Embed Size (px)
Citation preview

RESEARCH ARTICLE
Energy structure, digital economy, and carbon emissions:evidence from China
Yan Li1 & Xiaodong Yang1& Qiying Ran1,2
& Haitao Wu3,4& Muhammad Irfan3,4
& Munir Ahmad5
Received: 26 April 2021 /Accepted: 1 July 2021# The Author(s), under exclusive licence to Springer-Verlag GmbH Germany, part of Springer Nature 2021
AbstractAs a new production factor, digitalization plays a vital role in society, economy, and the environment. Based on the expandedSTIRPAT model, this paper empirically tests the impact of energy structure and digital economy on carbon emissions by paneldata from 2011 to 2017 in 30 provinces of China. The results show that the energy structure mainly based on coal has a significantdriving effect on carbon emissions. Compared with non-resource-based provinces, the increase of energy structure dominated bycoal has a greater effect on carbon emission in resource-based provinces. It is worth noting that this kind of influence has a greaterimpact on the central region of China, followed by the western region and the eastern region. Besides, the digital economy has asignificant moderating effect. With the development of digital economy, the impact of coal-based energy structure on carbonemissions is gradually decreasing. This effect is more significant in non-resource-based provinces and eastern China, but notsignificant in resource-based cities and central and western China.
Keywords Energy structure . Digital economy . Carbon emissions . Resource-based province
Introduction
In the past 40 years, China has not only experienced rapideconomic growth, but also experienced a sharp rise in energyconsumption and carbon emissions (Irfan et al. 2021). Chinahas become the largest carbon emitter in the world (Wang
et al. 2021). To actively tackle global climate change, theChinese government has set a series of emission reductiontargets. In 2015, when China submitted its NationallyDetermined Contribution Document (INDC) to the UnitedNations to fight climate change, it announced: China wouldpeak carbon dioxide emissions before 2030 and reduce its
Responsible Editor: Ilhan Ozturk
* Qiying [email protected]
* Haitao [email protected]
Xiaodong [email protected]
Muhammad [email protected]
Munir [email protected]
1 School of Economics and Management, Xinjiang University,Urumqi 830047, China
2 Center of Innovation Management Research of Xinjiang, XinjiangUniversity, Urumqi 830047, China
3 School of Management and Economics, Beijing Institute ofTechnology, Beijing 100081, China
4 Center for Energy and Environmental Policy Research, BeijingInstitute of Technology, Beijing 100081, China
5 School of Economics, Zhejiang University, Hangzhou 310058,China
https://doi.org/10.1007/s11356-021-15304-4
/ Published online: 27 July 2021
Environmental Science and Pollution Research (2021) 28:64606–64629

2030, its carbon intensity would be reduced bymore than 65%comparedwith 20052. To achieve these goals, China has takena series of emission reduction measures but still faces greatpressure on carbon emission reduction. At present, China’seconomic development is still highly related to coal consump-tion. According to China Energy Development Report 2018,China’s total energy consumption has reached 4.64 billiontons of standard coal, 8.12 times of 1978. Among them, theproportion of coal consumption with high-carbon emission isas high as 59%, far exceeding the world average consumptionlevel of 30%, while the proportion of energy consumptionwith low-carbon emission is far lower than the average levelof developed countries (Yang and Wei 2018). According tothe data of the National Bureau of Statistics, the change trendof energy consumption structure dominated by coal and car-bon emissions from 2004 to 2017 is basically consistent (seeFig. 1); unreasonable energy structure will bring great harm tothe ecological environment and people’s physical and mentalhealth, and pose a potential threat to the sustainable develop-ment of China’s economy. In the critical period of economictransformation from high-speed growth to high-qualityment, the optimization and adjustment of energy structure areimportant forces to promote “carbon peak and carbon emissionreduction” (Yong andYing 2019). Deeply exploringences in China’s regional energy structure and clarternal driving factors can provide a theoreticaltific formulationof differentiated emissionIt is of great significance for China tonomic development and effectively deal with climate change.
In the new round of global technological and industrialchange, the popularization of information technology has animportant marginal utility (Vu 2011; Anser et al. 2021). Thedigital economy is taking information technology as the coreto provide new impetus for the intelligent management of theenvironment (Kjaer et al. 2018; Usman et al. 2021). The gen-eralized penetration and popularization of the digital economyin the fields of energy consumption and environmental pro-tection are conducive to solving problems such as the declinein environmental carrying capacity and scarcity (Junior et al.2018; Rehman et al. 2021a), and it has great potential forimproving the ecological environment (Kjaer et al. 2018;Alam and Murad 2020). According to China EnergyStatistical Yearbook, in 2017, China’s per capita energy con-sumption and per capita electricity consumption were 32.79%and 37.17% of those of the USA, respectively. It is foreseeablethat China’s economy will continue to grow steadily.Economic growth means the increase of energy demand andChina’s energy consumption will continue to grow. China’s
carbon emission reduction target is undoubtedly facing signif-icant pressure and challenges. At the same time, globalwarming caused by carbon emissions will pose a considerablethreat to public health and welfare in all countries (Watts et al.2021; Shuai et al. 2017). As the digital economy has becomean important starting point for high-quality economic devel-opment and the urgent requirements for climate change to takeaction, exploring the contribution of digital technology to en-ergy conservation and emission reduction and the causes ofregional differentiation can provide theoretical support forreasonably expanding the development level of digital econ-omy, narrowing the development gap between regions, im-proving the emission reduction capacity of digital economy,and realizing the win-win development of “economicdevelopment-environmental optimization” for all countries..
In summary, the contribution of this paper has three as-pects. First of all, in terms of digital economy indicators, onthe basis of accurately understanding the connotation of dig-ital economy, from a multi-dimensional and multi-level per-spective, taking the Internet as the core, this paper uses entro-py method to build a comprehensive digital economy index tocomprehensively and systematically measure the develop-ment level of digital economy in each province from 2011 to2017. Secondly, considering the great differences of economicdevelopment level and resource endowment among provincesin China, this paper explores the regional heterogeneity char-acteristics of the impact of energy structure on carbon emis-sions based on the above perspectives and analyzes the rea-sons for the heterogeneity. According to the characteristics offactor resource endowment of each region, we put forwardtargeted policy recommendations. In addition, combined withthe background of the rapid development of the new genera-tion of information technology revolution, this paper puts thedigital economy, energy structure, and carbon emissions into aunified analysis framework, which provides a new perspectivefor reducing regional carbon emissions.
The rest of this paper is organized as follows: Sect. 2 sum-marizes the literatures and puts forward the research hypoth-eses; Sect. 3 briefly introduces the models and data used in thisstudy; Sect. 4 provides empirical results of the study; in Sect.5, results have been reported; Sect. 6 elaborates the conclu-sions and policy recommendations of this study.
Literature review and research hypotheses
Energy structure and carbon emissions
At present, there is a vast literature on the influencing factorsof carbon emissions, but this paper is mostly concerned aboutthe literature related to energy structure and carbon emissions(Ozturk and Acaravci 2010). Based on the data of OECDcountries from 1980 to 2011, Shafiei and Salim (2014) found
1 See more details: www.gov.cn/guowuyuan/2015-06/30/content_2887287.htm.2 See more details: www.gov.cn/xinwen/2020-12/22/content_5572019.htm.
64607Environ Sci Pollut Res (2021) 28:64606–64629
develop-
the differ-ifying its
basis for thereduction strategies.
achieve sustainable eco-
CO2 intensity by 60–65% from the 2005 level1. At the 2020Climate Ambition Summit, China further announced that by
in-scien-
that the consumption of non-renewable energy increased car-bon dioxide emissions, while the consumption of renewableenergy reduced carbon dioxide emissions. The research ofDogan and Seker (2016) also reached the same result as theirs.Furthermore, Dogan and Seker (2016) believed that there wasa two-way causality between renewable energy and carbondioxide emissions. Then, whether the domestic energy con-sumption structure and carbon emissions also exist the above-mentioned relationship. Most domestic scholars believe thatthe energy consumption structure is an important leading andrestrictive factor affecting regional carbon emissions (Yu et al.2018; Rehman et al. 2020), and the change direction of theenergy structure varies from province to province, resulting ina “high-carbon” situation and a “low-carbon” situation(Guozhi et al. 2011). Energy structure transformation and en-ergy efficiency improvement are effective ways to reduce car-bon emissions (Palencia et al. 2013; Ahmad et al. 2021),which can promote China’s clean and low-carbon develop-ment (Wu et al., 2021). However, Xu et al. (2019) believe thatthe carbon emission reduction of clean energy will be offsetbecause the scale of domestic clean energy consumption is farsmaller than that of traditional fossil energy consumption,resulting in that the development of clean energy does notsignificantly reduce carbon dioxide emissions; further region-al heterogeneity analysis shows that clean energy and carbondioxide emissions in eastern China are “M-type”, while cleanenergy and carbon dioxide emissions in central and westernChina are “U-type”. Narayan and Doytch (2017) showed thatthe exogenous negative effect of low-carbon clean energy oneconomic growth might be more significant than its endoge-nous positive effect (Nguyen and Kakinaka 2019). Chen et al.(2020) further show that the promotion of renewable energyon economic growth is only established when the use of re-newable energy exceeds a certain threshold.
Because China has a large geographical range from east towest, and its population characteristics, technological devel-opment level, and natural resources are different (Ahmad et al.
2019; Feng et al. 2021a), we cannot help thinking whetherthere are regional characteristics of carbon emissions inChina. Therefore, according to the 2004–2017 China EnergyStatistical Yearbook, we calculated the average carbon emis-sions and the overall carbon emission growth rate of ninemajor energy sources in 30 provinces of China. As shown inTable 1, from the average carbon emissions of 30 provinces(cities and autonomous regions), it can be seen that among thetop ten provinces with the highest carbon emissions, theeastern provinces account for six, which are Shandong,Jiangsu, Guangdong, Hebei, Liaoning, and Zhejiang.The central provinces are Henan, Shanxi, and Hubei.Only Inner Mongolia is in the west. It can be seen thatcarbon emissions are unevenly distributed among re-gions. From the perspective of carbon sources thatcause carbon emissions, coal and electricity consump-tion contribute the most to carbon emissions, indicatingthat China needs to transform its energy consumptionstructure. Besides, these ten provinces are basicallyChina’s major industrial provinces and resource-richprovinces, indicating carbon emissions endogenous tothe current economic development model and resourceendowment, the existence of differences in the level ofeconomic development, and resource endowment has al-so caused the alienation of carbon emissions.
It is worth noting that from the perspective of the averagegrowth rate of carbon emissions, the average growth rate ofHainan, Xinjiang, Guangxi, Ningxia, and Inner Mongolia allexceeded 10% from 2004 to 2017, and the average GDPgrowth rates of the other four provinces except InnerMongolia were less than that of carbon emissions.Therefore, the quality of economic development at the ex-pense of the environment is not high. On the contrary, theaverage carbon emission growth rate of Beijing, Guizhou,and Shanghai is less than 3%, which is much lower than theiraverage GDP growth rate, which has achieved a relativedecoupling of economic development and carbon emissions.
60
62
64
66
68
70
72
74
76
78
0
2000
4000
6000
8000
10000
12000
14000
16000
18000
2004 2005 2006 2007 2008 2009 2010 2011 2012 2013 2014 2015 2016 2017
%
10
00
0 ton
s
Energy structure Total carbon emissions
Fig. 1 Changes in energystructure and carbon emissionsfrom 2004 to 2017. Note: Datacollected from China EnergyStatistical Yearbook from 2005 to2018, The dotted line is the trendline of the energy structure duringthe study period, reflecting thechanging trend of the energystructure
64608 Environ Sci Pollut Res (2021) 28:64606–64629

It implies that there are still some provinces with low energyefficiency in China.
Based on the above analysis, this paper proposes the firstand second hypotheses as:
H1: The impact of energy structure on carbon emissions isregional heterogeneity due to different local developmentlevels.
H2: The impact of energy structure on carbon emissions isregional heterogeneity due to the resource endowment gap.
Energy structure, digital economy, and carbonemissions
According to the estimation of the State Internet InformationOffice, the added value of China’s digital economy accounts
for 36.2% of GDP. There is no doubt that the digital economyis having an important impact on all aspects of our lives. Dueto the short development time of digital economy, there arefew literatures on digital economy and energy structure,digital economy, and carbon emissions. Miller and Wilsdon(2001) pointed out that digital economy represents a techno-logical revolution and is the decisive factor of technologicalinnovation. Digital technology has played a fundamental busi-ness change in the value chain of almost all industries(Yuan et al. 2021). The solutions of digital technologyin energy, manufacturing, agriculture and land use, con-struction, services, transportation, and other fields canhelp reduce global carbon emissions by 15% (TheExponential Roadmap 2020). Among all industries, theenergy sector is one of the fields with the largest
Table 1 China’s average energy carbon emissions and average growth rate of carbon emissions from 2004 to 2017
Unit: 10,000 tons
Region Coal Coke Crude oil Fuel oil Gasoline Kerosene Diesel Natural gas Electric power Average growth rate
Beijing 1182.08 17.95 804.75 33.99 301.52 198.07 167.53 511.92 2189.35 2.02%
Tianjin 2344.15 80.61 1066.11 86.74 160.94 18.88 270.23 197.79 1783.20 4.26%
Hebei 14,112.06 743.69 1152.49 42.93 251.04 5.69 557.25 225.53 6995.37 5.26%
Shanxi 17,183.22 262.38 0.00 6.23 159.04 8.60 376.79 188.22 4018.32 5.34%
Inner Mongolia 15,026.41 148.97 198.24 13.07 221.49 8.27 514.33 202.01 4565.00 10.35%
Liaoning 8611.53 294.93 5230.38 273.02 468.21 15.06 750.54 231.12 4533.03 3.80%
Jilin 4746.50 58.21 806.65 33.03 133.18 3.07 282.52 99.86 1545.99 3.95%
Heilongjiang 6301.12 24.95 1686.10 71.06 280.02 18.35 415.85 187.53 2033.23 4.19%
Shanghai 2815.49 72.18 1795.10 600.71 358.34 193.77 414.71 296.17 3350.24 2.63%
Jiangsu 12,437.18 291.32 2491.73 170.62 597.48 24.04 605.55 564.15 10,610.31 7.11%
Zhejiang 6936.05 41.56 2114.52 274.76 475.89 37.87 764.42 256.18 7647.70 5.83%
Anhui 6861.57 99.52 421.99 14.02 196.38 5.72 372.00 111.54 3175.25 7.13%
Fujian 3670.14 57.92 901.28 145.72 278.37 35.41 387.43 153.35 3802.84 7.83%
Jiangxi 3296.34 78.82 407.37 22.04 134.55 3.06 341.80 49.77 2088.53 6.83%
Shandong 18,683.73 325.13 5107.87 1471.83 527.03 23.66 1122.66 328.87 9639.28 8.26%
Henan 14,300.04 210.10 660.92 45.71 322.80 19.68 521.42 338.58 6720.66 7.31%
Hubei 7539.79 106.03 861.68 102.88 454.48 26.49 596.78 141.90 3841.73 7.95%
Hunan 5688.84 103.74 614.77 56.36 287.74 16.72 425.52 86.84 3434.94 6.00%
Guangdong 7252.41 56.36 3293.54 740.83 847.91 109.14 1291.67 557.65 11,317.25 5.14%
Guangxi 4197.74 81.62 625.85 24.00 196.41 11.74 374.23 26.19 2662.23 11.78%
Hainan 998.19 0.62 623.82 23.08 49.60 41.51 90.02 209.72 486.26 17.56%
Chongqing 2417.10 36.45 0.40 8.22 109.73 22.90 298.41 367.75 1746.48 3.45%
Sichuan 5106.13 150.29 376.56 58.45 475.27 95.49 491.27 839.83 4349.72 3.74%
Guizhou 5501.45 40.12 0.00 8.05 140.35 8.04 256.17 47.17 2456.13 2.55%
Yunnan 5015.16 128.99 0.04 3.41 188.02 28.39 419.94 32.94 2867.72 7.31%
Shaanxi 6850.30 72.17 1537.92 8.96 194.40 12.05 360.31 357.39 2541.31 9.52%
Gansu 2884.52 60.70 1181.58 8.97 83.15 2.84 196.80 105.47 2252.96 4.97%
Qinghai 777.10 18.21 105.04 0.22 24.86 0.11 74.44 188.41 1272.90 8.56%
Ningxia 3452.07 31.49 252.96 24.68 19.93 1.38 87.81 89.62 1674.07 10.54%
Xinjiang 5602.51 69.58 1835.03 11.17 137.32 15.22 376.62 578.97 3004.25 12.80%
Data collected from China Energy Statistical Yearbook from 2005 to 2018
64609Environ Sci Pollut Res (2021) 28:64606–64629

emission reduction effect after the application of digitaltechnology.
The impact of digital economy on the energy system isreflected in both supply and demand. On the supply side,digital technology monitors the data of the energy productionlink, prevents and warns production risks in advance, andimproves the production efficiency of the traditional fossilenergy industry. Thus, digital technology ensures the safeand efficient operation of the energy system (Chen 2020)and reduces the degree of damage to the environment(Soares and Tolmasquim 2000; Rademaeker et al. 2014).Alam and Murad (2020) found that improving the level oftechnology utilization can promote the development and uti-lization of renewable energy. Digital technology shortens theR&D cycle of clean energy and improves R&D efficiencythrough accurate 3D modeling of natural and geographicalconditions (Allam and Jones 2021). Similar to traditional fos-sil energy, digital technology has been applied in the field ofnew energy. Such applications enable staff to perceive datamore accurately, predict meteorological changes, and improvethe utilization of clean energy. In addition, digital technologyhelps the government to control the total amount of energysupply through pricing and cross-subsidies (Bhattacharyaet al. 2015), which in turn promotes the transformation ofenergy consumption structure and ultimately achieves effec-tive carbon emission control. On the demand side, the appli-cation of digital technology in areas with self-diagnosis, sat-ellite navigation, entertainment systems, and key infrastruc-ture and transportation systems can improve the efficiency ofenergy sales and consumption in the whole society. The ap-plication of digital transportation platform in the fields ofsmart cars, housing, electrical appliances, and so on bringsgreat significance to energy conservation (Aydin et al.2018). The digital economy reduces the demand for energyand raw materials through the dematerialization of humanactivities and communication (Heiskanen et al. 2005). Forexample, during the COVID-19 outbreak, online office re-duced public travel, and therefore, energy consumption re-duced. Generally speaking, the digital economy “empower-ment” effect is significant, and the information integrationeffect can weaken the information asymmetry between thesupply and demand sides. The integration and penetration ofthe digital economy in the field of energy consumption willhelp to achieve the synchronous improvement of energy useefficiency between supply and demand, transform the con-sumption pattern, and effectively promote the developmentof a low-carbon economy.
Based on the above analysis, this paper proposes the thirdand fourth hypotheses as:
H3: Digital economy can weaken the negative effect ofenergy structure on carbon emissions.
H4: The impact of the digital economy on the energy struc-ture and carbon dioxide emissions is heterogeneous.
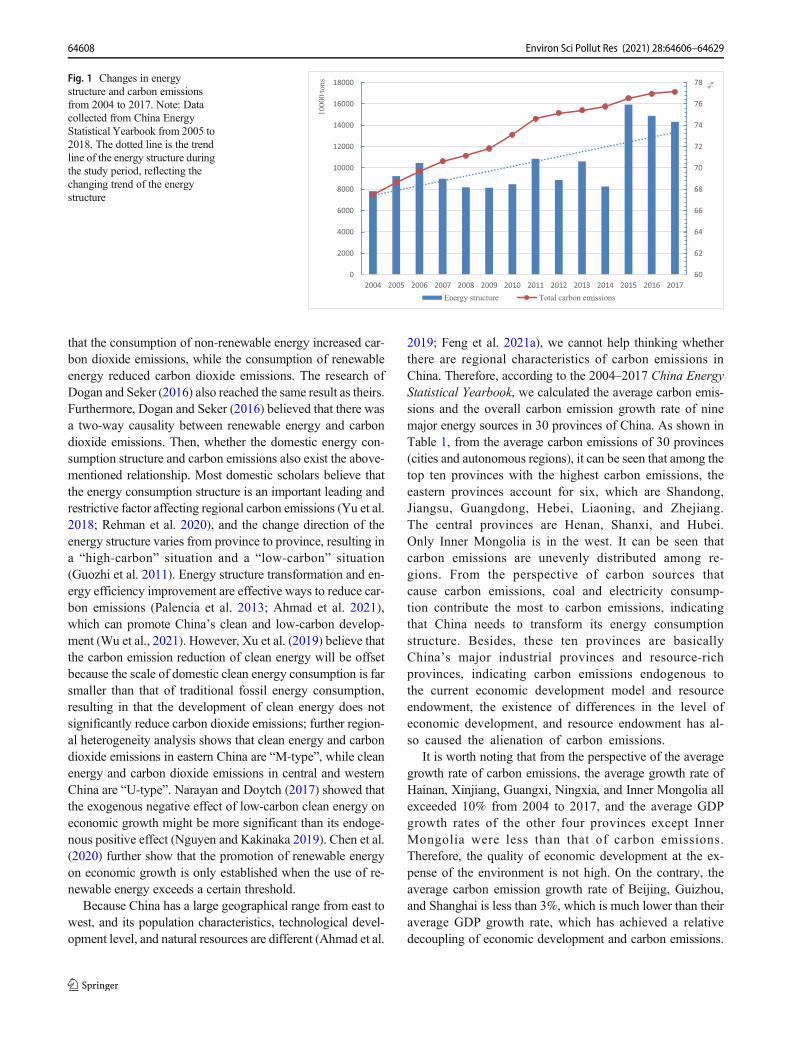
Although many scholars have conducted a large number ofnormative and empirical studies on energy structure and car-bon emissions, there are still some limitations to the researchin this field. There is a growing body of relevant studies, butthe latest data analysis of the relationship between the two islacking. In addition, previous studies generally directly stud-ied the relationship between energy structure and carbon emis-sions. Unfortunately, there is a lack of discussion on the rela-tionship between energy structure and carbon emissions in thecontext of the digital economy. Obviously, the developmentof the digital economy will have a significant impact on therelationship between the two. What is more, although someliterature has discussed the heterogeneity caused by regionaldevelopment gaps, insufficient attention has been paid to theimpact of resource endowment differences on the researchresults. Finally, the previous literature on energy structureand carbon emissions has carried out a linear analysis as awhole. The empirical results using the proportion of coal con-sumption as the proxy variable of the energy structure basi-cally show that there is a positive correlation between theenergy structure and carbon emissions, but in this paper,the empirical results show that the actual relationshipbetween energy structure and carbon emissions may benonlinear (Fig. 2).
Model construction and variable selection
Model construction
Benchmark model
Ehrlich and Holdren (1971) first proposed IPAT model as aframework to study the impact of population growth on theenvironment, and the specific model settings are as follows:
C ¼ P � A � T ð1Þ
where,C denotes carbon emissions, Pmeans population, Ameans affluence, and T means technology. However, theIPAT equation does not take into account the differences inthe sensitivity of the dependent variables to the influencingfactors and cannot observe the impact of factors other thanpopulation, affluence, and technology on environmental pres-sure. In order to overcome the limitations of this model, Dietzand Rosa (1994) established the stochastic form of IPAT—STIRPATmodel. In order to study the impact of energy struc-ture on carbon emissions, following Ren et al. (2021) andadding energy structure (E) into model (1) to analyze the im-pact of energy structure on carbon emissions, the followingmodel can be obtained:
Carbon emissions ¼ Pit � Ait � Tit � Eit: ð2Þ
64610 Environ Sci Pollut Res (2021) 28:64606–64629
In addition, according to previous studies, carbon emis-sions are also affected by other variables. Therefore, this paperappropriately extends the STIRPAT model:
C ¼ Pit � Ait � Tit � Eit � other variablesit: ð3Þ
From the perspective of model and data processing, takinglogarithm will not change the nature and correlation of thedata but will compress the variable scale, make the data morestable, and weaken the collinearity and heteroscedasticity ofthe model. From the perspective of the research problem itself,we need to understand the impact of each unit change ofinfluencing factors on carbon emissions. By taking logarithm,we can convert the multiplication in the model into addition.At this time, the regression coefficient can be explained by theconcept of “elasticity” in economics, which is convenient forus to analyze the impact of various influencing factors oncarbon emissions. Therefore, we take logarithm on both sidesof model (3); the following equation can be obtained:
lnCit ¼ α0 þ α1lnPit þ α2lnAit þ α3lnT it þ α4lnEit
þ α5lnX it þ εit: ð4Þ
In the specific analysis, total carbon emissions (TC), thecarbon intensity (CI), and per capita carbon emissions (CP)are taken as the proxy variables of carbon emissions, andpopulation size, per capita GDP, and energy intensitywere taken as the proxy variables of population, afflu-ence, and technology.
Because the early carbon emissions may have an impact onthe current and future carbon emissions, and considering thatthe lag term is easily related to the residual term of the model,this paper introduces the lag term of carbon emissions into themodel to build a dynamic panel model. The lagged term ofcarbon emissions included in the explanatory variables is
often correlated with the unobservable cross-sectional hetero-geneity effect. Due to the limited number of control variablesadded in the model, the important explanatory variables maybe omitted, which will lead to the correlation between explan-atory variables and error terms, resulting in the endogeneity ofthe model (Hsiao 1986)3. We use System GMM to estimatethe model and Arellano bond test and Hansen test to verify themodel.
Moderation effect
In order to test the moderating role of the digital economy inthe impact of energy structure on carbon emissions, the fol-lowing model is constructed, where D is the digital economy:
lnCit ¼ α0 þ α1lnPit þ α2lnAit þ α3lnTit þ α4lnEit
þ α5lnDit þ α6lnEit � lnDit þ α7lnX it þ εit: ð5Þ
The significance of the interaction coefficient can testwhether the digital economy has a moderating effect on theimpact of the energy structure on carbon emissions. When theinteraction term between the energy structure and the digitaleconomy and the original frequency term exists at the sametime, the model regression results may be biased due to the
3 In this regard, the current mainstream idea is to use dynamic GMMmethod.The dynamic GMM method is divided into System GMM and DifferenceGMM, and the Difference GMM destroys the integrity of sample informationwhile removing the fixed effect, which leads to the problem of weak instru-mental variables (Arellano and Bond 1991). The characteristic of SystemGMM is to estimate the horizontal equation and the difference equation atthe same time. It can improve the real efficiency by adding the lag differencevariable as the tool variable of the model and ensure the integrity of the sampleinformation (Blundell and Bond 1998). Before using GMMmodel of dynamicpanel system, two conditions should be satisfied: there is no sequence corre-lation in random error term, and there is no weak instrumental variable.
Fig. 2 Mechanism analysisdiagram
64611Environ Sci Pollut Res (2021) 28:64606–64629

existence of collinearity problems. Therefore, the interactionitems in model (5) are centralized.
Threshold effect
According to the regression results of the moderating effect ofthe digital economy in the impact of energy structure on car-bon emissions, it can be found that the moderating effectvaries in different regions. Therefore, this paper conjecturesthat the moderating effect of the digital economy may havesome nonlinear influence; that is, with the development levelof the digital economy, the energy structure and carbon emis-sions show an inconsistent change. Referring to Li et al.(2021a), this paper constructs model (6):
lnCit ¼ α0 þ α1lnPit þ α2lnAit þ α3lnT it þ α4lnEit
� F lnDit ≤qð Þ þ α5lnEit � F lnDit ≥qð Þ þ α6lnX it
þ μi þ εit ð6Þ
where: F(∗) is the indicator function, q is the thresholdvalue, and the other variables are consistent with the above.
Variable selection
Due to the serious lack of data of some three-level indicatorsof digital economy before 2011, in view of the availability andintegrity of data of digital economy indicators, this paper onlyuses the data from 2004 to 2017 to make a preliminary anal-ysis of the relationship between energy structure and carbonemissions. The empirical analysis uses the panel data of 30provinces (excluding Tibet, Hong Kong, Macao, and Taiwan)from 2011 to 2017 according to the actual situation. The se-lection of variables and relevant data sources are as follows:
(1) Total carbon emissions. This paper draws on the ideasof Liu et al. (2021); the material balance algorithm isadopted to calculate the total carbon emissions accordingto formula (7):
TCit ¼ ∑9
m¼1Eitm � Hm � Dm; mϵ 1; 9f g ð7Þ
where, i is the province, t is the year, and M is the energytype. Energy consumption is represented by E, and the energyconversion coefficient and energy carbon emission coefficientare denoted by H and D, respectively (see Table 2).
(2) The carbon emission intensity. The intensity of carbondioxide emissions is the amount of CO2 emissions per unit ofGDP, and the calculation formula is total carbon dioxideemissions/GDP (Liu et al. 2021).
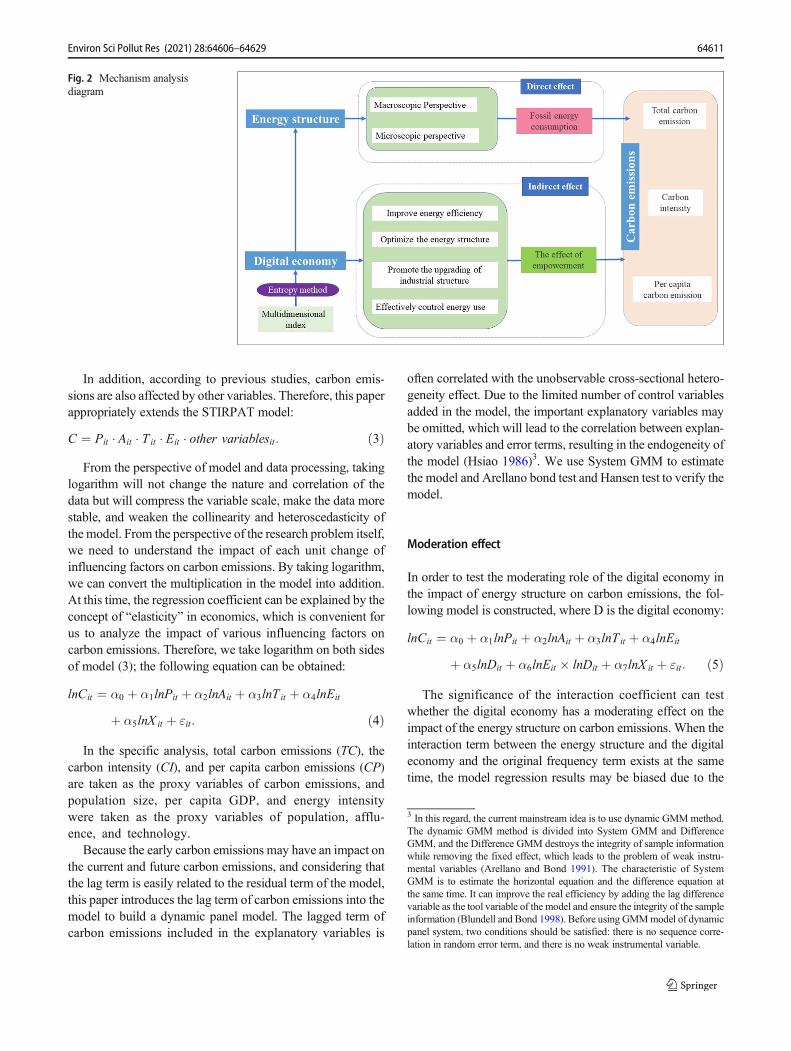
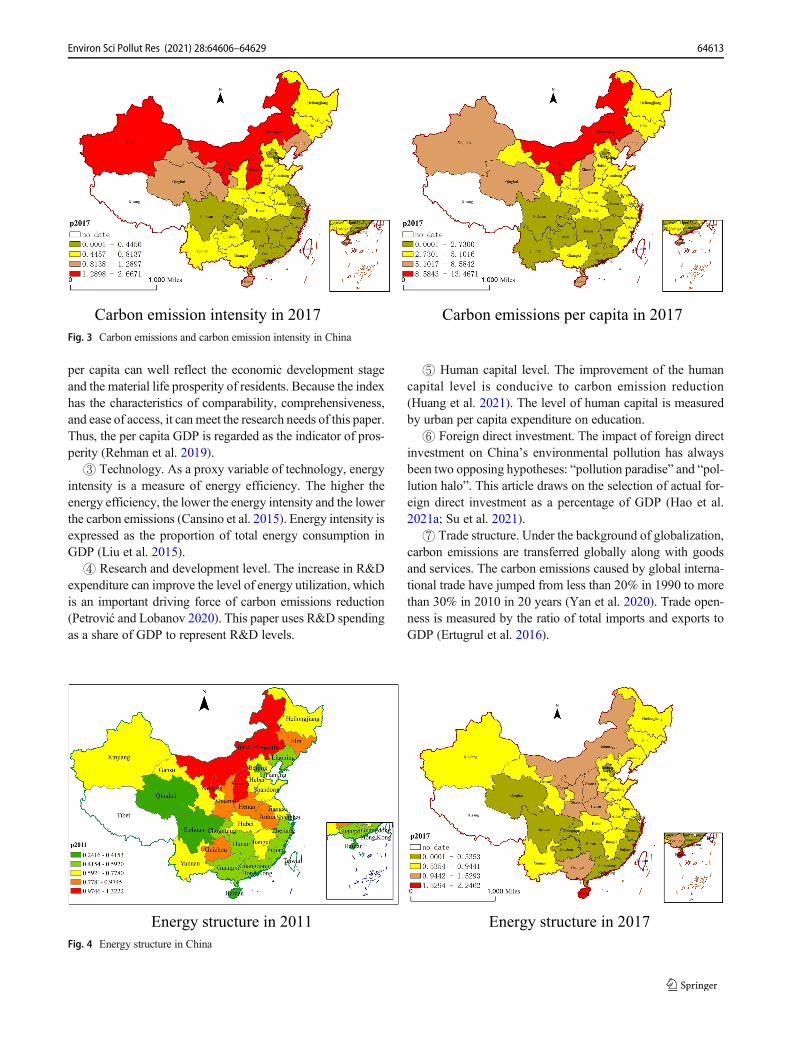
(3) Per capita carbon emissions. Referring to Li et al.(2021a, 2021b), per capita carbon emissions are measuredby the ratio of total carbon dioxide emissions to the totalpopulation. As we have analyzed, the regional heterogeneitycharacteristics of energy structure on carbon emissions inSect. 2.1. In Sect. 3.2, we show the heterogeneity characteris-tics of carbon emissions and the current situation of energystructure more intuitively and vividly in the form of graphs(Figs. 3 and 4).
(4) Energy structure. As coal is the main source of energyconsumption in China, compared with oil, natural gas, electricpower, and other energy sources, coal contributes the most toChina’s economic growth (Bhattacharya et al. 2015).Therefore, the proportion of coal consumption in energy con-sumption is used to express the energy structure.
(5) Digital economy. A single index cannot comprehen-sively and accurately measure the real development level ofthe digital economy. Drawing on the ideas of Liu et al. (2020), this paper uses the entropy method to construct the digitaleconomy index with the internet as the core (Cao et al. 2021).The development level of digital economy of 30 provinces in2011 and 2017 are shown in Fig. 5. By comparison, we canclearly see that the development speed of digital economy ineastern coastal areas is faster (Table 3).
(6) Control variables.① Population. Population factor will affect greenhouse gas
emissions through “total amount” and “speed” (Birdsall1992). Knapp and Mookerjee (1996) believe that populationis the reason for the growth of global CO2 emissions. As thenumber of permanent residents reflects the actual populationof the region, we follow the method of Liu et al. (2021); thepopulation is measured by the total resident population.
② Affluence. As a comprehensive measure of the produc-tion capacity of products and services within the region, GDP
Table 2 Energy conversion coefficient and energy carbon emission coefficient
Energy types Coal Coke Crude oil Fuel oil Gasoline Kerosene Diesel Natural gas Electric power
Hm 0.7143 0.9714 1.4286 1.4286 1.4714 1.4714 1.4571 13.3 0.1229 kg standard coal/kWh
Dm 0.7476 0.1128 0.5854 0.6176 0.5532 0.3416 0.5913 0.4479 2.2132
Source: Hm data from China Energy Statistical Yearbook 2018, Dm data from IPCC 2006
According to China Energy Statistics Yearbook, nine kinds of energy include coal, coke, crude oil, fuel oil, gasoline, kerosene, diesel oil, natural gas, andelectric power.
64612 Environ Sci Pollut Res (2021) 28:64606–64629
per capita can well reflect the economic development stageand the material life prosperity of residents. Because the indexhas the characteristics of comparability, comprehensiveness,and ease of access, it can meet the research needs of this paper.Thus, the per capita GDP is regarded as the indicator of pros-perity (Rehman et al. 2019).
③ Technology. As a proxy variable of technology, energyintensity is a measure of energy efficiency. The higher theenergy efficiency, the lower the energy intensity and the lowerthe carbon emissions (Cansino et al. 2015). Energy intensity isexpressed as the proportion of total energy consumption inGDP (Liu et al. 2015).
④ Research and development level. The increase in R&Dexpenditure can improve the level of energy utilization, whichis an important driving force of carbon emissions reduction(Petrović and Lobanov 2020). This paper uses R&D spendingas a share of GDP to represent R&D levels.
⑤ Human capital level. The improvement of the humancapital level is conducive to carbon emission reduction(Huang et al. 2021). The level of human capital is measuredby urban per capita expenditure on education.
⑥ Foreign direct investment. The impact of foreign directinvestment on China’s environmental pollution has alwaysbeen two opposing hypotheses: “pollution paradise” and “pol-lution halo”. This article draws on the selection of actual for-eign direct investment as a percentage of GDP (Hao et al.2021a; Su et al. 2021).
⑦ Trade structure. Under the background of globalization,carbon emissions are transferred globally along with goodsand services. The carbon emissions caused by global interna-tional trade have jumped from less than 20% in 1990 to morethan 30% in 2010 in 20 years (Yan et al. 2020). Trade open-ness is measured by the ratio of total imports and exports toGDP (Ertugrul et al. 2016).
Carbon emission intensity in 2017 Carbon emissions per capita in 2017
Fig. 3 Carbon emissions and carbon emission intensity in China
Energy structure in 2011 Energy structure in 2017
Fig. 4 Energy structure in China
64613Environ Sci Pollut Res (2021) 28:64606–64629

⑧ Industrial structure. Industrial development willcause environmental pollution and degradation (Antociet al. 2018), and the rapid development of industrializa-tion will bring great harm to the urban environment(Mahmood et al. 2020). Industrial structure is expressedas the proportion of industrial added value in GDP(Feng et al. 2021b).
⑨ Social structure. Urban expansion derives a largeamount of energy consumption demand and leads to a corre-sponding increase in pollutant emissions (Maheshwari et al.2020; Zhang and Lin 2012). Referring to Gan et al. (2020), theproportion of the urban population in the total population ofeach region in each year is used as the proxy variable ofurbanization level.
All variables in this paper were logarithmically processed,and the data came from China Statistical Yearbook and ChinaEnergy Statistical Yearbook (Table 4).
Research results
Direct effects of energy structure on carbon emissions
The Hausman test is performed on the extended STIRPATmodel. The results show that the model should not ignorethe province effect and time effect on carbon emissions.Therefore, the province effect and time effect are controlledin this paper. As can be seen from the regression results
Table 3 Comprehensive index system of digital economy development level
Main indicator First level indicator Secondary indicator Third level indicator Indicatorunit
Digital economyindex
Informatization development index Information foundation Optical cable density %
Density of mobile phone base station %
Proportion of informatization employee %
Impact of informatization Total telecom services %
Software business revenue %
Internet development indicator Fixed end Internet foundation Internet access port density %
Mobile Internet foundation Mobile phone penetration %
Impact of fixed end Internet Proportion of broadband Internet user %
Impact of mobile Internet Proportion of mobile Internet user %
Digital transaction developmentindicator
Fundamentals of digitaltrading
Proportion of enterprise website %
Proportion of computers used byenterprise
%
Proportion of e-commerce %
Impact of digital transactions E-commerce sale %
Online retail sale %
Digital economy in 2011 Digital economy in 2017
Fig. 5 Digital economy in China
64614 Environ Sci Pollut Res (2021) 28:64606–64629

Table 4 Descriptive statisticsVariable Variable Obs Mean Std. dev. Min Max
Total carbon emissions C 210 15,934.12 10,176.96 2246.95 52,335.68
Carbon emission intensity CI 210 0.91 0.57 0.20 3.13
Carbon emissions per capita CP 210 4.09 2.42 1.37 13.47
The energy structure E 210 0.72 0.37 0.05 2.32
The digital economy D 210 41.53 28.60 11.01 175.01
Population P 210 4534.60 2711.61 568.00 11,169.00
Affluence A 210 5.07 2.34 1.64 12.90
Technology T 210 0.82 0.42 0.25 2.05
R&d spending rd 210 0.02 0.01 0.00 0.06
Human capital rlzb 210 2218.72 721.44 967.90 5087.20
Foreign direct investment fdi 210 0.33 0.33 0.05 1.76
The trade structure mykf 210 0.28 0.32 0.02 1.55
The industrial structure ind 210 0.45 0.08 0.19 0.59
The social structure csh 210 0.57 0.12 0.35 0.90
Table 5 Benchmark regression results
Explanatory variables Static panel model (OLS) Dynamic panel model (SYS-GMM)
TC CI CP TC CI CP TC CI CP
lnE 0.352*** 0.386*** 0.356*** 0.342*** 0.342*** 0.342*** 0.432*** 0.412*** 0.153**
(22.94) (22.09) (24.59) (30.58) (30.58) (30.58) (25.79) (15.35) (2.55)lnP 1.254*** 0.254 0.254 1.001*** −0.001 −0.043
(4.30) (0.87) (0.87) (21.93) (−0.05) (−0.82)lnA 0.959*** −0.041 0.959*** 1.119*** 0.498*** 0.651**
(10.30) (−0.44) (10.30) (7.13) (4.14) (2.18)lnT 0.784*** 0.784*** 0.784*** 0.974*** 0.949*** 0.492***
(11.38) (11.38) (11.38) (8.30) (15.68) (3.67)lnrd 0.002 0.002 0.002 −0.088 −0.175* 0.184
(0.04) (0.04) (0.04) (−1.01) (−1.65) (0.99)lnrlzb −0.097** −0.097** −0.097** −0.058 −0.124*** −0.095
(−2.54) (−2.54) (−2.54) (−1.51) (−4.09) (−1.28)lnfdi −0.006 −0.006 −0.006 −0.026 −0.014 −0.012
(−0.35) (−0.35) (−0.35) (−0.78) (−0.63) (−0.37)lnmykf 0.014 0.014 0.014 0.141*** 0.051** 0.054
(0.93) (0.93) (0.93) (3.37) (2.22) (1.42)lnind −0.036 −0.036 −0.036 −0.636*** −0.307*** −0.563**
(−0.42) (−0.42) (−0.42) (−3.04) (−2.58) (−2.20)lncsh −0.353** −0.353 * * −0.353** −0.119 −0.453 −0.975
(−2.03) (−2.03) (−2.03) (−0.21) (−1.40) (−1.54)L.lnC 0.037**
(2.44)L.lnCI 0.056***
(2.77)L.lnCP 0.649***
(5.33)Constant 9.533*** 0.077*** 1.356*** −1.393 −1.393 −1.393 −0.628 −0.762 0.605
(714.00) (5.09) (107.91) (−0.58) (−0.58) (−0.58) (−0.90) (−1.30) (0.63)F-value/AR(2) 95.78***
[0.000]129.96***
[0.000]99.67***
[0.000]107.18***
[0.000]185.16***
[0.000]97.20***
[0.000]0.44[0.660]
1.21[0.225]
−1.19[0.235]
R2/Hansen test 0.795 0.840 0.801 0.913 0.948 0.905 16.77/[0.539] 17.35/[0.431] 10.49/[0.487]Year FE Yes Yes Yes Yes Yes Yes Yes Yes YesProvince FE Yes Yes Yes Yes Yes Yes No No NoObservations 210 210 210 210 210 210 180 180 180
The values in brackets are T values, and the values in [] are P values
* represents P < 0.1; ** represents P < 0.05; *** represents P < 0.01
64615Environ Sci Pollut Res (2021) 28:64606–64629

(Table 5), the elastic coefficients of energy structure on carbonemissions are all around 0.35, which are significant at the 1%significance level. Carbon emissions are positively cor-related with the proportion of coal consumption. Every1% increase in the proportion of coal consumption willlead to an increase of carbon emissions of about 0.35%.This is closely related to China’s coal-rich energy struc-ture, which indicates that China is still in the stage ofeconomic development dominated by traditional fossilenergy. In contrast, clean energy consumption accountsfor only a small proportion. Increasing coal consump-tion will aggravate carbon dioxide emissions. In thiscase, it is imperative to change the channel of energyuse and gradually minimize the dependence of economicdevelopment on coal.
The number of permanent residents, per capita GDP, andenergy intensity are significantly positively correlated withcarbon emissions, and the previous level of carbon emissionsis an important factor affecting the current level of carbonemissions (see Table 5). It means that the increase of popula-tion, economic development level, energy intensity, and car-bon emission level in the early stage will lead to the increaseof carbon emissions. With the increase of population and theexpansion of urban scale, people’s demand for food, clothing,housing, transportation, and other aspects of life increasescorrespondingly, and energy consumption increases accord-ingly (Ahmad et al. 2020). In addition, the increase of energyintensity indicates that economic growth depends on en-ergy consumption, and the level of economic growth isnot high. Moreover, the growth of social wealth meansthe improvement of people’s living standards and theimprovement of people’s demand for quality life suchas transportation, household appliances, and heating,which further induces the supply of high-carbon emis-sion products. Finally, because it takes some time tobreak technical barriers, form environmental awareness,build policies and systems, and update fixed assets, it isdifficult to change greatly in a short time. The currentcarbon emission level will be significantly affected bythe previous period and eventually lead to the rise ofenergy consumption and carbon emission level.
Regional heterogeneity
Heterogeneity of regional development level
Taking into account the level of economic development andthe industrial level in various parts of China, the division ofthe three major regions of the east, the middle, and the westbasically reflects the regional characteristics and closely ad-heres to the strategic deployment of China’s regional devel-opment (Yang et al. 2021a;Wu et al. 2021a). In order to verifywhether the energy structure has different impacts on carbon
emissions in different regions due to the existence of regionaldifferences, the impact of energy structure on carbon emissionin eastern, central, and western regions is regressedrespectively.4
If i∈eastern region, dummy 1 = 1; if i∈central region orwestern region, dummy 1 = 0. If i∈central region, dummy 2= 1; if i∈eastern region or western region, dummy 2 = 0. Ifi∈western region, dummy 3 = 1; if i∈eastern region or centralregion, dummy 3 = 0.
It can be seen fromTable 6 that considering the total carbonemissions, the carbon intensity, and per capita carbon emis-sions, the impact of energy structure on carbon emissions isstatistically significant. However, the influence coefficient ofcoal consumption ratio on carbon emissions in different re-gions is different. We can easily find that the central region >western region > eastern region. Therefore, hypothesis 1 isproved.
Heterogeneity of regional resource endowment
In addition, because resource-based provinces have com-parative advantages in resource factor input, they tendto attract resource-based industrial agglomeration andincrease carbon emissions. Therefore, it is necessary tosubdivide the overall sample into resource-based prov-inces and non-resource-based provinces to explore theheterogeneity of the impact of energy structure on car-bon emissions. Specifically, this paper refers to the def-inition of resource-based areas by Yu et al. (2019) andcomprehensively considers the output value of resource-based industries and the proportion of employees. Ninetypical resource-based provinces, namely Shanxi, InnerMongolia, Heilongjiang, Guizhou, Yunnan, Shaanxi,Qinghai, Ningxia, and Xinjiang, are selected as the re-search objects5. If i∈ resource-based provinces, dummy4 = 1; if i∈ non-resource-based provinces, dummy 4 =0. If i∈non-resource-based provinces, dummy 5 = 1;if i∈ resource-based provinces, dummy 5 = 0.
The regression results in Table 7 show that for every 1%increase in the proportion of coal consumption, the total
4 According to the division method of the National Bureau of statistics for theeastern, central, and western regions, the eastern region includes 11 provinces(cities) including Beijing, Tianjin, Hebei, Liaoning, Shanghai, Jiangsu,Zhejiang, Fujian, Shandong, Guangdong, and Hainan; the central region in-cludes Shanxi, Jilin, Heilongjiang, Anhui, Jiangxi, Henan, and Hainan. Thewestern region includes 11 provinces (cities) including Inner Mongolia,Guangxi, Chongqing, Sichuan, Guizhou, Yunnan, Shaanxi, Gansu, Qinghai,Ningxia, and Xinjiang.5 According to the data of the National Bureau of statistics, Shanxi, InnerMongolia, Shaanxi, Guizhou, and Xinjiang are the top five provinces withcoal reserves of more than 10 billion tons, accounting for about 74% of thetotal reserves in China. Heilongjiang, Shaanxi, and Xinjiang have oil reservesof more than 100 million tons, accounting for about 50% of the total oilreserves in China. Yunnan is known as China’s “Kingdom of nonferrousmetals” for its large mineral reserves and complete varieties.
64616 Environ Sci Pollut Res (2021) 28:64606–64629

carbon emissions of resource-based provinces will increase by0.395% on average, while that of non-resource-based
provinces will increase by 0.310% on average, whichis significant at the 1% statistical level. It shows that
Table 6 Direct effect results based on heterogeneity of economic level
Explanatory variables Total carbon emissions The carbon intensity Per capita carbon emissions
Eastern Midland Western Eastern Midland Western Eastern Midland Western
L.lnC/L.lnC/L.lnCP 0.217*** 0.317*** 0.160** 0.725*** 0.722*** 0.220*** 0.541*** 0.546*** 0.173***
(2.90) (6.31) (2.39) (3.94) (3.51) (7.40) (3.45) (9.69) (4.06)
lnE×dummy1 0.241*** 0.284** 0.242*
(2.94) (2.02) (1.83)
lnE×dummy2 0.443** 0.735** 0.721**
(2.56) (2.56) (2.49)
lnE×dummy3 0.344*** 0.418*** 0.469***
(3.65) (5.28) (3.72)
lnP 0.589*** 0.492** 1.045*** −0.013 0.118 0.113 −0.431 0.292* 0.149
(7.31) (2.19) (8.34) (−0.15) (1.19) (1.01) (−1.48) (1.86) (1.01)
lnA 0.585*** 0.293 1.490*** 0.320 −0.335 0.456*** 0.994*** 1.603*** 1.786***
(3.45) (1.30) (9.02) (1.41) (−1.18) (3.10) (2.95) (5.92) (6.80)
lnT 0.492*** 0.306*** 1.427*** 0.355* −0.164 0.930*** 0.629** 1.295*** 1.181***
(5.37) (2.67) (9.33) (1.78) (−1.01) (14.24) (2.54) (6.10) (10.74)
lnrd −0.515*** −0.604*** −0.058 −0.039 −0.932*** −0.425*** −0.053 −0.215 −0.383***
(−3.44) (−3.36) (−0.42) (−0.26) (−2.79) (−7.55) (−0.37) (−1.27) (−3.07)lnrlzb 0.150*** 0.063 −0.032 −0.157*** −0.249*** 0.041 0.029 −0.424*** −0.236**
(3.17) (0.78) (−0.29) (−2.63) (−2.66) (0.83) (0.32) (−3.34) (−2.27)lnfdi 0.057 0.018 −0.083 −0.025 0.065 −0.155*** 0.003 −0.077 −0.045
(0.79) (0.21) (−1.17) (−0.36) (0.67) (−3.61) (0.06) (−1.34) (−1.08)lnmykf 0.024 0.049 0.166* 0.055* 0.063 * −0.038*** 0.013 0.304*** 0.036
(0.50) (1.12) (1.76) (1.90) (1.76) (−3.16) (0.28) (5.53) (0.79)
lnind 0.020 0.176 −1.253*** −0.496** 0.234 −0.205 −0.135 −1.623*** −0.496**
(0.09) (0.97) (−2.80) (−2.24) (0.70) (−1.30) (−0.70) (−4.20) (−2.13)lncsh 0.391 1.421** −1.442** −0.550 1.844*** 0.415 −1.217** −1.255 −0.900
(0.82) (2.02) (−2.29) (−0.50) (2.81) (1.10) (−2.11) (−1.33) (−1.30)dummy1 0.409* 0.310 0.885**
(1.77) (1.10) (2.27)
dummy2 0.255 −0.270 0.692***
(0.88) (−0.83) (3.47)
dummy3 −0.370 −0.367* −0.280(−1.58) (−1.67) (−1.20)
Constant −1.278 0.071 −3.917** −0.070 −1.123 −3.781*** 1.273 −3.307*** −3.164**
(−1.19) (0.03) (−2.53) (−0.09) (−1.12) (−5.34) (0.45) (−2.59) (−2.34)F-value/AR(2) −0.94
[0.349]−0.83[0.406]
−0.32[0.752]
−0.12[0.907]
−0.52[0.605]
−0.86[0.390]
−0.70[0.485]
−1.25[0.210]
0.53[0.598]
Hansen test 12.62 13.07 18.69 3.59 9.11 17.86 4.20 17.87 17.15
[0.761] [0.668] [0.347] [0.990] [0.612] [0.398] [0.898] [0.397] [0.444]
Year FE Yes Yes Yes Yes Yes Yes Yes Yes Yes
Province FE No No No No No No No No No
Observations 180 180 180 180 180 180 180 180 180
The values in brackets are T values, and the values in [] are P values
* represents P < 0.1; ** represents P < 0.05; *** represents P < 0.01
64617Environ Sci Pollut Res (2021) 28:64606–64629

the “contribution” of the energy structure to carbonemissions of resource-based provinces is greater thanthat of non-resource-based provinces. The regression re-sults of the carbon intensity and per capita carbon emis-sions as explained variables also support this conclu-sion, thus verifying hypothesis 2.
Moderating effect of the digital economy on therelationship between energy structure and carbonemission
Judging from the regression results at the national level(Table 8), the regression coefficients of the interaction terms
Table 7 Direct effect results based on the heterogeneity of resource endowment
Explanatory variables Total carbon emissions The carbon intensity Per capita carbon emissions
Resource Non-resource Resource Non-resource Resource Non-resource
L.lnC / L.lnCI/ L.lnCP 0.221** 0.129*** 0.570*** 0.493*** 0.333*** 0.105***
(2.45) (5.36) (7.29) (3.03) (6.08) (3.86)
lnE×dummy4 0.395*** 0.367** 0.348**
(2.62) (2.17) (2.12)
lnE×dummy5 0.310*** 0.246*** 0.286***
(11.05) (2.87) (7.88)
lnP 0.689*** 0.990*** 0.229* 0.124 0.170 0.159***
(6.47) (28.93) (1.75) (0.94) (1.39) (2.70)
lnA 0.105 1.167*** 0.361* 0.373 0.399 1.302***
(0.31) (6.56) (1.96) (1.55) (0.93) (7.75)
lnT 0.058 1.093*** 0.995*** 0.572** 0.874** 1.376***
(0.34) (10.65) (6.54) (2.06) (2.42) (10.66)
lnrd −0.696*** −0.180 −0.393*** −0.054 −0.320 −0.259(−4.91) (−1.14) (−5.26) (−0.53) (−1.38) (−1.57)
lnrlzb 0.160* −0.101 0.169* −0.159** −0.251 −0.183**
(1.96) (−1.54) (1.80) (−2.14) (−1.21) (−1.97)lnfdi 0.146 −0.019 −0.091 −0.015 −0.060 0.007
(1.51) (−0.41) (−1.53) (−0.26) (−0.54) (0.11)
lnmykf −0.019 0.256*** 0.221*** −0.002 0.148 0.303***
(−0.54) (7.09) (4.57) (−0.06) (1.22) (5.45)
lnind 0.450* −0.969*** −1.039*** −0.349** −1.141** −1.205***
(1.91) (−7.70) (−4.39) (−2.55) (−2.18) (−5.48)lncsh 0.970 −0.436 −0.240 −0.338 1.341 −0.437
(1.02) (−0.99) (−0.42) (−0.49) (1.21) (−0.75)dummy4 0.309* −0.349 0.051
(1.73) (−1.33) (0.18)
dummy5 −0.062 0.086 0.058
(−0.33) (0.43) (0.28)
Constant −1.588 −1.746* −5.897*** −1.059 −0.299 −2.067**
(−1.06) (−1.81) (−4.12) (−0.72) (−0.15) (−2.36)F-value/AR(2) 0.95
[0.342]−1.57[0.115]
−1.06[0.291]
0.14[0.886]
−0.85[0.394]
−1.09[0.278]
Hansen test 9.99 22.81 22.36 8.95 10.70 24.20
[0.867] [0.155] [0.267] [0.627] [0.828] [0.114]
Year FE Yes Yes Yes Yes Yes Yes
Province FE No No No No No No
Observations 180 180 180 180 180 180
The values in brackets are T values, and the values in [] are P values
* represents P < 0.1; ** represents P < 0.05; *** represents P < 0.01
64618 Environ Sci Pollut Res (2021) 28:64606–64629

between the energy structure and the digital economy are bothsignificantly negative. It shows that the digital economy has asignificant moderating effect on the impact of the energystructure on carbon emissions. The improvement of the devel-opment level of the digital economy will reduce the adverseimpact of the energy structure on carbon emissions, therebyreducing carbon emissions. Therefore, hypothesis 3 is proved.
Moderating effect (heterogeneity of regional developmentlevel)
The regression results show that the interactive coefficients ofenergy structure and digital economy in the eastern region aremore than 5%, which is significantly negative, but the inter-active coefficients of energy structure and digital economy inthe central and western regions are not significant. It showsthat the digital economy in the eastern region has a significantmoderating effect on the impact of energy structure on carbonemissions, while there is no moderating effect of the digitaleconomy in the central and western regions. The improvementof the development level of the digital economy can onlyreduce the negative impact of the eastern region’s energystructure on carbon emissions, thereby reducing carbon emis-sions, and has no impact on the central and western regions(Table 9).
Moderating effect (heterogeneity of regional resourceendowment)
Regional resources endowment heterogeneity results showthat the interaction coefficients of the digital economy andenergy structure of resource-based provinces are negativebut not significant. However, the interaction coefficients ofthe digital economy and energy structure of non-resource-based provinces are both negative and significant at the 5%statistical level, which show that the regulation effect of thedigital economy is not significant in resource-based provinces,but significant in non-resource-based provinces. Improvingthe level of the digital economy can reduce the negative im-pact of the energy structure of non-resource provinces on car-bon emissions and reduce carbon emissions. Therefore, hy-pothesis 4 is proved in this paper (Table 10).
Threshold effect
Test of threshold effect
Tables 11, 12, 13 show that the single threshold test shows thethreshold value of the digital economy is significant at thestatistical level of 1%. The double threshold test shows thatthe threshold value of the digital economy is significant at thestatistical level of 5%. The triple threshold test failed to passthe significance level of 10%. In summary, the energy
structure has a significant dual-threshold feature of the digitaleconomy when it affects carbon emissions. It is worth notingthat whether or not control variables are added to the model,the panel threshold model rejects the zero hypothesis that thereis no threshold effect, which indicates that the threshold effectof energy structure on carbon emissions exists. The impact ofenergy structure on carbon emissions depends on the regionaldigital economy. It is necessary to introduce the panel thresh-old model.
Threshold effect regression structure
When the digital economy is below the threshold of 3.7180,the influence coefficient of energy structure on carbon emis-sions is 0.425, which is significant at the statistical level of1%. When the digital economy crosses the threshold of3.7180, the impact coefficient of energy structure on carbonemissions decreases to 0.349, which is significant at the sta-tistical level of 1%. When the digital economy crosses thethreshold value of 4.7529, the impact coefficient of energystructure on carbon emissions is only 0.255, and it is signifi-cant at the level of 1%. It shows that the impact of energystructure on carbon emissions has nonlinear characteris-tics. The higher the level of the digital economy, thesmaller the adverse impact of energy structure on car-bon emissions (Table 14).
Overall, the proportion of coal consumption has a positiveimpact on carbon emissions. Under the influence of differentlevels of the digital economy, the aggravating effect of energystructure on carbon emissions will be reduced to varying de-grees. According to the estimated threshold variables, thewhole sample is divided into high/medium/low digital econo-my regions. Due to space constraints, the results of each prov-ince in 2017 are shown in Table 15. It can be seen that thedigital economy level ranking top 10 provinces are Beijing(5.0693), Fujian (5.0580), Guangdong (4.7529), Zhejiang(4.7060), Jiangsu (4.6791), Shandong(4.4431), Shanghai(4.4293), Sichuan (4.2014), Hebei (4.0411), and Liaoning(4.0187), and they mainly distribute in the eastern regionand non-resource-based provinces.
The development levels of the digital economy in Beijing(5.0693), Fujian (5.0580), and Guangdong (4.7529) are higherthan the threshold of 4.7529. Tianjin (3.3501), Qinghai(3.4590), Ningxia (3.4665), Jilin (3.4973), Gansu (3.5227),Heilongjiang (3.6198), Xinjiang (3.6794), Shanxi (3.7078),Guizhou (3.7180), and Jiangxi (3.7628) are the ten provinceswith the lowest level of digital economic development, andthey mainly distribute in the central and western regions andresource-based provinces. Interestingly, these results reflectthat in the eastern region and non-resource-based provinceswith higher economic development levels, the developmentlevel of the digital economy is higher than that in the centraland western regions and resource-based provinces.
64619Environ Sci Pollut Res (2021) 28:64606–64629

Table 8 Regression results of moderating effect
Explanatory variables Static panel model (OLS) Dynamic panel model (SYS-GMM)
TC CI CP TC CI CP TC CI CP
lnE 0.393*** 0.417*** 0.392*** 0.379*** 0.379*** 0.379*** 0.394*** 0.270*** 0.326***
(24.05) (21.96) (25.38) (37.61) (37.61) (37.61) (3.83) (4.31) (4.21)
lnD 0.018 −0.137*** 0.014 −0.039 −0.039 −0.039 0.048 0.182*** 0.066
(0.46) (3.09) (0.39) (1.61) (1.61) (1.61) (0.98) (4.46) (1.39)
lnE×lnD −0.086*** −0.073*** −0.078*** −0.112*** −0.112*** −0.112*** −0.121** −0.112*** −0.149***
(−5.03) (−3.66) (−4.84) (−8.98) (−8.98) (−8.98) (−2.57) (−3.94) (−3.45)lnP 0.953*** −0.047 −0.047 0.438 −0.003 −0.064
(3.94) (−0.19) (−0.19) (1.63) (−0.04) (−1.42)lnA 0.855*** −0.145* 0.855*** 0.806** −0.376* 0.780**
(10.73) (−1.82) (10.73) (2.12) (−1.86) (2.46)
lnT 0.847*** 0.847*** 0.847*** 0.800*** 0.383*** 0.586***
(14.85) (14.85) (14.85) (3.03) (2.97) (3.53)
lnrd 0.016 0.016 0.016 0.373** −0.052 −0.059(0.41) (0.41) (0.41) (2.12) (−0.33) (−1.16)
lnrlzb −0.080** −0.080** −0.080** −0.049 −0.031 −0.005(−2.56) (−2.56) (−2.56) (−0.96) (−0.60) (−0.09)
lnfdi −0.023 −0.023 −0.023 −0.094* −0.089** 0.010
(−1.50) (−1.50) (−1.50) (−1.87) (−2.05) (0.32)
lnmykf 0.027** 0.027** 0.027** 0.078 0.032 0.064*
(2.27) (2.27) (2.27) (1.34) (1.35) (1.71)
lnind 0.036 0.036 0.036 −0.356 0.006 0.028
(0.50) (0.50) (0.50) (−1.36) (0.04) (0.17)
lncsh 0.223 0.223 0.223 −0.454 0.982** −0.429(1.42) (1.42) (1.42) (−0.52) (2.06) (−0.83)
L.lnC 0.517***
(2.78)
L.lnCI 0.593***
(5.23)
L.lnCP 0.430***
(2.92)
Constant 9.487*** 0.503*** 1.321*** 1.697 1.697 1.697 1.437 0.570 −0.170(80.78) (3.68) (11.88) (0.85) (0.85) (0.85) (0.70) (0.41) (−0.29)
F-value/AR(2) 88.57[0.000]
113.25[0.000]
90.79[0.000]
145.51[0.000]
248.11[0.000]
132.37[0.000]
−1.32[0.186]
−0.65[0.516]
−0.51[0.607]
R2/Hansen test 0.823 0.856 0.827 0.942 0.965 0.936 7.84 / [0.449] 9.98 / [0.442] 14.03 / [0.172]
Year FE Yes Yes Yes Yes Yes Yes Yes Yes Yes
Province FE Yes Yes Yes Yes Yes Yes No No No
Observations 210 210 210 210 210 210 180 180 180
The values in brackets are T values, and the values in [] are P values
* represents P < 0.1; ** represents P < 0.05; *** represents P < 0.01
64620 Environ Sci Pollut Res (2021) 28:64606–64629

Table 9 Regression results of regulatory effect based on heterogeneity of local economic level
Explanatory variables Total carbon emissions The carbon intensity Per capita carbon emissions
Eastern Midland Western Eastern Midland Western Eastern Midland Western
lnE 0.280*** 0.424*** 0.187** 0.372*** 0.443*** 0.483*** 0.202*** 0.168*** 0.331***
(2.91) (11.13) (2.37) (5.40) (5.06) (4.89) (3.24) (2.81) (3.67)
lnD 0.060 −0.033 0.061 0.146*** 0.165 0.145** 0.060 −0.097 0.036
(0.96) (−0.74) (1.21) (3.51) (1.11) (2.40) (1.57) (−1.15) (0.68)
lnE×lnD×dummy1 −0.166** −0.122*** −0.109**
(−2.18) (−2.90) (−2.09)lnE×lnD×dummy2 0.509 −0.102 0.632
(1.59) (−0.09) (1.47)
lnE×lnD×dummy3 −0.159 −0.082 −0.187(−1.30) (−0.65) (−1.01)
lnP 0.512*** 1.032*** 0.212 0.006 0.228 0.270 −0.068* 0.007 0.190
(2.65) (9.97) (1.23) (0.06) (1.25) (1.03) (−1.86) (0.08) (0.36)
lnA 0.855*** 1.127*** 0.244 0.016 0.264 0.362 0.381** 0.804*** 1.036*
(3.30) (5.13) (0.97) (0.09) (0.70) (0.81) (2.13) (3.14) (1.84)
lnT 0.660*** 0.931*** 0.212* 0.735*** 0.585** 0.647** 0.394*** 0.366*** 0.753*
(3.07) (5.89) (1.68) (4.51) (2.36) (1.98) (2.77) (2.92) (1.93)
lnrd 0.117 −0.210 0.041 −0.025 0.490 0.565 −0.053 −0.093 −0.004(1.25) (−1.12) (0.57) (−0.26) (1.29) (1.53) (−1.58) (−0.51) (−0.01)
lnrlzb 0.015 −0.150*** −0.080 0.037 0.012 0.078 0.027 −0.122* 0.113
(0.31) (−3.37) (−1.46) (0.89) (0.10) (0.67) (0.46) (−1.71) (1.04)
lnfdi −0.100** −0.047 0.030 −0.124*** −0.264** −0.342** −0.039 0.024 −0.025(−2.42) (−1.21) (1.15) (−3.02) (−2.01) (−2.10) (−1.44) (0.83) (−0.48)
lnmykf −0.073 0.083*** 0.008 0.009 0.011 0.046 0.047 −0.008 −0.035(−1.14) (2.73) (0.18) (0.34) (0.32) (1.21) (1.17) (−0.24) (−0.51)
lnind −0.001 −0.459* 0.017 −0.119 −0.429 −0.590 0.014 −0.165 −0.079(−0.01) (−1.84) (0.12) (−0.69) (−0.91) (−1.23) (0.10) (−0.80) (−0.23)
lncsh −0.998* 0.437 −0.063 −0.134 −0.592 −0.360 −0.110 −0.498 −1.259(−1.93) (0.57) (−0.12) (−0.21) (−0.67) (−0.26) (−0.47) (−1.01) (−1.07)
dummy1 0.413* 0.314 0.099
(1.80) (1.63) (1.35)
dummy2 −0.100 −0.326 −0.147(−0.93) (−1.02) (−0.87)
dummy3 0.054 0.171 −0.173(0.51) (0.42) (−0.59)
L.lnC/ L.lnCI/ L.lnCP 0.477*** 0.037*** 0.679*** 0.309** 0.639*** 0.648** 0.579*** 0.550*** 0.335**
(3.49) (2.70) (4.68) (2.20) (4.38) (2.43) (4.58) (4.30) (2.53)
Constant −1.072 −0.226 1.674* −1.255 −1.572 −2.331 0.012 0.010 −3.752(−0.64) (−0.29) (1.72) (−1.00) (−0.66) (−0.79) (0.02) (0.01) (−0.59)
F-value/AR(2) −1.14[0.253]
0.97[0.333]
−0.48[0.628]
−0.57[0.571]
0.08[0.937]
0.18[0.860]
−0.97[0.330]
−0.11[0.909]
−0.10[0.920]
Hansen test 4.15 11.91 13.67 3.75 2.63 1.94 13.73 11.45 10.65
[0.843] [0.613] [0.134] [0.927] [0.955] [0.983] [0.318] [0.246] [0.155]
Year FE Yes Yes Yes Yes Yes Yes Yes Yes Yes
Province FE No No No No No No No No No
Observations 180 180 180 180 180 180 180 180 180
The values in brackets are T values, and the values in [] are P values
* represents P < 0.1; ** represents P < 0.05; *** represents P < 0.01
64621Environ Sci Pollut Res (2021) 28:64606–64629

Discussion
Discussion of direct effect estimation results
According to the direct effect regression results, the followingdiscussion can be drawn:
As can be seen from the results in Table 5, with the increaseof the proportion of coal consumption, carbon emissions willalso increase. It shows that China’s carbon emission level isstill highly related to the energy consumption structure. FromFigure 1, both the proportion of coal consumption and carbonemissions presented an increasing trend from 2004 to 2017. It
can be seen from Table 1 that the average growth ratesof carbon emissions are all positive, and Hainan,Xinjiang, Guangxi, Ningxia, and Inner Mongolia arethe five provinces with the fastest growth rate of carbonemissions, and their carbon emission growth rates areall over 10%. And the growth rate of carbon emissionsin Inner Mongolia is faster than economic growth, andthe quality of energy consumption is obviously low(Rehman et al. 2021a, 2021b). One possible reason isthat these provinces have a relatively low level of eco-nomic development. In the early stage of economic de-velopment, energy consumption is relatively large,
Table 10 Regression results of regulatory effect based on heterogeneity of resource endowment
Explanatory variables Total carbon emissions The carbon intensity Per capita carbon emissions
Resource Non-resource Resource Non-resource Resource Non-resource
lnE 0.451*** 0.389*** 0.422*** 0.345*** 0.260*** 0.283***
(12.22) (3.86) (12.35) (6.18) (4.68) (3.71)lnD 0.058* 0.041 0.103*** 0.144 * * 0.094*** 0.058
(1.86) (0.96) (4.18) (2.37) (2.96) (1.57)lnE×lnD×dummy4 −0.457 −0.123 −0.314
(−1.31) (−0.54) (−1.14)lnE×lnD×dummy5 −0.146*** −0.106*** −0.104**
(−3.13) (−2.34)lnP 0.867*** 0.593** −0.096 −0.080 −0.077 −0.094
(9.74) (2.46) (−1.15) (−1.60) (−1.21) (−1.41)lnA 1.446*** 1.094*** 0.338* 0.141 0.755** 0.877***
(6.43) (3.62) (1.81) (0.63) (2.36) (3.53)lnT 0.941*** 0.872*** 0.970*** 0.643*** 0.535*** 0.604***
(10.13) (3.39) (9.84) (3.22) (3.75) (3.36)lnrd −0.057 0.272 −0.065 −0.012 0.046 0.137
(−0.26) (1.64) (−0.38) (−0.08) (0.43) (0.93)lnrlzb −0.129** −0.031 0.046 0.012 −0.053 −0.085
(−2.06) (−0.53) (0.99) (0.22) (−0.91) (−1.21)lnfdi 0.011 −0.071* −0.078** −0.129** 0.029 −0.009
(0.29) (−1.84) (−2.14) (−2.36) (1.26) (−0.33)lnmykf 0.119*** 0.027 −0.001 0.012 0.029 0.027
(3.04) (0.53) (−0.09) (0.61) (0.88) (0.67)lnind −0.281* −0.258 −0.256 −0.042 −0.209 −0.157
(−1.66) (−1.21) (−1.57) (−0.22) (−1.54) (−1.01)lncsh −0.670 −1.155** −0.960 0.196 −0.709 −1.018*
(−0.94) (−2.11) (−1.45) (0.37) (−0.91) (−1.93)dummy4 0.081 −0.159 0.017
(0.72) (−1.05) (0.19)dummy5 0.062 0.153 0.094
(0.51) (1.05) (1.23)L.lnC/ L.lnCI/ L.lnCP 0.040*** 0.477*** 0.072*** 0.498*** 0.420*** 0.518***
(2.63) (2.80) (3.13) (4.35) (3.62) (3.60)Constant 0.362 −0.869 −1.362* −0.222 0.271 0.636
(0.29) (−0.49) (−1.88) (−0.22) (0.33) (0.55)F-value/AR(2) 0.05
[0.962]−0.10[0.917]
1.50[0.134]
−0.30[0.765]
−0.76[0.445]
−0.27[0.787]
Hansen test 19.39 8.40 14.13 7.07 10.96 11.47[0.111] [0.396] [0.365] [0.630] [0.278] [0.245]
Year FE Yes Yes Yes Yes Yes YesProvince FE No No No No No NoObservations 180 180 180 180 180 180
The values in brackets are T values, and the values in [] are P values
* represents P < 0.1; ** represents P < 0.05; *** represents P < 0.01
64622 Environ Sci Pollut Res (2021) 28:64606–64629

which brings relatively high economic growth (Wuet al. 2018; Wu et al. 2021b).
The intensity of energy structure’s impact on carbon emis-sions varies significantly with different levels of economicdevelopment. The results in Table 6 show that the easternenergy structure has the least impact on carbon emissions,while the western is in the middle and the central is the largest.The reason is that the central region is not only the mainagricultural production area, but also the traditional produc-tion area of coal and other energy, and the secondary andtertiary industries started late (Jin and Wu 2013; Song andPeng 2019).With the advancement of China’s industrial struc-ture, the energy and resource-based industries in the easternregion have to find the best transfer place under the constraintsof the livable environment of local residents and the rising cost(Yang et al. 2021b; Hao et al. 2021b). The central region hasthe advantages of resources, transportation, and population,which will reduce the production cost and transfer cost ofenterprises. Therefore, it has become an ideal place to under-take the eliminated industries in the eastern region (Mao2019). In addition, the low added value of these backwardindustries is not conducive to the improvement of technicalefficiency and the reduction of carbon emissions. The eco-nomic development of the western region is relatively back-ward, but it contains abundant wind energy, natural gas, andsolar energy resources. Under the western development strat-egy, the implementation of the West-East natural gas trans-mission project and the West-East power transmission projecthas slowed down the dependence on coal and other traditionalenergy to a certain extent (Tian et al. 2006). At the same time,natural gas and hydropower replace coal as primary energy,which also contributes to reducing CO2 and other greenhousegas emissions. Combined with Table 6 and China’s carbonemission calculation results (Table 1), the eastern region ac-counts for 6 of the 10 provinces with the largest carbon
emission, but the energy structure of the eastern region hasthe least impact on carbon emissions; from the results of av-erage growth rates of carbon emissions, the growth rate ofcarbon emissions in eastern China is low. It can be seen thatthe energy demand of the eastern region is transferred acrossregions (Wu et al. 2020). China’s energy geographic spatialreallocation not only transforms the resource advantages ofthe western region into economic advantages, but also makesan indelible contribution to the economy and environment ofthe eastern region; carbon emissions in the western regionhave also increased (Guo and Ge 2004).
The impact of energy structure on carbon emissions is het-erogeneous due to the difference of resource endowment. Thecontribution of energy structure to carbon emissions inresource-based provinces is greater than that of non-resource-based provinces. One possible explanation is that,for resource-based provinces, it is undoubtedly a “shortcut”to drive economic growth by taking advantage of local re-source industries to drive economic growth, but this growthmodel naturally attracts resource-intensive industrial agglom-eration (Wang et al. 2019). The excessive dependence ofresource-based provinces on resources will lead to the simpli-fication of the local industrial structure, and regional develop-ment is likely to form the “inertia” (Fouquet 2016). Moreover,the industries pursuing resources are mostly high energy con-sumption and high emission sectors (Hao and Deng 2019).There is no doubt that the high level of energy consumptionleads to an increase in carbon emissions.
Discussion on the estimation results of themoderating effect
First of all, at the national level, the digital economy has anobvious moderating effect on the relationship between energystructure and carbon emissions. According to Eq. 5, the
Table 11 Total carbon emissionsas explained variable The number of
thresholds(total carbon emissions)
The thresholdvalue
TheF value Pvalues
The critical value
1% 5% 10%
Single threshold test 4.7529 77.53 0.000 36.8878 27.2855 22.0899
Double threshold test 3.7180 52.97 0.014 60.1436 25.5798 19.3863
Triple threshold test 2.7551 21.42 0.7080 110.990 68.7736 54.0355
Table 12 Carbon emissionintensity is taken as the explainedvariable
The number ofthresholds(The carbon intensity)
The thresholdvalue
The F value Pvalues
The critical value
1% 5% 10%
Single threshold test 4.7529 77.53 0.000 37.0517 25.5707 22.5935
Double threshold test 3.7180 52.97 0.018 76.3572 26.8427 18.4189
Triple threshold test 2.7551 21.42 0.664 96.7156 59.1368 49.4026
64623Environ Sci Pollut Res (2021) 28:64606–64629

marginal contribution of the energy structure to carbon emis-sions is a function of the digital economy. Since the influencecoefficients of the interaction terms of the digital economy oncarbon emissions are all significantly negative (Table 8), thehigher the development level of digital economy, the greaterthe contribution of the moderating effect of digital economy tocarbon emission reduction.
The moderating role of the digital economy in the relation-ship between energy structure and carbon emissions is signif-icant in the eastern region, but not significant in the central andwestern regions. This may be because the eastern region has ahigher level of economic development than the central andwestern regions and a better environment for the developmentof the digital economy, which is conducive to the regulation of
Table 14 Regression results ofthe threshold effect Threshold effect parameter estimation results (1) (2) (3)
TC CI CP
lnP 1.402* * 0.402* 0.402*
(6.42) (1.84) (1.84)
lnA 0.942* * −0.058 0.942 * *
(15.06) (−0.92) (15.06)
lnT 0.784 * * 0.784* * 0.784 * *
(15.27) (15.27) (15.27)
lnrd 0.012 0.012 0.012
(0.37) (0.37) (0.37)
lnrlzb −0.033 −0.033 −0.033(−1.25) (−1.25) (−1.25)
lnfdi −0.025* −0.025 * −0.025 *
(−1.94) (−1.94) (−1.94)lnmykf 0.021 * 0.021 * 0.021 *
(1.94) (1.94) (1.94)
lnind −0.110** −0.110 * * −0.110**
(−2.58) (−2.58) (−2.58)lncsh −0.061 −0.061 −0.061
(−0.46) (−0.46) (−0.46)lnEit·F(lnDit≤3.7180) 0.425*** 0.425*** 0.425***
(31.96) (31.96) (31.96)
lnEit·F(3.7180≤ lnDit≤4.7529) 0.349*** 0.349*** 0.349***
(37.11) (37.11) (37.11)
lnEit·F(lnDit≥4.7529) 0.255*** 0.255*** 0.255***
(20.47) (20.47) (20.47)
Constant −2.861 −2.861 −2.861(−1.62) (−1.62) (−1.62)
R2 0.944 0.967 0.939
Observations 210 210 210
The values in brackets are T values
* represents P < 0.1; ** represents P < 0.05; *** represents P < 0.01
Table 13 Per capita carbonemissions as explained variable The number of thresholds
(Per capita carbonemissions)
The thresholdvalue
The Fvalue
Pvalues
The critical value
1% 5% 10%
Single threshold test 4.7529 77.53 0.000 37.9399 26.3816 22.4251
Double threshold test 3.7180 52.97 0.010 51.3781 22.0493 17.2228
Triple threshold test 2.7551 21.42 0.6980 103.209 61.8878 49.9699
64624 Environ Sci Pollut Res (2021) 28:64606–64629

the digital economy. The digital economy provides more ob-vious “information and technology incentives” to enterprisesand users. Driven by a higher level of the digital economy,companies are more willing to transform their energy structureand save energy. And the information integration effect of thedigital economy has a more obvious effect on improving en-ergy efficiency. Energy efficiency directly affects the amountof energy required to provide products and services so as toreduce energy consumption and curb the increase of carbonemissions. Moreover, the central and western regions are fac-ing greater economic development pressure compared withthe eastern region. Therefore, these two regions pay moreattention to the short-term impact of energy consumption oneconomic growth and pay less attention to the development ofdigital economy and energy structure adjustment. Therefore,the regulatory effect of digital economy in the impact of ener-gy structure on carbon emissions has not been effectivelyexerted.
The digital economy has a significant regulatory role innon-resource-based provinces but not significant in resource-based provinces. The reason is that, on one hand, comparedwith non-resource-based provinces, resource-based provincesundertake the two important tasks of supplying productionfactors and maintaining economic growth. GDP-oriented per-formance concept drives local governments to use resourceswith comparative advantages to attract resource-based indus-tries to gather in the region. But the traditional extractive in-dustry as the pillar of economic development will make thedevelopment of emerging technologies subject to the dilemmaof the “economy-environment” zero-sum game, causingresource-based provinces to ignore the development of envi-ronmentally friendly technologies. On the other hand,resource-based industries have a relatively great demand forproduction factors such as capital and labor and have strong“stickiness” (Liebowitz and Margolis 1995), which has a sig-nificant “crowding-out effect” on innovative enterprises.Thus, it is not conducive to promoting the regional technologylevel, and the development level of digital technology is low.Therefore, the positive regulatory role of the digital economyhas not yet appeared.
Discussion of threshold effect estimation results
The nonlinear effect of energy structure on carbon emissions,with the digital economy as the threshold variable, is the fur-ther research of this paper based on the heterogeneity analysisof moderating effect. According to Table 14, when lnDit ≤3.7180, the level of the digital economy does not pass thethreshold, and the positive effect of energy structure on carbonemissions is 0.425; when 3.7180 ≤ ln Dit ≤ 4.7529, the posi-tive effect of energy structure on carbon emissions is 0.349,which is 17.88% lower than that of regions without passingthe threshold; when lnDit ≥ 4.7529, the impact of energy struc-ture on carbon emissions is only 0.255, which is 34.12% low-er than that of regions without passing the threshold.Therefore, the digital economy is an important driving factorfor carbon emission reduction, and only a high level of digitaleconomy development quality can reduce the adverse impactof energy structure on carbon emissions. The higher the levelof the digital economy, the less negative effect of the energyconsumption structure dominated by coal on carbon emissionswill be. In the role of the digital economy, energy consump-tion has brought economic growth, but the adverse output(carbon emissions) is lower than in places where the digitaldevelopment level failed to pass the threshold. Therefore, thedigital economy is a strong competitive force for a region tobalance the “economic growth-environmental pollution”dilemma.
Conclusions and implications
Based on the extended STIRPATmodel, this paper empirical-ly tests the impact of energy structure and digital economy oncarbon emissions in 30 provinces of China from 2011 to 2017and discusses the heterogeneity of economic level and re-source endowment. The static and dynamic regression resultsshow that the energy structure has a significant driving effecton carbon emissions, and the conclusion is still robust afterchanging the explained variables. It is worth noting that thiskind of influence has a greater impact on the central region of
Table 15 Development level of the digital economy in different provinces
lnDit≤3.7180 N 3.7180≤ lnDit≤4.7529 N 4.7529≤ lnDit N
Shanxi (3.7078), Xinjiang (3.6794), Heilongjiang(3.6198), Gansu (3.5227), Jilin (3.4973), Ningxia(3.4665), Qinghai (3.4590), Tianjin (3.3501)
8 Zhejiang (4.7060), Jiangsu (4.6791), Shandong (4.4431),Shanghai (4.4293), Sichuan (4.2014), Hebei (4.0411),Liaoning (4.0187), Henan (4.0181), Anhui (3.9570),Hunan (3.9267), Chongqing (3.9242), Hainan(3.8600), Hubei (3.8964), Shaanxi (3.8261), Guangxi(3.8248), Inner Mongolia (3.8020), Yunnan (3.7923),Jiangxi (3.7628), Guizhou (3.7180)
19 Beijing (5.0693),Fujian (5.0580),Guangdong(4.7529)
3
64625Environ Sci Pollut Res (2021) 28:64606–64629

China, followed by the western region and the eastern region.In addition, the digital economy has a significant moderatingeffect. Specifically, the digital economy can play the role ofenergy conservation and emission reduction. With the devel-opment of the digital economy, the impact of coal-based en-ergy structure on carbon emissions is gradually decreasing.This effect is more obvious in non-resource-based provincesand eastern China but not obvious in resource-based cities andcentral and western China. On the basis of the above analysisresults, this paper gets the following enlightenment:
Combined with the regional characteristics, we believethat, as the key carbon emission regions with higher economicdevelopment level, the eastern and non-resource-based prov-inces should pay attention to the development of green tech-nology, effectively use the advantages of local talents andcapital, research and develop green technology and transformprocess flow, improve energy utilization efficiency, and pro-mote the development of energy conservation and emissionreduction technology. The central and resource-based prov-inces need to take into account the governance of input andoutput. On one hand, the central and resource-based provincesshould abandon the traditional path of resource-based indus-tries for growth, restrict the development of high energy con-sumption and high-carbon emission enterprises, and promotethe transformation and upgrading of industrial structure. Onthe other hand, the government should improve the marketmechanism design of carbon emission reduction and guideenterprises to pay attention to the application of green tech-nology in the form of carbon tax and carbon emission right, soas to realize low-carbon development. The western regionneeds to focus on breaking through the bottleneck of photo-voltaic, wind, solar, and other clean energy utilization, striveto realize the wide application of clean energy as soon aspossible, and decarbonize production and life by means ofenergy structure transformation.
Digital economy includes digital industrialization and dig-ital industry. Among them, digital industrialization is thefoundation. According to the white paper on China’s DigitalEconomy Development and Employment (2018), China’s dig-ital foundation is weak, and it still needs a process for China’smanufacturing industry from automation and digitization tonetworking and intellectualization. Therefore, the governmentshould guarantee the orderly progress of digital economy in-frastructure construction by means of financial support, indus-trial support, investment, and financing inclination. In addi-tion, the government should encourage social and economicentities to increase their understanding and application of dig-ital technology, expand digital reform efforts, and promote thewide application of digital technology in the three major in-dustries. Due to the unbalanced development level of digitaleconomy among regions, digital knowledge and technologyneed to bewidely popularized in less developed areas. In orderto narrow the development gap of digital economy between
regions, the government should build a platform for knowl-edge and technology communication and exchange amongregions. Threshold effect shows that the higher the develop-ment level of digital economy, the more obvious the effect ofemission reduction. This means that while promoting the pop-ularization of digital knowledge and technology, innovationand breakthrough of digital technology still need to be placedin an important position. Finally, the healthy development ofdigital economy is inseparable from the effective supervisionand management mechanism. In the process of the integrationof digital economy and traditional industries, and the birth ofnew business state by digital economy, the government shouldalso pay attention to the potential security risks of digitaleconomy, so as to ensure that the application and promotionof digital economy can play an “enabling” role.
Code availability Source codes are available on request.
Author contribution Y.L.: Conceptualization, project administration,formal analysis, writing—review & editing, data curation, writing—original draft. X.Y.: Writing—review & editing, validation. Q.R.:Conceptualization, methodology, funding acquisition, supervision.H.W.: Conceptualization, methodology, funding acquisition, supervision.M.I.: Writing—original draft, writing—review & editing, formal analy-sis. M.A.: Writing—review & editing, writing—original draft.
Funding The authors acknowledge financial support from the Project ofNational Natural Science Foundation of China (71463057), the Project ofNatural Science Foundation of Xinjiang Uygur Autonomous Region(2017D01C071), the key scientific research projects of universities inXinjiang (XJEDU2019SI003), the Silk Road Foundation of XinjiangUniversity (JGSL18053), the second phase project of the School ofEconomics and Management of Xinjiang University (19JGPY001), andthe graduate research and innovation project of Xinjiang University(XJ2019G005, XJ2020G020). The party central committee’s Xinjiang-Governance strategy theory and practice research key project(19ZJFLZ09) is also acknowledged. The usual disclaimer applies.
Data availability Not applicable.
Declarations
Ethical approval and consent to participate Not applicable.
Consent for publication Not applicable.
Conflict of interest The authors declare no competing interests.
References
Ahmad M, Zhao Z-Y, Irfan M, Mukeshimana MC (2019) Empirics oninfluencing mechanisms among energy, finance, trade, environ-ment, and economic growth: a heterogeneous dynamic panel dataanalysis of China. Environ Sci Pollut Res 26(14):14148–14170
Ahmad M, Ahmed N, Jabeen M, Jabeen G, Qamar S, Chandio AA,Rehman A, Rauf A (2020) Empirics on heterogeneous links among
64626 Environ Sci Pollut Res (2021) 28:64606–64629

urbanization, the intensity of electric power consumption, water-based emissions, and economic progress in regional China.Environ Sci Pollut Res 27(31):38937–38950
AhmadM, Chandio AA, Solangi YA, Shah SAA, Shahzad F, Rehman A,Jabeen G (2021) Dynamic interactive links among sustainable ener-gy investment, air pollution, and sustainable development in region-al China. Environ Sci Pollut Res 28(2):1502–1518
Alam MM, Murad MW (2020) The impacts of economic growth, tradeopenness and technological progress on renewable energy use inorganization for economic co-operation and development countries.Renew Energy 145(Jan.):382–390
Anser MK, Ahmad M, Khan MA, Zaman K, Nassani AA, Askar SE,Abro MMQ, Kabbani A (2021) The role of information and com-munication technologies in mitigating carbon emissions: evidencefrom panel quantile regression. Environ Sci Pollut Res 28(17):21065–21084
Antoci A, Galeotti M, Sordi S (2018) Environmental pollution as anengine of industrialization. Commun Nonlinear Sci NumerSimulEnvironmental pollution as engine of industrialization.Communications in Nonlinear Science and Numerical Simulation,58, 262–273
Arellano M, Bond S (1991) Some tests of specification for panel data:Monte Carlo evidence and an application to employment equations.Rev Econ Stud 58(2):277–297
Aydin E, Brounen D, Kok N (2018) Information provision and energyconsumption: evidence from a field experiment. Energy Econ 71:403–410
Bhattacharya M, Rafiq S, Bhattacharya S (2015) The role of technologyon the dynamics of coal consumption-economic growth: new evi-dence from China. Appl Energy 154:686–695
Birdsall N (1992) Another look at population and global warming.Research Papers in Economics, 1
Blundell R, Bond SR (1998) Initial conditions and moment restrictions indynamic panel data models. J Econ 87(1):115–143
Cansino JM, Sánchez-Braza A, Rodríguez-Arévalo ML (2015) Drivingforces of Spain’s CO2 emissions: a LMDI decomposition approach.Renew Sust Energ Rev 48:749–759
Cao J, Law SH, Samad ARBA, Mohamad WNBW, Wang J, Yang X(2021) Impact of financial development and technological innova-tion on the volatility of green growth—evidence from China.Environ Sci Pollut Res:1–17
Chen Y (2020) Improving market performance in the digital economy.China Econ Rev 62:101482
Chen C, Pinar M, Stengos T (2020) Renewable energy consumption andeconomic growth nexus: evidence from a threshold model. EnergyPolicy 139:111295
Dietz T, Rosa EA (1994) Rethinking the environmental impacts of pop-ulation, Affluence and Technology
Dogan E, Seker F (2016) Determinants of CO2 emissions in the EuropeanUnion: the role of renewable and non-renewable energy. RenewEnergy 94:429–439
Ehrlich PR, Holdren JP (1971) Impact of population growth. ObstetGynecol Surv 26(11):769–771
Ertugrul HM, Cetin M, Seker F, Dogan E (2016) The impact of tradeopenness on global carbon dioxide emissions: evidence from the topten emitters among developing countries. Ecol Indic 67:543–555
Exponential roadmap (2020) Exponential roadmap2030[EB/OL]. https://exponentialroadmap.org/,2020-3
Feng Y, Wang X, Liang Z (2021a) How does environmental informationdisclosure affect economic development and haze pollution inChinese cities? The mediating role of green technology innovation.Sci Total Environ 775:145811
Feng Y, Wang X, Liang Z, Hu S, Xie Y, Wu G (2021b) Effects ofemission trading system on green total factor productivity inChina: empirical evidence from a quasi-natural experiment. JClean Prod 294:126262
Fouquet R (2016) Path dependence in energy systems and economicdevelopment. Nat Energy 1(8):16098
Gan T, LiangW, Yang H, Liao X (2020) The effects of haze pollution oneconomic development and spatial distribution of PM2.5 in hazepollution. Urbanization as a mediating variable. J Clean Prod 266:121880
Guo X, Ge J (2004) Simulation study on integrated development systemof “resources economy environment” in West to East gas transmis-sion corridor. Journal of system simulation 11:2533–2537 (inChinese)
Guozhi L, Zongzhi L, Ming Z (2011) Provincial comparison and factordecomposition of energy carbon emissions in eastern China.Contemporary economic management 33(10):48–52 (in Chinese)
Hao X, Deng F (2019) The marginal and double threshold effects ofregional innovation on energy consumption structure: evidencefrom resource-based regions in China. Energy Policy 131:144–154
Hao Y, Ba N, Ren S, Wu H (2021a) How does international technologyspillover affect China’s carbon emissions? A new perspectivethrough intellectual property protection. Sustainable Productionand Consumption 25:577–590
Hao Y, Gao S, Guo Y, Gai Z, Wu H (2021b) Measuring the nexusbetween economic development and environmental quality basedon environmental Kuznets curve: a comparative study betweenChina and Germany for the period of 2000–2017. Environment,Development and Sustainability, 1-26
Heiskanen E, Jalas M, Timonen P (2005) Reducing the natural resourceintensity of private and organisational consumption: the potential ofICT and service innovations. Progress in Industrial Ecology, AnInternational Journal 2:453–474
Hsiao C (1986) Analysis of Panel Data, Vol. 11 of Econometric SocietyMonographs. Cambridge University Press, New York.
Huang C, Zhang X, Liu K (2021) Effects of human capital structuralevolution on carbon emissions intensity in China: a dual perspectiveof spatial heterogeneity and nonlinear linkages. Renew Sust EnergRev 135:110258
IrfanM, Elavarasan RM, HaoY, FengM, Sailan D (2021) An assessmentof consumers’ willingness to utilize solar energy in China: end-users’ perspective. J Clean Prod 292:126008
Jin L, Wu H (2013) Regional heterogeneity of China's carbon emissionsand countermeasures. Econ Manag 27(11):83–87 (in Chinese)
Junior JAG, Busso CM, Gobbo SCO, Carreão H (2018) Making the linksamong environmental protection, process safety, and industry 4.0.Process Saf Environ Prot 117:372–382
Kjaer LL, Pigosso DCA, McAloone TC, Birkved M (2018) Guidelinesfor evaluating the environmental performance of Product/Service-Systems through life cycle assessment. J Clean Prod 190:666–678
Knapp T, Mookerjee R (1996) Population growth and global CO2 emis-sions: a secular perspective. Energy Policy 24(1):31–37
Li Q, Wang M, Xiangli L (2021a) Do government subsidies promotenew-energy firms’ innovation? Evidence from dynamic and thresh-old models. J Clean Prod 286:124992
Li R,WangQ, Liu Y, Jiang R (2021b) Per-capita carbon emissions in 147countries: effects of economic, energy, social, and trade structuralchanges. Sustainable Production and Consumption
Liebowitz SJ, Margolis SE (1995) Path dependence, lock-in, and history.J Law Econ Org 11(1):205–226
64627Environ Sci Pollut Res (2021) 28:64606–64629

Liu Y, Zhou Y, Wu W (2015) Assessing the impact of population, in-come and technology on energy consumption and industrial pollut-ant emissions in China. Appl Energy 155:904–917
Liu J, Yuanyi Y, Zhang S (2020) Research on China’s digital economicmeasurement and driving factors. Shanghai Economic Research 06:81–96 (in Chinese)
Liu J, Li S, Ji Q (2021) Regional differences and driving factors analysisof carbon emission intensity from transport sector in China. Energy224:120178
Maheshwari B, Pinto U, Akbar S, Fahey P (2020) Is urbanisation also theculprit of climate change?—evidence from Australian cities. UrbanClim 31:100581
Mahmood H, Alkhateeb TTY, Furqan M (2020) Industrialization, urban-ization and CO2 emissions in Saudi Arabia: asymmetry analysis.Energy Rep 6:1553–1560
Mao J (2019) Government behavior, environmental regulation and re-gional technological innovation—an analysis based on regional het-erogeneity and path mechanism. Journal of Shanxi University ofFinance and Economics 41(05):16–27 (in Chinese)
Miller P, Wilsdon J (2001) Digital futures—an agenda for a sustainabledigital economy. Corp Environ Strateg 8(3):275–280
Narayan S, Doytch N (2017) An investigation of renewable and non-renewable energy consumption and economic growth nexus usingindustrial and residential energy consumption. Energy Econ 68:160–176
Nguyen KH, Kakinaka M (2019) Renewable energy consumption, car-bon emissions, and development stages: some evidence from panelcointegration analysis. Renew Energy 132:1049–1057
Ozturk I, Acaravci A (2010) CO2 emissions, energy consumption andeconomic growth in Turkey. Renew Sust Energ Rev 14(9):3220–3225
Palencia JCG, Furubayashi T, Nakata T (2013) Analysis of CO2 emis-sions reduction potential in secondary production and semi-fabrication of non-ferrous metals. Energy Policy 52:328–341
Petrović P, Lobanov MM (2020) The impact of R&D expenditures onCO2 emissions: evidence from sixteen OECD countries. J CleanProd 248:119187
Rademaeker ED, Suter G, Pasman HJ, Fabiano B (2014) A review of thepast, present and future of the European loss prevention and safetypromotion in the process industries. Process Saf Environ Prot 92(4):280–291
RehmanA, Rauf A, AhmadM, ChandioAA, Deyuan Z (2019) The effectof carbon dioxide emission and the consumption of electrical ener-gy, fossil fuel energy, and renewable energy, on economic perfor-mance: evidence from Pakistan. Environ Sci Pollut Res 26(21):21760–21773
Rehman A, Ma H, Ozturk I, Ahmad M, Rauf A, Irfan M (2020) Anotheroutlook to sector-level energy consumption in Pakistan from dom-inant energy sources and correlationwith economic growth. EnvironSci Pollut Res:1–16
Rehman A, Ma H, Ahmad M, Ozturk I, Işık C (2021a) Estimating theconnection of information technology, foreign direct investment,trade, renewable energy and economic progress in Pakistan: evi-dence from ARDL approach and cointegrating regression analysis.Environ Sci Pollut Res:1–13
Rehman A, Ma H, Chishti MZ, Ozturk I, Irfan M, Ahmad M (2021b)Asymmetric investigation to track the effect of urbanization, energyutilization, fossil fuel energy and CO2 emission on economic effi-ciency in China: another outlook. Environ Sci Pollut Res 28(14):17319–17330
Ren S, Hao Y, Xu L, Wu H, Ba N (2021) Digitalization and energy: howdoes internet development affect China’s energy consumption?Energy Econ 98:105220
Shafiei S, Salim RA (2014) Non-renewable and renewable energy con-sumption and CO2 emissions in OECD countries: a comparativeanalysis. Energy Policy 66:547–556
Shuai C, Shen L, Jiao L, Wu Y, Tan Y (2017) Identifying key impactfactors on carbon emission: evidences from panel and time-seriesdata of 125 countries from 1990 to 2011. Appl Energy 187:310–325
Soares JB, Tolmasquim MT (2000) Energy efficiency and reduction ofCO2 emissions through 2015: the Brazilian cement industry. MitigAdapt Strateg Glob Chang 5(3):297–318
SongH, PengD (2019) Factor endowment structure, biased technologicalprogress and total factor productivity growth: an empirical studybased on stochastic frontier function of regional heterogeneity.Jiangxi Social Sciences, 39(09):47-59+254-255 (in Chinese)
Su X, Yang X, Zhang J, Yan J, Zhao J, Shen J, Ran Q (2021) Analysis ofthe impacts of economic growth targets and marketization on energyefficiency: evidence from China. Sustainability 13(8):4393
Tian C, Li L, Yang H, Shang H, Jia N, DongW, Jiang C, Zhao G (2006)Study on environmental synergy of West to East Gas TransmissionProject. Environ Sci Res 03:122–127 (in Chinese)
Usman A, Ozturk I, Hassan A, Zafar SM, Ullah S (2021) The effect ofICT on energy consumption and economic growth in South Asianeconomies: an empirical analysis. Telematics Inform 58:101537
Vu KM (2011) ICT as a source of economic growth in the informationage: empirical evidence from the 1996-2005 period. TelecommunPolicy 35(4):357–372
Wang K, Wu M, Sun Y, Shi X, Sun A, Zhang P (2019) Resource abun-dance, industrial structure, and regional carbon emissions efficiencyin China. Res Policy 60:203–214
Wang B, He L, Yuan X-C, Sun Z-M, Liu P (2021) Carbon emissions ofcoal supply chain: an innovative perspective from physical to eco-nomic. J Clean Prod 295:126377
Watts N, Amann M, Arnell N, Ayeb-Karlsson S, Beagley J, Belesova Ket al (2021) The 2020 report of The Lancet Countdown on healthand climate change: responding to converging crises. Lancet397(10269):129–170
Wu Y, Zhu Q, Zhu B (2018) Comparisons of decoupling trends of globaleconomic growth and energy consumption between developed anddeveloping countries. Energy Policy 116:30–38
Wu H, Hao Y, Ren S (2020) How do environmental regulation andenvironmental decentralization affect green total factor energy effi-ciency: evidence from China. Energy Econ 91:104880
Wu W, Zhang T, Xie X, Huang Z (2021) Regional low carbon develop-ment pathways for the Yangtze River Delta region in China. EnergyPolicy 151:112172
Wu H, Xia Y, Yang X, Hao Y, Ren S (2021a) Does environmentalpollution promote China’s crime rate? A new perspective throughgovernment official corruption. Struct Chang EconDyn 57:292–307
WuH, Hao Y, Ren S, Yang X, Xie G (2021b) Does internet developmentimprove green total factor energy efficiency? Evidence from China.Energy Policy 153:112247
Xu B, Chen Y, Shen X (2019) The clean energy development, carbondioxide emission reduction and regional economic growth. EconRes 54(07):188–202 (in Chinese)
Yan Y,Wang R, Zheng X, Zhao Z (2020) Carbon endowment and trade-embodied carbon emissions in global value chains: evidence fromChina. Appl Energy 277:115592
Yang, Zhongshan., & Wei, Xiaoxue. (2018) Total factor energy efficien-cy of the regions along the belt and road—measurements,
64628 Environ Sci Pollut Res (2021) 28:64606–64629

decomposition and influence factors analysis. China Environ Sci38(11):4384–4392 (in Chinese)
Yang X,Wu H, Ren S, Ran Q, Zhang J (2021a) Does the development ofthe internet contribute to air pollution control in China? Mechanismdiscussion and empirical test. Struct Chang Econ Dyn 56:207–224
Yang X, Zhang J, Ren S, Ran Q (2021b) Can the new energy demonstra-tion city policy reduce environmental pollution? Evidence from aquasi-natural experiment in China. J Clean Prod 287:125015
Yong W, Ying W (2019) Feasibility and optimal path for China toachieve the goal of dual control of carbon emission reduction—from the perspective of energy structure optimization. ChinaEnvironmental Science and Technology 39(10):4444–4455 (inChinese)
Yu S, Zheng S, Li X (2018) The achievement of the carbon emissionspeak in China: the role of energy consumption structure optimiza-tion. Energy Econ 74:693–707
Yu J, Li J, Zhang W (2019) Identification and classification of resource-based cities in China. J Geogr Sci 29(8):1300–1314
Yuan S, Musibau HO, Genç SY, Shaheen R, Ameen A, Tan Z (2021)Digitalization of economy is the key factor behind fourth industrialrevolution: how G7 countries are overcoming with the financingissues? Technol Forecast Soc Chang 165:120533
Zhang C, Lin Y (2012) Panel estimation for urbanization, energy con-sumption and CO2 emissions: a regional analysis in China. EnergyPolicy 49:488–498
Wu W, Zhang T, Xie X, Huang Z (2021) Regional low carbon develop-ment pathways for the Yangtze River Delta region in China. EnergyPolicy 151:112172
Allam Z, Jones DS (2021) Future (post-COVID) digital, smart and sus-tainable cities in the wake of 6G: Digital twins, immersive realitiesand new urban economies. Land Use Policy, 101(101):105201
Publisher’s note Springer Nature remains neutral with regard to jurisdic-tional claims in published maps and institutional affiliations.
64629Environ Sci Pollut Res (2021) 28:64606–64629