Embed Size (px)
Citation preview
Energy Subsidy Policy and Fossil Fuel Reform
Koh Samui, 18 March 2013
Fiscal Policy Agency - Ministry of Finance
1
12,8 33,3 52,3 43,5 52,8 39,8 39,9 42,530,433,1
83,949,5 57,6 90,4 94,6 80,964,2
83,8
139,1
45,082,4
165,2211,9
193,8
107,4150,2
275,3
138,1
192,7
295,4
346,4317,2
16,1
19,8
27,9
14,7
18,5
22,823,4
18,8
0,0
5,0
10,0
15,0
20,0
25,0
30,0
0,0
100,0
200,0
300,0
400,0
500,0
600,0
2006 2007 2008 2009 2010 2011 2012Real
2013APBN
Trilliun Rp
BBM Listrik Non energi % Subsidi thd Belanja Negara
2
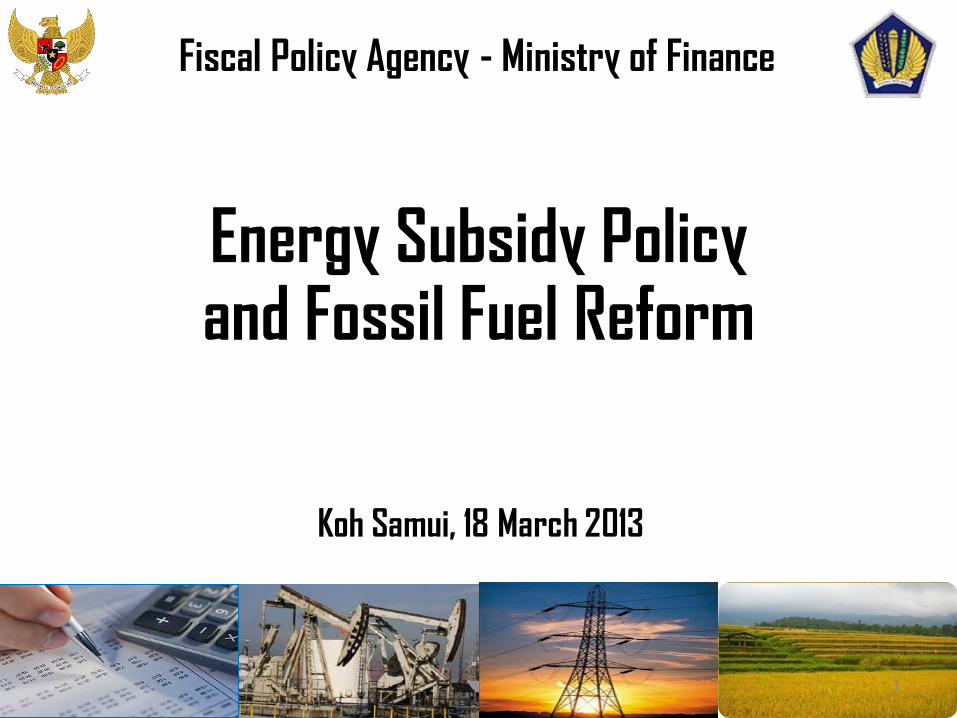
Fuel subsidy in Government Budget
20.9
14.5
18.7 9.8
27.5
0.3 5.5 2.8 15.0
8.1
9.1
18.1
33.4
- 6.9
9.4
2005
Belpeg
Bel barang
Bel Modal
Bunga Utang
Subsidi
2013
Personal Exp
Goods Exp
Capital Exp Debt Interest Subsidy Exp
Subsidy portion is still dominant reducing Govt discretion to expand the support for insfrastructure and other strategic programs.
% subsidy to Govt Exp Non Energy Electricity Fuel
Realization Budget
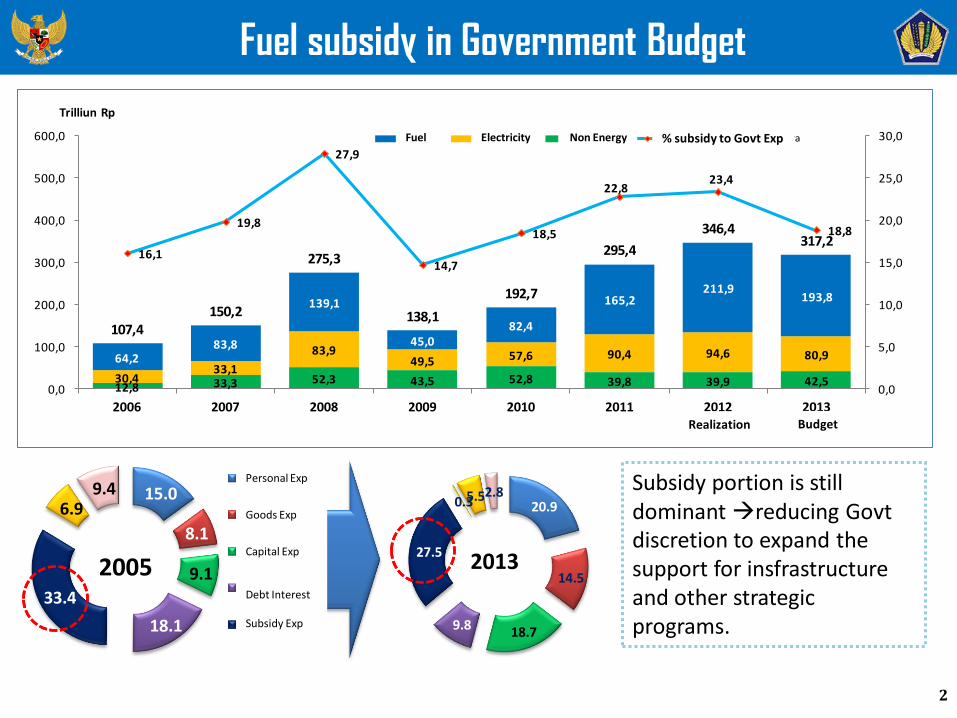
Oil price has a strong effect on fuel subsidy.
Fuel subsidy in 2013 is expected to be around Rp193.8 trillion. However, taking into account the current development of the ICP, fuel subsidy in 2013 will be higher than initially expected.
3
Fuel Prices Impact on Subsidies
45.0 65.0 94.6 80.9
123.6 137.4
211.9 193.8
90.0 105.0
112.7
100.0
0
30
60
90
120
0
100
200
300
400
Budget Revised Budget Realization Budget
2012 2013
USD/barel Rp Trillion Fuel Subsidy Electricity Subsidy Oil Price (ICP)
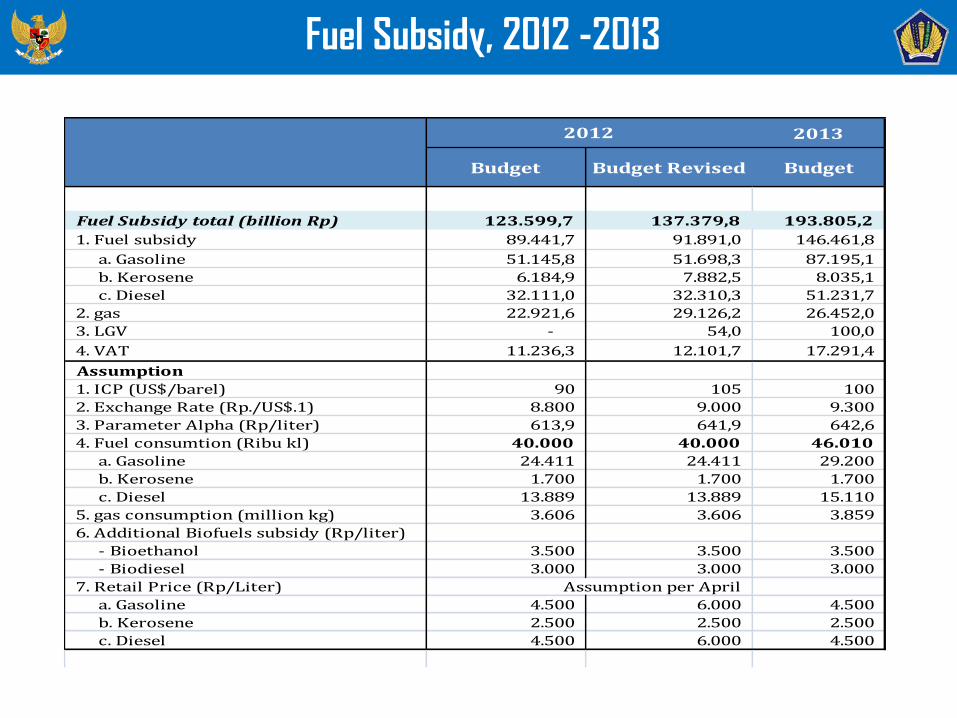
Fuel Subsidy, 2012 -2013
2013
Budget Budget Revised Budget
Fuel Subsidy total (billion Rp) 123.599,7 137.379,8 193.805,2
1. Fuel subsidy 89.441,7 91.891,0 146.461,8
a. Gasoline 51.145,8 51.698,3 87.195,1
b. Kerosene 6.184,9 7.882,5 8.035,1
c. Diesel 32.111,0 32.310,3 51.231,7
2. gas 22.921,6 29.126,2 26.452,0
3. LGV - 54,0 100,0
4. VAT 11.236,3 12.101,7 17.291,4
Assumption
1. ICP (US$/barel) 90 105 100
2. Exchange Rate (Rp./US$.1) 8.800 9.000 9.300
3. Parameter Alpha (Rp/liter) 613,9 641,9 642,6
4. Fuel consumtion (Ribu kl) 40.000 40.000 46.010
a. Gasoline 24.411 24.411 29.200
b. Kerosene 1.700 1.700 1.700
c. Diesel 13.889 13.889 15.110
5. gas consumption (million kg) 3.606 3.606 3.859
6. Additional Biofuels subsidy (Rp/liter)
- Bioethanol 3.500 3.500 3.500
- Biodiesel 3.000 3.000 3.000
7. Retail Price (Rp/Liter) Assumption per April
a. Gasoline 4.500 6.000 4.500
b. Kerosene 2.500 2.500 2.500
c. Diesel 4.500 6.000 4.500
2012
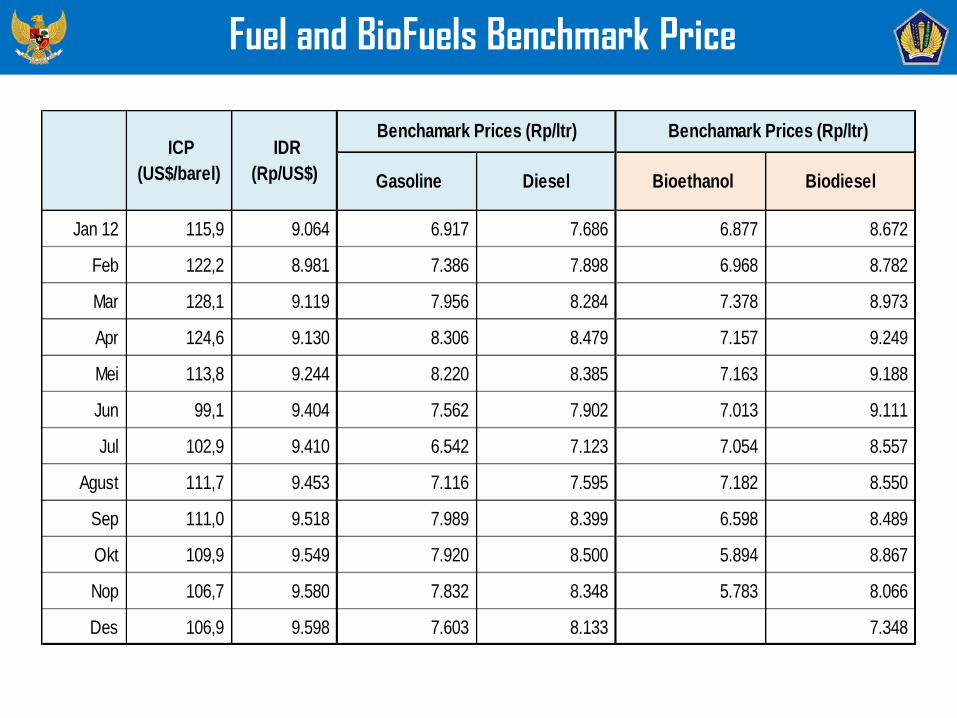
Fuel and BioFuels Benchmark Price
Gasoline Diesel Bioethanol Biodiesel
Jan 12 115,9 9.064 6.917 7.686 6.877 8.672
Feb 122,2 8.981 7.386 7.898 6.968 8.782
Mar 128,1 9.119 7.956 8.284 7.378 8.973
Apr 124,6 9.130 8.306 8.479 7.157 9.249
Mei 113,8 9.244 8.220 8.385 7.163 9.188
Jun 99,1 9.404 7.562 7.902 7.013 9.111
Jul 102,9 9.410 6.542 7.123 7.054 8.557
Agust 111,7 9.453 7.116 7.595 7.182 8.550
Sep 111,0 9.518 7.989 8.399 6.598 8.489
Okt 109,9 9.549 7.920 8.500 5.894 8.867
Nop 106,7 9.580 7.832 8.348 5.783 8.066
Des 106,9 9.598 7.603 8.133 7.348
ICP
(US$/barel)
IDR
(Rp/US$)
Benchamark Prices (Rp/ltr) Benchamark Prices (Rp/ltr)
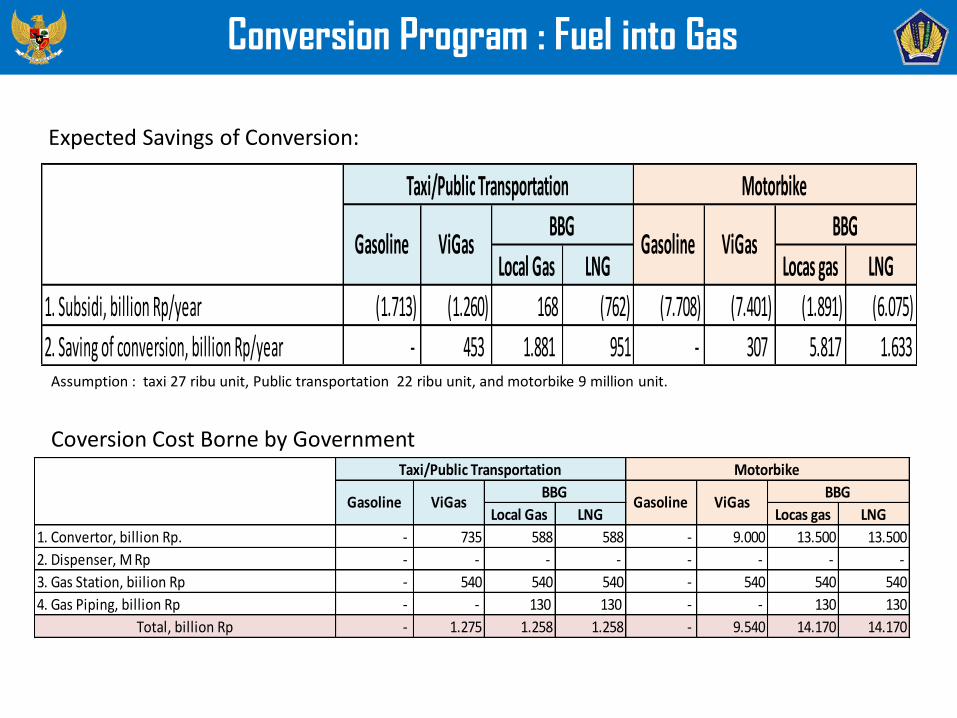
Conversion Program : Fuel into Gas
Local Gas LNG Locas gas LNG
1. Subsidi, billion Rp/year (1.713) (1.260) 168 (762) (7.708) (7.401) (1.891) (6.075)
2. Saving of conversion, billion Rp/year - 453 1.881 951 - 307 5.817 1.633
Taxi/Public Transportation
Gasoline ViGas BBG
Motorbike
Gasoline ViGasBBG
Expected Savings of Conversion:
Assumption : taxi 27 ribu unit, Public transportation 22 ribu unit, and motorbike 9 million unit.
Local Gas LNG Locas gas LNG
1. Convertor, billion Rp. - 735 588 588 - 9.000 13.500 13.500
2. Dispenser, M Rp - - - - - - - -
3. Gas Station, biilion Rp - 540 540 540 - 540 540 540
4. Gas Piping, billion Rp - - 130 130 - - 130 130
Total, billion Rp - 1.275 1.258 1.258 - 9.540 14.170 14.170
BBGViGas ViGas
Taxi/Public Transportation Motorbike
Gasoline GasolineBBG
Coversion Cost Borne by Government
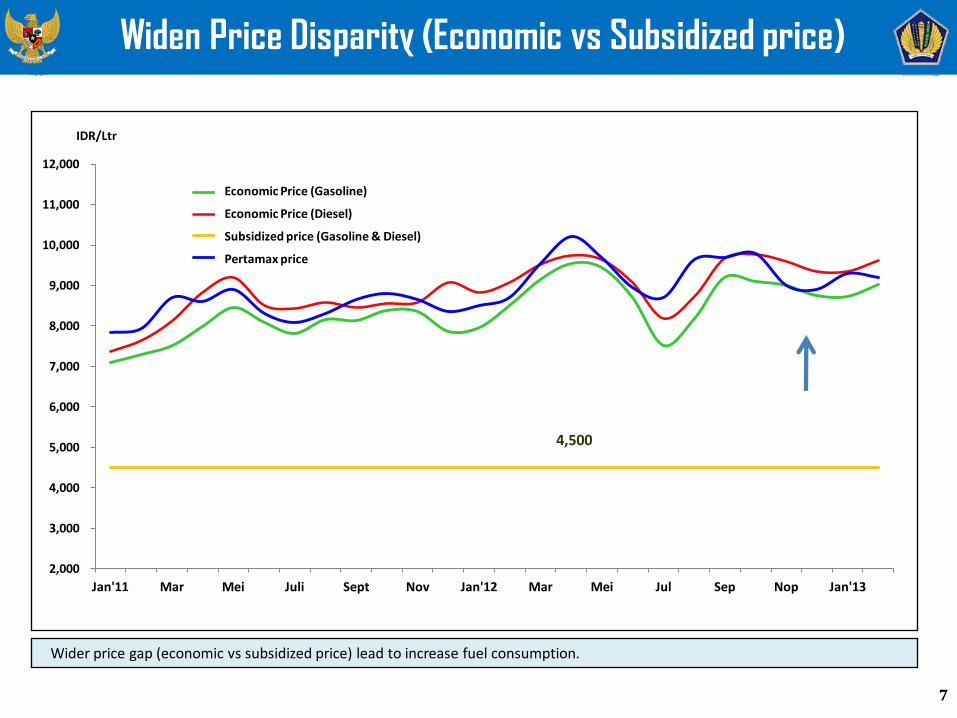
Widen Price Disparity (Economic vs Subsidized price)
7
Wider price gap (economic vs subsidized price) lead to increase fuel consumption.
4,500
2,000
3,000
4,000
5,000
6,000
7,000
8,000
9,000
10,000
11,000
12,000
Jan'11 Mar Mei Juli Sept Nov Jan'12 Mar Mei Jul Sep Nop Jan'13
IDR/Ltr
Premium Keekonomian
Solar Keekonomian
Premium dan Solar Bersubsidi
Pertamax
Economic Price (Gasoline)
Economic Price (Diesel)
Subsidized price (Gasoline & Diesel)
Pertamax price

Fuel Consumption
8
10,7 10,9 11,8 12,0 13,0 14,5 13,9 15,6 15,1
10,0 9,9 7,9 4,7 2,3 1,7 1,7 1,2 1,7
16,8 17,9 19,521,2 22,9
25,5 24,428,2 29,2
37,4 38,6 39,2 37,9 38,241,8
40,0
45,0 46,0
0,0
10,0
20,0
30,0
40,0
50,0
2006 2007 2008 2009 2010 2011 2012 APBN-P
Realisasi 2013APBN
Juta KLSolar Minyak Tanah Premium
Fuel consumption : gasoline for 3 years on average increased by 10% and diesel by 9%.
Diesel Gasoline Kerosene
Million KL
Budget Revised
Realization
Budget
-
3.000
6.000
9.000
12.000
15.000
18.000
21.000
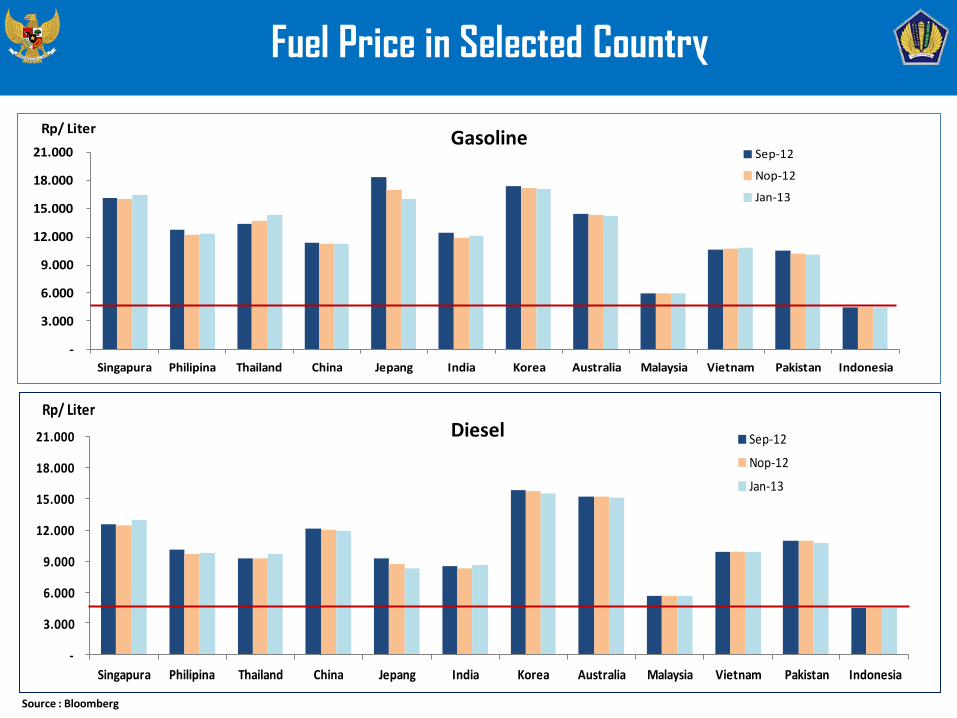
Singapura Philipina Thailand China Jepang India Korea Australia Malaysia Vietnam Pakistan Indonesia
PREMIUMRp/ Liter
Sep-12
Nop-12
Jan-13
Fuel Price in Selected Country
Source : Bloomberg
-
3.000
6.000
9.000
12.000
15.000
18.000
21.000
Singapura Philipina Thailand China Jepang India Korea Australia Malaysia Vietnam Pakistan Indonesia
SOLARRp/ Liter
Sep-12
Nop-12
Jan-13
Gasoline
Diesel
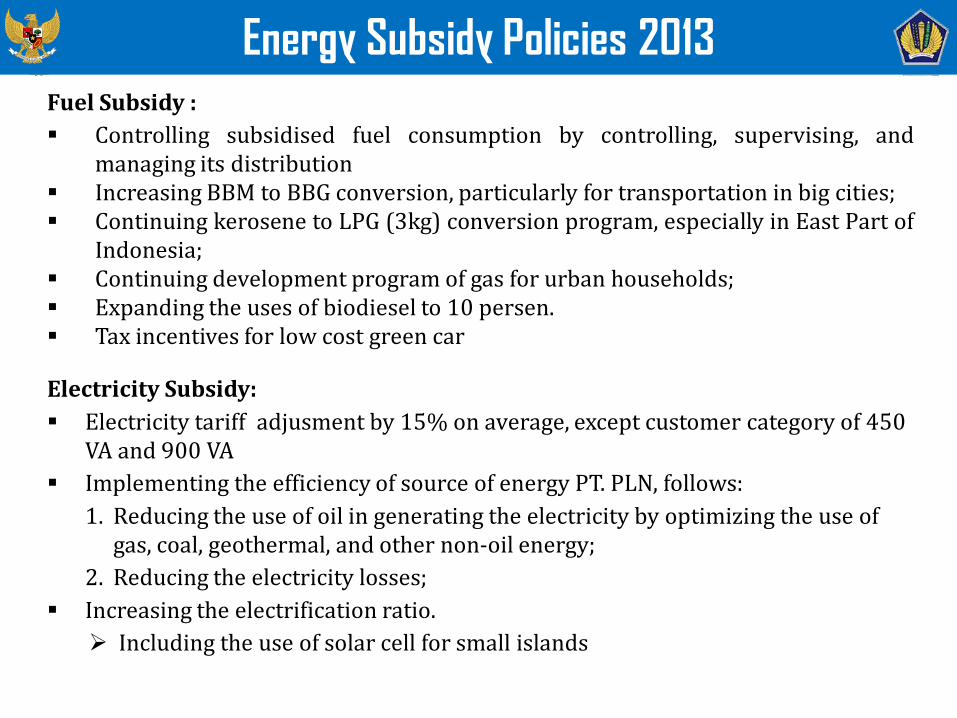
Energy Subsidy Policies 2013 Fuel Subsidy :
Controlling subsidised fuel consumption by controlling, supervising, and managing its distribution
Increasing BBM to BBG conversion, particularly for transportation in big cities; Continuing kerosene to LPG (3kg) conversion program, especially in East Part of
Indonesia; Continuing development program of gas for urban households; Expanding the uses of biodiesel to 10 persen. Tax incentives for low cost green car
Electricity Subsidy:
Electricity tariff adjusment by 15% on average, except customer category of 450 VA and 900 VA
Implementing the efficiency of source of energy PT. PLN, follows:
1. Reducing the use of oil in generating the electricity by optimizing the use of gas, coal, geothermal, and other non-oil energy;
2. Reducing the electricity losses;
Increasing the electrification ratio.
Including the use of solar cell for small islands
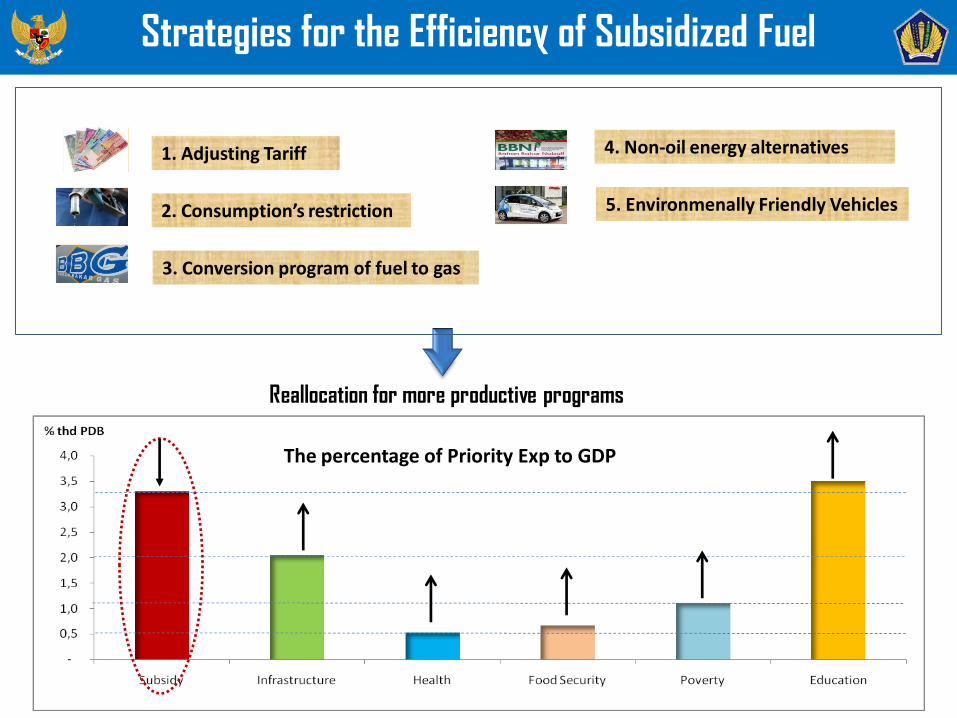
Strategies for the Efficiency of Subsidized Fuel
The percentage of Priority Exp to GDP
Reallocation for more productive programs
2. Consumption’s restriction
1. Adjusting Tariff
3. Conversion program of fuel to gas
4. Non-oil energy alternatives
5. Environmenally Friendly Vehicles 16

*) free converter kit for public transportation
Consumption’s
restriction
Diversification of
BBM to
BBG
Presidential Act No 64/2012
a. CNG for public transportation *)
b. Implementing the program gradually
Other institutional supports
a. Accelerating the mass transportation development
b. Developing the non-oil vehicles (e.g. hybrid and electricity
vehicles)
DEMAND SIDE
MANAGEMENT
S
T
E
P
S
The Gov’t of Indonesia has implemented the consumption’s restriction of
fuel subsidized …..
Presidential Act No 15/2012
The change of the criteria of subsidized fuel consumer.
Permen 01/2013
Gradually limit the use of fuel by government institution (central
and local government and state owned enterprise), mining sector,
plantation, foresty, non-pioneer cargo shipping
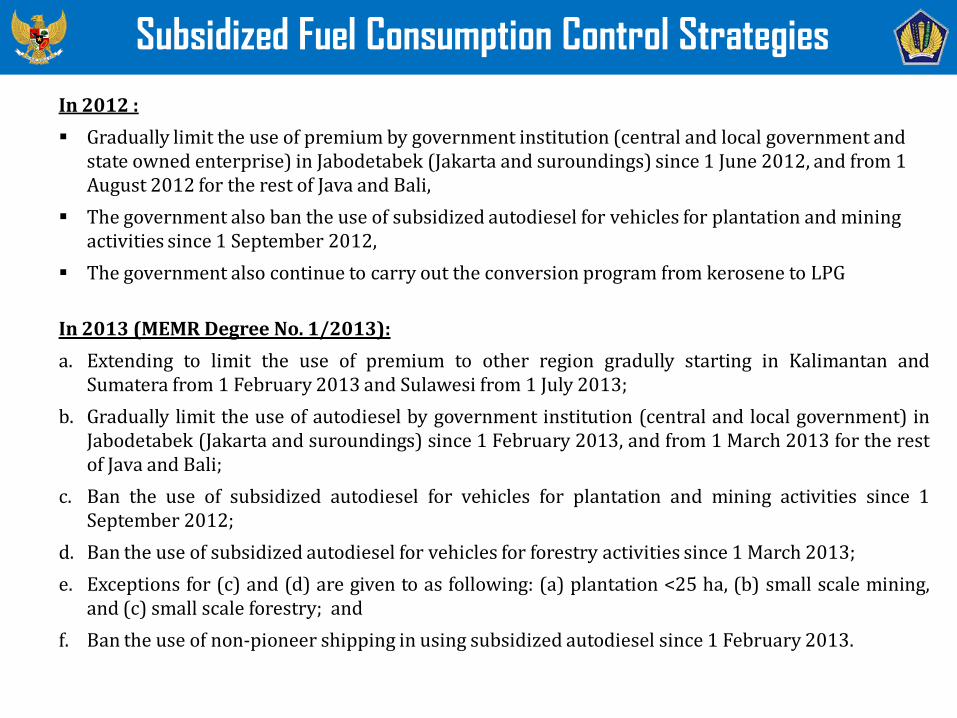
Subsidized Fuel Consumption Control Strategies
In 2012 :
Gradually limit the use of premium by government institution (central and local government and state owned enterprise) in Jabodetabek (Jakarta and suroundings) since 1 June 2012, and from 1 August 2012 for the rest of Java and Bali,
The government also ban the use of subsidized autodiesel for vehicles for plantation and mining activities since 1 September 2012,
The government also continue to carry out the conversion program from kerosene to LPG
In 2013 (MEMR Degree No. 1/2013):
a. Extending to limit the use of premium to other region gradully starting in Kalimantan and Sumatera from 1 February 2013 and Sulawesi from 1 July 2013;
b. Gradually limit the use of autodiesel by government institution (central and local government) in Jabodetabek (Jakarta and suroundings) since 1 February 2013, and from 1 March 2013 for the rest of Java and Bali;
c. Ban the use of subsidized autodiesel for vehicles for plantation and mining activities since 1 September 2012;
d. Ban the use of subsidized autodiesel for vehicles for forestry activities since 1 March 2013;
e. Exceptions for (c) and (d) are given to as following: (a) plantation <25 ha, (b) small scale mining, and (c) small scale forestry; and
f. Ban the use of non-pioneer shipping in using subsidized autodiesel since 1 February 2013.
Electricity Subsidy
14
15
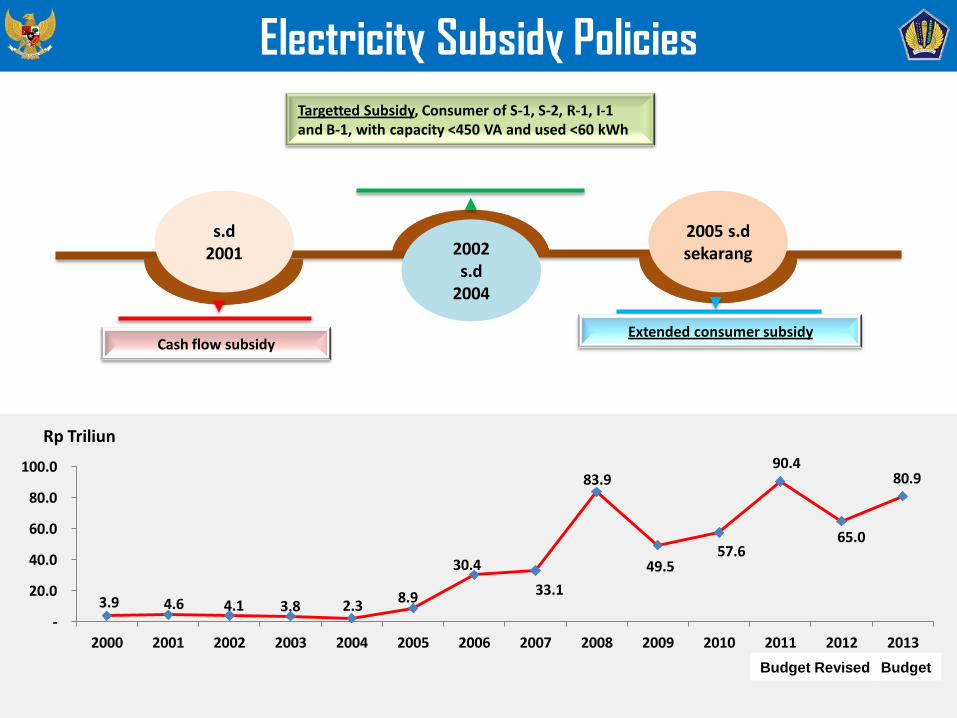
Cash flow subsidy
2005
Targetted Subsidy, Consumer of S-1, S-2, R-1, I-1 and B-1, with capacity <450 VA and used <60 kWh
Extended consumer subsidy
2005 s.d sekarang 2002
s.d 2004
s.d 2001
3.9 4.6 4.1 3.8 2.3 8.9
30.4
33.1
83.9
49.5 57.6
90.4
65.0
80.9
-
20.0
40.0
60.0
80.0
100.0
2000 2001 2002 2003 2004 2005 2006 2007 2008 2009 2010 2011 2012 APBN-P
2013 APBN
Rp Triliun
Budget Revised
Electricity Subsidy Policies
Budget
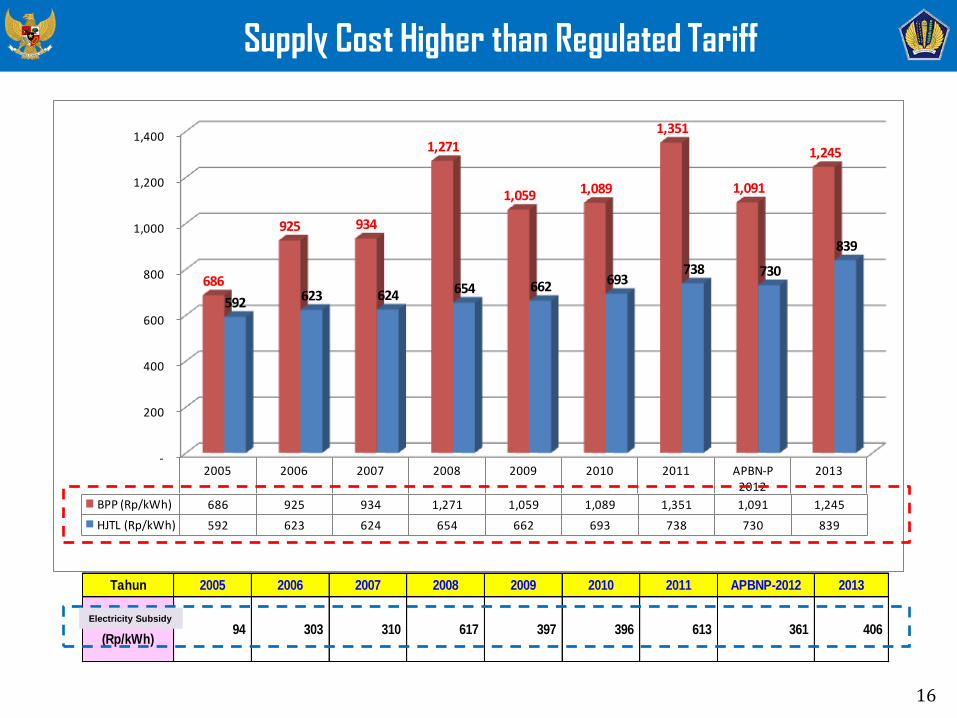
Supply Cost Higher than Regulated Tariff
-
200
400
600
800
1,000
1,200
1,400
2005 2006 2007 2008 2009 2010 2011 APBN-P 2012
2013
BPP (Rp/kWh) 686 925 934 1,271 1,059 1,089 1,351 1,091 1,245
HJTL (Rp/kWh) 592 623 624 654 662 693 738 730 839
686
925 934
1,271
1,059 1,089
1,351
1,091
1,245
592 623 624 654 662 693 738 730
839
Tahun 2005 2006 2007 2008 2009 2010 2011 APBNP-2012 2013
Subsidi Listrik
(Rp/kWh)94 303 310 617 397 396 613 361 406
16
Electricity Subsidy
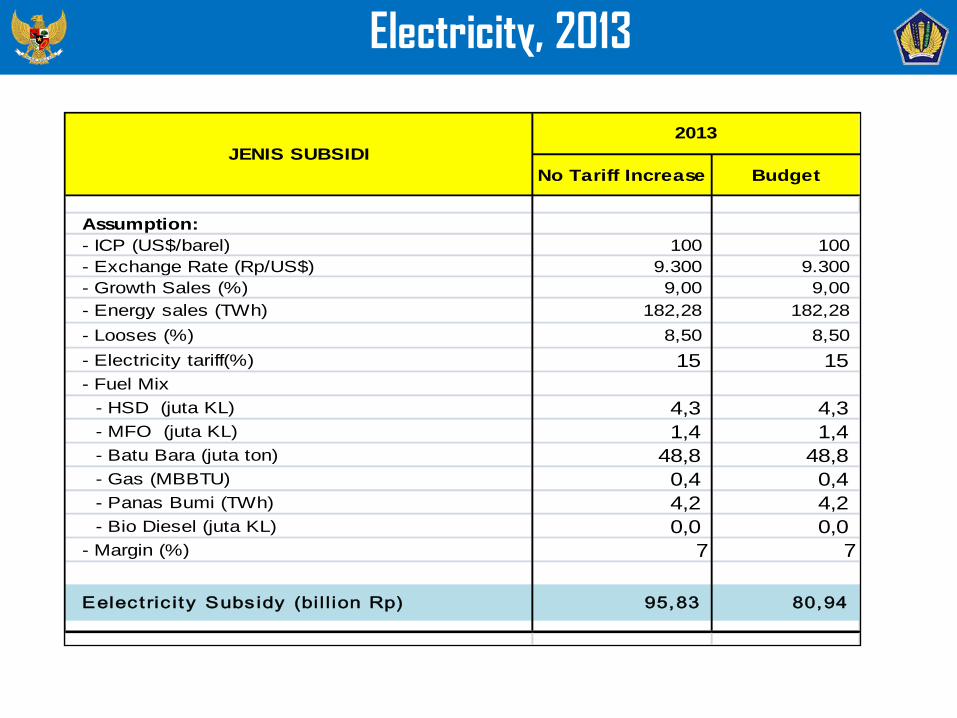
No Tariff Increase Budget
Assumption:
- ICP (US$/barel) 100 100
- Exchange Rate (Rp/US$) 9.300 9.300
- Growth Sales (%) 9,00 9,00
- Energy sales (TWh) 182,28 182,28
- Looses (%) 8,50 8,50
- Electricity tariff(%) 15 15
- Fuel Mix
- HSD (juta KL) 4,3 4,3
- MFO (juta KL) 1,4 1,4
- Batu Bara (juta ton) 48,8 48,8
- Gas (MBBTU) 0,4 0,4
- Panas Bumi (TWh) 4,2 4,2
- Bio Diesel (juta KL) 0,0 0,0
- Margin (%) 7 7
Eelectric ity Subs idy (bil l ion Rp) 95,83 80,94
JENIS SUBSIDI
2013
Electricity, 2013
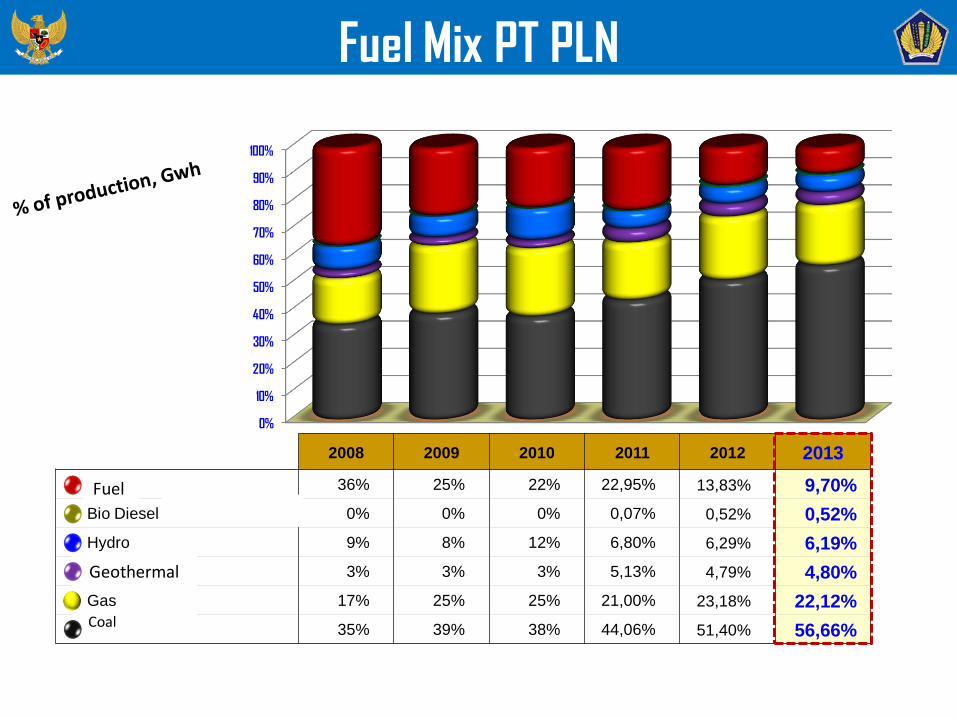
2008 2009 2010 2011 2012 2013
BBM 36% 25% 22% 22,95% 13,83% 9,70%
Bio Diesel & EBT Lainnya 0% 0% 0% 0,07% 0,52% 0,52%
Hydro 9% 8% 12% 6,80% 6,29% 6,19%
Panas Bumi 3% 3% 3% 5,13% 4,79% 4,80%
Gas 17% 25% 25% 21,00% 23,18% 22,12%
Batubara 35% 39% 38% 44,06% 51,40% 56,66%
Fuel Mix PT PLN
0%
10%
20%
30%
40%
50%
60%
70%
80%
90%
100%
Geothermal
Coal
Geothermal Fuel
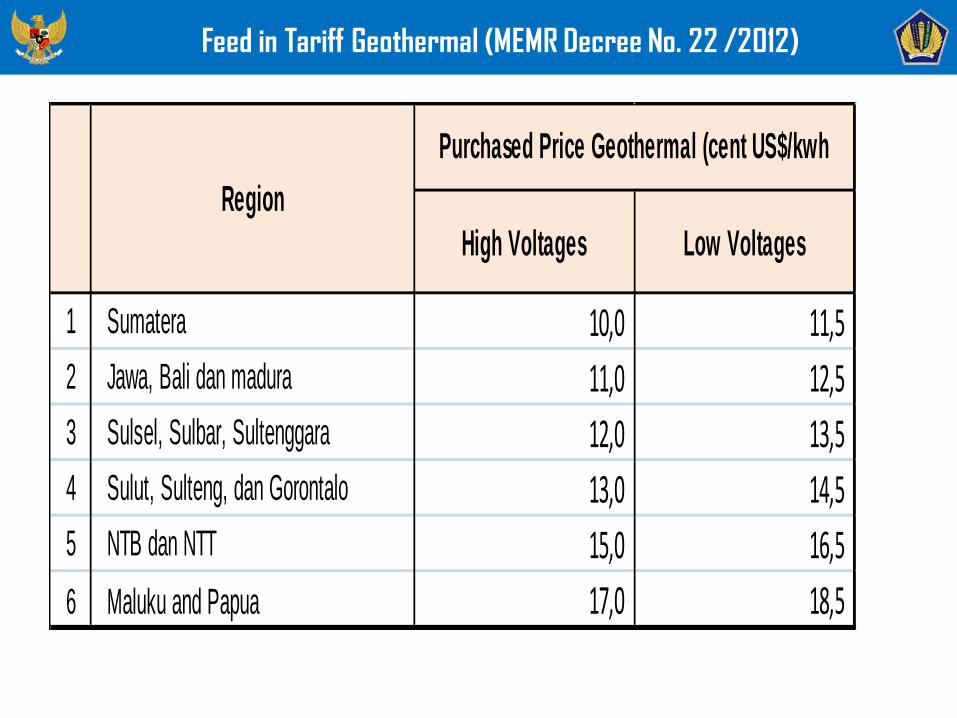
Feed in Tariff Geothermal (MEMR Decree No. 22 /2012)
High Voltages Low Voltages
1 Sumatera 10,0 11,5
2 Jawa, Bali dan madura 11,0 12,5
3 Sulsel, Sulbar, Sultenggara 12,0 13,5
4 Sulut, Sulteng, dan Gorontalo 13,0 14,5
5 NTB dan NTT 15,0 16,5
6 Maluku and Papua 17,0 18,5
Region
Purchased Price Geothermal (cent US$/kwh
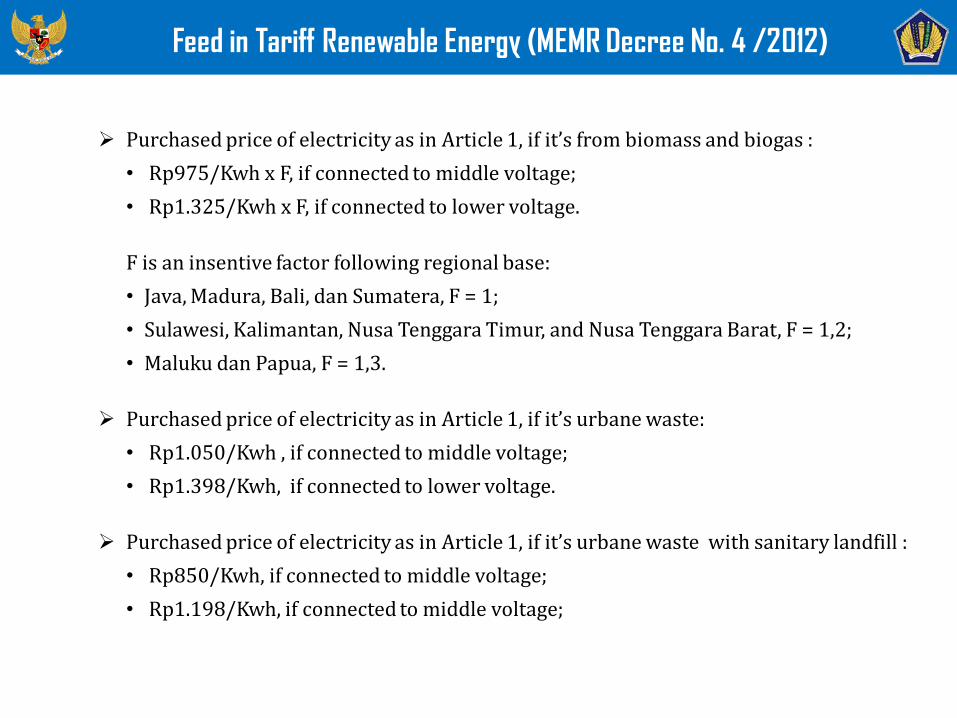
Feed in Tariff Renewable Energy (MEMR Decree No. 4 /2012)
Purchased price of electricity as in Article 1, if it’s from biomass and biogas :
• Rp975/Kwh x F, if connected to middle voltage;
• Rp1.325/Kwh x F, if connected to lower voltage.
F is an insentive factor following regional base:
• Java, Madura, Bali, dan Sumatera, F = 1;
• Sulawesi, Kalimantan, Nusa Tenggara Timur, and Nusa Tenggara Barat, F = 1,2;
• Maluku dan Papua, F = 1,3.
Purchased price of electricity as in Article 1, if it’s urbane waste:
• Rp1.050/Kwh , if connected to middle voltage;
• Rp1.398/Kwh, if connected to lower voltage.
Purchased price of electricity as in Article 1, if it’s urbane waste with sanitary landfill :
• Rp850/Kwh, if connected to middle voltage;
• Rp1.198/Kwh, if connected to middle voltage;

Thank you
21