Embed Size (px)
Citation preview
Energy Supply Sector Fossil Fuel Power Plant
Indonesia 2050 Pathway Calculator

1
Table of Contents
I. Overview of Fossil Fuel Power Plant ............................................................................................. 3
II. Fixed Assumption .......................................................................................................................... 4
2.1 Capacity Factor...................................................................................................................... 4
2.2 Own Use and Energy Losses .................................................................................................. 5
2.3 Thermal Efficiency ................................................................................................................. 6
2.5 Retirement Schedule For Existing Power Plant ..................................................................... 7
2.6 Base Year Data ...................................................................................................................... 7
III. Methodology ................................................................................................................................. 7
3.1 Installed Capacity .................................................................................................................. 7
3.2 Available Supply .................................................................................................................... 8
3.3 Available Generation ............................................................................................................. 8
3.4 Actual Generation ................................................................................................................. 8
3.5 Total Energy Need ................................................................................................................. 9
IV. Trajectory assumption .................................................................................................................. 9
4.1 Combined Cycle Power Plant (PLTGU) .................................................................................. 9
4.2 Gas fired Power Plant (PLTG) .............................................................................................. 14
4.3 Diesel Power Plant (PLTD) ................................................................................................... 18
4.4 Coal Combustion Technology .............................................................................................. 20
V. References .................................................................................................................................. 22

2
List of Tables
Table 1. Energy Production and Installed Capacity of Power Plants ..................................................... 5
Table 2. Capacity Factor of Power Plants .............................................................................................. 5
Table 3. Assumed Own use and Losses ................................................................................................. 5
Table 4. Own use Percentage................................................................................................................ 5
Table 5. Comparison Power Plants Efficiency ....................................................................................... 6
Table 6. Fossil fuel Power Plants Thermal Efficiency ............................................................................. 6
Table 7. Proportion of Plant Capacity by Fuel Type .............................................................................. 6
Table 8. Asummed Retirement of Fossil Fuel Power Plant.................................................................... 7
Table 9. Plant Capacity, Electricity Production and Fuel Consumption 2011 ........................................ 7
Table 10. Installed Capacity of steam power plant (GW) ...................................................................... 8
Table 11. Projected Gas Supply and Natural Gas Pipeline for Muara Karang, Muara Tawar and Grati
Combined Cycle Power Plant .............................................................................................................. 10
Tabel 12. Plan of Gas Pipeline in east Indonesia ................................................................................. 11
Tabel 13, Projected Gas Supply for PLTG in East Indonesia Region .................................................... 16
List of Figures
Figure 1. Installed Capacity of Fossil fuel Power Plant in 2011 ............................................................. 3
Figure 2. Installed Capacity of Fossil fuel Power Plant in 2001-2011 .................................................... 3
Figure 3. Projected Fossil Fuel Power Plant Capacity 2014 - 2022 ........................................................ 4
Figure 4. Levels of Installed Capacity of PLTGU 2011 to 2050 ............................................................. 13
Figure 5. Installed Capacity of Combined Cycle Power Plant in 2050 (GW) ........................................ 14
Figure 6. The leves of Installed Capacity of gas fired power plant 2011 - 2050 .................................. 17
Figure 7. Installed Capacity of gas fired power plant in 2050 (GW) .................................................... 18
Figure 8. Leveling of Installed Capacity of PLTD 2011 to 2050 ............................................................ 19
Figure 9. Installed Capacity of PLTD in 2050 ....................................................................................... 20
Figure 10. The Levels of Coal Combustion Technology ....................................................................... 21

3
I. Overview of Fossil Fuel Power Plant Fossil fuel power plant capacity in 2011 was dominated by steam power plant with the installed
capacity of 16.32 GW (Figure 1). Of the total 34.51 GW installed capacity in 2011, most of the fossil-
fueled plants are installed in Java. Only diesel power plant (Pembangkit Listrik Tenaga Diesel, PLTD)
that has greater capacity outside Java.
Figure 1. Installed Capacity of Fossil fuel Power Plant in 2011
(Source: Handbook of Energy & Economics, 2013)
Historically, the total fossil-fuel power plant capacity increased from 19.78 GW in 2001 to 34.51 GW
in 2011. In general, the increase was driven by a significant increase of steam power plant
(Pembangkit Listrik Tenaga Uap, PLTU) capacity compared to the other plants (Figure 2).
Figure 2. Installed Capacity of Fossil fuel Power Plant in 2001-2011
(Source: Handbook of Energy & Economics, 2013) Based on the projected generation capacity listed in the Electricity Supply Business Plan (Rencana
Usaha Penyediaan Tenaga Listrik, RUPTL) for the year 2013-2022, the capacity of steam and gas fired
power plant (Pembangkit Listrik Tenaga Gas, PLTG) will continue to increase until 2022. The
combined cycle power plant (Pembangkit Listrik Tenaga Gas Uap, PLTGU) will increase until 2018
PLTU, 16.32
PLTG, 4.24
PLTGU, 8.48
PLTD, 5.47
2001 2002 2003 2004 2005 2006 2007 2008 2009 2010 2011 PLTU 7.80 6.90 9.75 9.75 9.75 11.17 12.01 12.29 12.59 12.98 16.32 PLTG 1.97 1.22 1.69 2.80 3.19 3.10 3.22 3.07 3.14 3.82 4.24 PLTGU 7.00 6.86 7.00 6.85 6.57 7.66 7.70 8.01 8.01 7.59 8.48 PLTD 3.02 2.59 2.73 2.99 3.04 3.17 3.21 3.27 3.26 4.57 5.47
0 2 4 6 8
10 12 14 16 18
GW

4
and will remain steady until 2022. The document projects that there will not be any diesel power
plant addition until 2022 (Figure 3).
Figure 3. Projected Fossil Fuel Power Plant Capacity 2014 - 2022 (Source: Adapted from RUPTL PLN, 2013-2022)
*) Capacity in 2014 was obtained by adding the data from 2013 (until September) with projected additional capacity in 2014
In the Indonesia 2050 Pathway Calculator, steam power plant capacity is not included in the leveling
scenarios (level 1-4); there is only projected figures of the base year (2011) until 2050. In addition,
the entire electricity needs will be met by domestic supply and the shortage will be supplied by
steam power plant.
II. Fixed Assumption
2.1 Capacity Factor
In the Indonesia 2050 Pathway Calculator, capacity factor varies depending on the type of generator.
It is determined based on the following equation sourced from the PLN (State Electricity Company)
Statistics. The data assumptions used in the National Energy Policy (Kebijakan Energi Nasional, KEN)
is also referred to. The PLN statistic equation is shown below:
∑kWh gross production per year∑ kW installed capacity x 8760 x 100%
In determining the capacity factor of each plant, the data used is the data of energy production and
installed capacity in 2011 from PLN Statistics 2011. The data is presented in Table 1 below.
2014 2015 2016 2017 2018 2019 2020 2021 2022 PLTU 22.99 24.54 27.43 29.44 36.78 43.71 49.35 52.29 55.57 PLTG 4.18 4.82 6.20 6.47 6.60 6.76 6.82 6.95 7.07 PLTGU 8.96 9.29 10.49 11.44 13.79 13.79 13.79 13.79 13.79 PLTD 2.67 2.67 2.67 2.67 2.67 2.67 2.67 2.67 2.67
0.00
10.00
20.00
30.00
40.00
50.00
60.00
GW
5
Table 1. Energy Production and Installed Capacity of Power Plants PLTG PLTGU PLTD Energy Production (GWh) 8246,22 40409,68 4010,94 Installed Capacity (GW) 2,84 7,83 2,57
Source: PLN Statistics, 2011
Based on the above equation, the capacity factor for each plant can be seen in Table 2.
Table 2. Capacity Factor of Power Plants
No Power Plant Type 2011 2050 Liquid Gaseous Liquid Gaseous
1 Coal power plant* 62 % 91 % 1 Combined cycle power
plant** 58,88 % 58,88 % 58,88 % 58,88 %
2 Gas fired power plant**
33,15 % 33,15 % 33,15 % 33,15 %
3 Diesel power plant* 30 % 50 % *) Based on KEN data assumption **) Calculated using PLN Statistics equation
2.2 Own Use and Energy Losses
Own use parameter in Indonesia 2050 Pathway Calculator includes the own use for central system,
substations and distribution systems as well as energy losses in transmission and distribution. The
assumed percentage for own use is obtained from PLN Statistics 2011 as shown in Table 3.
Table 3. Assumed Own use and Losses
Year Own use
(%) Energy Losses (%) Total
(%) Transmission Distribution 2011 4,32 2,25 7,34 9,54
Source: PLN Statistics, 2011
Percentage of own use at 9.54% is rounded up to 10%, and it is assumed to be valid for the entire
conventional thermal plants (Table 4).
Table 4. Own use Percentage
No Power Plant Type Liquid Gaseous 1 Coal power plant 10 % 2 Combined cycle power
plant 10 % 10 %
3 Gas fired power plant 10 % 10 % 4 Diesel power plant 10 %

6
2.3 Thermal Efficiency
Thermal efficiency of fossil fuel power plant is based on journal by Cahyadi (2011) shown in Table 5.
Table 5. Comparison Power Plants Efficiency
Power Plant Type Capacity (MW) Thermal Efficiency (%) Coal fired Steam Power Plant (Ultra/Supercritical)
400 – 600 40 – 45
Coal fired Steam Power Plant (Subcritical)
200 – 800 30 – 40
Gas fired power plant 50 – 100 22 – 28 Combined Cycle Power Plant 300 – 600 36 – 50 Diesel power plant 1 - 30 27 - 30
Source: Nag. PK, 2002 and Burr, 1999 in Cahyadi, 2011
Based on Table 5, the assumptions of thermal efficiency used in Indonesia 2050 Pathway Calculator
are presented in Table 6.
Table 6. Fossil fuel Power Plants Thermal Efficiency
No Power Plant Type 2011 2050 Liquid Gaseous Liquid Gaseous
1 Coal fired Steam Power Plant (Ultra/Supercritical)
40 % 40 %
2 Coal fired Steam Power Plant (Subcritical) 30 % 30 % 3 Coal fired Steam Power Plant (Advance Ultra
Super critical) 45 % 45 %
4 Gas fired power plant 36 % 36 % 36 % 36 % 5 Combined Cycle Power Plant 28 % 28 % 28 % 28 % 6 Diesel power plant* 25 % 30 %
*) Based on KEN assumption
2.4 Proportion of Plant Capacity by Fuel Type
The proportion of capacity by type of fuel goes for gas and combined cycle power plants. The fuels
mix in the base year (2011) and 2050 refer to the assumptions of KEN. It shows that in 2050, both
gas and combined cycle power plants use 100% gas as fuel. The data between 2011 and 2050 are
obtained by extrapolation as shown in Table 7.
Table 7. Proportion of Plant Capacity by Fuel Type
Power plant type
Fuel 2011 2015 2020 2025 2030 2035 2040 2045 2050
PLTGU Liquid 35.20% 31.56% 27.05% 22.54% 18.02% 13.51% 9.00% 4.48% 0.00% Gaseous 64.80% 68.44% 72.95% 77.46% 81.98% 86.49% 91.00% 95.52% 100%
PLTG Liquid 42.85% 38.56% 33.05% 27.54% 22.02% 16.51% 11.00% 5.48% 0.00%
Gaseous 57.15% 61.44% 66.95% 72.46% 77.98% 83.49% 89.00% 94.52% 100%

7
2.5 Retirement Schedule For Existing Power Plant
Asassumptions of retirement of each fossil fuel power plant are shown in Table 8. For combined
cycle, gas and diesel power plants, the retirement occurs once every 5 years for 0.0001 GW capacity
(combined cycle and gas fired power plant) and 0.00007 GW (diesel power plant).
Table 8. Asummed Retirement of Fossil Fuel Power Plant
No Power Plant Type Retirement (GW) 1 Steam power plant (Subcritical) in 2020
& 2035 0,25
2 Combined cycle power plant 0,0001 3 Gas fired power plant 0,0001 4 Diesel power plant 0,00007
2.6 Base Year Data
Base year data including plant capacity, electricity production and fuel consumption is presented in
Table 9. Plant capacity in 2011 is taken from the Handbook of Energy & Economics 2013. While the
electricity production and fuel consumption data are obtained from the Electricity Statistics 2011.
Table 9. Plant Capacity, Electricity Production and Fuel Consumption 2011
No Power
Plant Type Capacity (GW)*
Electricity Production (GWh)**
Fuel Consumption **
Liquid Gas Liquid (kilo liter) Gas (mmscf) 1 Combined
cycle power plant
8,48 13159.71 26889.96 3296931.98 219227.65
2 Gas fired power plant
4,24 7658.38 2359.33 2139185.07 56057.13
3 Diesel power plant
5,47 16125.11 4243562.39
*) Source: Handbook of Energy & Economics of Indonesia, 2013 **) Source: Electricity Statistics, 2011
III. Methodology
3.1 Installed Capacity

8
In the Indonesian 2050 Pathway Calculator modeling, the installed capacity of steam power plant is
not included in the leveling scenario, steam power plant serves as a supplier of electricity needs in
the event of electricity shortage. There is only one fixed scenario for projected installed capacity of
steam power plant based on data from RUPTL PLN 2013-2022. Given the data on the installed
capacity of RUPTL PLN only until 2022, the projected capacities from 2025 to 2050 are assumed to
remain unchanged at 57.68 GW (Table 10).
Table 10. Installed Capacity of steam power plant (GW)
2011 2015 2020 2025 2030 2035 2040 2045 2050 Installed Capacity of steam power plant
16.32 26.65 51.47 57.68 57.68 57.68 57.68 57.68 57.68
Projected installed capacity of combined cycle power plant and gas fired power plant until 2050 is
built according to data of KEN, RUPTL PLN, and draft of National General Energy Plan (Rencana
Umum Energi , RUEN).
In general, the equation for calculation of power plant’s installed capacity is described as follows:
𝑇𝑜𝑡𝑎𝑙 𝑖𝑛𝑠𝑡𝑎𝑙𝑙𝑒𝑑 𝑐𝑎𝑝𝑎𝑐𝑖𝑡𝑦= 𝑖𝑛𝑠𝑡𝑎𝑙𝑙𝑒𝑑 𝑐𝑎𝑝𝑎𝑐𝑖𝑡𝑦 𝑜𝑓 𝑝𝑟𝑒𝑣𝑖𝑜𝑢𝑠 𝑦𝑒𝑎𝑟+ 𝑎𝑑𝑑𝑖𝑡𝑖𝑜𝑛𝑎𝑙 𝑖𝑛𝑠𝑡𝑎𝑙𝑙𝑒𝑑 𝑐𝑎𝑝𝑎𝑐𝑖𝑡𝑦 𝑖𝑛 𝑡ℎ𝑒 𝑐𝑢𝑟𝑟𝑒𝑛𝑡 𝑦𝑒𝑎𝑟 − 𝑅𝑒𝑡𝑖𝑟𝑒𝑚𝑒𝑛𝑡
The following equation is used to find out the total installed capacity for each fuel type.
𝐼𝑛𝑠𝑡𝑎𝑙𝑙𝑒𝑑 𝑐𝑎𝑝𝑎𝑐𝑖𝑡𝑦 𝑓𝑜𝑟 𝑒𝑎𝑐ℎ 𝑓𝑢𝑒𝑙 𝑡𝑦𝑝𝑒 = 𝑇𝑜𝑡𝑎𝑙 𝑖𝑛𝑠𝑡𝑎𝑙𝑙𝑒𝑑 𝑐𝑎𝑝𝑎𝑐𝑖𝑡𝑦 𝑥 𝐹𝑢𝑒𝑙 𝑚𝑖𝑥 𝑓𝑜𝑟 𝑒𝑎𝑐ℎ 𝑓𝑢𝑒𝑙 𝑡𝑦𝑝𝑒 3.2 Available Supply
Available supply is defined as available capacity of power plants. The figure is obtained by
multiplying the installed capacity with the capacity factor.
𝐴𝑣𝑎𝑖𝑙𝑎𝑏𝑙𝑒 𝑠𝑢𝑝𝑝𝑙𝑦 = 𝑖𝑛𝑠𝑡𝑎𝑙𝑙𝑒𝑑 𝑐𝑎𝑝𝑎𝑐𝑖𝑡𝑦 𝑥 𝑐𝑎𝑝𝑎𝑐𝑖𝑡𝑦𝑓𝑎𝑐𝑡𝑜𝑟 3.3 Available Generation
Available generation is defined as energy produced in certain duration of time. Available generation
is obtained by multiplying the available supply with the operating hour per year.
𝐴𝑣𝑎𝑖𝑙𝑎𝑏𝑙𝑒 𝑔𝑒𝑛𝑒𝑟𝑎𝑡𝑖𝑜𝑛 = 𝐴𝑣𝑎𝑖𝑙𝑎𝑏𝑙𝑒 𝑠𝑢𝑝𝑝𝑙𝑦 𝑥 𝑜𝑝𝑒𝑟𝑎𝑡𝑖𝑛𝑔 𝑡𝑖𝑚𝑒 𝑝𝑒𝑟 𝑦𝑒𝑎𝑟
3.4 Actual Generation
Actual generation is defined as total electricity generated. In the Indonesian 2050 Pathway
Calculator, the actual generation is calculated using the following equation:

9
𝐴𝑐𝑡𝑢𝑎𝑙 𝐺𝑒𝑛𝑒𝑟𝑎𝑡𝑖𝑜𝑛 = 𝐴𝑣𝑎𝑖𝑙𝑎𝑏𝑙𝑒 𝐺𝑒𝑛𝑒𝑟𝑎𝑡𝑖𝑜𝑛 + Own Use
Meanwhile, own use and losses is formulated by the following equation:
𝑂𝑤𝑛 𝑢𝑠𝑒 = 𝐴𝑣𝑎𝑖𝑙𝑎𝑏𝑙𝑒 𝐺𝑒𝑛𝑒𝑟𝑎𝑡𝑖𝑜𝑛 𝑥 𝑜𝑤𝑛 𝑢𝑠𝑒 𝑝𝑒𝑟𝑐𝑒𝑛𝑡𝑎𝑔𝑒
3.5 Total Energy Need
Total energy need is defined as the amount of fuel needed to generate electricity. It is related to
thermal efficiency of each power plant.
𝑇𝑜𝑡𝑎𝑙 𝑒𝑛𝑒𝑟𝑔𝑖 𝑛𝑒𝑒𝑑 =𝐴𝑐𝑡𝑢𝑎𝑙 𝑔𝑒𝑛𝑒𝑟𝑎𝑡𝑖𝑜𝑛𝑇ℎ𝑒𝑟𝑚𝑎𝑙 𝐸𝑓𝑓𝑖𝑐𝑖𝑒𝑛𝑐𝑦
IV. Trajectory assumption
One pager for fossil fuel power plant include projected capacity for combined cycle power plant, gas
fired power plant, diesel power plant and technology for coal combustion.
4.1 Combined Cycle Power Plant (PLTGU)
Combined cycle power plant is an installation of equipment to convert thermal energy (from
combustion of fuel and air) into electricity. Basically, the combined cycle power plant is a
combination of gas fired power plant and steam power plant. In Indonesia, there are currently more
combined cycle power plants installed in Java (53 power plants). Total installed capacity of combined
cycle power plant in 2011 was 8.48 GW.
Level 1
Level 1 assumes that the capacity of combined cycle power plant remains the same from base year
(2011) until 2050 at 8.48 GW. This level assumes that the new combined cycle power plant
experience a shortage in natural gas. Beside the gas reserves depletion issue, the other issue is the
access to big gas reserves location, since the big gas reserves have been included in the long-term
contracts with foreign buyers.
The existing capacity of combined cycle power plant can be maintained until 2050. This is caused by
the gas supply that is assured for the main power plants in Java-Bali system, namely the combined
cycle power plant of Muara Karang and Priok, and also Tambak Lorok. Most gas supply for the
combined cycle power plant of Muara Karang and Priok is obtained from LNG FSRU West Java. Gas
for Tambak Lorok combined cycle power plant is supplied from Gundih and Kepodong field.
As for the system outside Java-Bali, the combined cycle power plant is assumed to operate in East
Kalimantan region, Northern Sumatera and Southern Sumatera. The combined cycle power plant in

10
East Kalimantan region is assumed to have gas supply from Salamander, Salamander Lapangan
Tutung, and JOB Simenggaris. While the gas supply for the combined cycle power plant in Northern
Sumatera and Southern Sumatera is assumed from FSRU LNG Tangguh.
Level 2
Level 2 assumes that the capacity of combined cycle power plant in 2050 will be 10.42 GW.
Additional capacity of combined cycle is assumed from the conversion of power plant and the
changes in the existing power plant’s unit size, such as Muara Karang combined cycle power plant
with additional capacity of 0.8 GW and Grati combined cycle power plant with additional capacity of
0.75 GW. Additional capacity of these power plants are possible since its is supported by the existing
97 km gas pipeline and the plan to add another 113 km of gas pipeline. Besides, the gas supply for
additional capacity of combined cycle power plant for this level is assumed from several fields
including Offshore North West Java (ONWJ), Cepu and Santos (Table 11).
Table 11. Projected Gas Supply and Natural Gas Pipeline for Muara Karang, Muara Tawar and Grati
Combined Cycle Power Plant
No Plant Gas Supplier/ Operator Route Region Diameter (inch)
Length (km)
1 Muara Karang
Offshore North West Java (ONWJ)/ PHE ONWJ *)
APN – MM Compressor Muara Karang Combined Cycle Power Plant
West Java 24 50
Re-gasification LNG from Mahakam Block/ PT Nusantara Ragas **)
Offshore pipe from to ORF Muara Karang pipe
24 15
3 Grati Santos – Oyong/ Santos (Sampang) *)
Oyong – PLN Grati
East Java 14 40
Madura Strait (Husky Oil Ltd) & PT Inti Alasindo Energi **)
ORF Semare – Grati Combined Cycle Power Plant
Pasuruan – East Java
16 22
Madura Strait (Husky Oil Ltd) / PT Parna Raya **)
ORF Husky Kraton – PLTGU Grati Pasuruan Combined Cycle Power Plant
Grati, Pasuruan – East Java
14 16,83
Sampang (Santos Distribution Grati – 16 9

11
Sampang)/ PT. PGN **)
Grati – Pasuruan – Probolinggo
Pasuruan – Probolinggo
Source: Adapted from RUPTL PLN 2013-2022 and MEMR Ministerial Decree No 2700 K/11/MEM/2012
*) Exsisting Natural Gas Pipeline **) Planned Natural Gas Pipeline
Level 3
Level 3 assumes the capacity of combined cycle power plant in 2050 will be 13.81 GW. Increase in
combined cycle power plant capacity in this level is caused by the increase of electricity demand and
higher peak load than Level 2. This level also assumes the infrastructure planned in MEMR
Ministerial Decree No 2700 K/11/MEM/2012 has been fully built (25,754 km) and the gas supply is
available from potential reserves that already under contract.
In order to fulfill electricity need especially during peak load, about 5 GW additional capacity of
combined cycle power plant is needed in 2050. This additional capacity assumes to be fulfilled from
Sumatera region with 1.19 GW, Eastern Indonesia region with 0.66 GW and Java-Bali grid system
with 3.15 GW (RUPTL 2013-2022). Therefore, the total installed capacity including the existing
capacity of 8.81 GW with additional capacity of 5 GW is 13.81 GW.
Additional capacity of combined cycle power plant mainly comes from Java-Bali grid system. This is
caused by the electricity demand in 2022 is projected to come mostly from Java-Bali region (70%). To
fulfill fuel need of combined cycle power plant that is projected to be able to use 100% gas in 2050,
the gas distribution infrastructure in Java-Bali region is assumed to be sufficient for additional PLTGU
operation. Currently, 6,678 km gas pipeline has been built and 25,745 km more is planned to be built
in 2025 (MEMR Ministerial Decree No.2700 K/11/MEM/2012). For further detail, maps of existing
and planned gas pipeline are shown in Appendix 2 to Appendix 6.
To support the development of combined cycle power plant additional capacity of 0.66 GW in the
eastern part of Indonesia, it is assumed that the planned gas pipeline according to MEMR Ministerial
Decree No. 2700 K/11/MEM/2012 has been built (Table 11).
Tabel 12. Plan of Gas Pipeline in east Indonesia
Gas reserve location (Block) Type of Pipe Route Region
KALIMANTAN
1 Chevron, Total E & P Indonesia, Petronas Carigali Muriah Ltd
Transmission East Kalimantan – Central Java
East Kalimantan, South Kalimantan, Central Java
2 Sanga-Sanga (VICO), Mahakam Distribution Network of

12
(Total), East Kalimantan (Chevron)
Samarinda Region Distribution
3 Sanga-Sanga (VICO), Mahakam (Total), East Kalimantan (Chevron)
Transmission Network of Balikpapan Region Distribution
4 Chevron, Total E & P Indonesia, Petronas Carigali Muriah Ltd
Transmission Banjarmasin – Palangkaraya – Pontianak
East Kalimantan, South Kalimantan, West Kalimantan,
5 Natuna Sea “A” (Premier Oil Natuna Sea BV)
Transmission Natuna – Kalimantan West
West Kalimantan
SULAWESI
1 Sengkang (Energy Equity Sengkang), Donggi Senoro
Transmission Donggi – Pomala – Sengkang
North Sulawesi, Central Sulawesi
2 Sengkang (Energy Equity Sengkang)
Distribution Region Jaringan Distribution Ujung Pandang
South Sulawesi
3 Sengkang (Energy Equity Sengkang)
Transmission Sengkang – Pare-Pare – Makassar
South Sulawesi
MALUKU & PAPUA
1 Salawati Kepala Burung (JOB Pertamina – Petrochina Salawati)
Distribution Sorong Distribution Sorong, Papua
2 SE Arar 1 (Petrocihina International (Bermuda) Ltd.)
Transmission SE Arar – Ex P/L Arar
Papua
3 SE Arar 1 (Petrocihina International (Bermuda) Ltd.)
Transmission NA 1 – PF Arar Papua
4 Onshore Block Pulau Salawati Kepala Burung by JOB PT PHE and Petrochina International (Kepala Burung) Ltd.
Distribution Flare JOB Pertamina – Petrochina to plant Intermega Sabaku PTE Ltd.
Sorong, West Papua
Level 4
Level 4 assumes that the capacity of combined cycle power plant in 2050 will be 25 GW. Significant
increase of the capacity in this level is caused by the significant increase in electricity demand and
higher peak load than Level 3. This level also assumes the infrastructure planned in MEMR
Ministerial Decree No 2700 K/11/MEM/2012 has been built 100% (25,754 km) and also other
infrastructure such as FSRU and new LNG plant, for example Arun Regasification unit, FSRU Labuhan

13
Maringgai (Lampung), FSRU Cilegon (Banten), FSRU Central Java, LNG Plant Donggi Senoro, LNG
Plant South Sulawesi and LNG Plant Masela. Gas supply for this level is assumed from the potential
reserves that has been under contract and also from the imported gas supply.
In Level 4, it is assumed that 45% of total combined cycle power plant capacity is installed in Java.
While Sumatera and other islands share 35% and 20% of total combined cycle power plant capacity,
respectively.
Significant increase in installed capacity of combined cycle power plant in Sumatera is triggered by
the increase in electricity demand and the higher peak load in the area. The development of
combined cycle power plant in Sumatera is supported by sufficient infrastructures comprising the
existing gas pipeline (2012) of 4,567.92 km and readily available pipeline according to National
General Plan Natural Gas Transmission and Distribution Line of 15,803.3 km. Gas pipeline from
Natuna archipelago to Sumatera become the important infrastructure considering the gas reserves
in Natuna (51,46 TSCF). Gas supply for combined cycle power plant in Sumatera will be fulfilled by
the optimal exploration of gas reserves in Sumatera that reaches 31.65 TSCF (Statistik Gas Bumi,
2012).
Figure 4. Levels of Installed Capacity of PLTGU 2011 to 2050
Level 1 (2050): 8.48 GW
Level 2 (2050): 10.42 GW
Level 3 (2050): 13.81 GW
Level 4 (2050): 25 GW
0.0
5.0
10.0
15.0
20.0
25.0
30.0
2010 2015 2020 2025 2030 2035 2040 2045 2050
Capa
city
(Gig
aWat
t)
Installed Capacity of PLTGU

14
Figure 5. Installed Capacity of Combined Cycle Power Plant in 2050 (GW)
4.2 Gas fired Power Plant (PLTG)
Gas fired power plant is a power plant that utilizes the power resulted from fuel combustion and
high pressure gas. The result of combustion that is high-pressure gas will move the turbine and
generator, thus electricity is generated.
One of drawbacks of gas-fired power plant is its low efficiency. Therefore, gas fired power plant can
be combined with steam power plant to get higher efficiency, such combination is called combined
cycle power plant.
According to PLN Statistics 2011, the number of gas fired power plant and combined cycle power
plant are 71 units and 61 units respectively with installed capacity of 2839.44 MW and 7833.97 MW.
Therefore, the average capacities of gas fired power plant and combined cycle power plant are 39.99
MW and 128.42 MW. Based on this data, gas fired power plant is still needed to fulfill moderate
electricity demand (like combined cycle power plant) especially to supply the electricity outside Java.
The number of gas fired power plant outside Java in 2011 was 40 unit, higher than the number of
gas fired power plant in Java (Statistik PLN, 2011).
Level 1
Level 1 assumes that the capacity of gas fired power plant remain the same from base year (2011)
until 2050 at 4.23 GW. Level 1 assumes that there will not be any new gas fired power plant installed
and the existing gas fired power plant will be maximized. This level assumes that the new gas-fired
power plant faces the natural gas shortage issue due to the low exploration activities in exploration
8.48
8.48
10.42
13.81
25
0.00 5.00 10.00 15.00 20.00 25.00 30.00
Tahun dasar
Level 1
Level 2
Level 3
Level 4

15
and slow exploitation of new gas field. Besides, the development of new gas fired power plant
outside Java is hindered by insufficient gas pipeline and infrastructure.
The existing gas fired power plants in Java in 2011 were operated by PT.Indonesia Power, PT PJB and
Pembangkitan Muara Tawar. Muara Tawar gas fired power plant is assumed to be operating until
2050 due to continuous gas supply from Pertamina Hulu Energi (PHE), Program SWAP FSRU Jawa
West and SWAP Premier. Meanwhile, Cilegon gas fired power plant is assumed to obtain gas supply
from CNOOC and PGN. Sunyaragi gas fired power plant is assumed to be operating with gas supply
from Pertamina EP Reg Jawa. In addition, additional capacity of Pesanggaran gas fired power plant is
supplied by LNG Sengkang.
The existing gas fired power plants outside Java are assumed to still operate until 2050, among
others: the gas fired power plants in West Kalimantan, South Kalimantan, East Kalimantan, South
Sulawesi, KIT Northern Sumatera and KIT Southern Sumatera.
Level 2
Level 2 assumes that the capacity of gas-fired power plant in 2050 will be 6.65 GW. Level 2 assumes
that there is a 2.4 GW additional capacity compared to the base year (2011). Such additional
capacity is assumed from the gas-fired power plants in Sumatera region with 0.88 GW, eastern part
of Indonesia with 1.34 GW and Java-Bali system with 0.21 GW.
Additional capacity in Sumatera Region is assumed from Sungai gelam gas fired power plant (0.092
GW), Duri gas fired power plant (0.112 GW), Lampung Sribawuno gas fired power plant , Sutami gas
fired power plant (0.2 GW), Payo selincah gas fired power plant (0.05 GW), Arun gas fired power
plant (0.2 GW), East Tanjung Jabung gas fired power plant (0.1 GW), Aceh (0.025 GW) and Jambi
Peaker gas fired power plant (0.1 GW).
For east Indonesia region, additional capacity of gas fired power plant is assumed from East
Kalimantan peaking (0.1 GW), Senipah (0.082 GW), South Kalimantan Peaker-1 (0.2 GW), South
Kalimantan peaker-2 (0.05 GW), East Kalimantan peaker-2 (0.1 GW), East Kalimantan peaker-3 (0.05
GW), Minahasa peaker (0.15 GW), Sengkang (0.06 GW), Makassar peaker (0.45 GW), and Gorontalo
peaker (0.1 GW). For Java-Bali grid system, additional capacity of gas-fired power plant is assumed
from Pesanggaran peaker (0.21 GW).
For this level, it is assumed that storage and regasification facilities are available in LNG Arun to be
used for supplying the gas fired power plant in Arun and northern Sumatera. For the gas fired power
plants in Sungai Gelam, Duri, Lampung and Jambi, the gas is supplied in the form of Compressed
Natural Gas (CNG) from PEP-TAC, Energasindo, Jambi Merang, FSRU Lampung and Petro china.

16
The gas-fired power plants in eastern part of Indonesia, especially East Kalimantan peaker, uses LNG
from Simenggaris field as fuel. For peaker in Makassar, Minahasa and Sengkang, gas supply is
assumed from Sengkang (Wasambo field) using mini LNG technology. And for Pesanggaran gas fired
power plant, the gas is supplied from Sengkang (Wasambo field) using mini LNG technology.
Level 3
Level 3 assumes that the capacity of as fuel in 2050 will be 8.12 GW. Increase in gas fired power
plant capacity in this level is caused by the increase of electricity demand and higher peak load than
Level 2. This level also assumes the infrastructure planned in MEMR Ministerial Decree No 2700
K/11/MEM/2012 has been built 100% (25,754 km) and the gas supply is available from potential
reserves that have been under contract. In order to fulfill the electricity need especially during peak
load, about 3.89 GW additional capacity of gas-fired power plant is needed in 2050. This additional
capacity assumes to be fulfilled in Sumatera region with 1.5 GW, Eastern Indonesia region with 2.18
GW and Java-Bali grid system with 0.22 GW.
Most of additional capacity of gas-fired power plant comes from the eastern part of Indonesia with
low capacity per plant yet spread out in the region. To fulfill the fuel need of gas fired power plant,
the new gas pipeline of 3,960 km long has been built in 2050 therefore the total length of pipeline
reach 7,080 km (MEMR Ministerial Decree No.2700 K/11/MEM/2012). Gas supply for gas fired
power plant in east Indonesia region comes from several gas field including Salamander, Donggi,
Total Senipah and LNG Sengkang (Table 13).
Gas fired power plant development in Sumatera region and Java-Bali grid system are supported by
sufficient gas pipeline infrastructure. It is assumed that the available gas pipeline in 2050 for
Sumatera region reach 20,371 km and 32,423 km pipeline for Java-Bali. Gas supply for gas fired
power plant in Java-Bali comes from block gas Corridor (ConocoPhilipsIndonesia) and Cepu (Exxon
Mobil Oil Indonesia). Meanwhile for Sumatera region, gas supply comes from potential block such as
Seng, Segat in Pelalawan regency, Bento and Baru in Pekanbaru that is currently operated by PT
Kalla, Jambi Merang, and FSRU LNG Tangguh.
Tabel 13, Projected Gas Supply for PLTG in East Indonesia Region
No Power Plant Province Gas Supplier 1 Pontianak Peaker West Kalimantan LNG PLN Bantam (planned) 2 Bangkanai Central Kalimantan Salamander 3 South Kalimantan
Peaker South Kalimantan Salamander (potential)
4 Bontang East Kalimantan Salamander Lapangan Tutung (potential), Total Bontang
5 Sambera East Kalimantan VICO (potential) 6 East Kalimantan East Kalimantan JOB Simenggaris (potential)

17
peaker 7 Senipah East Kalimantan Total Senipah 8 Tarakan North Kalimantan GSA Pertamina EP, Manhattan KI 9 Minahasa Peaker North Sulawesi LNG Sengkang
10 Gorontalo Peaker Gorontalo Donggi (potential) 11 Morowali Central Sulawesi Tiaka (potential) 12 Sengkang South Sulawesi Energy Equity Epic (sengkang) 13 Makassar Peaker South Sulawesi LNG Sengkang 14 Lombok Peaker West Nusa Tenggara Marine CNG from Gresik 15 Kawasan Indonesia
Timur (KTI) Tersebar LNG Sengkang (potential), Perusda
Salawati (potential), Sorong Petrochina (planned), BP Berau (potential)
Source: Adapted from RUPTL PLN 2013-2022
Level 4
Level 4 assumes that the capacity of gas-fired power plant in 2050 will be 21 GW. Significant increase
of gas fired power plant capacity in this level is caused by the significant increase of electricity
demand that is higher than Level 3. This level also assumes that the infrastructure planned in MEMR
Ministerial Decree No 2700 K/11/MEM/2012 has been built 100% (25,754 km) and also other
infrastructure such as FSRU and new LNG plant, for example Arun Regasification unit, FSRU Labuhan
Maringgai (Lampung), FSRU Cilegon (Banten), FSRU Central Java, LNG Plant Donggi Senoro, LNG
Plant South Sulawesi and LNG Plant Masela. The gas fired power plant in eastern part of Indonesia
will be supplied by mini LNG, for example the gas fired power plants of peaker Makassar, Minahasa,
Kupang, Pesanggrahan, Ambon and Jayapura. Gas supply for this level is assumed from the potential
reserves that have been under contract and also from the imported gas supply.
Figure 6. The leves of Installed Capacity of gas fired power plant 2011 - 2050
Level 1 (2050): 4.23 GW
Level 2 (2050): 6.65 GW
Level 3 (2050): 8.12 GW
Level 4 (2050): 21 GW
0.0
5.0
10.0
15.0
20.0
2010 2015 2020 2025 2030 2035 2040 2045 2050
Capa
city
(Gig
aWat
t)
Installed Capacity of PLTG

18
Figure 7. Installed Capacity of gas fired power plant in 2050 (GW)
4.3 Diesel Power Plant (PLTD)
In 2011, installed capacity of diesel power plant in Indonesia was 5,47 GW. It belongs to PLN owned
power plant (5.02 GW) and private owned (0.45 GW). Most diesel power plants are installed outside
Java-Bali grid system (5.24 GW), and the rest (0.23 GW) is installed in Java-Bali grid system (Statistik
Ketenagalistrikan, 2011). Outside Java-Bali system, diesel power plant is used for base load, peak
load and also captive power. Diesel power plant condition is usually old, not feasible economically
and technically for operation due to high operational cost or needs to be replaced or reconditioning.
Due to high operational cost, especially for diesel fuel, replacement technology is needed to reduce
fossil fuel use. The appropriate replacement technology includes small-scale coal fired steam power
plant, thermal modular power plants (pembangkit thermal modular pengganti diesel, PTMPD) and
hybrid renewable energy power plant with diesel or biofuel power plant.
Level 1
Level 1 assumes that the capacity of diesel power plant remains the same from base year (2011)
until 2050 at 5.47 GW. This level assumes that the diesel power plant is used to fulfill electrification
ratio target of 100%. Therefore, the diesel power plant is still used in remote islands in eastern part
of Indonesia, particularly in the area that is difficult to be covered by PLN grid. The technology to
replace diesel power plant, through the use of renewable energy source, is assumed not fully
developed so that the diesel power plant is still being used. If in 2011, most diesel power plants are
installed in Sumatera and Kalimantan; in 2050, the diesel power plant is assumed to be installed
mostly in Maluku, Papua dan Nusa Tenggara. It happens because the diesel power plants in
Sumatera dan Kalimantan have been replaced by small-scale coal fired, while the diesel power plant
is needed to meet the electrification ratio target in Maluku, Papua and Nusa Tenggara region.
Level 2
4.23
4.23
6.65
8.12
21
0.00 5.00 10.00 15.00 20.00 25.00
Tahun dasar
Level 1
Level 2
Level 3
Level 4

19
Level 2 assumes that the capacity of diesel power plant in 2050 decrease to 2 GW. This level
assumes that the fossil fuel is expensive and its supply is fluctuated that causes the diesel power
plant to be uneconomical to develop. On the other hand, the technology replacement using
renewable energy resources is assumed to be ready that the diesel power plants in Maluku, Nusa
Tenggara and Papua region have been replaced. Besides, the number of small-scale coal fired power
plant installed in Sumatera dan Kalimantan regions is higher compared to Level 1.
Level 3
Level 3 assumes that the capacity of diesel power plant in 2050 decreases to 1.5 GW. This level
assumes that the fossil fuel is expensive and its supply is fluctuated that causes the diesel power
plant to be uneconomical to develop. The use of green diesel is assumed to be uneconomical for
small-scale diesel power plants . On the other hand, the technology replacement using renewable
energy resources is assumed to be ready that diesel power plants in Nusa Tenggara are totally
replaced. Only some areas in Maluku and Papua that still use diesel power plants in 2050. Besides,
the number of small-scale coal fired power plant in Sumatera dan Kalimantan regions is similar to
Level 2.
Level 4
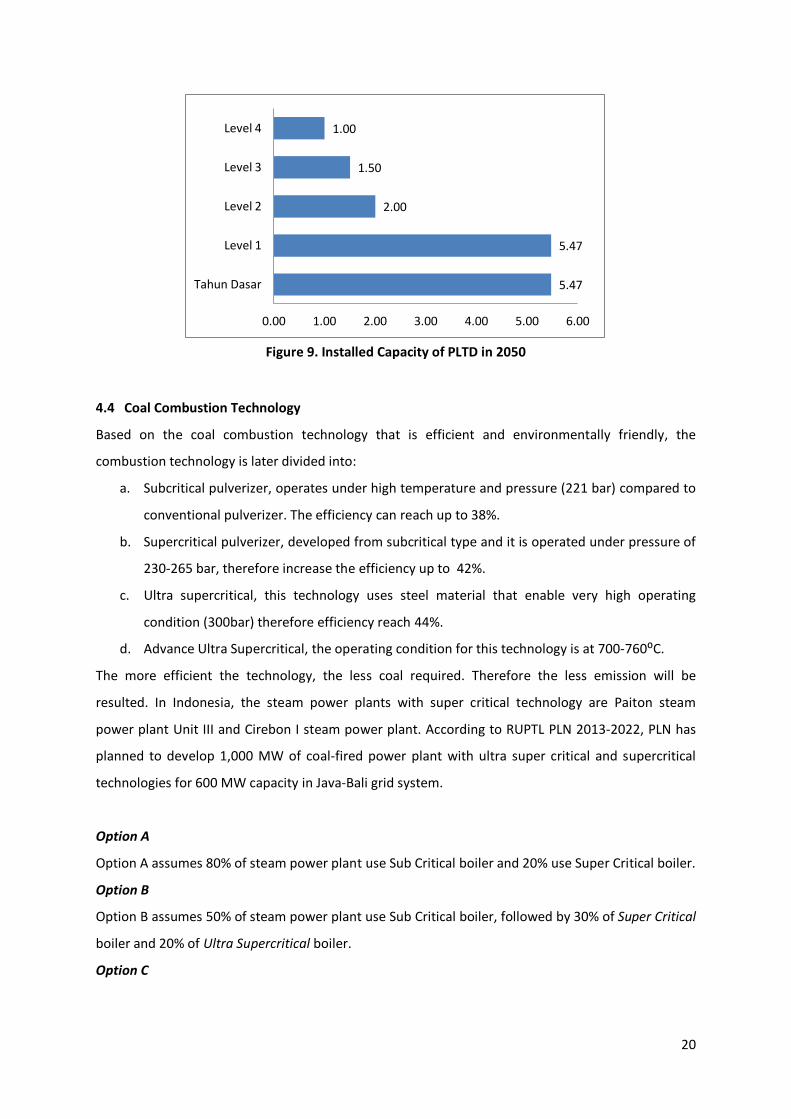
Level 4 assumes that capacity of diesel power plants in 2050 decreases to 1 GW. This level assumes
that the fossil fuel is expensive and its supply is fluctuated that causes the diesel power plant to be
uneconomical to develop. Similar to Level 3, the use of green diesel is considered uneconomical for
small-scale diesel power plants. On the other hand, technology replacement of small-scale steam
power plant has been proven to be reliable. Therefore the use of diesel power plants has been
replaced. The installed capacity of diesel power plants that reach 1 GW is assumed from the diesel
power plant that is combined with renewable energy resources in some areas like Nusa Tenggara
and Papua.
Figure 8. Leveling of Installed Capacity of PLTD 2011 to 2050
Level 1 (2050): 5.4 GW
Level 3 (2050): 2 GW
Level 2 (2050): 1.5 GW Level 4 (2050):
1 GW 0.0
1.0
2.0
3.0
4.0
5.0
6.0
2010 2020 2030 2040 2050
Capa
city
(Gig
aWat
t)
Installed Capacity of PLTD
20
Figure 9. Installed Capacity of PLTD in 2050
4.4 Coal Combustion Technology
Based on the coal combustion technology that is efficient and environmentally friendly, the
combustion technology is later divided into:
a. Subcritical pulverizer, operates under high temperature and pressure (221 bar) compared to
conventional pulverizer. The efficiency can reach up to 38%.
b. Supercritical pulverizer, developed from subcritical type and it is operated under pressure of
230-265 bar, therefore increase the efficiency up to 42%.
c. Ultra supercritical, this technology uses steel material that enable very high operating
condition (300bar) therefore efficiency reach 44%.
d. Advance Ultra Supercritical, the operating condition for this technology is at 700-760⁰C.
The more efficient the technology, the less coal required. Therefore the less emission will be
resulted. In Indonesia, the steam power plants with super critical technology are Paiton steam
power plant Unit III and Cirebon I steam power plant. According to RUPTL PLN 2013-2022, PLN has
planned to develop 1,000 MW of coal-fired power plant with ultra super critical and supercritical
technologies for 600 MW capacity in Java-Bali grid system.
Option A
Option A assumes 80% of steam power plant use Sub Critical boiler and 20% use Super Critical boiler.
Option B
Option B assumes 50% of steam power plant use Sub Critical boiler, followed by 30% of Super Critical
boiler and 20% of Ultra Supercritical boiler.
Option C
5.47
5.47
2.00
1.50
1.00
0.00 1.00 2.00 3.00 4.00 5.00 6.00
Tahun Dasar
Level 1
Level 2
Level 3
Level 4

21
Option C assumes the use of Sub Critical boiler for steam power plant decrease to 20% the use of
Super Critical and Ultra Supercritical boiler for PLTU increase to 50% and 30% respectively.
Option D
Option D assumes Sub Critical boiler is not being used anymore. Advance Ultra Supercritical boiler
technology has been used for 20% PLTU. While Super Critical and Ultra Supercritical boiler are used
with percentage of 30% and 50%.
Figure 10. The Levels of Coal Combustion Technology
Opsi A Opsi B Opsi C Opsi D Advance Ultra Super Critical 0% 0% 0% 20% Ultra Super Critical 0% 20% 30% 50% Super Critical 20% 30% 50% 30% Sub Critical 80% 50% 20% 0%
0%
20%
40%
60%
80%
100%
Coal Combustion Technology for PLTU

22
V. References Burr, M. T., Holding companies rule; top 10 sell 28% of U.S. electricity, Electric Light and Power,
October 1999.
Cahyadi. 2011. Kajian Teknis Pembangkit Listrik Berbahan Bakar Fosil. Balai Besar Teknologi Energi
(B2TE). BPPT
Handbook of Energy & Economics of Indonesia. 2013. Pusdatin, Kementerian Energi dan Sumber
Daya Mineral
Keputusan Menteri Energi dan Sumber Daya Mineral Nomor 2700 K/II/MEM/2012 tentang Rencana
Induk Jaringan Transmission dan Distribution Gas Bumi Nasional Tahun 2012-2025.
Nag, PK, Power Plant Engineering, Tata Mc Graw Hill, 2002.
Rencana Usaha Penyediaan Tenaga Listrik 2013-2022. 2013. PT PLN. Jakarta
Statistik Ketenagalistrikan. 2011. Direktorat Ketenagalistrikan, Kementerian Energi dan Sumber Daya
Mineral
Statistik PLN 2011. 2012. PT PLN. Jakarta

Appendix 1. Map of National General Plan for Gas Transmission and Distribution Pipeline Year 2012 - 2025

24
Appendix 2. Map of Existing and Planned Gas Pipeline in Java (1)

25
Appendix 3. Map of Existing and Planned Gas Pipeline in Java (2)

26
Appendix 4. Map of Existing and Planned Gas Pipeline in Java (3)

27
Appendix 5. Map of Existing and Planned Gas Pipeline in Java (4)

28
Appendix 6. Map of Existing and Planned Gas Pipeline in Java (5)