Embed Size (px)
Citation preview

© 2017. Afolayan, S.O., Habu, H, Yaduma, J.J., Shuaib S.M., Muazu, Y.G., Idris B.A., Hudu, A.H. & Adams, I.. This is a research/review paper, distributed under the terms of the Creative Commons Attribution-Noncommercial 3.0 Unported License http://creativecommons.org/licenses/by-nc/3.0/), permitting all non commercial use, distribution, and reproduction in any medium, provided the original work is properly cited.
Global Journal of Science Frontier Research: D Agriculture and Veterinary Volume 17 Issue 4 Version 1.0 Year 2017 Type : Double Blind Peer Reviewed International Research Journal Publisher: Global Journals Inc. (USA) Online ISSN: 2249-4626 & Print ISSN: 0975-5896
Energy use Efficiency, Agronomic Efficiency, Economic Analysis, Residue Deposit, Nutrient Tolerance and Yield of Tomatoes under Limited and Optimal Fertilizer
By Afolayan, S.O., Habu, H, Yaduma, J.J., Shuaib S.M., Muazu, Y.G., Idris B.A., Hudu, A.H. & Adams, I.
National Horticultural Research Institute
Abstract- Nine tomato cultivars comprising Tropimech (T1), Carl J (T2), Peto 86 (T3), Roma (T4), UC82B (T5), Chibli (T6), Heinz (T7), NI (T8) and RIO (T9) were evaluated for energy use efficiency, economic analysis, residue deposits, agronomic efficiency, nutrient tolerance and yield performance under four fertilizer rates. The trial was conducted at the Kadawa irrigation site of Kano State altitude 476.2m, Lat.11.550N and Long. 8.380E. Nursery sowing and transplanting were carried out on 10 November, 2015 at a minimum temperature of 160C and on 22 December 2015 at a minimum temperature of 13.40C. Fertilizer treatment was applied at 0, 170, 200,230 and 260 kgha-1(20-10-10) respectively under the basin size of 25m2 and 0.5m x 0.5m spacing. Irrigation water was supplied evenly at the flow rate of 11 m3hr-1 using 3” diameter pressurized rubber tube at an average discharge rate of 10.87 m3-hr.
GJSFR-D Classification : FOR Code: 079999
EnergyuseEfficiency,AgronomicEfficiency,EconomicAnalysis,ResidueDeposit,NutrientToleranceandYieldofTomatoesunderLimitedandOptimal Fertilizer
Strictly as per the compliance and regulations of :

Energy use Efficiency, Agronomic Efficiency, Economic Analysis, Residue Deposit, Nutrient
Tolerance and Yield of Tomatoes under Limited and Optimal Fertilizer
Afolayan, S.O. α, Habu, H σ , Yaduma, J.J. ρ, Shuaib S. M. Ѡ, Muazu, Y.G. ¥, Idris B. A. §, Hudu, A. H. χ & Adams, I. ν
Abstract-
Nine tomato cultivars comprising Tropimech (T1), Carl J (T2), Peto 86 (T3), Roma (T4), UC82B (T5), Chibli (T6), Heinz (T7), NI (T8)
and RIO (T9) were evaluated for energy use efficiency, economic analysis, residue deposits, agronomic efficiency, nutrient tolerance and yield performance under four fertilizer rates. The trial was conducted at the Kadawa irrigation site of Kano State altitude 476.2m, Lat.11.550N and Long. 8.380E. Nursery sowing and transplanting were carried out on 10 November, 2015 at a minimum temperature of 160C
and on 22 December 2015 at a minimum temperature of 13.40C. Fertilizer treatment was applied at 0, 170, 200,230 and 260 kgha-1(20-10-10) respectively under the basin size of 25m2
and 0.5m x 0.5m spacing. Irrigation water was supplied evenly at the flow rate of 11 m3hr-1 using 3” diameter pressurized rubber tube at an average discharge rate of 10.87 m3-hr. Results obtained indicated that the total energy budget for the production of the nine cultivars was 112,180.55 MJha-1
with
fertilizer accounting for about 41.2% of the energy input. Energy use efficiency was however low showing inefficient us of energy in tomato production typical of Nigerian system. T2,
T4,
T5,
T6
and T7
recorded agronomic efficiency of 8.05, 14.10, 2.38, 4.53, and 13.96 with a corresponding yield performance of 20.6, 24.8, 19.4, 20.1 and 24. 4 tha-1
respectively. Residue deposits were significantly more pronounced with T4,
T7, T9, T3, and T2
possibly suggesting cultivars with higher concentration of ethanol than others at 7.88 tha-1, 5.99 tha-1, 4.85 tha-1, 4.75 tha-1, and 4.62 tha-1
respectively. The highest nutrient limited tolerance index (TOLN) was observed in T4
followed by T7, T6
and T5, revealing the cultivars with the possibility of early segregation , although displaying the characteristics of initial better yield performance in contrast to T2
with more stable traits as observed in low TOLN with higher yield at both optimal and limited fertilizer rates. However, due to low yield performance associated with T5
under limited fertilizer rates, T2,T4, T6
and T7
were found to be more desirable for production and further improvement. Economics, a very strong agricultural business decision tool as indicated in the value of Benefit-Cost ratio, was found to be 2.09 with corresponding returns of N1,503,168.00 per ha. This outcome was highly desirable despite the massive invasion of tomato leaf-miner (Tuta Absoluta) towards the maturity stage of the crop.
I. Introdouction
lants generally exhibit unique growth traits even within a similar genotype despite uniform accessibility to nutrient factors, weather
interactions and ecological balance. David (2011) reported that plants were the first complex organisms that evolve with the power of making the atmosphere hospitable for animal and humans, while displaying specific features as distinguishing factors of agriculture that guarantees animal, aquatic and human survival( Genesis 1: 1). In the next fifty years, it is certain agriculture will be struggling with the need for more food than in the previous 10,000 years combined therefore necessitating the need for efficient use of energy compatible with optimum economic returns especially in anti-oxidant crops like tomatoes. AVRDC (1996) classified tomatoes as one of the world’s most important vegetables with global production capacity of 2.6 million ha at fresh tomato fruit production capacity of 100 million metric tons distributed across fifteen leading countries with Nigeria ranking as the 13th best producing country that accounts for about 1.7% of the global production index (FAO, 2010) compared with China (33.9%), Egypt (6.8%), despite the country’s (Nigeria) diverse weather that accommodate and supports multiple vegetable production throughout the year. Notwithstanding, Nigeria’s ranking as the 13th best producing country, the out-put per ha. suggests one of the lowest in global index with 7t/ha in contrast to Egypt (35t/ha), USA (65t/ha) Brazil (58t/ha), Iran (29t/ha) and Turkey (40t/ha) (Janice,2004).
In the recent times, Nigeria has been plunged into tomato production crisis. Unpredicted invasive insects of about 5-7mm in size with egg production capacity of between 250-300 per insect and life cycle of 24 to 76 days spanning 10-12 generations. The insect thrives favourably between 240C and 250C temperature (IRAC, 2011) and thus makes the insect difficult to be eradicated without holistic approach involving water management, energy implications, agronomic dynamics, economic analysis, integrated pest
P
Authorα: National Horticultural Research Institute, Ibadan.e-mail: [email protected] σ ρ Ѡ ¥ § χ ν: National Horticultural Research Institute, Bagauda, Kano.
1
Globa
lJo
urna
lof
Scienc
eFr
ontie
rResea
rch
V
olum
eXVII
X Issue
er
sion
IV
IVYea
r20
17
© 2017 Global Journals Inc. (US)
51
( D)
management, environmental management and climate scenario. This study therefore attempted to determine the energy use efficiency, agronomic efficiency, economic analysis, residue deposits, nutrient tolerance and yield performance of nine cultivar of tomatoes under five fertilizer application rates in Sudan Savannah Ecology of Nigeria.
II. Methodology This study was carried out in the Sudan
Savannah Ecological Zone of Nigeria located on more than 2,000ha of rice, tomato and wheat cultivated area of Kano. The land was characterized with extensive deposition of mineral fertilizers, herbicides and insecticides due to the nature of soil fertility with resultant chemical residue accumulation of high alkalinity and salinity as observed in the red colorations of the surface soil. Seeds of nine cultivars of tomatoes were sown into the nursery on 10th
November 2015 after the necessary land preparation, with each cultivar occupying one square meter of land. These include Tropimech (T1), Carl J (T2), Peto 86 (T3),
Roma (T4),
UC82B (T5), Chibli (T6), Heinz (T7), NI (T8) and RIO (T9). The cultivars were transplanted six weeks after nursery
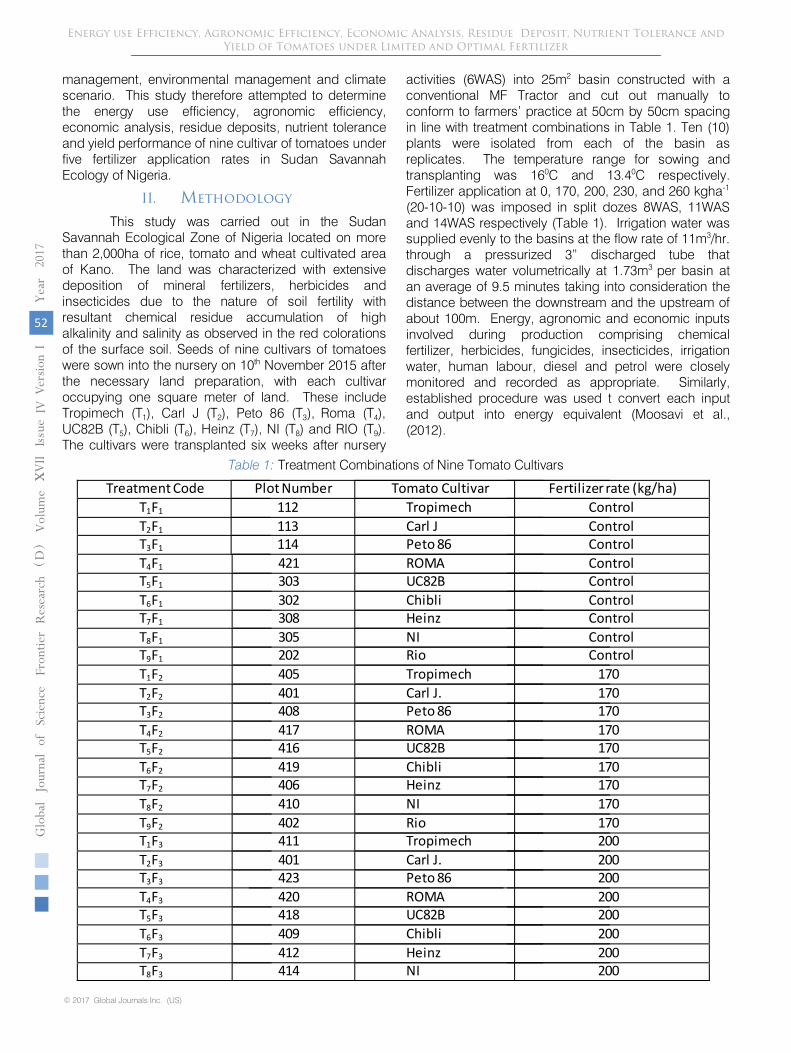
activities (6WAS) into 25m2 basin constructed with a conventional MF Tractor and cut out manually to conform to farmers’ practice at 50cm by 50cm spacing in line with treatment combinations in Table 1. Ten (10) plants were isolated from each of the basin as replicates. The temperature range for sowing and transplanting was 160C and 13.40C respectively. Fertilizer application at 0, 170, 200, 230, and 260 kgha-1 (20-10-10) was imposed in split dozes 8WAS, 11WAS and 14WAS respectively (Table 1). Irrigation water was supplied evenly to the basins at the flow rate of 11m3/hr. through a pressurized 3” discharged tube that discharges water volumetrically at 1.73m3 per basin at an average of 9.5 minutes taking into consideration the distance between the downstream and the upstream of about 100m. Energy, agronomic and economic inputs involved during production comprising chemical fertilizer, herbicides, fungicides, insecticides, irrigation water, human labour, diesel and petrol were closely monitored and recorded as appropriate. Similarly, established procedure was used t convert each input and output into energy equivalent (Moosavi et al., (2012).
Table 1: Treatment Combinations of Nine Tomato Cultivars
Treatment Code Plot Number Tomato Cultivar Fertilizer rate (kg/ha)
T1F1 112 Tropimech Control
T2F1 113 Carl J ControlT3F1 114 Peto 86 Control
T4F1 421 ROMA ControlT5F1 303 UC82B Control
T6F1 302 Chibli ControlT7F1 308 Heinz Control
T8F1 305 NI ControlT9F1 202 Rio Control
T1F2 405 Tropimech 170
T2F2 401 Carl J. 170T3F2 408 Peto 86 170
T4F2 417 ROMA 170T5F2 416 UC82B 170
T6F2 419 Chibli 170T7F2 406 Heinz 170
T8F2 410 NI 170
T9F2 402 Rio 170T1F3 411 Tropimech 200
T2F3 401 Carl J. 200T3F3 423 Peto 86 200
T4F3 420 ROMA 200T5F3 418 UC82B 200
T6F3 409 Chibli 200
T7F3 412 Heinz 200T8F3 414 NI 200
© 2017 Global Journals Inc. (US)
52
Globa
lJo
urna
lof
Scienc
eFr
ontie
rResea
rch
V
olum
eYea
r20
17XVII
X Issue
er
sion
IV
IV( D
)Energy use Efficiency, Agronomic Efficiency, Economic Analysis, Residue Deposit, Nutrient Tolerance and
Yield of Tomatoes under Limited and Optimal Fertilizer
Output-
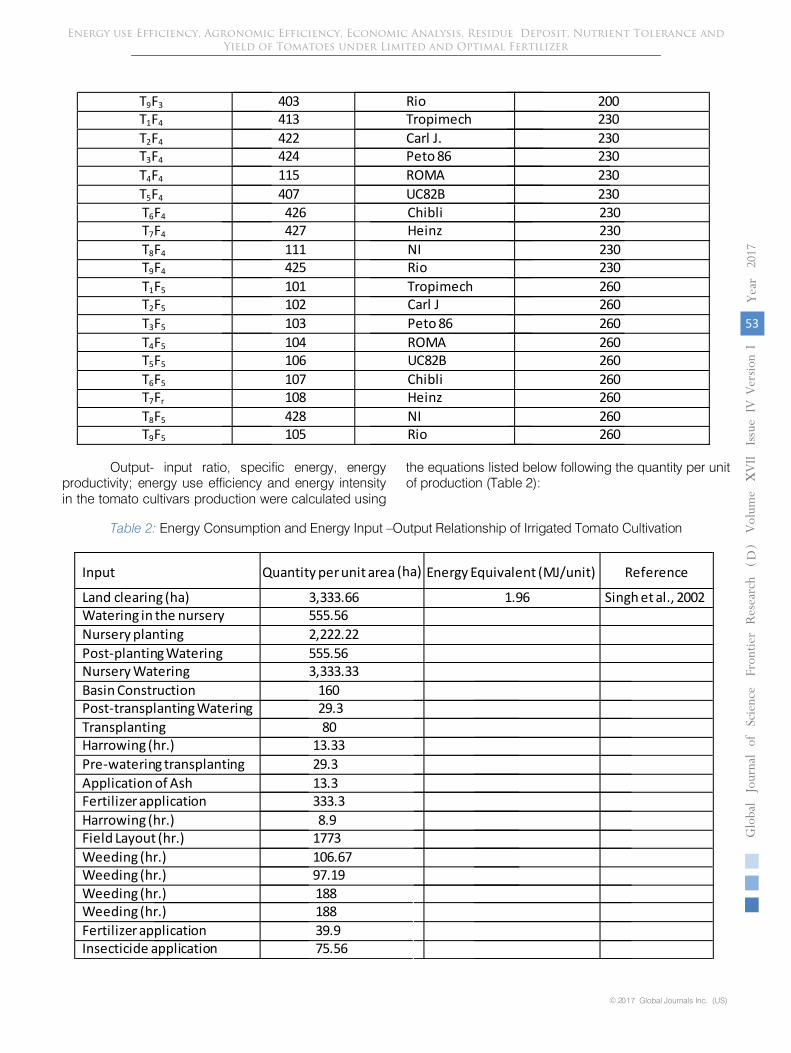
input ratio, specific energy, energy productivity; energy use efficiency and energy intensity in the tomato cultivars production were calculated using
the equations listed below following the quantity per unit of production (Table 2):
Table 2:
Energy Consumption and Energy Input –Output Relationship of Irrigated Tomato Cultivation
T9F3 403 Rio 200T1F4 413 Tropimech 230
T2F4 422 Carl J. 230T3F4 424 Peto 86 230
T4F4 115 ROMA 230
T5F4 407 UC82B 230T6F4 426 Chibli 230T7F4 427 Heinz 230
T8F4 111 NI 230T9F4 425 Rio 230
T1F5 101 Tropimech 260T2F5 102 Carl J 260
T3F5 103 Peto 86 260
T4F5 104 ROMA 260T5F5 106 UC82B 260
T6F5 107 Chibli 260T7Fr 108 Heinz 260
T8F5 428 NI 260T9F5 105 Rio 260
Input Quantity per unit area (ha) Energy Equivalent (MJ/unit) Reference
Land clearing (ha) 3,333.66 1.96 Singh et al., 2002Watering in the nursery 555.56
Nursery planting 2,222.22
Post-planting Watering 555.56Nursery Watering 3,333.33
Basin Construction 160Post-transplanting Watering 29.3
Transplanting 80Harrowing (hr.) 13.33
Pre-watering transplanting 29.3
Application of Ash 13.3Fertilizer application 333.3
Harrowing (hr.) 8.9Field Layout (hr.) 1773
Weeding (hr.) 106.67Weeding (hr.) 97.19
Weeding (hr.) 188Weeding (hr.) 188
Fertilizer application 39.9Insecticide application 75.56
1
Globa
lJo
urna
lof
Scienc
eFr
ontie
rResea
rch
V
olum
eXVII
X Issue
er
sion
IV
IVYea
r20
17
© 2017 Global Journals Inc. (US)
53
( D)
Energy use Efficiency, Agronomic Efficiency, Economic Analysis, Residue Deposit, Nutrient Tolerance and Yield of Tomatoes under Limited and Optimal Fertilizer

Watering (major – 1s-16th wk.) 63.02Harvesting (w) 445
Transportation (kg/km) 25 13.6 Yin, 1996
Irrigation water (m3/ha) 1,700.6 1.02 Rafiee et al., 2010Tomato seedlings (ha) 40,000 0.2 Pellizi., 1992
ToolsHoes (kg) 6.2 0.1 Wen., 1987
Rice straws (it) 50Knapsack (kg) 15 6.5 Chem, 2002
Fertilizers (kg)
Nitrogen 1093.4 60.6 Singh et al., 2002Phosphorus 322.2 11.1 Singh et al., 2002
Potassium 322.2 6.7 Singh et al., 2002Chemical(L)
Herbicides (L) 5 238 Helzel, 1992Insecticides (L) 47.5 199 Helzel, 1992
Fungicides (L) 7.5 92 Helzel, 2002
Irrigation water (M3/ha) 1,700.6 1.02 Rafiee et al 2010Tomato seedlings (ha) 0.2 Pellizi, 1992
Hoes (Kg) 666.6 0.1 Wen, 1987Rice straw (t) 2,000 14 Zalman, 2015
Knapsack (Kg) 15 6.5 Chem, 2002Gasoline 931.26 42.33 Cervinka, 1980
Diesel (L) 47.9
OutputsTomato fruits (kg) 7,792 1.2 Mihov and
Tomato fruits Residue (kg) 1,844.8 1.2 Tringosvska, 2010
Energy Ratio: = Energy Output Energy Input (Baihya and Sharma 1990)
------------------------- (i)
Specific Energy = Energy Input Yield (Burnett, 1982)
----------------- (ii)
Energy Productivity = Yield Energy Input (Mittal, and Dhawan, 1988)
---------------- (iii)
Energy Use Efficiency = Energy Output Energy Input (Acaroglu, (1998)
------ (IV)
Economic indices in terms of Gross return, Net return, Benefit cost and productivity were determined as indicated in the equations below:
Gross return = Total production value - Variable cost of production ---------- (v) (Banaeian et al., 2011)
Net return = Total Production value - Total Production cost ---------- (viii) (Mohammadi et al., 2010)
Benefit cost = Total production value Total production cost
------------ (ix) (Salami and Ahmadi, 2010)
© 2017 Global Journals Inc. (US)
54
Globa
lJo
urna
lof
Scienc
eFr
ontie
rResea
rch
V
olum
eYea
r20
17XVII
X Issue
er
sion
IV
IV( D
)Energy use Efficiency, Agronomic Efficiency, Economic Analysis, Residue Deposit, Nutrient Tolerance and
Yield of Tomatoes under Limited and Optimal Fertilizer
1
Globa
lJo
urna
lof
Scienc
eFr
ontie
rResea
rch
V
olum
eXVII
X Issue
er
sion
IV
IVYea
r20
17
© 2017 Global Journals Inc. (US)
55
( D)
Energy use Efficiency, Agronomic Efficiency, Economic Analysis, Residue Deposit, Nutrient Tolerance and Yield of Tomatoes under Limited and Optimal Fertilizer
Productivity = Yield / Total Production cost
------------ (x) (Ozkan et al; 2010)
Agronomic efficiency was obtained using the model of Jagdish et al., (2005) YT- YO FN------- (xi)
Where YT = Fruit yield of tomatoes with optimum fertilizer rate.
Yo = Fruit yield of tomatoes with limited fertilizer rate.
FN = Optimum fertilizer rate.
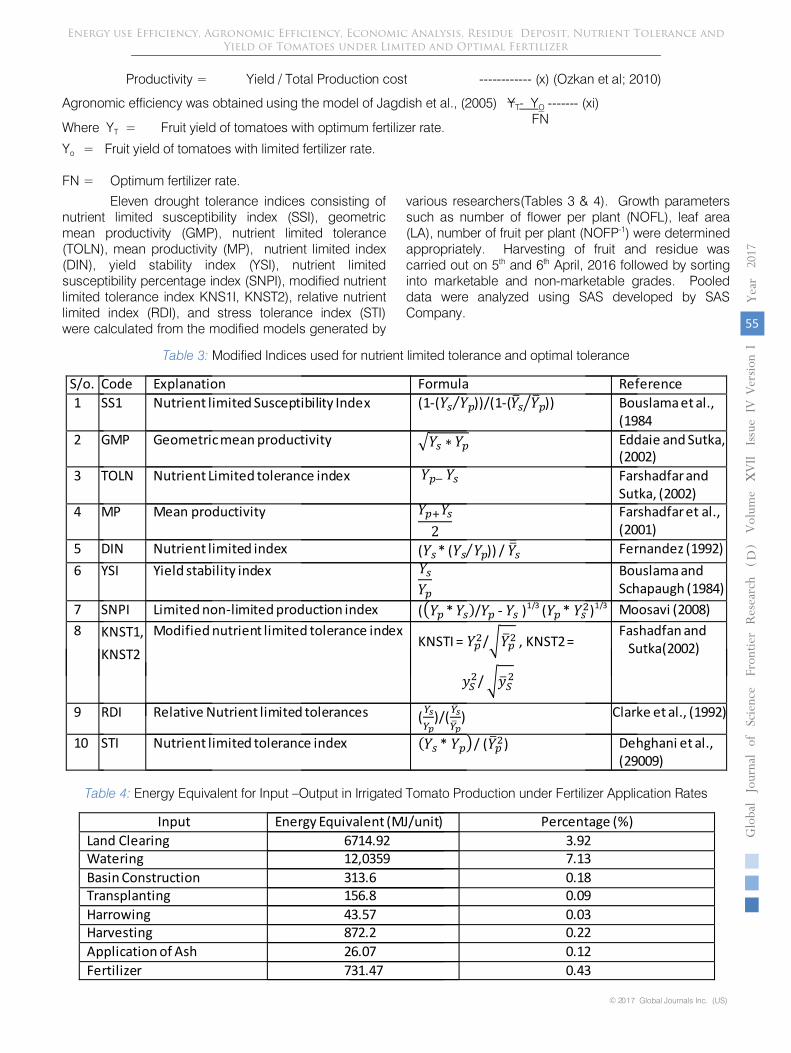
Eleven drought tolerance indices consisting of nutrient limited susceptibility index (SSI), geometric mean productivity (GMP), nutrient limited tolerance (TOLN), mean productivity (MP), nutrient limited index (DIN), yield stability index (YSI), nutrient limited susceptibility percentage index (SNPI), modified nutrient limited tolerance index KNS1I, KNST2), relative nutrient limited index (RDI), and stress tolerance index (STI) were calculated from the modified models generated by
various researchers(Tables 3 & 4). Growth parameters such as number of flower per plant (NOFL), leaf area (LA), number of fruit per plant (NOFP-1) were determined appropriately. Harvesting of fruit and residue was carried out on 5th and 6th April, 2016 followed by sorting into marketable and non-marketable grades. Pooled data were analyzed using SAS developed by SAS Company.
Table 3: Modified Indices used for nutrient limited tolerance and optimal tolerance
S/o. Code Explanation Formula Reference
1 SS1 Nutrient limited Susceptibility Index (1-( ⁄ ))/(1-( ⁄ )) Bouslama et al., (1984
2 GMP Geometric mean productivity √ Eddaie and Sutka, (2002)
3 TOLN Nutrient Limited tolerance index Farshadfar and Sutka, (2002)
4 MP Mean productivity
Farshadfar et al., (2001)
5 DIN Nutrient limited index ( * ( ⁄ )) / Fernandez (1992)
6 YSI Yield stability index
Bouslama and Schapaugh (1984)
7 SNPI Limited non-limited production index (( * )/ - )1/3 ( * )1/3 Moosavi (2008)
8 KNST1, Modified nutrient limited tolerance indexKNSTI =
/√ , KNST2 =
/ √
Fashadfan and Sutka(2002)
9 RDI Relative Nutrient limited tolerances (
)/(
) Clarke et al., (1992)
10 STI Nutrient limited tolerance index ( * )/ ( ) Dehghani et al.,
(29009)
KNST2
Table 4: Energy Equivalent for Input –Output in Irrigated Tomato Production under Fertilizer Application Rates
Input Energy Equivalent (MJ/unit) Percentage (%)
Land Clearing 6714.92 3.92Watering 12,0359 7.13
Basin Construction 313.6 0.18Transplanting 156.8 0.09
Harrowing 43.57 0.03Harvesting 872.2 0.22
Application of Ash 26.07 0.12
Fertilizer 731.47 0.43

© 2017 Global Journals Inc. (US)
56
Globa
lJo
urna
lof
Scienc
eFr
ontie
rResea
rch
V
olum
eYea
r20
17XVII
X Issue
er
sion
IV
IV( D
)Energy use Efficiency, Agronomic Efficiency, Economic Analysis, Residue Deposit, Nutrient Tolerance and
Yield of Tomatoes under Limited and Optimal Fertilizer
Field layout 3475.10 2.03Weeding 1136.53 0.66
Insecticides 148.10 6.09.Transportation 340 0.2
Irrigation water 1734.61 1.01Tomato seedlings (ha) 8000 4.67
Rice straw 98 0.06
Knapsack 97.5 0.06Fertilizer(kg)
Nitrogen 66,260.0 38.7Phosphorus 3576.42 2.09
Potassium 631.51 0.37Chemicals( L)
Herbicides 1190 0.70
Insecticides 9452.5 5.52Fungicides 690 0.40
Hoes 66.66 0.3
Gasoline 39,420.24 23.0Diesel 2874.0 1.68
III. Results and Discussions
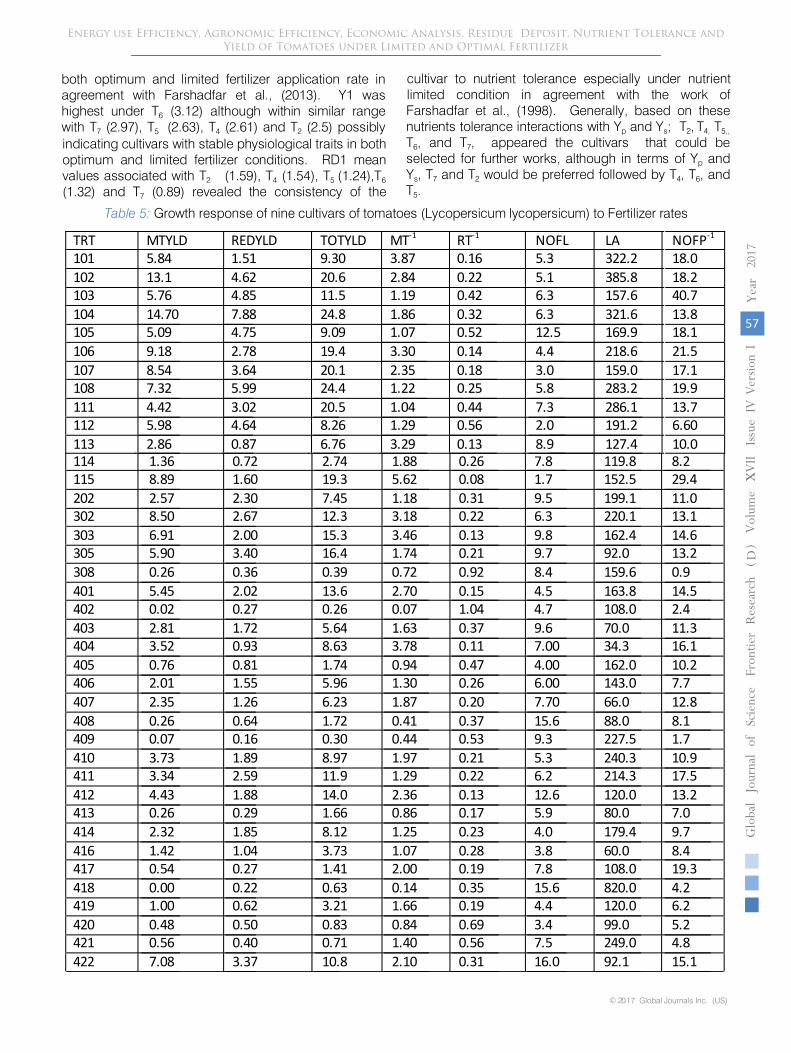
The previous year rainfall data was 1,107.36mm covering the months of June (124mm), July (213.9mm), August (505.7mm), September (235.8mm) and October (28mm) thus suggesting UNIFORMITY of distribution and sufficiency of rainfall for horticultural crop production with little or no supplemental irrigation within the production cycle. Six treatment combinations which include 102 (T2F5), 104 (T4F5), 106 (T5F5), 107 (T6F5), 108 (T7F5), 111 (T8F4) and 115(T4F4) appeared the treatment with most promising yield at 20.6, 24.8, 19.4, 20.1, 24.1 20.5t/ha and 19.3t/ha respectively (Table: 5). However, in terms of marketable yields, 102, 104, 106, 107, 111 and 115 recorded mean weights above 8.5t/ha with corresponding percentage of marketable yield to total yield at 63.9%, 59.3%, 47.3%,42.5%, 46% and 40% possibly revealing 102 and 104 exhibiting less susceptibility to pest damage. Similarly, residue yield followed this trend, 102(4.62t/ha) <104(7.88t/ha)> 106(2.78t/ha)<107(3.64t/ha) <08(5.99t/ha)> 111(3.02t/ha), and>115(1.60t/ha) presenting 104 and 102 asPossessing highest potentials for ethanol production in agreement with the work of Ercolano et at., (2014). Tomato cultivars require multi-dimensional approach comprising energy requirements, economic analysis, residue deposits, agronomic efficiency, nutrients limited susceptibility and potential marketable yield to facilitate sustainable security of production with optimum resistance to pests, diseases, and minimal fertilizer application. Consequently, Nutrient limited tolerance indices are presented in Table 6. However, due to multiple indices, ranking was introduced to determine the cultivar that is most compatible with the ecological
together at 70 and above, T2, T5, T6 (60-70) and T7 (40-45). T7 appeared the best with the highest total yield under optimum (24.4t/ha) and limited fertilizer application (5.96t/ha) compared with T4 (24.8t/ha) under optimum and (1.41t/ha) under limited fertilizer application thereby suggesting that T4 can only perform under optimum fertilizer application. T2, T5, T6 equally displayed some measure of adaptability as observed in the total yield at 20.6t/ha, 19.4t/ha and 20.1t/ha with corresponding yields under limited condition at 13.6t/ha, 3.73t/ha and 3.21t/ha respectively. Generally, T2, T4, T5, T6
and T7 displaced highly promising traits in addition to agronomic efficiency of 8.05 (T2), 2.38(T5), 4.53(T6), and 13.96(T2) which implies cultivars desirable for Sudan Savannah ecology of Nigeria under optimum or limited fertilizer application. Selection of the best cultivar in comparism with energy demand and economics is also essential. Yield under optimum and limited fertilizer application (Yp, Ys) as influenced by nutrient tolerance indices are presented in Table 6. T2, T4, T5, T6 and T7, recorded Yp mean yield values of 20.6t/ha, 24.8t/ha, 19.4t/ha, 20.1t/ha and 24.4t/ha with corresponding Ys at 13.6t/ha, 1.41t/ha, 3.73t/ha, 3.21t/ha, and 5.96t/ha respectively. However, SS1 was highest under T7 (1.04) with close range among T4 (0.98), T5 (0.96), and T6
(0.96) thus reflecting T7 as the most yield stable cultivar under diverse conditions with above-coverage susceptibility to nutrient stress in accordance with the work of Farshadfar et al., (2013). Similarly, MP, Y1, RD1,
system of Sudan Savanna of Nigeria. Four rankings were identified which grouped T1, T3, T4, T8 and T9
did not differ in most prominent cultivars identified at 17.1MP (T2), 13.1MP(T4), 11.6MP (T5), 11.7MP (T6), and 15.2MP (T7)) showing T2 and T7 most desirable under
1
Globa
lJo
urna
lof
Scienc
eFr
ontie
rResea
rch
V
olum
eXVII
X Issue
er
sion
IV
IVYea
r20
17
© 2017 Global Journals Inc. (US)
57
( D)
Energy use Efficiency, Agronomic Efficiency, Economic Analysis, Residue Deposit, Nutrient Tolerance and Yield of Tomatoes under Limited and Optimal Fertilizer
both optimum and limited fertilizer application rate in agreement with Farshadfar et al., (2013). Y1 was highest under T6 (3.12) although within similar range with T7 (2.97), T5 (2.63), T4 (2.61) and T2 (2.5) possibly
optimum and limited fertilizer conditions. RD1 mean values associated with T2 (1.59), T4 (1.54), T5 (1.24),T6
(1.32) and T7 (0.89) revealed the consistency of the
cultivar to nutrient tolerance especially under nutrient limited condition in agreement with the work of
indicating cultivars with stable physiological traits in both
Farshadfar et al., (1998). Generally, based on these nutrients tolerance interactions with Yp and Ys; T2, T4, T5,,
T6, and T7, appeared the cultivars that could be selected for further works, although in terms of Yp and Ys, T7 and T2 would be preferred followed by T4, T6, and T5.
Table 5: Growth response of nine cultivars of tomatoes (Lycopersicum lycopersicum) to Fertilizer rates
TRT MTYLD REDYLD TOTYLD MT-1 RT-1 NOFL LA NOFP-1
101 5.84 1.51 9.30 3.87 0.16 5.3 322.2 18.0
102 13.1 4.62 20.6 2.84 0.22 5.1 385.8 18.2103 5.76 4.85 11.5 1.19 0.42 6.3 157.6 40.7
104 14.70 7.88 24.8 1.86 0.32 6.3 321.6 13.8105 5.09 4.75 9.09 1.07 0.52 12.5 169.9 18.1
106 9.18 2.78 19.4 3.30 0.14 4.4 218.6 21.5
107 8.54 3.64 20.1 2.35 0.18 3.0 159.0 17.1108 7.32 5.99 24.4 1.22 0.25 5.8 283.2 19.9
111 4.42 3.02 20.5 1.04 0.44 7.3 286.1 13.7112 5.98 4.64 8.26 1.29 0.56 2.0 191.2 6.60
113 2.86 0.87 6.76 3.29 0.13 8.9 127.4 10.0114 1.36 0.72 2.74 1.88 0.26 7.8 119.8 8.2115 8.89 1.60 19.3 5.62 0.08 1.7 152.5 29.4
202 2.57 2.30 7.45 1.18 0.31 9.5 199.1 11.0302 8.50 2.67 12.3 3.18 0.22 6.3 220.1 13.1
303 6.91 2.00 15.3 3.46 0.13 9.8 162.4 14.6305 5.90 3.40 16.4 1.74 0.21 9.7 92.0 13.2
308 0.26 0.36 0.39 0.72 0.92 8.4 159.6 0.9
401 5.45 2.02 13.6 2.70 0.15 4.5 163.8 14.5402 0.02 0.27 0.26 0.07 1.04 4.7 108.0 2.4
403 2.81 1.72 5.64 1.63 0.37 9.6 70.0 11.3404 3.52 0.93 8.63 3.78 0.11 7.00 34.3 16.1
405 0.76 0.81 1.74 0.94 0.47 4.00 162.0 10.2406 2.01 1.55 5.96 1.30 0.26 6.00 143.0 7.7
407 2.35 1.26 6.23 1.87 0.20 7.70 66.0 12.8
408 0.26 0.64 1.72 0.41 0.37 15.6 88.0 8.1409 0.07 0.16 0.30 0.44 0.53 9.3 227.5 1.7
410 3.73 1.89 8.97 1.97 0.21 5.3 240.3 10.9411 3.34 2.59 11.9 1.29 0.22 6.2 214.3 17.5
412 4.43 1.88 14.0 2.36 0.13 12.6 120.0 13.2413 0.26 0.29 1.66 0.86 0.17 5.9 80.0 7.0
414 2.32 1.85 8.12 1.25 0.23 4.0 179.4 9.7
416 1.42 1.04 3.73 1.07 0.28 3.8 60.0 8.4417 0.54 0.27 1.41 2.00 0.19 7.8 108.0 19.3
418 0.00 0.22 0.63 0.14 0.35 15.6 820.0 4.2419 1.00 0.62 3.21 1.66 0.19 4.4 120.0 6.2
420 0.48 0.50 0.83 0.84 0.69 3.4 99.0 5.2421 0.56 0.40 0.71 1.40 0.56 7.5 249.0 4.8
422 7.08 3.37 10.8 2.10 0.31 16.0 92.1 15.1

© 2017 Global Journals Inc. (US)
58
Globa
lJo
urna
lof
Scienc
eFr
ontie
rResea
rch
V
olum
eYea
r20
17XVII
X Issue
er
sion
IV
IV( D
)Energy use Efficiency, Agronomic Efficiency, Economic Analysis, Residue Deposit, Nutrient Tolerance and
Yield of Tomatoes under Limited and Optimal Fertilizer
423 1.88 1.35 3.24 1.09 0.42 7.3 152.0 12.3424 2.43 3.31 5.33 0.73 0.62 4.6 82.6 21.7
425 0.03 0.59 0.08 0.05 7.38 4.9 283.3 0.6426 0.47 0.76 3.15 0.53 0.24 9.10 200.0 9.6
427 0.58 0.80 0.24 0.73 3.33 9.5 129.2 2.0428 0.02 0.54 0.09 0.04 6.00 2.4 68.8 0.2
LSD (5%) 3.7* 2.02* 0.86* 1.2* 1.4* 3.5* 88.6* 7.8*
MTL/LD = marketable yield (t/ha); REDYLD = Residue deposits (t/ha); TOTYLD= Total yield (t/ha); MT -1 =ratio of marketable yield to total yield; RT-1 =ratio of residue deposit to total yield; NOFL= No of flowers; LA= leaf area per plant (cm2); NOFT – Number of fruits per plant
Table 6: Agronomic Efficiency & Nutrients/Tolerance indices of tomato cultivars under limited and optimal Fertilizer rates
TLN SD 1 Y1 YP YS YPM YSM SS1 GMP TOLN MP DIN YS1 SNP1 KNST1 KNST2 RD1 ST1 AGE
T1 0.81 2.29 9.3 1.74 5.84 0.76 0.93 0.43 7.56 5.52 0.43 0.19 64.7 2.54 5.24 1.44 0.47 8.26
T2 0.34 2.5 20.6 13.6 13.1 5.45 0.58 0.81 7.00 17.1 1.65 0.66 26.7 2.47 6.23 1.59 1.63 6.76T3 0.85 6.62 11.5 1.72 5.76 0.26 0.89 0.39 9.78 6.61 0.99 0.15 84.9 3.99 43.8 3.31 0.6 2.74
T4 0.94 2.61 24.8 1.41 14.7 0.54 0.98 0.24 23.4 13.1 0.15 0.06 79.7 2.86 6.82 1.54 0.16 0.71T5 0.81 2.63 19.4 3.73 9.18 1.42 0.96 0.44 15.7 11.6 0.51 0.19 85.3 4.47 6.90 1.24 0.86 15.3
T6 0.84 3.12 20.1 3.21 8.54 1.03 0.96 0.40 16.9 11.7 0.5 0.16 98.9 5.54 9.71 1.32 0.88 12.3T7 0.76 2.97 24.4 5.96 7.32 2.01 1.04 0.49 18.4 15.2 6.72 0.24 126 11.1 8.79 0.89 2.71 0.39
T8 0.99 4.50 8.97 0.09 3.73 0.2 1.00 0.10 8.88 4.53 0.05 0.01 119 5.78 20.3 1.87 0.06 8.97
T9 0.97 13.0 9.09 0.26 5.09 0.02 0.98 0.17 8.83 4.68 0.34 0.03 86.7 3.19 169 7.28 0.09 7.45
Holistically, in other to determine the most desirable nutrient limited tolerant criteria, correlation co-effients between Yp and Ys in relationship with other indices were evaluated (Farshadfar et al., 2013). Yp was more highly and positively correlated with MP at 0.93 but negatively correlated with SS1 (-0.90) while Ys was significantly and positively correlated with YSI (0.96), MP (0.80) and negatively correlated with SS1 (-0.81). Similar trends were observed under other tolerance indices (Table 7). This trend possibly suggested MP,
YS1 and SS1 as the most desirable tolerance indices required for tomato cultivar selection in both optimum and limited fertilizer conditions. AGE followed this trend, T5 (15.3) > T6 (12.3) > T9 (9.46) > T8 (8.97) > T1 (8.26) > T2 (6.76) and T7 (0.39) the least. There however, appears little or no interaction between Yp and Ys
considering the fact that the cultivar with the least AGE recorded the highest Yp and second highest Ys. This therefore calls for further studies to establish sustainable positive correlation between AGE, Yp and Ys.
Table 7: Ranking of Tomato Cultivars based on Nutrient Tolerance generated from Table 6
TRT YLD YI MP YPm YSm SSI GMP TOLN DIN YSI SNPI KNST1 KNST2 RDI STI Total
T1 7 9 7 6 5 7 4 8 6 3 8 8 9 6 6 92T2 3 8 1 7 1 9 1 9 1 1 9 9 8 4 2 68
T3 6 2 6 7 7 8 6 5 2 6 6 5 1 2 5 74
T4 1 7 3 1 6 3 7 1 8 7 7 7 7 5 7 77T5 5 6 5 3 3 5 3 4 4 3 5 5 6 8 4 68
T6 4 4 4 4 4 5 5 3 5 5 3 3 4 7 3 63T7 2 5 2 5 2 1 2 2 3 2 1 1 5 9 1 43
T8 9 3 9 9 8 2 9 6 9 1 2 2 2 3 9 85T9 8 1 8 8 9 3 8 7 7 8 4 6 3 1 8 89

Energy use Efficiency, Agronomic Efficiency, Economic Analysis, Residue Deposit, Nutrient Tolerance and Yield of Tomatoes under Limited and Optimal Fertilizer
1
Globa
lJo
urna
lof
Scienc
eFr
ontie
rResea
rch
V
olum
eXVII
X Issue
er
sion
IV
IVYea
r20
17
© 2017 Global Journals Inc. (US)
59
( D)
Table 7: Simple correlation co-efficient for Yp, Ys, and other tolerance indices in 2015/2016 nine cultivars of tomatoes
YP YS SSI GMP TOLN MP DIN YSI SNPI KNST1 KNST2 RDI STI
YP 1YS 0.51 1
SS1 -0.90 -0.81 1GMP 0.45 -0.15 -.077
TOLN 0.78 -0.14 0.48 -0.15 1
MP 0.93 0.80 -0.42 0.72 0.49 1DIN 0.48 0.41 0.11 0.39 0.25 0.52 1
YSI 0.37 0.96 -0.88 0.96 -0.28 0.69 0.31 1SNPI -0.19 0.58 0.87 -0.63 0.93 -0.27 0.35 -0.69 1
KNSTI 0.35 0.03 0.49 -0.02 0.38 0.26 0.83 -0.11 0.78 1KNST2 -0.51 -0.36 0.16 -0.44 -0.32 -0.51 -0.19 -0.36 0.06 -0.20 1
RDI -0.56 -0.36 0.08 -0.42 -0.38 -0.55 -0.27 -0.33 -0.03 -0.31 0.99 1
STI 0.60 0.70 -0.20 0.70 0.19 0.73 0.91 0.61 0.07 0.68 -0.37 -0.44 1
Tables 2 & 4 show input and output quantities with their corresponding energy equivalents and percentages in nine tomato cultivars production. The total energy budget was 112,180.55 MJ/ha of which fertilizer alone accounted for 41.2% followed by the use of gasoline and human labour at 23.0% and 15.7% respectively in agreement with works of Sara et al., (2011), and Yuexician et al., (2014), showing the use of mineral fertilizer as the input in tomato production. However, in view of health implication of chemical fertilizer to humans and environmental respect to cancerous diseases as a result of fresh consumption of tomato or other agricultural products, there is need for alternative source for boosting production with fewer hazards to human nutrition and the environments (Scott, 2003). Human labour has long remained a major factor in Nigerian agricultural business which remains unsustainable in food security thereby calling for concerted effort to migrate from the present use of crude farm implements (cutlasses, hoes) to mechanized farming capable of eliminating all forms of drudgery associated with farming while attracting the reactive youths to agriculture and improve the national economy. Energy use efficiency still remained low in Nigerian agricultural production. This study showed energy use
efficiency of 0.1 (Table 8) in contrast to 4.94 reported by Sara et al., (2011) for grape; 0.96 for cherry (Kizilaslan, 2009) in 0.69 for cucumber, 1.48 for tomato (Heidari and Omid, 2011). This development poses a grave danger to the Nigerian agricultural development in view of crisis experienced by energy sector in the country and its implication on sustainable production. Table 9 shows the distribution of direct and indirect renewable and non-renewable energy components in nine tomato cultivars. Non-renewable energy accounted for 37.1% followed by indirect energy at 29.6% and renewable energy the least at 11% showing the national challenge to develop the natural renewable energy to the level of sustainability. The total expenditure for the cultivation of the nine tomato cultivars was N3, 116,800.00 with corresponding net return of N1, 641,292.00 at 2.09 benefit-cost-ratios (BCR). The BCR value revealed preferential performance of tomato cultivation over wheat (1.43) (Shahan et al., 2008), cotton (0.86) (Yilmaz et al., 2005), sugar beet (1.17) (Erdal et al., 2007), and stake tomato (1.03) Esengum et al., 2007). Succinctly speaking, Evaluation of energy use components of crop production is essential to determine the actual returns achievable in a project.
Table 8: Energy Input – Output Ratio of Tomato Production
Item Unit Value
Energy Input MJha-1 112,180.55Energy output (fruits +straw) MJha-1 1,562.6
Tomato Yield Kgha-1 9,636
Energy Use efficiency 0.1Energy Productivity KgMJ-1 0.1
Specific Energy MJkg-1 11.64

© 2017 Global Journals Inc. (US)
60
Globa
lJo
urna
lof
Scienc
eFr
ontie
rResea
rch
V
olum
eYea
r20
17XVII
X Issue
er
sion
IV
IV( D
)Energy use Efficiency, Agronomic Efficiency, Economic Analysis, Residue Deposit, Nutrient Tolerance and
Yield of Tomatoes under Limited and Optimal Fertilizer
Table 9: Total Energy Input in the form of direct, direct renewable and non-renewable for tomato production under Optimal and limited fertilizer application
Table 10: Economic Analysis of Tomato Production:
IV. Conclusion
Energy Use Efficiency, Agronomic Efficiency, Economic Analysis, and Nutrient tolerance indices are necessary budgets that require intensive and multi-disciplinary attention especially in the content of Nigerian agricultural production that often yield far below world standard. The situation becomes more frightening in view of dwindling energy sources in Nigeria that plummet the economy. The nine tomato cultivars investigated in this study were subjected to diverse conditions on the field. Results obtained suggested that T2, T7 were most adaptable to Sudan ecology of Nigeria, although T6, T4 and T5 are potential alternatives.
References Références Referencias
1. IRAC, 2011: Tuta Absoluta. The Tomato Leaf miner or Tomato Borer.
2. AVRDC, 1996. Combating Micronutrient Deficiency through Vegetable. AVRDC Point. Vol.14 (1):4-5. Asia n Vegetable Research and DevelopmentCentre, Shanshua.
3. David, W. 2011: Horticultural Classification Terms and Tomato Production in the world.
4. FAO. 2010: List of Countries by Tomato Production. En.wikipedia.org
5. Donald C. stamps and John W. Adams. 2003.Life in the Spirit Study Bible. King James Version Zondervan.5pp
6. Janice, L. 2004: Tomato Temperature Tolerance. Best Growing Temperature for Tomatoes.Ag.info.omofraeontan:o.ca
7. Ercolano, M.R., Gomez. L.D., Andolfi, A., Sinister, R. Triose. Angelino, C., Borelli, C., McQueen-Mason, S.J., Evidente, A., Frusciante.L. and Garuso, G. 2014. Residual biomass Saccharification in processing tomato as affected by cultivar and nitrogen fertilization. Biomass and Energy http:lldx.doi.org/101016/J.biombioe. 2014.
8. Moosavi, S.S., Yazdi Samadi,B., Naghavi, M.R., Zali, A.ADashti, H and Pourshahbazi, A. 2008. Introduction to new indices to identify relative drought tolerance and resistance in wheat genotypes. DESERT 12:165-178
9. Ezatollah, F., Mohammad., M.P. and Seyed, MS. 2013. Assessment of drought tolerance in land races of bread wheat based on resistance /tolerance indices. International Journal of Advanced Biological and Biomedical Research. (1)2: 143-158.
10. Jagdish, K.L., Himanshu, P., Timothy, J.K., Sin, J. and Chris van Kessel. 2005. Efficiencey of Fertilizer Nitrogen in Cereal Production: Retrospects and Prospects. Advances in Agronomy 87:85-156.
11. Milkar, B-J., Suzana, P., Zdenkka, G., Millan, U. and Jasmina, Z. 2014. Assessing Tomato Drought Tolerance Based on Selection Indices. Ratar. Povrt (51):38-45
12. Bouslama, M. and Schapaugh, W.T. 1984. Stress tolerance in soybean. Part 1: evaluation of three
Energy forms (MJ-ha) Total Energy Input(MJ-ha) %Direct Energy 67,788.83 22.3
Indirect Energy 90,062.59 29.6
Renewable Energy 33,494.3 11Non-Renewable Energy 112,926.33 37.1
Cost and Return Component Value
Fruit Yield(kgha-1) 7,792Sale price( Nkg-1) 400
Residue yield (kgha-1) 1,844
Sale price (minor)(N kg-1) 15.0Gross value of production (N/ha)(fruits) 3,116,800
Gross value of production (N/ha) residue 27,660
Total gross value of production 3,140,460Total cost of production 1,503,168
Net return (S/ha-1) 1,641,292Benefit cost ratio 2.09

1
Globa
lJo
urna
lof
Scienc
eFr
ontie
rResea
rch
V
olum
eXVII
X Issue
er
sion
IV
IVYea
r20
17
© 2017 Global Journals Inc. (US)
61
( D)
Energy use Efficiency, Agronomic Efficiency, Economic Analysis, Residue Deposit, Nutrient Tolerance and Yield of Tomatoes under Limited and Optimal Fertilizer
screening techniques for heat and drought tolerance. Crope Science , 24:933-937.
13. Clarke, J.M., Depauw, R.M. and Townlley Smiith, T.F. 1992. Evaluation of methods of quantification of drought tolerance in wheat. Crope Science (32): 423-428
14. Dehghani, G.H., Malekshhi, F. and Alizadeh, B. 2009. A Study of Drought Tolerance Indices in Cauola (Brassicanapus L.) Genotype. Journal of Science and Technology of Agriculture and Natural Resources (13) 48:77-90
15. Ehdaie, B. and Shakiba, M.R. 1996. Relationship of inter node specific weight and water - soluable carbohydrate in wheat. Cereal Rea. Commun (24):61-67
16. Farshadfar, E. and Sutka, J. 2002. Multivariate analysis of drought tolerance in wheat substation line. Cereal Research Communication (31): 33-39.
17. Fernandez. G.C.J. 1992. Effective selection criteria for assessing plant stress tolerance.Proceedings of the International Symposium on Adaptation of Vegetables and other Food Crops in Temperature and Water Stress. Chapter 25, Taiwan.
18. Yuexian, L., Vibeke,L., Henning, H.I.and Henrick E.2004. Energy Use in Organic , Green and Conventional Peer Producing System- Cases from China. Journal of Sustainable Agriculture (34)6: 6345- 6351
19. Scott, H. 2003. Healing by Desgn: unlocking your body’s potential to heal itself. A STRANG COMPANY, 28pp
20. Kizilaslan, H. 2009. Input-Output energy analysis of Cherries production in Tokat Province of Turkey. Appl Energy(86):1354-8
21. Heidari, M.D and Omid, M. 2011. Energy Use Pattern and Economic Models of major greenhouse vegetable production in Iran. Energy(36): 220 -5
22. Shahan, S.A., Jafari, A., Mobli, H., Rafiee, S. and Karimi, M. 2008. Energy Use and economic analysis of wheat production in Iran: Acase study from Ardabil Province. Agricultural Technology (4): 77-78
23. Yilmaz, I., Akcaoz, H. and OzkN, B. 2005. An analysis of energy use and input costs for cotton production in Turkey. Renewable Energy(30): 145-155
24. Erdal, G., Erdal, H. and Gunduz, O. 2007. Energy Use and Economic Analysis of Sugar beet production in Tokat Province of Tirkey. Energy(32): 35-41

Global Journals Inc. (US)
Guidelines Handbook 2017
www.GlobalJournals.org