Embed Size (px)
Citation preview

Energy Use in Farm Buildings– A study of 16 farms with different enterprises
Revised and translated second edition
Swedish University of Agricultural SciencesFaculty of Landscape Planning, Horticulture and Agricultural Science
Report 2008:8ISSN 1654-5427ISBN 978-91-85911-76-9Alnarp 2008
LANDSCAPE HORTICULTURE AGRICULTURE
Repor tser ies
Torsten Hörndahl

The original title:
Energiförbrukning i jordbrukets driftsbyggnader - en kartläggning av 16 gårdar med olika driftsinriktning
Rapport 145
'Translation by Mary McAfee, 2008.

FOREWORD
Swedish agriculture used an estimated 3.7 TWh in the form of electricity, heating and diesel oil in the year 2005. Of this, an estimated 34% was used within animal production. This value includes manure spreading but not the energy used for harvesting of forage, grain and straw. The majority (appr. 63%) of the energy used was in the form of electricity. These estimates are mainly based on data from an investigation carried out in 1982-1984 by Nilsson & Påhlstorp (1985). Much of the technology available at that time is still being used on farms with a comparable structure, but new technology has also been introduced. However, the major change that has occurred is that herd size has increased.
The aim of this project was to complement the results of the above-mentioned investigation with data on the energy consumption of more recent technology. During the course of the project the topic became increasingly relevant and it was therefore decided to report the results in English in order to make the material available to a wider audience. The data presented have also been reworked in later projects that evaluate the effects of various energy saving measures.
The investigation was carried out by MAgSc Torsten Hörndahl, with the financial support of the Swedish Foundation for Agricultural Research, the Swedish Energy Authority and the energy supplier E.ON-elnät Sverige AB.
Local electrical contractors were a great help in connecting up electricity meters. Through consultation and great flexibility, they minimised the amount of inevitable disruption meter installation caused on farms.
Sincere thanks to all the farmers and farm personnel who made this investigation possible through making their enterprises available and through recording and reporting empirical data.
The investigation was performed between June 2005 and September 2006 and was presented in a report in Swedish in 2007. This English version of that report has been complemented with facts on Swedish animal husbandry and on the climate in the region during the measurement period.
Alnarp November 2008
Christer Nilsson
Professor


TABLE OF CONTENTS
SUMMARY 3
1 INTRODUCTION 5 1.1 Study sites, parameters and terminology 5 1.2 Swedish agriculture – an overview 6
2 REVIEW OF THE LITERATURE 9 2.1 Milk production 10 2.2 Beef production 10 2.3 Pig production 10 2.4 Egg production 11 2.5 Broiler chickens 11 2.6 Grain drying 11 2.7 Manure handling 12 2.8 Ventilation 13 2.9 Lighting 14 2.10 Feeding 15 2.10.1 Beef and dairy animals 15 2.10.2 Pigs 16 2.10.3 Feed preparation 16 2.11 Staffroom 17 2.12 Heating 17 2.13 Milking 18 2.14 Egg packing 19 2.15 Miscellaneous 19
3 MATERIALS AND METHODS 20 3.1 Equipment in dairy enterprises 21 3.2 Equipment in pig enterprises 22 3.3 Egg producers 23 3.4 Broiler chickens 23 3.5 Grain dryers 24 3.6 Equipment for energy measurement 24 3.7 Equipment for power measurement 25
4 RESULTS AND DISCUSSION 26 4.1 Dairy cows 26 4.2 Pig production 31 4.3 Laying hens 34 4.4 Broiler chickens 36 4.5 Grain drying equipment 38
5 REFERENCES 40
APPENDIX 1-6

- 3 -
SUMMARY In Sweden, the agricultural sector uses an estimated 3.7 TWh per year as electricity or fuel. About 34% of this total is estimated to be used in the production of beef, pork, eggs and milk, including the spreading of manure. Some energy is also used for harvesting ley and cereals as feed, which is not included. Most of the energy used is in the form of electricity (approx 63%). All these estimates are based on a 1981-1984 survey by Nilsson & Påhlstorp (1985). Most of the technical equipment is still the same today on farms of comparable size and production methods. However, herds of pigs and cattle are larger now, and therefore new equipment is being used.
The average Swedish dairy farm is 39% larger (49 cows) than the EU-15 average (35.5 cows) and herd size is growing rapidly. The climate in winter at the study farms is not as cold as that in central Europe or northern Sweden, although air temperature was below 0ºC for about 3 months in 2006 (average -0.1ºC, Dec-Feb.) In the period June-August, the average temperature was 17.8ºC in 2005 and 19.1ºC in 2006. It only exceeded 30ºC for a period longer than three hours on seven occasions.
Because of the climate, it is necessary to have artificial heating in buildings for sows (farrowing section). In all other buildings the animals produce enough heat themselves to keep the house warm. When breeding cattle or dry sows some farmers accept a low inside temperature.
Swedish animal welfare legislation requires more space per animal than most other countries. Slatted floors in lying areas are only permissible for fattening steers. Cages for laying hens have to include a sand-bath, nest and perches. Another difference is that sows can only be kept in crates occasionally and can never be tied up.
The purpose of this study was to collect data on energy use on modern farms of a size and with a level of technical equipment that could be expected to be in use for the next 10-15 years. The data obtained were then added to data from Nilsson & Påhlstorp (1985).The survey was conducted on 16 farms with buildings mainly constructed during the past 10 years and with modern equipment. All these farms except one were in the south of Sweden (Skåne, Halland, Lat. 55-56ºN) and the last one 180 km south-east of Stockholm (Lat. 58ºN). The study was structured as follows:
- Four complete dairy farms were studied in detail and another three were studied because they had interesting technical equipment that was not installed on the first four farms.
- Three farms with pigs were studied. One had an FTS-system (Farrowing To Slaughter in the same pen), one a farrowing-growing system (Farrowing to approx. 25 kg/11 weeks in the same pen), and one had fattening pigs (approx. 25-110 kg).
- Two farms with laying hens were studied. One had furnished cages and the other had laying hens on floors.
- Two broiler houses were studied.
- Four different types of grain dryers were studied: batch drier, circulating batch drier, continuous drier and batch-in-bin drier with multiple stirring augers.

- 4 -
To measure electricity use, electricity meters of the type used by power companies were installed. These meters distinguishing between feeding, ventilation, light, manure handling and, for some plants, cleaning/disinfection, heating, milking and packing of eggs. When all these were measured there was still some more electricity that was impossible to measure or to distribute to the right category. This was categorised as Miscellaneous. Meters were also installed for estimating the power (W) used at one piglet farm and at two dairy farms.
The data were processed and are included in the appendices in order to allow estimations to be made for other farms and evaluations to reduce the use of energy (power).
In milk production, energy use was between 930 and 1540 kWh/cow per year (0.125-0.203 kWh/L milk). The functions that used most energy were milking and feeding, which together used 65-75% of total energy. On farms that used a wheel loader and tractor for mixing Total Mixed Ration (TMR), energy consumption was higher than on those farms that used electrical engines for mixing. One litre of diesel was set to 9.8 kWh.
Production of piglets (approx. 25 kg) used 689 kWh/sow per year, which means about 28.7 kWh/25 kg pig (assuming 24 piglets/sow & year). During the fattening period (25-110 kg), energy use was 20 kWh per pig. The total energy requirement to produce finishing pigs from birth to 110 kg was thus 48.7 kWh/110 kg pig or 1163 kWh/sow per year, assuming a sow produces 24 piglets per year. This can be compared with the FTS-system, which uses 2431 kWh/sow per year. This difference is not completely caused by different breeding systems but is more likely to be due to difference in buildings, and therefore to a greater need for energy for lighting and ventilation, and a higher temperature in the farrowing unit. The farm that used less energy heated the breeding areas with a heat-pump, while another used diesel as fuel. Most energy was used for heating (including the use of heat lamps). If the building for dry sows needs mechanical ventilation and artificial light, then this leads to a greater use of energy.
Egg production with laying hens in furnished cages used 3.1 kWh/year per hen, while a system with free hens used 5.0 kWh/year per hen. Light and ventilation fans used most energy, but were also the functions that showed the greatest differences between the systems. The difference in energy used for light is most probably due to the higher light intensity and to the two extra hours of light each day in the system with free layers.
In broiler production, the largest use of energy was heating (84%), followed by light (10.7%) and ventilation (3.6%). The energy needed to produce one broiler (1.5 kg) was an estimated 0.91 kWh. This value is an average of five batches due to large variations between batches. The use of electricity differed from 6% to 20% between similar houses.
All the grain driers except the batch-in-bin drier used between 4.2 and 9.1 kWh per 1000 kg of grain during 2005 and 2006. Due to bad weather conditions the use of energy was 30% higher in 2006. The batch-in-bin dryer used 12.0 kWh per 1000 kg of grain 2006. Due to different technical standards the values are not directly comparable, but the data are valid for the separate functions.

- 5 -
1 INTRODUCTION
1.1 Study sites, parameters and terminology
Swedish agriculture uses approximately 7.9 TWh per year in its production (Edström et al., 2006). Just over half of this (4.2 TWh/yr) consists of indirect consumption, i.e. transport, manufacturing of inputs and consumables, etc. The largest single item is manufacturing of artificial fertiliser, which amounts to 2.7 TWh/yr. Direct use in the form of electricity, heating oil and diesel makes up 3.7 TWh per year, subdivided as shown in Figure 1, with 34% used directly in animal production. However, a large proportion of the cereals and forage produced are also used at a later stage for animals.
Figure 1. Subdivision of energy consumption in Swedish agriculture (recalculated after Edström et al. (2006).
Edström et al. (2006) estimate that the main animal production enterprises (milk, eggs and meat from poultry, pigs and cattle) use 1.29 TWh/yr. Thirty per cent of this is in the form of diesel, which is mainly used for on-farm transport, including handling and spreading of farmyard manure. Seven per cent is used as heating oil in pig and poultry meat production. The remainder is electricity (63%), which is used in increasingly mechanised and automated agriculture. A small proportion is used for heating.
The above estimate is based on a study by Nilsson & Påhlstorp (1985), in which actual energy consumption was measured on 19 farms during a 12-month period. Much of the technology that was in use at that time is still being used on farms with comparable structure. The exception is battery cages for laying hens, which are now banned. During the recording (study) period, the size of the average dairy herd
Ley and green forage14%
Meat production15%
Egg production1%
Irrigation1%
Other crops & fallow8%
Milk production16%
Spreading manure2%
Cereals43%

- 6 -
increased from 18 cows in 1985 to 49 cows in 2005, with the greatest increase occurring in the largest herds. SCB (2007) report that the number of herds with more than 74 dairy cows increased from 385 in 1990 to 1123 in 2005. A similar trend exists for other farm animals.
This structural change has brought about the introduction of new technology, such
as TMR-mixers for cows, milking robots and equipment for liquid feeding to pigs. So-called natural ventilation has also begun to be used to a greater extent. Advances in animal breeding and rearing have also led to an increase in production per animal, which means e.g. that more feed and manure have to be transported. The equipment used in Swedish animal husbandry is the same as in other countries with similar herd size and climate.
The aim of this investigation was to complement the study by Nilsson & Påhlstorp (1985) with data on energy consumption with respect to technology that has come into use since 1985. Reworked data from the above study and other sources are presented in appendices to this report, which can therefore be used to determine key values for a comparison of total energy use at farm level.
Measurements were carried out in buildings that were constructed in the past 15
years and that have dimensions and equipment that can be expected to be relevant for the coming 10-15 years. In order to prevent the measurements being too fractured, only installations that require large amounts of energy were included. Against this background, no measurements were made in houses for beef cattle production.
To obtain an estimate of the amount of energy used in grain handling in addition to heat for warming the drying air, the electrical appliances were studied. The most common types of dryer were represented, i.e. continuous dryer, batch dryer, circulating batch dryer and batch-in bin dryer.
In a strictly physical sense, energy cannot be consumed but simply converted to other forms. With this thermodynamic approach it is therefore incorrect to use words such as ‘consumption’ in relation to energy. A better choice of words would probably be ‘use’ or ‘conversion’. In common parlance (even among professionals) ‘energy consumption’ is used to describe how electrical energy is used or how diesel is combusted. Therefore in this report, the concepts ‘energy consumption’ and ‘energy use’ are used synonymously.
1.2 Swedish agriculture – an overview
In 1985, there were 37 930 farm businesses reporting a minimum of 1699 labour hours in Sweden, but by 2005 the number had decreased to 21 944. The total number of animals has also decreased since 1985, particularly the number of dairy cows, although this has partly been compensated for by an increase in the number of beef animals. The statistics also show that the average size of the Swedish dairy cow herd (Table 1) was 49 in 2005, which is somewhat over the EU-15 average (35.5 cows) and greatly over the EU-25 average (15.3 cows). The corresponding data are lacking in the case of pigs and laying hens (SCB, 1987; SCB 2007).
- 7 -
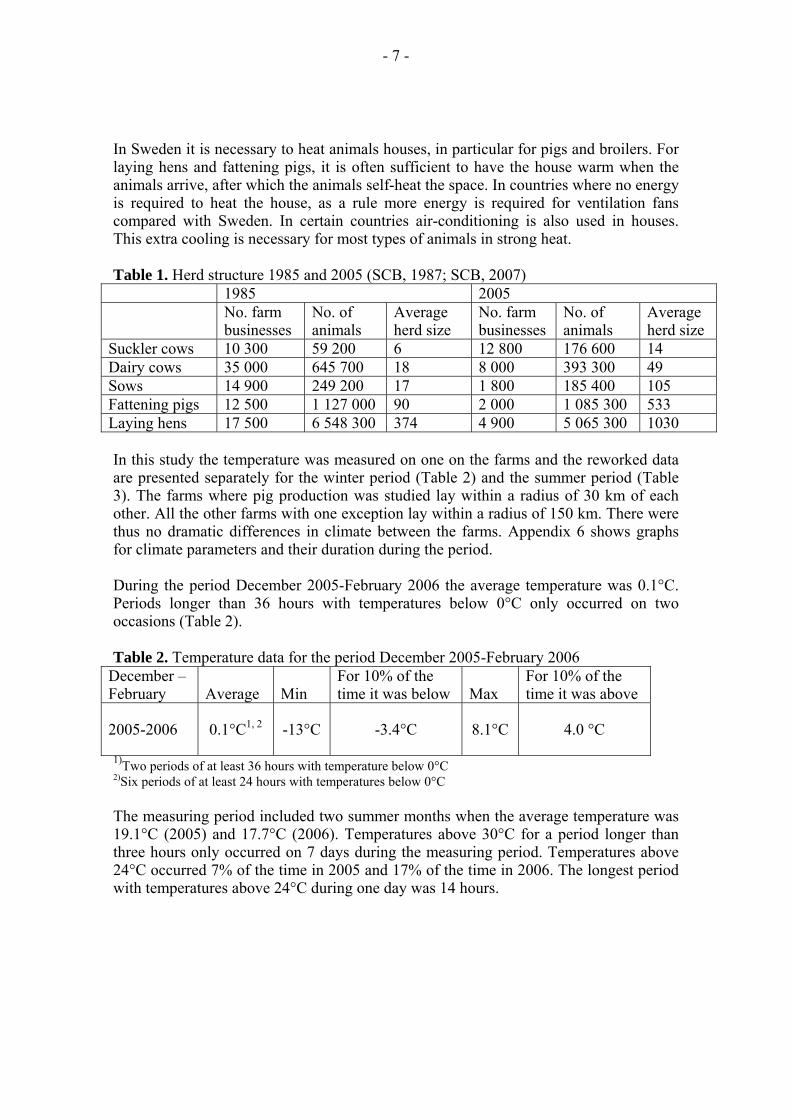
In Sweden it is necessary to heat animals houses, in particular for pigs and broilers. For laying hens and fattening pigs, it is often sufficient to have the house warm when the animals arrive, after which the animals self-heat the space. In countries where no energy is required to heat the house, as a rule more energy is required for ventilation fans compared with Sweden. In certain countries air-conditioning is also used in houses. This extra cooling is necessary for most types of animals in strong heat. Table 1. Herd structure 1985 and 2005 (SCB, 1987; SCB, 2007)
1985 2005 No. farm
businesses No. of animals
Average herd size
No. farm businesses
No. of animals
Average herd size
Suckler cows 10 300 59 200 6 12 800 176 600 14 Dairy cows 35 000 645 700 18 8 000 393 300 49 Sows 14 900 249 200 17 1 800 185 400 105 Fattening pigs 12 500 1 127 000 90 2 000 1 085 300 533 Laying hens 17 500 6 548 300 374 4 900 5 065 300 1030 In this study the temperature was measured on one on the farms and the reworked data are presented separately for the winter period (Table 2) and the summer period (Table 3). The farms where pig production was studied lay within a radius of 30 km of each other. All the other farms with one exception lay within a radius of 150 km. There were thus no dramatic differences in climate between the farms. Appendix 6 shows graphs for climate parameters and their duration during the period. During the period December 2005-February 2006 the average temperature was 0.1°C. Periods longer than 36 hours with temperatures below 0°C only occurred on two occasions (Table 2). Table 2. Temperature data for the period December 2005-February 2006
December – February Average Min
For 10% of the time it was below Max
For 10% of the time it was above
2005-2006 0.1°C1, 2 -13°C -3.4°C 8.1°C 4.0 °C
1)Two periods of at least 36 hours with temperature below 0°C 2)Six periods of at least 24 hours with temperatures below 0°C The measuring period included two summer months when the average temperature was 19.1°C (2005) and 17.7°C (2006). Temperatures above 30°C for a period longer than three hours only occurred on 7 days during the measuring period. Temperatures above 24°C occurred 7% of the time in 2005 and 17% of the time in 2006. The longest period with temperatures above 24°C during one day was 14 hours.

- 8 -
Table 3. Temperature data for the period June-August 2005 and June-August 2006
June - August Average Min For 10% of the time it was below Max
For 10% of the time it was above
2005 (92 days) 19.1°C 1) 4.4°C 12.7°C 33.1°C 26.7°C 2006 (83 days) 17.8°C 2) 6.2°C 12.2°C 33.0°C 23.1°C 1)Two periods of at least 3 hours with temperatures above 30°C, 2005 2)Five periods of at least 3 hours with temperatures above 30°C, 2006 Due to the colder climate, many cattle houses and all houses for pigs and poultry are insulated. A common U-value for walls, ceiling and floor is 0.22-0.35 W/m2 and °C. This means that only pig houses need to be continually heated with an external heat source for long periods. The same applies to offices and staffrooms (Nilsson & Påhlstorp, 1985). Losses of heat energy primarily occur through the house having to be ventilated so that the relative humidity does not exceed 80% or the CO2 content does not exceed 3000 ppm. These are statutory limits. Losses through walls, ceiling and floor are in many cases negligible. Swedish animal protection legislation demands that animals be allocated a greater floor space (m2/animal) than most other countries. Furthermore, the law does not allow slatted lying areas except for fattening steers in insulated buildings. Another difference is that cages for laying hens have to include a sand-bath, nest and perches. As regards pig production, an important difference is that sows can only be kept in crates occasionally and can never be tied (DFS, 2007:5). Drawings of Swedish animal houses are published in a series of reports on systems solutions for agricultural buildings (Johansson & Persson, 1979; Johansson et al., 1982; Olsson et al., 1993; Ascard, 2004; Olsson & Ascard, 2007). In the case of dairy cow houses, drawings are displayed at www.jbt.slu.se/kostallplan. In regions that are warmer than Sweden, forage production areas have to be irrigated. In these low rainfall regions, energy for irrigation is generally included as a part of energy consumption for milk production (Nieto, 2008). Since rainfall in Sweden is normally sufficient to give good yields, this parameter is not included in this report.

- 9 -
2 REVIEW OF THE LITERATURE Technical equipment uses fuel in proportion to the power rating and the efficiency of the power source and the operating time of the equipment. A simple way to estimate the energy consumption is to record these values (kW and hours) and multiply one by the other. This gives the energy in kWh, which can then be compared with actual consumption (Jonsson, 2006). This method gives a very rough estimate but at the same time it shows that even functions with a low effect use a lot of energy when operated for a long time.
In terms of energy use, the efficiency, i.e. the amount of work done in relation to the energy supplied, is of central importance. Electric engines have the highest efficiency (60-95%). These engines have their best efficiency at high load (near max. power) and large power rating. The opposite is true for engines that produce low output or run at low load. For the engine sizes that are common in agriculture (0.5-7.5 kW), the efficiency is 70-88% (BEVI, 2006).
Diesel engines have different efficiency depending on how heavily they are loaded but 32-40% is generally reported (Myhrman et al., 1993). They have their lowest efficiency at low load. The most efficient way of using a fuel source is through electric or diesel engines running at near max. power. For a heating boiler fuelled with oil the mean annual efficiency is ~85%, while if it is run on electricity it is 90-95% (Konsumentverket, 2007b).
When it comes to heating of buildings, it is not as easy to estimate energy consumption on the basis of specified data because a range of factors are involved (Warfvinge, 1996; Svedinger, 1995). The most important of these are: - the difference between indoor and outdoor temperature - how well insulated the building is - the surface in contact with the outdoor climate (walls, floor, roof) - ventilation so as not to exceed the upper limits for CO2 and RH.
Theoretically, it is not particularly complicated to estimate the energy/power requirement for given conditions. However, relatively advanced mathematical models are required to estimate the energy consumption for heating with good accuracy. Such a model must take account of e.g. the position of the building (geographical) and its orientation (amount of walls/windows facing different directions). Other important factors include the local climate arising due to neighbouring buildings and vegetation and how exposed the building is to wind. There are simple models available for estimating the energy requirement for residential houses. The Swedish Consumer Agency (Konsumentverket, 2007a) has one such model on its website in which different energy saving measures can be compared. Using this model, it can be shown that the energy requirement for heating a 150 m2 single-storey detached house varies between 9 000 and 15 800 kWh/yr depending on whether is situated in Malmö (southern Sweden, Lat. 55ºN) or Luleå (northern Sweden, Lat. 65ºN). This type of calculation programme is not available for farm buildings. For designing power requirement in these buildings SS-EN ISO 15927-5:2005 is used.

- 10 -
Fans, lighting and engines to drive various functions operate similarly regardless of animal type and therefore each function is presented separately in this chapter instead of functions being compiled on the basis of animal type. Since the floor plan depends on the type of production enterprise for which it is designed, the units used are kWh/animal place, kWh/pen or similar. This report can be seen as a complement to the inventory carried out by Nilsson & Påhlstorp (1985), since few investigations have been added later. Therefore the following generally follows the structure of the above-mentioned report, complemented with new information where applicable.
2.1 Milk production
The annual energy consumption in milk production was determined by Nilsson & Påhlstorp (1985) to be between 409 and 988 kWh/dairy cow, which is equivalent to 0.06-0.14 kWh/kg milk. This includes both dairy cows and followers. On some of the farms a certain amount of energy is used for heating. Allocations of variable costs use 860 kWh for dairy cows with followers without any adjustment for milk production. Converted to kWh/kg milk, this would amount to 0.08-0.12 kWh/kg milk (Hushållningssällskapet, 2003).
2.2 Beef production
The annual energy consumption in production of concentrate-fed bulls to 220 kg slaughter weight was determined by Nilsson & Påhlstorp (1985) as 63 kWh/animal place. The corresponding figure for forage-fed bulls was 92 kWh/animal place and year. The values presented in Table 4 are used in allocation of variable costs (Hushållningssällskapet, 2003). Table 4. Estimated energy consumption according to Hushållningssällskapet (2003)
Production Energy consumption, kWh/animal & year
Concentrate-fed bulls, 280 kg slaughter weight, age 14.5 months 138
Young bulls, 285 kg slaughter weight, age 16 months 199
Steers, 280 kg slaughter weight, age 25 months 136
2.3 Pig production
Annual energy consumption in piglet production was determined by Nilsson & Påhlstorp (1985) to be 589-699 kWh/animal place including heating. In production of
- 11 -
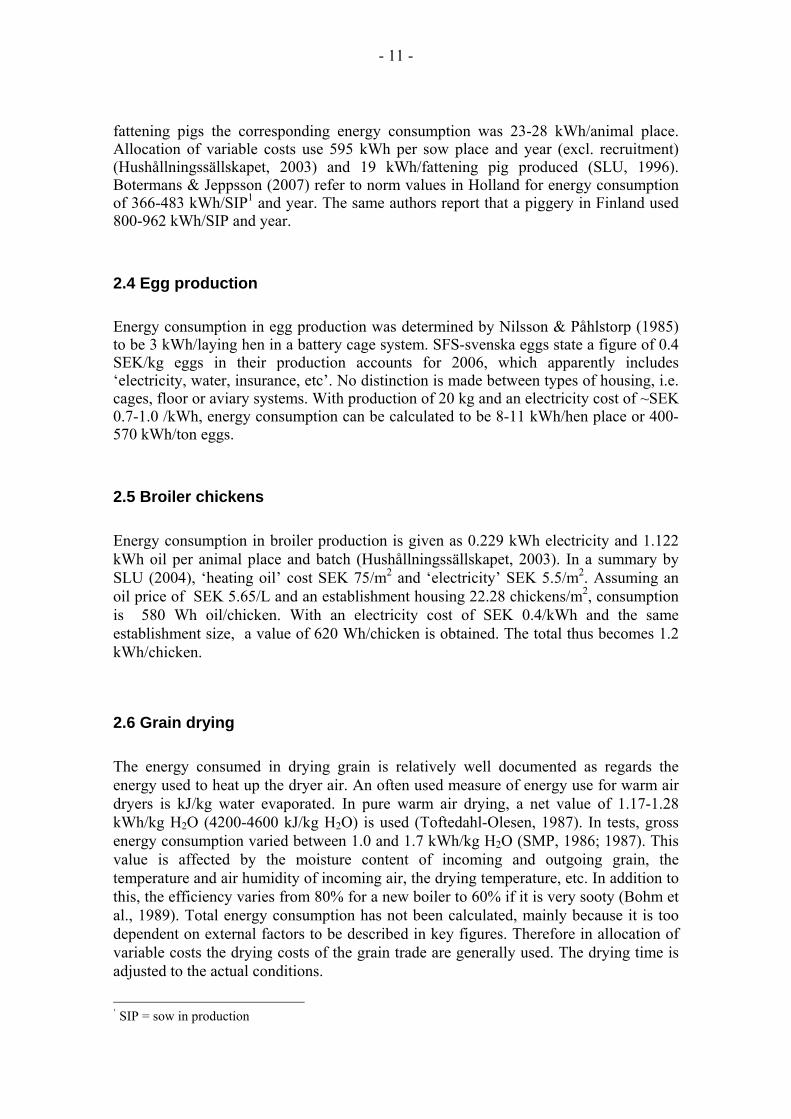
fattening pigs the corresponding energy consumption was 23-28 kWh/animal place. Allocation of variable costs use 595 kWh per sow place and year (excl. recruitment) (Hushållningssällskapet, 2003) and 19 kWh/fattening pig produced (SLU, 1996). Botermans & Jeppsson (2007) refer to norm values in Holland for energy consumption of 366-483 kWh/SIP1 and year. The same authors report that a piggery in Finland used 800-962 kWh/SIP and year.
2.4 Egg production
Energy consumption in egg production was determined by Nilsson & Påhlstorp (1985) to be 3 kWh/laying hen in a battery cage system. SFS-svenska eggs state a figure of 0.4 SEK/kg eggs in their production accounts for 2006, which apparently includes ‘electricity, water, insurance, etc’. No distinction is made between types of housing, i.e. cages, floor or aviary systems. With production of 20 kg and an electricity cost of ~SEK 0.7-1.0 /kWh, energy consumption can be calculated to be 8-11 kWh/hen place or 400-570 kWh/ton eggs.
2.5 Broiler chickens
Energy consumption in broiler production is given as 0.229 kWh electricity and 1.122 kWh oil per animal place and batch (Hushållningssällskapet, 2003). In a summary by SLU (2004), ‘heating oil’ cost SEK 75/m2 and ‘electricity’ SEK 5.5/m2. Assuming an oil price of SEK 5.65/L and an establishment housing 22.28 chickens/m2, consumption is 580 Wh oil/chicken. With an electricity cost of SEK 0.4/kWh and the same establishment size, a value of 620 Wh/chicken is obtained. The total thus becomes 1.2 kWh/chicken.
2.6 Grain drying
The energy consumed in drying grain is relatively well documented as regards the energy used to heat up the dryer air. An often used measure of energy use for warm air dryers is kJ/kg water evaporated. In pure warm air drying, a net value of 1.17-1.28 kWh/kg H2O (4200-4600 kJ/kg H2O) is used (Toftedahl-Olesen, 1987). In tests, gross energy consumption varied between 1.0 and 1.7 kWh/kg H2O (SMP, 1986; 1987). This value is affected by the moisture content of incoming and outgoing grain, the temperature and air humidity of incoming air, the drying temperature, etc. In addition to this, the efficiency varies from 80% for a new boiler to 60% if it is very sooty (Bohm et al., 1989). Total energy consumption has not been calculated, mainly because it is too dependent on external factors to be described in key figures. Therefore in allocation of variable costs the drying costs of the grain trade are generally used. The drying time is adjusted to the actual conditions.
‘ SIP = sow in production

- 12 -
Electrical energy for fans has been found to be 0.06-0.10 kWh/kg H2O in a ‘double dryer’ (SMP, 1986), or 4.2-8.4 kWh/ton. This was based on an initial water content of 17-24%. For a circulating batch dryer the value obtained was 0.07-0.09 kWh/kg H2O (6.5-10.4 kWh/ton dry grain), but this value also included elevators (SMP,1987) and the measurements were made for an initial water content of 21-24%. Nilsson & Påhlstorp (1985) report the use of 9.63 kWh/ton (0.13 kWh/kg H2O) on a farm handling 545 tons of grain. Another farm used 23 kWh/ton (0.33 kWh/kg H2O) but it only handled 184 tons. By recalculating data presented by Ekström (1972), it appears that he estimated electrical energy consumption at 16-23 kWh/ton grain for warm air drying and 41-49 kWh/ton grain for cold air drying for grain dried from 22% water content.
For cold air drying, energy is only used to run the fan. A fan uses 0.27-0.5 kWh/1000 m3 air according to SMP (1985). Assuming that the air carries 0.5-1 g water/m3 air, this would mean a requirement of 0.27-1.0 kWh/kg H2O. Another assumption can be that 50 kg H2O/ton is dried off (20%→15.8%), which would mean a requirement of 13.5-50 kWh/ton. This huge difference can be due to the starting and final water content used in the calculations.
There is another type of dryer (batch-in-bin dryer) where the grain is stored in the bin but is dried with air pre-heated to 35-40°C before being blown in. In order to achieve uniform drying, the grain is mixed with vertical augers. Westin (2004) discovered that 1.61 kWh/kg H2O is used to heat the air in this type of dryer. He also estimated consumption of electrical energy for the fan to be 0.077 kWh/kg H2O and for the stirrers 0.04 kWh/kg H2O.
2.7 Manure handling
The most common type of manure removal system is electric-powered, where a scraper or sled is drawn along the slurry channel and carries the manure to a culvert, which conducts it into the slurry tank. A common type in tied-stall houses is flap scrapers, which make short strokes that move the manure a short distance each time they move forward. This method can also be used in alleys for cattle, in which case it is often driven by a hydraulic piston. Another type is the sled scraper, which runs from one end of the gutter/alley to the other in a single stroke. It is dragged/driven by a wire, rope or chain. The scraper/sled itself and its speed vary in form depending on whether it is used in a gutter or an alley. There is also a system with scrapers on a continuous chain. SMP (1978) tested several types but only measured power requirement and operating time. Table 5 shows a summary of the power requirement of the various manure removal equipment tested, including hydraulically driven scrapers (SMP, 1982). It indicates that the sled scraper requires less power than the flap scraper, results confirmed by Nilsson & Påhlstorp (1985), see Appendix 1-3. The continuous chain system required the most power but was also the longest of the systems tested.

- 13 -
Table 5. Test data on manure handling systems according to SMP (1978; 1982)
Production Operating time min/day
Power requirement
kW
Sled scraper, chain, pigs, 52 m gutter 3.5-4 1.4-1.7
Flap scraper, chain, pigs, 52 m gutter channel 7-8 1.3
Continuous chain with scrapers, beef animals, 120-124 m chain incl. 10-11 m elevator
20 3.6-5.0
Hydraulically powered, flap scrapers in channels (32 beef animals) incl. collection culvert and transport to manure storage with a piston.
44 3.01)
1) (motor output)
As regards slurry pumps, tests (SMP, 1979) show that the energy requirement under normal conditions should be 0.07-0.84 kWh/m3. The higher value refers to pumps with greater flow. When pipe dimensions are the same for the pumps, the higher value is an example of how much greater the flow losses are when the speed increases.
Houses for laying hens often have conveyor belts that collect the manure and transport it to the collection culvert/transport belt or similar. However, results from measurements in this type of system are not available to date.
2.8 Ventilation
There are two main principles used to ventilate buildings. One involves the use of fans (mechanical ventilation) and the other uses natural driving forces to replace the air in the animal house. The latter is used to a greater extent in houses for beef animals, dry sows and other animals with moderate requirements for a uniform temperature and small air movements in winter-time. The only energy used is to control inlets in walls and ridge. Houses for other types of animals are usually ventilated with fans, which require more energy.
Danish studies (Pedersen & Jensen, 1998) have shown that the design and location of the fan is very important for energy consumption in relation to the amount of air expelled. A normal value for this is 0.043-0.046 Wh/m3. Great differences have also been observed between the efficiency of different fans. Pedersen & Hinge (2002) have defined the criteria that must be fulfilled for a fan to be ‘energy-efficient’. They specify that the fan, working at designed static pressure, must have an efficiency of at least 78% for motor sizes between 0.5-1.0 kW, which is a common motor size for fans used in
- 14 -
farm buildings. This should be applicable when it comes to comparing different fans with each other but cannot be used to estimate consumption in an animal house.
Mechanical ventilation can be provided using only extractor fans which give a negative pressure in the building, a system called exhaust ventilation. Another type, called balanced ventilation, uses fans both for inlets and exhaust. The pressure in the building is almost neutral or slightly negative (1-2 Pa). Balanced ventilation uses twice as much energy as exhaust ventilation since it has twice as many fans. The system changing the amount of air expelled is also very important for the energy used. The best system is varying the speed of the fans by frequency control. The worst is only using a throttle and having the fan motors running at full revs all the time. Other ways of change the revs of the fans are voltage regulators such as thyristors or transformers (Pedersen & Hinge, 2002). In a computer-based advisory programme, frequency-controlled ventilation gives a saving of 48% (Landcentret, 2007).
The task of the ventilation system is to remove moisture and gases from the animal house in order to provide a good environment for the animals. The air extracted must therefore be replaced with new external air, which in turn must be warmed up. Replacing the air more often than is absolutely necessary markedly increases the energy consumption. For example if the relative humidity (RH) is lowered from 75% to 65% in a sow house with 60 SIP, the energy use increases from 75 kWh/SIP and year to 286 kWh/SIP and year. Although this energy comes from the heating system, the increase is caused by the ventilation system removing too much air from the house (Nilsson & Sällvik, 1977). See also Section 2.12 Heating.
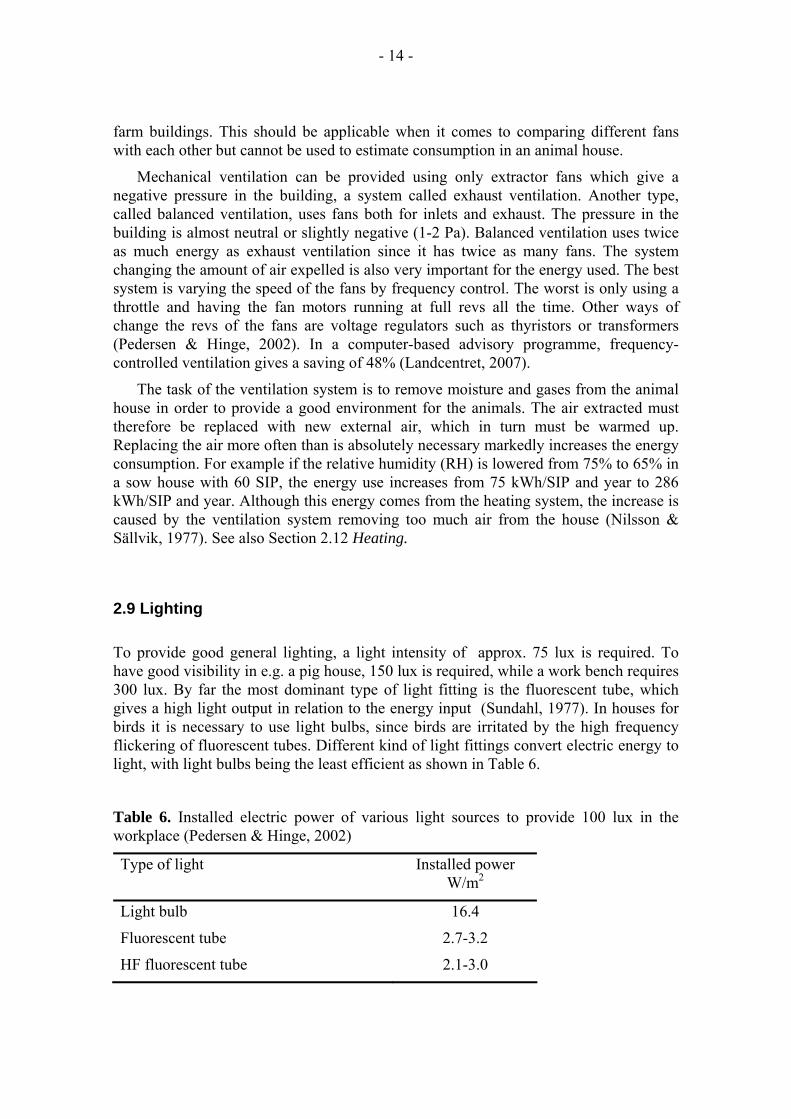
2.9 Lighting
To provide good general lighting, a light intensity of approx. 75 lux is required. To have good visibility in e.g. a pig house, 150 lux is required, while a work bench requires 300 lux. By far the most dominant type of light fitting is the fluorescent tube, which gives a high light output in relation to the energy input (Sundahl, 1977). In houses for birds it is necessary to use light bulbs, since birds are irritated by the high frequency flickering of fluorescent tubes. Different kind of light fittings convert electric energy to light, with light bulbs being the least efficient as shown in Table 6.
Table 6. Installed electric power of various light sources to provide 100 lux in the workplace (Pedersen & Hinge, 2002)
Type of light Installed power W/m2
Light bulb 16.4
Fluorescent tube 2.7-3.2
HF fluorescent tube 2.1-3.0

- 15 -
As mentioned above, energy consumption is affected by the power consumption of the actual lighting equipment installed (installed power) and the operating time. Nilsson & Påhlstorp (1985) observed large differences in installed electric power for lighting of 25-69 W/cow place and 13-54 W/SIP, which led to a large range of energy use of 57-183 kWh/cow place and year and 38-135 kWh/SIP and year, see Appendix 1-3. However there is a distinct correlation between low installed power and low energy use per year.
2.10 Feeding
The equipment required to feed animals differs greatly depending on feeding strategy and type of animal. In the case of poultry, the equipment is relatively similar, although the feeding point can vary. A chain in a trough is often used for laying hens and a pan filled with an auger is used to feed broiler chickens. Nilsson & Påhlstorp (1985) reported that an establishment with 10 500 laying hens in cages had an energy consumption of 92 Wh/animal place and year. The feeding system was not described.
2.10.1 Beef and dairy animals
Beef animals are fed with both forage (hay or silage) and concentrate (grain, etc.). Silage can vary greatly in DM content and this determines the mass that must be handled. Since different amounts of energy are used to transport the same amount of nutrients, this gives a wide variation in the energy requirement for silage handling. In hay the DM content is more constant and the fodder is often handled manually, which means that there is a lack of data in this area.
When Nilsson & Påhlstorp (1985) carried out their investigation, hay was still common and TMR (Total Mixed Ration) or PMR (Partly Mixed Ration) was only used to a very limited extent. In their investigation there was only one farm with automated forage handling and the value measured there was 51.8 kWh/cow place and year. Thus there is a lack of data on modern forage handling.
Today as a rule a mixture of forage and grain is fed, plus possibly some other feed. Mixing is carried out at feeding and the most common option is a mobile system where the mixer is mounted on a trailer (mixer wagon) and is powered by a tractor. The wagon is loaded by a wheel loader or tractor with front loader. There are other systems with stationary mixers where the feed is transported to the animals by an electric-powered feed wagon (rail mounted) or a belt feeder. There is also an option where a rail-mounted cart mixes the feed before delivering it (www.mullerp.com).
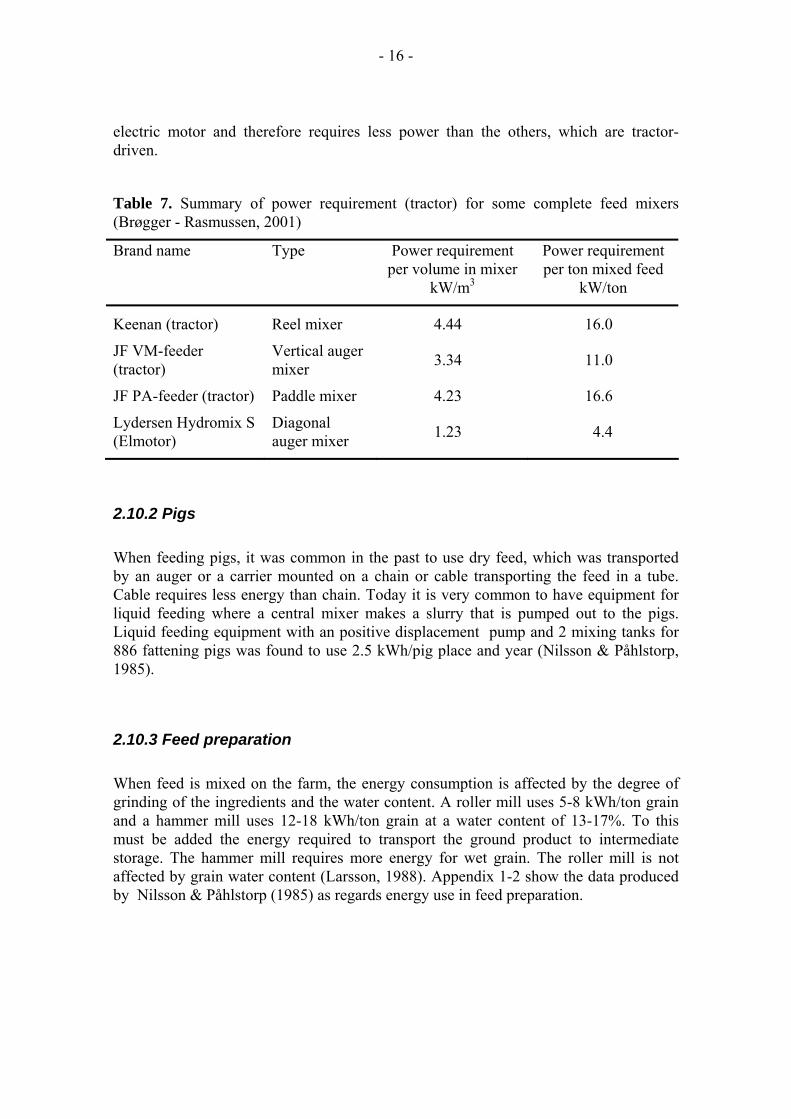
The most common types of mixers are reel mixers and vertical auger mixers, which describes the mixing member. There are also other types, e.g. paddle mixers and diagonal auger mixers. Table 7 summarises the recommended power for different types of trailed mixers. However, since the mixing time has a large impact it is difficult to rank them as regards energy use. Note also that the diagonal auger mixer uses an
- 16 -
electric motor and therefore requires less power than the others, which are tractor-driven.
Table 7. Summary of power requirement (tractor) for some complete feed mixers (Brøgger - Rasmussen, 2001)
Brand name Type Power requirement per volume in mixer
kW/m3
Power requirement per ton mixed feed
kW/ton
Keenan (tractor) Reel mixer 4.44 16.0
JF VM-feeder (tractor)
Vertical auger mixer 3.34 11.0
JF PA-feeder (tractor) Paddle mixer 4.23 16.6
Lydersen Hydromix S (Elmotor)
Diagonal auger mixer 1.23 4.4
2.10.2 Pigs
When feeding pigs, it was common in the past to use dry feed, which was transported by an auger or a carrier mounted on a chain or cable transporting the feed in a tube. Cable requires less energy than chain. Today it is very common to have equipment for liquid feeding where a central mixer makes a slurry that is pumped out to the pigs. Liquid feeding equipment with an positive displacement pump and 2 mixing tanks for 886 fattening pigs was found to use 2.5 kWh/pig place and year (Nilsson & Påhlstorp, 1985).
2.10.3 Feed preparation
When feed is mixed on the farm, the energy consumption is affected by the degree of grinding of the ingredients and the water content. A roller mill uses 5-8 kWh/ton grain and a hammer mill uses 12-18 kWh/ton grain at a water content of 13-17%. To this must be added the energy required to transport the ground product to intermediate storage. The hammer mill requires more energy for wet grain. The roller mill is not affected by grain water content (Larsson, 1988). Appendix 1-2 show the data produced by Nilsson & Påhlstorp (1985) as regards energy use in feed preparation.

- 17 -
2.11 Staffroom
An animal production farm that employs staff has to have a room where staff can change into their working clothes, wash and eat their food. The recommendations differ depending on the number of employees (AFS, 2000:42). Energy consumption is affected to a high degree by the number of people using the staffroom and the type of use. For certain pig and poultry producing establishments, staff and visitors have to shower and change their clothes on the way in and on the way out in order to decrease the risk of infection (Olsson et al., 1993). Such establishments require much more personal hygiene space than normal. No such establishment was reported in previous measurements. Table 8 shows some examples of values.
Table 8. Energy consumption in the staffroom of farm businesses with different specialisations (Nilsson & Påhlstorp, 1985)
Production Energy consumptionkWh/year
Piglet production, 11.5 m2, for 3 people. One person showers after every shift. 3 700
Piglet production, 11.5 m2, used by relief worker, for simple personal hygiene and as an office. 1 181
Fattening pig production, 16 m2, used by one employee, for simple personal hygiene and as an office. 6 556
Milk production, 29 m2, used by 1-4 people to varying degrees, excl. warm water. 8 016
Milk production, 14 m2, used by the family and one extra worker to varying degrees, and as an office. 1 815
Milk production, 10 m2 with sauna, used by the family and one extra worker to varying degrees, 5 392
Fattening beef production, 6 m2, simple personal hygiene. 1 206 Egg production, 19.5 m2, used for simple personal hygiene and as an office, excl. lighting (200 W). 1 364
2.12 Heating
It is mainly for production of broiler chickens and piglets that it is necessary to heat the animal house. In fattening pig production it is also necessary to dry out the house after cleaning and to provide a temperature of 16-18ºC when the pigs arrive in the pens. Heat lamps are available in both 150 and 250 W. They are primarily intended to provide

- 18 -
additional heat to attract the piglets away from the sow so that they are not harmed. This means that they are used even during the summer. The ventilation system, in addition to taking away the heat from the animals, must then also remove the heat from the heat lamps. There are different ways in which the power to the heat lamps can be decreased so that excess heat is reduced but they are not widely used. Danish guidelines for energy consumption specify 410 kWh/SIP and year, which does not differ greatly from Nilsson & Påhlstorp (1985), who recorded 410-505 kWh/SIP and year (incl. heat lamps). Table 9 gives some examples of the energy requirement for heating.
Table 9. Energy consumption for heating and heat lamps at farm businesses with different specialisations (1)Nilsson & Påhlstorp, 1985; 2)Nilsson & Sällvik, 1977). ap = animal place
Heating type Energy consumption
Heating, 80 SIP, 20,5 kW, S. Sweden Lat. 55ºN 197 kWh/SIP and year1)
Heat lamps, 80 SIP, 17x150W 213 kWh/SIP and year1)
Heating, 55 SIP, 11 kW, 140 km W Stockholm Lat. 59ºN 230 kWh/SIP and year1)
Heat lamps, 15x250 W, 55 SIP 275 kWh/SIP and year1)
Heating, 60-70 SIP, 120-200 km W Stockholm Lat. 59ºN 80-407 kWh/SIP and year2)
Heating 18 kW, 620 fattening pig, S Sweden, Lat. 56ºN 3.2 kWh/ap and year1)
Heating, 520-730 fattening pig places, Lat. 58ºN 1) 11-44 kWh/ap and year2)
Heating, calf pen for 15-20 animals, 30 km north of Stockholm. Lat. 59ºN 1100-1466 kWh/ap and year1)
Heating, calf pen for 6-9 animals, S. Sweden Lat 55º 125-187 kWh/ap and year1)
2.13 Milking
Before the introduction of robot milking, in Sweden the only distinction made was between tied-stall and loose housing. Nilsson & Påhlstorp (1985) concluded that total consumption amounted to 314-424 kWh/dairy cow and year. Converted to kWh/ton milk, the difference was even smaller, see Table 10. When the milking procedure is divided into milking, washing and cooling, large differences emerge, which may indicate that working practices can have a large impact. There is a lack of data on how much hot water is used for washing and other uses, e.g. feeding calves and personal hygiene.

- 19 -
Table 10. Energy consumption for milking (Nilsson & Påhlstorp, 1985)
Production Hot water kW/cow and year
Cooling kWh/cow and year
Milking kWh/cow and year
Total
Tied, 90 dairy cows 6800 kg milk
1451) 87 82 314 kWh/cow &year46 kWh/ton milk
Tied, 20 dairy cows, 6800 kg milk, 8 months
1141) 78 32 224 kWh/cow &year33 kWh/ton milk
Tied, 30 dairy cows, 7500 kg milk
2541) 105 65 424 kWh/cow &year46 kWh/ton milk
Loose, 35 dairy cows, 6200 kg milk
1501) 188 338 kWh/cow &year 54 kWh/ton milk
1)Values also include hot water used for feeding calves and other washing.
A Danish study (Brøgger-Rasmussen & Pedersen, 2004) showed that milking robots (n=21) use 15-83.5 kWh/ton milk, while milking parlours (n=3) use 19-38 kWh/ton milk. The study also showed that there were enormous differences between farms and pointed out that amount of milk (litres) per robot, amount of hot water and technical equipment all appeared to be very significant.
2.14 Egg packing
In egg handling, all packing equipment is based on the eggs arriving on a conveyor belt from the birds. The eggs are then sorted and placed in trays and transported further on to larger containers. This process can be automated to various degrees. Nilsson & Påhlstorp (1985) calculated that a house with 10 500 laying hens in cages used 38 Wh/hen for mechanical transport and manual sorting of the eggs. Cooling used 269 kWh/1000 birds. A small proportion of eggs are washed before packing. After this they are classed as lower quality and are handled separately. No data were found for such handling.
2.15 Miscellaneous
Some activities that take place in farm buildings cannot be classified under any of the headings above. Examples of these are repairs, water supply, house cleaning, outdoor lighting, etc. There is generally a lack on data on these but according to adjusted data from Nilsson & Påhlstorp (1985) they can amount to between 1-10% of total consumption on the farm. Appendix 1-3 show some examples of functions and their estimated energy consumption.

- 20 -
3 MATERIALS AND METHODS In consultation with the reference group, it was decided that this study would include at least four milk producers, three pig producers (of which one with an FTS system), two egg producers and two broiler producers, for which energy use in the entire animal production enterprise would be investigated. The study would also include energy consumption in grain dryers. The farms selected were located in the south of Sweden (Lat. 55º-56ºN) and one 150 km south-west of Stockholm (Lat. 58ºN). The focus in the study was on how new technology has affected energy consumption in these enterprises. When new technology was not present on the selected farms, it was studied on additional farms. Tables 11-13 show a summary of dairy, pig and poultry enterprises as regards size and scope of measurements.
Table 11. Summary of size and scope of measurements on farms with milk production, plus establishments where only certain functions were studied
Farm A Farm B Farm C Farm D Farm E1 E2, E3 150 cows 150 heif.
Milk parlour Clamp
silo
220 cows 220 heif.
Milk parlour
Clamp silo
120 cows 120 heif. 35 bulls
Milk-robot Tower silo
40 cows 140 heif.
Milk parlour Clamp
silo
106 cows Milk-robotClamp silo
100 cows Milk-robot
Dairy cows, lambs
All animals
Measure-
ments divided
into functions
All animals
Measure-
ments divided
into functions
All animals
Measure-
ments divided
into functions
Total consumpt.
All animals
Measure-
ments divided
into functions
60 cows
Milking Manure handling
Feeding
Power
measure-ment
Power measure-
ment

- 21 -
Table 12. Summary of size and scope of measurements on farms with pig production. SIP= Sow in production
Farm F Farm G Farm H
Fattening pig rearing Farrowing to slaughter (FTS)-system 96 SIP
Piglet rearing Farrowing-Growing system 0-25 kg in same pen 480 SIP
Fattening pigs 25-100 kg 1160 places
All animals Measurements divided into functions
All animals Measurements divided into functions
All animals Measurements divided into functions
Power measurement
Table 13. Summary of size and scope of measurements on farms with egg and broiler production
Farm J Farm K Farm L Farm M
40 000 laying hens Furnished cages
12 500 laying hens Free range system
100 000 broiler chickens in two sections
100 000 broiler chickens in two sections
All birds Measurements divided into functions
All birds Measurements divided into functions
All birds Measurements divided into functions
Only total consumption
On the farms, the functions were divided into Manure handling, Feeding, Ventilation, Lighting and, where appropriate, Washing, Milking and Egg packing. In all enterprises, there was additional consumption that could not be categorised under any of these headings and was thus listed under Miscellaneous. This included e.g. lighting and washing in areas outside the animal housing, repairs, etc. On the farms studied, the majority of the production took place in buildings brought into use after 1993 and most were less than five years old and used modern equipment.
3.1 Equipment in dairy enterprises
The equipment studied on the dairy farms is shown in Table 14. The animals were kept in a loose-house system. Two of the farms had slatted floors and gutter with sled for cleaning out the manure, while the others had alleys with scapers. Silage was stored in clamp silos on all farms except one, which had a tower silo. Unwinding of round bales

- 22 -
was studied on one farm with lamb production. All the farms had fluorescent tubes and the installed power for light was 15-26 W/animal. None of the enterprises had a separate staffroom so this could not be documented. The computer on the milking robot records the amount of milk produced (milked). This figure was used on farm E1 to calculate kWh/l milk and day. For other enterprises, the amount of milk delivered to the creamery was used. Table 14. Equipment studied in the dairy enterprises
Function Equipment
Milking - Milking robot Lely and DeLaval - Herringbone parlour, SAC and DeLaval
Manure handling - Scraper and sled driven by rope under slats and alleys - Hydraulic slurry scraper – alleys - Hydraulic-driven piston for transport from house to intermediate storage - Slurry pump to intermediate storage
Feeding - Tractor-powered mixer wagon - Electric-powered (Battery) mixer wagon, rail-borne, Mullerup (Mixfeeder) - Stationary mixer and electric-powered feed wagon - Belt feeder - Round bale unwinder
Ventilation - Natural ventilation, fixed air inlets - Natural ventilation, automatically controlled ridge & air inlets - Natural ventilation, inflatable walls (DeBoer) with automatic valve control - Mechanical ventilation, balanced type - Mechanical ventilation, exhaust type
Miscellaneous - Ceiling heating in milking parlour - Frost protection for drinking water in uninsulated house - Water
3.2 Equipment in pig enterprises
The equipment studied on the pig farms is shown in Table 15. One enterprise had piglet production with 480 sows in single pens. One enterprise had fully-integrated production with FTS pens (Farrowing to slaughter) for 96 sows. In one case there was an unheated loose-house and in another a heated loose-house for dry sows. The piglet producer with 480 sows sold his pigs of 20-30 kg to a specialist for fattening. He had pig production with three sections containing 400 fattening pigs each. All farms had fluorescent tube lighting. The power for lighting in the farrowing and FTS-section was 36 W/pen. In the fattening pig house it was 1.8 W/animal place (approx. 18 W/pen). Data on the number of animal places were obtained from farm staff.

- 23 -
Table 15. Equipment studied in the pig enterprises
Function Equipment
Manure handling - Sled driven by rope under slats - Sled driven by rope in alleys
Feeding - Liquid feed, Weda and Datamix
Ventilation - Mechanical ventilation, exhaust type - Natural ventilation, automatically controlled ridge & air inlets
Staffroom
Washing - Washing robot + rinsing
3.3 Egg producers
The equipment studied at the eggs producers is shown in Table 16. One enterprise had furnished cages and the other had free range hens in a multi-storey system. They had 40 000 and 12 500 hens respectively. Both enterprises had bulb lighting in the bird houses. The power was 0.46-0.48 W/animal place. Egg production was not recorded. Table 16. Equipment studied in the egg-producing enterprises
Function Equipment
Manure handling - Belt and hydraulic-driven piston - Belt - Manure dryer
Feeding - Dry feed in troughs
Ventilation Mechanical ventilation, exhaust type - 5 fans controlled in parallel - 13 fans of which 2 rev-controlled, other in steps
Egg packing - Packing machine without stacker - Packing machine with stacker
3.4 Broiler chickens
The houses studied were identical, with space for 100 000 chickens per batch. In one, measured energy consumption was subdivided into Lighting, Ventilation, Heating and Miscellaneous. In the other, only total consumption was recorded. Thanks to power supplier recordings, the total consumption of both houses could be monitored on an hourly basis.

- 24 -
3.5 Grain dryers
Four farms with different types of grain dryer were studied. No recording was made of oil consumption since this is dependent on incoming and outgoing water content and properties of the drying air. Only total grain quantity and total energy (electricity) consumption were recorded. On farms N and P (Table 17), ventilation and lighting are included. A summary is presented in Table 17.
Table 17. Description of grain dryers included in the investigation
Farm Type of dryer Description
N Continuous dryer, TORNUM Energy for dust reducing equipment, cooling and loading in and out included
Complete dryer with two outdoor silos (400 ton) with cooling, 400 ton in self-emptying bins and the rest in clamps. Three elevators and chain conveyors to and from silos and to clamp. Approx. 1400 ton handled
O Circulating batch dryer, MEPU Outdoor dryer with in and out loading bin. Approx. 600 ton handled
P Twin batch dryer, AKRON Two batch driers are connected to the same boiler and cooling fan, which switch between the dryers. Energy for lighting, air flow and loading in and out included
Dryer house with dryer and storage bins in which 190 ton can be stored. Approx. 500 ton handled
Q Batch-in-bin dryer with multiple stirrers, MertzCorn
Two dryer silos with fans and stirrers. Approx. 1400 ton handled
3.6 Equipment for energy measurement
The measurements were carried out with calibrated electricity meters of the type used for recording electric energy use by domestic customers, which were provided by the electricity provider (E.ON-elnät Sverige AB), see Figure 2. These meters were installed by the usual electrical contractor on the study farms. The aim of installation was to be able to distinguish between the functions Feeding, Manure handling, Ventilation, Lighting, Hygiene, Handling of goods produced and Miscellaneous. For milk and pig producers, a rough subdivision into different groups of animals was made. In many cases, each function could be differentiated but in some cases direct measurement was necessary, i.e. all consumption was recorded and the amount remaining could be allocated to the required categories. As regards smaller items of consumption, e.g. grooming brushes and automatic feeders, point measurements of energy consumption were made using an ammeter that was accurate to two decimal places. It was then possible to calculate an approximate value for energy consumption per day.

- 25 -
Figure 2. Electricity meter used for recording energy use.
Pig and egg producers made meter readings once a week and reported the data in most cases on a monthly basis. For the grain dryers, only total consumption during the year was measured. Broiler chicken producers made weekly recordings when birds were present in the house. Data from the electricity supplier (hourly readings) were transferred electronically with the prior written permission of the farm businesses studied. On the milk producing farms readings were made once a month, but in some cases the interval was longer.
3.7 Equipment for power measurement
The electrical power used was determined using equipment provided by E.ON-elnät Sverige AB, which recorded energy consumption at 5-minute intervals (Figure 3). With knowledge of the line voltage (400V) the average current could be calculated, and this was then used as a measure of power out-take. Such measurements were made on only one pig farm (G) and one dairy farm (C) during a long period. On another dairy farm (B), measurements were made for a week to determine the magnitude of the difference between farms with different equipment.
Figure 3. (Left) Measuring equipment for recording of data and (right) formula used to calculate average current consumption during a 5-minute interval. The computer was only used to collect data from the recording equipment.
[ ]
[ ]8,0cos
400
cos3
===
==
=
⋅⋅=
FactorPowerACurrentI
VvaltageLineUs
JPowerP
UPI
ϕ
ϕ

- 26 -
4 RESULTS AND DISCUSSION This investigation resulted in a large amount of empirical data, all of which have a certain intrinsic value. To prevent the report being too exhaustive, however, only a small proportion of the actual results obtained are presented here. Other data were processed and are provided in Appendix 1-4, classified according to production. All data were converted to relate to number of animal places or in some cases number of dairy cows or sows in production (SIP). Energy consumption per litre milk was also used. The way in which the results are reported depends on the factors determining the amount of energy required. For lighting, for example, number of animal places was used since the size of the buildings determines the number of light fittings installed. However, feed and manure are related to the number of animals in the pen/building. In the case of milking and manure, conversion was also made to kWh/litre milk and Wh/m3 manure respectively. Data for staffrooms are given in Appendix 5.
Despite the relatively large number of meters installed, very few of the functions had sufficient data to allow for deeper statistical analysis. However, the empirical data obtained identified the functions that used a lot of energy and those that used less, and with the help of additional analysis, it was possible to identify energy-saving measures. It was also possible to use the measurements to provide a rough guide to equipment that is energy-efficient and an indication of the level of energy consumption within the respective farm enterprises.
4.1 Dairy cows
Milk production enterprises are often built up gradually and it is only in later years that there have been buildings designed exclusively for dairy cows (no calves or followers) . One of the farms studied (D) had cows with both a milking robot and a milking parlour. There was variation in where the calves and followers were reared and when/if followers were in another building. This made it difficult to estimate energy consumption and to relate it to a specific group of animals. However, the total picture of energy use in milk production was clear. A very simple overview of the farms is provided in Table 18.

- 27 -
Table 18. Brief description of dairy farms where the whole production process was studied
Farm A Farm B Farm C Farm D
150 cows Milking parlour
Clamp silo
220 cows Milking parlour
Clamp silo
120 cows Robot
Tower silo
40 cows/heif. Milking parlour
Clamp silo
106 cows, Robot
Clamp silo
Milk production
10.5 ton/ cow & yr
8.8 ton/ cow &yr
5 ton/ cow & yr 12 ton/cow & yr
Cow house (build yr)
Insulated Natural vent. Slatted floor Rope muck-
out (1993)
Insulated Natural vent
No slats Rope muck-out
+piston + pump (2003)
Insulated Natural vent
No slats Rope muck-out +piston + pump
(2001)
Young beef house (build yr)
Un-insulated Natural vent Slatted floor Rope muck-
out (2000)
Insulated Balanced
mech. Vent., Slatted floor
Rope muck-out+ pump
(unknown)
All animals in same building
Insulated
Natural vent. Slatted floor
Rope muck-out+ pump (2000)
~40 cows + 100 heifers 6-23 mths in building
Insulated
Exhaust vent. Slatted floor Rope muck-out +pump
(1966)
Insulated Exhaust vent 3-6 months Slatted floor
Rope muck-out (unknown)
Table 19 summarises the results of the measurements for the entire farm expressed per dairy cow and per litre of milk. Farm C had much lower milk production than the others, which was not discovered until half-way through the measuring period. The functions related to amount of milk produced are feeding, manure handling and milking (incl. cooling). The amount of forage handled on this farm (C) corresponded to the amount that could be expected to be handled on a farm with higher milk production (E-M. Liedström, pers. comm. 2006), so this source of error should be small. The measurements indicate that Farm C used 30-60% less energy than the other farms for automatic concentrate feeders but the energy consumption for handling concentrate is only 1-2% of the total energy used for feeding on the study farms, so the error as regards total consumption should therefore be acceptable. The amount of manure at this level of production was 10% lower than on other farms according to SJV (1995), but in view of the fact that no measurements or estimates were made of water spillage, this error should also be acceptable.
The measurements for Farm D do not have the same accuracy as the others since the measurements were not divided into subgroups in the same way as the others. The focus on this farm was to study the functions in the cow house with milking robots. The house for the smallest replacement heifers was also studied. The rest of the farm was only studied by metering the total energy used. Since measurements for milking and lighting in the other building were lacking, these functions were estimated in consultation with the farmer on the basis of the measurements obtained.

- 28 -
Table 19. Results from energy measurements on four farms with milk production
Farm A Farm B Farm C Farm D
Activity
150 cows Milking parlour
Clamp silo, kWh/cow & yr
220 cows Milking parlour
Clamp silo kWh/cow & yr
120 cows Robot
Tower silo kWh/cow & yr
146 cows Robot/parlour
Clamp silo kWh/cow & yr
Feeding 1)652 1)370 133 1)480 Ventilation 3 74 1 80 Manure 40 31 27 22 Lighting 216 224 109 227 Milking 386 406 572 487 Misc. 2)216 145 87 224 Total/cow 1513 1250 929 1512 Of which l
868 994 929 1060 Tot. kWh/ litre milk 0.148 0.141 0.203 0.125
% to heif. 23% 26% Not determined Not determined 1) Energy content in diesel set at 9.8 kWh/L 2) Value includes frost protection in young beef house of 91 kWh/cow place and year.
As expected, there were large differences between houses with mechanical and ‘natural’ ventilation. On Farms B and D, the old cow house was used for followers and in some cases for dry cows and the ventilation system was probably over dimensioned for these animals. The fact that Farm B had balanced ventilation did not appear as clearly.
Manure handling was similar on all farms, as reflected in the results. The large difference in lighting was probably due to different procedures for switching the lights on. Farms B and D use light sensors that switch on/off at a certain light intensity.
As mentioned earlier, it was not possible to distinguish all the components so that they could be allocated to their respective main group. Therefore Miscellaneous includes various electronic equipment, e.g. computer, control units for feeders (except on Farm A), calf feeders, grooming brushes, etc. The farms studied had no staffroom but only an office. Heating of this space is included in Miscellaneous.
As shown in Table 19, a large part of the difference in total energy use between the farms was caused by the way in which the animals were fed. Feeding was also the item where the variation between the farms studied was greatest. The results show that systems where all equipment is run on electricity alone used 20-35% of the energy, compared with systems there a tractor was used to a greater or lesser extent. This is probably due to the lower efficiency of the diesel engine. All mixer wagons were made by the same manufacturer (Keenan System), so the differences only reflect the wide variation that exists within the respective system. According to the equipment manufacturer, the energy requirement increases with increasing amount of feed in the

- 29 -
mixer. A higher DM content in the feed also requires more energy, since the feed occupies more space in the mixer. The measurements indicate that choice of tractor and number of feed mixes per day have a great impact.
The investigation also examined energy use for a system with stationary mixing of a mixed ration. When this study is combined with data (kWh/ton feed) from Farm C, this measurement can be compared with the others. Table 20 shows a comparison between the systems. Table 20. Comparison of energy use in feeding of dairy cows incl. recruitment heifers. See also Appendix 1
Farm Feeding equipment Energy consumption
kWh/cow & yr
A Clamp silo, tractor + mixer wagon, concentrate feeding stations 652
B Clamp silo, tractor +mixer wagon, rail feed wagon in cow house + diesel-powered feed truck for young beef animals 370
C Tower silo, rail feed wagon, concentrate feeding stations 160
D Clamp silo, tractor +mixer wagon + belt feeder for cows + electric forage wagon for other animals. 480
E2 Tower silo, rail mixer wagon, Mullerup mixfeeder, concentrate feed stations, combined with Farm C 274
Within milk production, it was milking that required a large amount of energy. Energy was used for cooling the milk and a lot of energy was required to power the vacuum pumps. To estimate the distribution of energy use for milking, this function was studied in detail on two farms, one with milking robots and the other with a milking parlour. The recording was divided up into Milking, Hot water and Cooling. The technical solution on the farm with the milking parlour was misinterpreted at installation, which meant that only the energy used to maintain the temperature of washing water was recorded. An estimate was made subsequently with this taken into consideration, since the amount of water per wash is known. The results are shown in Table 21. Table 21. Results of energy use divided into different functions involved in milking on two farms
Function Robot Milking parlour Wh/L milk Proportion Wh/L milk Proportion Hot water 5.2 13% 4.7-5.2 10-11% Cooling 13.6 34% 17.3 38% Milking, etc. 21.1 53% 23.4-23.9 51-52% Total 39.9 45.9

- 30 -
0
20
40
60
80
100
0 2 4 6 8 10 12 14 16 18 20 22
From these results it is not possible to see any great difference between milking by robot and in a milking parlour. The small difference was in favour of the robot, but this was comparing a robot with best energy saving technology (rev-controlled compressor etc) compared with a milking parlour where nothing had been done to decrease energy consumption. It also appears positive to have more milk per cow, since Farm C and Nilsson & Påhlstorp (1985) show at least 10% higher energy use both per cow and per litre milk.
Power requirement was measured on Farm B and C for 8 days and 3 months respectively. These measurements show that use of milking robot and tower silo gave rise to a pattern with high loads between 5 a.m. and 6 p.m. and low loads at other times, see Figure 4. As regards power utilisation, more than 50% of available power was used for only 10-25% of the week. During the short period in which measurements were made on Farm B, these showed a clear peak in consumption at every milking. In addition, 50% or more of the power was only used for 12% of the time.
Figure 4. Average power during 5-minute intervals over four weeks with high and low energy consumption on Farm C. Figure 5. Average power during 5-minute intervals over six days in April 2005 on Farm B.
Proportion of max
power %
Time of day
0
10
20
30
40
50
60
70
80
90
100
0 2 4 6 8 10 12 14 16 18 20 22 24Time of day
Proportion of max
power %

- 31 -
4.2 Pig production
The farms on which measurements were made were very different and this was reflected in the results obtained. In order to make some form of comparison, Farm G was combined with Farm H so as to show the amount of energy required to produce a fattening pig. An assumption of 24 piglets per sow was only made to indicate the production level for the herds. Production results were not recorded. Table 22 shows total consumption and how this was distributed between the different functions.
Table 22. Results of energy measurements on three farms with pig production and estimated energy consumption for fattening pigs produced at Farm G and H. FTS - system (Farrowing to Slaughter)= Farrowing to slaughter in the same pen, FG - system (Farrowing-Growing)= Farrowing to 25 kg in the same pen
Farm Farm F Farm G G+24xH Farm H
Description FTS-system 96 SIP* kWh/SIP& yr
FG-system 480 SIP kWh/SIP&yr
FG-system + fattening pig kWh/SIP
Fattening pigs 1160 places kWh/ap & batch
Feeding 90 13 68 2.3 Ventilation 654 80 310 9.6 Manure handling 11 12 14 0.1 Lighting 2441) 782) 121 1.83) Heat lamps 161 310 310 Heating heat source
992 oil
93 heat pump 194 4.2
oil (before entry)Water Incl. in Misc 4 4-8 Not included Washing 79 7 24 0.7 Total recruit. - 11 11 - Staffroom 38 15 15 Incl. in MiscMisc 164 66 90 1.0
Total per ap 2431 689 1163 19.7
Of which el. 1441 689 15.5
Other equipment 23
Distillers’ waste pump
38 Hammer-
mill -
Mating section Insulated Insulated - Dry section Insulated Uninsulated - Fattening pig Insulated - Insulated Build year 1998 1999 1998 1) FTS section 36W/pen, dry & mating 25W/ap 2) Farrow section 36 W/pen, mating section 17 W/ap, dry section 10 W/ap. 3) 18 W/box * SIP= sow in production

- 32 -
In all systems, heating and heat lamps used a large share of the energy. In fattening pig production additional heat was used only for drying the house and keeping it warm before the pigs arrived. In piglet production (all types of pens except deep litter), this additional heating is required for some weeks during farrowing and particularly during weaning, when the sow is moved to give the piglets as good an environment as possible. The function of the heat lamps is to provide extra heat in a part of the pen where the piglets are lured away from the sow to prevent them being trampled or lain on and being fatally injured. The heat lamp also contributes to maintaining a higher temperature in the section. The power of the heat lamps was 150 W on the farms studied. None of the houses studied used any system to alter the power of the lamps.
The fan motors represent a large proportion of energy use in fattening pig production (46%). In piglet production they represent approx. 12%. Manure handling and Washing are functions that are generally negligible in relation to total consumption. The Miscellaneous category was 5-10% of total consumption. The majority of this was probably due to external lighting and lighting in corridors and other side-areas. This conclusion can be drawn since the lighting in the fattening pig house uses 1.8 kWh/animal place and year, despite the lighting only being used for 2-3 hours per day.
The great difference in heating energy can partly be explained by one of the farms (G) having a heat pump and the other (F) using an oil boiler. Another factor that contributed to the difference is that the building for 480 sows presented a smaller surface area to the outdoor environment than the house for 96 sows (m2/animal). However, in other investigations (Nilsson & Sällvik, 1977), this difference has proved to be of less significance for total consumption. The main energy drain is when the ventilation fans overventilate the house. Another factor that may be important is that the Farrowing sections on Farm F had 2-4°C higher temperature compared than that on Farm G. Even if the fans only blow out 10% too much air, together with a higher indoor temperature this can have great consequences for energy consumption during the cold season.
Table 23 provides an analysis of the causes of the differences between energy use for one SIP producing 24 pigs (100 kg) in an FTS system or FG-system + separate section for fattening. The results show that the largest difference comes from heating depending on the system used for heating. The next largest is caused by the ventilation and lighting in the mating & dry section. The building (insulated) makes it necessary to have mechanical ventilation (fans) and artificial lighting, which the other system does not have.

- 33 -
Table 23. Summary of the causes of differences between energy use per SIP producing 24 pigs (100 kg) in the FTS system or FG-system + separate section for fattening
FTS-system kWh/SIP& yr
FG+fatteningkWh/SIP& yr
Difference Possible causes
Feeding 126 104 +22 23 kWh used for handling distillers’ waste to FTS
Ventilation 507 296 +211 85 kWh are used for the fans in mating/dry section
Manure handling
59 14 +45 Maybe more frequent manure removal
Lighting 272 122 +150 140 kWh more lightning needed for separate mating+dry section
Heat lamps 288 310 -22 +2°C warmer in FTS so the heat lamps are used less
Heating: - measured
(992)
(208)
Not comparable
- converted to heat pump
230-300 120-140 -110 to-160 15-30 kWh caused by higher temp. in building and heated mating+ dry section
Cleaning 22 21 -1
Staffroom 42 25 +17 The same size but less animals
Miscellaneous 188 107-111 +77 to +81 More spaceous planning, which need more lighting
Total 1734-1804 1331-1355 +379 to +473 Appr. 390 kWh explained
Power consumption was measured on the farm with 480 sows in production (Figure 6). It was not possible to identify any cyclical relationship throughout the day, week, etc. with the exception of a small decrease for a few hours during the night. In Figure 7, the values obtained for the weeks that had highest and lowest energy consumption are subdivided so that it is possible to see the percentage of time a certain level of power out-take occurred. The diagram shows that for 5-18% of the time, the power out-take was less than 50% of max. load, leading to the conclusion that there is nothing to be gained by diverting peak loads (mill and slurry pump) to other times.

- 34 -
0
20
40
60
80
100
0 2 4 6 8 10 12 14 16 18 20 22
0102030405060708090
100
0% 10% 20% 30% 40% 50% 60% 70% 80% 90% 100%
v 12v 6v 11v 13
Figure 6. Average power during 5-minute intervals on Mondays in weeks 13-17. Figure 7. Percentage utilisation of max power subdivided into size range. The example refers to the preceding text measured during the weeks 6,11,12 and 13.
4.3 Laying hens
The results from the measurements of energy consumption on the farms with egg production are shown in Table 24. Since laying hens are a form of batch production with a batch duration of more than one year, the values obtained are presented as 365 days of hens including both a warm and a cold period. The amounts measured in conjunction with washing between batches are reported separately.
Proportion of max power
%
Time of day
Proportion of max power
%
Duration, % of time

- 35 -
Table 24. Results from energy measurements on two farms with egg production. Energy use is converted to correspond to 365 days of laying hens. Washing between batches shown separately
Farm J K
Function 40 000 laying hens furnished cages Wh/ap and yr
12 500 laying hens free range system
Wh/ap and yr
Feeding 130 3 times/day
106 8 times/day
Ventilation 1250 2156 Manure handling 11 42
Lighting: Power & light programme
1454 0.48 W/ap, 14 hr/day
2431 0.46 W/ap, 16 hr/day
Egg packing 29 26 Egg washing 16 36 Cooling Included in Misc. 150 Cleaning Included in Misc. 18 Miscellaneous 228 65 Total/ap 3118 5030
kWh/ton eggs1) 156 kWh/ton eggs 251 kWh/ton eggs Cleaning etc. between batches excl. heating 18.8 10
Build year 2004 2003 1) Based on 20 kg eggs/hen & 12 month period
There is a great difference in energy use as regards Lighting (30%), which can partly be explained by Farm K having lights on 16 hours/day and Farm J having 14 hours/day. In houses for free range hens there is usually a higher light intensity, which contributes to higher energy consumption. Another detail that emerged from the measurements of lighting is that the control system does not switch the lamps off when it is dark, since energy consumption was recorded even during the night. From measurements made when the house was empty, this consumption was estimated at 91 Wh/animal place and year.
There are also great differences between the systems in terms of Ventilation and Miscellaneous. For ventilation, the difference can be explained by the fact that the Farm K house has a control system that does not shut off the fans, which are instead rev-controlled in parallel, even at minimum ventilation. The Farm J has a combination of rev-controlled (2) and step-controlled (13) fans. The difference in Miscellaneous is due to measuring technique because cleaning, a fridge/freezer and a small office are included in this item for Farm J. When these functions are added in for farm K, the difference between the farms is very small.

- 36 -
A function that uses a lot of energy is washing eggs during sorting, despite few eggs being washed. The difference is probably due to the higher incidence of dirty eggs in the free range system on Farm K. More energy was used in cleaning the house with furnished cages, which can possibly be explained by the fittings taking longer to wash. To get laying started during the cold season (15 days), Farm J used approx. 16 Wh/hen for heating and approx. 10 Wh/hen for other activities.
4.4 Broiler chickens
For broiler chickens, only one enterprise was studied in detail. The results of five rearing batches (Table 25) show that the item requiring most energy was heating in the form of heating oil. As regards electrical energy consumption, lighting and to a certain extent ventilation were the main consumers. Diesel use in manure handling was estimated from the working hours and loading machinery reported by the producer and is therefore less reliable. The results show that the energy requirement is 25-35% lower than previously reported. Table 25. Results from energy measurements on a farm with broiler chicken production
L M
Energy consumption per
batch, kWh/100 000 birds
Proportion
Energy consumption per
batch, kWh/100 000 birds
Feeding 290 0.3 % Ventilation 3 340 3.6 % Lighting 9 790 10.7 % Heating 77 000 84.2 % Manure handling, diesel1)
1 078 1.2 %
Total 91 324 Diesel/ heating oil 78 078 0.78 kWh/bird
Electric energy 13 246 0.13 kWh/bird 10 456 1) Energy value of diesel set at 9.8 kWh/litre.
In order to study how electrical energy use was distributed during the rearing period, data on total consumption per hour were obtained from EON-elnät Sverige AB with the prior permission of the farmers. An example of the distribution during two batches on Farm M (Figure 8) shows that energy use was highest during the first week and then decreased for the remainder of the period. Climate conditions were similar during the period 05-12-23 to 06-03-15
.

- 37 -
0
50
100
150
200
250
300
350
1 3 5 7 9 11 13 15 17 19 21 23 25 27 29 31 33 35 37 39 41 43 45 47
N 2005-12-23N 2006-02-09
0
2000
4000
6000
8000
10000
12000
14000
16000
L 1 sept M 14 sept L 19 okt M 3 nov L 10 dec M 23 dec
week 5 +cleaningweek 4week 3week 2week 1
Figure 8. Variation in electrical energy use per day during two batches on Farm M, December-March 2006. The insert box shows date the chickens arrive on the farm.
In Figure 9, previous data have been transformed to allow Farms L and M to be compared during three batches. The diagram shows that Farm L had 6-20% higher consumption than Farm M. There was an approx. 3-week difference in date of entry but the difference in outdoor climate should eliminate this over a longer period of time. The difference can possibly be explained by different management or lighting programmes. Figure 9. Variation in electrical energy use during three batches on Farms L and M, December to March 2006. Date of entry at base of columns.
Day after entry of chickens
Energy consumption kWh/day
Energy consumption per batch, kWh
- 38 -
4.5 Grain drying equipment
Measurements were carried out during 2005 on Farms N, O and P and during 2006 on Farms N, P and Q. On Farms N and P it was therefore possible to study the effect of higher incoming water content. On the farms, energy use increased by 37-49% during the difficult harvest year of 2006. The dryer on Farm O needed more engines running for a longer time in order to carry out drying, This meant that this dryer should (theoretically) have used more energy. However, in fact it had the lowest recorded use, probably because no associated equipment (augers, elevators, cooling fans) was included in the measurements. It is therefore interesting to note that the difference between Farms O and P was no greater than 6%, since some energy is used for transport and to a certain extent to aerate the storage bins. The values measured are much lower than those obtained in previous testing of similar dryers. This can be explained by the incoming water content generally being low during the harvest year 2005. Farm N is a much larger establishment, plus it also has dust reduction equipment, which explains the large difference with respect to Farms O and P. A grain drying unit with silo dryer appears to require more energy than other dryers and previous estimates appear to undervalue the amount of electrical energy required.
It is also interesting to note how specific energy consumption varied between years. With reservation for the uncertainty regarding the water content of the grain and the final water content after drying, it can be seen that at higher water content kWh/kg H2O decreases, while kWh/ton grain increases. The conclusion from this is that it is difficult to find a good measure of energy consumption in grain handling. However, the values presented should have adequate precision for estimation of energy consumption.

- 39 -
Table 26. Results from energy measurements on four farms with grain dryers. Grain water content (WC) in 2005-2006 estimated by farmers
Ton gr. WC-area Electricity use Comments
N Continuous dryer, Tornum, 2005 + 2006
1 300 ton
1 200 ton
2005 ~17%2006 ~21%
6.1 kWh/ton &yr0.13 kWh/kg H2O
9.1 kWh/ton &yr0.09 kWh/kg H2O
Complete dryer with 2 airable outdoor silos (400 ton) 400 ton in self-emptying bins and the rest in bunker stores. Three elevators and horizontal chain conveyor to and from silos and to bunkers. ~1400 ton handled
O Circulating dryer, MEPU 2005
600 ton ~18% 4.2 kWh/ton &yr0.07 kWh/kg H2O
Outdoor dryer with in/out loading hatch. ~600 ton handled
P Twin dryer, Akron 2005 + 2006
470 ton
550 ton
2005 ~18%
2006 ~21%
4.5 kWh/ton &yr 0.07 kWh/kg H2O
6.1 kWh/ton &yr 0.06 kWh/kg H2O
Dryer house with airing and storage bins for total of 250 tons, 190 ton can be aired. ~500 ton handled
Q Silo dryer with pre-heating 2006
1 400 ton ~18% 12 kWh/ton & yr Filling not included

- 40 -
5 REFERENCES AFS. 2000. Arbetsplatsens utformning [Workplace Design]. Arbetarskyddsstyrelsens författningssamling AFS 2000:42. Arbetarskyddstyrelsen.
Ascard. K. 2004. Systemlösningar för jordbrukets driftsbyggnader. Byggnader för nötköttproduktion [Systems Solutions for Agricultural Buildings. Buildings for Beef Production]. Lund. Swedish University of Agricultural Sciences, Dept. Agricultural Biosystems and Technology, JBT. BEVI. 2006. Teknisk information Bevi elmotorer typ Sg/Sh [Technical information Bevi electric motors type Sg/sh]. Bevi AB Blomstermåla. www.bevi.se. Updated 2006-05-07, posted 2006-07-05. Bohm, M., Browén, A., Ekström, N. & Rohde, L. 1989. Värmeåtervinning i varmluftstorkar [Heat Recovery in grain drying]. Uppsala. Institute of Agricultural Engineering Meddelande [Report] 424. Botermans, J. & Jeppsson, K-H. 2007. Effektiv energianvändning i grisstallar [Efficient energy use in pig houses]. Documentation from Alnarp Pig Days 2007. Alnarp. Brøgger-Rasmussen, J. 2001. Fuldfoderblandere [Mixers for TMR]. Århus. Dansk Landbrugsrådgivning, Landcentret Farm Test 6.,
Brøgger-Rasmussen, J. & Pedersen, J. 2004. El och vandforbrug ved mælkning [Electricity and Water Consumption in Milking]. Århus. Dansk Landbrugsrådgivning. Landscentret. FarmTest Kvæg nr 17.
DFS. 2007. Djurskyddsmyndighetens föreskrifter och allmänna råd om djurhållning inom lantbruket m. m. [Animal Protection Regulations and Recommendations] Skara.
Edström, M., Petterson, O. Nilsson, L. och Hörndahl, T. 2006. Jordbrukssektorns energianvänding [Energy Use in the Agricultural Sector]. Uppsala. JTI- Institute of Agricultural and Environmental Technology. JTI Report Lantbruk och Industri 342.
Ekström, N. 1972. Val av spannmålstork - med hänsyn tagen till ekonomi och arbetsbehov [Choice of Grain Dryer – with regard to Economy and Requirement]. Institute of Agricultural Engineering Meddelande [Report] 343. Uppsala.
Hushållningssällskapet. 2003. Produktionsgrenskalkyler för husdjur i Skåne, Halland, Blekinge [Production Enterprise Calculations for Farm Animals in Skåne, Halland, Blekinge].
Johansson, P. & Persson, E. 1979. Systemlösningar för jordbrukets driftsbyggnader - 30 kor + rekrytering - kortbås. [Systems Solutions for Agricultural Buildings – 30 Cows + Recruitment – Short Stalls]. Swedish University of Agricultural Sciences, Dept. Agricultural Building Technology Lund. LTs förlag, Stockholm.
Johansson, P., Eklund, K. & Ascard K. 1982. Systemlösningar för jordbrukets driftsbyggnader - Mindre lösdriftsstallar. [Systems Solutions for Agricultural Buildings – Small Houses]. Swedish University of Agricultural Sciences, Dept. Agricultural Building Technology Lund. LTs förlag, Stockholm.
Jonsson, L. 2006. Dags att kartlägga elförbrukningen. Tidn. Lantmannen nr 9. 2006.

- 41 -
Konsumentverket. 2007a. Energikalkylen [Energy Calculations]. www.energikalkylen.konsumentverket.se/, uppdate unknown, posted 06-07-05.
Konsumentverket. 2007b. Marknadsöversikt Olje- och elpannor, kombinerade [Market Review Oil and Electric Boilers, Combined]. www.energi.konsumentverket.se/, uppdate unknown, accessed 07-01-16.
Landcentret. 2007. StaldVent-Light - Grovanalyse energiforbrug. Energisparekataloget [Energy Savings Catalogue] Landbrugets Rådgivningscenter. www.lr.dk. 2007-01-15.
Larsson, K. 1988. Beredning och hantering av kraftfoder - med tonvikt på foder med hög vattenhalt [Preparation and Handling of Concentrate – With Emphasis on concentrate with High Water Content]. Uppsala. Institute of Agricultural Engineering Meddelande [Report] 418.
Liedström, E-M. 2006. Personal communication. Feed advisory service Skåne semin. Hörby. Telephone call November 2006 regarding forage requirements.
Mullerup AS. 2008. Homepage. Feeding systems, Manure systems. www.Mullerup.com
Myhrman, D., Berg, S., Granlund, P. & Karlsson, L. 1993. Terrängmaskinen del 1 [Terrain Machinery Part 1]. Foundation for Forest Research Institute. SkogForsk. Uppsala.
Nieto. A. 2008. Personal communication. Business Developer Manager, CRIC, Centre de Recerca i Investigació de Catalunya. Barcelona, Spain.
Nilsson, S., & Påhlstorp. S. 1985. Energiförbrukning i Jordbrukets driftsbyggnader [Energy Consumption in Farm Buildings]. Department of Farm Buildings, Special report 141. Swedish University of Agricultural Sciences. Lund.
Nilsson, C. & Sällvik, K. 1977. Beräkning av energiförbrukning för uppvärmning och ekonomsikt val av värmeisolering i svinstallar [Simulation of Energy Consumption for heating and Economic Choice of Insulation in Swine Houses]. Lund. Swedish University of Agricultural Sciences.. Department of Farm Buildings, Special report 66.
Olsson. O. Johansson. P. & Ascard. K. 1993. Systemlösningar för jordbrukets driftsbyggnader. Stallar för svinproduktion [Systems Solutions for Agricultural Buildings. Houses for Pig Production]. Swedish University of Agricultural Sciences, Dept. of Farm Buildings Lund.
Olsson. O. & Ascard. K. 2007. Systemlösningar för jordbrukets driftsbyggnader. Planeringshandledning för svinstallar. [Systems Solutions for Agricultural Buildings. Planning Supervision for Pig Houses]. Swedish University of Agricultural Sciences, Dept. of Farm Buildings Lund.
Pedersen, J. & Hinge, J. (eds) 2002. Energisparekatalog i Landbruget [Energy Saving Catalogue in Agriculture]. Århus. Landbrugets rådgivningscenter.
Pedersen, S. & Jenssen, T. 1998. Afprøvninger af ventilationsanlæg til stalde 1977-1997 [Testing Ventilation Units for Animal Houses 1977-1997]. Grøn Viden No:8, Danmarks Jordbrugsforskning.
SCB. 1987. Jordbruksstatistisk Årsbok 1987 [Agricultural Statistics for the Year 1987]. Statistiska Centralbyrån. Örebro.

- 42 -
SCB. 2007. Jordbruksstatistisk Årsbok 2007 [Agricultural Statistics for the Year 2007]. Statistiska Centralbyrån. Örebro.
SJV. 1993. Gödselproduktion lagringsbehov och djurtäthet i olika djurhållningssystem för svin [Manure Production, Storage Requirement and Animal Density in Various Housing Systems for Pigs]. Report 1993:20. Jönköping.
SJV. 1995. Gödselproduktion lagringsbehov och djurtäthet vid nötkreaturshållning [Manure Production, Storage Requirement and Animal Density in Various Housing Systems for Beef Animals]. Report 1993:10. Jönköping.
SLU. 1996. Databok för driftsplanering [Data Book for Enterprise Planning]. Swedish University of Agricultural Sciences Special Publication 62. Uppsala.
SLU. 2004. Databok för driftsplanering [Data Book for Enterprise Planning]. Agriwise. www.agriwise.com. Swedish University of Agricultural Sciences, Dept. Economics. Uppsala.
SLU. 2007 Kostallplan. [Planning for Dairy Cows]. Dept of Agricultural Biosystems and Technology. Swedish University of Agricultural Sciences. Alnarp.
SMP. 1978. Sammanställningar av resultat från provning av utgödslingsanordningar [Summary of Results from Testing of Manure Removal Systems]. Statens maskinprovningar [Swedish Machine Testing Institute] Meddelande [test report] 2460. Uppsala.
SMP. 1979. Gödselpumpar Flygt, typ 3082 och typ 3101, Gödselpumpar Flygt typ 3126 och typ 3152 [Slurry Pumps Flygt type 3082 3101, 3126 and typ 3152]. Statens maskinprovningar [Swedish Machine Testing Institute] Meddelande [test report] 2537 and 2538. Uppsala.
SMP. 1982. Hydrauliska tryckutgödslingar, sammanställningar av resultat från en rikstäckande provning [Hydraulic Piston Manure Removal. Summary of Results from National Tests]. Statens maskinprovningar [Swedish Machine Testing Institute] Meddelande [test report] 2754. Uppsala.
SMP. 1985. Propellerfläkt NIMA AK 900/7,5 och AKRON PFS 100/7,5 kW [Propeller fan NIMA AK 900/7.5 and AKRON PFS 100/7.5 kW]. Statens maskinprovningar [Swedish Machine Testing Institute] Meddelande [test report] 3007 and 3009. Uppsala.
SMP. 1986. Spannmålstork Akron dubbeltork typ 2A-166 med torkskiftesautomatik, typ TA 100 [Grain Dryer Akron Twin Dryer Type type 2A-166 with Automated Batches type TA 100]. Statens maskinprovningar [Swedish Machine Testing Institute] Meddelande [test report] 3080. Uppsala.
SMP. 1987. Spannmålstork MEPU [Grain Dryer MEPU]. Statens maskinprovningar [Swedish Machine Testing Institute] Meddelande [test report] 3099. Uppsala.
SS-EN ISO 15927-5:2005. Svensk Standard Fukt- och värmetekniska egenskaper hos byggnader - Klimatdata - Del 5: Data för att bestämma byggnaders effektbehov för uppvärmning (ISO 15927-5:2004).[Properties of Moisture and Heat Transfer in Buildings - Climate Data - Section 5 - Data for Determining Heating Power in Buildings] SIS, Swedish Standards Institute. Stockholm.

- 43 -
Sundahl A-M. 1977. Belysning i lantbruksbyggnader [Lighting in Agricultural Buildings]. Agricultural College. Aktuellt [Report] 243. Uppsala.
Svedinger, S. (ed). 1995. Byggnader för jordbruket - Planering och utrustning [Buildings for Agriculture – Planning and Equipment]. LTs förlag.
Toftedal-Olesen, H. 1987. Grain Drying. Innovation Development Engineering ApS. Thisted. Denmark.
Warfvinge, C. 1996. Installationsteknik AK för V [Technical Installations AK for V]. Lund University, Faculty of Engineering, Dept. Building Construction. Lunds University.
Westin, H. 2004. Utvärdering av ett silotorksystem för spannmål utrustat med omrörare [Evaluation of a Grain Stir Drying System]. Uppsala Swedish University of Agricultural Sciences, Dept. Biometry and Technology. Examensarbete [Thesis] 2004:5.

Appendix 1 : 1
APPENDIX 1 DAIRY AND BEEF
Lighting
1) Recalculated from Nilsson & Påhlstorp (1985) ap=animal place, cp=cow place, Letters A-E = data obtained from study farm with relevant reference letter
Description Installed power Use of energy 120 beef bulls, slatted floor pens, 12 months housing period 5 W/ap 2.3 kWh/ap & yr1)
125, forage fed bulls/steers, slatted floor pens, grazing period 11.5 W/ap 10.3 kWh/ap & yr1)
100 followers, 12-22 months, slatted floor pens (B) 27 W/ap 169 kWh/ap & yr
65 followers 12-22 months + 35 dry cows, cubicles (A) 17.3 W/ap 58.5 kWh/ap & yr
20 dairy cows plus followers. tie-stall, incl. milk room, no night lighting.
32 W/cp 57 kWh/cp & yr1)
30 dairy cows plus followers., tie-stall, night lighting. No grazing 69 W/cp 183 kWh/cp & yr1)
90 dairy cows plus followers., tied 25 W/cp 162 kWh/cp & yr1)
35 dairy cows plus followers, loose house incl night lighting & milking parlour
43 W/cp 73 kWh/cp & yr1)
120 cow places with followers, loose house (C) 23 W/cp 109 kWh/cp & yr
115 cow places, no followers, loose house (A) 34,0 W/cp 231 kWh/cp & yr
230 cow places no followers, loose house (B) 16 W/cp 148 kWh/cp & yr
120 cow places no followers, loose house (D) 24 W/cp 62.0 kWh/cp & yr

Appendix 1 : 2
Ventilation
1) Recalculated from Nilsson & Påhlstorp (1985) ap=animal place, cp=cow place Letters A-E = data obtained from farm with relevant reference letter
Description of system Use of energy
120 beef bulls, 12 month housing period, slatted floor pens
Combined rev. + step control, 3 fans, 10 W/ap
60 kWh/ap & yr 1)
125 forage bulls, slatted floor pens, grazing
Step control 4 fans, 8.9 W/cow place 45 kWh/ap & yr1)
100 followers, 12-22 months, loose house (B)
Balanced ventilation incl. slurry gas ventilator 142 kWh/ap & yr
65 followers 12-22 mon. + 35 dry cows, cubicles (A)
Natural ventilation with automatic control, incl. slurry gas ventilator
4.2 kWh/ap & yr
20 dairy cows plus followers.+ 10 young bulls, tie-stall incl. milk room
Combined rev. + step control,, 4 fans (unspecified rev. control) 29 W/cow place
120 kWh/cp & yr1)
30 dairy cows plus followers, tie-stall, no grazing
Combined rev. + step control,, 2 fans, 13 W/cp
161 kWh/cp & yr1)
90 dairy cows plus followers, tie-stall
Combined rev. + step control, 5 fans, 24 W/cp 113 kWh/cp & yr1)
35 dairy cows plus followers, loose house incl. milking parlour
Natural vent cows+ rev control for calves, 7 W/cp 22.7 kWh/cp &yr1)
120 cows plus followers, loose house (C)
Natural ventilation with automatic control 1.0 kWh/cp & yr
115 dairy cows without followers, loose house (A)
Natural ventilation with automatic control 48.3 kWh/cp & yr
220 dairy cows without followers, loose house (B)
Inflatable wall (DeBoer) + open ridge. 9.1 kWh/ap & yr

Appendix 1 : 3
Feeding
Filling of tower silo (Total amount handled estimated with the help of feeding plan). Herd size 120 cows with followers and 35 bulls aged 2-12 months.
Electricity for unloader and intermediate store 1.64 kWh/ton silage
Filling fan, diesel, 9.8 kWh/L diesel 14.65 kWh/ton silage
Total 16.29 kWh/ton silage Filling of tower silo (Nilsson & Påhlstorp, 1985) 235 ton DM = approx. 670 ton silage, herd size 90 cows with followers.
Feed table & conveyor, excl. distributor/unloader 1.81 kWh/ton silage Tower silo + rail forage wagon Tower silo with unloader, fan blows to bins and electric-powered (Battery) feeding wagon, rail-borne, (Huma battery-powered) distributes the forage. During the period 01/10/2005 to 01/05/2006 (212 days), 996 tonnes were fed to 120 cows plus followers. and 35 bulls 2-12 months. Estimated amount fed was 23-28 kg feed/cow and day.
Unloading of silage from tower silo 10.8 kWh/ton silage
Feeding forage by rail wagon 1.2 kWh/ton silage
Feeding forage in total 12.1 kWh/ton silage Tower silo + belt feeder (Nilsson & Påhlstorp, 1985) Tower silo with distributor/unloader, feed blown to feeding table (filling of tower included)
Tower silo, distributor/unloader (electric for both filling and emptying) 39.1 kWh/cp & yr 5.3 kWh/ton feed
Belt feeder (silage) + hay (25%), 737 tons feed; 90 dairy cows incl. followers
12.7 kWh/cp & yr 0.16 W/ton feed
Rail mix-ration wagon/mixer Mullerup – mixfeeder, incl. bin for silage, straw, beet pulp and three feed components by auger from feed bins. During the period 06/04/2005 to 01/05/2006 (390 days), 836 tons of silage and 1907 tons feed were fed, 30-40% DM
Feeding forage with rail wagon 2.1 kWh/ton feed

Appendix 1 : 4
Stationary full-ration mixer and rail feed wagon Diagonal auger mixer (Cormall, 35 m3, electric – powered), Huma battery-powered silage feeding wagon. Wheel loader fills mixer, one mix per day. Feed amount not measured. Herd of 220 cows fed, approx. 9000 kg milk/cow place and year. No followers.
Diesel for wheel loader, 9,8 kWh/L diesel 167.5 kWh/cp & yr
Electric-powered (battery) feeding wagon 5.7 kWh/cp & yr
Mixing 86 kWh/cp & yr Mobile feed wagon and feed truck for followers Keenan EF 200 tractor-powered reel mixer, 100 followers
Diesel for wheel loader + tractor for mixing, 9.8 kWh/L diesel 150.2 kWh/ap & yr
Diesel for feeding truck, 9.8 kWh/L diesel 35.8 kWh/ap & yr Mobile feed wagon and rail wagon Keenan EF 200 tractor-powered reel mixer, feeding by Huma silage wagon. 220 dairy cows, one mix per day. Feed amount not measured. 9000 L per cow place and year.
Diesel for wheel loader, 9.8 kWh/L diesel 167.5 kWh/cp & yr
Diesel for mixer tractor, 9.8 kWh/L diesel 162.6 kWh/cp & yr
Electric for rail feed wagon 5.7 kWh/cp & yr Mobile feed wagon, drivable feeding table Measured during January+February 2006 (55 days) recalculated to annual consumption. Total amount fed 507 546 kg feed, 82% to dairy cows and 18% to dry cows + bullocks over 3 months. Keenan EF 200 tractor-powered mixer wagon, wheel loader for transport from clamp silo and mini loader for clearing, 150 dairy cows and 100 followers. One mix for bullocks and one for dairy cows per day. 29 Wh/tons feed. Distribution of energy consumption: mixer tractor 23%, wheel loader 71%, miniloader 6%, 9.8 kWh/L diesel
Diesel for loader + mixer tractor, 65 followers 12-22 mths + 35 dry cows 118 kWh/animal place & yr
Diesel for wheel loader + mixer tractor, 115 dairy cows 527.5 kWh/cow place & yr Diesel for wheel loader + mixer tractor, 150 dairy cows incl. followers. Feeding of all animals. 645 kWh/ cow place & yr
Total consumption = 29 Wh/ton feed Wheel loader (75 kW) 71%, Mixer tractor 23% and mini loader 6%.

Appendix 1 : 5
Clamp silo + Keenan mixer + belt feeder Keenan EF 200 tractor-powered reel mixer, feeding with conveyor-belt feeder from interim store. 106 milking cows, one mix per day. Feed amount 1190 tons feed during 333 days. 12 000 L milk per cow place and year
Feeding, conveyor-belt feeder with interim storage, electric 102.2 kWh/cp & yr 12.3 kWh/ton feed
Diesel for tractor with loader + mixer tractor (95 kW), 106 dairy cows, 9.8 kWh/L diesel
381.4 kWh/cp & yr 33.9 kWh/ton feed
Total for dairy cows 484 kWh/cp & yr 46.2 kWh/ton feed
Concentrate and feed preparation
Roller mill + portioner & transport, 120 beef bulls, 12 month housing period
8.6 kWh/ap & yr1)
Roller mill + portioner, 125 forage bulls, grazing period incl. 5.4 kWh/ap & yr 1)
Hammer mill (5.5 kW) incl. pneumatic transport, 20 dairy cows incl. followers
22.6 kWh/ap & yr 1)
Mill incl. augers for conc, 30 dairy cows incl. followers. 25.4 kWh/ap & yr 1)
Roller mill + augers for concentrate, 90 dairy cows incl. followers
22.5 kWh/ap & yr 1)
Rail feeding (?) wagon, 90 dairy cows incl. followers. 1.1 kWh/ap & yr 1)
Concentrate automatic feeders (loose house) incl. augers, 35 cows in loose house incl. followers
0.29 kWh/cp & yr 1)
Concentrate automatic feeders (loose house) incl. augers, 102 cows in loose house incl. followers, 5500 kg/yr (C)
2.5 kWh/cp & yr
Augers for concentrate automatic feeders 106 cows in loose house incl. followers, 12000 kg/yr (D)
3.7 kWh/cp & yr
Concentrate automatic feeders (loose house) incl. augers, 150 cows in loose house incl. followers, 10 500 kg/yr (A)
6,4 kWh/cp & yr
Milling and transport to mobile feed mixer 220 dairy cows + followers (B)
18.5 kWh/cp & yr

Appendix 1 : 6
Manure handling
1) Recalculated from Nilsson & Påhlstorp (1985) 2) Recalculated with data from SJV (1995) cp= cow place, ap = animal place
Sled scraper (rope) under slats
0.22 kWh/ap & yr1)
0.045 kWh/m3
(1,2) 120 beef bulls, slatted floor pens. 5 m3 slurry/ap
Removal by slurry pump
1.96 kWh/ap & yr1)
0.39 kWh/m3 (1,2)
Sled scraper (rope) under slats
1.6 kWh/ap & yr 0.53 kWh/m3 (2) 40 followers, 3-12 months, slatted floor pens, 3 m3 slurry/ap (D)
Slurry pump 0.4 kWh/ap & yr 0.13 kWh/m3 (2)
Sled scraper (rope) under slats
0.7 kWh/ap & yr 0.17 kWh/m3 (2) 100 followers, 12-22 months, slatted floor pens, 6 m3 slurry/ap, (B)
Slurry pump 31 kWh/ap & yr 5.2 kWh/m3 (2)
Sled scraper (rope) under slats
0.7 kWh/ap & yr 0.09 kWh/m3 (1,2)65 followers, 12-22 mths + 35 dry cows, cubicles, slats in alley, 5.6 m3/ap + 12.2 m3/cp = 790 m3/yr (A) Slurry pump 33.4 kWh/ap & yr 4.2 kWh/m3 (1,2)
20 cows incl. followers. & 10 bullocks, tied-stall, 6800 kg milk, 16 m3 manure/cp 1)
Flap scrapers (chain) cows + sled scrapers (rope) young stock + urine pump
6.8 kWh/cp & yr1) 0.29 kWh/m3 (1,2)
30 cow, incl. followers, approx. 7500 kg milk, tied-stall, 14 m3 manure/cp1)
Flap scrapers (hydr. piston) incl. urine pump
49.3 kWh/cp & yr1)
3.5 kWh/m3 (1,2)
90 cows, incl. followers, 6800 kg milk tied-stall, 17 m3 slurry /cp 1)
Flap scrapers, (chain)
4.6 kWh/cp & yr1) 0.19 kWh/m3 (1,2)
35 cows incl. followers, approx. 6200 kg milk, cubicles & slatted floor, 17 m3 slurry/cp 1)
Sled scrapers (rope) under slats
1.28 kWh/cp & yr1)
0.07 kWh/m3 (1,2)
Beef animals, 70-124 m chain and 10-11 m elevator SMP 2391, 2457,2458, 1977
Continuous chain with scrapers
5.3-5.9 kWh ap & yr1)

Appendix 1 : 7
120 dairy cows incl. followers. + 35 bulls 2-12 mths, 5000 kg/yr, 25 m3/ap (C)
Sled scrapers (rope) under slats incl. slurry pump
26.8 kWh/cp & yr 1.1 kWh/m3 (1,2)
Sled scraper (rope) in alleys
9.7 kWh/cp & yr 0.48 kWh/m3 (1,2)220 dairy cows 9500 kg milk, lying cubicles solid floor, 20 m3/cp (B) Slurry pump 6.5 kWh/cp & yr 0.32 kWh/m3 (1,2)
Sled scraper (rope) in alleys
13.9 kWh/cp & yr 0.63 kWh/m3 (1,2)
Piston to slurry pump
3.5 kWh/cp & yr 0.16 kWh/m3 (1,2)
106 dairy cows, 12 000 kg milk, 22 m3/cp (D)
Slurry pump 6.3 kWh/cp & yr 0.29 kWh/m3 (1,2)
Sled scraper (rope) under slats
1.3 kWh/cp & yr 0.065 kWh/m3
(1,2) 115 dairy cows 10 500 kg milk, 20 m3/cp (A)
Slurry pump 43.6 kWh/cp & yr 2.2 kWh/m3 (1,2)
100 dairy cows excl. followers, 10 500 kg milk, 20 m3/cp (E)
Flap scrapers (hydraulic piston) in gutter and alley
100 kWh/cp & yr 5.0 kWh/m3 (1,2)

Appendix 1 : 8
Milking
1) Recalculated from Nilsson & Påhlstorp (1985) 2) Results from Brøgger Rasmussen & Pedersen (2006). 3) De Laval. Internal information material, VMS version 2007.
Milking total/yr
Milking total/yr
Hot water
Milking/yr
Cooling/yr
kWh/cp Wh/ kg milk
kWh/cp kWh/cp kWh/cp
Tied, 90 cows, 6 800 kg milk1) 314 46 144 83 87
Tied, 20 cows, 6 800 kg milk, excl. summer* 224 33 114 32 78
Milking parlour, 35 cows, 6200 kg milk1) 338 54 188 150
Tied, 30 cows, 7 500 kg milk1) 424 56 254 65 105
Milking parlour, 220 cows, 8 800 kg/yr 406 46 41-46 199-204 153
Milking parlour, 150 cows, 10 200 kg/yr 386 38 294 92
Milking robot, 60 cows, 13 700 kg/yr 535 39 68 284 183
Milking robot, 106 cows, 12 000 kg/yr 590 49 256 334
Milking robot 120 cows, 5 000 kg/yr 682 126 - - -
Milking robot Lely2) 171-223
Milking robot DeLaval2) 365-438
Milking robot DeLaval3) 36 (VMS) 239

Appendix 1 : 9
Miscellaneous
1)Recalculated from Nilsson & Påhlstorp (1985)
Unspecified consumption
30 dairy cows, incl. followers, tied: 35 kWh/cp & yr1)
90 dairy cows, incl. followers, tied: 76 kWh/cp & yr1)
35 dairy cows, incl. followers, loose house: 98 kWh/cp & yr1)
106 dairy cows excl. followers, loose house, incl. slurry gas extractor fan(D): 132.8 kWh/cp & yr
120 dairy cows incl. followers, loose house, 35 bulls 2-12 mths. (C): 102.9 kWh/cp & yr
150 dairy cows incl. followers, loose house (A): 76.5 kWh/cp & yr
220 dairy cows incl. followers, loose house (B): 145 kWh/cp & yr
Electric IR heating, milking parlour 2x8 herringbone, 3 mths of temp -5-0 °C (A): 1191 kWh/yr
Frost protected water, 65 followers 12-22 mths + 35 dry cows (A): 106.9 kWh/ap & yr
Drinking water1), 120 beef bulls, 12 month housing period: 6.8 kWh/ap & yr1)
Drinking water, 220 dairy cows excl. followers and calves (B): 26.0 kWh/cp & yr
Drinking water, 35 cows + followers, 6200 kg/cow: 13.8 kWh/cp & yr1)
High pressure washer + drinking water, 125 forage bulls, grazing: 10.3 kWh/ap & yr1)
High pressure washer, 30 dairy cows incl. followers: 1.2 kWh/ap & yr1)


Appendix 2 : 1
APPENDIX 2 PIG PRODUCTION
FG = Farrowing growing pens (piglets 0-25 kg) FTS = Farrowing to Slaughter (piglets 0-100 kg)
Ventilation
1) Recalculated from Nilsson & Påhlstorp (1985) , ap =animal place, SIP= sow in production
Piglet prod. 80 SIP, 3 sect.+ dry/mating sect.
Fans w rev control in 3 sect.+ one sect. with throttle
134 kWh/SIP& yr1)
Piglet prod. 55 SIP One section
Manual on/off of fans 41 kWh/SIP& yr1)
Fattening pigs 620 places, 2 sect., 2.6 litters/yr
Step control, 4 fans/sect. 18.8 kWh/ap & yr1)
Fattening pigs 300 places, 2 litters/yr
Step control, 3 fans 21 kWh/ap & yr1)
Fattening pigs 2x400 places, 2.6 litters/yr
Combined rev + step control, 3 fans+ slurry gas vent.
31.9 kWh/ap & yr
Piglet production 40 single pens/sect. Combined rev control + step, 2 fans
4.2 kWh/pen & yr
Natural ventilation. Mating sect. 0.66 kWh/SIP & yr
Natural ventilation. Dry sect. 0.19 kWh/SIP & yr
Piglet production FTS FTS-section, 3 fans per section. One fan always running, others rev controlled in parallel
853 kWh/FTS-pen & yr
Dry-mating. 1 fan Combined rev + step control
85 kWh/SIP& yr

Appendix 2 : 2
Lighting
1) Recalculated from Nilsson & Påhlstorp (1985) ap=animal place, sp=sow place, SIP=sows in production
480 SIP 40 FG-pens /section 36 W/pen 115 kWh/pen & yr
Mating section, 186 places 17 W/ap 5.8 kWh/SIP & yr
Dry section 206 sp+96 gilts
10 W/ap 15 kWh/SIP& yr
96 SIP FTS pens 36 W/pen 83 kWh/pen & yr
Dry & mating section 25 W/sp 161 kWh/sp & yr
800 fattening pigs Two sections 1.8 W/ap 6.3 kWh/ap & yr
80 SIP 3 farrowing section + one section for dry & mating
54 W/SIP 134 kWh/ap & yr 1)
55 SIP All animals in one section 13 W/SIP incl. staffroom
38 kWh/ap & yr 1)
620 fattening pig places
All animals in one section 1.74 W/ap 2.2 kWh/ap & yr1)
300 fattening pig places
All animals in one section 1.6 W/ap 0.34 kWh/ap & yr1)

Appendix 2 : 3
Feed handling
1) Recalculated from Nilsson & Påhlstorp (1985) ap=animal place, SIP=sow in production
480 SIP, piglet prod. to 25 kg Hammer mill 38 kWh/SIP & yr
Liquid feeding 13.4 kWh/SIP & yr
96 SIP -FTS Liquid feeding 89.3 kWh/SIP & yr
2200 L distiller’s waste/day Stirring (90%)+ pump (10%) for distiller’s waste
23.7 kWh/SIP & yr 2.8 Wh/m3
2x400, fattening pig places. Liquid feeding 7.7 kWh/ap & yr1)
80 SIP, piglet production Feeding troughs+ wire in pipe
5.2 kWh/SIP & yr 1)
620 fattening pig places, 2.6 litters/yr
Feeding troughs + wire in pipe
1.3 kWh/ ap & yr1)
886 fattening pig places, 2.6 litters/yr
Liquid feeding 2 mixers and auger pump
2.49 kWh/ap & yr1)
300 fattening pig places Feeding troughs+ chain in pipe
1.8 kWh/ap & yr1)

Appendix 2 : 4
Heating
1) Recalculated from Nilsson & Påhlstorp (1985) 2) Recalculated from Nilsson & Sällvik (1977) ap =animal place, SIP=sow in production
Heat pump 18.5 kWh/SIP & yr 480 SIP (G)
South Sweden Lat. 55ºN Heat lamps 155 kWh/SIP & yr
Diesel for heating 9.8 kWh/l
992 kWh/SIP & yr 96 SIP –FTS (F)
South Sweden Lat. 55ºN Heat lamps 161 kWh/SIP & yr
2x400, fattening pig places (H) South Sweden Lat. 55ºN
Diesel for heating 9.8 kWh/l
16.7 kWh/ap & yr
20.5 kW 197 kWh/SIP & yr1) 80 SIP
South Sweden Lat. 55ºN Heat lamps, 150 W 213 kWh/ap & yr1)
Heating 11 kW 230 kWh/ap & yr1) 55 SIP, West of Stockholm Lat. 59ºN Heat lamps, 250 W 230 kWh/ ap & yr1)
60-70 SIP 120-200 km west of Stockholm Lat. 59ºN
Heating, 80-407 kWh/ap & yr2)
620 fattening pig places South of Sweden, Lat. 56ºN
18 kW electric, 3.2 kWh/ap & yr2)
520-730 fattening pig places Lat. 58ºN
Diesel for heating 7 kWh/l
11-44 kWh/ap & yr2)

Appendix 2 : 5
Manure handling
1) Recalculated from Nilsson & Påhlstorp (1985) 2) Recalculated with data from SJV (1995) ap=animal place, SIP=sow in production
720 fattening pigs, 1.76 m3/ap & yr
Sled scraper (chain) under slats, SMP 2389
0.08-0.11 kWh/ap & yr 45-62 Wh/m3 2)
1000 fattening pigs 1.76 m3/ap & yr
Sled scraper (cable) under slats, SMP 2392
0.20-0.21 kWh/ap & yr 0.11-0.12 Wh/ap & yr
Flap scrapers under slats, chain
0.05 kW/ap & yr1) 28 Wh/m3 2)
620 fattening pig places, 2.6 litters, 1.76 m3/ap & yr Slurry pump 1.5 kW/ap & yr1)
850 Wh/m3 2)
300 fattening pigs, 2 litters/yr, 1.41 m3/ap & yr
Slurry pump 0.11 kWh/ap & yr1) 80 Wh/m3 2)
55 SIP, 18.5 weaners/yr 6.2 m3/ap & yr
Flap scrapers with rope, incl. slurry pump for slurry
3.2 kWh/SIP& yr1) 516 Wh/m3 slurry 2)
80 SIP 18 weaners/yr 3.4 m3/ap & yr
Flap scrapers with rope,manure (15-25% DM)
7,7 kWh/SIP& yr1) 2260 Wh/m3 manure 2)
Sled + rope under slats6x40 single pens, 7.0 m3/pen & yr
0.12 kWh/single pen & yr 17 Wh/m3 2)
Slurry pump, 6x40 single pens, 7.0 m3/pen & yr
0.45 kWh/single pen & yr 64 Wh/m3 2)
Sled scraper (rope) in alley Dry sect. (302 ap)
3.3 kWh/SIP & yr
480 sows in production
Manure + straw handling with loader, mating section.
7.1 kWh/SIP & yr
FTS-house, sled scraper under slats, 16 m3/pen & yr.
1.44 kWh/pen & yr 90 Wh/m3 2)
Dry/mating sect., 64 ap with slurry. Sled scraper under slats +piston removal in cross culverts that also take FTS slurry .
2 kWh/ap & yr
FTS-house 96 SIP
Slurry pump, 200 m3/yr
8.4 kWh/SIP& yr 1120 Wh/m3 2)
Sled scraper (rope) under slats1.76 m3/ap & yr
0.02 kWh/ap & yr 10 Wh/m3 2)
Fattening pigs, 2x400 places, 3 litters/yr
Slurry pump 1.76 m3/ap & yr 0.39 kWh/ap & yr 222 Wh/m3 2)

Appendix 2 : 6
Miscellaneous
Data for Staffroom reported in Appendix 5 1) Recalculated from Nilsson & Påhlstorp (1985) 2) Includes water to residence ap =animal place, SIP=sow in production
Unspecified consumption 66 kWh/SIP & yr
Water 3.7 kWh/SIP & yr
480 SIP
Washing 6.6 kWh/SIP & yr
Unspecified consumption 164 kWh/SIP & yr 96 SIP
Washing 79 kWh/SIP & yr
Unspecified consumption 4.2 kWh/ap & yr Fattening pigs 2x400
Washing 2.2 kWh/ap & yr
Piglet production, 80 SIP Vacuum cleaner, gates dry sows
7.7 kWh/ap & yr 1)
Piglet production, 55 SIP Sawdust handling, high pressure washing, drinking water2),
6.2 kWh/ap & yr 1)
Fattening pigs, 1000 High pressure washing, drinking water2)
1.9 kWh/ap & yr 1)
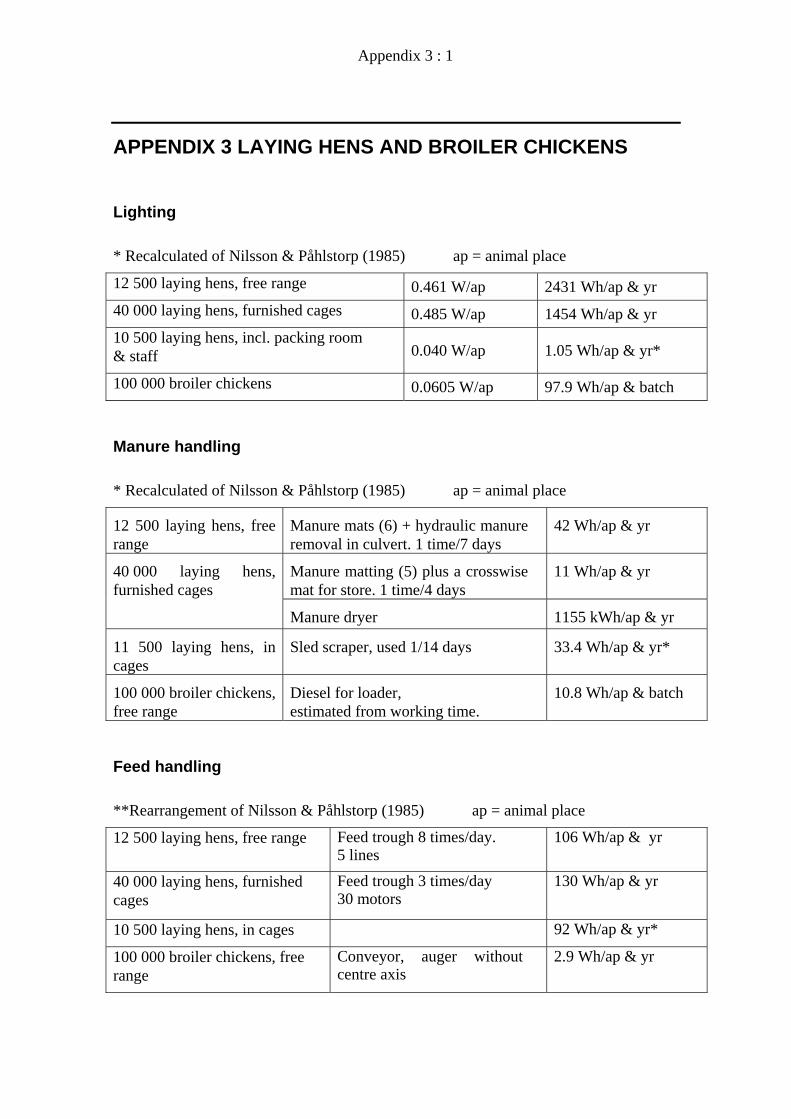
Appendix 3 : 1
APPENDIX 3 LAYING HENS AND BROILER CHICKENS
Lighting
* Recalculated of Nilsson & Påhlstorp (1985) ap = animal place
12 500 laying hens, free range 0.461 W/ap 2431 Wh/ap & yr 40 000 laying hens, furnished cages 0.485 W/ap 1454 Wh/ap & yr 10 500 laying hens, incl. packing room & staff 0.040 W/ap 1.05 Wh/ap & yr*
100 000 broiler chickens 0.0605 W/ap 97.9 Wh/ap & batch
Manure handling
* Recalculated of Nilsson & Påhlstorp (1985) ap = animal place
12 500 laying hens, free range
Manure mats (6) + hydraulic manure removal in culvert. 1 time/7 days
42 Wh/ap & yr
Manure matting (5) plus a crosswise mat for store. 1 time/4 days
11 Wh/ap & yr 40 000 laying hens, furnished cages
Manure dryer 1155 kWh/ap & yr
11 500 laying hens, in cages
Sled scraper, used 1/14 days 33.4 Wh/ap & yr*
100 000 broiler chickens, free range
Diesel for loader, estimated from working time.
10.8 Wh/ap & batch
Feed handling
**Rearrangement of Nilsson & Påhlstorp (1985) ap = animal place
12 500 laying hens, free range Feed trough 8 times/day. 5 lines
106 Wh/ap & yr
40 000 laying hens, furnished cages
Feed trough 3 times/day 30 motors
130 Wh/ap & yr
10 500 laying hens, in cages 92 Wh/ap & yr*
100 000 broiler chickens, free range
Conveyor, auger without centre axis
2.9 Wh/ap & yr

Appendix 3 : 2
Ventilation
* Recalculated of Nilsson & Påhlstorp (1985) ap = animal place
12 500 laying hens, free range
Rev count control of 3 fans in parallel 2155 kWh/ap & yr
40 000 laying hens, furnished cages
2 rev controlled. + 13 fans start up in steps. When a new fan starts up the revs on the rev-controlled fans is lowered
1250 kWh/ap & yr
10 500 laying hens, in cages
Step control, 4 fans/section 1478 Wh/ap & yr*
100 000 broiler chickens, free range
30 fans (∅ 60cm) + 2 (∅ 60cm) rev-controlled + 6 ‘summer’ fans
33 Wh/ap & batch
Miscellaneous
* Recalculated of Nilsson & Påhlstorp (1985) ap = animal place
12 500 laying hens, free range
Unspecified consumption 65 Wh/ap & yr
Cooling (refrigerated store) 150 Wh/ap & yr
Vacuum cleaning 18 Wh/ap & yr
Egg packing, semi-automated
26 Wh/ap & yr
Egg washing 36 Wh/ap & yr
40 000 laying hens, furnished cages
Unspecified consumption, incl. staff, incl. cleaning and refrigerated store
228 Wh/ap & yr
Packing, semi-automated plant with stacker
29 Wh/ap & yr
Egg washing 16 Wh/ap & yr
10500 laying hens, in cages Refrigerated store 26.9 Wh/ap & yr*

Farm
Yea
r to
ns g
rain
W
C ra
nge
Elec
trici
ty u
se
Com
men
ts
M
Con
tinuo
us d
ryer
, To
rnum
Har
vest
200
5 &
200
6
2005
2006
1 30
0 to
n
1 20
0 to
n
~17
%
~21
%
6.1
kW
h/ to
n0.
13 k
Wh/
kg H
2O
9.1
kWh/
ton
0.09
kW
h/kg
H2O
Com
plet
e dr
ying
pla
nt w
ith tw
o ou
tdoo
r silo
s with
coo
ling
fans
(400
to
n), 4
00 to
n in
self-
empt
ying
bin
s and
re
st in
bun
ker s
tore
. Thr
ee e
leva
tors
and
ch
ain
conv
eyor
s to
and
from
silo
s and
to
bun
ker s
tore
. App
rox.
1400
ton
hand
led
N
Circ
ulat
ing
batc
h-dr
yer,
MEP
U
2005
60
0 to
n~1
8%
4.2
kWh/
ton
0.07
kW
h/kg
H2O
Out
door
dry
er w
ith lo
adin
g/un
load
ing
bin.
A
ppro
x. 6
00 to
n ha
ndle
d
O
Twin
bat
ch d
ryer
, Akr
on
2005
2006
470
ton
550
ton
~18%
~2
1%
4,46
kW
h/yr
0.07
kW
h/kg
H2O
6.11
kW
h/yr
0.06
kW
h/kg
H2O
Dry
er h
ouse
with
dry
er a
nd st
orag
e bi
ns
(w c
oolin
g) in
whi
ch 1
90 to
n ca
n be
st
ored
. A
ppro
x. 5
00 to
n ha
ndle
d
P B
atch
-in-b
in d
ryer
with
m
ultip
le st
irrer
s, M
ertz
Cor
n
2006
1
400
ton
~18%
12
kW
h/yr
Two
drye
r silo
s with
fans
and
stirr
ers.
App
rox.
140
0 to
n ha
ndle
d.
Load
ing/
unlo
adin
g no
t inc
lude
d
Tw
in b
atch
dry
er,
SMP
1987
, nr 3
080
16
-24%
m
ean
18%
4.
5-7.
3 kW
h/to
n gr
ain.
0.
06-0
.09
kWh/
kg H
2OD
ryer
fan
only
C
ircul
atin
g ba
tch
drye
r M
EPU
SM
P 19
87, n
r309
9
21
-24%
m
ean
22%
8-
11 k
Wh/
ton
grai
n 0.
25-0
.32
kWh/
kg H
2OD
ryer
incl
. ele
vato
rs fo
r lo
adin
g/un
load
ing,
sim
ilar t
o fa
rm N
C
ontin
uous
dry
er
Mix
ed-f
low
(1
20 k
g H
2O/h
) 1)
54
5 to
n~1
9%
9.63
kW
h/to
n gr
ain
0.13
kW
h/kg
H2O
C
ompl
ete
drye
r pla
nt,
load
ing/
unlo
adin
g
C
ontin
uous
dry
er
Cro
ss fl
ow
(80
kg H
2O/h
) 1)
18
4 to
n~1
9.5%
21
.5 k
Wh/
ton
grai
n 0.
32 k
Wh/
kg
H2O
Com
plet
e dr
yer p
lant
, lo
adin
g/un
load
ing

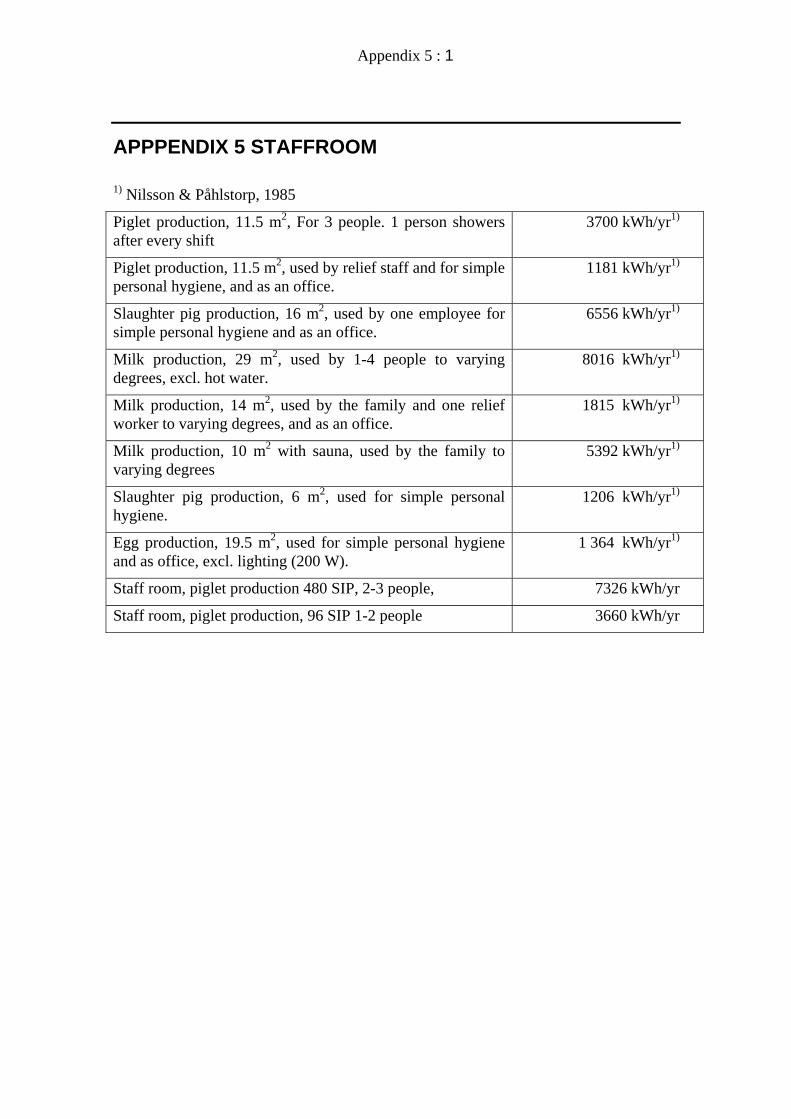
Appendix 5 : 1
APPPENDIX 5 STAFFROOM 1) Nilsson & Påhlstorp, 1985
Piglet production, 11.5 m2, For 3 people. 1 person showers after every shift
3700 kWh/yr1)
Piglet production, 11.5 m2, used by relief staff and for simple personal hygiene, and as an office.
1181 kWh/yr1)
Slaughter pig production, 16 m2, used by one employee for simple personal hygiene and as an office.
6556 kWh/yr1)
Milk production, 29 m2, used by 1-4 people to varying degrees, excl. hot water.
8016 kWh/yr1)
Milk production, 14 m2, used by the family and one relief worker to varying degrees, and as an office.
1815 kWh/yr1)
Milk production, 10 m2 with sauna, used by the family to varying degrees
5392 kWh/yr1)
Slaughter pig production, 6 m2, used for simple personal hygiene.
1206 kWh/yr1)
Egg production, 19.5 m2, used for simple personal hygiene and as office, excl. lighting (200 W).
1 364 kWh/yr1)
Staff room, piglet production 480 SIP, 2-3 people, 7326 kWh/yr
Staff room, piglet production, 96 SIP 1-2 people 3660 kWh/yr


Appendix 6: 1
-30
-20
-10
0
10
20
30
40
0%10%
20%30%
40%50%
60%70%
80%90%
°C
APPPENDIX 6 CLIMATIC DATA
Figure 6:1 Distribution of temperature during the study period.
Figure 6:2 Percentage of daily temperature readings subdivided into 10oC intervals during the period 2 Sept 2005 to 2 Sept 2006
-20
-10
0
10
20
30
June Ju
ly
Augus
t
Septem
ber
Octobe
r
Novem
ber
Decem
ber
Janu
ary
Februa
ryMarc
hApri
lMay
June Ju
ly
Augus
t
Septem
ber
°C