Embed Size (px)
Citation preview
• ENG 1181
College of EngineeringEngineering Education Innovation Center
Microsoft Excel: Data Analysis
Trendlines
Formulas
Functions
Cell Addressing

• ENG 1181
Review - Data Analysis with Excel
Excel offers many capabilities for analyzing data:
1. Trendlines for predicting data values
2. Use of equations to do sophisticated calculations with the worksheet data using cell referencing
3. Comprehensive library of built-in functions to help calculate and analyze spreadsheet data

• ENG 1181
Review - Cell Reference: Relative Addressing
• Relative Cell Address – refer to the cell in the same relative position
• Ex: B12 – relative reference to value in cell B12, use fill handle to drag to cell C17
Step 1 Step 2 Step 3

• ENG 1181
Review - Cell Reference: Absolute Addressing
• Absolute Cell Address – always refer to the same cell
• Ex: $B$12 – absolute reference to value in cell B12, use fill handle to drag to cell C17
Step 1 Step 2 Step 3

• ENG 1181
Review - Formulas and the Excel Function Library
• Formulas are used to calculate values in a cell in a worksheet based on values stored in other cells with optional use of the Excel function library.
• There are hundreds of functions available

• ENG 1181
Review – Examples of Functions in Excel
• Trigonometric functions• COS(cell) – calculates cosine of an angle• PI() – calculates pi
• Mathematical functions• EXP(cell) – raises e to the power “cell”• SQRT(cell) – finds the square root of cell
• Statistical functions• AVERAGE(cells) – finds the mean of a list of cells• STDEV(cells) – finds the standard deviation of a list of cells

• ENG 1181
Predicting Data - Trendlines
• Excel graphing allows you to graph data and then create an equation that best fits that data.
• You can choose the type of equation for Excel to use, such as linear, exponential, logarithmic, etc.
• With a best-fit equation you can predict data values not included in the worksheet
• Note: You must use X-Y Scatter Plots

• ENG 1181
Example – Predicting ValuesYear Births Deaths2002 3,167,788 1,909,440
2003 3,612,258 1,989,841
2004 3,680,537 1,974,797
2005 3,669,141 2,039,369
2006 3,756,547 2,105,361
2007 3,909,510 2,167,999
2008 4,158,212 2,148,463
2009 4,110,907 2,169,518
2010 4,065,014 2,175,613
2011 4,000,240 2,268,553
2012 3,952,767 2,278,994
Question: How many births and deaths would we expect in 2016?

• ENG 1181
Scatter Plot of Example Data
2000 2002 2004 2006 2008 2010 2012 20140
500,000
1,000,000
1,500,000
2,000,000
2,500,000
3,000,000
3,500,000
4,000,000
4,500,000
US Population Statistics
BirthsDeaths
Year
Population

• ENG 1181
Adding a Linear Trendline1. Right click on any data point
and select Add Trendline.
2. Select Linear as the regression type
*Note that there are other options available to you
3. Select Display Equation on Chart

• ENG 1181
Trendline for Births
2000 2002 2004 2006 2008 2010 2012 20140
500,000
1,000,000
1,500,000
2,000,000
2,500,000
3,000,000
3,500,000
4,000,000
4,500,000
f(x) = 71958.6454545455 x − 140595281.336364
US Population Statistics
BirthsLinear (Births)Deaths
Year
Population
Note: You may need to re-format the trendline equation to improve resolution, or move the equation for readability

• ENG 1181
Formatting Trendline Label
1. Click on trendline label
2. Right-click on edge of label box
3. Select Format Trendline Label
• ENG 1181
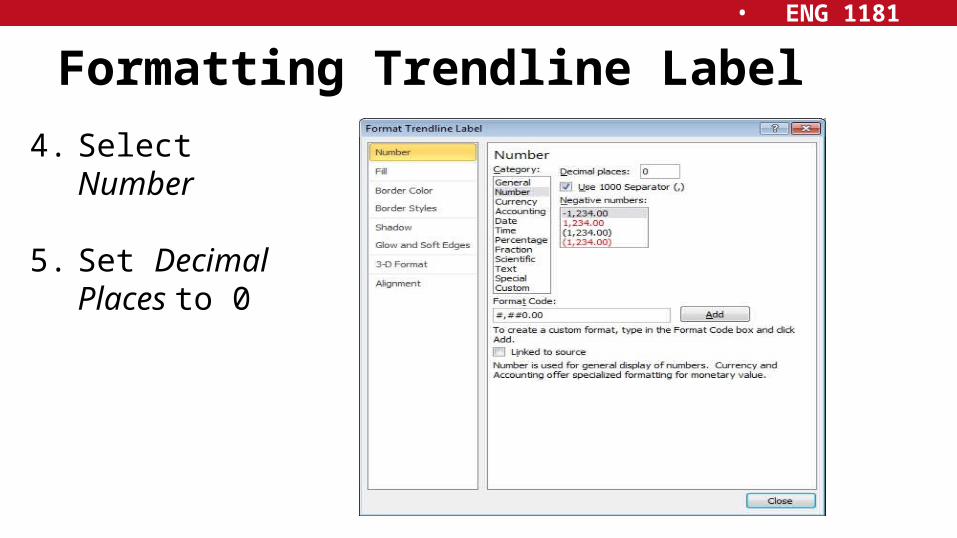
Formatting Trendline Label
4. Select Number 5. Set Decimal
Places to 0

• ENG 1181
ResultsUsing these equations, we can predict the numbers of births and deaths expecting in 2016:
Births : 4,474,063Deaths: 2,428,399
Do you see any problem with these predictions?
2000 2002 2004 2006 2008 2010 2012 20140
500,000
1,000,000
1,500,000
2,000,000
2,500,000
3,000,000
3,500,000
4,000,000
4,500,000
f(x) = 35167.8727272727 x − 68470288.9272727
f(x) = 71958.6454545455 x − 140595281.336364
US Population Statistics
BirthsLinear (Births)DeathsLinear (Deaths)
Year
Population

• ENG 1181
Example – Subtracting DataHow do we find the difference between births and deaths for each year in the table?
1. Select cell E42. Type: = c4 – d43. Press enter

• ENG 1181
Example – Subtracting Data
Note cell E4 now displays the difference between cells C4 and D4.
Also, note the formula bar shows you the actual calculation in cell E4. The formula bar always shows the actual contents or formula of the selected cell.

• ENG 1181
Copying Formulas1. Select cell E4, where
equation resides
2. Move cursor to lower right corner of E4, until it changes to a small + (fill handle)
3. Left click and drag down to cell E14
4. The formula is copied from E4 through E14

• ENG 1181
Copying FormulasNote how Excel uses relative cell addressing when copying.
Select cell E14, then look in the formula bar. What does it tell you?
Cell E14 should contain:=C14-D14

• ENG 1181
Formulas & Excel Function Library
• Excel allows for the use of sophisticated equations and functions to be used
• Operations– Multiplication: * – Division: /– Exponents: ^
• Note that ‘e’ is not defined– Instead, use: exp( )

• ENG 1181
Order of Precedence
• Higher-precedence operations are executed before lower-precedence operations
• If two operations have the same precedence, then the expression is executed from left to right.
• Excel’s Order of Precedence is:1. Parentheses (innermost pair first)
2. Exponentiation
3. Multiplication and Division
4. Addition and Subtraction

• ENG 1181
In-Class Exercise:Type the following expressions in Excel. Share your answer with your teammates. Discuss the order which the operators are executed.
Expression:
1. = 7 + 8 / 2
2. = (7 + 8) / 2
3. = 27 ^ 1 / 3 + 32 ^ 0.2
4. = 27 ^ (1 / 3) + 32 ^ 0.2
Answer:
1. Result = 11 ; 8 / 2 executed 1st
2. Result = 7.5 ; 7 + 8 executed 1st
3. Result = 11 ;
4. Result = 5 ; 1 / 3 executed 1st , then ^, then +
27^1 and 32^0.2 executed 1st ,then / , then +

• ENG 1181
Formulas & Excel Function Library
• Equations can be combinations of the mathematical operators and functions.
• The Excel functions can be accessed in two ways:– select the Formulas tab on the ribbon, or– type the function name in the cell or formula bar
• Remember to use proper cell referencing (see following example)

• ENG 1181
Formula Example We want to get the following function into Excel so we can plot the data.
x(t) = 10 e(-0.5t) sin(3t +2)
We need to use Excel’s function library to do this. Type in the equation after select the tab labeled "My Example :
=10*EXP(-0.5*B3)*SIN(3*B3+2)
Copy this formula through Cell C23. Now you can view a plot of the data!
• ENG 1181
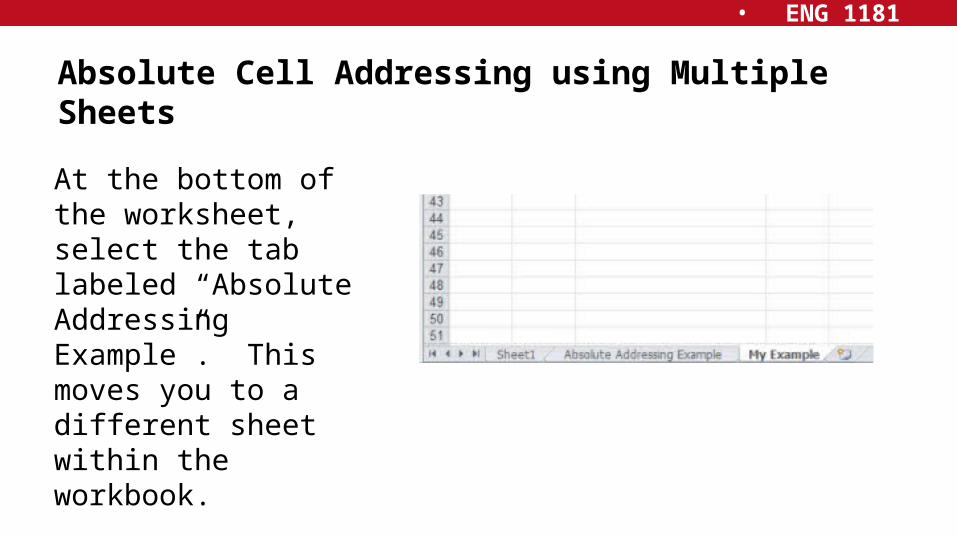
Absolute Cell Addressing using Multiple Sheets
At the bottom of the worksheet, select the tab labeled “Absolute Addressing Example”. This moves you to a different sheet within the workbook.

• ENG 1181
Absolute Cell Addressing Example
x(t) = 10 e(-0.5t) sin(At +2)
Change the value in cell B2 to see dynamic changes of the graph. Reset cell B2 to 1.

• ENG 1181
Absolute Cell Addressing Example
In Excel, you also have the ability to reference cells located in a different sheet.
1. Select the tab labeled ″My Example″. In
cell C3, select the 3 in the equation and
then hit the delete key
2. Select the tab labeled “Absolute
Addressing Example”
3. Select the cell B2
4. Press the ″Enter″ key
5. You have now returned to ″My Example″
My Example
Absolute Addressing Example

• ENG 1181
Absolute Cell Addressing ExampleFirst hit the up-arrow key to reselect cell C3. Before you drag the new formula in cell C3 of ″My Example″ to adjust the remaining cells, make sure you add “$” to the equation so that the cell you reference in ″Absolute Addressing Example″ tab is an absolute cell reference.
After dragging cell C3 to C23 in ″My Example″ tab and change the value of A in cell B2 of ″Absolute Addressing Example″ and return to ″My Example″ to see dynamic changes of in that graph by changing cell B2.

• ENG 1181
Absolute Cell Addressing ExampleTo organize the various worksheets within your workbook, it is helpful to give them descriptive names.
1. Right click on ″My Example″ tab
2. Select “Rename”
3. Enter a name for the worksheet. (Here we call it ″My Sinusoidal Function″)

• ENG 1181
Homework Assignment
• See the assigned work on the appropriate Class page on the EEIC website.