Embed Size (px)
Citation preview
Eng. 6002 Ship Structures 1
Introduction to Matlab
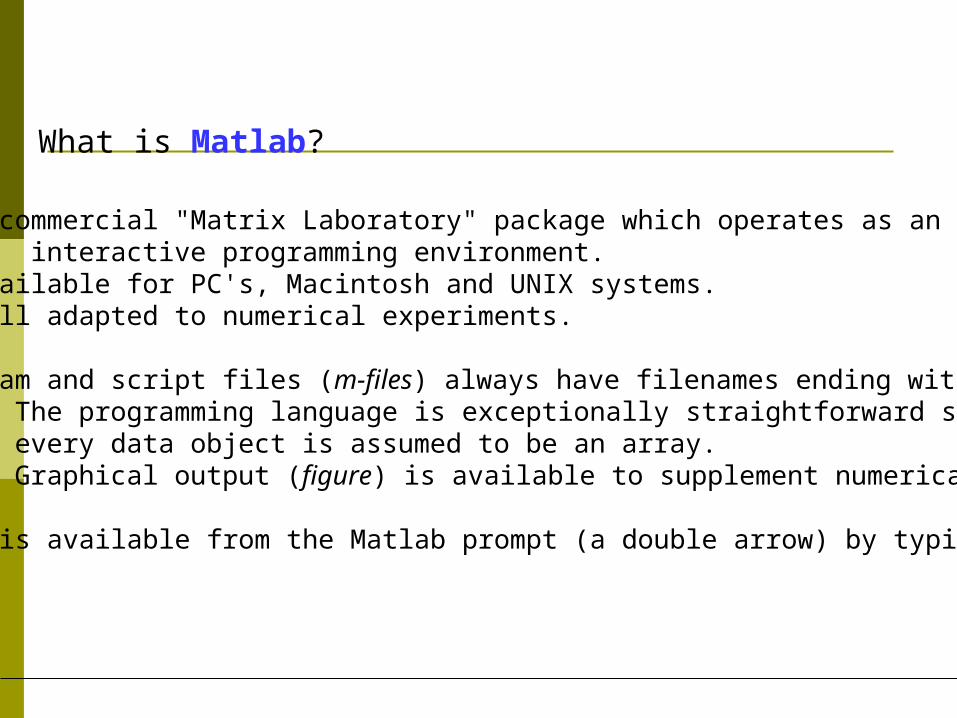
What is Matlab?
Matlab is a commercial "Matrix Laboratory" package which operates as an interactive programming environment. Matlab is available for PC's, Macintosh and UNIX systems.Matlab is well adapted to numerical experiments.
Matlab program and script files (m-files) always have filenames ending with ".m"; The programming language is exceptionally straightforward since almost every data object is assumed to be an array. Graphical output (figure) is available to supplement numerical results.
Online help is available from the Matlab prompt (a double arrow) by typing help.
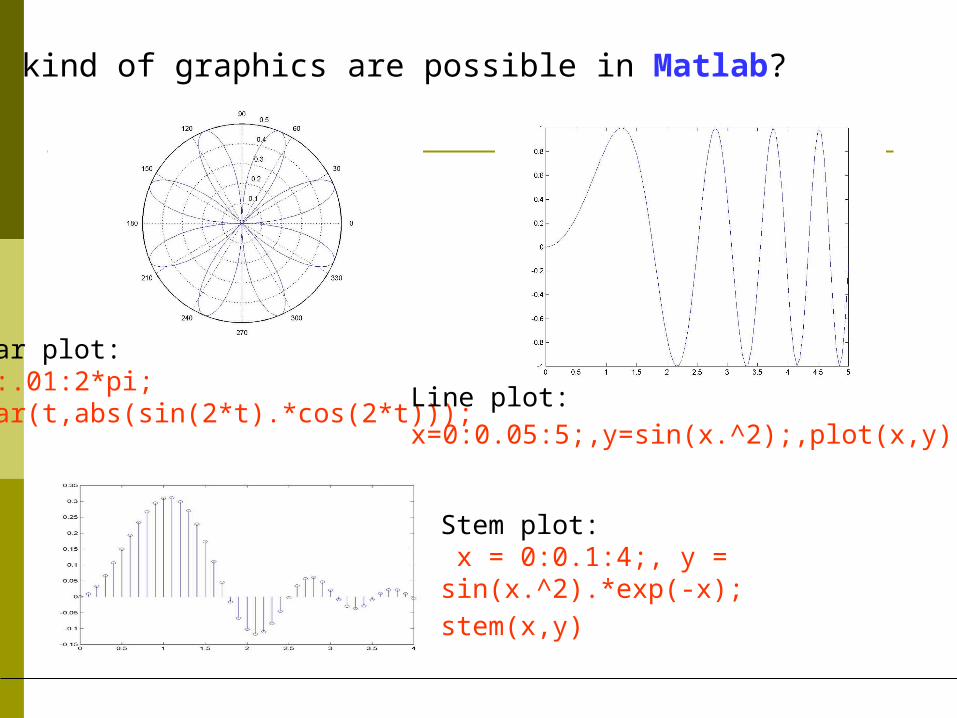
What kind of graphics are possible in Matlab?
Polar plot: t=0:.01:2*pi; polar(t,abs(sin(2*t).*cos(2*t)));
Line plot:
x=0:0.05:5;,y=sin(x.^2);,plot(x,y);
Stem plot: x = 0:0.1:4;, y = sin(x.^2).*exp(-x);
stem(x,y)
28 January 2003, Matlab tutorial: Joanna Waniek ([email protected])
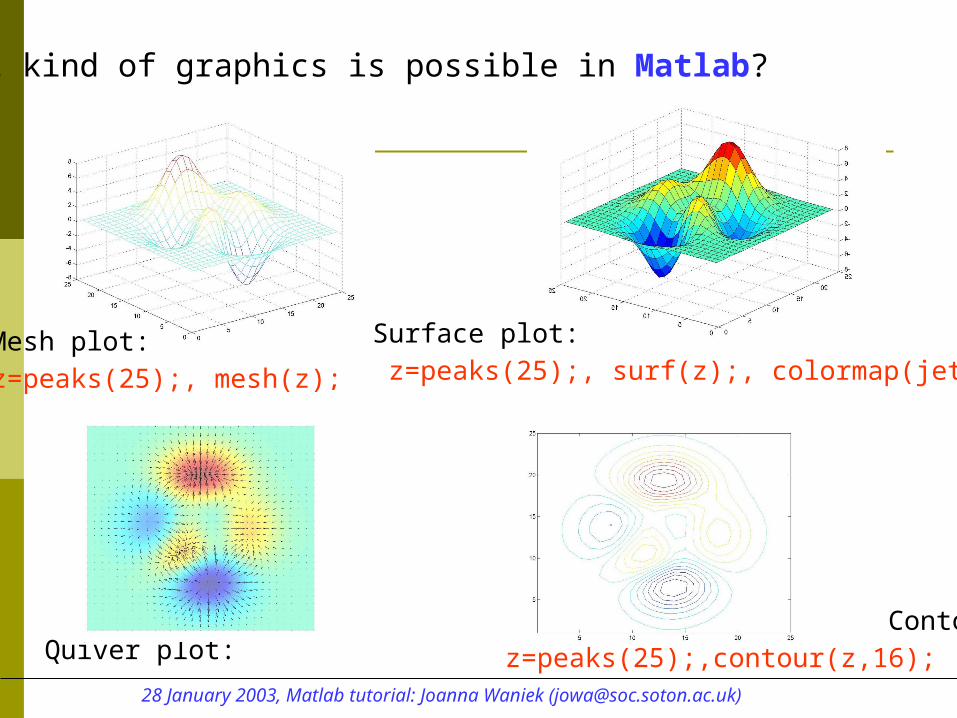
What kind of graphics is possible in Matlab?
Mesh plot:
z=peaks(25);, mesh(z);
Surface plot:
z=peaks(25);, surf(z);, colormap(jet);
Contour plot:
z=peaks(25);,contour(z,16); Quiver plot:
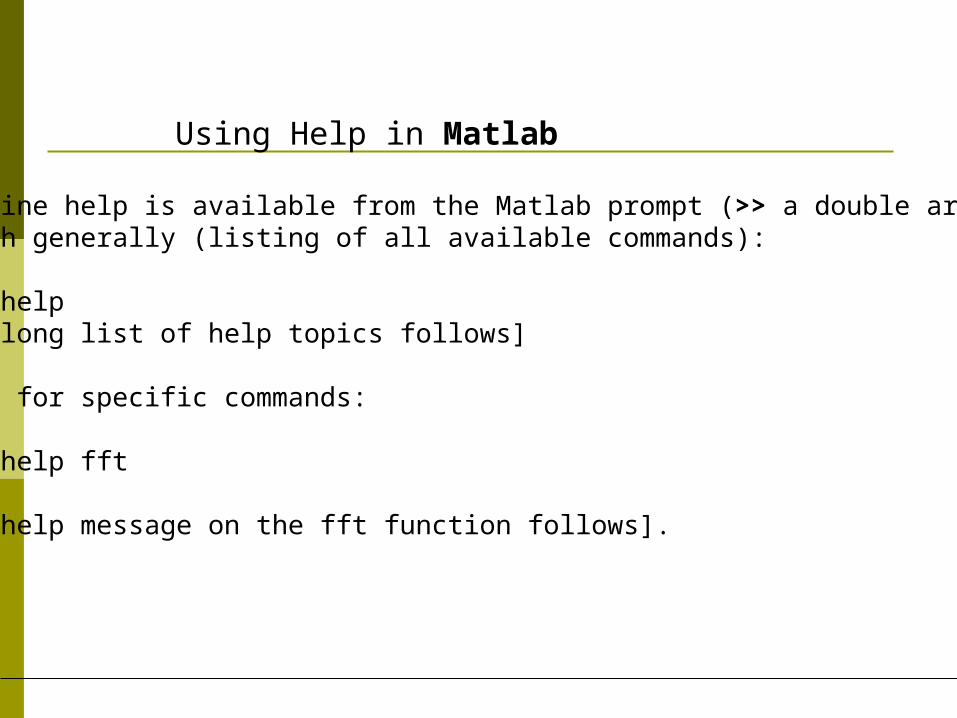
Using Help in Matlab
Online help is available from the Matlab prompt (>> a double arrow), both generally (listing of all available commands):
>> help[a long list of help topics follows]
and for specific commands:
>> help fft
[a help message on the fft function follows].
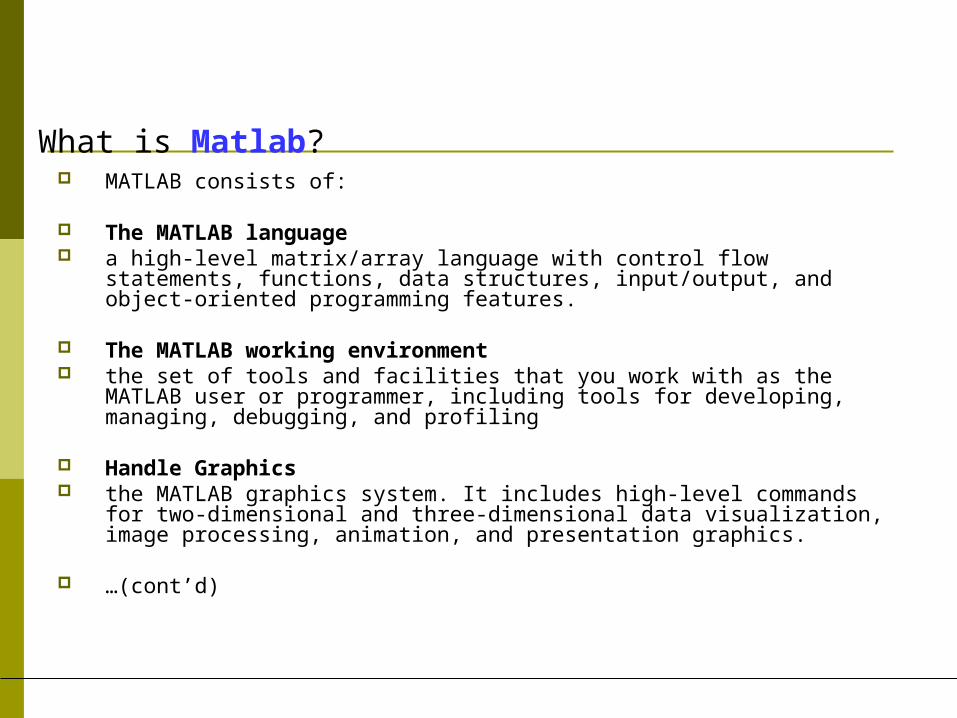
What is Matlab? MATLAB consists of:
The MATLAB language a high-level matrix/array language with control flow statements,
functions, data structures, input/output, and object-oriented programming features.
The MATLAB working environment the set of tools and facilities that you work with as the MATLAB user or
programmer, including tools for developing, managing, debugging, and profiling
Handle Graphics the MATLAB graphics system. It includes high-level commands for two-
dimensional and three-dimensional data visualization, image processing, animation, and presentation graphics.
…(cont’d)
What is Matlab? The MATLAB function library. a vast collection of computational algorithms ranging from
elementary functions like sum, sine, cosine, and complex arithmetic, to more sophisticated functions like matrix inverse, matrix eigenvalues, Bessel functions, and fast Fourier transforms as well as special image processing related functions
The MATLAB Application Program Interface (API) a library that allows you to write C and Fortran programs
that interact with MATLAB. It include facilities for calling routines from MATLAB (dynamic linking), calling MATLAB as a computational engine, and for reading and writing MAT-files.
What is Matlab? Some facts for a first impression
Everything in MATLAB is a matrix !
MATLAB is an interpreted language, no compilation needed (but possible)
MATLAB does not need any variable declarations, no dimension statements, has no packaging, no storage allocation, no pointers
Programs can be run step by step, with full access to all variables, functions etc.
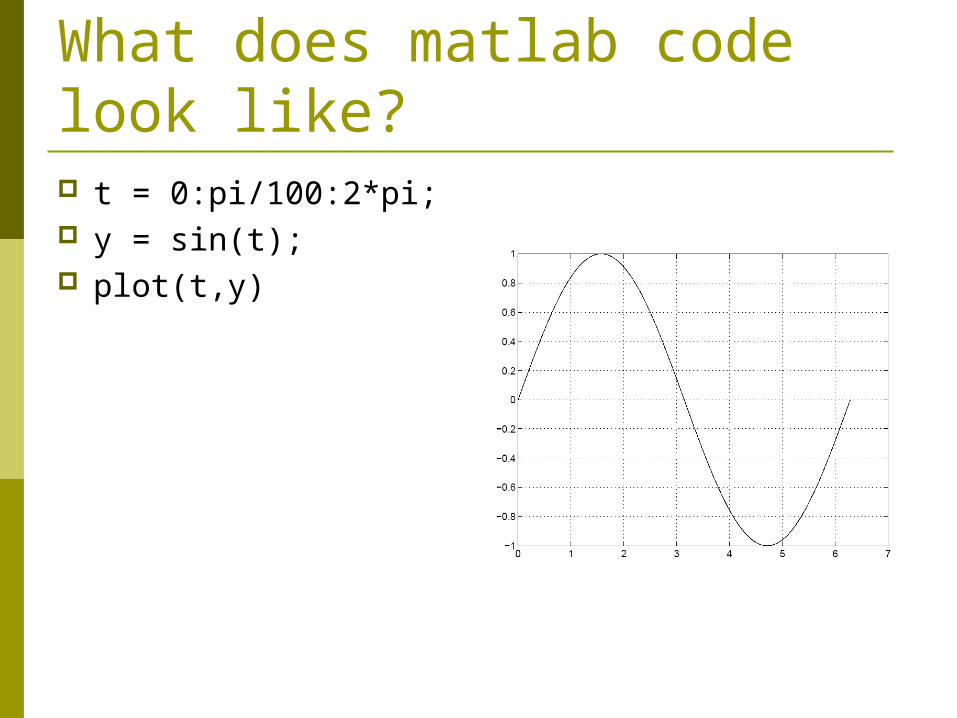
What does matlab code look like? t = 0:pi/100:2*pi; y = sin(t); plot(t,y)
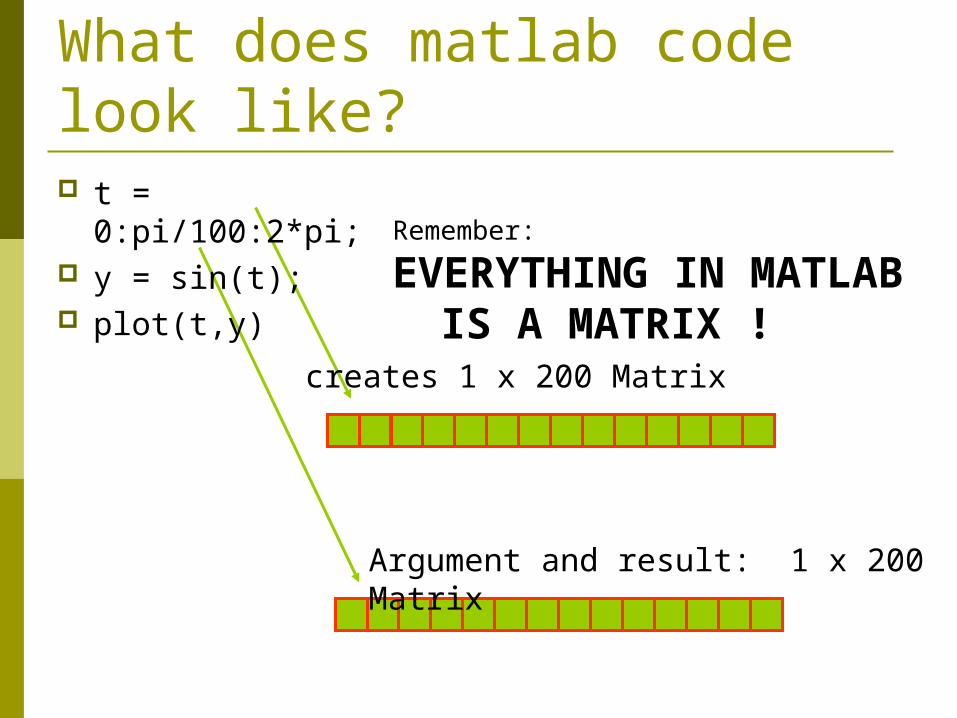
What does matlab code look like?
Remember:
EVERYTHING IN MATLAB IS A MATRIX !
creates 1 x 200 Matrix
Argument and result: 1 x 200 Matrix
t = 0:pi/100:2*pi; y = sin(t); plot(t,y)
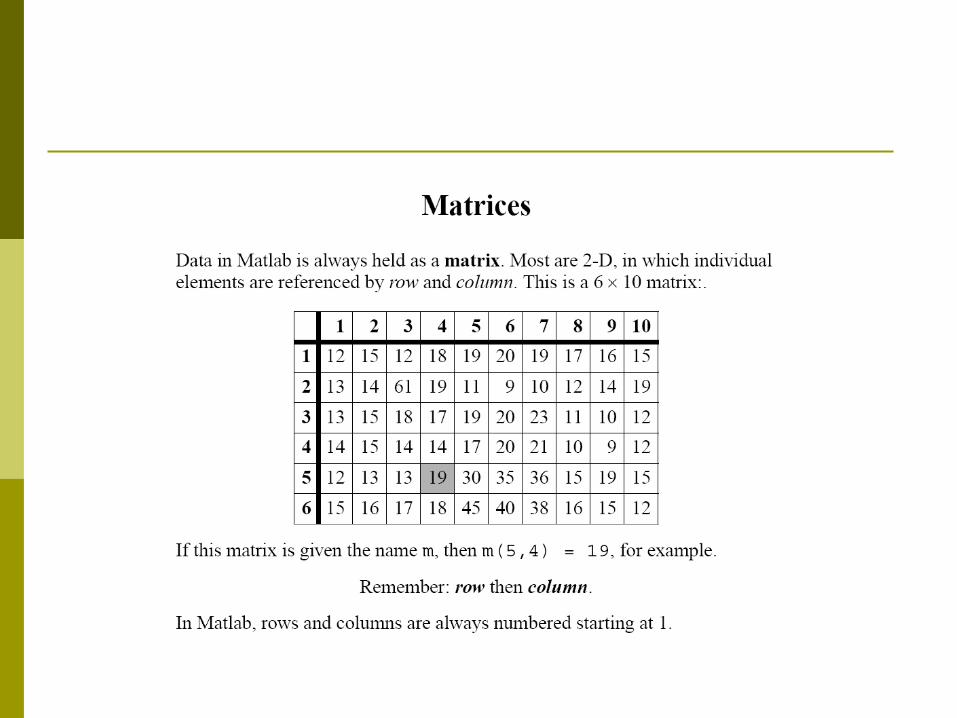
Rows and columns are always numbered starting at 1
A single number is really a 1 x 1 matrix in Matlab!
Matlab variables are not given a type, and do not need to be declared
Any matrix can be assigned to any variable
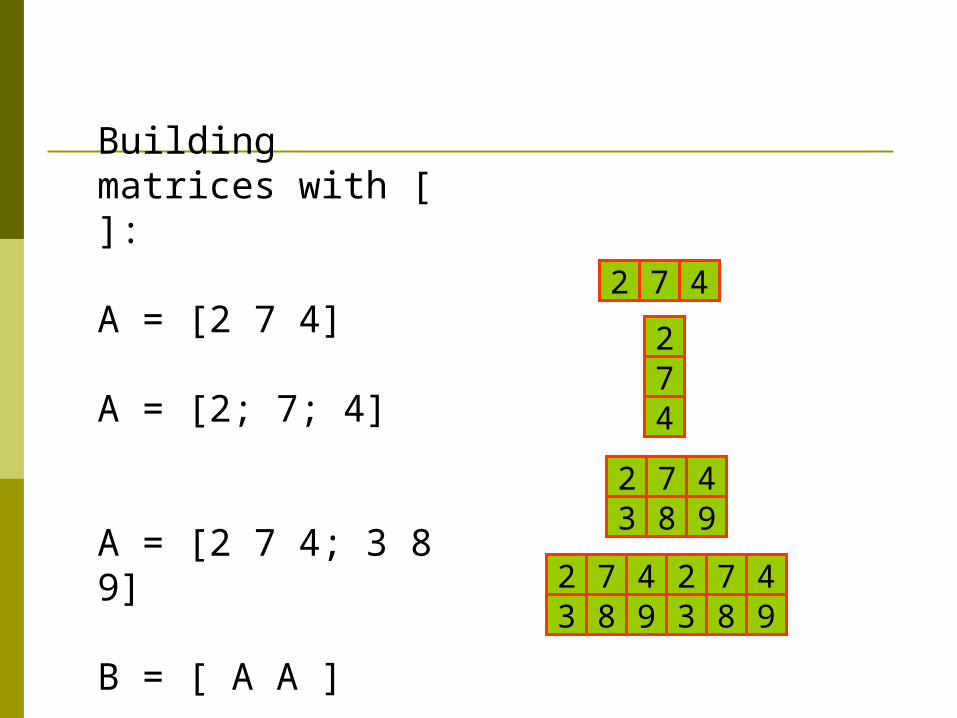
Building matrices with [ ]:
A = [2 7 4]
A = [2; 7; 4]
A = [2 7 4; 3 8 9]
B = [ A A ]
2 7 4
274
2 7 43 8 9
2 7 43 8 9
2 7 43 8 9
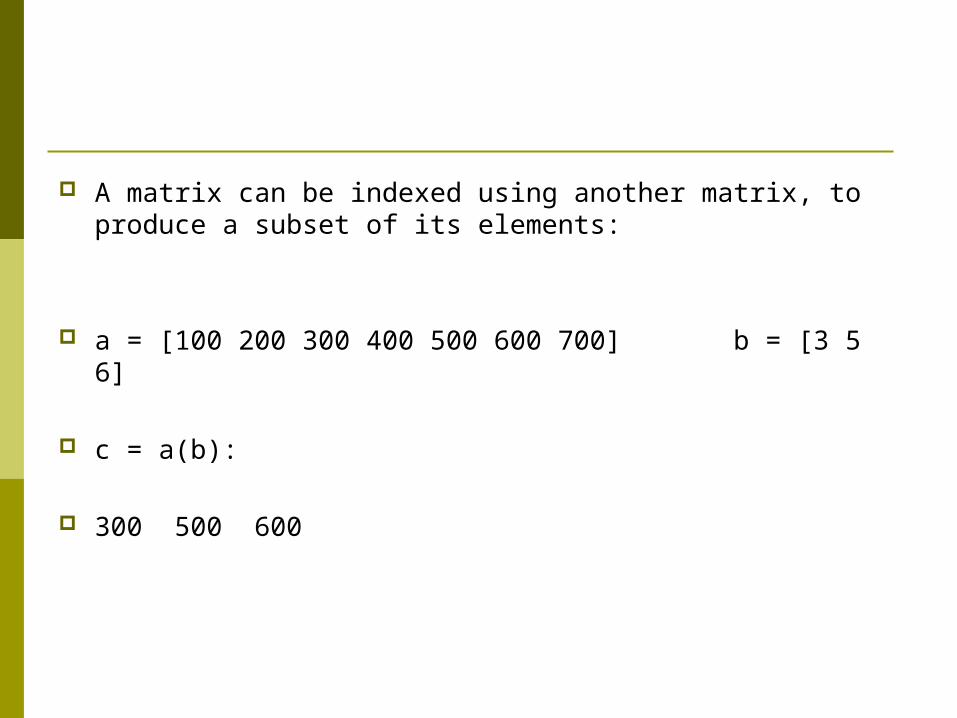
A matrix can be indexed using another matrix, to produce a subset of its elements:
a = [100 200 300 400 500 600 700] b = [3 5 6]
c = a(b):
300 500 600
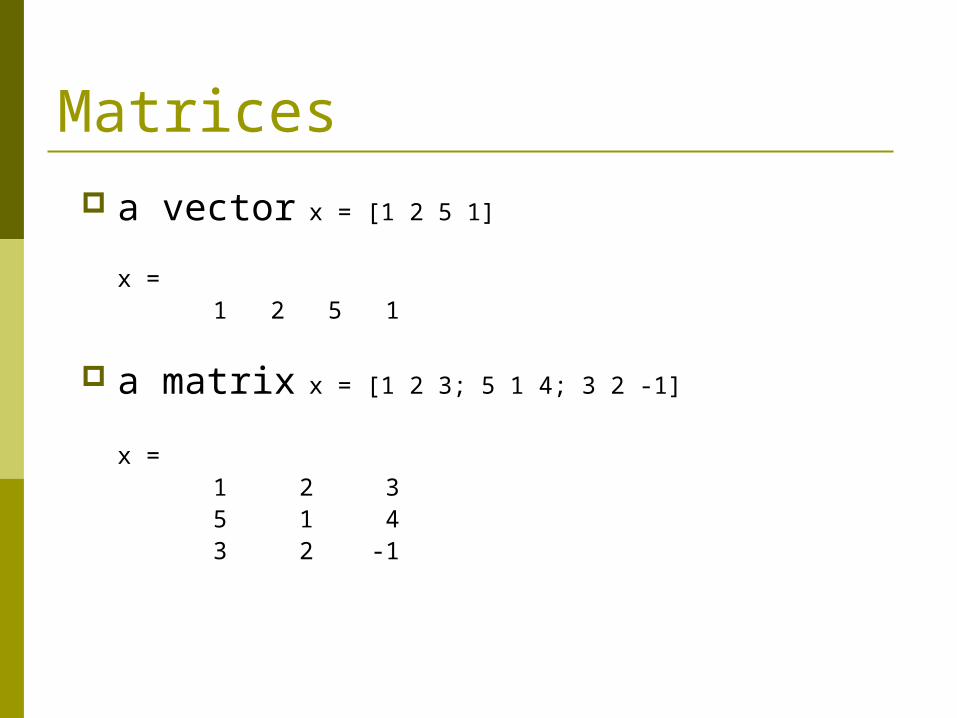
Matrices a vector x = [1 2 5 1]
x = 1 2 5 1
a matrix x = [1 2 3; 5 1 4; 3 2 -1]
x = 1 2 3 5 1 4 3 2 -1
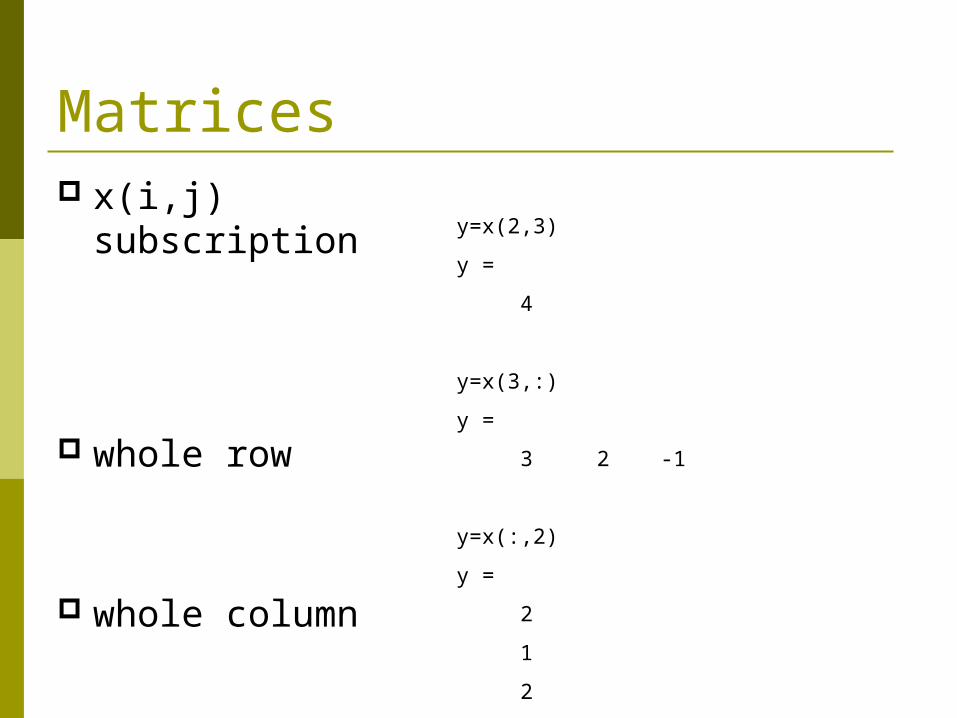
Matrices x(i,j) subscription
whole row
whole column
y=x(2,3)
y =
4
y=x(3,:)
y =
3 2 -1
y=x(:,2)
y =
2
1
2
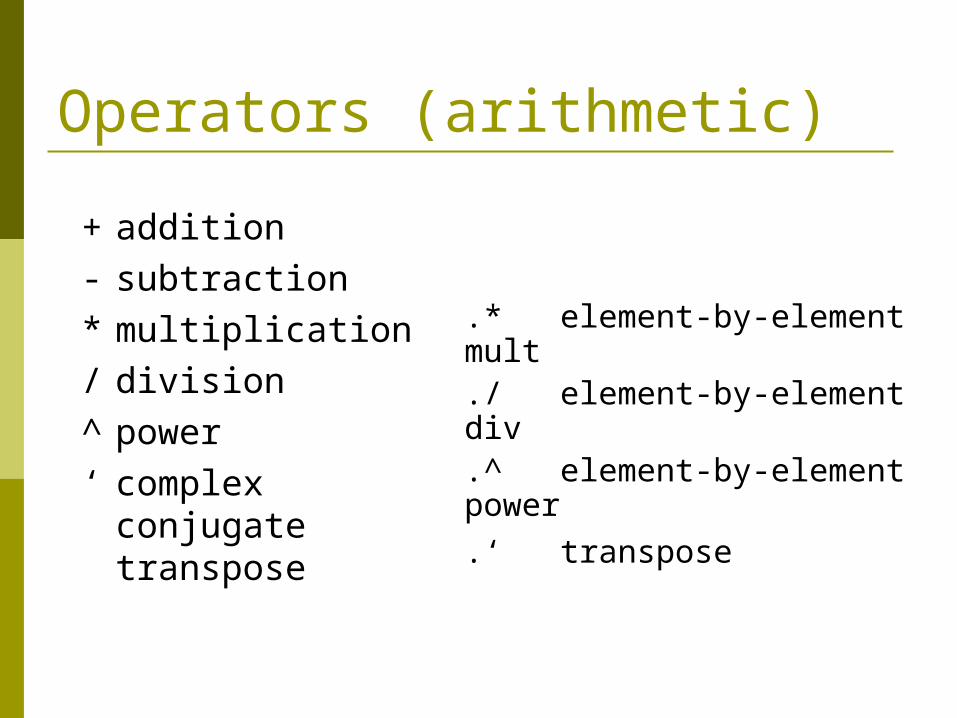
Operators (arithmetic)
+addition- subtraction* multiplication/ division^power‘ complex
conjugate transpose
.* element-by-element mult
./ element-by-element div
.^ element-by-element power
.‘ transpose
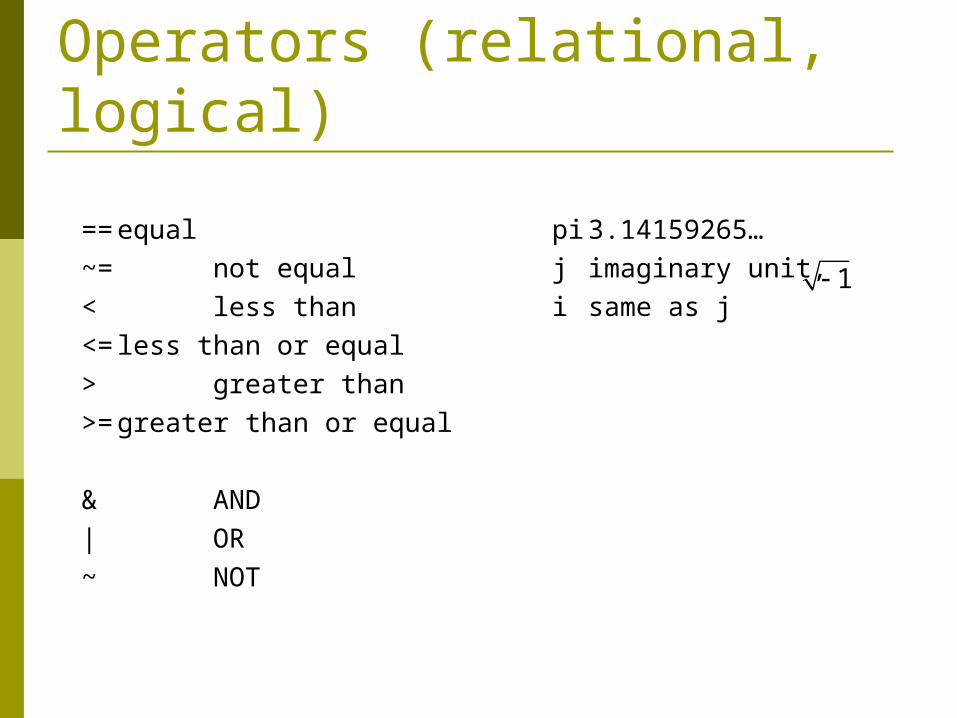
Operators (relational, logical)
== equal~= not equal< less than<= less than or equal> greater than>= greater than or
equal
& AND| OR~ NOT
1
pi 3.14159265…
j imaginary unit,
i same as j
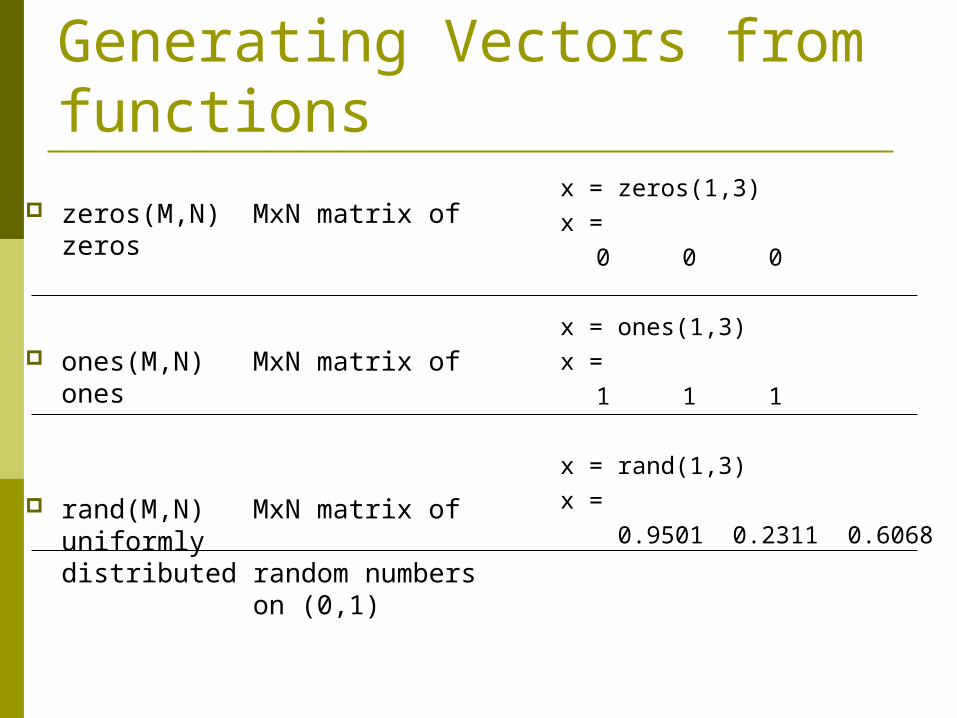
Generating Vectors from functions
zeros(M,N) MxN matrix of zeros
ones(M,N) MxN matrix of ones
rand(M,N) MxN matrix of uniformly distributed random numbers
on (0,1)
x = zeros(1,3)
x =
0 0 0
x = ones(1,3)
x =
1 1 1
x = rand(1,3)
x =
0.9501 0.2311 0.6068
M-files Executing commands in the command window is
fine for short scripts; but when dealing with long scripts for complex problem-solving (or when programming) M-files is a must.
It allows the user to write MATLAB command in a text file (called M-file) and then MATLAB will open the file and execute the commands exactly as it would if the user typed them at the MATLAB Command Window. The M-file editor is the MATLAB’s tool for creating M-files.
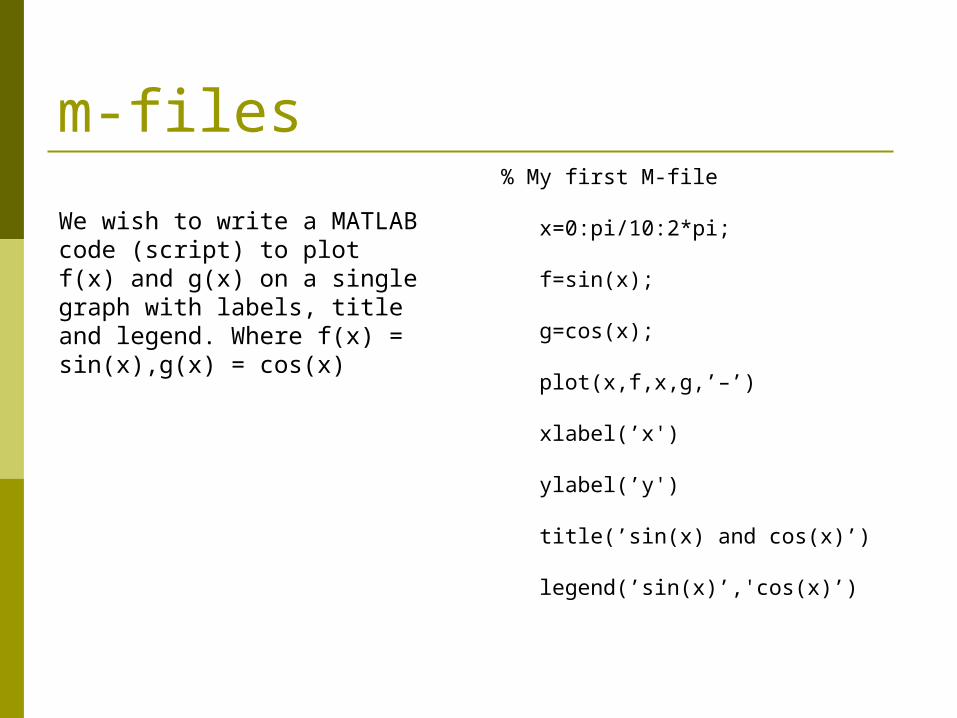
m-files % My first M-file
x=0:pi/10:2*pi;
f=sin(x);
g=cos(x);
plot(x,f,x,g,’–’)
xlabel(’x')
ylabel(’y')
title(’sin(x) and cos(x)’)
legend(’sin(x)’,'cos(x)’)
We wish to write a MATLAB code (script) to plot f(x) and g(x) on a single graph with labels, title and legend. Where f(x) = sin(x),g(x) = cos(x)
Where is this going? As a final assignment in the course, we will
be writing a Matlab script (or function) to solve a beam problem