Embed Size (px)
Citation preview
Engagement or alienation:
The transition to secondary
school mathematics
Susan Fullarton
B. App. Sc.(Mathematics), Dip. Ed., Grad. Dip. Math. Ed., M. Ed. Studies.
A thesis submitted for the degree of Doctor of Philosophy in the Faculty of Education,
Monash University
January, 1998
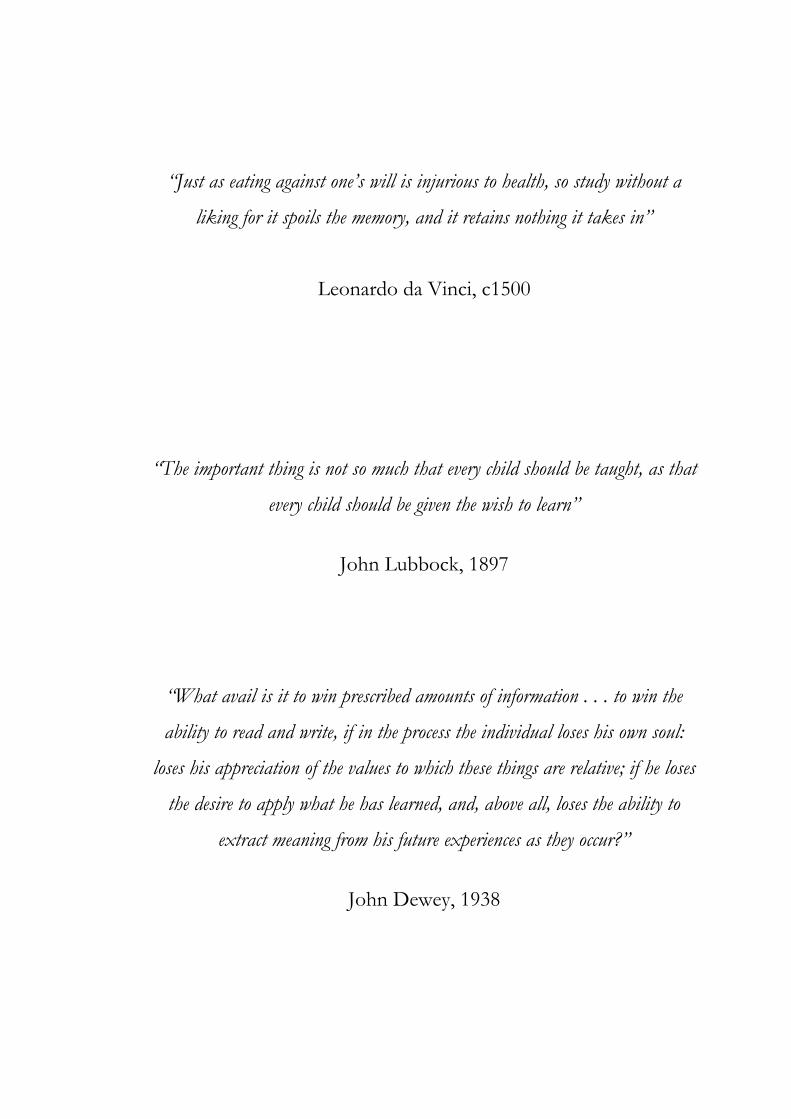
“Just as eating against one’s will is injurious to health, so study without a
liking for it spoils the memory, and it retains nothing it takes in”
Leonardo da Vinci, c1500
“The important thing is not so much that every child should be taught, as that
every child should be given the wish to learn”
John Lubbock, 1897
“What avail is it to win prescribed amounts of information . . . to win the
ability to read and write, if in the process the individual loses his own soul:
loses his appreciation of the values to which these things are relative; if he loses
the desire to apply what he has learned, and, above all, loses the ability to
extract meaning from his future experiences as they occur?”
John Dewey, 1938
Table of Contents
List of Tables__________________________________________________v
List of Figures _______________________________________________ viii
Abstract _________________________________________________ ix
Declaration _________________________________________________ xi
Acknowledgments____________________________________________ xii
Chapter 1: Introduction to the study
1.1 Transitions ______________________________________________1 1.2 Calls for research on the middle years of schooling ________________2 1.3 Changes in mathematics ____________________________________4 1.4 The present study _________________________________________5 1.5 Outline of this thesis _______________________________________7 1.6 Summary _______________________________________________10
Chapter 2: Jumping the first hurdle: Transition to secondary school mathematics
2.1 Introduction ____________________________________________11 2.2 Alienation or engagement __________________________________11 2.3 Individual responses to transition ____________________________14 2.4 Transition and adolescence _________________________________16 2.5 Pressure from above ______________________________________16 2.5 Transition and mathematics_________________________________17 2.7 Transition and other variables _______________________________20 2.8 Changes in curriculum and teaching over transition_______________23 2.9 Systemic responses to transition _____________________________26 2.10 A motivational approach to the study of transition _______________29 2.11 Summary _______________________________________________30
Chapter 3: A Motivational Framework
3.1 Introduction ____________________________________________34 3.2 Motivation______________________________________________34 3.3 Metacognition ___________________________________________39 3.4 Competence ____________________________________________43 3.5 Autonomy______________________________________________44 3.6 Relatedness _____________________________________________45 3.7 Motivational engagement___________________________________46 3.8 Locus of control _________________________________________49 3.9 Attribution theory ________________________________________50 3.10 Learned helplessness ______________________________________52
ii
3.11 Self-efficacy_____________________________________________53 3.12 The perceived control model________________________________54
3.12.1 Strategy beliefs _______________________________________55 3.12.2 Capacity beliefs _______________________________________56 3.12.3 Control beliefs________________________________________56
3.13 Findings from other studies_________________________________58 3.14 The impact of perceived control _____________________________60 3.15 Self-regulation ___________________________________________64 3.16 Relationships with teachers and peers _________________________66 3.17 Summary _______________________________________________68 3.18 Conclusions_____________________________________________71
Chapter 4: Methods and Instruments
4.1 Introduction ____________________________________________72 4.2 Method of study _________________________________________72 4.3 Procedures _____________________________________________73 4.4 Data collection __________________________________________80 4.5 Instruments_____________________________________________82
4.5.1 Students’ questionnaire _________________________________83 4.5.1.1 Your views about mathematics _________________________83 4.5.1.2 Perceptions of teacher involvement, autonomy support and
provision of structure _______________________________84 4.5.1.3 Perceived control ___________________________________84 4.5.1.4 Coping style _______________________________________86 4.5.1.5 Relatedness________________________________________86 4.5.1.6 Autonomy ________________________________________87 4.5.1.7 Engagement _______________________________________87 4.5.1.8 Classroom environment ______________________________87 4.5.1.9 Ratings in mathematics_______________________________88
4.5.2 Teacher’s rating of student engagement_____________________88 4.6 Additional questions ______________________________________89 4.7 Summary _______________________________________________90
Chapter 5: Validation of instruments
5.1 Introduction ____________________________________________92 5.2 Data screening___________________________________________93 5.3 Missing data ____________________________________________93 5.4 Perceived control beliefs ___________________________________94 5.5 Engagement ____________________________________________97 5.6 Self-regulation ___________________________________________98 5.7 Coping ________________________________________________99 5.8 Relatedness ____________________________________________ 101 5.9 Summary ______________________________________________ 104
iii
Chapter 6: Cross-sectional comparisons
6.1 Introduction ___________________________________________ 105 6.2 Research questions ______________________________________ 105 6.3 Statistical methods_______________________________________ 106 6.4 Analysis of cross-sectional data: Aims ________________________ 106
6.4.1 Stage 1: Early grade 6 _________________________________ 107 6.4.1.1 Descriptive statistics________________________________ 107 6.4.1.2 Correlations between variables ________________________ 107 6.4.1.3 Regression analysis_________________________________ 111
6.4.2 Stage 2: Late grade 6 __________________________________ 112 6.4.2.1 Descriptive statistics _______________________________ 112 6.4.2.2 Correlations______________________________________ 113 6.4.2.3 Regression analysis_________________________________ 114
6.4.3 Stage 3: Year 7_______________________________________ 115 6.4.3.1 Descriptive statistics _______________________________ 115 6.4.3.2 Correlations______________________________________ 116 6.4.3.3 Regression analysis_________________________________ 118 6.4.3.4 Analysis of variance on extreme groups _________________ 118
6.5 Summary and discussion of results __________________________ 120 Chapter 7: Longitudinal comparisons
7.1 Introduction ___________________________________________ 123 7.2 Comparing stages: Looking longitudinally _____________________ 123 7.3 Statistical methods_______________________________________ 124
7.3.1 Use of repeated measures ______________________________ 124 7.3.2 Contrasts and trend analysis ____________________________ 125
7.4 Perceived control measures ________________________________ 126 7.5 Engagement, ability and antecedents of perceived control _________ 131 7.6 Relatedness ____________________________________________ 133 7.7 “How Good?” measures __________________________________ 134 7.8 Autonomy_____________________________________________ 138 7.9 Coping styles ___________________________________________ 140 7.10 Views about mathematics _________________________________ 141 7.11 Summary ______________________________________________ 147
Chapter 8: Trajectories of perceived control
8.1 Longitudinal data analysis: A different view ____________________ 149 8.2 Cluster analysis _________________________________________ 150
8.2.1 Hierarchical cluster analysis _____________________________ 151 8.2.2 Stopping rules _______________________________________ 152 8.2.3 Non-hierarchical cluster analysis _________________________ 154
8.3 Cluster analysis of the smaller data set ________________________ 155 8.3.1 Agglomerative hierarchical clustering______________________ 155 8.3.2 k-means cluster analysis________________________________ 156
8.4 Cluster solutions for the larger sample________________________ 158 8.4.1 Validity and replicability of cluster solutions ________________ 158 8.4.2 Hierarchical cluster analysis _____________________________ 159 8.4.3 k-means cluster analysis________________________________ 159
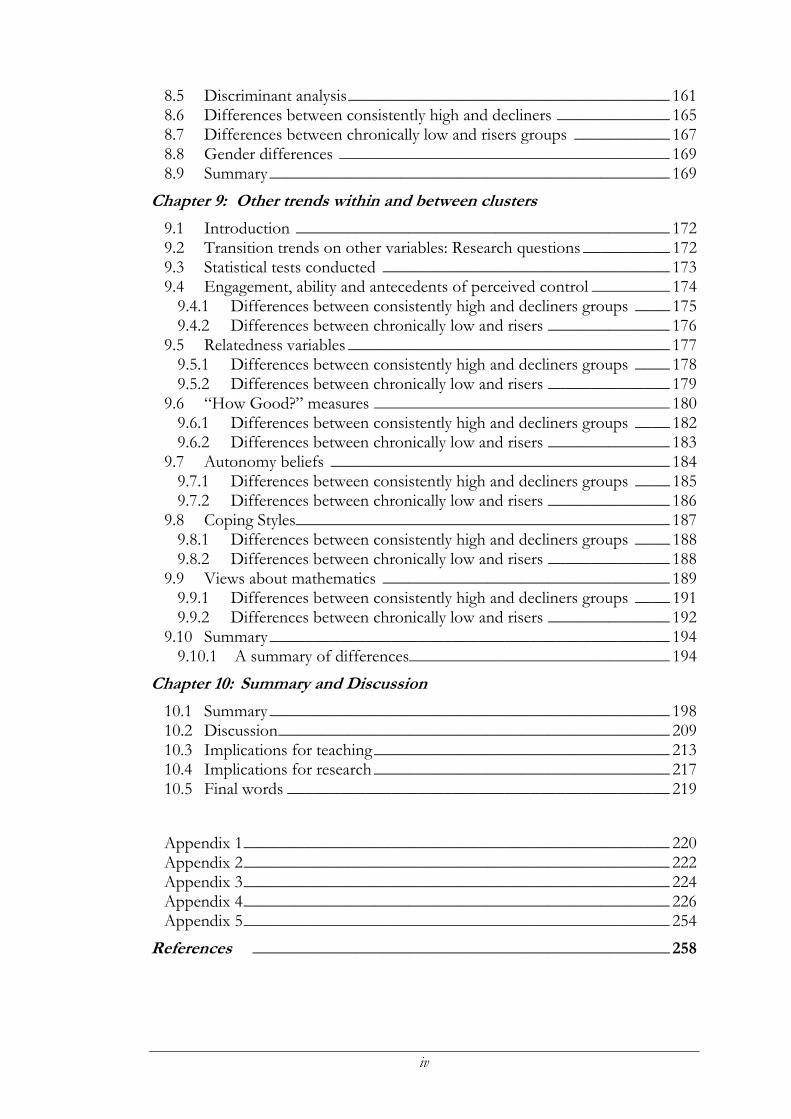
iv
8.5 Discriminant analysis_____________________________________ 161 8.6 Differences between consistently high and decliners _____________ 165 8.7 Differences between chronically low and risers groups ___________ 167 8.8 Gender differences ______________________________________ 169 8.9 Summary ______________________________________________ 169
Chapter 9: Other trends within and between clusters
9.1 Introduction ___________________________________________ 172 9.2 Transition trends on other variables: Research questions __________ 172 9.3 Statistical tests conducted _________________________________ 173 9.4 Engagement, ability and antecedents of perceived control _________ 174
9.4.1 Differences between consistently high and decliners groups ____ 175 9.4.2 Differences between chronically low and risers ______________ 176
9.5 Relatedness variables _____________________________________ 177 9.5.1 Differences between consistently high and decliners groups ____ 178 9.5.2 Differences between chronically low and risers ______________ 179
9.6 “How Good?” measures __________________________________ 180 9.6.1 Differences between consistently high and decliners groups ____ 182 9.6.2 Differences between chronically low and risers ______________ 183
9.7 Autonomy beliefs _______________________________________ 184 9.7.1 Differences between consistently high and decliners groups ____ 185 9.7.2 Differences between chronically low and risers ______________ 186
9.8 Coping Styles___________________________________________ 187 9.8.1 Differences between consistently high and decliners groups ____ 188 9.8.2 Differences between chronically low and risers ______________ 188
9.9 Views about mathematics _________________________________ 189 9.9.1 Differences between consistently high and decliners groups ____ 191 9.9.2 Differences between chronically low and risers ______________ 192
9.10 Summary ______________________________________________ 194 9.10.1 A summary of differences______________________________ 194
Chapter 10: Summary and Discussion
10.1 Summary ______________________________________________ 198 10.2 Discussion_____________________________________________ 209 10.3 Implications for teaching__________________________________ 213 10.4 Implications for research __________________________________ 217 10.5 Final words ____________________________________________ 219
Appendix 1_________________________________________________ 220 Appendix 2_________________________________________________ 222 Appendix 3_________________________________________________ 224 Appendix 4_________________________________________________ 226 Appendix 5_________________________________________________ 254
References ________________________________________________ 258
v
List of Tables
Table 2.1 Studies Examining Transition from Primary to Secondary School in Mathematics ............... 12
Table 3.1 Studies Carried Out Using Aspects of the Perceived Competence Model .............................. 58
Table 4.1 Number of Male and Female Students at Each Primary School in Stage 2............................ 77
Table 4.2 Movement of Students from Primary to Participating Secondary Schools ............................. 79
Table 4.3 Additional Short Answer Questions Asked at Each Stage of the Study................................... 90
Table 5.1 Eigenvalues and Factor Loadings (Varimax Rotation) for Perceived Control Scales,
Stage 2 .................................................................................................................................... 95
Table 5.2 Reliability Analysis on Perceived Control Variables ............................................................. 96
Table 5.3 Eigenvalues and Factor Loadings (Varimax Rotation) for Self-Regulation Scale,
Stage 2 .................................................................................................................................... 98
Table 5.4 Reliability Analysis on Self-Regulation Variables .................................................................. 99
Table 5.5 Eigenvalues and Factor Loadings (Varimax Rotation) for Coping Scale, Stage 2 .............. 100
Table 5.6 Reliability Analysis on Coping Scales .................................................................................. 100
Table 5.7 Eigenvalues and Factor Loadings (Varimax Rotation) for Relatedness Scale, Stage 2 ....... 101
Table 5.8 Reliability Analysis on Relatedness Scales ........................................................................... 102
Table 5.9 Eigenvalues and Factor Loadings (Varimax Rotation) for Classroom Environment Scale, Stage 2........................................................................................................................ 103
Table 6.1 Descriptive Statistics for Stage 1 Students: Perceived Control Variables ........................... 107
Table 6.2 Correlations Among Strategy and Capacity Beliefs: Stage 1 .............................................. 108
Table 6.3 Correlations Between Perceived Control and Its Proposed Antecedents and Consequences: Stage 1 ......................................................................................................... 110
Table 6.4 Descriptive Statistics for Stage 2 Students: Perceived Control Variables ........................... 112
Table 6.5 Correlations Among Strategy and Capacity Beliefs: Stage 2 ............................................... 113
Table 6.6 Correlations Between Perceived Control and Its Proposed Antecedents and Consequences: Stage 2 ......................................................................................................... 114
Table 6.7 Descriptive Statistics for Stage 3 Students: Perceived Control Variables ........................... 116
Table 6.8 Correlations Among Strategy and Capacity Beliefs: Stage 3 ............................................... 116
Table 6.9 Correlations Between Perceived Control and Its Proposed Antecedents and Consequences: Stage 3 ......................................................................................................... 117
Table 7.1 Descriptive Statistics for Perceived Control Variables for Students Common to Stages 1 and 2 .................................................................................................................................. 127
Table 7.2 Descriptive Statistics for Perceived Control Variables for Students Common to Stages 2 and 3 .................................................................................................................................... 128
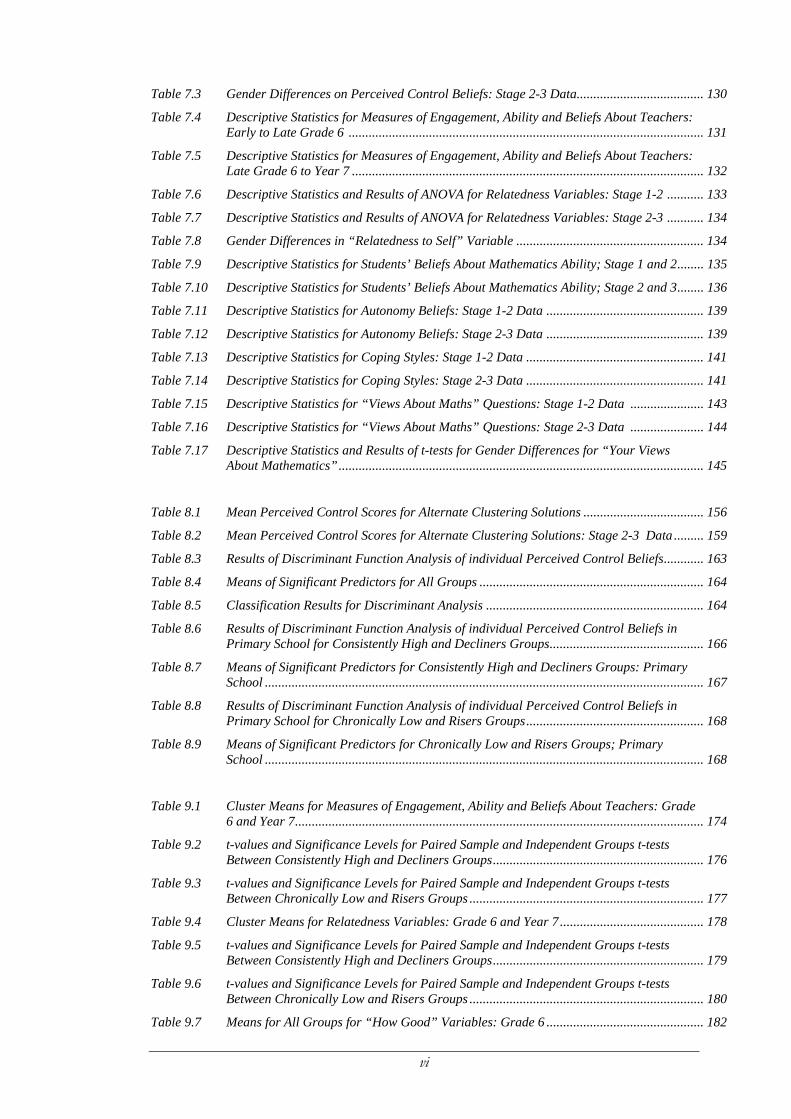
vi
Table 7.3 Gender Differences on Perceived Control Beliefs: Stage 2-3 Data...................................... 130
Table 7.4 Descriptive Statistics for Measures of Engagement, Ability and Beliefs About Teachers: Early to Late Grade 6 .......................................................................................................... 131
Table 7.5 Descriptive Statistics for Measures of Engagement, Ability and Beliefs About Teachers: Late Grade 6 to Year 7 ......................................................................................................... 132
Table 7.6 Descriptive Statistics and Results of ANOVA for Relatedness Variables: Stage 1-2 ........... 133
Table 7.7 Descriptive Statistics and Results of ANOVA for Relatedness Variables: Stage 2-3 ........... 134
Table 7.8 Gender Differences in “Relatedness to Self” Variable ........................................................ 134
Table 7.9 Descriptive Statistics for Students’ Beliefs About Mathematics Ability; Stage 1 and 2........ 135
Table 7.10 Descriptive Statistics for Students’ Beliefs About Mathematics Ability; Stage 2 and 3........ 136
Table 7.11 Descriptive Statistics for Autonomy Beliefs: Stage 1-2 Data ............................................... 139
Table 7.12 Descriptive Statistics for Autonomy Beliefs: Stage 2-3 Data ............................................... 139
Table 7.13 Descriptive Statistics for Coping Styles: Stage 1-2 Data ..................................................... 141
Table 7.14 Descriptive Statistics for Coping Styles: Stage 2-3 Data ..................................................... 141
Table 7.15 Descriptive Statistics for “Views About Maths” Questions: Stage 1-2 Data ...................... 143
Table 7.16 Descriptive Statistics for “Views About Maths” Questions: Stage 2-3 Data ...................... 144
Table 7.17 Descriptive Statistics and Results of t-tests for Gender Differences for “Your Views About Mathematics”............................................................................................................. 145
Table 8.1 Mean Perceived Control Scores for Alternate Clustering Solutions .................................... 156
Table 8.2 Mean Perceived Control Scores for Alternate Clustering Solutions: Stage 2-3 Data ......... 159
Table 8.3 Results of Discriminant Function Analysis of individual Perceived Control Beliefs............ 163
Table 8.4 Means of Significant Predictors for All Groups ................................................................... 164
Table 8.5 Classification Results for Discriminant Analysis ................................................................. 164
Table 8.6 Results of Discriminant Function Analysis of individual Perceived Control Beliefs in Primary School for Consistently High and Decliners Groups.............................................. 166
Table 8.7 Means of Significant Predictors for Consistently High and Decliners Groups: Primary School ................................................................................................................................... 167
Table 8.8 Results of Discriminant Function Analysis of individual Perceived Control Beliefs in Primary School for Chronically Low and Risers Groups..................................................... 168
Table 8.9 Means of Significant Predictors for Chronically Low and Risers Groups; Primary School ................................................................................................................................... 168
Table 9.1 Cluster Means for Measures of Engagement, Ability and Beliefs About Teachers: Grade 6 and Year 7.......................................................................................................................... 174
Table 9.2 t-values and Significance Levels for Paired Sample and Independent Groups t-tests Between Consistently High and Decliners Groups............................................................... 176
Table 9.3 t-values and Significance Levels for Paired Sample and Independent Groups t-tests Between Chronically Low and Risers Groups ...................................................................... 177
Table 9.4 Cluster Means for Relatedness Variables: Grade 6 and Year 7 ........................................... 178
Table 9.5 t-values and Significance Levels for Paired Sample and Independent Groups t-tests Between Consistently High and Decliners Groups............................................................... 179
Table 9.6 t-values and Significance Levels for Paired Sample and Independent Groups t-tests Between Chronically Low and Risers Groups ...................................................................... 180
Table 9.7 Means for All Groups for “How Good” Variables: Grade 6 ............................................... 182
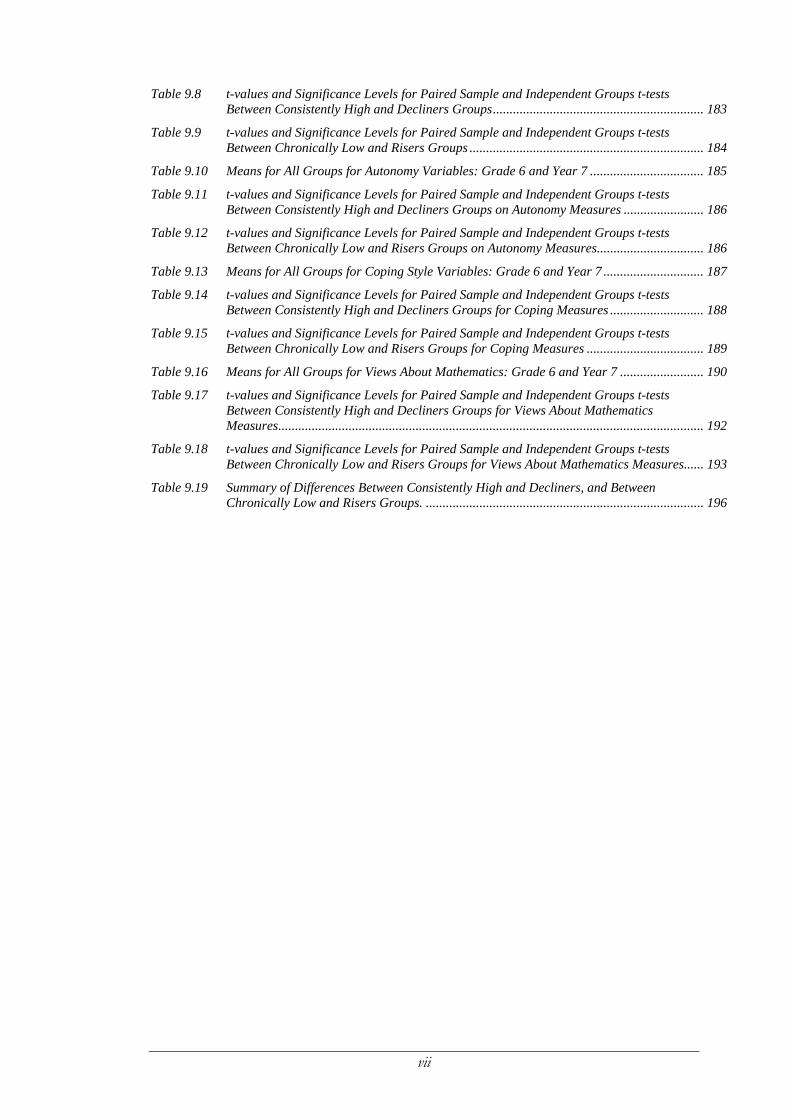
vii
Table 9.8 t-values and Significance Levels for Paired Sample and Independent Groups t-tests Between Consistently High and Decliners Groups............................................................... 183
Table 9.9 t-values and Significance Levels for Paired Sample and Independent Groups t-tests Between Chronically Low and Risers Groups ...................................................................... 184
Table 9.10 Means for All Groups for Autonomy Variables: Grade 6 and Year 7 .................................. 185
Table 9.11 t-values and Significance Levels for Paired Sample and Independent Groups t-tests Between Consistently High and Decliners Groups on Autonomy Measures ........................ 186
Table 9.12 t-values and Significance Levels for Paired Sample and Independent Groups t-tests Between Chronically Low and Risers Groups on Autonomy Measures................................ 186
Table 9.13 Means for All Groups for Coping Style Variables: Grade 6 and Year 7 .............................. 187
Table 9.14 t-values and Significance Levels for Paired Sample and Independent Groups t-tests Between Consistently High and Decliners Groups for Coping Measures ............................ 188
Table 9.15 t-values and Significance Levels for Paired Sample and Independent Groups t-tests Between Chronically Low and Risers Groups for Coping Measures ................................... 189
Table 9.16 Means for All Groups for Views About Mathematics: Grade 6 and Year 7 ......................... 190
Table 9.17 t-values and Significance Levels for Paired Sample and Independent Groups t-tests Between Consistently High and Decliners Groups for Views About Mathematics Measures............................................................................................................................... 192
Table 9.18 t-values and Significance Levels for Paired Sample and Independent Groups t-tests Between Chronically Low and Risers Groups for Views About Mathematics Measures...... 193
Table 9.19 Summary of Differences Between Consistently High and Decliners, and Between Chronically Low and Risers Groups. ................................................................................... 196
viii
List of Figures
Figure 3.1 A motivational model of the effects of children’s psychological needs on their
engagement ............................................................................................................................ 48
Figure 3.2 Weiner’s attributional theory model....................................................................................... 50
Figure 3.3 A measure of children’s control, strategy and capacity beliefs in the academic domain ....... 57
Figure 6.1 Teacher-rated student engagement as a function of the interaction between strategy and
capacity beliefs, stage 2 sample ........................................................................................... 119
Figure 7.1 Means for perceived control variables for 74 students common to stages 1, 2 and 3 .......... 129
Figure 7.2 Student-rated engagement levels for stages 1, 2 and 3......................................................... 133
Figure 7.3 Graphs representing three stage data for “How Good” variables for female and male
students ................................................................................................................................. 137
Figure 7.4 Student reasons for working in mathematics: three stage data ............................................ 140
Figure 8.1 Means for perceived control over the primary-secondary transition for two, three and
four cluster solutions ............................................................................................................ 157
Figure 8.2 Means for two, three and four cluster solutions; wave 2 and 3 data set .............................. 160
Figure 8.3 Group centroids for the four cluster solution ....................................................................... 162
ix
Abstract
Transition to secondary school is one of the critical periods in a student’s
life, occurring as it does at the junction of childhood and adolescence. A number
of government reports have called for a greater emphasis on these middle years
of schooling, proposing that attention to these periods in a student’s life may
prevent some of the alienation with learning that is often seen in the later years of
secondary school. In mathematics, transition entails the change to a more formal
and abstract curriculum, and it seems that student disaffection occurs more
frequently in mathematics than in other subjects. Very few longitudinal studies
have examined transition to secondary school in mathematics; none in the last
few years when there have been enormous changes to the school system.
The lens that was chosen through which to view transition was that of
perceived control. The perceived control model examines the amount of control
students believe they have over the learning process, and in this study the effect
of a number of other variables such as beliefs about self, coping strategies and
self-regulation were also examined. The outcome measured was engagement in
learning; cognitive, emotional and behavioural. Prior research indicated that
engagement in learning promotes metacognition and self-esteem, and can help
make mathematics meaningful and enjoyable for all students, not just those who
achieve at the highest levels.
The study followed several cohorts of students from late grade 6 to the
middle of year 7, using a survey methodology. At each stage of the study
x
students completed a survey measuring aspects of perceived control, beliefs
about mathematics, coping, self-regulation and perceptions of the classroom
environment. Students were also asked to comment on aspects of primary
school and the transition to secondary school, and asked to reflect on their own
ability in mathematics and others’ perceptions of that ability.
Traditional forms of analysis of longitudinal data revealed few changes to
beliefs either during the grade 6 year or over the transition to secondary school.
However did this reflect a situation of no change, or were there changes masked
by the method of data analysis? In order to address this question, cluster analysis
was employed to investigate trajectories of change in the perceived control
construct over transition. This analysis was successful, finding four distinct
patterns of transition.
A highly successful group of students took transition in its stride, while a
poorly engaged and unmotivated group continued to struggle. A third group,
whose members were unsure and not highly engaged in primary school, seemed
to find their feet in secondary school and show higher levels of engagement. The
fourth and largest group of students would not have been identified by their
primary teachers as potentially having problems at secondary school, and yet they
suffer a decline in perceived control in combination with a decline in
engagement, coping skills, self-regulation and perception of self. These children
are particularly at risk of disaffection in mathematics, and a number of
recommendations are made to help identify these students and to address some
of their common problems.
xi
Declaration
This thesis contains no material which has been accepted for the
award of any other degree or diploma in any university or other
institution. To the best of my knowledge this thesis contains no
material previously published or written by another person, except
where due reference is made.
Sue Fullarton
Approved by the Monash University Standing Committee on Ethics in Research on Humans: Approval number E3.13/95
xii
Acknowledgments
Thanks must firstly go to the schools and teachers who agreed to participate in this
study. It should be acknowledged that these school communities gave freely of their
time when under increasing pressure from politicians and the public. Thank you in
particular to the students who completed surveys over a period of eighteen months.
Associate Professor Glenn Rowley continued the supervision of this thesis after my
original supervisor Dr Dudley Blane departed for Pakistan. Thank you Glenn for
your guidance and encouragement, for the coffee, and for not making early
appointments.
Many other people in the Faculty of Education have been very supportive; in
particular my good mate Julie Ryan, who even managed to give frequent advice from
Manchester; and also Julie Pallant, Greg Carroll and Gail Paasse. Thanks to Sharon
Fitzgerald and David Yammouni, who helped pick up the pieces after the inevitable
computer malfunction.
Many years ago my father in particular encouraged my study of mathematics,
knowing that in a technological society it would be a vital skill. His death provided a
further spur for me to work towards this degree, and I wish he were here to share
this time with me. Thanks to my mother, for always being there, to my other
friends, for their shoulders, and to Debra Harris, for proofreading.
Lastly, thanks to my family: Tony, Jessie and Daniel. This thesis has been
contemplated, written and proofread while chauffeuring, watching swimming and
softball, listening to clarinet, trombone and recorder practice and concerts. May you
go gently through the transitions in your lives, and thanks for being there to remind
me that there is a real world out there!
1
Chapter 1
Introduction to the study
1.1 Transitions
The move from primary to secondary school is one of many transitions that
people will make in their lives. As we move through childhood, we also move
from pre-primary to primary school and later in various combinations from
secondary school to tertiary education and to the labour force. Many of us
change jobs or careers more than once in our lifetime, and hence the concept of
transition is not alien to any of us.
Connell and Furman (1984) explained that “human lives appear to be
characterised by periods of relative stability and periods of marked change or
transition. These transitions are thought to be the times when major
reorganisation or discontinuities may occur” (p. 153). Clarke (1985, 1989) also
discussed discontinuities, and proposed “a general theory of transition … [which]
must confront those phenomena most frequently associated with the transition
experience” (p. 390). The key phenomena that Clarke argued contribute to this
model of transition are discontinuity, adjustment, challenge and regression. The first two
of these can be explained as:
Chapter 1: Introduction to the Study
2
… discontinuity is an inevitable (and defining) characteristic of transition and … personal discontinuity is experienced … as a challenge to established roles and behaviours. The consequent (and essential) process of adjustment may be realised through either acquiescence by the individual to the expectations and judgements of others, or through a process of self-realization in which individuals accept responsibility for their own learning behaviour and assert that responsibility through conscious choice. (Clarke, 1989, p. 391).
Acquiescence, Clarke argued, leads to regression, while self-realisation leads to
personal growth. It is the aim of this study to identify beliefs held by students
that either encourage self-realisation and hence facilitate engagement over
transition, or that lead to acquiescence and hinder engagement and adjustment
over transition.
1.2 Calls for research on the middle years of schooling
Transition is seen as a key stage in development by diverse bodies. Most
recently the Suicide Prevention Task Force, established in January 1997 by the
Victorian Government to investigate the high rate of youth suicide, reported on
several themes relevant to this study. The first of these themes was the
development of improved self-esteem among young people; the second was
support for individuals during key periods, including the transition from primary
to secondary school.
The report on the middle years of schooling conducted by the Schools
Council of the Australian National Board of Employment, Education and
Training (1993) argued that the middle years of schooling have received
insufficient attention. They stated that:
Chapter 1: Introduction to the Study
3
the primary - secondary paradigm, so clearly reflected in terms of the universal organisation of facilities, administration, curriculum, teacher training, teacher registration and professional development, has become so entrenched that this arbitrary division rarely tends to be questioned. (p. 3)
Implicit in this is the premise that the middle years of schooling need to be
treated more as a whole, with perhaps the merging of the two school systems, or
at least more of a blurring of the boundaries between them.
The Schools Council further expressed the view that the middle years of
schooling are highly significant because of their intrinsic value in the
development of adolescents. This intrinsic value is reflected in areas such as self-
esteem and valuing of learning, and in beliefs about learning that will impact on
students’ educational outcomes.
Following the review by the Schools Council, the Australian Department of
Employment, Education and Training (DEET), funded a Project of National
Significance, the Student Alienation during the Middle Years of Schooling Project
(Australian Curriculum Studies Association, 1996). It was noted that the focus of
a considerable amount of recent research had been on the problems of older
adolescents and students in post-compulsory education. The intention of the
Student Alienation Project was to focus on the “hidden alienation of years 5 - 8”
(Australian Curriculum Studies Association, 1996, p. 1) in order to attempt to
prevent some of the problems seen in the later years of schooling.
This ‘hidden alienation’ encompassed students “whose behaviour was rarely
problematic, but who appeared to be ‘switched off’, ‘tuned out’ or simply not
achieving” (Australian Curriculum Studies Association, 1996, p. 1). Students’
problems with engagement in learning could remain undetected by teachers, as
Chapter 1: Introduction to the Study
4
some students might conceal their lack of engagement and be reluctant to seek
help. Other students who appear bored or rebellious may feel this way because
they lack an understanding of how to learn effectively. The report pointed out
that even alienated students still want to succeed in areas of the curriculum that
they value, but they may need these areas dealt with in a different manner.
The Victorian Board of Studies, also concerned about transition problems,
recently formed a working party to address issues of discontinuity of curriculum.
It was argued that transition should be seen as part of the curriculum, presumably
for both primary and secondary schools. Recent reports from the Education
Committee of the Victorian Government, as yet unpublished, have pointed to
the possible need for a complete restructuring of the school system so as to focus
more attention and financial support to the middle years (Curtis, 1997).
1.3 Changes in mathematics
In mathematics in particular, where transition entails the change to a more
formal and abstract curriculum, problems students have with beliefs about
learning can critically affect their self-confidence. It has been shown that a lack
of self-confidence affects achievement and, one could argue more importantly,
learning (for example Eccles (Parsons), 1983; Gottfried, 1985; Wigfield, Eccles,
MacIver, Reuman, and Midgley, 1991).
Mathematics has been referred to as a critical filter for employment and
tertiary courses (Boomer, 1987; Sells, 1992), with Sells elaborating that
Ours is an increasingly technological society in which those who have no training in basic computation and the use of numbers and symbols will become the virtual “illiterates”. (p. 79)
Chapter 1: Introduction to the Study
5
High youth unemployment rates combined with more competitive entry to
tertiary study add more pressure for students to do well in mathematics or opt
out. Comments from students in Grade 6 indicate that they are aware that entry
to Year 7 “puts them on the treadmill” towards the VCE, and so the pressure to
achieve is felt all the way down the school.
1.4 The present study
This study focussed on the transition of students from primary to
secondary school, at the significant stage of development we label puberty. It is
at this point in young people’s lives that two major transitions occur
simultaneously; transition to a new learning environment and transition to young
adulthood. Some argue that it is precisely this combination that causes many of
the problems that are seen with transition, as students try to cope with two such
major changes at the same time. Others argue that the timing of the transition is
not the key, the environment at either end of the transition is more important.
In Victoria, Australia, students start school at the age of approximately five
years. They generally attend primary school for seven years then transfer to
secondary school for a further six years, culminating in the Victorian Certificate
of Education (VCE). In the government school setting, primary and secondary
schools are usually physically completely separate, and primary schools are
generally much smaller than secondary schools. Obvious changes over transition
then are the physical and social changes involved with moving to a new, large and
often complex setting, and re-establishing oneself within a peer group composed
of students from many different feeder schools.
Chapter 1: Introduction to the Study
6
Transition programs in secondary schools initially involve visits by the
secondary transition co-ordinator to the primary school and visits to the
secondary school by the primary students. After the transition, orientation
camps help to socialise children with their new peer group, and most schools
employ a home group program, where one teacher works closely with a small
group of children within a pastoral care paradigm. While all of these programs
are worthwhile for the emotional and social well being of the students, far less
emphasis is given to different ways of learning that will become necessary in
secondary school. While transition is seen by all involved in the process as more
significant than simply a change of schools, it should also be seen as more than
forming a new social group.
The focus of this study is on perceived control and engagement with
learning, rather than with the more traditional achievement. It will be argued that
engagement is a more fundamental construct than achievement, since learning
should be the primary goal of educators. The participants in this longitudinal
study were a group of several hundred students from diverse backgrounds who
were surveyed over the period from early Grade 6 through to the second term of
their Year 7 year in secondary school.
The perceived control model was chosen for this study because it presents a
rather different view of students’ beliefs about mathematics. This model focuses
on three aspects of beliefs about learning; control, strategy and capacity beliefs.
Briefly, control beliefs describe how much control students feel they have over
learning outcomes, strategy beliefs describe students’ beliefs about whether
particular strategies are effective in producing outcomes, while capacity beliefs
Chapter 1: Introduction to the Study
7
describe students’ beliefs about whether they are personally able to enact the
particular strategy.
Perceived control has been described as “a flexible set of interrelated beliefs
that are organized about interpretations of prior interactions in specific domains”
(Skinner, 1995, p. 4). It is important to think of the perceived control system of
beliefs as flexible, so that interventions can be effective. Skinner and her
colleagues (see for example Connell, Halpern-Felsher, Clifford, Crichlow, and
Usinger, 1995; Connell and Wellborn, 1991; Skinner, 1990b; Skinner and
Belmont, 1993; Skinner, Wellborn, and Connell, 1990) have stressed the
importance of this cyclical model, and many of their studies have examined
reciprocal relationships between perceived control and the other related
constructs within the broad educational context. The present study makes the
“specific domain” of the educational context even more specific by narrowing
the focus to the particular context of mathematics.
1.5 Outline of this thesis
Chapter 2 of this thesis examines the issue of transition to secondary school,
with the focus on mathematics. There have been very few quantitative
longitudinal studies examining children’s beliefs about mathematics, and this part
of the literature review examines these longitudinal studies as well as other
relevant cross-sectional studies. Chapter 3 examines the psychological model that
underpins this study. The particular framework using a model of perceived
control has not been used within a specific subject context such as mathematics,
nor in a longitudinal design over two separate grades that span the transition to
secondary school. It was believed that by using this model, particular beliefs
Chapter 1: Introduction to the Study
8
could be isolated that would contribute to our understanding of engagement and
disaffection in the learning of mathematics.
Chapters 4 and 5 detail the methodology used in this study and the
validity of the instruments used. The study was a longitudinal panel design, and
students were surveyed either two or three times. The main instruments were
found to be valid and reliable, however the classroom environment scale was
found to have some problems with factor structure. The consequences of this
are discussed.
Chapters 6, 7, 8 and 9 deal with the analysis of the data obtained from the
surveys. Chapter 6 deals with the cross-sectional data analysis while chapter 7
presents and discusses a longitudinal analysis of the data. Traditionally, such data
have been analysed using repeated measures analysis of variance, or path analysis.
While repeated measures analysis of variance and other more traditional analyses
were carried out and are reported in Chapters 6 and 7, further research questions
examining the issue of differing trajectories of perceived control required the
application of a more innovative approach. Cluster analysis was found to provide
a more detailed picture of groups over the transition to secondary school. The
rationale behind the use of cluster analysis and the results of this analysis are
discussed in Chapter 8. Chapter 9 examines the validity of the cluster solution
derived in Chapter 8. This validity is examined by looking at the means for other
variables based on the previously defined cluster groups.
The data used in these chapters were able to be analysed in a number of
different ways, because of different groupings that could be made.
Longitudinally there were three groups:
Chapter 1: Introduction to the Study
9
• One for the students who completed all three surveys: two in Grade 6 and
one in Year 7
• One containing students who had completed surveys at the start and at the
end of Grade 6
• One containing students who completed surveys at the end of Grade 6 and
the beginning of Year 7
Analysis of each of these groups provided a broad picture of perceived control,
coping and autonomy beliefs over the transition to secondary school, as well as
indications of children’s beliefs about themselves and about mathematics.
The aim of this study is to look at ways of facilitating transition and
encouraging systems of beliefs about learning that will contribute to higher
retention rates in mathematics and greater student satisfaction and motivation.
Broadly, the major focus of this research study will be on the following question:
Are there identifiable groups of students whose beliefs about learning mathematics
could be recognised as indications of potential problems with motivation in
secondary school?
In order to address this question, several subsidiary questions will provide
specific points of focus for the research:
• Can the perceived control model be used to identify these groups?
• What are the profiles of students at risk of alienation in secondary school
mathematics?
• What are the profiles of students who maintain high engagement with learning
mathematics?
Other research questions will be dealt with as they arise.

Chapter 1: Introduction to the Study
10
1.6 Summary
This chapter described the perceived problems with transition to secondary
school. Many national and state bodies have called for further research to be
devoted to the middle years of schooling, to try and prevent some of the
problems seen with alienated students in the post-compulsory years. In
mathematics in particular, with a change in emphasis from the concrete to the
abstract, further research is essential to try and understand the complexity of
cognition, beliefs and attitudes that children take with them from primary to
secondary school. Theoretically underpinning this particular study is the
perceived control model, which examines students’ beliefs about learning. By
understanding these beliefs, it is hoped that identification of groups of students
with maladaptive beliefs about learning mathematics may be facilitated.

11
Chapter 2
Jumping the first hurdle: Transition
to secondary school mathematics
2.1 Introduction
The prime concern of this research was to investigate whether identifiable
changes were apparent in students’ engagement and beliefs about learning
mathematics over the transition from primary to secondary school. The debate
about transition, whether it is a problem and what can be done to alleviate
students’ difficulties, is one that has simmered for many years. Mathematics is
seen as a particular area of concern during transition, as there are perceived
discontinuities between primary and secondary school mathematics content and
teaching method. Despite this, few studies have examined the motivational
orientations and beliefs of students on both sides of this major transition point.
This chapter examines the literature pertaining to issues about transition to
secondary school in general, and about mathematics in particular.
2.2 Alienation or engagement
Schooling in Australian schools is divided into three stages, corresponding
approximately to the education of the child, the education of the adolescent and
the education of the adult. While primary education, the education of the child,
Chapter 2: Jumping the first hurdle: Transition to secondary school mathematics
12
is perceived as being child-focussed, secondary education is seen as being subject-
oriented and driven more by pressures from employers and tertiary institutions.
Transition from primary to secondary school is now an experience shared by all
members of our society, yet it is an area that is largely neglected in terms of
research and school funding in comparison to early childhood and post-
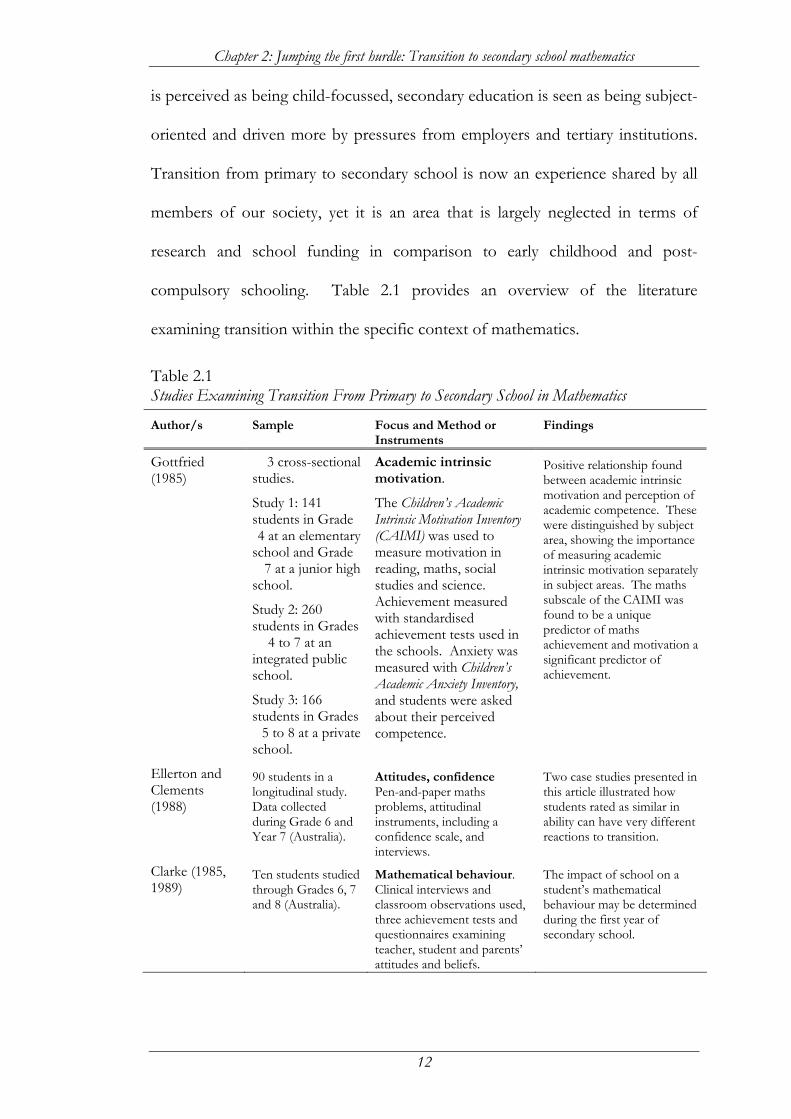
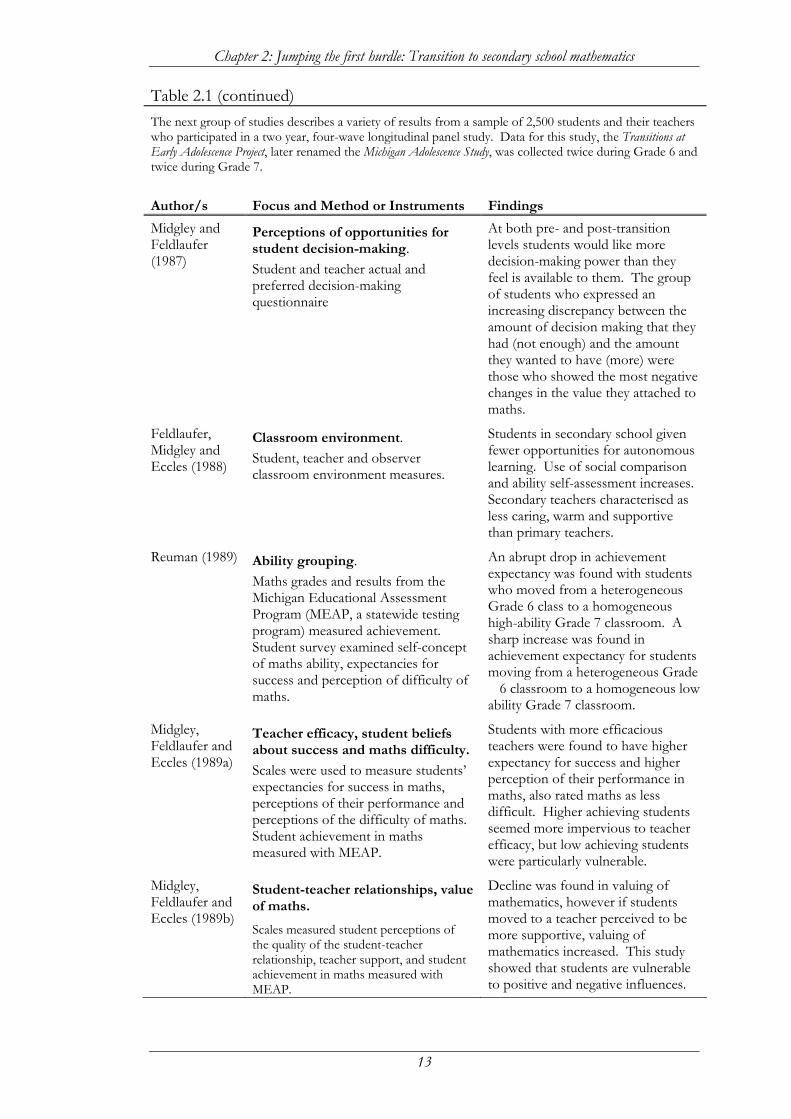
compulsory schooling. Table 2.1 provides an overview of the literature
examining transition within the specific context of mathematics.
Table 2.1 Studies Examining Transition From Primary to Secondary School in Mathematics
Author/s Sample Focus and Method or Instruments
Findings
Gottfried (1985)
3 cross-sectional studies.
Study 1: 141 students in Grade 4 at an elementary
school and Grade 7 at a junior high
school.
Study 2: 260 students in Grades
4 to 7 at an integrated public school.
Study 3: 166 students in Grades
5 to 8 at a private school.
Academic intrinsic motivation.
The Children’s Academic Intrinsic Motivation Inventory (CAIMI) was used to measure motivation in reading, maths, social studies and science. Achievement measured with standardised achievement tests used in the schools. Anxiety was measured with Children’s Academic Anxiety Inventory, and students were asked about their perceived competence.
Positive relationship found between academic intrinsic motivation and perception of academic competence. These were distinguished by subject area, showing the importance of measuring academic intrinsic motivation separately in subject areas. The maths subscale of the CAIMI was found to be a unique predictor of maths achievement and motivation a significant predictor of achievement.
Ellerton and Clements (1988)
90 students in a longitudinal study. Data collected during Grade 6 and Year 7 (Australia).
Attitudes, confidence Pen-and-paper maths problems, attitudinal instruments, including a confidence scale, and interviews.
Two case studies presented in this article illustrated how students rated as similar in ability can have very different reactions to transition.
Clarke (1985, 1989)
Ten students studied through Grades 6, 7 and 8 (Australia).
Mathematical behaviour. Clinical interviews and classroom observations used, three achievement tests and questionnaires examining teacher, student and parents’ attitudes and beliefs.
The impact of school on a student’s mathematical behaviour may be determined during the first year of secondary school.
Chapter 2: Jumping the first hurdle: Transition to secondary school mathematics
13
Table 2.1 (continued) The next group of studies describes a variety of results from a sample of 2,500 students and their teachers who participated in a two year, four-wave longitudinal panel study. Data for this study, the Transitions at Early Adolescence Project, later renamed the Michigan Adolescence Study, was collected twice during Grade 6 and twice during Grade 7.
Author/s Focus and Method or Instruments Findings Midgley and Feldlaufer (1987)
Perceptions of opportunities for student decision-making. Student and teacher actual and preferred decision-making questionnaire
At both pre- and post-transition levels students would like more decision-making power than they feel is available to them. The group of students who expressed an increasing discrepancy between the amount of decision making that they had (not enough) and the amount they wanted to have (more) were those who showed the most negative changes in the value they attached to maths.
Feldlaufer, Midgley and Eccles (1988)
Classroom environment. Student, teacher and observer classroom environment measures.
Students in secondary school given fewer opportunities for autonomous learning. Use of social comparison and ability self-assessment increases. Secondary teachers characterised as less caring, warm and supportive than primary teachers.
Reuman (1989) Ability grouping. Maths grades and results from the Michigan Educational Assessment Program (MEAP, a statewide testing program) measured achievement. Student survey examined self-concept of maths ability, expectancies for success and perception of difficulty of maths.
An abrupt drop in achievement expectancy was found with students who moved from a heterogeneous Grade 6 class to a homogeneous high-ability Grade 7 classroom. A sharp increase was found in achievement expectancy for students moving from a heterogeneous Grade
6 classroom to a homogeneous low ability Grade 7 classroom.
Midgley, Feldlaufer and Eccles (1989a)
Teacher efficacy, student beliefs about success and maths difficulty.
Scales were used to measure students’ expectancies for success in maths, perceptions of their performance and perceptions of the difficulty of maths. Student achievement in maths measured with MEAP.
Students with more efficacious teachers were found to have higher expectancy for success and higher perception of their performance in maths, also rated maths as less difficult. Higher achieving students seemed more impervious to teacher efficacy, but low achieving students were particularly vulnerable.
Midgley, Feldlaufer and Eccles (1989b)
Student-teacher relationships, value of maths.
Scales measured student perceptions of the quality of the student-teacher relationship, teacher support, and student achievement in maths measured with MEAP.
Decline was found in valuing of mathematics, however if students moved to a teacher perceived to be more supportive, valuing of mathematics increased. This study showed that students are vulnerable to positive and negative influences.
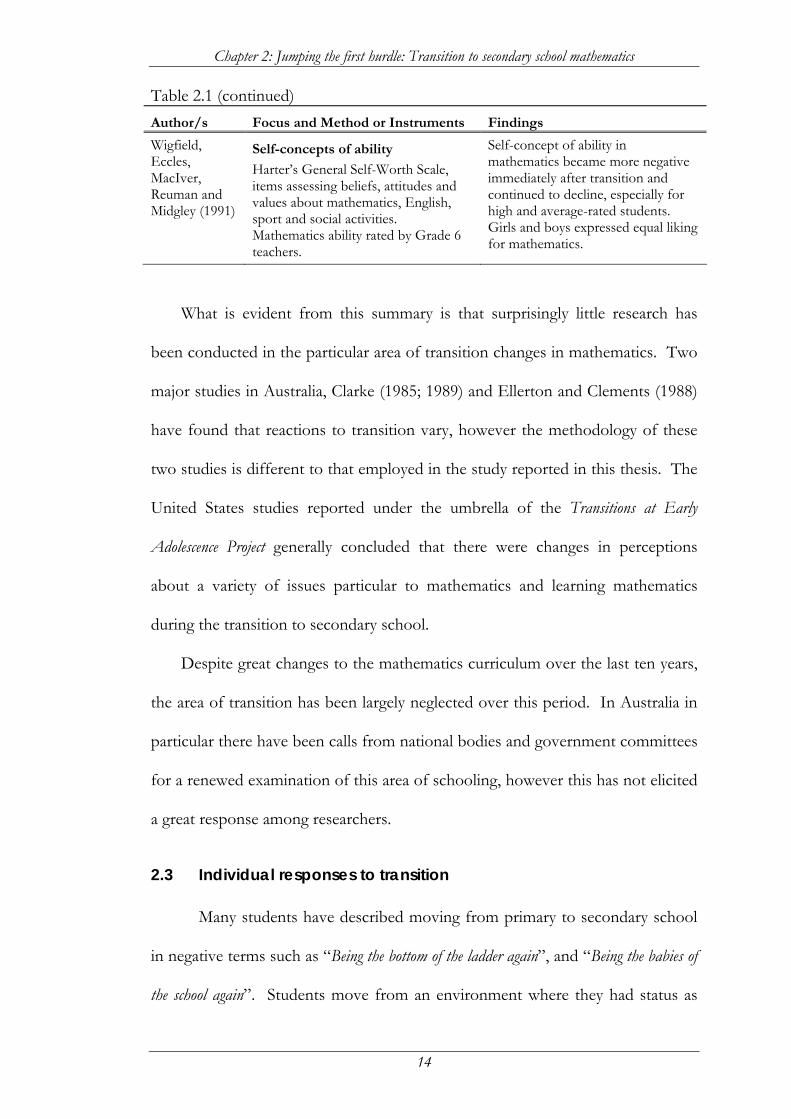
Chapter 2: Jumping the first hurdle: Transition to secondary school mathematics
14
Table 2.1 (continued) Author/s Focus and Method or Instruments Findings Wigfield, Eccles, MacIver, Reuman and Midgley (1991)
Self-concepts of ability Harter’s General Self-Worth Scale, items assessing beliefs, attitudes and values about mathematics, English, sport and social activities. Mathematics ability rated by Grade 6 teachers.
Self-concept of ability in mathematics became more negative immediately after transition and continued to decline, especially for high and average-rated students. Girls and boys expressed equal liking for mathematics.
What is evident from this summary is that surprisingly little research has
been conducted in the particular area of transition changes in mathematics. Two
major studies in Australia, Clarke (1985; 1989) and Ellerton and Clements (1988)
have found that reactions to transition vary, however the methodology of these
two studies is different to that employed in the study reported in this thesis. The
United States studies reported under the umbrella of the Transitions at Early
Adolescence Project generally concluded that there were changes in perceptions
about a variety of issues particular to mathematics and learning mathematics
during the transition to secondary school.
Despite great changes to the mathematics curriculum over the last ten years,
the area of transition has been largely neglected over this period. In Australia in
particular there have been calls from national bodies and government committees
for a renewed examination of this area of schooling, however this has not elicited
a great response among researchers.
2.3 Individual responses to transition
Many students have described moving from primary to secondary school
in negative terms such as “Being the bottom of the ladder again”, and “Being the babies of
the school again”. Students move from an environment where they had status as
Chapter 2: Jumping the first hurdle: Transition to secondary school mathematics
15
senior members of the student community and they knew the environment and
school routines well, to an environment where they have the least status and
everything is new and different. Other students see the move to secondary
school as a part of the maturation process, and are excited by the broad range of
new opportunities for learning. That there are varying responses to transition
was aptly summarised by Nisbet and Entwistle;
One headteacher suggested that ‘the sharp division between primary and secondary education which exists at present imposes a severe strain on some pupils – probably more than we realize – and provides for not a few a traumatic experience from which they hardly recover’. Another headteacher saw transfer as a stimulus: ‘I found that, while the sudden switch upset one or two, the vast majority of youngsters, irrespective of ability, liked it. It was a stimulant. Youngsters who came up with rather unflattering reports about their attitude to work (not their ability) became revitalised’. (Nisbet and Entwistle, 1969, p. 29)
The authors concluded that students most likely to suffer from the primary –
secondary transition were “those from poorer homes, where parents have had
limited education and fail to give the support and understanding needed for
adjustment to secondary school work” (p. 95). While Nisbet and Entwistle used
achievement as their main outcome measure, they acknowledged that this
provided only a somewhat superficial examination of the issues involved.
Our data does not take us much beyond mere speculation on the issues involved. They do indicate points which should be examined in any evaluation of middle schools: for example, do problems of adjustment to transfer affect certain categories of students more than others? (Nisbet and Entwistle, 1969, p. 99)
To move beyond mere speculation researchers need to examine other facets of
transition than achievement. As transition usually coincides approximately with
puberty, a number of studies have examined psychological aspects of children’s
behaviour before and after transition to secondary school.
Chapter 2: Jumping the first hurdle: Transition to secondary school mathematics
16
2.4 Transition and adolescence
Large scale studies carried out by Simmons and Rosenberg (1975) and by
Simmons, Blyth, Van Cleave and Bush (1979) compared the effects of different
types of school organisations on children of comparable age. The purpose of
these studies was to investigate the relative effects of age, maturation and
transition into secondary school on students’ declining self-evaluations. Their
findings suggested that it was the transition to secondary school that was the
primary cause of this decline, and they argued that this was because society
forced children of this age to make two major transitions simultaneously. They
argued that major transitions, such as the transition to puberty or the transition to
secondary school, could precipitate a reappraisal of oneself, and when two such
major transitions occur at a similar time the likelihood of such a reappraisal is
much higher. Reappraisals may involve a decline in self-esteem and motivation
as children attempt to find their niche within a new peer group and within a new
school environment.
When the current primary – secondary system of education was devised, the
transition to secondary school did not occur at the same time as the onset of
puberty, but with this latter age declining, the two are usually coincident. The
pressures on students because of this transition are therefore made more
complex and difficult because of changes due to puberty.
2.5 Pressure from above
Power and Cotterell (1981) studied transition in Queensland schools (which
occurs between Grade 7 and Grade 8), and discussed the perceived “transition
problem” (p. 5). They found that transition was seen as a time with competing
Chapter 2: Jumping the first hurdle: Transition to secondary school mathematics
17
demands on the student; demands that were seen as largely driven by societal
expectations. The societal expectations that were felt by teachers to drive the
curriculum came from tertiary institutions, employers and parents’ own
aspirations for their children. Sixteen years later, the same societal pressures are
perhaps magnified, as the unemployment rate for the eighteen to twenty-four
year old age group remains at approximately 30%. The pressure on students to
achieve at a high standard in Year 12 begins to be felt at the start of secondary
school, in order that they can continue their education or find an adequate job.
Power and Cotterell argued that it is these societal pressures that handicap
secondary schools which attempt to cater more adequately for students for
whom transition is a traumatic experience.
2.5 Transition and mathematics
In mathematics in particular, Power and Cotterell (1981) found that there
were discontinuities in student attitude, with a moderate decline (decreases in z
score between 0.4 and 0.8) over the transition period. Large gains in positive
attitude and confidence in English suggested that in some areas transition could
be seen as facilitating students’ progress; however the authors warned that “there
is evidence of unfulfilled promises and shattered expectations in several areas of
the curriculum” (p. 24). That mathematics is seen as one of these areas is evident
as students were likely to “experience unnecessary stress, confusion and
boredom”. Curriculum was also seen as exacerbating the problem, as “areas of
overlap and mismatch creating particular difficulties at one or both levels seemed
to exist in … the Grades 7-8 mathematics program” (p. 36). A decline in
motivation and in self-esteem has also been found to be more characteristic of
Chapter 2: Jumping the first hurdle: Transition to secondary school mathematics
18
mathematics than English in other studies (Eccles (Parsons), Midgely, and Adler,
1984).
In 1982, the Report of Inquiry into the Teaching of Mathematics in Schools was
published in Great Britain (Cockroft, 1982), and again transition to secondary
school was flagged as an area of concern. The committee discussed transition
primarily in terms of continuity between educational sectors, stating that “We
believe the greatest problems exist on the transfer to secondary or upper school”
(p. 125). Cockroft also briefly discussed attitudes to mathematics, pointing out
that a student’s attitude will most likely be fixed by the end of the primary school
years and will thus have an effect on the way in which the student approaches
mathematics in secondary school.
Clarke (1985) conducted an intensive study of ten students over the
transition from primary to secondary school mathematics in Victoria, arguing
that “if transition creates problems in a student’s mathematics education it is
equally true that mathematics contributes significantly to the difficulties of the
student in transition” (p. 231). Some students, he found, successfully overcame
academic and social challenges and found transition to secondary school
mathematics to be a positive and rewarding experience. For others however it
could be “destructive and personally-restricting” (Clarke, 1985, p. 255).
“Darren”, a student in Clarke’s study for whom transition caused a decline in
self-concept and achievement in mathematics seemed to suffer from a decrease
in engagement combined with increased attributions to ability. This student
believed that he was not smart at mathematics, and according to motivational
theory the combination of believing ability to be an important strategy but not
Chapter 2: Jumping the first hurdle: Transition to secondary school mathematics
19
believing oneself to be smart at mathematics is particularly debilitating for
engagement in learning. Clarke described this student “at the end of his first year
of secondary schooling, whose response to a non-routine mathematical task was
conformist, defensive and pessimistic” (p. 247). It is difficult to see this student
continuing to do mathematics past the compulsory level without intervention.
Ellerton and Clements (1988) studied over 500 students in the transition
from primary to secondary school and argued that many children seemed to be
very positive about the move to secondary school mathematics. Two case studies
presented in their article portray students who appear to be coping well with the
early stages of secondary school mathematics. These two students had
performed at a similar level in mathematics in Grade 6, and had been taught by
the same teachers at both Grade 6 and Year 7.
For one of these students the transition to secondary school presented an
opportunity to ‘start again’, to have a new beginning in mathematics and an
opportunity to prove that she was capable of doing well at mathematics. For the
other student however, the transition became a lost opportunity, and Ellerton
and Clements (1988) ask the readers to consider whether it is likely that the
student’s mathematical decline would be reversed. They felt that it was unlikely.
Some students may even believe that they do cope with transition well, but those
students who have faulty belief systems in mathematics may only start to
encounter difficulties later in secondary school. This case study in particular
underlines the necessity of intervention. It is difficult for teachers to decide just
what problems each student has without some sort of examination of their belief
systems.
Chapter 2: Jumping the first hurdle: Transition to secondary school mathematics
20
In mathematics, affective and motivational issues are seen as fruitful areas
for research. Asking students for an evaluation of their mathematical ability
usually elicits emotive responses, as explained by McLeod:
Affective issues play a central role in mathematics learning and instruction. When teachers talk about their mathematics classes, they seem just as likely to mention their students’ enthusiasm or hostility towards mathematics as to report their cognitive achievements. Similarly, inquiries of students are just as likely to produce affective as cognitive responses; comments about liking (or hating) mathematics are as common as reports of instructional activities. (McLeod, 1990, p. 575)
de Abreu, Bishop and Pompeu (1997) argued however, that while learners
do experience mathematics in both the cognitive and affective sense, the school
environment generally encourages the cognitive aspect. It is further suggested
that differences in mathematical cognition may be attributable to interactions
between cognition, affect and beliefs; “beliefs and attitudes may constrain the
adoption of particular forms of mathematics in specific contexts” (p. 237).
2.7 Transition and other variables
Gottfried (1985) used the Children’s Academic Intrinsic Motivation Inventory
(CAIMI) to examine the relationship between academic intrinsic motivation,
achievement and anxiety in both primary (elementary) and secondary (junior
high) students in specific subject domains, including mathematics. Perceived
competence was also assessed in two of the studies, and indicated that there were
strong correlations between students’ perceived competence and their intrinsic
motivation. A consistent trend was also found for the correlations between
corresponding subject areas to be higher than the correlations between subject
areas. An example of this was the correlation between perceived competence in
Chapter 2: Jumping the first hurdle: Transition to secondary school mathematics
21
mathematics and the mathematics subscale of the CAIMI, which was found to be
higher than the correlation between the mathematics subscale and perceived
competence in areas of reading, social studies or science. Similar patterns were
seen for each of the subject areas, indicating the importance of measuring
perceived competence separately for different subject areas.
Similar patterns were also seen between the CAIMI scales and anxiety, where
children with high academic intrinsic motivation in a specific subject area
generally exhibited low anxiety in that area. This study also found that intrinsic
motivation was correlated to achievement as measured by both standardised
achievement tests and teacher grades. In mathematics, it was found that intrinsic
motivation was consistently a significant unique predictor of mathematics
achievement. Gottfried hypothesised that this is because “children with higher
intrinsic motivation in math may therefore be better able to master challenging
and difficult math tasks and show higher academic achievement in this subject”
(p. 643). It may be that for subjects such as mathematics, with a perceived high
difficulty, it is important for students to have high intrinsic motivation in order
for them to persist at challenging tasks.
Kowalski, Harter and Whitesell (1986) examined perceptions of self-worth,
competence and motivational orientation in order to investigate differences
between grade-change and school-switch. They argued that much of the
available research does not differentiate between the advancement in grade and
the change to the secondary school, and so their longitudinal study was designed
to explore this issue. The lowest levels of perceived competence and intrinsic
motivation were reported by the students who had moved from primary to
Chapter 2: Jumping the first hurdle: Transition to secondary school mathematics
22
secondary school. The authors also found that not all students’ self-perceptions
declined, and that there was a need for “further research identifying the
characteristics of individuals and school environments related to positive school
transitions” (Kowalski et al., 1986, p. 10).
A major source of data examining transition from primary to secondary
school has been published under the umbrella of the Transitions at Early Adolescence
Project, later known as the Michigan Adolescence Study. This study was a two year
longitudinal project examining the impact of change on adolescents’ beliefs,
motives, values and behaviours. Originally the study looked at the areas of
English, mathematics, sport and social activities, however prior research by some
of the authors (Eccles et al., 1983), indicated that the greatest motivational
declines were to be found in mathematics, and so later studies focussed on this
subject.
In a report on a subset of data from the Michigan Adolescence Study examining
students’ relationships with their teachers and attitudes towards mathematics over
the primary – secondary transition, Midgley, Feldlaufer and Eccles (1989b) also
found that it was not inevitable for students’ perceptions of mathematics to
decline over transition. The study indicated that the quality of student – teacher
relationships was more powerful in the first year of secondary school than in the
last year of primary school, and therefore moving to a supportive learning
environment facilitated transition in mathematics. The authors recommended
that “less attention needs to be paid to the timing of transition … and more
attention needs to be paid to the nature … of the environment” (p. 988).
Chapter 2: Jumping the first hurdle: Transition to secondary school mathematics
23
In another report on data obtained from this study, Wigfield, Eccles,
MacIver, Reuman and Midgley (1991) found that self-esteem declined after
transition to secondary school, and that boys reported higher self-esteem than
girls at all four stages of the study. The decline was only temporary however, and
as students adjusted to the new school surroundings and gained in confidence,
self-esteem increased.
It was also found in this study that mathematics and English self-concepts of
ability declined over transition and continued to decline towards the end of the
first year in secondary school, however other studies have shown that students’
valuing of mathematics decreases after transition while their valuing of English in
general increases (Eccles et al., 1983). The authors have argued that these results
demonstrate the importance of examining self-perceptions in specific subject
domains. In the cross-sectional study conducted by Harter (1982), students’
perceptions of their cognitive competence did not differ by age, however the
studies reported by Wigfield et al. (1991) and Gottfried (1985) demonstrate that it
is possible that while students’ general sense of competence may remain stable
their beliefs about specific subject areas may become more negative.
2.8 Changes in curriculum and teaching over transition
Movement to secondary school also generally involves the move from a
largely integrated curriculum to an entirely departmentalised curriculum. For
example, the primary school student is taught most subjects by a generalist
classroom teacher, while after transition students are taught by an array of
specialist teachers in separate curriculum areas.
Chapter 2: Jumping the first hurdle: Transition to secondary school mathematics
24
Differences in the environments of the primary and secondary schools were
the focus of a longitudinal study reported by Cotterell (1992). This study found
that “changes in school size may accentuate the degree of discontinuity between different
kinds of schooling” (author’s italics, p. 42). The findings from this study
indicated that smaller primary schools are more organised and cohesive, while
secondary schools’ focus is more academic and abstract. For students from
smaller primary schools then, there is a heightened contrast between the two
emphases, causing greater discontinuity. In the study reported in this thesis,
schools were chosen to represent a range of both feeder and receiver school
sizes, with the average primary school size being 413 students (range 230 – 710)
and average secondary school size being 840 students (range 400 – 1200).
Other aspects of the changing classroom environment were discussed by
Feldlaufer et al. (1988). This study showed that at the same time as children are
entering puberty and showing a desire for more control over their lives, they are
also entering into an environment in which they are provided with fewer
decision-making opportunities. Students of this age also have a need for more
positive relationships with adults other than their parents, and yet secondary
teachers are typically characterised as less caring and supportive than primary
teachers are.
In mathematics, transition involves the beginning of a move from
computational to more abstract concepts, for example algebra and calculus.
Carol Dweck described the differences between changes in the mathematics and
language curricula:
Chapter 2: Jumping the first hurdle: Transition to secondary school mathematics
25
These new skills and concepts [in mathematics] are not only different from but are often more difficult than the child has mastered in the past. In the verbal areas, however, once the basic skills of reading and writing are mastered, one does not as typically encounter leaps to qualitatively different tasks, tasks requiring mastery of completely unfamiliar verbal skills. Increments in difficulty appear to be more gradual, and new units or courses often simply ask the student to bring existing skills to bear on new material. (Dweck, 1986, p. 1044)
While there is a large overlap with that taught in primary school, entirely new
conceptual frameworks are developed in mathematics in the early years of
secondary school. The introduction of an area that is qualitatively different can
be illustrated by the introduction of the Algebra Strand in Level 5 of the
Curriculum and Standards Framework (CSF, Board of Studies, 1995), which
pertains to the start of grade seven in Victorian schools. In this strand, work
involving number patterns and relationships in previous levels provides a basis
for the introduction of pronumerals and algebraic notation to represent general
rules and relationships, and yet there is a leap from one to the other. Students
who could cope with computational mathematics tasks at Grade 6 may find that
they have conceptual problems that are highlighted with the increasing
complexity of the subject. Dweck argued that:
It may be that only in subsequent school years will these maladaptive tendencies have their impact on achievement, when children with these patterns may elect to avoid challenging courses of study, drop out of courses that pose a threat of failure, or show impairment of performance under real difficulty. (Dweck, 1986, p. 1044)
Students who are engaged with learning may be able to make adjustments
and thus cope with problems; those who are already disaffected will almost
certainly give up at this point.
Chapter 2: Jumping the first hurdle: Transition to secondary school mathematics
26
2.9 Systemic responses to transition
While the implementation of the CSF in Victoria formalised the view of the
mathematics curriculum as a continuum through primary and into secondary
school, there is still a perceived discontinuity between the two. In a recent
attempt to address this, the Victorian Board of Studies formed a Year 5-8
working party to examine the overall process of transition in all key learning
areas. Howard Kelly, Chairperson of the Victorian Board of Studies, expressed
concerns that a gap had been created between primary and secondary school, and
that a more holistic view of the curriculum needed to be developed. This would
necessitate closer work between schools, and he argued further that “many
schools have transition programs, but transition must be more than a program.
It must be part of the curriculum” (Kelly, 1994).
At present however, transition programs typically consist of orientation days
for primary students at the secondary school, year 7 camps and other measures
designed to socialise students and familiarise them with the secondary school.
Home groups, with a particular teacher responsible for the pastoral care needs of
a specific group of children, are also common in secondary schools. However,
changes such as lower self-esteem, lowered perceptions of ability, decreased
motivation and confidence continue to be found in relation to transition to
secondary school mathematics in particular. Why is it that this happens? What is
it about mathematics that some children just founder for no apparent reason?
Clarke recommended in 1989 that
The same effort which secondary schools expend in developing familiarity as an aid to social adjustment must be exerted in presenting new mathematics content in ways familiar to the student, drawing on
Chapter 2: Jumping the first hurdle: Transition to secondary school mathematics
27
instructional techniques and cognitive strategies with which the student is already confident. (Clarke, 1989, p. 405)
Ten years later, it could be argued that this recommendation has been largely
unheeded by the educational community.
In an increasingly technological society it is argued that mathematics is
essential for understanding the world as it is the language of science (Nicholls,
Cheung, Lauer, and Patashnick, 1989). We encourage as many students as
possible to continue with mathematics past the compulsory years of schooling by
tailoring courses of study to suit students of varying ability levels. Mathematics is
the only subject in which this is done at the secondary school level, which
highlights the value society places on mathematics education. However despite
curriculum changes and transition programs, some students still have difficulty
adjusting to secondary school mathematics, and some students still drop out of
mathematics as soon as they are able to.
Since the studies by Power and Cotterell (1981), Clarke (1985) and
Ellerton and Clements (1988) there have been many changes in curriculum and
instruction in mathematics, particularly in Victorian schools. Mathematics
curriculum has moved from largely school based to centrally prescribed and
statewide testing in mathematics (Learning Assessment Project, or LAP) is
carried out with grades three and five students and is soon to move into
secondary schools. The LAP tests, however problematical, present parents and
schools with a result in which each student is situated on a scale of achievement
compared both to their peers and to the expected level as prescribed by the CSF
(see Figure 2.1).
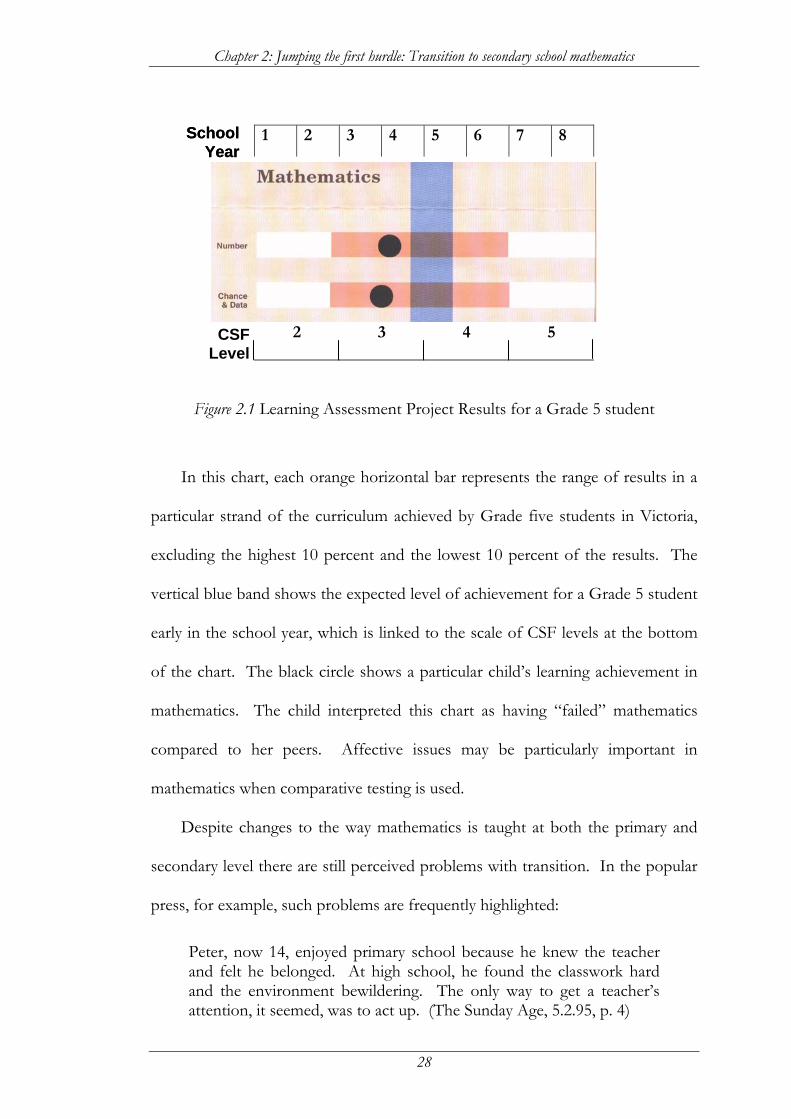
Chapter 2: Jumping the first hurdle: Transition to secondary school mathematics
28
1 2 3 4 5 6 7 8
2 3 4 5
Figure 2.1 Learning Assessment Project Results for a Grade 5 student
In this chart, each orange horizontal bar represents the range of results in a
particular strand of the curriculum achieved by Grade five students in Victoria,
excluding the highest 10 percent and the lowest 10 percent of the results. The
vertical blue band shows the expected level of achievement for a Grade 5 student
early in the school year, which is linked to the scale of CSF levels at the bottom
of the chart. The black circle shows a particular child’s learning achievement in
mathematics. The child interpreted this chart as having “failed” mathematics
compared to her peers. Affective issues may be particularly important in
mathematics when comparative testing is used.
Despite changes to the way mathematics is taught at both the primary and
secondary level there are still perceived problems with transition. In the popular
press, for example, such problems are frequently highlighted:
Peter, now 14, enjoyed primary school because he knew the teacher and felt he belonged. At high school, he found the classwork hard and the environment bewildering. The only way to get a teacher’s attention, it seemed, was to act up. (The Sunday Age, 5.2.95, p. 4)
School Year
School Year
CSF Level
Chapter 2: Jumping the first hurdle: Transition to secondary school mathematics
29
Reports are also emerging (as yet unpublished) that recommend changing
the structure of the Victorian school system. The draft report from the
Education Committee to the Education Minister (reported in the Sunday Age,
24.8.97) argued that there was “compelling evidence to support the restructuring
of schools”, and recommended the introduction of a three-stage structure with
junior (Prep to Grade 4), middle (Grades 5 – 8) and senior schools (Grades 9 -12)
(Curtis, 1997).
These continuing government-funded investigations into the middle years of
schooling indicate that there are many avenues open for investigation in this area.
A re-examination of beliefs about mathematics over the transition to secondary
school would seem to be timely.
2.10 A motivational approach to the study of transition
The approach taken in many studies is to use academic achievement as a
measure of success, reflecting a general societal view of academic achievement as
the primary indicator of success in school. There are other aspects to education
however, and some educational researchers have argued that research can be used
to help make education meaningful to all students, not just those who achieve at
a high level. John Nicholls presented the argument that:
The framework and dimensions researchers employ are likely to reflect concerns expressed in the society of the day. In one sense this is as it should be. Researchers should have something to say to citizens who are concerned about education. But if researchers merely reflect the popular preoccupations, they are unlikely to help citizens confront the contradictions in their aspirations for their children or in the ways the schools function. (Nicholls et al., 1989, p. 64)
Chapter 2: Jumping the first hurdle: Transition to secondary school mathematics
30
The research study presented in this thesis aims to confront some
contradictions in that the major focus is on motivation and engagement with
learning, not achievement scores. A goal for researchers should be to “ask
whether there are situational and personal qualities that enable even those
students who recognize that they are at the bottom of the heap in terms of ability
to be favourably motivated and find learning meaningful” (Nicholls et al., 1989, p.
68).
Although not considered as frequently nor probably as visible, students who
are at the top of the heap may also suffer motivational problems, leading to
underachievement. Dweck (1986) proposed that high achievers with maladaptive
motivational patterns may still achieve at high levels in primary school when
choice of subject is not possible and the work presented is not difficult enough to
create debilitating failure situations. However in later secondary school, when
work becomes more complex and failure is possible, motivational problems may
have their impact on achievement, when children with these patterns may elect to avoid challenging courses of study, drop out of courses that pose a threat of failure, or show impairment of performance under real difficulty. (Dweck, 1986, p. 1044)
While underachievers do not present the most pressing problem for the
classroom teacher, they are a group of students whose potential is largely wasted,
and it should be recognised that problems do exist in this area. Research should
aim to identify all students with dysfunctional motivational patterns.
2.11 Summary
This chapter examined the literature pertaining to the many issues involved
in transition to secondary school, with a particular focus on mathematics.
Chapter 2: Jumping the first hurdle: Transition to secondary school mathematics
31
In general, primary education is seen as being child-focussed and as a caring
comfortable place. In contrast, secondary school is often characterised as being
subject oriented and driven by external forces such as employers and tertiary
institutions, while students try and cope with the twin pressures of parental
expectations and a high youth unemployment rate. At a time when students are
seeking more autonomy, it was found that they are given fewer opportunities for
autonomous learning and decision making, and that this results in a lower valuing
of mathematics. At a time when students have a need for closer relationships
with role models such as teachers they are thrust into an environment where their
teachers are seen as being more impersonal and less supportive than their
primary counterparts.
Intrinsic motivation was examined in relation to anxiety and perceived
competence and it was found that high intrinsic motivation was significantly
correlated with low anxiety and was a significant predictor of achievement.
However lowest levels of intrinsic motivation and perceived competence were
found for students immediately after the transition to secondary school. Self-
esteem was found to decline temporarily after transition, but self-concepts of
ability in mathematics declined and continued to decline. Several studies have
proposed that these negative trends may be a result of students making the
double transition, the transition from primary to secondary school and the
transition from childhood to adolescence, at the same time.
Other affective and motivational issues have been examined with regard to
the primary – secondary transition. Some studies found that attitudes towards
mathematics deteriorated, while attitude towards English improved after
Chapter 2: Jumping the first hurdle: Transition to secondary school mathematics
32
transition. The study conducted by Gottfried (1985) found that correlations
between various measures were generally much higher within subject areas than
those between subject areas, and this indicated the importance of measuring
constructs separately in different subject areas. Similar findings were obtained
for other constructs such as self-perceptions about mathematics and competence.
These studies demonstrate the importance of examining perceptions in specific
subject domains. Maladaptive beliefs may not have a short-term effect, but if in
the long term they lead to problems with self-confidence and lower perceptions
of efficacy they will affect course or subject selection or even continuance of
mathematics. At the same time it may be difficult for classroom teachers to
identify students with particular dysfunctional motivational patterns until these
students are totally disaffected. Motivational problems often manifest themselves
as behavioural problems in the classroom, and so relevant interventions may not
be seen as appropriate without underlying knowledge about beliefs.
Nisbet and Entwistle (1969) foreshadowed the major focus of this thesis
when they asked whether certain categories of students were more negatively
affected by transition than others. Several other studies have also alluded to
there being groups of students who react in different ways to transition. This
thesis examines whether these groups are identifiable in the specific subject
domain of mathematics, as mathematics has usually been shown to elicit an
emotive response and there are perceived to be major curriculum changes in the
early years of secondary school. There have been few Australian studies that
have examined this period of transition in mathematics, and none in the past few
years, during which time the Victorian state school system has undergone
Chapter 2: Jumping the first hurdle: Transition to secondary school mathematics
33
massive changes. New longitudinal research is needed to examine changes in
beliefs students hold about mathematics over the transition to secondary school.
Perhaps too great an emphasis is placed on achievement in mathematics in
the early stages of secondary school. Students may encounter competitive
assessment for the first time in Year 7, and without a framework of beliefs that
can sustain their self-concept, may make debilitating comparative judgements
about their own ability. Researchers need to push the boundaries by using facets
of education other than achievement as a measuring stick, and the framework
used in this study is that of the psychological construct of perceived control.
Motivation should be of primary importance to educators, since increased
motivation can help all students. Students high in ability may suffer motivational
problems that lead to underachievement, while low achievers should always be
motivated enough to find something meaningful in learning.
The major focus of this study is on motivational aspects of learning and in
particular the constructs of perceived control and engagement. One aim is to
identify possible subgroups of students whose engagement in mathematics
changes after transition to secondary school.
In the next chapter, the conceptual framework for this study will be
presented and discussed. This model provides some interesting insights into
children’s beliefs about learning, and presents a global view of how attitudes may
have an indirect effect on academic and behavioural outcomes through the
construct of engagement.
34
Chapter 3
A Motivational Framework
3.1 Introduction
The previous chapter indicated that further longitudinal research was needed
examining transition in mathematics. While other studies have tackled this
problem using a case study approach, there is a need for a large-scale survey
study examining attitudes and beliefs about mathematics over this period of
change. This chapter deals first with a global view of motivation in the
classroom and its links to metacognition and constructivism, then describes the
particular model used in this study.
3.2 Motivation
A motivational approach to learning has the potential to improve outcomes
for all students. Brophy (1983), for example, argued that “students who are
motivated to learn will not necessarily find classroom tasks intensely pleasurable
or exciting, but they will take them seriously, find them meaningful and
worthwhile and try to get the intended benefit from them” (p. 200). Henderson
and Dweck (1990) argued that motivation is more than simply a desire to do well,
it helps determine what goals a person will pursue and how effectively they will
be pursued. They argue that motivational factors predict
Chapter 3: A motivational framework
35
academic achievement over and above actual academic ability … a student who is less bright than others but who has an adaptive motivational pattern … may turn out to be a high achiever. In contrast, some of the brightest students who have maladaptive motivational patterns … may fall considerably behind and fail to fulfill their potential. (Henderson and Dweck, 1990, p. 309)
Teachers and parents value motivation in its own right as well as for the long
term contribution it makes to children’s learning and self-esteem. Skinner and
Belmont (1993) described highly motivated students as:
enthusiastic, interested, involved and curious. These students try hard and persist, and they actively cope with challenges and setbacks. These are the students who are most likely to stay in school longer, learn more, feel better about themselves and continue their education past secondary school. (p. 571)
Not all students can excel at mathematics; nevertheless, mathematics has
value for all participants in a technological society. This value should be seen as
“essential for the vitality of society and the well-being of individuals within it”
(Nicholls, 1984b, p. 226), and not merely as a means to achieve occupational
status. Nicholls contended that when education is seen as the means to an end,
such as getting a good job or gaining entry to tertiary study, it has no inherent
value, making it less meaningful to those who do not believe their ability to be
high. Students of all ability levels should be able to find something intrinsically
and personally meaningful for them in the study of mathematics.
Dweck (1985) argued that by focussing on learning goals rather than
performance goals, it is possible for all students to participate meaningfully in
mathematics education. Dweck described learning goals as a manner of learning
in which the goal is to expand or develop competence, while performance goals
focus on the documentation or validation of competence. Put succinctly, she
Chapter 3: A motivational framework
36
described the difference as “with performance goals, an individual aims to look
smart, whereas with learning goals the individual aims at becoming smarter”
(1985, p. 291).
Nicholls (1983) used a similar construction to describe the effects of
different conceptions of ability on students’ motivation. He argued that students
can have different reasons for wanting to learn, and that the solution to
motivational problems lies in the development of the “right type, not just the
right level of motivation” (p. 212). Dweck’s performance goals are those of
Nicholls’ ego-involved students, while learning goals are the product of the task-
involved student. Nicholls described ego-involvement as being “preoccupied …
with avoiding looking stupid – rather than with learning, understanding, or
finding out … learning is not valued … [it] is not an end in itself” (Nicholls,
1983, p. 213). Both ego-involvement and performance goals focus on the
learner’s preoccupation with appearance: appearing smart or not appearing
stupid.
Students’ motivation for learning can have a bearing on their conceptions
about effort, ability and learning. For students who are task-involved, mastery
through the expenditure of effort leads to feelings of competency, because
learning is an end in itself. For students who are ego-involved, however, greater
effort will only imply high ability if other students learnt the same amount with
an even greater expenditure of effort. These students will put in the required
effort only as a means of demonstrating high ability. For task-involved students,
effort is seen as the most important strategy for learning, whereas for ego-
Chapter 3: A motivational framework
37
involved students, ability is the focus since effort is simply a means of showing
oneself to be better than others.
Studies examining performance attributions in competitive and non-
competitive situations (for example Ames, 1978; Ames, Ames, and Felker, 1977)
have supported this view, contending that ego-involved students will only make
effective attempts to learn if they believe that their attempts will show their
superior ability. In other research supporting the benefit of learning goals,
Bouffard, Boisvert, Vezeau and Larouche (1995) examined self-regulation
strategies with college students. This study found that students strongly oriented
towards learning reported more frequent use of cognitive and metacognitive
strategies, were more motivated and had better academic performances than
those weakly oriented towards this goal.
Much of the research talks about students’ beliefs about effort versus ability.
Pintrich and Blumenfeld (1985) explained that it is not until the later primary
school years that children begin to differentiate between ability and effort, and to
recognise their differential contribution to performance. Nicholls and Miller
(1984) presented a similar argument, arguing that the inference that one has high
or low ability has different meanings at different levels of development. By the
age of about twelve, at around the time of transition to secondary school, student
perceptions of the differences between ability and effort become more
differentiated. Carr, Borkowski and Maxwell (1991) for example, in a study of
students who were underachieving readers, concluded that successful learning is
due, in part, to children’s beliefs that effort is important and that they have
control over their learning.
Chapter 3: A motivational framework
38
Covington and Omelich (1979) have argued that effort is a double-edged
sword, as failing with high effort implies low ability, but low effort often results
in punishment and is not regarded highly by teachers or parents. Ego-involved
students’ self-concept could be threatened if trying did not lead to immediate
success, as effort without results could be seen by these students as indicating a
lack of ability. In mathematics in particular, if a student also believes that success
is largely due to ability, these beliefs are doubly undermining.
Dweck (1990) proposed that some children consider their intelligence to be a
fixed trait over which they have no control (entity theorists), whereas other
children see it as a flexible quantity that they can develop through effort
(incremental theorists). In a longitudinal study, Henderson and Dweck followed
groups of children over the transition to secondary school (Henderson and
Dweck, 1990). The groups were based on children’s beliefs about ability (fixed
or flexible) and confidence level (high or low), and achievement levels were
compared for the four groups thus formed. Different patterns emerged over
transition to secondary school. Incremental theorists did particularly well, with
students who were high achievers at primary school continuing to achieve at a
high level, while those in this group who were low in confidence and had not
done particularly done well in primary school showed impressive gains in their
achievement. Entity theorists however, did rather poorly. Low achieving entity
theorists generally remained low achieving, while many sixth grade high achievers
were now amongst the lowest in achievement, most particularly the high-
confidence entity theorists, who showed the most pronounced decline. Dweck
(1990) suggested that it may be that “the challenge and confusion of the
Chapter 3: A motivational framework
39
transition are most threatening to those who believe that intelligence is fixed and
are accustomed to themselves as having it” (p. 211).
It is clear that students have different views about the role that effort and
ability in particular play in learning. These beliefs can influence the way students
learn by affecting the way they approach learning itself.
3.3 Metacognition
To promote motivation, the development of metacognitive skills is vital.
Metacognition was described by Flavell (1976) as referring
to one’s knowledge concerning one’s own cognitive processes and products or anything related to them … for example, I am engaging in metacognition … if I notice that I am having more trouble learning A than B; if it strikes me that I should double-check C before accepting it as a fact … Metacognition refers, among other things, to the active monitoring and consequent regulation and orchestration of these processes in relation to the cognitive objects on which they bear, usually in the service of some concrete goal or objective. (p. 232)
It is argued that metacognition allows students to enhance their learning “by
becoming aware of their own thinking as they read, write, and solve problems in
school” (Paris and Winograd, 1990, p. 15). Stimulating students to think about
the reasons for their successes and failures in mathematics could enable a re-
evaluation of maladaptive beliefs and the positive reinforcement of adaptive
beliefs. The selection of goals and tasks, the persistence with which a student
attempts a task are all a reflection of the beliefs that students hold about how
they learn.
The advantages to both students and teachers of a metacognitive approach
to learning are enormous. Paris and Winograd (1990) explained that discussing
cognitive and motivational aspects of thinking with students helps in two ways.
Chapter 3: A motivational framework
40
The first is that it transfers the responsibility for monitoring learning to students,
and the second is that it promotes positive self-esteem and positive beliefs about
learning and motivation in students. “Metacognition helps learners become
active participants in their own performance rather than the passive recipients of
instruction and imposed experiences. It is consistent with constructivist accounts
of learning and development” (Paris and Winograd, 1990, p. 18). Kurtz and
Borkowski (1984) argued that those students with an accurate and perceptive
understanding of how they learn should be more persistent and achieve greater
success because they are more likely to choose correct strategies. The authors
also suggested that these students would be more likely to attribute good
performance to controllable factors such as effort. In contrast, “a child who has
immature metacognitive information and inaccurate beliefs about the causes of
success and failure should be less strategic and persistent in the face of
challenging academic tasks” (Kurtz and Borkowski, 1984, p. 337). However,
metacognition should not be viewed as an end in itself, rather it should be seen as
being embedded in the development of effective strategies for problem solving in
all facets of learning.
Paris and Winograd (1990) discussed three situations that may be particularly
influenced by metacognitive processes. The first is when children acquire new
knowledge and skills. Students with an understanding of their own thinking may
understand better which strategies they can use in order to learn. The second
occasion is in trouble-shooting; when problems appear. Students with an
awareness of the cognitive demands of the task and of the benefits of various
strategies may be able to switch to strategies that are more advantageous when
Chapter 3: A motivational framework
41
problems are encountered. The third occasion described by the authors is in the
initial presentation of knowledge or a task. Paris and Winograd (1990) explained
that whoever the presenter: expert, teacher or peer, “metacognitive
understanding of the task at hand can facilitate instruction” (p. 22). At each of
these critical junctures in learning, metacognitive knowledge influences students’
beliefs about their own abilities and about learning, and from these beliefs about
ability and learning flows motivation and engagement in learning.
In mathematics in particular, metacognition plays an important role. In an
unpublished report, Silver (1982), cited in Garofalo and Lester (1985), argued
that while cognitive actions had been the focus of research, there was a real need
for this focus to be redirected to examine behaviour relevant to the selection of
strategies, cognitive monitoring and evaluation of cognitive processes. Silver, it is
stated, believed that metacognitive processes formed the “driving force” behind a
great deal of success and failure in mathematics. In a study of third and fifth
grade students’ beliefs about learning mathematics, Lester and Garofalo (1982)
found that children of this age do not routinely analyse information, monitor
their progress or evaluate results; in other words they do not act metacognitively.
In a later paper, the authors asserted that:
it is particularly disturbing that [students] are so deficient in the regulatory skills of monitoring and assessing. These skills are important in all mathematical performance, but especially so in problem solving. Problem solving is a complex activity involving a variety of cognitive operations, each of which needs to be managed and all of which need to be co-ordinated. (Garofalo and Lester, 1985, p. 169)
Schoenfeld (1981) distinguished between tactical and managerial problem-
solving behaviours. Tactical behaviours include algorithms and heuristics,
Chapter 3: A motivational framework
42
managerial decisions include selecting frameworks for problems, deciding on a
path of attack, monitoring progress and deciding what to do when problems are
encountered. The managerial decisions described by Schoenfeld bear similarities
to those situations described by Paris and Winograd (1990) as being particularly
susceptible to influences from metacognitive processes.
If the goal for education is to motivate students to learn for learning’s sake,
research studies need to examine methods that enable teachers to assess which
students need particular help. Understanding students’ beliefs about the causes
of success and failure, and their beliefs about how much control they have over
these causes, is of primary importance in being able to formulate interventions
appropriate for particular students. It seems that until about the age of twelve
there may not be complete differentiation between ability and effort, and so
examining beliefs at the age of transition to secondary school would provide new
insights into student behaviour at this time.
How can we examine cognitive, motivational and personality constructs as a
system that interacts to shape academic performance? Different frameworks
have been constructed to examine this issue, however underlying many of these
is the study of the self-system. According to Borkowski, Carr, Rellinger and
Pressley (1990), the self-system includes constructs such as self-efficacy, locus of
control, achievement motivation, and attributional beliefs, and is a “complex
interdependent system that supports both metacognitive functions and academic
performance” (p. 58). The authors also suggested that “the self-system
constructs power metacognition by giving children reasons to learn” (p. 64).
Chapter 3: A motivational framework
43
Connell (1990) focussed on the self-system processes which he described as
being of the most motivational significance; those of the individual’s
psychological needs for competence, autonomy and relatedness. It is this model
that forms the theoretical framework for this study. Skinner (1995) argued
strongly that competence research is important both because of its explanatory
power and because it is proactive. “Postulating a need for competence gives
ultimate power to individuals as sources and agents of their own motivation. It
specifies that all people have the internal prerequisites for the development of
well-functioning competence systems” (p. 15). Finding a way for teachers to help
students to monitor their own motivation is one of the primary aims of this
research study.
3.4 Competence
White (1959) postulated that an innate characteristic of humans is an
intrinsic ‘need’ to feel competent, and that behaviours such as exploration and
mastery attempts are best explained by this motivational force. Competence has
two strands; understanding how to attain goals and being efficacious in
performing the required actions to achieve these goals. Competence needs are
fulfilled when a person feels able to achieve positive outcomes and avoid negative
outcomes (Deci and Ryan, 1985). Competence therefore is an active component
of the self-system, and can be thought of as having metacognitive components.
The opposite of competence is described by Patrick, Skinner and Connell (1993)
as helplessness, while Skinner (1995) suggested that the implication of a human
need for competence is that “a price will always have to be paid for violating this
need, in disaffection, depression, and apathy” (p. 16).

Chapter 3: A motivational framework
44
Competence beliefs are fostered in students when they are provided with
structure. Structure encompasses “clearly communicated and optimally challenging
expectations for and consequences of individual action, to constant
administration of these consequences and to the provision of competence-
relevant feedback” (Connell, 1990, p. 66). In simple terms, knowing what is
expected of one and knowing the consequences of success and failure,
consistency, and useful information about performance. Skinner and Belmont
(1993) explained that teachers provide structure by “clearly communicating their
expectations, by responding consistently, predictably, and contingently, by
offering instrumental support and help, and by adjusting teaching strategies to
the level of the child” (p. 572).
3.5 Autonomy
Autonomy has largely been studied by researchers interested in intrinsic
motivation (Deci and Ryan, 1985; Deci and Ryan, 1991; Ryan, Connell, and Deci,
1985). Autonomy is described as experiencing choice in initiating, maintaining
and regulating activity. It has also been described as:
the connection between volition and action; it is the extent to which a person feels free to show the behaviours of his choice. Non-autonomous behaviours include both compliance and defiance, which have in common that they are reactions to others’ agendas and not freely chosen. (Patrick et al., 1993, p. 782)
Connell and Wellborn (1991) reported that for a primary school sample
there were moderate to strong correlations between perceived autonomy, teacher
reports of student engagement and a composite index of school performance.
Significant differences in perceived autonomy were also found in a sample of
students labelled as ‘at-risk’ of academic failure and other non-labelled students
Chapter 3: A motivational framework
45
studied by Connell and Wellborn (1991). In this study, at-risk students showed
significantly lower levels of perceived autonomy than other non-labelled students
did. The authors concluded that “children and adolescents who experience
themselves as regulating their own behaviour in school are more engaged in this
domain and those engaged patterns of action are associated with higher levels of
academic accomplishment” (p. 63). It has also been demonstrated (Midgley and
Feldlaufer, 1987) that students with low levels of perceived autonomy also
showed negative changes in their valuing of mathematics over transition.
Students’ need for autonomy in learning is promoted when they experience
autonomy support, that is “the amount of freedom a child is given to determine
his or her own behaviour” (Skinner and Belmont, 1993, p. 573). Research has
shown that when the classroom climate is seen as autonomy supportive rather
than controlling, it has been associated with greater intrinsic motivation, trust,
self-worth and satisfaction (Deci, Schwartz, Sheinman, and Ryan, 1981).
However, it has also been shown that students in secondary schools are given
fewer opportunities for autonomous learning than students in primary schools
(Feldlaufer et al., 1988).
3.6 Relatedness
Relatedness refers to the quality of involvement of the student with
significant others, and in the context of the classroom, more specifically to
teacher and peer involvement with the student. Relatedness is supported by
involvement, where “teachers are involved with their students to the extent that
they take time for, express affection toward, enjoy interactions with, are attuned
to, and dedicate resources to their students” (Skinner and Belmont, 1993, p. 573).
Chapter 3: A motivational framework
46
The Midgley et al. (1989b) study showed that for students moving to a
supportive secondary school environment, valuing of mathematics increased.
However Feldlaufer at al. (1988), while agreeing that children need positive
relationships with their teachers, found that secondary teachers were more often
characterised by their students as less caring, warm and supportive than primary
teachers.
The self-system is thus defined as an appraisal process in which students
evaluate themselves with respect to these three basic psychological needs.
Connell (1990) proposed that students’ beliefs about themselves affect their
learning and adjustment indirectly, through the construct of engagement.
3.7 Motivational engagement
Cambourne (1994) claimed that that while learners are exposed to thousands
of demonstrations of techniques, methods and other learning practices during
their lives, many of these are ignored by students, and therefore learning does not
occur. He argued that teaching can only result in learning if the student is
engaged with the learning process. Skinner, Wellborn and Connell (1990) carried
out a study on 220 students in grades three to six, measuring, among other
things, engagement, grades and achievement test scores. They found that
students who were more engaged earned higher grades, scored better on
standardised tests of achievement, and showed better personal adjustment to
school.
Skinner and Belmont (1993) contended that children who are engaged are
positive emotionally and show sustained behavioural involvement.
Chapter 3: A motivational framework
47
They select tasks at the border of their competencies, initiate action when given the opportunity, and exert intense effort and concentration in the implementation of learning tasks; they show ... enthusiasm, optimism, curiosity and interest. (p. 572)
Disaffected students, however, can be bored, anxious, depressed or even angry
about their presence in the classroom, they can withdraw from learning
opportunities or be rebellious towards teachers and their peers.
Teachers respond in different ways to students’ engagement or disaffection
in their classes. Skinner and Belmont (1993) investigated aspects of teacher
behaviour (involvement, provision of structure and autonomy support) and
students’ active engagement (behaviour and emotion) over a school year with
grades 3 to 5 students. They found that students’ engagement was influenced
both by their perceptions of their teachers and by the effect of teachers’ actual
behaviours. Students whose teachers provided clear expectations, contingent
responses and strategic help were found to be more likely to expend effort and to
be persistent.
Another influence found in this study was between student engagement and
subsequent teacher behaviour. “Teachers respond to children who have initially
high behavioural engagement with more involvement, more autonomy support
… more contingency and consistency, and they respond to children who are
more passive with correspondingly more neglect, more coercion, and even
inconsistency” (Skinner and Belmont, 1993, p. 578). Teachers’ actions have an
impact on subsequent student engagement, meaning that students with high
behavioural engagement are treated in a way that is likely to increase their active
participation in class, while teachers deal with children of low behavioural
engagement in ways that serve to exacerbate their initial passivity and cause them
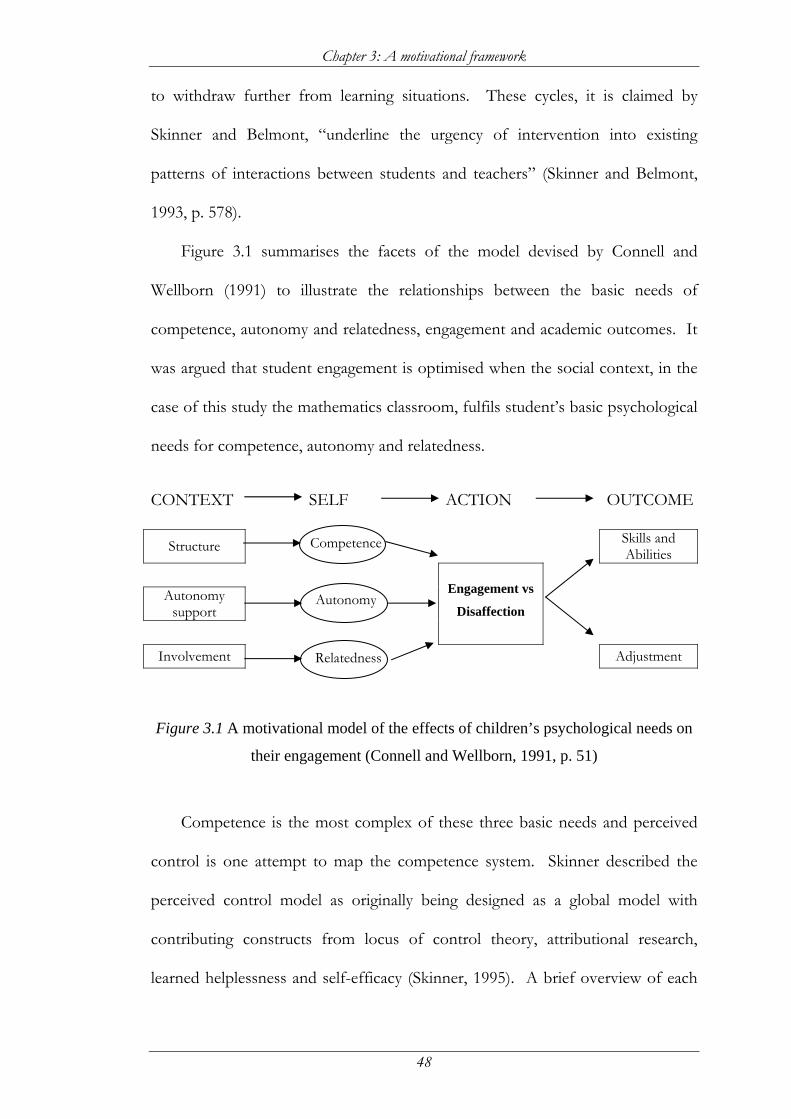
Chapter 3: A motivational framework
48
to withdraw further from learning situations. These cycles, it is claimed by
Skinner and Belmont, “underline the urgency of intervention into existing
patterns of interactions between students and teachers” (Skinner and Belmont,
1993, p. 578).
Figure 3.1 summarises the facets of the model devised by Connell and
Wellborn (1991) to illustrate the relationships between the basic needs of
competence, autonomy and relatedness, engagement and academic outcomes. It
was argued that student engagement is optimised when the social context, in the
case of this study the mathematics classroom, fulfils student’s basic psychological
needs for competence, autonomy and relatedness.
CONTEXT SELF ACTION OUTCOME
Structure Skills and Abilities
Autonomy support
Engagement vs
Disaffection
Involvement Adjustment
Figure 3.1 A motivational model of the effects of children’s psychological needs on
their engagement (Connell and Wellborn, 1991, p. 51)
Competence is the most complex of these three basic needs and perceived
control is one attempt to map the competence system. Skinner described the
perceived control model as originally being designed as a global model with
contributing constructs from locus of control theory, attributional research,
learned helplessness and self-efficacy (Skinner, 1995). A brief overview of each
Competence
Relatedness
Autonomy
Chapter 3: A motivational framework
49
of these constructs will be given to provide a background for the perceived
control model and to show how it incorporates aspects of each.
3.8 Locus of control
The notion of control; over one’s life, learning environment, or of learning
itself, had attracted a large amount of research over a number of years.
Heider (1958) proposed that individuals were aware of the reasons they were
rewarded or punished and that these reasons affected behaviour. Further to this,
Rotter (1966) contended that these actions and outcomes could be regarded as
internal or external. Internal referred to a person’s belief that events or outcomes
are contingent on their own behaviour, or on a relatively stable characteristic
such as ability. External referred to beliefs that events are caused by factors that
are beyond the individual’s control, such as luck, task difficulty and powerful
others.
Locus of control theories suggest that children’s behaviour in achievement
situations is influenced by their perceived locus of control. Rotter (1966) argued
that students bring with them their own generalised belief systems that have
developed from past experiences in school. Students who repeatedly experience
failure, regardless of the amount of effort they may have exerted, may develop
the belief that success is not contingent on effort. This belief may override
information to the contrary in certain situations, with students clinging to their
beliefs even when successful, preferring instead to interpret positive outcomes as
reflecting good luck or an easy task.
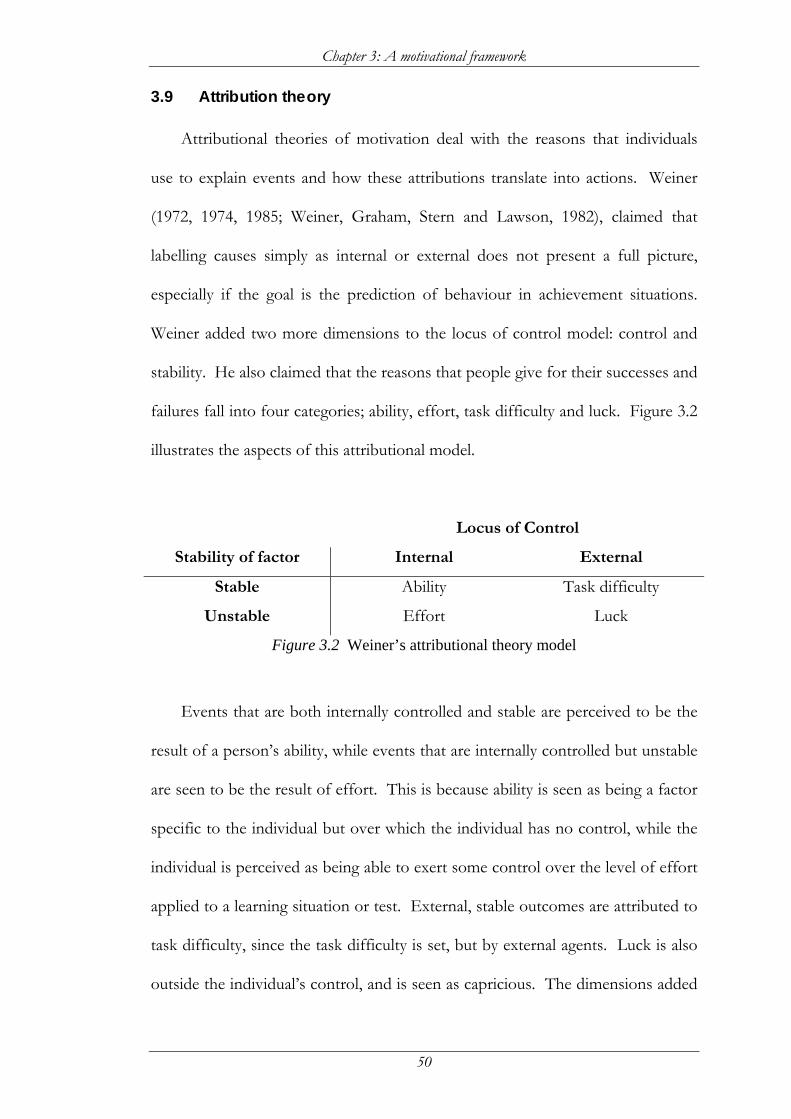
Chapter 3: A motivational framework
50
3.9 Attribution theory
Attributional theories of motivation deal with the reasons that individuals
use to explain events and how these attributions translate into actions. Weiner
(1972, 1974, 1985; Weiner, Graham, Stern and Lawson, 1982), claimed that
labelling causes simply as internal or external does not present a full picture,
especially if the goal is the prediction of behaviour in achievement situations.
Weiner added two more dimensions to the locus of control model: control and
stability. He also claimed that the reasons that people give for their successes and
failures fall into four categories; ability, effort, task difficulty and luck. Figure 3.2
illustrates the aspects of this attributional model.
Locus of Control
Stability of factor Internal External
Stable Ability Task difficulty
Unstable Effort Luck
Figure 3.2 Weiner’s attributional theory model
Events that are both internally controlled and stable are perceived to be the
result of a person’s ability, while events that are internally controlled but unstable
are seen to be the result of effort. This is because ability is seen as being a factor
specific to the individual but over which the individual has no control, while the
individual is perceived as being able to exert some control over the level of effort
applied to a learning situation or test. External, stable outcomes are attributed to
task difficulty, since the task difficulty is set, but by external agents. Luck is also
outside the individual’s control, and is seen as capricious. The dimensions added
Chapter 3: A motivational framework
51
by Weiner allowed more specific behavioural predictions from beliefs about
success and failure.
The consequences of attributions have a direct effect on motivation in the
classroom. If success or failure is attributed to a stable factor then it will be
expected that similar outcomes will occur in the future, however if the outcome
is attributed to an unstable factor then the individual will have doubts as to their
ability to repeat a success or failure (Pedro, Wolleat, Fennema, and Becker, 1981).
In short, students who attribute past failures to low effort may still be
motivated to succeed provided that they are willing to increase their effort.
However students who attribute their failures to lack of ability are not as likely to
exert increased effort because of their beliefs that without prerequisite ability no
amount of effort will lead to success. It is generally claimed that effort
attributions are the most productive for learning, as effort, unlike ability or luck,
is under the control of the individual. It has been found that ‘mastery orientated’
students felt that success was controllable, and hence were found to be “highly
motivated because they feel that success is contingent upon their actions”
(Kloosterman, 1988, p. 346).
A general finding in the literature is that attributions to effort for language
subjects are significantly higher than those for mathematics, and that attributions
to task difficulty and luck are higher in mathematics. Ryckman and Peckham
(1987) suggested that findings such as this indicate a more adaptive attributional
pattern in language subjects than in mathematics, with students feeling more in
control in the former.
Chapter 3: A motivational framework
52
Attribution of success to ability may have negative effects on motivation,
because if effort is not perceived as necessary for success students may not try
very hard and may consequently not perform at their true capacity or develop
good work habits. Kloosterman (1988) contended that “when uncontrollable
causes [such as ability or task difficulty] are blamed for failure, motivation is
generally poor” (p. 346). This type of attribution has been termed learned
helplessness.
3.10 Learned helplessness
Learned helplessness occurs when failure is attributed to uncontrollable
factors such as lack of ability and success either to the ease of the task or to being
helped by others. Studies on learned helplessness have demonstrated that if
individuals believe that there is no connection between their actions and the
outcomes they wish to achieve they often become passive and depressed
(Abramson, Seligman, and Teasdale, 1978). Kloosterman (1990) claimed that
because “lack of ability is a stable cause of failure that cannot be overcome,
learned-helpless students withhold effort rather than risk failure and
‘confirmation’ of their low ability” (p. 105).
The types of tasks that learned helpless students choose may be different
from those chosen by other students. When the learned helpless student is
presented with a choice of tasks, they often choose only those tasks that are
either very easy or very difficult. Either their success will be assured or their
failure can be blamed on the difficulty of the task, so their sense of self-worth can
be preserved as failure has not been blamed on lack of ability.
Chapter 3: A motivational framework
53
Wolleat, Pedro, Becker and Fennema (1980) applied the principles of
attribution theory and learned helplessness to the problem of mathematics
avoidance, which they explained as a lack of persistence in mathematics related
activities. They suggested that
it appears reasonable to hypothesize that if a student attributes successful performance to ability, the likelihood of persisting in mathematics is higher than if that success were attributed to an unstable cause such as effort or luck. Conversely, when failure is attributed to ability, lowered persistence will result. (p. 357)
3.11 Self-efficacy
Bandura’s self-efficacy theory posited that perceptions of efficacy “determine
whether coping behaviour will be initiated, how much effort will be expended,
and how long it will be sustained in the face of obstacles or aversive experiences”
(Bandura, 1977, p. 191). Thus, self-efficacy refers to the function of perceived
control that acts to regulate behaviour. Individuals who do not believe that they
are effective often become anxious and fearful, and do not perform well on
challenging tasks (Bandura, 1986).
Bandura also argued that most perceived control theories examined beliefs
about the effectiveness of responses in producing outcomes, but these beliefs
could have no effect unless the individual also believed that they could
“successfully execute the behaviour required to produce the outcome” (Bandura,
1977, p. 193). These beliefs were referred to as efficacy expectations.
Bandura argued that a successful performance would be more likely to boost
self-efficacy beliefs if that performance were perceived to be the result of skill
than from external causes. Skinner (1990b) contended that the effects of self-

Chapter 3: A motivational framework
54
efficacy beliefs on the regulation of behaviour were analogous to what she
termed as strategy and capacity beliefs.
3.12 The perceived control model
The model proposed by Skinner, Wellborn and Connell (1990) draws from
locus of control theory, attribution theory and studies on learned helplessness
and self-efficacy to present an integrated theory of perceived control. There are,
however, important differences. Skinner, Chapman and Baltes (1988) proposed
that statements frequently used to test attributions and locus of control could be
“unpacked” into separate beliefs, which they labelled as strategy and capacity beliefs.
For example an attribution of success to a cause, such as “I did well because I tried
hard” implies both that the cause is effective; “Effort is an important strategy for
success” and that the person is able to effect the cause; “I can work hard”. In
contrast, an attribution of failure such as “I failed because of ability” implies both
that the cause is effective in producing the outcome; “ability is important for
succeeding”, and that the person is unable to access the cause; “I’m not very smart”.
Disagreement with the statement “I did well on a mathematics test because I am smart at
mathematics” could be interpreted as either “I am not smart at mathematics” or “ability
is not the most important strategy for succeeding at mathematics”. These different semantic
structures have an impact on the interpretation of causal attributions, because for
example when contrasting effort and ability attributions, they differ not only on
the cause (ability versus effort) but also on students’ beliefs about themselves (I’m
not very smart versus I didn’t try hard).
Skinner, Chapman and Baltes (1988) presented a multidimensional
framework for perceived control in which three conceptually independent sets of
Chapter 3: A motivational framework
55
beliefs were distinguished. These were control beliefs; expectations about the extent
to which individuals can personally control academic outcomes; strategy beliefs;
expectations about the extent to which individuals understand what it takes to do
well in mathematics, and capacity beliefs; expectations about the extent to which
individuals believe they possess the means of enacting these strategies. Perceived
control is a combination of strategy, capacity and control beliefs that reflects the
amount of control children feel they have over the learning process.
A study conducted in West Germany by Chapman, Skinner and Baltes
(1990) provided evidence that this conceptualisation presented a more accurate
picture of students’ beliefs. A total of 180 children in Grades two, four and six
completed the perceived control questionnaire and a standard intelligence test.
The study showed a progressive increase in the correlation between capacity
beliefs and cognitive performance in Grades two and six. At Grade six, capacity
beliefs were found to be most strongly and consistently correlated with cognitive
performance. Strategy beliefs did not show the same pattern of correlations, and
this, it was claimed, underscored the empirical importance of distinguishing
between the different types of beliefs.
3.12.1 Strategy beliefs
There are five strategies developed within the perceived control model.
These strategies are labelled as unknown strategy (“I don’t know how to do well in
school” ), powerful others (“I have to have the teacher’s help to do well in school” ), luck
(“I have to be lucky to do well at school” ), effort (“working hard is the best way for me to
succeed at school” ) and ability (“being smart is the best way to succeed at school” ).
“Unknown” strategies were developed from the work done by Connell (1985),
Chapter 3: A motivational framework
56
who interviewed children about strategies for success in school and found that
some students said that they do not know the reasons for success and failure in
the classroom. Connell suggested that not knowing these reasons might inhibit
competence and motivation.
3.12.2 Capacity beliefs
Perceived capacity statements are statements derived directly from the
strategy statements. Students are asked to endorse the degree to which they
believe that they have or do not have the capacity for executing the powerful
others, luck, ability and effort strategies. For example, “I can work hard in school if I
want to” is a capacity statement tied to the effort strategy statement. There is no
corresponding capacity statement for unknown strategies since it is not possible
to enact an unknown strategy.
3.12.3 Control beliefs
Control beliefs are simply expectations such as “I can do well in school if I want
to”, or the opposite, “No matter what I do, I can’t avoid failure”, without reference to
specific means. Few other models include beliefs similar to control beliefs, which
Skinner (1995) explained have turned out to be “key predictors of action” (p. 33).
High control beliefs have been found to correlate positively with engagement
(Skinner, Wellborn & Connell, 1990).
A summary model showing the relationship between the three types of
beliefs is shown in Figure 3.3.
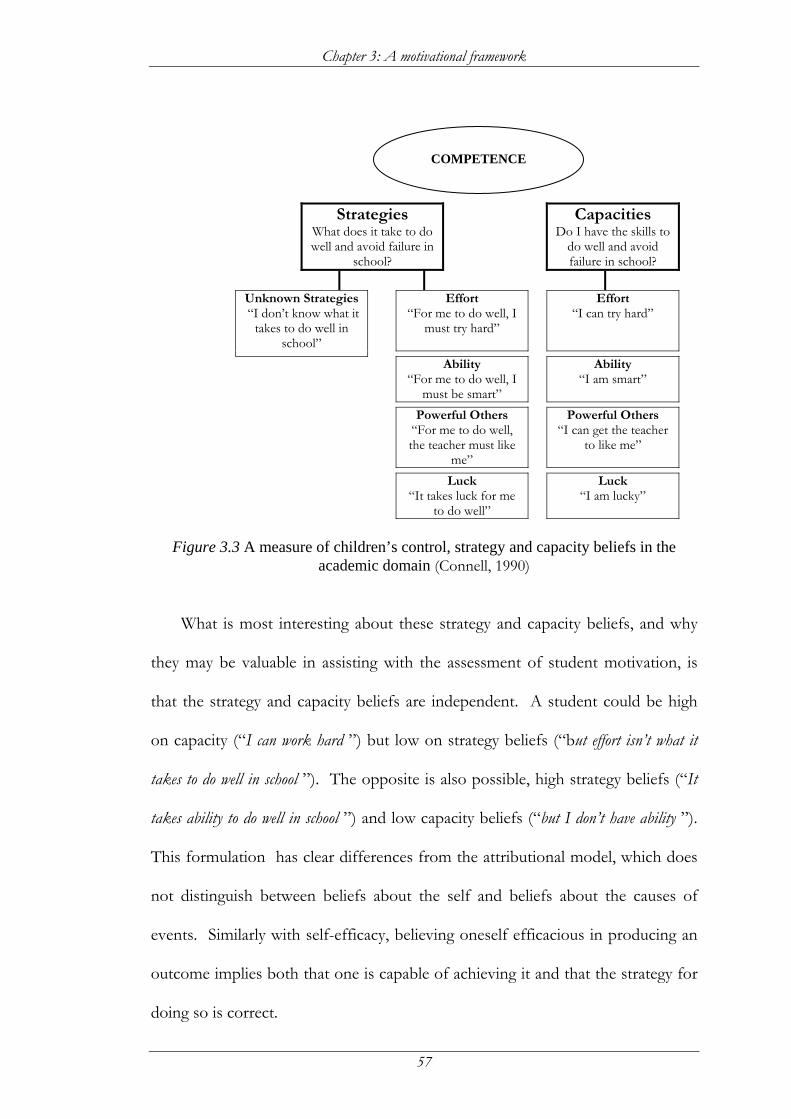
Chapter 3: A motivational framework
57
Strategies What does it take to do well and avoid failure in
school?
Capacities Do I have the skills to
do well and avoid failure in school?
Effort
“For me to do well, I must try hard”
Effort “I can try hard”
Unknown Strategies “I don’t know what it
takes to do well in school”
Ability “For me to do well, I
must be smart”
Ability “I am smart”
Powerful Others “For me to do well, the teacher must like
me”
Powerful Others “I can get the teacher
to like me”
Luck “It takes luck for me
to do well”
Luck “I am lucky”
Figure 3.3 A measure of children’s control, strategy and capacity beliefs in the
academic domain (Connell, 1990)
What is most interesting about these strategy and capacity beliefs, and why
they may be valuable in assisting with the assessment of student motivation, is
that the strategy and capacity beliefs are independent. A student could be high
on capacity (“I can work hard ”) but low on strategy beliefs (“but effort isn’t what it
takes to do well in school ”). The opposite is also possible, high strategy beliefs (“It
takes ability to do well in school ”) and low capacity beliefs (“but I don’t have ability ”).
This formulation has clear differences from the attributional model, which does
not distinguish between beliefs about the self and beliefs about the causes of
events. Similarly with self-efficacy, believing oneself efficacious in producing an
outcome implies both that one is capable of achieving it and that the strategy for
doing so is correct.
COMPETENCE
Chapter 3: A motivational framework
58
This conceptualisation also differs from the models discussed previously in
that the perceived control model describes both regulative and interpretive
functions. The locus of control, attribution theory and learned helplessness
models examine interpretive functions of perceived control, while the self-
efficacy model deals with the regulative function of perceived control. The
perceived control model deals with both regulative functions (control beliefs) and
interpretive functions (strategy and capacity beliefs).
3.13 Findings from other studies
In the ten years since research on perceived control using this particular
model began, a number of studies have used the associated instruments
(Rochester Assessment Package for Schools, or RAPS) to investigate various
aspects of learning. They are summarised in Table 3.1, and these and other
relevant studies are discussed in more detail in subsequent sections.
Table 3.1 Studies Carried Out Using Aspects of the Perceived Competence Model Author/s Country,
Participants What was measured, major findings
Skinner, Chapman and Baltes (1988)
West Germany 155 students in Grades 2, 4 and 6.
Perceived control: Strategy, capacity and control beliefs Factor analyses established three-factor solutions for each of the known causes and two-factor solution for unknown.
Chapman, Skinner and Baltes (1990)
West Germany 180 students in Grades 2, 4 and 6.
Perceived control and cognitive performance Capacity beliefs strongly correlated with cognitive performance.
Skinner (1990a) West Germany and USA 294 students from Grades 1-6 (USA), 215 from Grades 2, 4 and 6 (WG)
Perceived control Children’s beliefs about internal and external causes became more differentiated with age. Beliefs about ability appear to have an impact on motivation and behaviour, emerging at age 11 – 12.
Chapter 3: A motivational framework
59
Table 3.1 (ctd.) Author/s Country,
Participants What was measured, major findings
Skinner, Wellborn and Connell (1990)
USA 200 students in Grades 3 – 6
Perceived control, student engagement, achievement, teacher involvement and contingency Engagement undermined by beliefs in nonaction strategies (ability, luck, powerful others) and by not knowing how to succeed. Path analysis found that teacher involvement and contingency indirectly affected student engagement and achievement.
Pierson and Connell (1992)
USA 74 students retained
in grade, 69 students matched on ability but not retained
Competence, autonomy and relatedness, structure, support and involvement, performance, engagement Retained students reported less adaptive strategies for achieving success and avoiding failure.
Stiller and Ryan (1992)
USA 398 Grade 7 and 357 Grade 8 students
Perceived autonomy, perceived involvement, control, coping, engagement self-regulation. Teacher and parent involvement and autonomy support were predictors of student motivation, and correlated positively with student engagement, positive coping, control and self-regulation.
Patrick, Skinner and Connell (1993)
USA 264 students in Grades 3, 4 and 5
Perceived control, autonomy, behaviour, emotion Optimal motivation characterised by perceived control beliefs centred on the effectiveness of effort and autonomous reasons for engagement.
Schmitz and Skinner (1993)
West Germany 152 Grade 4 and 6 students
Perceived control, achievement on particular tasks (mathematics and German homework and tests) Success at tasks lead to attributions of correct answers to effort, ability and ease of task, failure lead to attributions of mistakes to effort and task difficulty and of correct answers to unknown causes.
Skinner and Belmont (1993)
USA 144 students in Grades 3,4 and 5. Surveys completed at the beginning and end of the school year.
Teacher involvement, structure, autonomy support, student engagement. Students’ behavioural engagement predicted by teacher structure, emotional engagement by teacher involvement. Disaffected students received less contextual support from teachers, engaged students received more, exacerbating the problems of disaffected students.
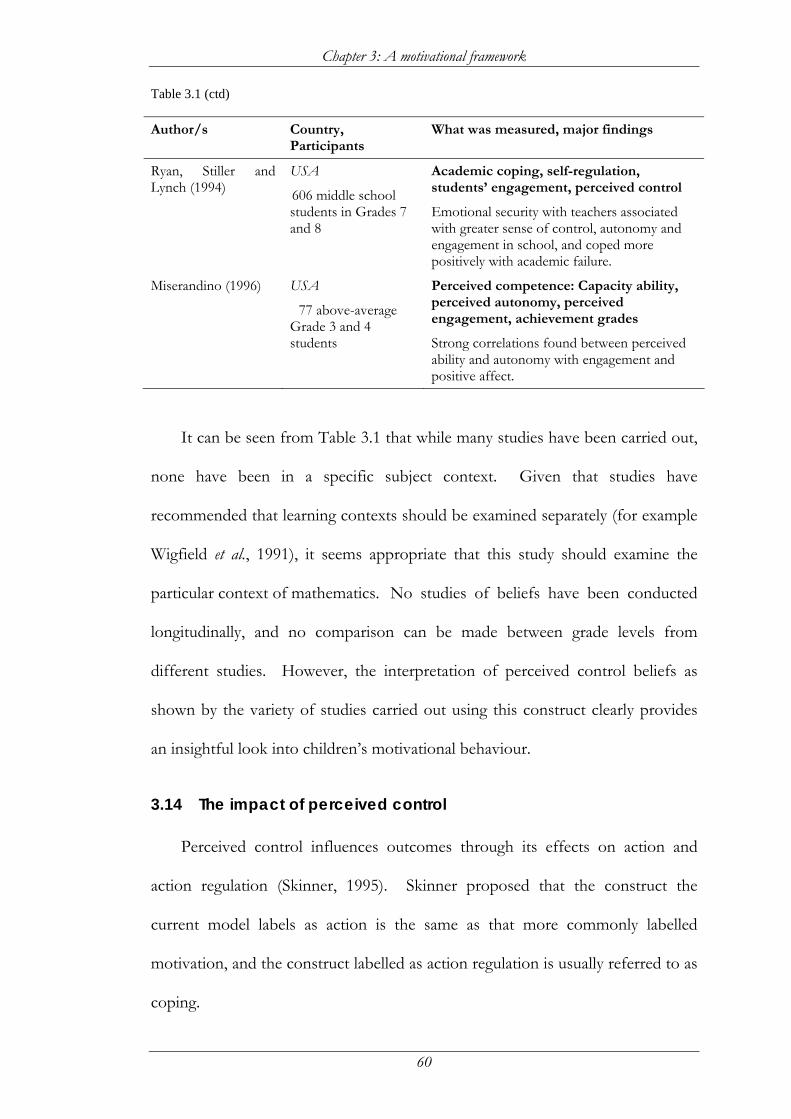
Chapter 3: A motivational framework
60
Table 3.1 (ctd) Author/s Country,
Participants What was measured, major findings
Ryan, Stiller and Lynch (1994)
USA 606 middle school students in Grades 7 and 8
Academic coping, self-regulation, students’ engagement, perceived control Emotional security with teachers associated with greater sense of control, autonomy and engagement in school, and coped more positively with academic failure.
Miserandino (1996) USA 77 above-average
Grade 3 and 4 students
Perceived competence: Capacity ability, perceived autonomy, perceived engagement, achievement grades Strong correlations found between perceived ability and autonomy with engagement and positive affect.
It can be seen from Table 3.1 that while many studies have been carried out,
none have been in a specific subject context. Given that studies have
recommended that learning contexts should be examined separately (for example
Wigfield et al., 1991), it seems appropriate that this study should examine the
particular context of mathematics. No studies of beliefs have been conducted
longitudinally, and no comparison can be made between grade levels from
different studies. However, the interpretation of perceived control beliefs as
shown by the variety of studies carried out using this construct clearly provides
an insightful look into children’s motivational behaviour.
3.14 The impact of perceived control
Perceived control influences outcomes through its effects on action and
action regulation (Skinner, 1995). Skinner proposed that the construct the
current model labels as action is the same as that more commonly labelled
motivation, and the construct labelled as action regulation is usually referred to as
coping.
Chapter 3: A motivational framework
61
It should be emphasised, however, that perceived control is not the only
determinant of a child’s level of performance. The effects of perceived control
on performance are proposed to be mediated through its effects on engagement,
however it cannot increase a child’s actual competence, which must be a primary
determinant of performance. Skinner (1995) argued that perceived control
“simply gives people access to all the resources they already have, to all the
responses in their repertoire” (p. 76). Perceived control can be used to help
explain why, given two children with similar abilities, one is able to perform near
the ceiling of their capacity while the other is not. Similarly, ability alone cannot
be the sole predictor of achievement. Other factors such as perceived control
may be prerequisites for engagement and learning.
The results of different levels of control can be seen in the behaviour and
actions taken by students. Children with low perceived control are more likely to
be unhappy, anxious and eventually depressed than children with high perceived
control (Nolen-Hoeksema, Girgus, and Seligman, 1986). Students with high
levels of control select challenging tasks and expect successful outcomes
(Bandura, 1989) and they set high and concrete goals (Schunk, 1990). In
contrast, students who do not expect control set low goals and are anxious about
the outcomes of their endeavours, culminating frequently in failure (Bandura,
1989). Students with high levels of control beliefs have been shown to select
tasks that are relatively difficult because these tasks seem to be the most
challenging and fun, not because they can use these tasks to diagnose their
competence (Dweck and Leggett, 1988; Nicholls, 1984a). Students with low
control are more likely to choose tasks that are either extremely difficult or

Chapter 3: A motivational framework
62
extremely easy, or even adopt an attitude of academic alienation, so that their
subsequent performance cannot be used to assess their ability. When confronted
by failure, or unexpected setbacks, students with low control worry about their
efficacy and about the consequences of failure, while those students with high
control are still concentrating on the task, considering other ways to approach the
situation (Dweck & Leggett, 1988).
These relationships are recursive; students who are not doing well in school
also perceive themselves as having no control over success and failure in this
setting, and these beliefs help to generate patterns of action that cause
performances that serve to reinforce their beliefs. It is important to intervene
into these cyclical patterns in order to increase motivation for these students.
It was postulated (Skinner, 1990b; Skinner, Schindler and Tschechne, 1990)
that the control beliefs that would undermine engagement could be distinguished
from those that would promote engagement. Engagement was hypothesised to
be undermined by beliefs that
imply that there is no connection between one’s action and desired outcomes. Sufficient for this would be either beliefs that outcomes are not contingent on actions (high strategy beliefs for non-action causes such as ability, powerful other, luck, or unknown factors) or beliefs that one is incapable of producing potentially effective actions (low capacity beliefs for … causes such as effort and ability. (Skinner,Schindler & Tschechne 1990, p. 177)
The combination of beliefs that were proposed to have the most devastating
effects on engagement was high strategy beliefs and low capacity beliefs for the
non-action causes. This might include statements such as “Success in school is due to
ability” and I’m not very smart”.

Chapter 3: A motivational framework
63
In contrast, it was proposed that high control beliefs would be sufficient in
itself to promote engagement, but that contrary to predictions from locus of
control theory about the positive effects of belief in effort, strategy effort would
not be sufficient in itself to promote engagement. Instead, it is necessary for
students to believe that they can produce the required effort themselves. These
predicted combinations and interactions were supported by the study conducted
by Skinner, Wellborn & Connell (1990).
In summary, Patrick et al. (1993) described profiles of children who were
most likely to be engaged in the classroom. These were children who believed
that
• effort is an important cause of school success and failure, and that they are
able to exert the required effort (high effort strategy and capacity beliefs);
• ability not necessary for success, but that they themselves were smart (low
strategy ability, high capacity ability beliefs);
• they are able to get powerful others (teachers) to help them or like them, and
that they feel they are lucky (high capacity luck and powerful others beliefs).
In contrast, the students most likely to be disaffected are those who believe that
• they are not capable of exerting the required amount of effort and that they
are nor smart (low capacity effort and ability beliefs);
• luck and the help of powerful others are needed to succeed, but they have no
influence on others and they are unlucky (high strategy beliefs paired with low
capacity beliefs for powerful others and luck);
• they don’t understand the causes for success and failure (high unknown
strategy beliefs).
Chapter 3: A motivational framework
64
A cross-sectional investigation of children’s perceived control beliefs at
different ages was reported by Skinner (1990a), who sampled students in primary
schools in both the USA and West Germany. The participants completed only
the strategy subscale of the Rochester Assessment Package for Schools (RAPS) in
order that children’s perceptions of the reasons for success and failure could be
examined as a function of time. Factor structure of the scale changed from two
to three to four factors as children got older, and changed from a simple internal,
external and unknown causes structure to the more differentiated structure in the
current model at about the age of 11 – 12 years. The investigation in the present
study of children’s beliefs as they move from primary to secondary school may
find further differences.
3.15 Self-regulation
Self-regulation is defined as processes associated with the need for
autonomy. In the school context, these processes examine the reasons why
students engage in academic activities. Children were asked for the reasons that
they participated in certain academic activities, such as doing homework, doing
classwork, and answering questions (Connell and Ryan, 1984; Ryan and Connell,
1989). Reasons given were classified as emphasising external pressures or
compulsion to behave, and internal mediators such as values or self-set goals.
These reasons were then classified along a continuum of increasingly
autonomous behaviour: external (I do my work because otherwise the teacher will yell at
me), introjected (I do my work because otherwise I’ll feel guilty), identified (I do my work
because I want to understand the subject) and intrinsic (I do my work because it’s fun).
Chapter 3: A motivational framework
65
External self-regulation is viewed as the least autonomous because the
initiation of behaviour is controlled by the student’s fears of external punishment
(usually in the form of adult’s approval or disapproval). Introjected self-
regulation is the next least autonomous because the child engages in behaviour so
as to protect against loss of self-esteem. Connell and Ryan (1984) explained that
when children develop this form of self-regulation, “the approving and
disapproving voice is inside the child’s skin … rather than in the external,
impersonal environment” (p. 69).
Identified and intrinsic self-regulation are an indication of more autonomous
behaviour, identified self-regulation because the student participates in learning
activities because the activity is seen as important, and intrinsic self-regulation
because the activity is seen as interesting and enjoyable.
Lower levels of autonomous behaviour in children are manifested in
reactions such as fear, tension, boredom, depression and attempts to evade the
activity, while children with higher levels of autonomy react with exertion,
persistence and optimism when faced with challenging tasks (Connell and
Wellborn, 1991; Deci and Ryan, 1985; Deci et al., 1981; Dweck, 1985; Nicholls,
1984a; Patrick et al., 1993). An interesting significant correlation was found
between introjected self-regulation and both anger and distress in the Patrick et al.
(1993) study. The authors explain this relationship, pointing out
the dual nature of pressured, introjected reasons. On the one hand, the regulation of behaviour is internalized, and so internal pressure to act in certain ways is maintained, resulting in distress. At the same time, however, because regulation of behaviour is not integrated, this style retains the evaluative character of being pressured by others, resulting in anger. (p. 789)
Chapter 3: A motivational framework
66
What is also evident from their analysis is that attribution of failure to luck
was also a significant predictor of both anger and distress, attribution of failure to
powerful others was a significant predictor of distress, and attribution to
unknown causes was a significant predictor of both distress and boredom. The
strongest predictors of motivated behaviour were found to be attributions of
success to effort, and identified self-regulation strategies.
In a summary of other studies investigating aspects of this model (Connell
and Wellborn, 1991), it was shown that high levels of perceived autonomy were
significantly correlated with teacher ratings of student engagement and with
performance. Students categorised as “at-risk” of academic failure were also
found to have significantly lower levels of autonomy than other students who
were not classified in this way. It is clear from these studies that to obtain a
better picture of students’ beliefs about learning, it is necessary to integrate
questions about both perceived control and autonomy.
3.16 Relationships with teachers and peers
Investigations into the relationship between students and their teachers and
peers, the partners in the academic context, indicate that emotional security is
positively associated with Teacher-rated student engagement (Connell and
Wellborn, 1991). In the Connell and Wellborn study, none of the relatedness
variables were found to be correlated with school performance, indicating the
importance of the engagement construct as a mediating variable. Without this
variable, it might be assumed from the lack of correlation that student
relationships had no effect on school performance, however if the path analysis
model is examined it is clear the relationship is mediated through engagement.

Chapter 3: A motivational framework
67
Ryan and Grolnick (1986) found that students whose teachers were
perceived as warm and supportive of student autonomy were more likely to be
intrinsically motivated and to have greater feelings of perceived control than
students who had a less supportive relationship with their teachers. In a study on
transition described in the previous chapter, Midgley et al.(1989b) found that
students experienced a decrease in their interest in learning when they move from
a classroom where teacher support is high, to one where the perception of
support is lower. Ryan, Stiller and Lynch (1994) found that adolescents who
reported positive relationships with teachers showed more positive coping skills,
greater engagement and more positive self-regulation, and higher levels of
perceived control. Lynch and Cicchetti (1997) argued that after the transition to
secondary school, students must become acclimatised to an “increasingly large
and impersonal educational milieu”, and that they are “exposed to a larger
number of teachers with whom they have limited and circumscribed contact, and
they encounter a large and unfamiliar set of new school peers” (p. 84).
Some methodological flaws are apparent in this latter study, with students
being asked to respond how they felt “on average” about their teachers. This
problem is acknowledged by the authors, who maintain that the results should be
generalised with some caution. With this caveat in mind, however, they point out
that there are a large number of students with insecure patterns of relatedness to
their teachers after transition to secondary school, and give a “poignant example
… that only 23% of elementary school children report having a disengaged pattern
of relatedness with their teachers, whereas over 60% of middle-school children
report being disengaged” (Lynch and Cicchetti, 1997, p. 94).
Chapter 3: A motivational framework
68
3.17 Summary
This chapter provided an overview of the psychological constructs related to
motivation, and of the particular theories from which the perceived control
model was developed.
It was argued that motivation to learn is an important goal in education, and
that education shouldn’t be seen simply as the means to an end. In a similar
manner, it is more important for students to be focussed on learning goals than
performance goals, the difference between these being described by Dweck
(1985) as the difference between looking smart and being smart. Students
oriented towards learning goals reported more frequent use of cognitive and
metacognitive strategies, were more highly motivated and performed better
academically.
It was also reported that perceptions about the roles of ability and effort
became more differentiated at about the age of transition to secondary school,
providing further rationale for a study of students’ beliefs to be conducted at this
time. Metacognition means that students become aware of the reasons for
success and failure, and of how best to learn. For metacognitive learning styles to
develop teachers must encourage students to think about and evaluate their own
beliefs about learning. It is argued that the selection of goals and tasks and
persistence are all a reflection of students’ beliefs about how they learn.
Researchers need to find ways that enable teachers to assess which students need
particular help in order to develop appropriate interventions.
Connell (1990) proposed a global model of perceived control and its
antecedents and consequences in the classroom. This model focuses on
Chapter 3: A motivational framework
69
competence, autonomy and relatedness. It is argued that this focus empowers
individuals as both agents and sources of their own motivation.
All of us need to feel competent and Connell argued that in the classroom
students need structure as a precursor to competence. Structure refers to a clear
communication of expectations, consistent, predictable and contingent
responses, and teacher support. Autonomy refers to the amount of choice
students have about the initiation, maintenance and regulation of activities in
which they participate. More autonomy has been shown to lead to higher levels
of engagement, and for autonomy teachers must feel confident enough to let
students make their own choices. Relatedness refers to the quality of the
relationships students have with their academic partners; peers and teachers.
Teacher involvement with students promotes feelings of relatedness to others. It
is argued that these three factors effect achievement through the mediating
construct of engagement.
Students who were more engaged were found to earn higher grades, score
better on standardised tests of achievement, and make more positive personal
adjustment to school. They showed sustained behavioural involvement,
enthusiasm, optimism, curiosity and interest. Teachers react to these students in
a way that will reinforce students’ beliefs and maintain their engagement, while
they often respond to students with low engagement in ways that will act to
perpetuate the problem. Engagement is thought to be optimised when the social
context, in this case the classroom, fulfils students’ basic psychological needs.
The perceived control model was developed from theories of locus of
control, attributions, learned helplessness and self-efficacy. It was found that
Chapter 3: A motivational framework
70
attributions to effort were generally higher for language subjects than for
mathematics and attributions to task difficulty and luck were higher in
mathematics. Motivation is generally found to be poor when uncontrollable
causes are blamed for failure. These findings again underline the need for
research studies to examine beliefs in separate subject areas.
Self-efficacy acts to regulate behaviour, and Bandura (1977) also argued that
beliefs about how to succeed would not have any effect unless individuals also
believed themselves able to execute the required behaviour.
The perceived control model “unpacks” attribution beliefs into strategy and
capacity beliefs: “Is this a successful strategy?” and “Can I enact that strategy?”
and asks students about control “Can I succeed if I want to?”. Strategy and
capacity beliefs have been shown to be independent, one can be high on strategy
and low on capacity for a particular cause, or the opposite. The strength of
control is that it gives students access to all the resources available to them, so
that students with low actual ability are still able to develop to their full potential
and feel confident about what they are doing.
An optimal profile for engagement is given as high effort strategy and
capacity beliefs, low strategy ability, high capacity ability beliefs, and high capacity
luck and powerful others beliefs. In contrast, the students most likely to be
disaffected are those with low capacity effort and ability beliefs, high strategy
beliefs paired with low capacity beliefs for powerful others and luck, and high
unknown strategy beliefs.
Self-regulation was also discussed as it is linked to the need for autonomy.
Students’ reasons for working were classified along a continuum of increasing
Chapter 3: A motivational framework
71
autonomy, from external to intrinsic. Introjected reasons, one step along that
continuum from external, were found to be correlated to anger and distress,
while children with higher levels of autonomy were found to react with exertion,
persistence and optimism.
3.18 Conclusions
It is apparent from the last two chapters that despite commonly held
perceptions that transition to secondary school is smoothed by special programs,
there are still problems. A limited number of longitudinal and cross-sectional
studies have implied that changes in perceived control are also evident over the
transitional period, however despite recommendations, these studies have all
been carried out within the broad school context, examining students’ beliefs
about generalised teaching and learning styles.
The present study draws its strength from its innovative approach to the
investigation of the transition question. Perceived control is a powerful construct
that has a great deal of practical appeal in education, and in mathematics
education, it has the potential to provide teachers and researchers with a way to
promote metacognitive learning and identify children with particular learning
problems. Self-regulation and relationships with peers and teachers have also
been shown to have a significant effect on engagement, and this study integrates
these factors into its design. Essentially, where other studies have concentrated
on ability and performance, this study focuses on motivation and engagement,
factors that not only underscore performance, but also which promote real
learning.
72
Chapter 4
Methods and Instruments
4.1 Introduction
This chapter describes the research study that was designed to examine
perceived control beliefs in mathematics over the transition to secondary school.
It provides details about the instruments and methods used to carry out the
research, and describes the participants in the study. The investigation was
longitudinal, with data collection carried out at three stages of the primary to
secondary school transition, and the particular research design adopted is also
discussed in this chapter.
4.2 Method of study
As the concern of this study was the changes in student beliefs about
mathematics over the transition to secondary school, it was determined that a
longitudinal panel design was most appropriate. The panel study design involves
the collection of data on a random sample of individuals at different times. The
advantage of a panel study over a trend or cohort study is that trends for groups
or for individuals may be studied. Wiersma (1995) argued that only with a panel
design could the possibility of a cause and effect relationship be explored, since
the design provides “temporal ordering of variables” (p. 174).
Chapter 4: Methods and Instruments
73
One disadvantage of the panel design, and particularly of any longitudinal
study attempting to track students in the transition from primary to secondary
school, is that of attrition in the panel across the study. Students in Victoria are
not allocated to particular primary or secondary schools, and student movement
occurs throughout the school year due to external factors. The choice of
secondary school is largely personal, and indications made by Grade 6 students as
to the secondary school they would be attending were subject to change. For this
reason, the duration of the study was necessarily brief, involving three data
collection points for one group of students and two data collection points for
another group of students. These data collections will be described more fully in
later sections.
4.3 Procedures
Ethical approval was applied for and obtained for this project in April 1995
from the Monash University Standing Committee on Ethics in Research on
Humans (Appendix 1). Permission was also obtained from the Department of
School Education (DSE) to conduct research in Government schools
(Appendix 2).
In 1995, the DSE grouped all schools in the southern and eastern suburbs of
Melbourne into a single region, the South-East region. Three areas were chosen
by the researcher as representative of the different school populations within this
region, these were in the local government areas of Stonnington, Casey and Yarra
Ranges.
After permission was obtained from the DSE administration for the region,
five primary schools, selected at random from a list of those in each area, were

Chapter 4: Methods and Instruments
74
approached by letter early in the second term to participate in the study. Three
of these schools responded favourably and meetings with the principal and
Grade 6 teacher / co-ordinator were conducted in weeks three and four of term
two to explain the purpose of the study and the methodology with which it
would be conducted. The entire cohort of Grade 6 students present at the time
of data collection in terms two and four were to be surveyed, and explanatory
statements and permission slips for both students and parents were given out and
collected by the school on behalf of the researcher (Appendix 3).
The school in the Stonnington area is situated in a largely affluent inner-
suburban area of Melbourne in close proximity to a large number of non-
government schools. Most of the students attending the primary school will
continue their secondary education at one of these non-government schools.
Casey schools are situated in working class middle-suburban areas, and the
students in grade six at this school are most likely to attend one of the local
government schools. The Yarra Ranges schools are situated in an outer
suburban, largely middle class area. Most of the students from these will attend
the government secondary college either in the immediate township or in the
adjacent town, while a small number will attend non-denominational independent
schools.
All surveys were to be administered by the researcher, and all instruments
were printed prior to visiting the schools. The researcher was at all times
sensitive to the increased workload of classroom teachers, and so every
endeavour was made not to add to this workload. It was emphasised to teachers
that they would be free to carry on with other work while the survey

Chapter 4: Methods and Instruments
75
administration was in progress, and that the researcher, being a qualified teacher
then registered with the DSE, would be competent to manage their class.
Principals and classroom teachers appeared to be quite happy with this
arrangement.
The middle weeks of term two 1995 proved to be very busy for schools in
the region. The initial administration of the Learning Assessment Project (LAP)
was carried out with Grade three and five students at all participating schools,
and as many of the classes involved in the study were composite Grade five and
six classes, this created extra pressure on the teachers and students involved in
the study. The week following the LAP testing was designated as Education
Week in Victoria, and all schools were involved in community and school based
activities for this week.
In the week following Education Week data collection occurred without any
problems at two of the three primary schools. However on the day prior to data
collection at the third primary school, the Grade 6 co-ordinator withdrew the
school from the study, citing the reason for this withdrawal as the increased
workload for the grade six teachers that the study would cause. During the
following week the school was contacted repeatedly by the researcher to attempt
to alleviate misconceptions about the amount of work involved for teachers,
however the co-ordinator was adamant that the school would no longer
participate in the study.
The term was rapidly drawing to a close and student reports and parent
teacher interviews were being planned for the last week of term, so it was vital
that a replacement school was found immediately. Personal contact was made
Chapter 4: Methods and Instruments
76
with a principal at another primary school in a similar area to the one that had
just dropped out of the study, and after discussion with the principal and the
three grade six teachers this school agreed to participate in the study. Permission
slips and explanatory statements were given out and collected in this week and
the data collection occurred in the second last week of term two.
In fourth term of 1995, it was clear that due to attrition, a much larger
sample would be required, and so a further fifteen primary schools were
approached. After discussions with the Stonnington school about the difficulty
of tracking their students after completion of grade six (the 21 students were
expected to spread out to some 15 different secondary schools), it was decided
that no other schools in this area would be targeted. As well, it was the aim of
the researcher that the research design should be limited as much as possible to
Government primary and secondary schools in order that cross-system variability
could be controlled in some way. The fifteen primary schools thus approached
were schools in areas close to those already sampled, with the intention being
that the participating secondary schools would receive students from different
primary schools participating in the grade six sample. Seven of these primary
schools agreed to participate in the study and so over a four week period during
late November and early December 1995, ten schools (including the initial three)
were surveyed. There were 154 students who were involved in the first stage of
the study; 76 females and 78 males, and 510 involved in the second stage; 231
females and 279 males. The number of male and female students from each
school who participated in Stage 2 of the project are shown in Table 4.1

Chapter 4: Methods and Instruments
77
Table 4.1 Number of Male and Female Students at Each Primary School in Stage 2
Primary Schools
YR S C
School ID 3 4 5 7 2 1 6 8 9 10 Total
Females 48 7 17 10 8 32 16 24 46 23 231
Males 38 13 14 27 13 33 41 27 52 21 279
Total 86 20 31 37 21 65 57 51 98 44 510 Note: Schools 1, 2 and 3 also participated in Stage 1 of the study. YR= Yarra Ranges, S = Stonnington, C = Casey
The secondary school sample was largely determined by the transition
intentions of the primary school students. At the end of the survey administered
in term four of their Grade six year, students were asked to indicate which
secondary school they planned to attend. Twenty-seven secondary schools were
listed by these students, not including the non-government schools from the
Stonnington school sample, and so a subset of twelve secondary schools was
chosen, representing 82.4% of the students surveyed in term four of Grade 6.
One of these schools was a government school situated in the Stonnington
area, and although only four students were intending to attend this school, it was
retained in the sample because it was felt that it might still provide a useful
contrast to the other areas, although of course statistical analysis on the basis of
only four students would be meaningless. Two non-government schools were
included in the secondary school sample. One of these schools is a Catholic
secondary college that caters for an ethnically diverse, largely working class
population. It is a very different school from the Stonnington non-government
schools. The school agreed that they would participate in the study, however an
illness on the part of the co-ordinating teacher meant that the school was not
Chapter 4: Methods and Instruments
78
able to participate in the study within the time frame set by the researcher. The
other non-government school is a Christian independent school set in a rural area
of the outer eastern suburbs. This school was included in the sample because
students from a number of schools in both the Casey and Yarra Ranges areas
attended the school, and it was felt that this might provide a different perspective
to the other schools.
The remaining nine schools were all government schools, and eight of these
agreed to participate in the study. Accordingly, the names of participating
students were forwarded to either year seven or mathematics co-ordinators,
permission and explanatory letters were forwarded to students and parents, and
dates were set for data collection. Table 4.2 shows the movement of primary
students to the particular secondary schools that participated in stage 3 of the
study. A total of 418 students’ names were submitted to these secondary schools,
and eventually 302 students were surveyed in term two of their first year at
secondary school, 148 females and 154 males. While all secondary schools in the
study claimed to address transition by providing students with such things as peer
group support, orientation camps and parent meetings, no school indicated that
their transition programs addressed any specific cognitive or other psychological
aims.
Data collection at the secondary schools was fraught with problems. As the
number of students participating in this project was generally only a small
proportion of all the Year 7 students at the school, these students had to be
withdrawn from class to complete the questionnaire. Teachers were quite willing
for this to occur for one class period, but it caused some problems for both
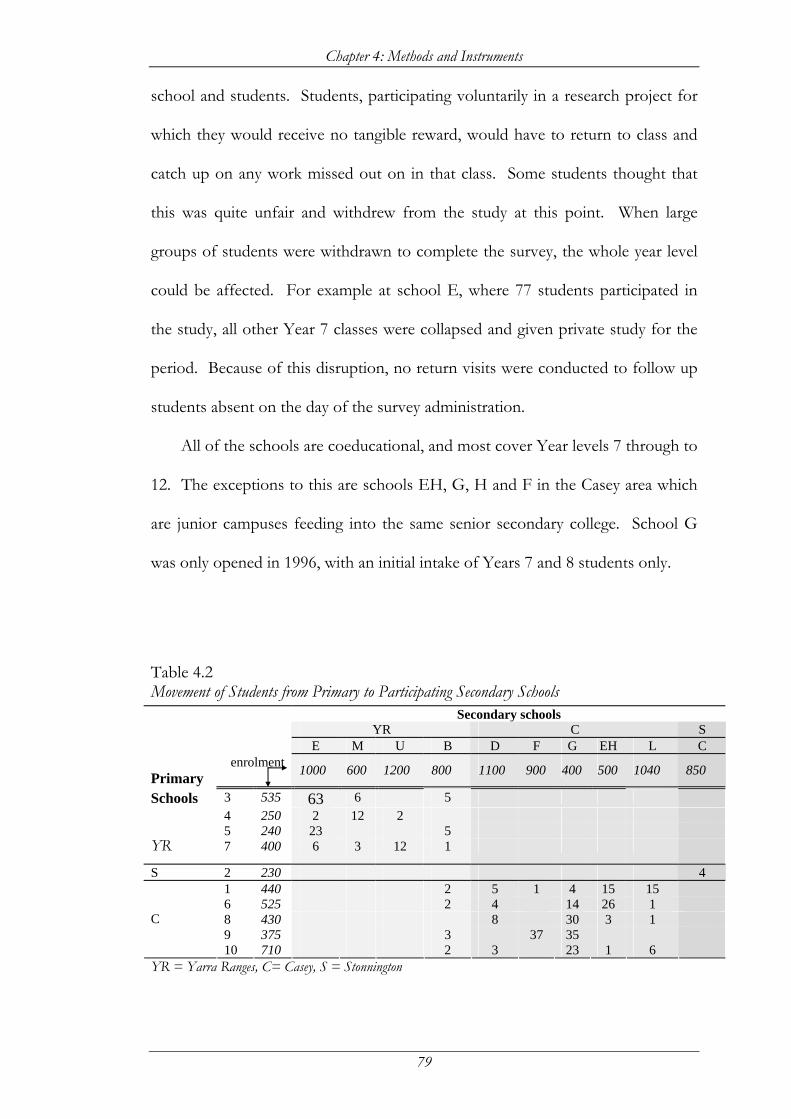
Chapter 4: Methods and Instruments
79
school and students. Students, participating voluntarily in a research project for
which they would receive no tangible reward, would have to return to class and
catch up on any work missed out on in that class. Some students thought that
this was quite unfair and withdrew from the study at this point. When large
groups of students were withdrawn to complete the survey, the whole year level
could be affected. For example at school E, where 77 students participated in
the study, all other Year 7 classes were collapsed and given private study for the
period. Because of this disruption, no return visits were conducted to follow up
students absent on the day of the survey administration.
All of the schools are coeducational, and most cover Year levels 7 through to
12. The exceptions to this are schools EH, G, H and F in the Casey area which
are junior campuses feeding into the same senior secondary college. School G
was only opened in 1996, with an initial intake of Years 7 and 8 students only.
Table 4.2 Movement of Students from Primary to Participating Secondary Schools
Secondary schools YR C S
E M U B D F G EH L C enrolment Primary
1000 600 1200 800 1100 900 400 500 1040 850
3 535 63 6 5 4 250 2 12 2 5 240 23 5
Schools YR 7 400 6 3 12 1
S 2 230 4 1 440 2 5 1 4 15 15 6 525 2 4 14 26 1 8 430 8 30 3 1 9 375 3 37 35
C
10 710 2 3 23 1 6 YR = Yarra Ranges, C= Casey, S = Stonnington
Chapter 4: Methods and Instruments
80
4.4 Data collection
All surveys and achievement tests were administered at each stage of the
study by the researcher. Students were told the basic purpose of the research;
that is that their opinions were being sought about mathematics as a subject, ways
to do well in mathematics, their mathematics classroom, and about their own
ability in mathematics. They were advised of the complete confidentiality of the
data, and assured that none of their answers would be reported directly to their
teachers, parents, peers or the school.
Students were then asked to complete the questionnaire and a short
mathematics test, the Progressive Achievement Test in Mathematics 2A (PAT
Maths, Australian Council for Educational Research, 1984). None of the
students refused to do either, however although they seemed quite happy to
complete the questionnaire there were grumbles about the test, and some
students became quite anxious. The questionnaire was read to the students to
obviate any particular reading problems, and students were encouraged to ask
questions regarding any lack of understanding of any part of the questionnaire.
The PAT Maths test was administered under the guidelines given by the
Australian Council for Educational Research (ACER).
The students first completed the composite questionnaire, and following
this, they completed the PAT- Maths 2A test. After both the questionnaire and
test were completed, students were invited to ask any questions they may have
had about the nature or purpose of the study, and a number availed themselves
of this opportunity. In general, while the students were finishing these tasks, the
teachers completed the engagement questionnaires on each student.
Chapter 4: Methods and Instruments
81
Procedures in stage 2 were much the same as for stage 1, except that the
PAT-Maths test was not carried out. There were a number of reasons for the
non-inclusion of the achievement test. Foremost among these reasons was the
amount of anxiety exhibited by many of the students at the mention of a “maths
test”. It was considered by the researcher to be counter - productive to include
an experience that caused feelings like this in the students participating in the
study. As well, given the arguments presented by Nicholls et al. (1989), discussed
in Chapter 2), and that the aim of the research was to investigate motivational
beliefs over transition, the non-inclusion of the achievement test was acceptable
within the framework of this study. Practical reasons also had a bearing on this
decision in that teachers only had limited time that they were prepared to give to
the project, and the administration of the PAT-Maths test would have
necessitated another time period out of the day taken up. Time constraints
brought about by school commitments were also a factor, with many students
participating in end of year school concerts and orientation days at their
proposed secondary schools.
Data collection at Stage 3, midway through the second term of the Grade
seven year, was of necessity conducted in a different manner. All the secondary
schools are large, and the students participating in this study were usually only a
small percentage of the total number of grade seven students present at the
school. Therefore, it was necessary in general to withdraw the participating
students as a group from class and administer the questionnaire to them. The
questionnaire was not read to the students at this level, and only one student had
Chapter 4: Methods and Instruments
82
obvious difficulties reading it. The researcher read the questionnaire to this
student.
After completion of the questionnaire, the students were asked for any
questions or comments, and generally the discussion centred on their new
secondary school and how they felt about being in Year seven. The students
were then thanked for their participation in the study.
A number of students were approached to be interviewed, however a very
low response rate was obtained for this despite the letters being distributed by
and with the blessing of the school. The interviews that resulted were conducted
in rooms separate from other teaching rooms, so that complete privacy was
assured. The interviews were audiotaped and transcripts made.
4.5 Instruments
Several different instruments were used at each stage of the study. The
general student questionnaires will be discussed in this section, and then the short
answer questions will be discussed.
The basic student questionnaire, the Student Perceptions of Control
Questionnaire (SPOCQ), and the Teacher perceptions of student engagement
questionnaire are both included in the Rochester Assessment Package for
Schools (RAPS, Wellborn and Connell, 1987), and were reworded to refer
specifically to mathematics. The questionnaire was piloted in the current form in
first term of 1995 with all of the Grade five and six students and all of the
teachers at one primary school. Any items that students or teachers flagged as
difficult to understand were discussed and alternative wordings formulated.
While care was taken to ensure that the original meaning of the question was
Chapter 4: Methods and Instruments
83
retained, some questions were reworded to reflect Australian rather than
American student vernacular. Attributions to luck were a common discussion
point for a number of the students who trialled the questionnaire. Luck is not
commonly thought to be associated with mathematics, and many students
rejected any links between the two. For another group of students however, luck
was vital for success in mathematics. Usually, luck was associated with being
asked the “right” questions, the ones the student had particularly studied or
learnt, or just those particular questions the student found easy. Bad luck was
commonly associated with studying the wrong topic or being asked questions
that had not been learnt.
4.5.1 Students’ questionnaire
Included in Appendix 4 are student questionnaires for each stage of the
study. The student instrument consisted of questions about students’ general
attitudes towards mathematics and beliefs about mathematics, questions about
perceived teacher involvement, teacher autonomy support, teacher structure,
relatedness, competence, engagement, coping and classroom environment, and
questions about perceived ability and perceptions about other people’s beliefs
about the particular student’s ability. These are described individually in the
sections that follow.
4.5.1.1 Your views about mathematics
In the first part of the questionnaire, eleven items tapped students’ liking of
mathematics, persistence, perception of usefulness of mathematics, perceptions
of mathematics as rule bound, open-mindedness and understanding of
Chapter 4: Methods and Instruments
84
mathematics, on a four point Likert-type scale ranging from not at all true to very
true.
The second part of the questionnaire consisted of a number of different
subscales that are described in more detail.
4.5.1.2 Perceptions of teacher involvement, autonomy support and provision of structure
Perceptions of teacher involvement, provision of autonomy support and
structure indices were taken from the Rochester Assessment Package for Schools
(RAPS). Four self-report items assessed the degree to which students felt that
their teachers cared personally for them and were involved in their learning (for
example “My teacher has plenty of time for me in mathematics”). Four self-report items
each assessed students’ beliefs about autonomy support, such as “My teacher lets me
make decisions about my work in maths”, and teacher provision of structure such as
“The rules in my classroom are clear”. Each was rated by students on a four-point
Likert-type scale, with responses ranging from not at all true to very true.
4.5.1.3 Perceived Control
This scale was also based on the RAPS questionnaire. It asked students to
assess, on the same four-point Likert scale, statements about the degree to which
they feel they are in control of their learning, the extent to which they believe that
outcomes in mathematics are due to effort, ability, powerful others, luck, or
unknown causes (strategies), and the extent to which they feel they are able to
enact these causes (capacities). As shown in Chapter 3, strategy and capacity
beliefs for all known causes are linked, so that the questionnaire not only
examined whether students believed that particular strategies are successful, but
Chapter 4: Methods and Instruments
85
whether they have the capacity to execute the particular strategy. Examples of
such items are: “Trying hard is the best way for me to do well in maths” (effort strategy),
and “I can work really hard in maths” (effort capacity).
Several interaction scores were calculated, using the method described by
Pierson and Connell (1992) and Skinner, Wellborn & Connell (1990). Using
these interaction scores, a summary score, CONMAX, was calculated which
combined the interactions of the strategy and capacity beliefs that theoretically or
empirically promote motivation and the interactions of the strategy and capacity
beliefs that theoretically or empirically undermine motivation. The rationale for
forming this combined score was given by Pierson and Connell, and although
somewhat lengthy, it is included in its entirety as it provides empirical support for
the use of this particular summary score.
For effort, high strategy and high capacity beliefs are predicted to promote motivation, so the interaction score for effort is calculated by multiplying Effort Strategy by Effort Capacity. For ability, research has shown that an over-reliance on ability as a strategy can undermine motivation, so interaction scores are calculated by multiplying the additive inverse of Ability Strategy by Ability Capacity. For powerful others and luck, the detrimental effects of endorsing these strategies can be exacerbated by believing one lacks the capacity to influence them. Hence interaction scores are calculated by multiplying Powerful Others Strategy by the additive inverse of Powerful Others Capacity. The Promote and Undermine summary scores each include beliefs from all four causal categories as well as Control and Unknown Strategy beliefs. (Pierson and Connell, 1992, p. 304)
Higher values on the perceived control construct (CONMAX) reflect high
levels of perceived control over positive and negative outcomes in mathematics
(“I can succeed in mathematics if I want to”), high strategy and capacity beliefs for
effort (“Effort is an important way to succeed, and I can work hard”), low strategy and
high capacity beliefs for ability (“Ability is not particularly important for succeeding in
Chapter 4: Methods and Instruments
86
maths, but I am smart”), low strategy and high capacity beliefs for powerful others
and luck (“Luck is not critical to success in maths, but I’m lucky, and getting the teachers to
like me isn’t vital for success, but I can get my teachers to like me”), and low unknown
strategy beliefs (“I understand the causes of success and failure in mathematics”).
Skinner (1995) argued that while missing any of the elements of this
“optimal profile” could be considered maladaptive, the most maladaptive profile
would include: low control beliefs, high strategy and low capacity beliefs for
effort, ability, powerful others and luck (“All these causes are important, but I can’t use
them”), and high strategy unknown beliefs.
4.5.1.4 Coping style
Items indicating student coping style were also derived from the RAPS,
which was based on work originally carried out by Tero and Connell (1984).
Items in the scale depict academic failure situations such as not doing well on a
test or not understanding what the teacher was explaining, and ask the student to
rate items on a four point Likert-type scale ranging from not at all true to very
true.
The scale measures students’ coping styles along four dimensions: projection
(“I say the teacher probably didn’t explain the work properly”), positive (“I say that I’ll try
harder next time”), denial (“I say I didn’t care about it anyway”) and anxiety (“I worry
that the other students will think I’m stupid”), which form subscales.
4.5.1.5 Relatedness
A number of subscales measured perceived relatedness; all were taken from
the RAPS. The subscales are relatedness to self, (“When I think about myself I feel
happy”), teacher emotional security (“When I’m with my teacher I feel relaxed”) and

Chapter 4: Methods and Instruments
87
peer emotional security (“When I’m with my classmates I feel tense”). Students again
rated the statements using a four point Likert-type scale ranging from very true to
not at all true.
4.5.1.6 Autonomy
Autonomy is measured in the RAPS instrument by looking at self-regulation
and the items in the current instrument are taken from this. Students’
perceptions of their reasons for performing various behaviours such as “Why do I
work in maths classes?” was assessed along four subscales: external (“Because the
teachers say we have to”), introjected (“Because I’ll feel guilty if I don’t”), identified
(“Because doing well in school is important to me”) and intrinsic (“Because it’s interesting”).
Students rated these items on a four point Likert-type scale ranging from not at
all true to very true.
4.5.1.7 Engagement
Items forming the engagement scale were also taken from the RAPS. These
items assessed beliefs about positive affect (“When I’m in maths class I feel happy”),
and degree of involvement (“When I’m in maths classes I usually just act as though I’m
working”). Items were rated on a four point Likert-type scale ranging from not at
all true to very true. The scale yielded a single factor solution, and so the scores
were combined to form a total engagement score.
4.5.1.8 Classroom environment
The items forming this scale were taken from the Individualised Classroom
Environment Questionnaire [ICEQ] (Fraser, 1990). The subscales used assess
students’ views on personalisation of the classroom (“The teacher considers students’
feelings”), participation (“Most students take part in discussions”), independence
Chapter 4: Methods and Instruments
88
(“Students choose their own partners for group work”), and differentiation (“Different
students use different books, equipment and material”). Students rated their responses on
a five point Likert-type scale ranging with responses ranging from almost never
to very often.
4.5.1.9 Ratings in mathematics
Students were asked to rate on a scale of 1 = weak to 5 = excellent, how
good they thought they were in mathematics, how good they would like to be,
where their teacher, parents and classmates would place them on the scale, and
how good they and their parents would like them to be at mathematics.
4.5.2 Teacher’s rating of student engagem ent
While students were completing their questionnaire, teachers completed the
Teacher rating of student engagement questionnaire (Appendix 5) for each student
present on the day. This questionnaire was based on that included in the RAPS,
but expanded to allow for a number of other constructs.
Connell and Wellborn (1991) described engagement and disaffection as
patterns of action. Three types of engagement are described in Figure 4.1. Extra
questions were formulated and added to the existing questionnaire, so that each
type of engagement was included. Several items felt by the teachers who trialled
the questionnaire to also be indicators of engagement were included in the final
instrument. These items were “This student organises his/her work well”, and “This
student makes careless mistakes in his/her work”.
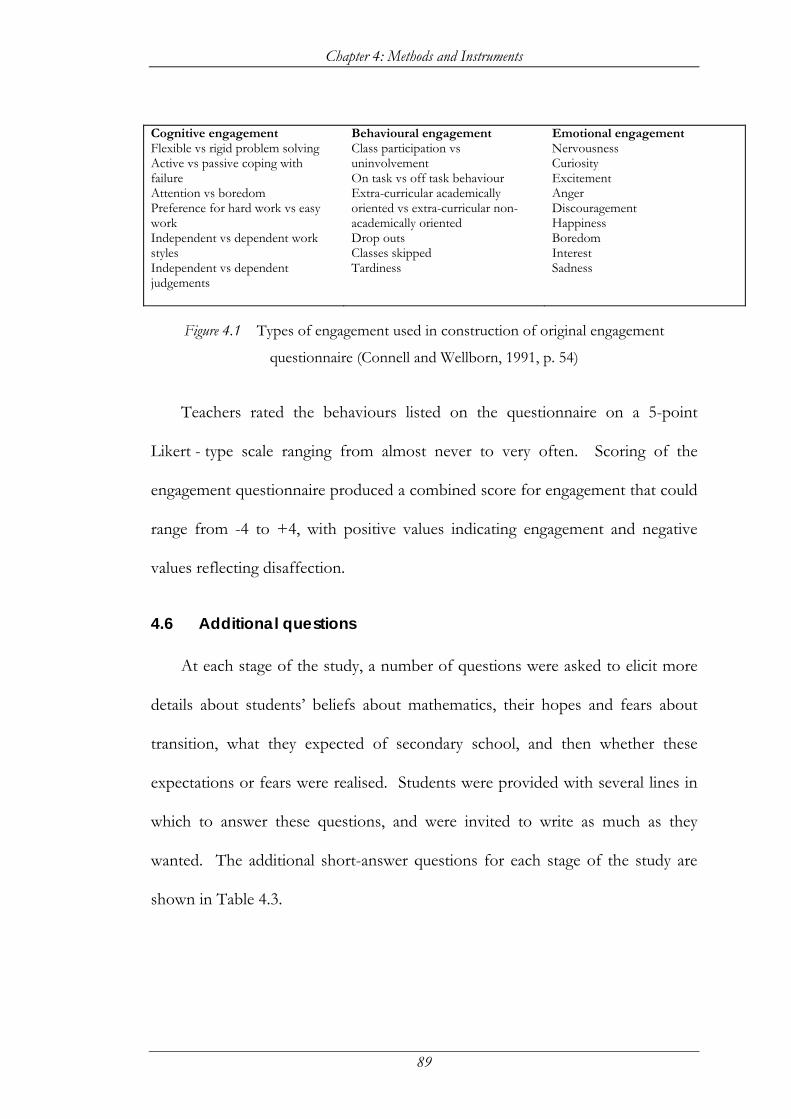
Chapter 4: Methods and Instruments
89
Cognitive engagement Flexible vs rigid problem solving Active vs passive coping with failure Attention vs boredom Preference for hard work vs easy work Independent vs dependent work styles Independent vs dependent judgements
Behavioural engagement Class participation vs uninvolvement On task vs off task behaviour Extra-curricular academically oriented vs extra-curricular non- academically oriented Drop outs Classes skipped Tardiness
Emotional engagement Nervousness Curiosity Excitement Anger Discouragement Happiness Boredom Interest Sadness
Figure 4.1 Types of engagement used in construction of original engagement
questionnaire (Connell and Wellborn, 1991, p. 54)
Teachers rated the behaviours listed on the questionnaire on a 5-point
Likert - type scale ranging from almost never to very often. Scoring of the
engagement questionnaire produced a combined score for engagement that could
range from -4 to +4, with positive values indicating engagement and negative
values reflecting disaffection.
4.6 Additional questions
At each stage of the study, a number of questions were asked to elicit more
details about students’ beliefs about mathematics, their hopes and fears about
transition, what they expected of secondary school, and then whether these
expectations or fears were realised. Students were provided with several lines in
which to answer these questions, and were invited to write as much as they
wanted. The additional short-answer questions for each stage of the study are
shown in Table 4.3.
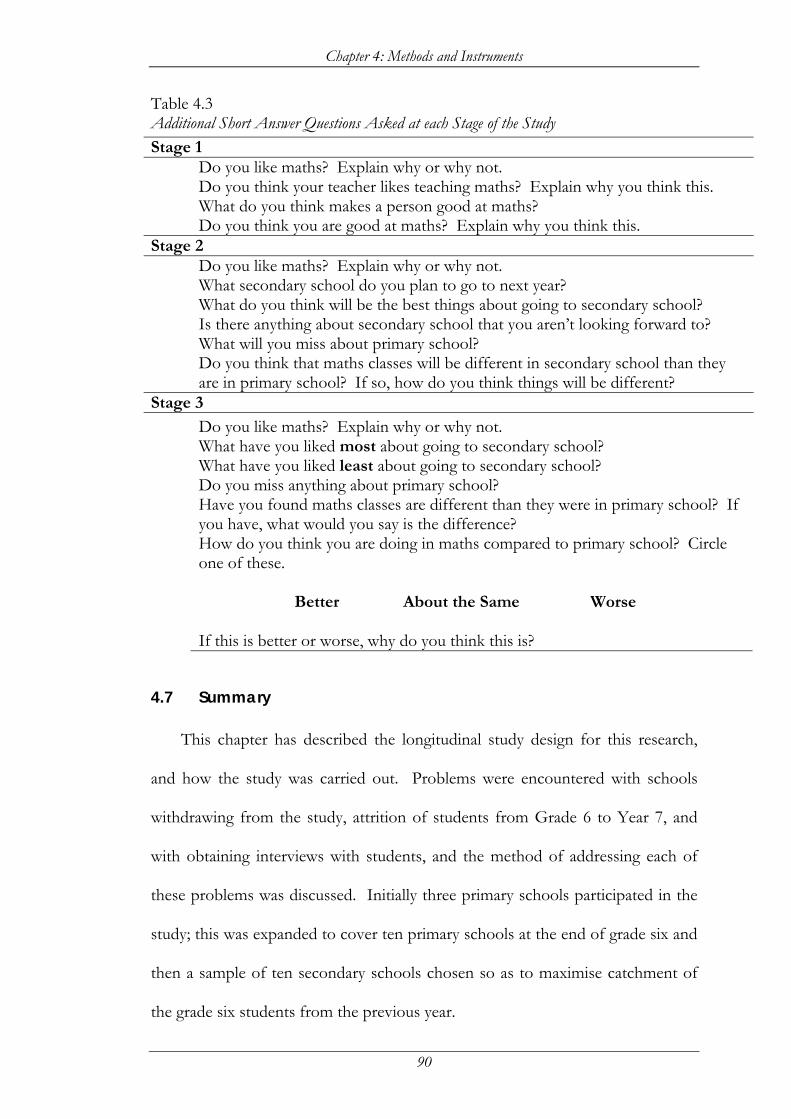
Chapter 4: Methods and Instruments
90
Table 4.3 Additional Short Answer Questions Asked at each Stage of the Study Stage 1
Do you like maths? Explain why or why not. Do you think your teacher likes teaching maths? Explain why you think this. What do you think makes a person good at maths? Do you think you are good at maths? Explain why you think this.
Stage 2 Do you like maths? Explain why or why not. What secondary school do you plan to go to next year? What do you think will be the best things about going to secondary school? Is there anything about secondary school that you aren’t looking forward to? What will you miss about primary school? Do you think that maths classes will be different in secondary school than they are in primary school? If so, how do you think things will be different?
Stage 3
Do you like maths? Explain why or why not. What have you liked most about going to secondary school? What have you liked least about going to secondary school? Do you miss anything about primary school? Have you found maths classes are different than they were in primary school? If you have, what would you say is the difference? How do you think you are doing in maths compared to primary school? Circle one of these.
Better About the Same Worse
If this is better or worse, why do you think this is?
4.7 Summary
This chapter has described the longitudinal study design for this research,
and how the study was carried out. Problems were encountered with schools
withdrawing from the study, attrition of students from Grade 6 to Year 7, and
with obtaining interviews with students, and the method of addressing each of
these problems was discussed. Initially three primary schools participated in the
study; this was expanded to cover ten primary schools at the end of grade six and
then a sample of ten secondary schools chosen so as to maximise catchment of
the grade six students from the previous year.
Chapter 4: Methods and Instruments
91
A variety of scales and questions made up the student questionnaire; these
measured beliefs about mathematics, perceptions of autonomy support,
involvement and provision of structure, perceived control, coping style,
autonomy, relatedness, engagement, classroom environment and self-ratings in
mathematics. An interaction score (CONMAX) was calculated that combined
the interactions of the strategy and capacity beliefs that are believed to promote
motivation and the interactions that are believed to undermine motivation.
Higher levels on the interaction score reflect more positive profiles of perceived
control.
The instruments were next subject to validation using factor analysis and
reliability analysis, and the description of this validation will form the contents of
the next chapter.
92
Chapter 5
Validation of instruments
5.1 Introduction
In the previous chapter, the instruments used in this study were described.
This chapter provides details about the validation of these instruments. The
scales from the Student Perceptions of Control Questionnaire (SPOCQ) have
been used in the United States and in Germany (see for example Connell and
Wellborn, 1991; Patrick et al., 1993; Pierson and Connell, 1992; Skinner and
Belmont, 1993; Skinner, Wellborn & Connell, 1990), but there have been no
studies published using these instruments with Australian students, and no
studies examining belief systems within the specific area of mathematics. The
Individualised Classroom Environment Questionnaire (ICEQ, Fraser, 1990) has
been used widely in the specific context of mathematics with Australian students.
Principal components analysis was carried out on the engagement
questionnaire and on each section of the student questionnaire to assess uni-
dimensionality. This was deemed to be particularly important with the scales
from the SPOCQ, because they had not been used with Australian students
before. Gardner (1996) has argued that factor analysis is an essential step in the
justification of a summated scale, as “the central assumption underpinning this
method is that of uni-dimensionality, i.e. that that all the items in the scale inter-
correlate with each other … and therefore measure a common construct”
Chapter 5: Validation of Instruments
93
(p. 913). Consistent with common practice factors loading less than .3 are not
reported. Reliability analysis was also carried out with each of the scales used,
and the results of all factor and reliability analyses are reported in this chapter.
5.2 Data screening
At each stage of data entry, checks were carried out on the accuracy of the
computer coding. A random sample of 10% of students was selected and their
data entries checked against the original manuscripts for keystroke errors. At
each stage of the data entry, the percentage of keystroke errors was found to be
extremely small (less than .001%). Frequency analysis was carried out for each
variable and no variables were found with entries outside of the accepted range.
The data were then screened for outliers. Mahalanobis distance with
p < .001 was used to screen for multivariate outliers on the perceived control
constructs. One student was deleted from the study after the screening results
found him to be both a univariate and multivariate outlier, and the classroom
teacher revealed that this child was suffering particularly traumatic domestic
problems.
5.3 Missing data
Examination of the data set during the data entry process revealed that there
were few missing items of data, and that any such data were randomly
distributed. Tabachnick and Fidell (1989) noted that while missing data can be a
problem in data analysis, “the pattern of missing data is more important than the
amount missing. Missing values scattered randomly through the data matrix
rarely pose serious problems” (p. 61).
Chapter 5: Validation of Instruments
94
The frequency of missing data was highest for the teacher report items that
assessed student engagement and teacher rating of student ability (4% and 3%,
representing 40 out of 936 and 30 out of 936 cases respectively), however for
student self rating items the amount of missing data did not exceed 2% (20 cases
out of 936).
5.4 Perceived control beliefs
Consistent with the original analysis of data conducted by Skinner et al.
(1988), principal components analysis was carried out separately on each category
of known causes (Table 5.1). The aim of these analyses was to examine the data
for each cause to see if the three-factor solution corresponding to strategy,
capacity and control beliefs was present, as found in previous studies. For
unknown causes, only two factors were expected, because there could be no
capacity beliefs for unknown causes. The three-factor solution was able to be
achieved with eigenvalues either greater than 1 or very close to 1.
Variables loaded as expected from previous research, with few exceptions.
The report of the factor analysis in the original report on the development of the
scale (Skinner et al., 1988), showed similar factor patterns, with loadings ranging
from .34 to .86. The results of the principal components analysis conducted for
this study provide further evidence for the acceptability of the predicted three-
factor solution for each category of known means in this perceived control
model, corresponding to control, strategy and capacity beliefs.
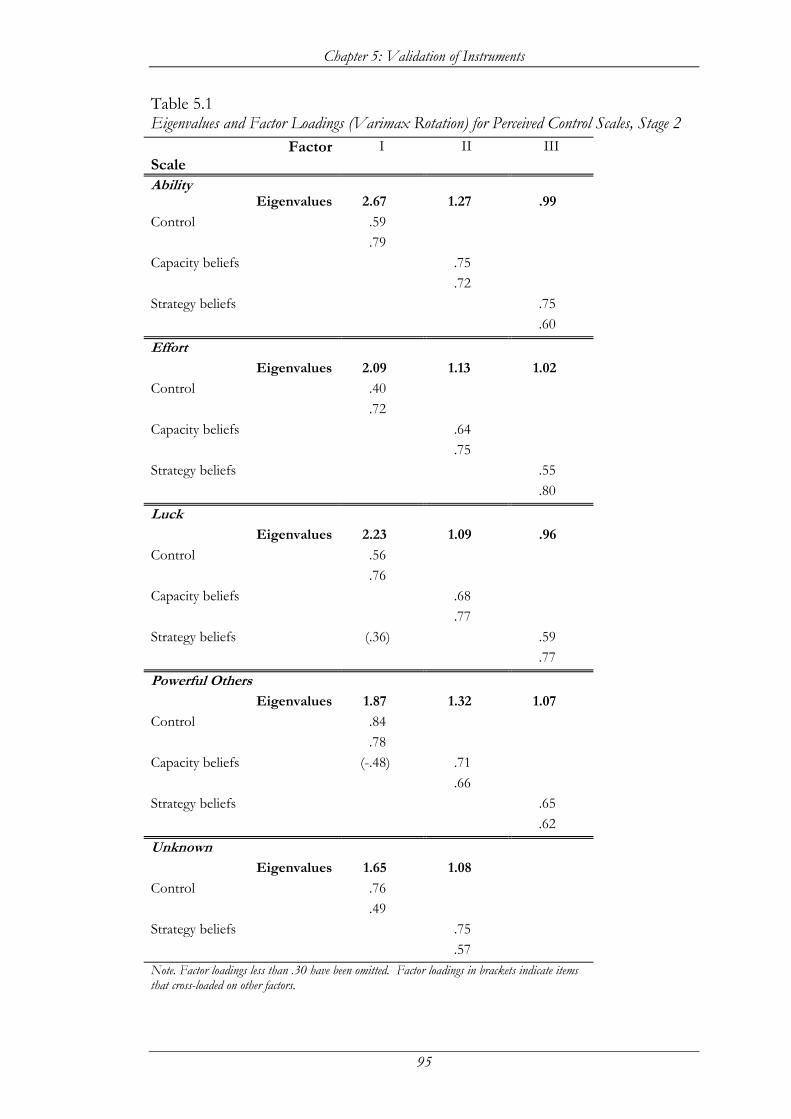
Chapter 5: Validation of Instruments
95
Table 5.1 Eigenvalues and Factor Loadings (Varimax Rotation) for Perceived Control Scales, Stage 2
Factor I II III Scale Ability
Eigenvalues 2.67 1.27 .99
Control .59 .79
Capacity beliefs .75 .72
Strategy beliefs .75 .60
Effort Eigenvalues 2.09 1.13 1.02
Control .40 .72
Capacity beliefs .64 .75
Strategy beliefs .55 .80
Luck Eigenvalues 2.23 1.09 .96
Control .56 .76
Capacity beliefs .68 .77
Strategy beliefs (.36) .59 .77
Powerful Others Eigenvalues 1.87 1.32 1.07
Control .84 .78
Capacity beliefs (-.48) .71 .66
Strategy beliefs .65 .62
Unknown Eigenvalues 1.65 1.08
Control .76 .49
Strategy beliefs .75 .57
Note. Factor loadings less than .30 have been omitted. Factor loadings in brackets indicate items that cross-loaded on other factors.
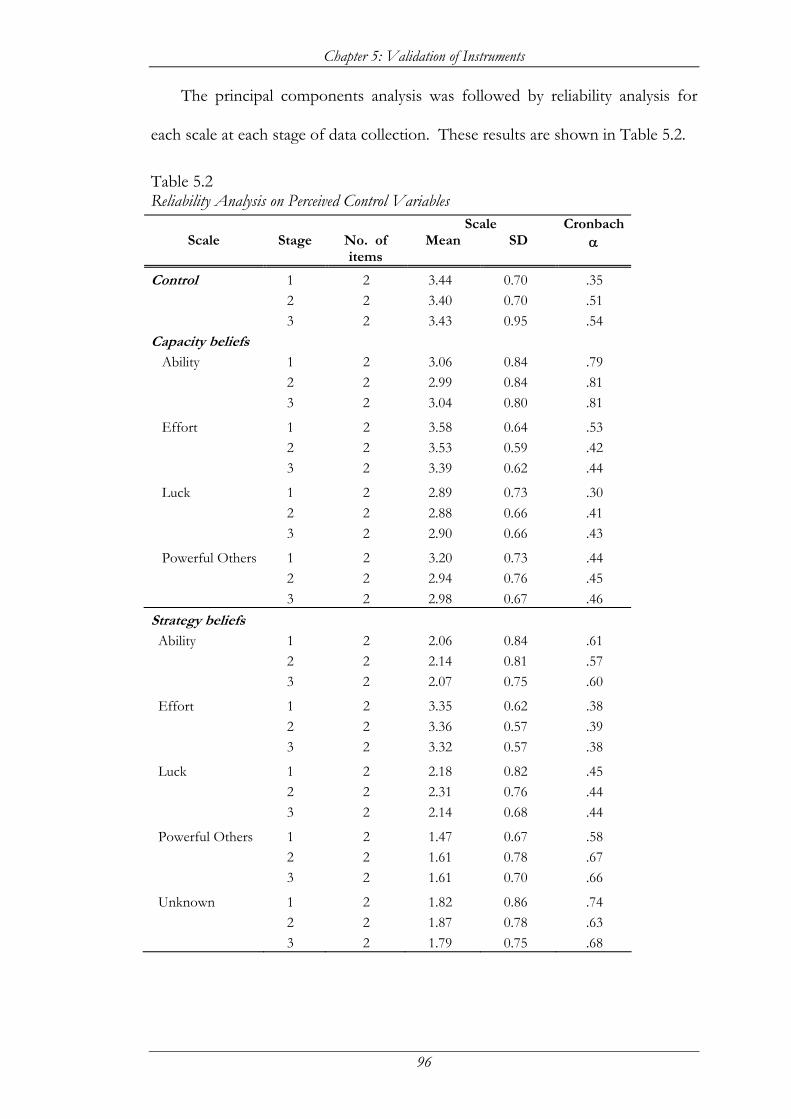
Chapter 5: Validation of Instruments
96
The principal components analysis was followed by reliability analysis for
each scale at each stage of data collection. These results are shown in Table 5.2.
Table 5.2 Reliability Analysis on Perceived Control Variables Scale
Scale Stage No. of items
Mean SD Cronbach
α
Control 1 2 3.44 0.70 .35 2 2 3.40 0.70 .51 3 2 3.43 0.95 .54 Capacity beliefs
Ability 1 2 3.06 0.84 .79 2 2 2.99 0.84 .81 3 2 3.04 0.80 .81
Effort 1 2 3.58 0.64 .53 2 2 3.53 0.59 .42 3 2 3.39 0.62 .44
Luck 1 2 2.89 0.73 .30 2 2 2.88 0.66 .41 3 2 2.90 0.66 .43
Powerful Others 1 2 3.20 0.73 .44 2 2 2.94 0.76 .45 3 2 2.98 0.67 .46 Strategy beliefs Ability 1 2 2.06 0.84 .61 2 2 2.14 0.81 .57 3 2 2.07 0.75 .60
Effort 1 2 3.35 0.62 .38 2 2 3.36 0.57 .39 3 2 3.32 0.57 .38
Luck 1 2 2.18 0.82 .45 2 2 2.31 0.76 .44 3 2 2.14 0.68 .44
Powerful Others 1 2 1.47 0.67 .58 2 2 1.61 0.78 .67 3 2 1.61 0.70 .66
Unknown 1 2 1.82 0.86 .74 2 2 1.87 0.78 .63 3 2 1.79 0.75 .68
Chapter 5: Validation of Instruments
97
Means and standard deviations reported in Table 5.2 are the result of the
scale mean and standard deviation divided by the number of items, in order that
scores on different scales can be compared.
Reliability coefficients for some scales were not particularly high, as would
be expected from a two-item scale. However as the factor analysis for these
variables is robust, the conclusion from this particular analysis would be that the
scale used in practice is acceptable as it agrees with that found in previous
research. It can also be seen from Table 5.2 that reliability generally increased
over the duration of the study.
5.5 Engagement
The questions that corresponded to the proposed student-rated
engagement scale were entered into principal components analysis and one
eigenvalue (3.71) was found to be significant. All questions loaded onto this
single factor, and subsequent reliability analysis found that the Cronbach alpha
coefficient was .82 at stage 1, .80 at stage 2 and .87 at stage 3. The questions
were thus deemed to form an acceptable scale.
The principal components analysis on items comprising the proposed
teacher-rated student engagement scale produced one eigenvalue of 16.33, and all
items loaded onto this factor, with loadings ranging from .40 to .86. Reliabilities
were found to be extremely high for this scale; .93 at stage 1, .97 at stage 2 and
.95 at stage 3. These results indicated that the engagement questions are all
measuring the same construct, and therefore it was appropriate that scores on
these items be combined to form a total engagement score.
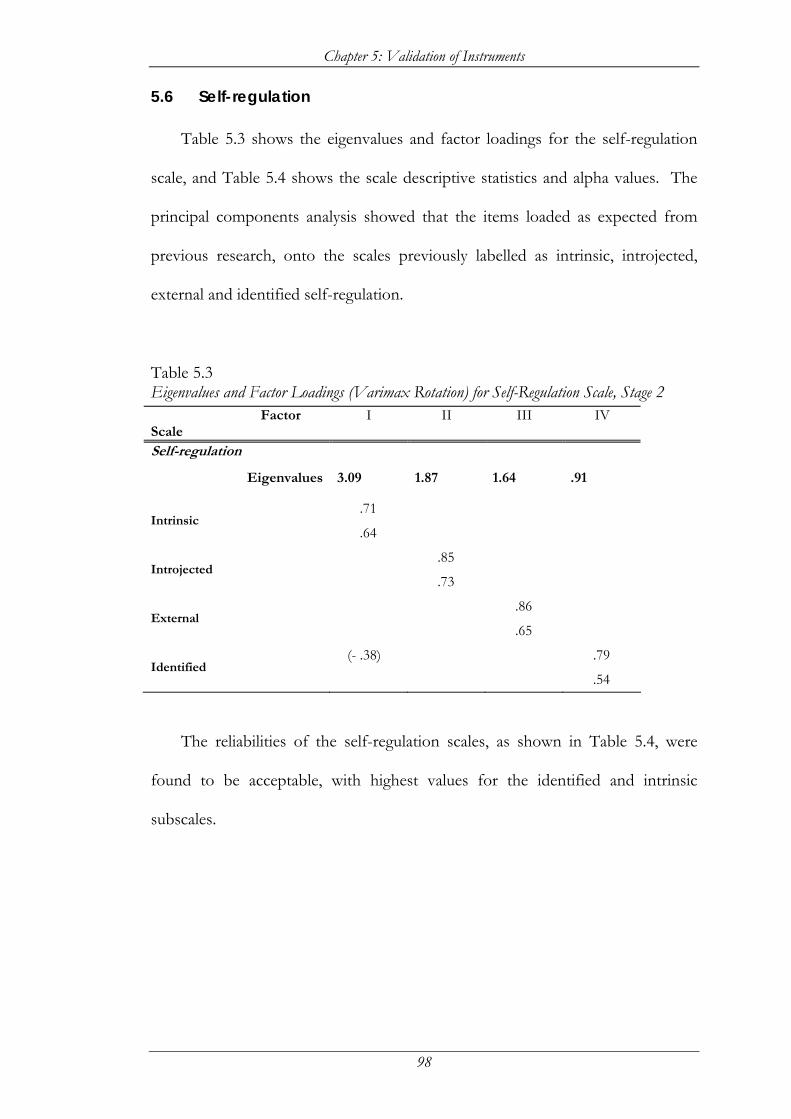
Chapter 5: Validation of Instruments
98
5.6 Self-regulation
Table 5.3 shows the eigenvalues and factor loadings for the self-regulation
scale, and Table 5.4 shows the scale descriptive statistics and alpha values. The
principal components analysis showed that the items loaded as expected from
previous research, onto the scales previously labelled as intrinsic, introjected,
external and identified self-regulation.
Table 5.3 Eigenvalues and Factor Loadings (Varimax Rotation) for Self-Regulation Scale, Stage 2 Factor I II III IV Scale Self-regulation
Eigenvalues 3.09 1.87 1.64 .91
Intrinsic .71
.64
Introjected .85
.73
External .86
.65
Identified (- .38) .79
.54
The reliabilities of the self-regulation scales, as shown in Table 5.4, were
found to be acceptable, with highest values for the identified and intrinsic
subscales.
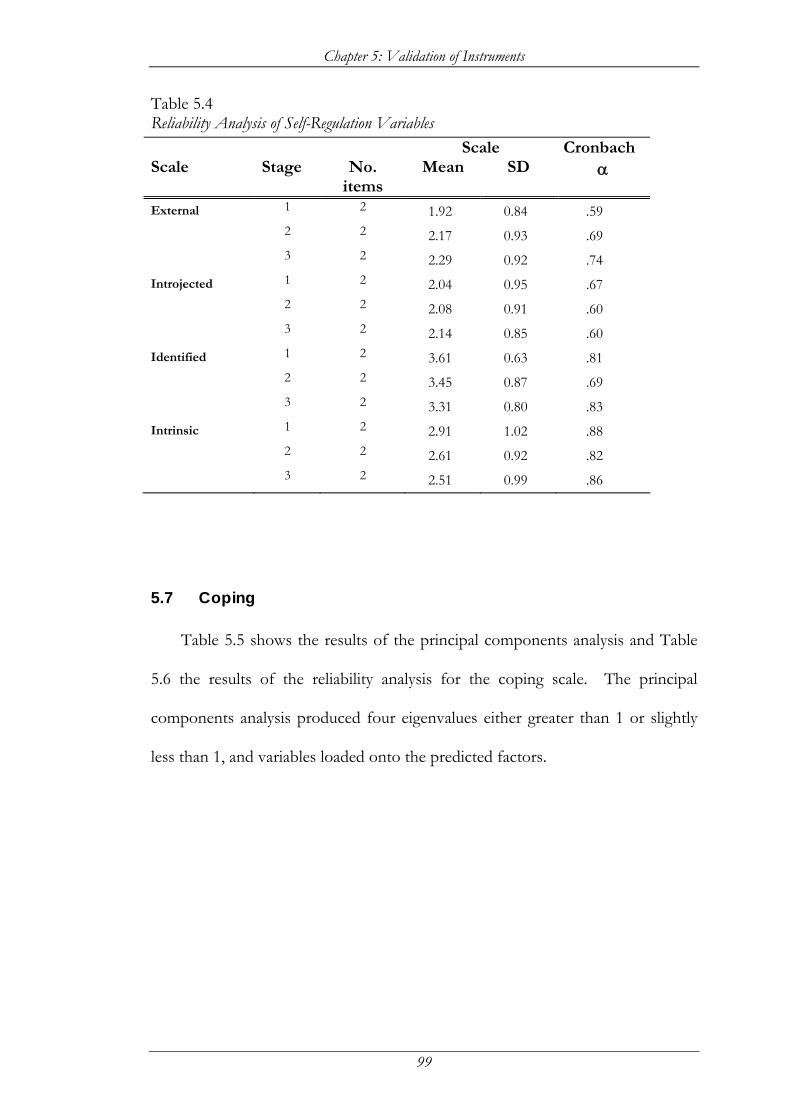
Chapter 5: Validation of Instruments
99
Table 5.4 Reliability Analysis of Self-Regulation Variables Scale Cronbach Scale Stage No.
items Mean SD α
External 1 2 1.92 0.84 .59 2 2 2.17 0.93 .69 3 2 2.29 0.92 .74 Introjected 1 2 2.04 0.95 .67 2 2 2.08 0.91 .60 3 2 2.14 0.85 .60 Identified 1 2 3.61 0.63 .81 2 2 3.45 0.87 .69 3 2 3.31 0.80 .83 Intrinsic 1 2 2.91 1.02 .88 2 2 2.61 0.92 .82 3 2 2.51 0.99 .86
5.7 Coping
Table 5.5 shows the results of the principal components analysis and Table
5.6 the results of the reliability analysis for the coping scale. The principal
components analysis produced four eigenvalues either greater than 1 or slightly
less than 1, and variables loaded onto the predicted factors.
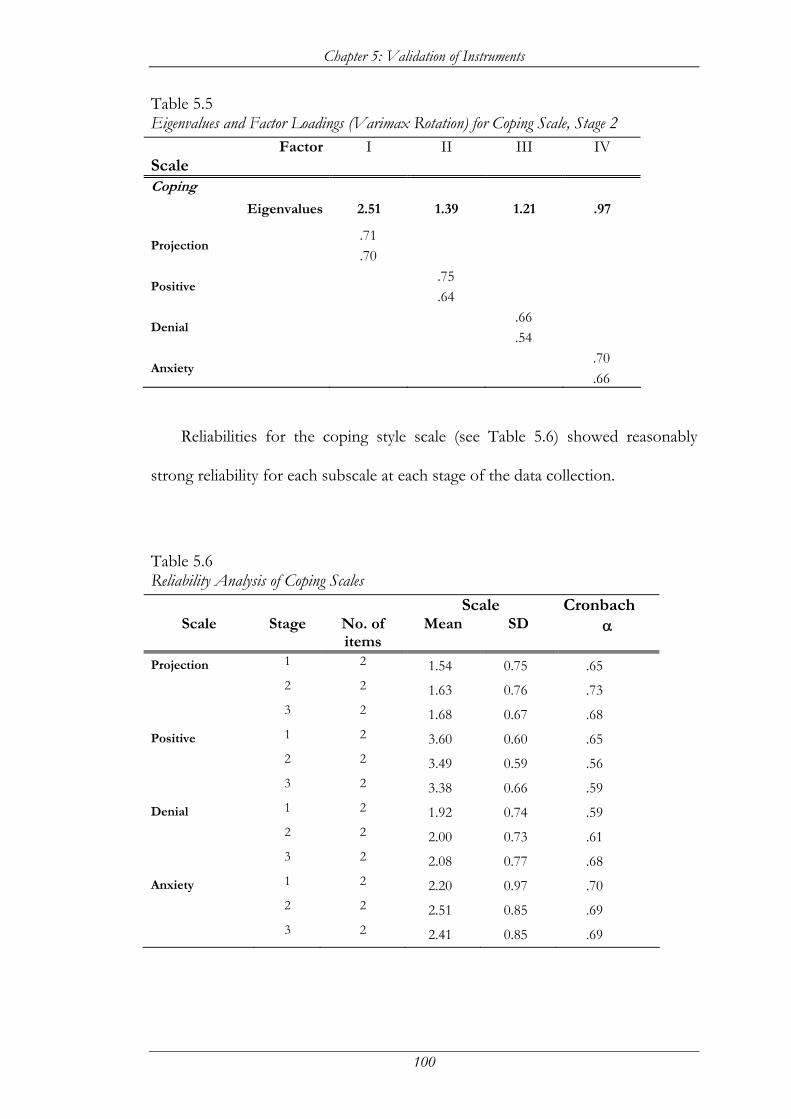
Chapter 5: Validation of Instruments
100
Table 5.5 Eigenvalues and Factor Loadings (Varimax Rotation) for Coping Scale, Stage 2
Factor I II III IV Scale Coping
Eigenvalues 2.51 1.39 1.21 .97
Projection .71 .70
Positive .75
.64
Denial .66
.54
Anxiety .70
.66
Reliabilities for the coping style scale (see Table 5.6) showed reasonably
strong reliability for each subscale at each stage of the data collection.
Table 5.6 Reliability Analysis of Coping Scales Scale Cronbach
Scale Stage No. of items
Mean SD α
Projection 1 2 1.54 0.75 .65 2 2 1.63 0.76 .73 3 2 1.68 0.67 .68 Positive 1 2 3.60 0.60 .65 2 2 3.49 0.59 .56 3 2 3.38 0.66 .59 Denial 1 2 1.92 0.74 .59 2 2 2.00 0.73 .61 3 2 2.08 0.77 .68 Anxiety 1 2 2.20 0.97 .70 2 2 2.51 0.85 .69 3 2 2.41 0.85 .69
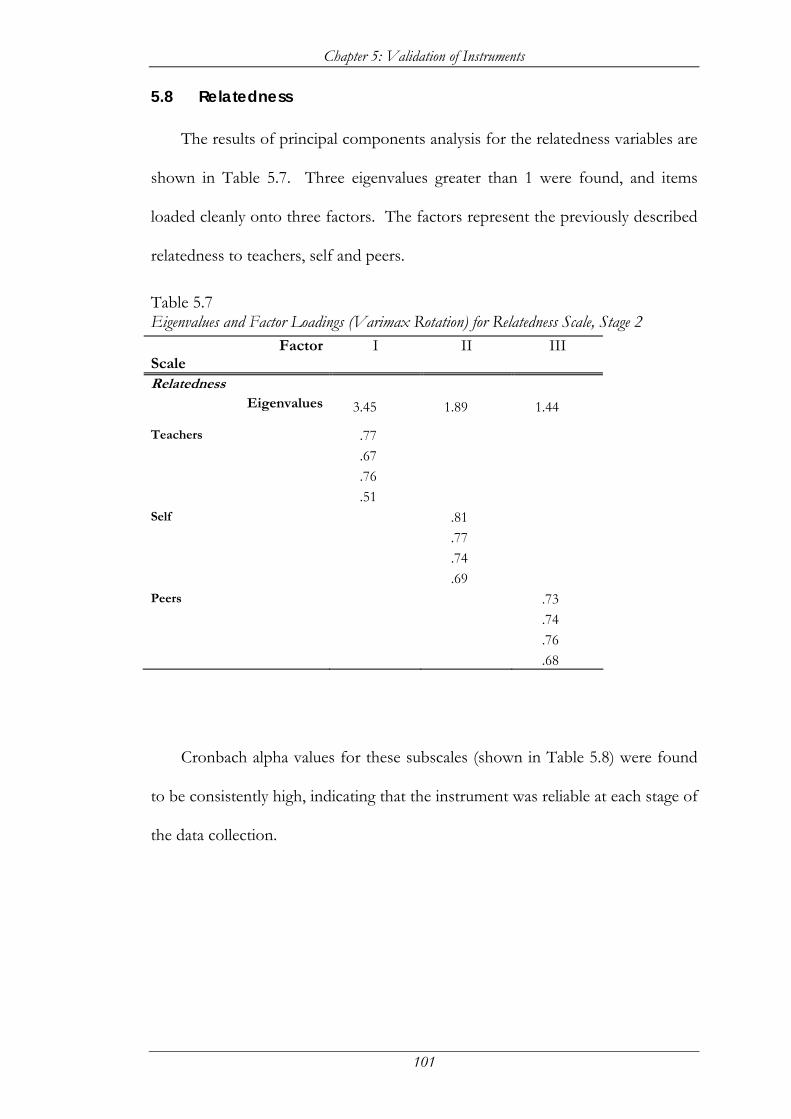
Chapter 5: Validation of Instruments
101
5.8 Relatedness
The results of principal components analysis for the relatedness variables are
shown in Table 5.7. Three eigenvalues greater than 1 were found, and items
loaded cleanly onto three factors. The factors represent the previously described
relatedness to teachers, self and peers.
Table 5.7 Eigenvalues and Factor Loadings (Varimax Rotation) for Relatedness Scale, Stage 2
Factor I II III Scale Relatedness
Eigenvalues 3.45 1.89 1.44
Teachers .77 .67 .76 .51
Self .81 .77 .74 .69
Peers .73 .74 .76 .68
Cronbach alpha values for these subscales (shown in Table 5.8) were found
to be consistently high, indicating that the instrument was reliable at each stage of
the data collection.
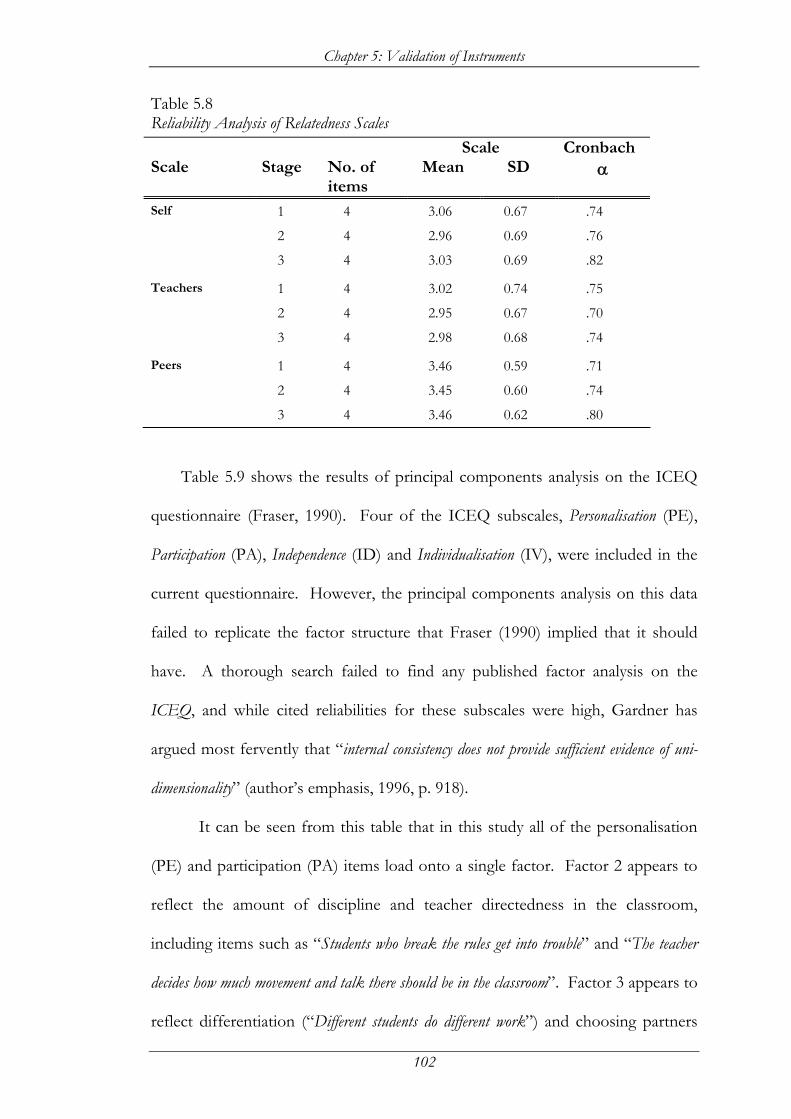
Chapter 5: Validation of Instruments
102
Table 5.8 Reliability Analysis of Relatedness Scales Scale Cronbach Scale Stage No. of
items Mean SD α
Self 1 4 3.06 0.67 .74 2 4 2.96 0.69 .76 3 4 3.03 0.69 .82
Teachers 1 4 3.02 0.74 .75 2 4 2.95 0.67 .70 3 4 2.98 0.68 .74
Peers 1 4 3.46 0.59 .71 2 4 3.45 0.60 .74 3 4 3.46 0.62 .80
Table 5.9 shows the results of principal components analysis on the ICEQ
questionnaire (Fraser, 1990). Four of the ICEQ subscales, Personalisation (PE),
Participation (PA), Independence (ID) and Individualisation (IV), were included in the
current questionnaire. However, the principal components analysis on this data
failed to replicate the factor structure that Fraser (1990) implied that it should
have. A thorough search failed to find any published factor analysis on the
ICEQ, and while cited reliabilities for these subscales were high, Gardner has
argued most fervently that “internal consistency does not provide sufficient evidence of uni-
dimensionality” (author’s emphasis, 1996, p. 918).
It can be seen from this table that in this study all of the personalisation
(PE) and participation (PA) items load onto a single factor. Factor 2 appears to
reflect the amount of discipline and teacher directedness in the classroom,
including items such as “Students who break the rules get into trouble” and “The teacher
decides how much movement and talk there should be in the classroom”. Factor 3 appears to
reflect differentiation (“Different students do different work”) and choosing partners
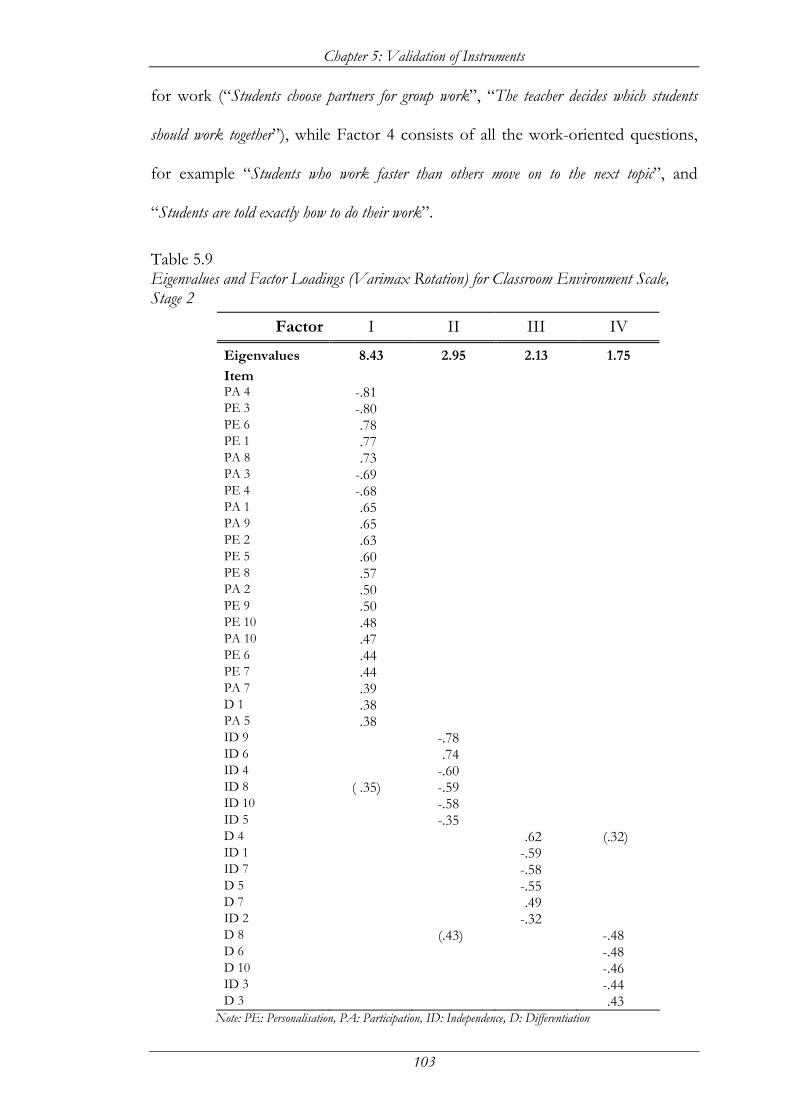
Chapter 5: Validation of Instruments
103
for work (“Students choose partners for group work”, “The teacher decides which students
should work together”), while Factor 4 consists of all the work-oriented questions,
for example “Students who work faster than others move on to the next topic”, and
“Students are told exactly how to do their work”.
Table 5.9 Eigenvalues and Factor Loadings (Varimax Rotation) for Classroom Environment Scale, Stage 2
Factor I II III IV
Eigenvalues 8.43 2.95 2.13 1.75
Item PA 4 -.81 PE 3 -.80 PE 6 .78 PE 1 .77 PA 8 .73 PA 3 -.69 PE 4 -.68 PA 1 .65 PA 9 .65 PE 2 .63 PE 5 .60 PE 8 .57 PA 2 .50 PE 9 .50 PE 10 .48 PA 10 .47 PE 6 .44 PE 7 .44 PA 7 .39 D 1 .38 PA 5 .38 ID 9 -.78 ID 6 .74 ID 4 -.60 ID 8 ( .35) -.59 ID 10 -.58 ID 5 -.35 D 4 .62 (.32) ID 1 -.59 ID 7 -.58 D 5 -.55 D 7 .49 ID 2 -.32 D 8 (.43) -.48 D 6 -.48 D 10 -.46 ID 3 -.44 D 3 .43
Note: PE: Personalisation, PA: Participation, ID: Independence, D: Differentiation
Chapter 5: Validation of Instruments
104
As the ICEQ questions did not replicate the factor structure for which
they were selected, the characteristics that they were supposed to measure could
not be assumed to form a scale. Consequently, no further analysis was carried
out on this particular part of the questionnaire for the present study.
5.9 Summary
This chapter described the analyses concerning the validity of the scales
chosen to be used in this study. Data were screened for keystroke errors and for
outliers and missing data were examined and found to be randomly distributed.
Principal components analysis of the perceived control items on the
questionnaire provided evidence that a three-factor solution was appropriate,
corresponding to strategy, capacity and control beliefs. The scales pertaining to
teacher and student-rated engagement, self-regulation, coping and relatedness
were all found to be similar in factor structure to those described in previous
research, and reliable within the limits of this study.
The items relating to the ICEQ questionnaire, however, were not found to
conform to previously published subscales, and no principal components analysis
on this questionnaire was able to be located. As such it was decided that this
scale could not be used in the present study.
In the next chapter the initial data analysis is discussed, including an
examination of the changes in each of the scales over the transition to secondary
school.
105
Chapter 6
Cross-sectional comparisons
6.1 Introduction
This chapter presents the results of the analysis of data obtained from the
student and teacher questionnaires at each stage of the study. As the study was
longitudinal, the aim being to examine the changing attitudes to and beliefs about
learning mathematics over the primary - secondary school transition, separate
data analyses were carried out to examine both the effects within each sample
and the effects between samples. This chapter will deal with the cross-sectional
data analysis while chapter 7 will deal with the longitudinal analysis.
6.2 Research questions
In order to begin to examine the major research question, it was important
to first look at the perceived control model to see whether the relationships
described in the literature for general beliefs about school were valid in the
particular context of mathematics. The following research questions were then
explored in this section of the data analysis:
• What are the relationships between the perceived control variables and
teacher-rated student engagement?
• Are these the same before and after the transition to secondary school?
Chapter 6: Cross-sectional comparisons
106
6.3 Statistical methods
A number of different statistical methods were employed in the analysis of
the data, in order to examine both the longitudinal effects of all of the variables
and the cross-sectional contribution of the perceived control variables to
Teacher-rated student engagement.
Initial data analysis, comprising descriptive statistics, correlations and
regression procedures was carried out on the whole data set collected at each
stage of the study.
6.4 Analysis of cross-sectional data: Aims
Skinner, Wellborn and Connell (1990) proposed that beliefs that indicated
that students felt that their school performances were out of their control were
those most likely to undermine engagement in learning. These beliefs include
high strategy beliefs for powerful others, luck or unknown factors, and a low
belief in one’s own ability or capacity to exert effort. If the perceived control
model applies within the specific context of mathematics, these beliefs would
correlate negatively with teacher-rated student engagement. As well, high control
beliefs would correlate positively with engagement, and engagement would
correlate positively with achievement and teacher rating of student achievement.
The data analysis in this initial stage was also to a large extent exploratory,
investigating whether beliefs were different before and after the transition to
secondary school.
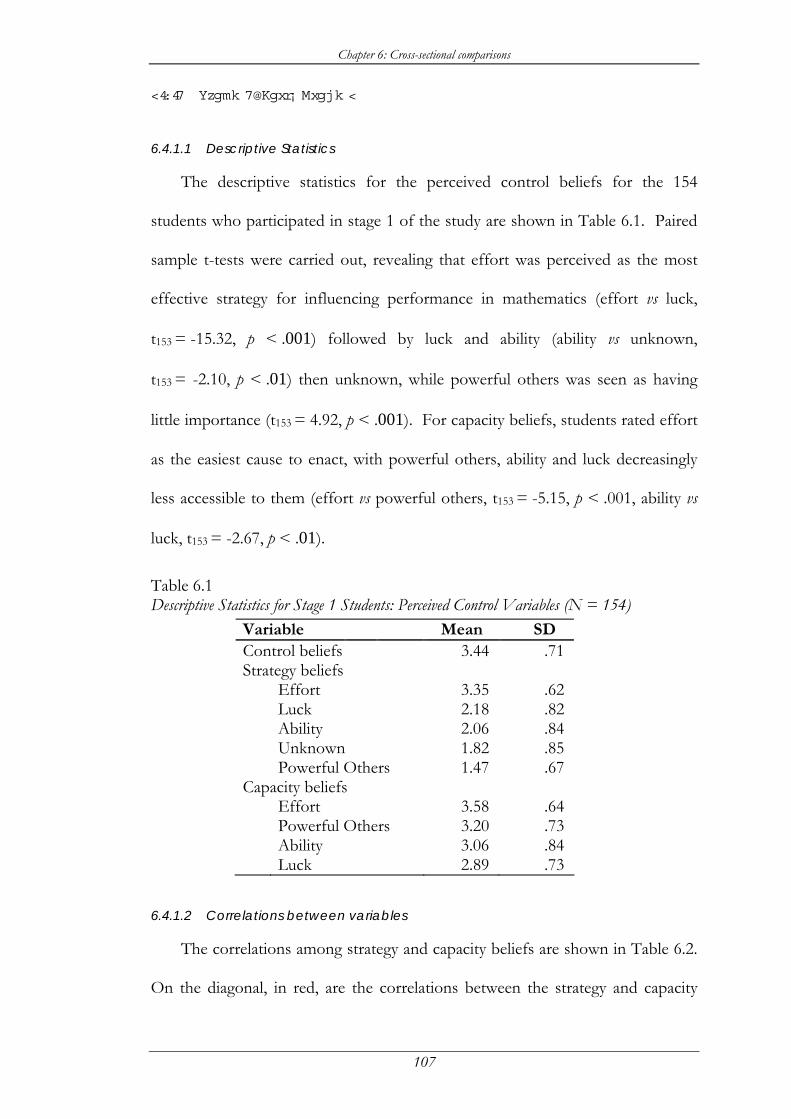
Chapter 6: Cross-sectional comparisons
107
6.4.1 Stage 1: Early Grade 6
6.4.1.1 Descriptive Statistics
The descriptive statistics for the perceived control beliefs for the 154
students who participated in stage 1 of the study are shown in Table 6.1. Paired
sample t-tests were carried out, revealing that effort was perceived as the most
effective strategy for influencing performance in mathematics (effort vs luck,
t153 = -15.32, p < .001) followed by luck and ability (ability vs unknown,
t153 = -2.10, p < .01) then unknown, while powerful others was seen as having
little importance (t153 = 4.92, p < .001). For capacity beliefs, students rated effort
as the easiest cause to enact, with powerful others, ability and luck decreasingly
less accessible to them (effort vs powerful others, t153 = -5.15, p < .001, ability vs
luck, t153 = -2.67, p < .01).
Table 6.1 Descriptive Statistics for Stage 1 Students: Perceived Control Variables (N = 154)
Variable Mean SD Control beliefs 3.44 .71 Strategy beliefs Effort 3.35 .62 Luck 2.18 .82 Ability 2.06 .84 Unknown 1.82 .85 Powerful Others 1.47 .67 Capacity beliefs Effort 3.58 .64 Powerful Others 3.20 .73 Ability 3.06 .84 Luck 2.89 .73
6.4.1.2 Correlations between variables
The correlations among strategy and capacity beliefs are shown in Table 6.2.
On the diagonal, in red, are the correlations between the strategy and capacity
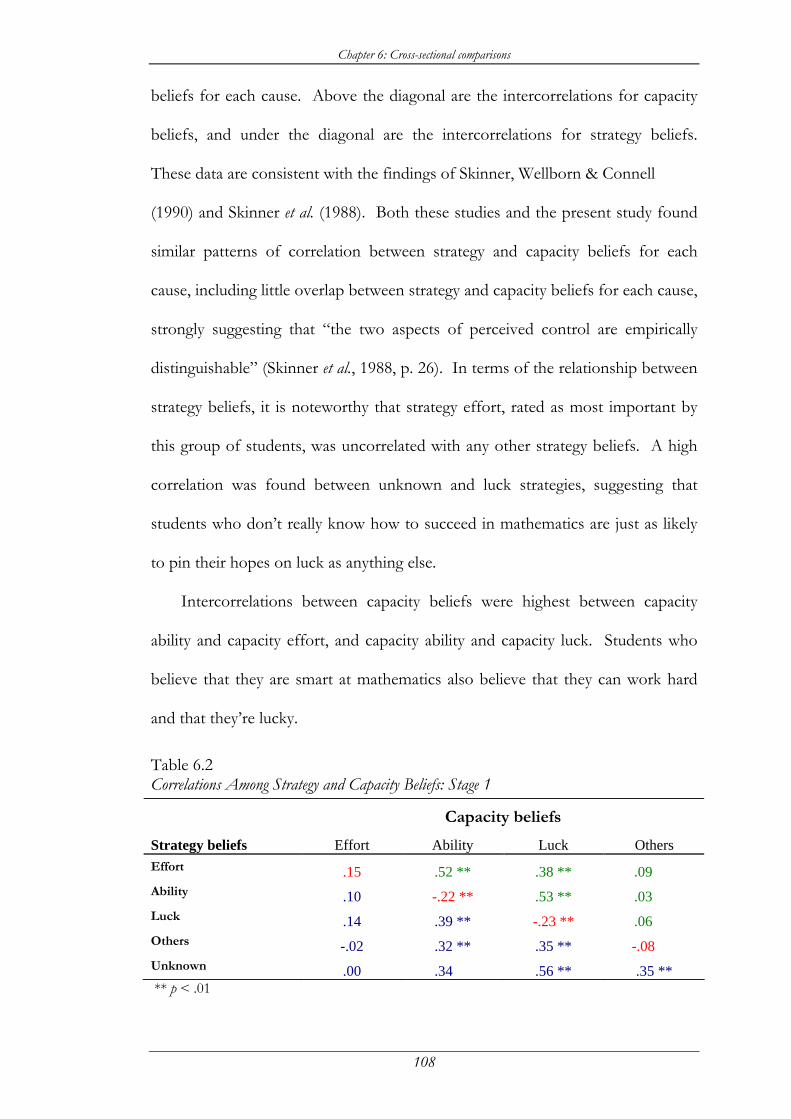
Chapter 6: Cross-sectional comparisons
108
beliefs for each cause. Above the diagonal are the intercorrelations for capacity
beliefs, and under the diagonal are the intercorrelations for strategy beliefs.
These data are consistent with the findings of Skinner, Wellborn & Connell
(1990) and Skinner et al. (1988). Both these studies and the present study found
similar patterns of correlation between strategy and capacity beliefs for each
cause, including little overlap between strategy and capacity beliefs for each cause,
strongly suggesting that “the two aspects of perceived control are empirically
distinguishable” (Skinner et al., 1988, p. 26). In terms of the relationship between
strategy beliefs, it is noteworthy that strategy effort, rated as most important by
this group of students, was uncorrelated with any other strategy beliefs. A high
correlation was found between unknown and luck strategies, suggesting that
students who don’t really know how to succeed in mathematics are just as likely
to pin their hopes on luck as anything else.
Intercorrelations between capacity beliefs were highest between capacity
ability and capacity effort, and capacity ability and capacity luck. Students who
believe that they are smart at mathematics also believe that they can work hard
and that they’re lucky.
Table 6.2 Correlations Among Strategy and Capacity Beliefs: Stage 1
Capacity beliefs
Strategy beliefs Effort Ability Luck Others Effort .15 .52 ** .38 ** .09 pp Ability .10 -.22 ** .53 ** .03 pp Luck .14 .39 ** -.23 ** .06 pp Others -.02 .32 ** .35 ** -.08 pp Unknown .00 .34 pp .56 ** .35 ** ** p < .01
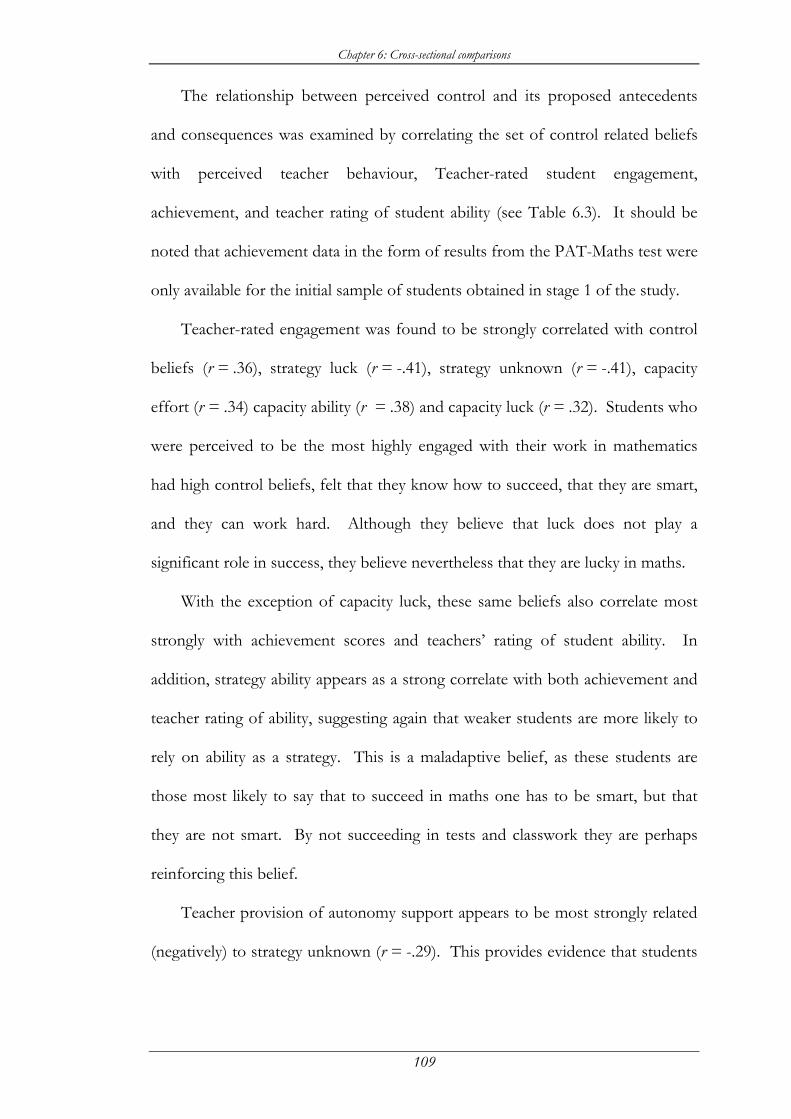
Chapter 6: Cross-sectional comparisons
109
The relationship between perceived control and its proposed antecedents
and consequences was examined by correlating the set of control related beliefs
with perceived teacher behaviour, Teacher-rated student engagement,
achievement, and teacher rating of student ability (see Table 6.3). It should be
noted that achievement data in the form of results from the PAT-Maths test were
only available for the initial sample of students obtained in stage 1 of the study.
Teacher-rated engagement was found to be strongly correlated with control
beliefs (r = .36), strategy luck (r = -.41), strategy unknown (r = -.41), capacity
effort (r = .34) capacity ability (r = .38) and capacity luck (r = .32). Students who
were perceived to be the most highly engaged with their work in mathematics
had high control beliefs, felt that they know how to succeed, that they are smart,
and they can work hard. Although they believe that luck does not play a
significant role in success, they believe nevertheless that they are lucky in maths.
With the exception of capacity luck, these same beliefs also correlate most
strongly with achievement scores and teachers’ rating of student ability. In
addition, strategy ability appears as a strong correlate with both achievement and
teacher rating of ability, suggesting again that weaker students are more likely to
rely on ability as a strategy. This is a maladaptive belief, as these students are
those most likely to say that to succeed in maths one has to be smart, but that
they are not smart. By not succeeding in tests and classwork they are perhaps
reinforcing this belief.
Teacher provision of autonomy support appears to be most strongly related
(negatively) to strategy unknown (r = -.29). This provides evidence that students
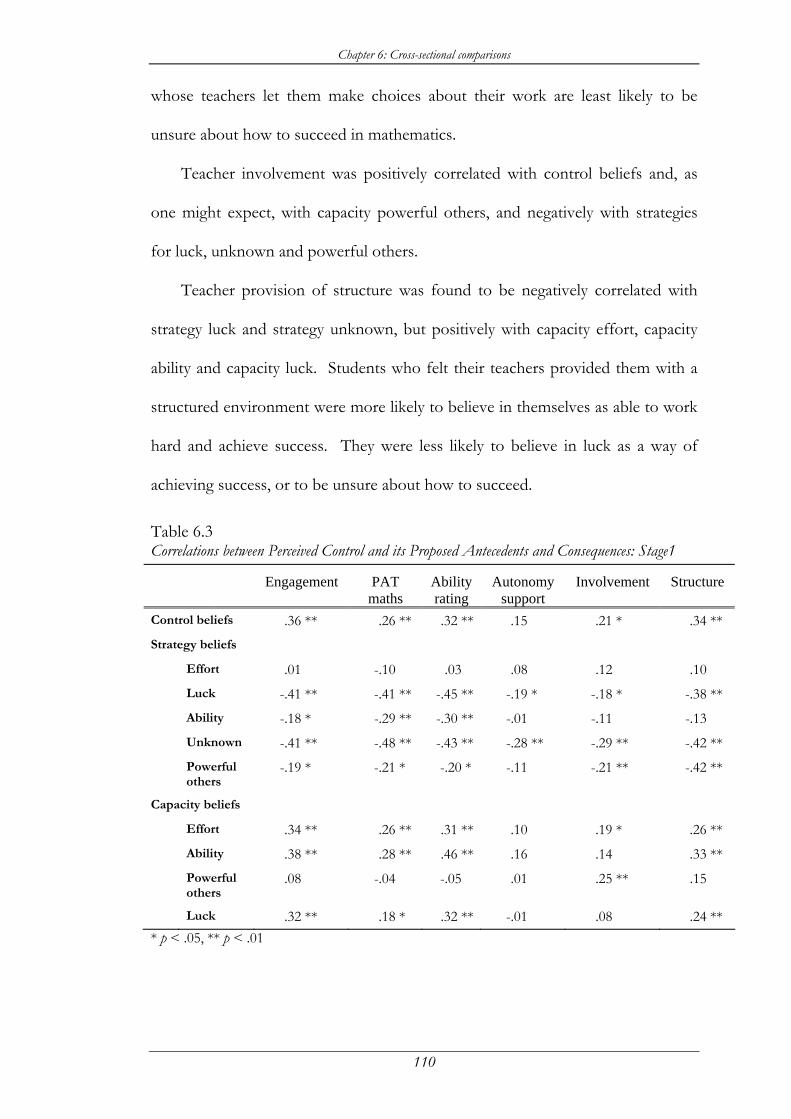
Chapter 6: Cross-sectional comparisons
110
whose teachers let them make choices about their work are least likely to be
unsure about how to succeed in mathematics.
Teacher involvement was positively correlated with control beliefs and, as
one might expect, with capacity powerful others, and negatively with strategies
for luck, unknown and powerful others.
Teacher provision of structure was found to be negatively correlated with
strategy luck and strategy unknown, but positively with capacity effort, capacity
ability and capacity luck. Students who felt their teachers provided them with a
structured environment were more likely to believe in themselves as able to work
hard and achieve success. They were less likely to believe in luck as a way of
achieving success, or to be unsure about how to succeed.
Table 6.3 Correlations between Perceived Control and its Proposed Antecedents and Consequences: Stage1
Engagement PAT maths
Ability rating
Autonomy support
Involvement Structure
Control beliefs .36 ** .26 ** .32 ** .15 .21 * .34 ** Strategy beliefs Effort .01 -.10 .03 .08 .12 .10 Luck -.41 ** -.41 ** -.45 ** -.19 * -.18 * -.38 ** Ability -.18 * -.29 ** -.30 ** -.01 -.11 -.13 Unknown -.41 ** -.48 ** -.43 ** -.28 ** -.29 ** -.42 ** Powerful
others -.19 * -.21 * -.20 * -.11 -.21 ** -.42 **
Capacity beliefs Effort .34 ** .26 ** .31 ** .10 .19 * .26 ** Ability .38 ** .28 ** .46 ** .16 .14 .33 ** Powerful
others .08 -.04 -.05 .01 .25 ** .15
Luck .32 ** .18 * .32 ** -.01 .08 .24 ** * p < .05, ** p < .01
Chapter 6: Cross-sectional comparisons
111
Correlations between teacher rating of student engagement, teacher rating of
student ability and the results from the PAT-Mathematics test were examined.
Strong correlations were found between all three, with the highest correlations, as
might be expected, between teacher ratings of student ability and engagement
(r = .71). The correlation between teacher rating of ability and the PAT-
Mathematics score was .63, and between teacher rating of engagement and PAT-
Mathematics was .58 (all p < .001).
6.4.1.3 Regression Analysis
The initial examination of the data was followed by multiple regression in
order to identify the unique contribution of each of the perceived control beliefs.
Engagement was regressed firstly onto the four capacity beliefs. The equation
was found to be significant (R2 = .19, p < .001), and capacity ability and effort
were both found to be significant predictors of engagement (β = .22, p < .05 and
β = .18, p < .05 respectively). Engagement was then regressed onto the five
strategy beliefs. The equation was significant (R2 = .19, p < .001), and both strategy
luck and strategy unknown were found to be significant negative predictors of
engagement (β = -.27, p < .01; β = -.26, p < .01 respectively).
A third set of regression analyses was carried out to examine the unique
effects of the paired strategy and capacity beliefs for each cause on engagement.
For effort and ability, only capacity beliefs predicted engagement (both βs = .35,
p < .001). For luck, both strategy and capacity beliefs predicted engagement,
however a high reliance on luck as a strategy for success predicted low
engagement (strategy β = - .36, p < .001, capacity β = .24, p < .01). For
powerful others, strategy beliefs were a significant negative predictor of
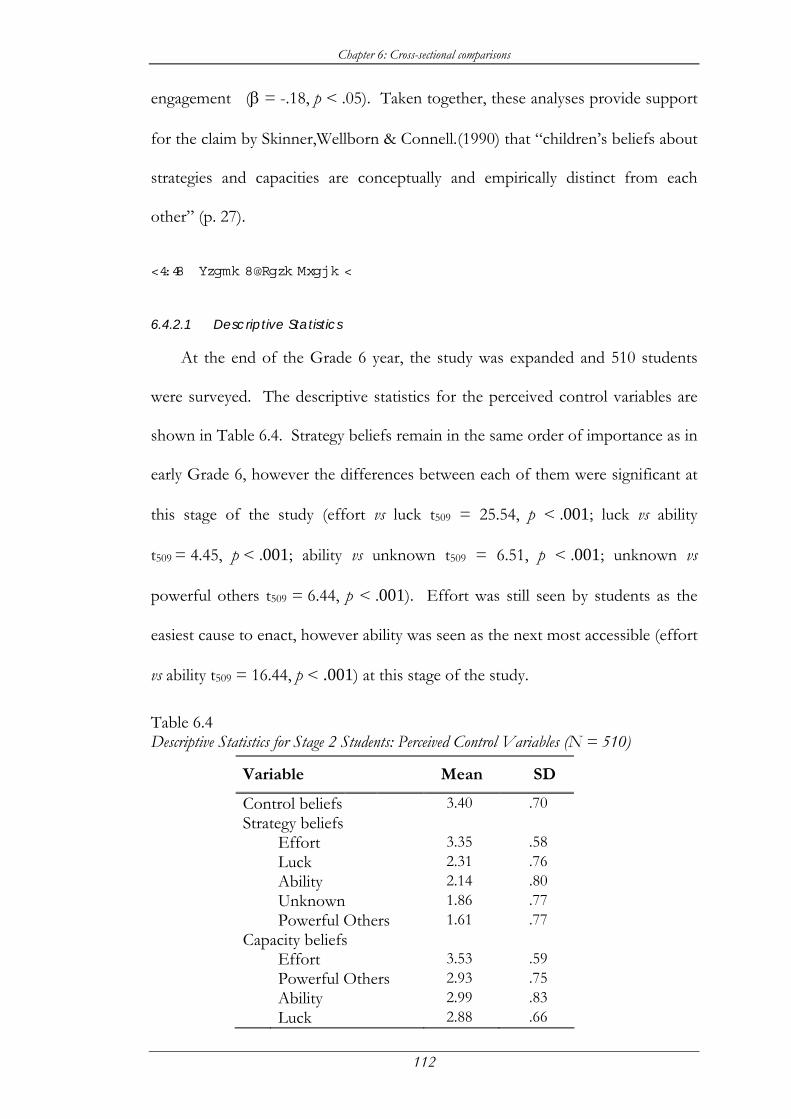
Chapter 6: Cross-sectional comparisons
112
engagement (β = -.18, p < .05). Taken together, these analyses provide support
for the claim by Skinner,Wellborn & Connell.(1990) that “children’s beliefs about
strategies and capacities are conceptually and empirically distinct from each
other” (p. 27).
6.4.2 Stage 2: Late Grade 6
6.4.2.1 Descriptive Statistics
At the end of the Grade 6 year, the study was expanded and 510 students
were surveyed. The descriptive statistics for the perceived control variables are
shown in Table 6.4. Strategy beliefs remain in the same order of importance as in
early Grade 6, however the differences between each of them were significant at
this stage of the study (effort vs luck t509 = 25.54, p < .001; luck vs ability
t509 = 4.45, p < .001; ability vs unknown t509 = 6.51, p < .001; unknown vs
powerful others t509 = 6.44, p < .001). Effort was still seen by students as the
easiest cause to enact, however ability was seen as the next most accessible (effort
vs ability t509 = 16.44, p < .001) at this stage of the study.
Table 6.4 Descriptive Statistics for Stage 2 Students: Perceived Control Variables (N = 510)
Variable Mean SD
Control beliefs 3.40 .70 Strategy beliefs Effort 3.35 .58 Luck 2.31 .76 Ability 2.14 .80 Unknown 1.86 .77 Powerful Others 1.61 .77 Capacity beliefs Effort 3.53 .59 Powerful Others 2.93 .75 Ability 2.99 .83 Luck 2.88 .66
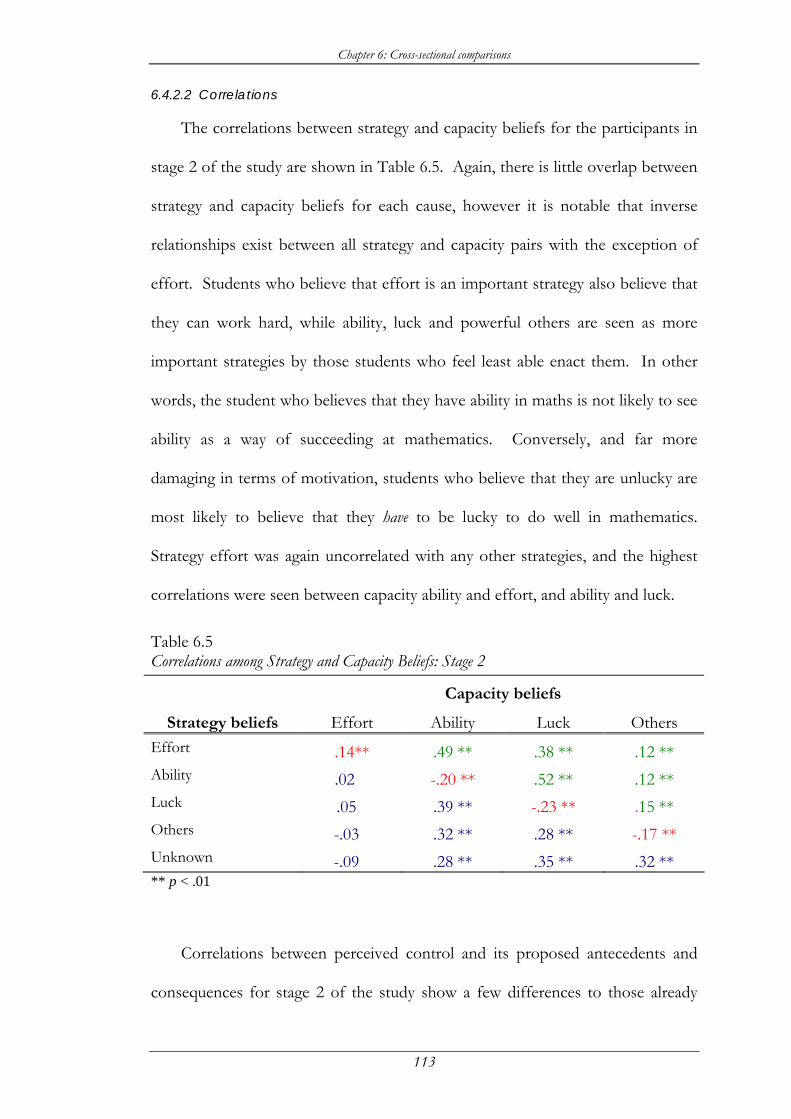
Chapter 6: Cross-sectional comparisons
113
6.4.2.2 Correlations
The correlations between strategy and capacity beliefs for the participants in
stage 2 of the study are shown in Table 6.5. Again, there is little overlap between
strategy and capacity beliefs for each cause, however it is notable that inverse
relationships exist between all strategy and capacity pairs with the exception of
effort. Students who believe that effort is an important strategy also believe that
they can work hard, while ability, luck and powerful others are seen as more
important strategies by those students who feel least able enact them. In other
words, the student who believes that they have ability in maths is not likely to see
ability as a way of succeeding at mathematics. Conversely, and far more
damaging in terms of motivation, students who believe that they are unlucky are
most likely to believe that they have to be lucky to do well in mathematics.
Strategy effort was again uncorrelated with any other strategies, and the highest
correlations were seen between capacity ability and effort, and ability and luck.
Table 6.5 Correlations among Strategy and Capacity Beliefs: Stage 2
Capacity beliefs
Strategy beliefs Effort Ability Luck Others Effort .14** .49 ** .38 ** .12 ** Ability .02pp -.20 ** .52 ** .12 ** Luck .05 p .39 ** -.23 ** .15 ** Others -.03 p .32 ** .28 ** -.17 ** Unknown -.09 p .28 ** .35 ** .32 ** ** p < .01
Correlations between perceived control and its proposed antecedents and
consequences for stage 2 of the study show a few differences to those already
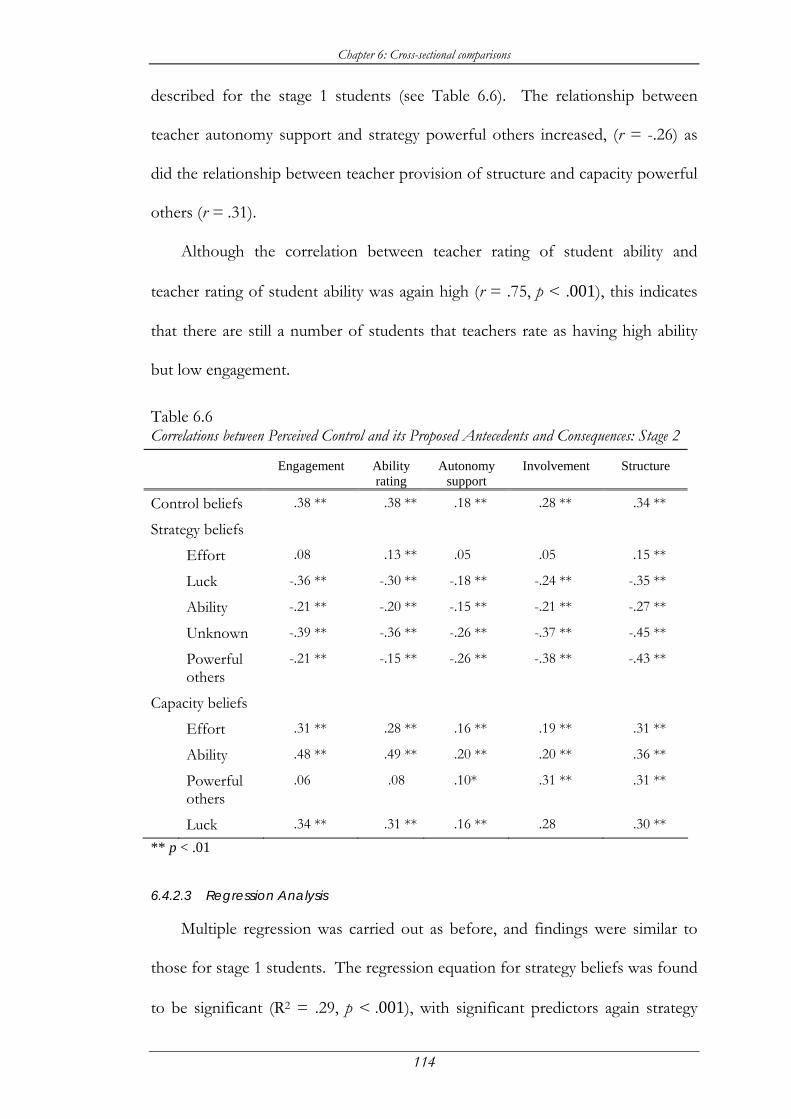
Chapter 6: Cross-sectional comparisons
114
described for the stage 1 students (see Table 6.6). The relationship between
teacher autonomy support and strategy powerful others increased, (r = -.26) as
did the relationship between teacher provision of structure and capacity powerful
others (r = .31).
Although the correlation between teacher rating of student ability and
teacher rating of student ability was again high (r = .75, p < .001), this indicates
that there are still a number of students that teachers rate as having high ability
but low engagement.
Table 6.6 Correlations between Perceived Control and its Proposed Antecedents and Consequences: Stage 2
Engagement Ability rating
Autonomy support
Involvement Structure
Control beliefs .38 ** .38 ** .18 ** .28 ** .34 **
Strategy beliefs
Effort .08 .13 ** .05 .05 .15 **
Luck -.36 ** -.30 ** -.18 ** -.24 ** -.35 **
Ability -.21 ** -.20 ** -.15 ** -.21 ** -.27 **
Unknown -.39 ** -.36 ** -.26 ** -.37 ** -.45 **
Powerful others
-.21 ** -.15 ** -.26 ** -.38 ** -.43 **
Capacity beliefs
Effort .31 ** .28 ** .16 ** .19 ** .31 **
Ability .48 ** .49 ** .20 ** .20 ** .36 **
Powerful others
.06 .08 .10* .31 ** .31 **
Luck .34 ** .31 ** .16 ** .28 .30 **
** p < .01
6.4.2.3 Regression Analysis
Multiple regression was carried out as before, and findings were similar to
those for stage 1 students. The regression equation for strategy beliefs was found
to be significant (R2 = .29, p < .001), with significant predictors again strategy
Chapter 6: Cross-sectional comparisons
115
luck (β = -.23, p < .01), and strategy unknown (β = -.33, p < .001). The
regression equation for capacity beliefs was also found to be significant (R2= .33,
p < .001). On this occasion, significant predictors were found to be capacity
ability (β = .37, p < .001) and capacity luck (β = .21, p < .01).
The regression of pairs of causes onto Teacher-rated engagement produced
similar results to that obtained in the stage 1 analysis. Strategy ability and
capacity ability were both found to be significant predictors of engagement
(strategy ability β = -.21, p < .01; capacity ability β = .49, p < .001). For effort,
capacity was the only significant predictor (β = .38, p < .001), while for powerful
others strategy was the sole predictor (β = -.21, p < .01). Again, for luck, both
strategy and capacity beliefs were strongly significant predictors of engagement
(strategy β = -.33, p < .001, capacity β = .35, p < .001).
6.4.3 Stage 3: Year 7
6.4.3.1 Descriptive Statistics
The descriptive statistics shown in Table 6.7 reflect those for the previous
two stages of the data collection. Capacity beliefs for powerful others decreased,
however students in general still feel confident that they are able to get their
teachers to like and help them in mathematics.
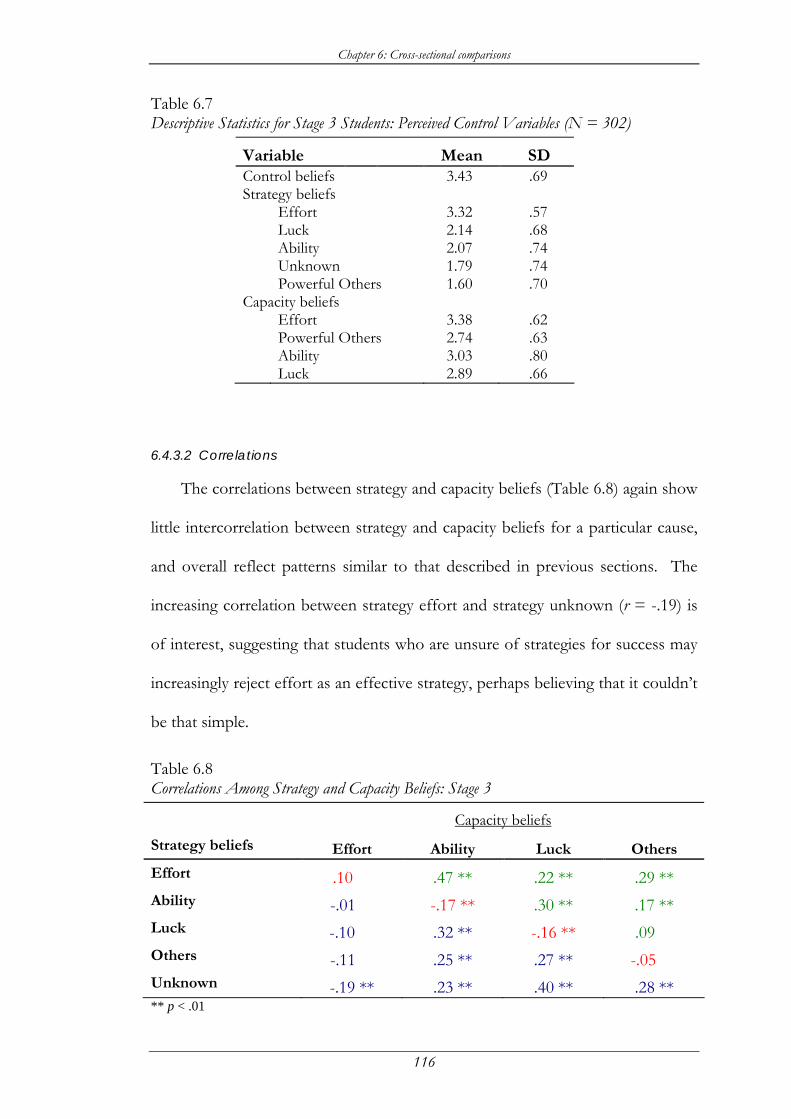
Chapter 6: Cross-sectional comparisons
116
Table 6.7 Descriptive Statistics for Stage 3 Students: Perceived Control Variables (N = 302)
Variable Mean SD Control beliefs 3.43 .69 Strategy beliefs Effort 3.32 .57 Luck 2.14 .68 Ability 2.07 .74 Unknown 1.79 .74 Powerful Others 1.60 .70 Capacity beliefs Effort 3.38 .62 Powerful Others 2.74 .63 Ability 3.03 .80 Luck 2.89 .66
6.4.3.2 Correlations
The correlations between strategy and capacity beliefs (Table 6.8) again show
little intercorrelation between strategy and capacity beliefs for a particular cause,
and overall reflect patterns similar to that described in previous sections. The
increasing correlation between strategy effort and strategy unknown (r = -.19) is
of interest, suggesting that students who are unsure of strategies for success may
increasingly reject effort as an effective strategy, perhaps believing that it couldn’t
be that simple.
Table 6.8 Correlations Among Strategy and Capacity Beliefs: Stage 3
Capacity beliefs Strategy beliefs Effort Ability Luck Others
Effort .10 pp .47 ** .22 ** .29 ** Ability -.01 pp -.17 ** .30 ** .17 ** Luck -.10 p .32 ** -.16 ** .09 pp Others -.11 pp .25 ** .27 ** -.05 pp Unknown -.19 ** .23 ** .40 ** .28 ** ** p < .01
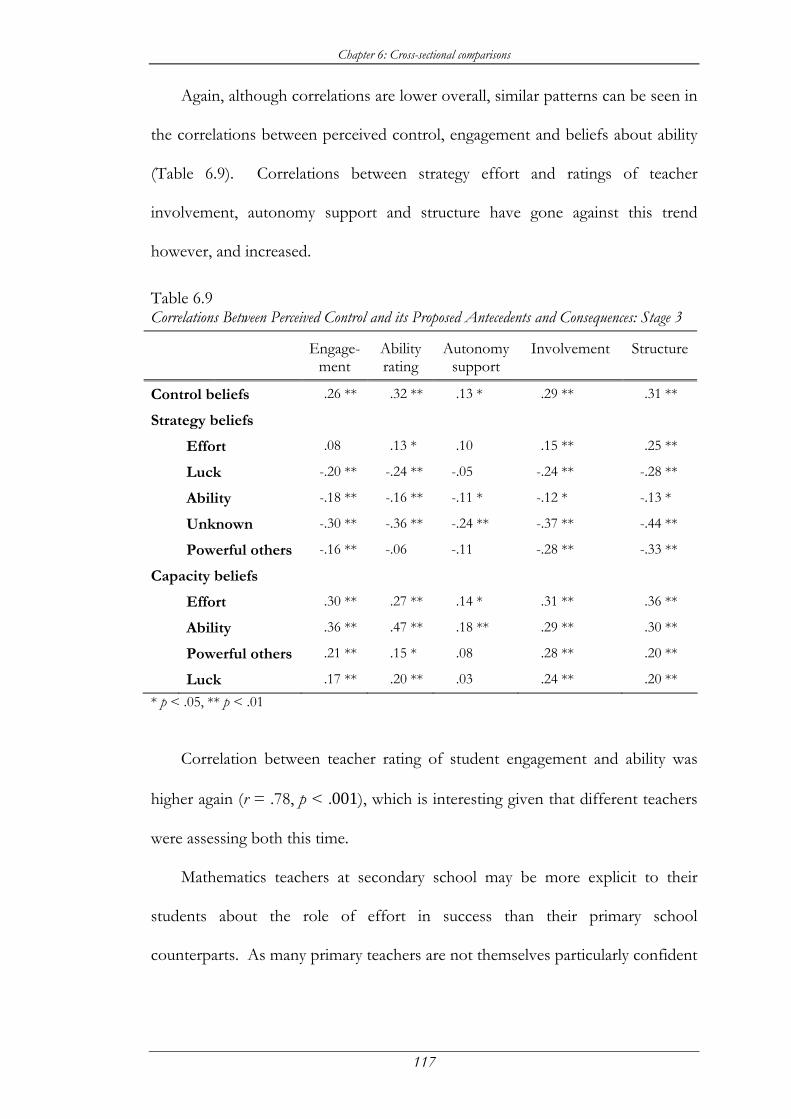
Chapter 6: Cross-sectional comparisons
117
Again, although correlations are lower overall, similar patterns can be seen in
the correlations between perceived control, engagement and beliefs about ability
(Table 6.9). Correlations between strategy effort and ratings of teacher
involvement, autonomy support and structure have gone against this trend
however, and increased.
Table 6.9 Correlations Between Perceived Control and its Proposed Antecedents and Consequences: Stage 3
Engage-ment
Ability rating
Autonomy support
Involvement Structure
Control beliefs .26 ** .32 ** .13 * .29 ** .31 **
Strategy beliefs
Effort .08 .13 * .10 .15 ** .25 **
Luck -.20 ** -.24 ** -.05 -.24 ** -.28 **
Ability -.18 ** -.16 ** -.11 * -.12 * -.13 *
Unknown -.30 ** -.36 ** -.24 ** -.37 ** -.44 **
Powerful others -.16 ** -.06 -.11 -.28 ** -.33 **
Capacity beliefs
Effort .30 ** .27 ** .14 * .31 ** .36 **
Ability .36 ** .47 ** .18 ** .29 ** .30 **
Powerful others .21 ** .15 * .08 .28 ** .20 **
Luck .17 ** .20 ** .03 .24 ** .20 ** * p < .05, ** p < .01
Correlation between teacher rating of student engagement and ability was
higher again (r = .78, p < .001), which is interesting given that different teachers
were assessing both this time.
Mathematics teachers at secondary school may be more explicit to their
students about the role of effort in success than their primary school
counterparts. As many primary teachers are not themselves particularly confident
Chapter 6: Cross-sectional comparisons
118
in mathematics, there may be a greater perception in the primary classroom that
factors other than effort are at play in successful mathematics learning.
6.4.3.3 Regression Analysis
Regression produced similar results to those described for stages 1 and 2 of
the study. The equation obtained when all strategy beliefs were regressed onto
teacher-rated engagement was found to be significant (R2= .11, p < .001)
however in this instance only strategy unknown was found to be a significant
predictor (β = -.23, p < .001). When the set of four capacity beliefs were
regressed onto engagement (R2 = .16, p < .001), significant predictors were
found to be ability (β = .26, p < .001), effort (β = .13, p < .05) and powerful
others (β = .12, p < .05).
Regression examining the effects of pairs of strategy and capacity beliefs for
each cause found that effort was the only cause for which strategy and capacity
beliefs did not both predict engagement. For ability, the regression equation was
significant, with significant predictors strategy beliefs (β = -.12, p < .05), and
capacity beliefs (β = .34, p < .001). Luck was also significant, with both strategy
beliefs (β = -.18, p < .01) and capacity beliefs (β = .15, p < .01) significant
predictors, and similarly powerful others was significant, with strategy beliefs
(β = -.15, p < .01) and capacity beliefs (β = .20, p < .001) significant. For effort
the significant predictor was capacity beliefs alone (β = .29, p < .001).
6.4.3.4 Analysis of variance on extreme groups
In order to explore the possibility of interactions between strategy and
capacity beliefs and teacher-rated engagement, all four known beliefs were

Chapter 6: Cross-sectional comparisons
119
divided into high and low groups, based on the top and bottom quarters of the
distribution of each variable. A 2 (strategy high vs low) × 2 (capacity high vs low)
ANOVA was performed using these groups, with teacher-rated student
engagement as the dependent variable. Skinner et al. (1990) conducted the same
analysis and found each of the four interaction terms to be significant. While no
interaction effects were significant in the present study, the effects of low
capacity beliefs are similar to that of the Skinner study, and these effects can be
seen from the following graphs of the means (Figure 6.1).
Effort
-0.50
0.51
1.52
2.5
low highStrategy beliefs
mea
n
Low
High
Capacity beliefs
Ability
-0.50
0.51
1.52
2.5
low highStrategy beliefs
mea
n
Low
HighCapacity beliefs
Luck
-0.50
0.51
1.52
2.5
low highStrategy beliefs
mea
n
Low
HighCapacity beliefs
Powerful others
-0.50
0.51
1.52
2.5
low highStrategy beliefs
mea
n
LowHigh
Capacity beliefs
Figure 6.1 Teacher-rated student engagement as a function of the interaction between strategy and capacity beliefs, stage 2 sample (N=510)
High strategy beliefs appear to exacerbate low capacity beliefs for effort,
while in effect boosting engagement for those students with high capacity beliefs
for effort. A different pattern of interactions between strategy and capacity
Chapter 6: Cross-sectional comparisons
120
beliefs was apparent for ability, luck and powerful others, where high strategy
beliefs linked to low capacity beliefs resulted in the lowest levels of engagement.
6.5 Summary and Discussion of results
These data show that little change occurs from early Grade 6 through late
Grade 6 and after the transition to secondary school. Students believe
throughout this time that effort is the most important strategy for succeeding in
mathematics, and generally believe that they have the capacity to put in the
required amount of effort. Students in general also felt, although the means for
these were not as high as for effort, that they were smart enough to succeed, that
they were lucky, and that they could get their teacher’s help and attention when
they needed it.
Control beliefs correlated strongly with teacher-rated engagement,
achievement and teacher-rated ability, indicating that students who feel in control
of their learning are those students who are most engaged and who achieve at the
highest level. Strategy effort was uncorrelated with engagement, suggesting that
effort as a strategy is not sufficient in itself to promote engagement, but requires
students to believe that they also have the capacity to work hard. Student
engagement was found to be undermined by beliefs in the nonaction strategies of
powerful others, luck and ability, and most strongly by students’ reports that they
did not know what strategies were effective.
At each stage of the study teacher-rated student engagement was found to be
strongly correlated with its proposed consequence; ability or achievement.
Although achievement was only assessed at one point of this study, strong
Chapter 6: Cross-sectional comparisons
121
correlations were found between teacher ratings of ability and actual
achievement.
These data confirm the findings of Skinner, Wellborn & Connell (1990), and
indicate that in mathematics, as at school in general, particular combinations of
beliefs about how to succeed can have positive or negative effects on student
engagement. The highest levels of engagement were reported in those students
with strong beliefs in effort as a means of succeeding in mathematics and who
perceived that they are capable of exerting the required effort. The lowest levels
of engagement were seen among those students who believed that success and
failure were, in essence, out of their control; for whom luck was the way to
succeed, but that they were unlucky in mathematics.
The cross-sectional data served to confirm that the perceived control model
is useful when adapted to mathematics. Strategy and capacity beliefs, together
with beliefs about control, appear to be relatively independent of each other, and
various combinations predict high or low engagement amongst students. As
suggested in the literature, students can be high on strategy beliefs (“Being smart is
what matters the most for success in maths”) but low on capacity beliefs (“But I’m not
smart”), or high on capacity beliefs (“I can try hard”) but low on strategy beliefs
(“Effort is not at all important”).
One of the strengths of the perceived control model is this ability to “split
apart” attributions; for example an attribution of success to a cause (“I succeeded
because I worked hard”) implies both that the strategy is effective and that the
student is able to access it (“effort is important for success”, and “I can work hard”). In
contrast, an attribution of failure to a particular cause (“I failed because I didn’t work
Chapter 6: Cross-sectional comparisons
122
hard enough”) implies that the strategy is effective but the self has no access to it
(“effort is important for success”, but “I just can’t seem to work hard enough”). Skinner
(1995) argued that these distinctions are essential when interpreting beliefs about
the self, particularly when contrasting beliefs about causes such as effort and
ability, for example “I didn’t try very hard” versus “I’m dumb at maths”.
Although the patterns of beliefs appear to be quite stable from early Grade 6
through to mid year 7, comparison needs to be made longitudinally among
cohorts, that is between students common to stages 1 and 2, and between
students common to stages 2 and 3. The next chapter deals with the analysis of
these data.
123
Chapter 7
Longitudinal comparisons
7.1 Introduction
While the previous chapter dealt with the analysis of the cross-sectional data,
it was also important to look at longitudinal changes in each cohort of students.
The research questions to be addressed in this chapter are:
• Do the relationships between the perceived control variables and
engagement remain the same after transition to secondary school?
• Are these changes the same for male and female students?
• Are there changes in views about mathematics, the antecedents or
consequences of perceived control, self-concept, autonomy or coping over
the primary secondary transition?
7.2 Comparing stages: Looking longitudinally
The data sets gathered at each of the three stages of the study were
subsequently adjusted to create three longitudinal sets, which were analysed using
more powerful statistical techniques to attempt a more fine-grained examination.
The most powerful data are the larger sets of 154 students who participated in
both stage one and two of the data collection, and the 302 students who
participated in both stage two and three of the data collection. These data sets
were analysed separately, while the data from the 74 students who participated in
Chapter 7: Longitudinal comparisons
124
all three stages of the data collection will be shown graphically where appropriate
to illustrate the longitudinal aspects of the study.
7.3 Statistical methods
In the analysis of longitudinal effects, the repeated measures design of the
study acts to eliminate some systematic bias attributable to subjects in one group
being different from subjects in other groups, and yet brings with it other
problems, particularly higher correlations between measures than would be
obtained with a randomised design. The statistical considerations necessary to
minimise Type I error, and yet retain power, are discussed in the next section.
7.2.1 Use of repeated m easures
Repeated measures analysis of variance (ANOVA) was used to examine the
longitudinal data. The use of repeated measures in statistical analysis presents
particular problems, notably heterogeneity of the variances of differences among
pairs of levels of the repeated measure. Levine (1991) recommended that the
Mauchly test of sphericity be employed to determine whether the heterogeneity
assumptions are violated, however he warned that “unfortunately, problems,
primarily regarding the test’s oversensitivity, reduce its practical value” (p. 27). In
a case where Mauchly’s test is significant, the multivariate tests should be used in
preference to the univariate, however Levine argued that it is possible the
multivariate test could have a negative bias, leading to reduced power. If the
univariate test was found to be significant and the assumptions of heterogeneity
violated, but the multivariate test non-significant, Levine’s recommendation was
Chapter 7: Longitudinal comparisons
125
“the use of a correction in the degrees of freedom, permitting a choice of a larger
critical F-value, which, if properly selected, avoids the bias problem” (p. 28).
This procedure involves the use of a correction factor, epsilon, which when
multiplied by both the numerator and denominator degrees of freedom of the F-
ratio, identifies the bias free F distribution. These corrected degrees of freedom
can then be used to obtain a correct critical F-value against which the empirical
F-value can be tested. The value of epsilon serves both as a correction factor and
a measure of the extent to which the heterogeneity assumptions were violated.
Its value can vary between 1, indicating no violation of assumptions, to 1/(k-1),
where k is the number of levels of the repeated measures factor, indicating
maximum violation of assumptions. In the case of this study, with a maximum
of three levels of repeated measure factors, the lower bound for epsilon was 0.5.
The two correction factors produced by SPSSWIN in the repeated measures print
out are the Greenhouse-Geisser epsilon and the Huynh-Feldt epsilon.
In the analysis discussed here, if the univariate test was found to be
significant but the heterogeneity assumptions were violated, then the multivariate
tests were examined. Low power and a non-significant result in the multivariate
test would imply that the multivariate test might be negatively biased, and so the
procedure in this case would be to use the Huynh-Feldt epsilon to calculate new
degrees of freedom and thus re-examine the calculated F-value against a revised
critical F-value.
7.2.2 Contrasts and trend analysis
Two types of contrasts were examined for variables where significant
differences were found, using the smaller data set of 74 students for whom three
Chapter 7: Longitudinal comparisons
126
data points were available. The first contrast compared each level of the factor
except the first, to the previous level. This contrast is analogous to post-hoc
testing in simple ANOVA. The second type of contrast (trend analysis)
employed used the polynomial subcommand in SPSSWIN in order to examine the
data for linear and quadratic effects across levels of the factor.
7.4 Perceived control measures
Tables 7.1 and 7.2 show the descriptive statistics for all perceived control beliefs
for the students involved in both stages 1 and 2 and in both stages 2 and 3
respectively. It can be seen that there are few significant differences from early
to late Grade 6, or from late Grade 6 to mid Year 7. Effort was seen as the most
important strategy for achieving success and avoiding failure in mathematics, and
capacity beliefs for this variable were the highest. However there was a
significant decrease in capacity effort between late Grade 6 and Year 7, and post-
hoc analysis of the data revealed that this was a linear decreasing trend
(F1,73 = .54, p < .05). This suggests a perception by some students that no
matter how hard they work, it may not be enough to do well in mathematics at
secondary school.
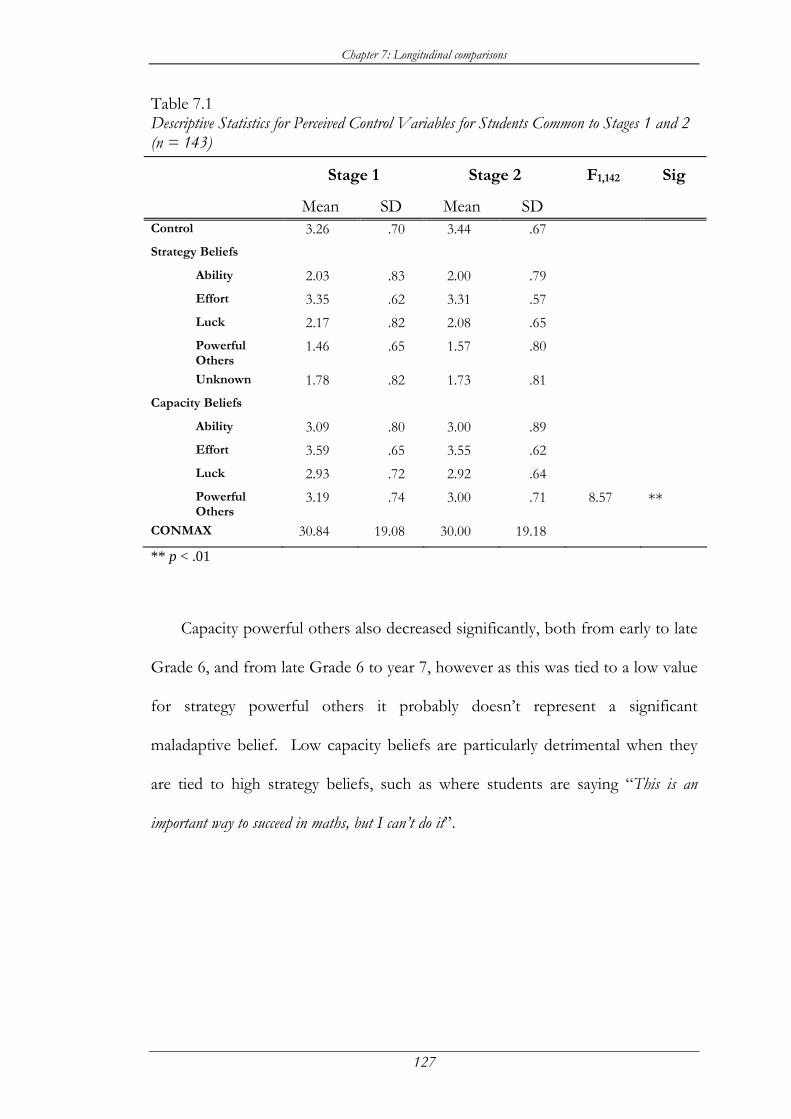
Chapter 7: Longitudinal comparisons
127
Table 7.1 Descriptive Statistics for Perceived Control Variables for Students Common to Stages 1 and 2 (n = 143)
Stage 1 Stage 2 F1,142 Sig Mean SD Mean SD
Control 3.26 .70 3.44 .67 Strategy Beliefs Ability 2.03 .83 2.00 .79 Effort 3.35 .62 3.31 .57 Luck 2.17 .82 2.08 .65 Powerful
Others 1.46 .65 1.57 .80
Unknown 1.78 .82 1.73 .81 Capacity Beliefs Ability 3.09 .80 3.00 .89 Effort 3.59 .65 3.55 .62 Luck 2.93 .72 2.92 .64 Powerful
Others 3.19 .74 3.00 .71 8.57 **
CONMAX 30.84 19.08 30.00 19.18 ** p < .01
Capacity powerful others also decreased significantly, both from early to late
Grade 6, and from late Grade 6 to year 7, however as this was tied to a low value
for strategy powerful others it probably doesn’t represent a significant
maladaptive belief. Low capacity beliefs are particularly detrimental when they
are tied to high strategy beliefs, such as where students are saying “This is an
important way to succeed in maths, but I can’t do it”.
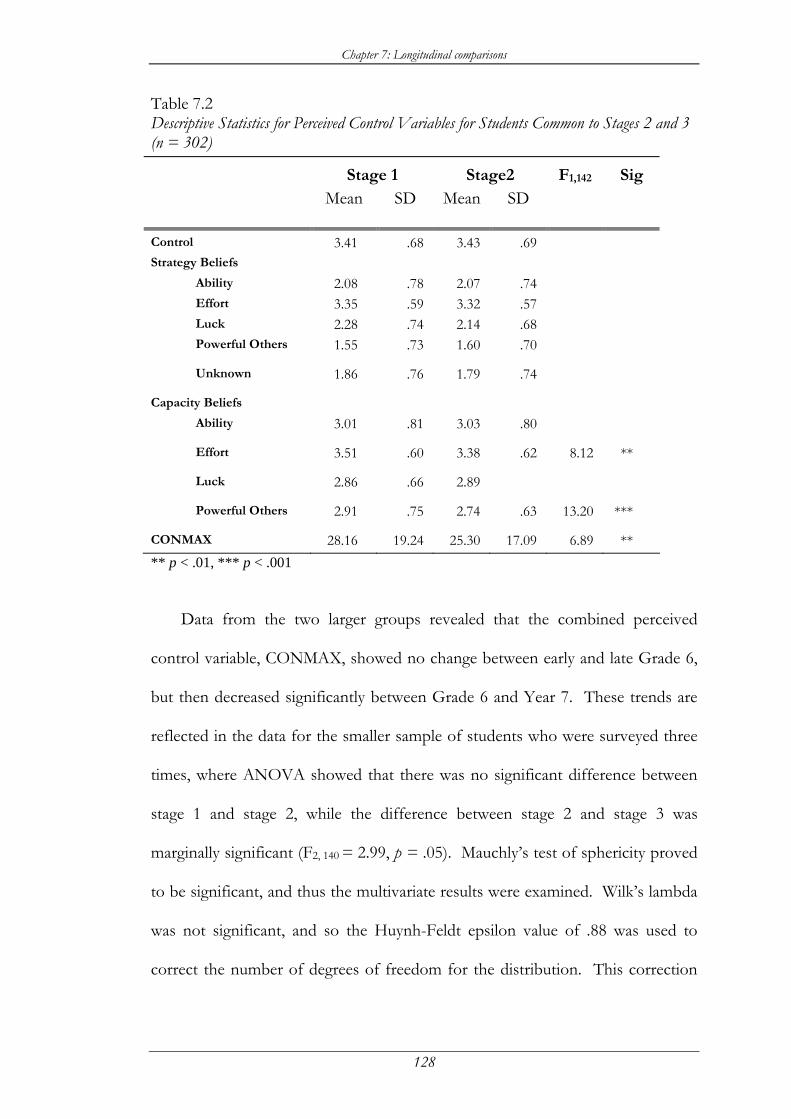
Chapter 7: Longitudinal comparisons
128
Table 7.2 Descriptive Statistics for Perceived Control Variables for Students Common to Stages 2 and 3 (n = 302)
Stage 1 Stage2 F1,142 Sig Mean SD Mean SD
Control 3.41 .68 3.43 .69 Strategy Beliefs Ability 2.08 .78 2.07 .74 Effort 3.35 .59 3.32 .57 Luck 2.28 .74 2.14 .68
Powerful Others 1.55 .73 1.60 .70
Unknown 1.86 .76 1.79 .74
Capacity Beliefs Ability 3.01 .81 3.03 .80
Effort 3.51 .60 3.38 .62 8.12 **
Luck 2.86 .66 2.89
Powerful Others 2.91 .75 2.74 .63 13.20 ***
CONMAX 28.16 19.24 25.30 17.09 6.89 ** ** p < .01, *** p < .001
Data from the two larger groups revealed that the combined perceived
control variable, CONMAX, showed no change between early and late Grade 6,
but then decreased significantly between Grade 6 and Year 7. These trends are
reflected in the data for the smaller sample of students who were surveyed three
times, where ANOVA showed that there was no significant difference between
stage 1 and stage 2, while the difference between stage 2 and stage 3 was
marginally significant (F2, 140 = 2.99, p = .05). Mauchly’s test of sphericity proved
to be significant, and thus the multivariate results were examined. Wilk’s lambda
was not significant, and so the Huynh-Feldt epsilon value of .88 was used to
correct the number of degrees of freedom for the distribution. This correction
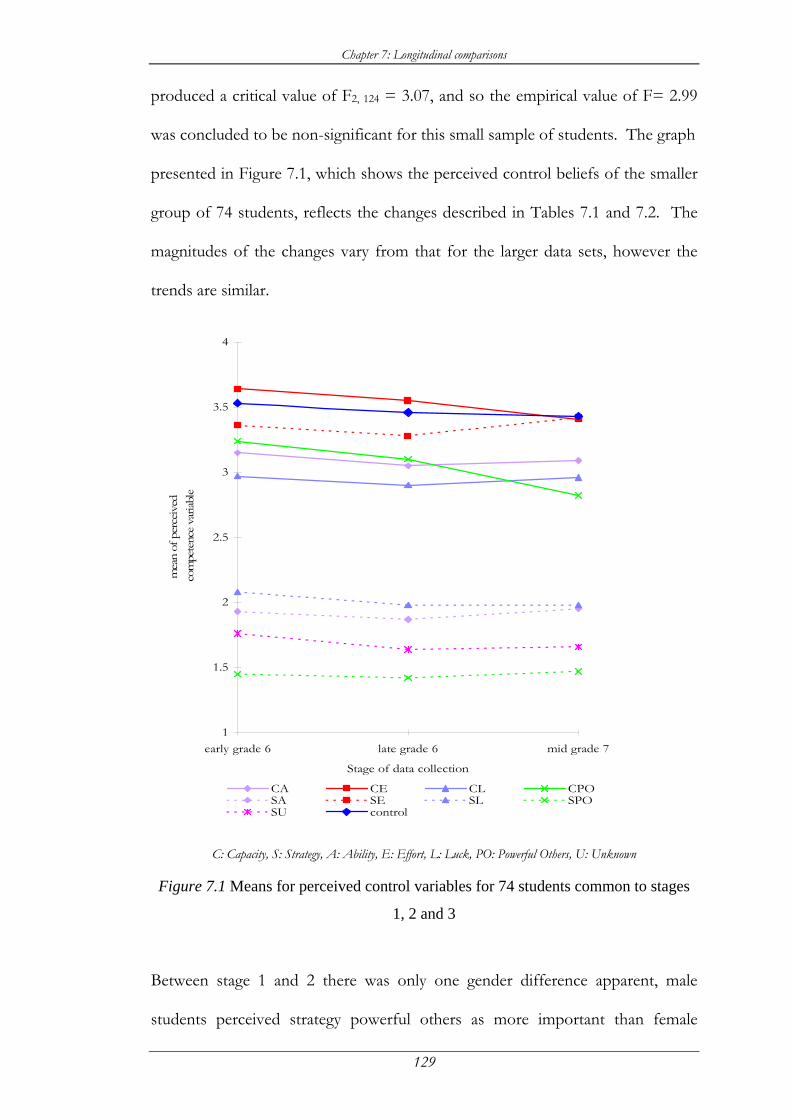
Chapter 7: Longitudinal comparisons
129
produced a critical value of F2, 124 = 3.07, and so the empirical value of F= 2.99
was concluded to be non-significant for this small sample of students. The graph
presented in Figure 7.1, which shows the perceived control beliefs of the smaller
group of 74 students, reflects the changes described in Tables 7.1 and 7.2. The
magnitudes of the changes vary from that for the larger data sets, however the
trends are similar.
1
1.5
2
2.5
3
3.5
4
early grade 6 late grade 6 mid grade 7
Stage of data collection
mea
n of
per
ceiv
ed c
ompe
tenc
e va
riabl
e
CA CE CL CPOSA SE SL SPOSU control
C: Capacity, S: Strategy, A: Ability, E: Effort, L: Luck, PO: Powerful Others, U: Unknown
Figure 7.1 Means for perceived control variables for 74 students common to stages
1, 2 and 3
Between stage 1 and 2 there was only one gender difference apparent, male
students perceived strategy powerful others as more important than female
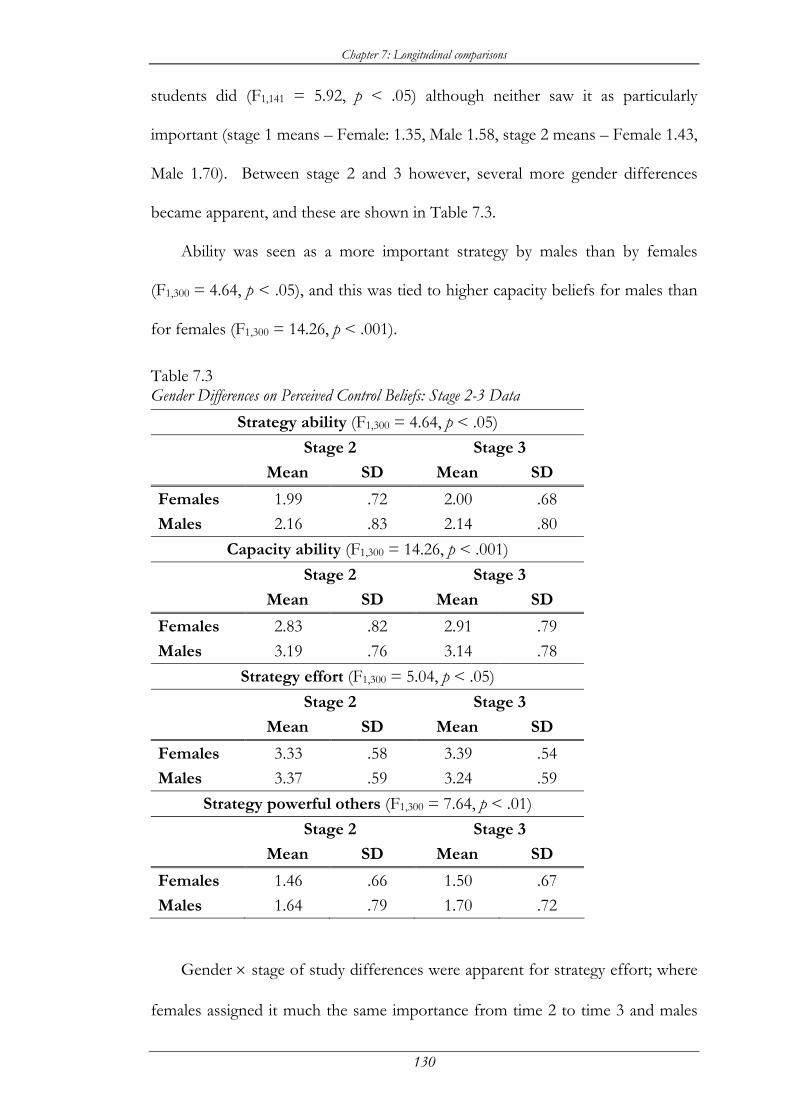
Chapter 7: Longitudinal comparisons
130
students did (F1,141 = 5.92, p < .05) although neither saw it as particularly
important (stage 1 means – Female: 1.35, Male 1.58, stage 2 means – Female 1.43,
Male 1.70). Between stage 2 and 3 however, several more gender differences
became apparent, and these are shown in Table 7.3.
Ability was seen as a more important strategy by males than by females
(F1,300 = 4.64, p < .05), and this was tied to higher capacity beliefs for males than
for females (F1,300 = 14.26, p < .001).
Table 7.3 Gender Differences on Perceived Control Beliefs: Stage 2-3 Data
Strategy ability (F1,300 = 4.64, p < .05) Stage 2 Stage 3
Mean SD Mean SD
Females 1.99 .72 2.00 .68 Males 2.16 .83 2.14 .80
Capacity ability (F1,300 = 14.26, p < .001) Stage 2 Stage 3
Mean SD Mean SD
Females 2.83 .82 2.91 .79 Males 3.19 .76 3.14 .78
Strategy effort (F1,300 = 5.04, p < .05) Stage 2 Stage 3
Mean SD Mean SD
Females 3.33 .58 3.39 .54 Males 3.37 .59 3.24 .59
Strategy powerful others (F1,300 = 7.64, p < .01) Stage 2 Stage 3
Mean SD Mean SD
Females 1.46 .66 1.50 .67 Males 1.64 .79 1.70 .72
Gender × stage of study differences were apparent for strategy effort; where
females assigned it much the same importance from time 2 to time 3 and males
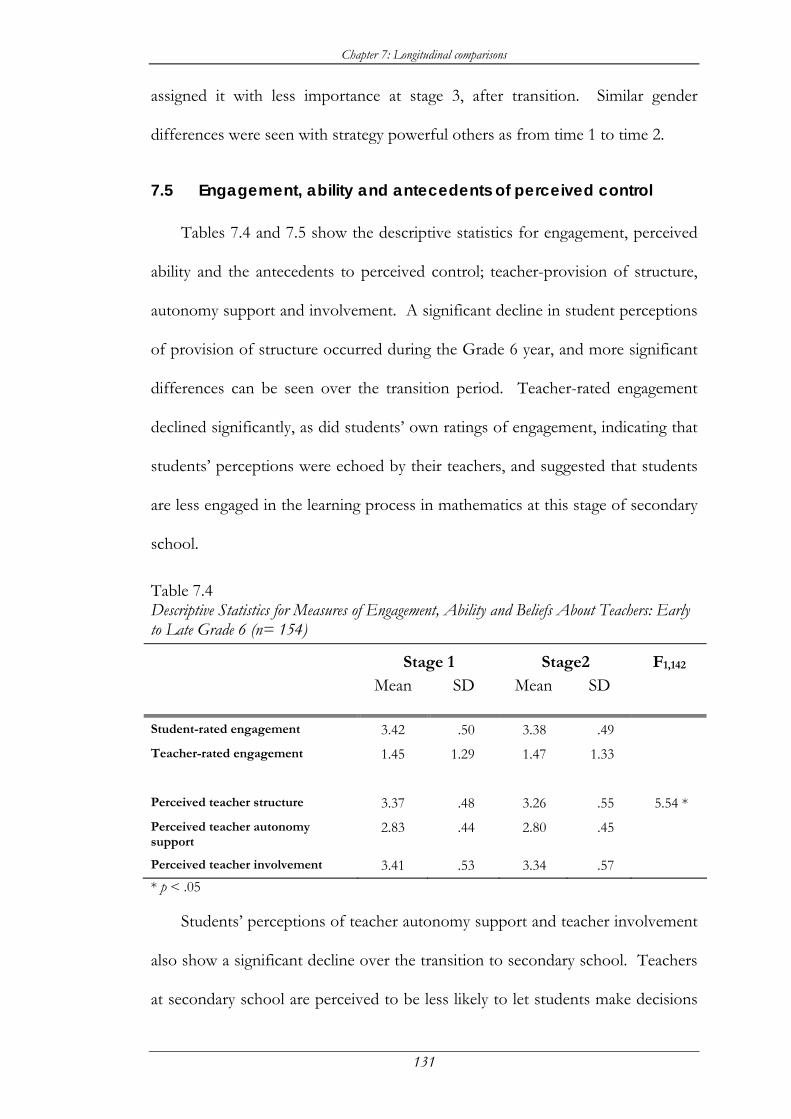
Chapter 7: Longitudinal comparisons
131
assigned it with less importance at stage 3, after transition. Similar gender
differences were seen with strategy powerful others as from time 1 to time 2.
7.5 Engagement, ability and antecedents of perceived control
Tables 7.4 and 7.5 show the descriptive statistics for engagement, perceived
ability and the antecedents to perceived control; teacher-provision of structure,
autonomy support and involvement. A significant decline in student perceptions
of provision of structure occurred during the Grade 6 year, and more significant
differences can be seen over the transition period. Teacher-rated engagement
declined significantly, as did students’ own ratings of engagement, indicating that
students’ perceptions were echoed by their teachers, and suggested that students
are less engaged in the learning process in mathematics at this stage of secondary
school.
Table 7.4 Descriptive Statistics for Measures of Engagement, Ability and Beliefs About Teachers: Early to Late Grade 6 (n= 154)
Stage 1 Stage2 F1,142 Mean SD Mean SD
Student-rated engagement 3.42 .50 3.38 .49 Teacher-rated engagement 1.45 1.29 1.47 1.33 Perceived teacher structure 3.37 .48 3.26 .55 5.54 * Perceived teacher autonomy support
2.83 .44 2.80 .45
Perceived teacher involvement 3.41 .53 3.34 .57 * p < .05
Students’ perceptions of teacher autonomy support and teacher involvement
also show a significant decline over the transition to secondary school. Teachers
at secondary school are perceived to be less likely to let students make decisions
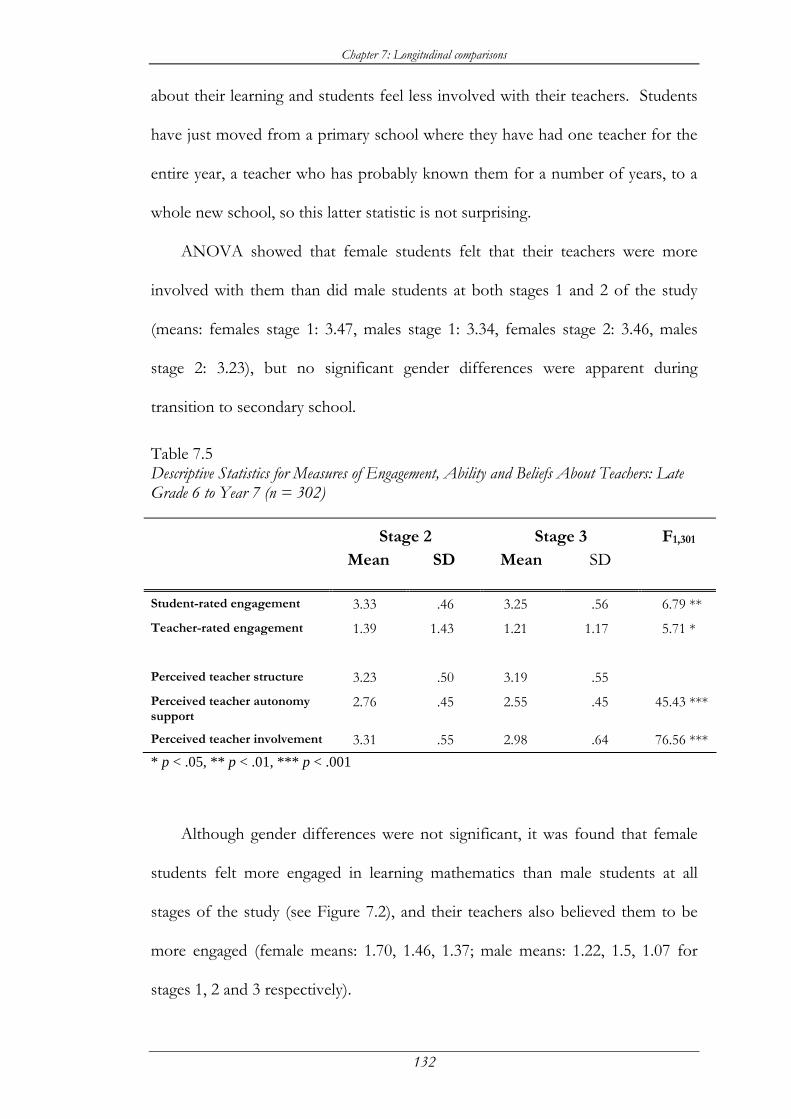
Chapter 7: Longitudinal comparisons
132
about their learning and students feel less involved with their teachers. Students
have just moved from a primary school where they have had one teacher for the
entire year, a teacher who has probably known them for a number of years, to a
whole new school, so this latter statistic is not surprising.
ANOVA showed that female students felt that their teachers were more
involved with them than did male students at both stages 1 and 2 of the study
(means: females stage 1: 3.47, males stage 1: 3.34, females stage 2: 3.46, males
stage 2: 3.23), but no significant gender differences were apparent during
transition to secondary school.
Table 7.5 Descriptive Statistics for Measures of Engagement, Ability and Beliefs About Teachers: Late Grade 6 to Year 7 (n = 302)
Stage 2 Stage 3 F1,301 Mean SD Mean SD
Student-rated engagement 3.33 .46 3.25 .56 6.79 ** Teacher-rated engagement 1.39 1.43 1.21 1.17 5.71 * Perceived teacher structure 3.23 .50 3.19 .55 Perceived teacher autonomy support
2.76 .45 2.55 .45 45.43 ***
Perceived teacher involvement 3.31 .55 2.98 .64 76.56 **** p < .05, ** p < .01, *** p < .001
Although gender differences were not significant, it was found that female
students felt more engaged in learning mathematics than male students at all
stages of the study (see Figure 7.2), and their teachers also believed them to be
more engaged (female means: 1.70, 1.46, 1.37; male means: 1.22, 1.5, 1.07 for
stages 1, 2 and 3 respectively).
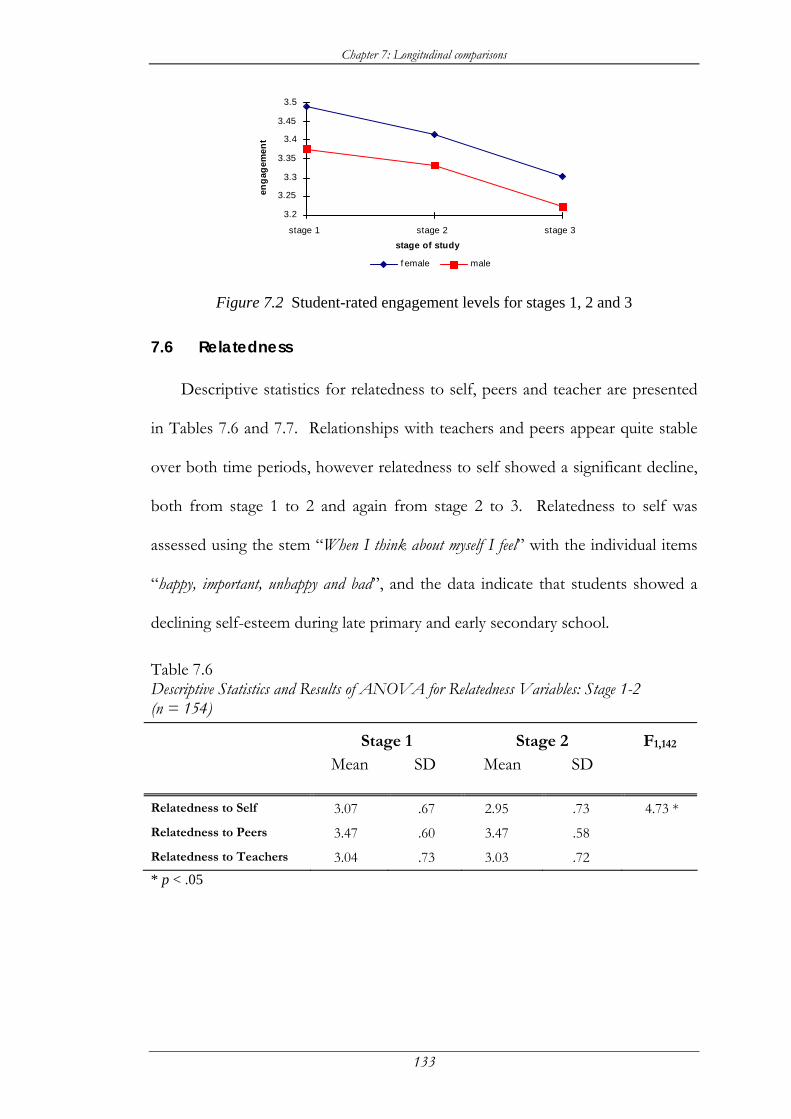
Chapter 7: Longitudinal comparisons
133
3.2
3.25
3.3
3.35
3.4
3.45
3.5
stage 1 stage 2 stage 3
stage of study
enga
gem
ent
f emale male
Figure 7.2 Student-rated engagement levels for stages 1, 2 and 3
7.6 Relatedness
Descriptive statistics for relatedness to self, peers and teacher are presented
in Tables 7.6 and 7.7. Relationships with teachers and peers appear quite stable
over both time periods, however relatedness to self showed a significant decline,
both from stage 1 to 2 and again from stage 2 to 3. Relatedness to self was
assessed using the stem “When I think about myself I feel” with the individual items
“happy, important, unhappy and bad”, and the data indicate that students showed a
declining self-esteem during late primary and early secondary school.
Table 7.6 Descriptive Statistics and Results of ANOVA for Relatedness Variables: Stage 1-2 (n = 154)
Stage 1 Stage 2 F1,142 Mean SD Mean SD
Relatedness to Self 3.07 .67 2.95 .73 4.73 * Relatedness to Peers 3.47 .60 3.47 .58 Relatedness to Teachers 3.04 .73 3.03 .72 * p < .05
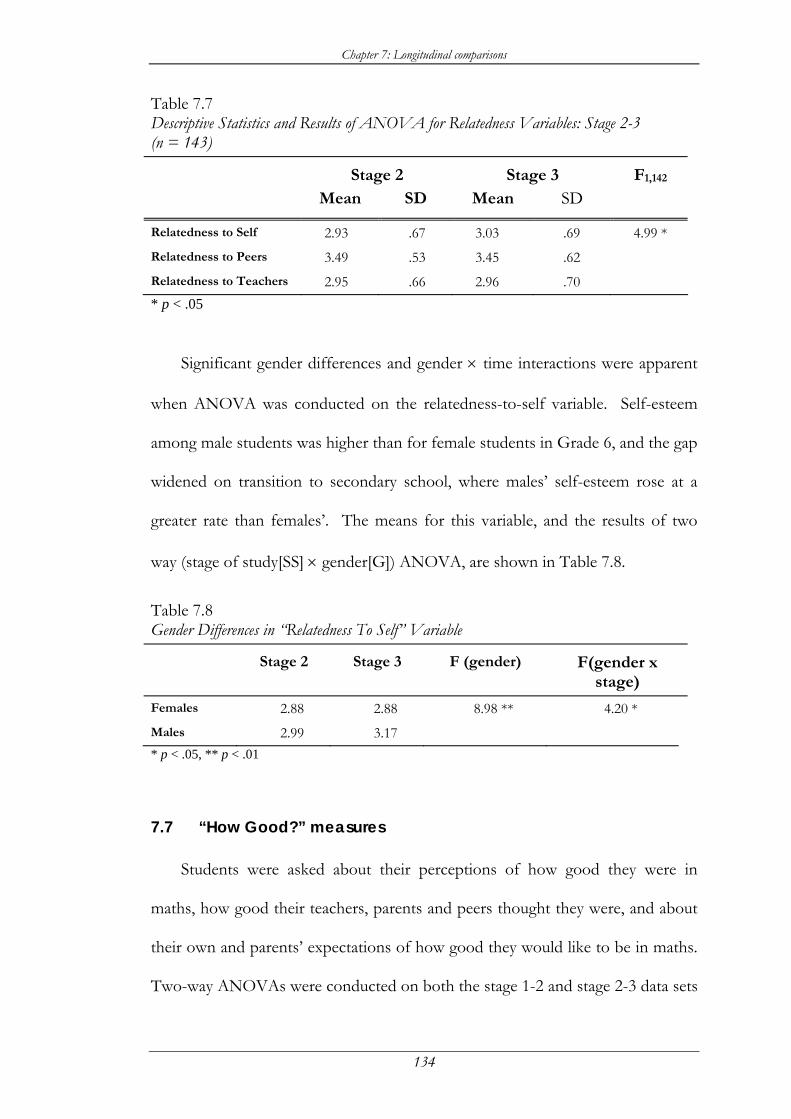
Chapter 7: Longitudinal comparisons
134
Table 7.7 Descriptive Statistics and Results of ANOVA for Relatedness Variables: Stage 2-3 (n = 143)
Stage 2 Stage 3 F1,142 Mean SD Mean SD
Relatedness to Self 2.93 .67 3.03 .69 4.99 * Relatedness to Peers 3.49 .53 3.45 .62 Relatedness to Teachers 2.95 .66 2.96 .70 * p < .05
Significant gender differences and gender × time interactions were apparent
when ANOVA was conducted on the relatedness-to-self variable. Self-esteem
among male students was higher than for female students in Grade 6, and the gap
widened on transition to secondary school, where males’ self-esteem rose at a
greater rate than females’. The means for this variable, and the results of two
way (stage of study[SS] × gender[G]) ANOVA, are shown in Table 7.8.
Table 7.8 Gender Differences in “Relatedness To Self” Variable Stage 2 Stage 3 F (gender) F(gender x
stage)
Females 2.88 2.88 8.98 ** 4.20 * Males 2.99 3.17 * p < .05, ** p < .01
7.7 “How Good?” measures
Students were asked about their perceptions of how good they were in
maths, how good their teachers, parents and peers thought they were, and about
their own and parents’ expectations of how good they would like to be in maths.
Two-way ANOVAs were conducted on both the stage 1-2 and stage 2-3 data sets
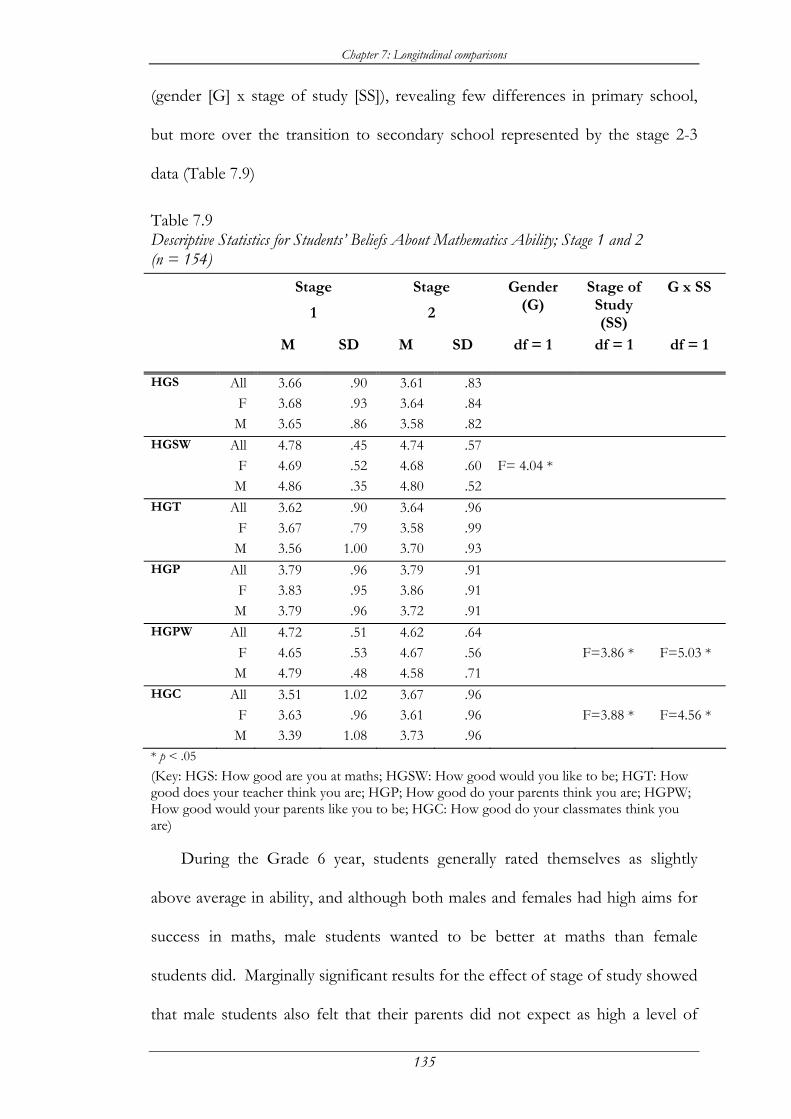
Chapter 7: Longitudinal comparisons
135
(gender [G] x stage of study [SS]), revealing few differences in primary school,
but more over the transition to secondary school represented by the stage 2-3
data (Table 7.9)
Table 7.9 Descriptive Statistics for Students’ Beliefs About Mathematics Ability; Stage 1 and 2 (n = 154)
Stage
1
Stage
2
Gender (G)
Stage of Study (SS)
G x SS
M SD M SD df = 1 df = 1 df = 1
HGS All 3.66 .90 3.61 .83 F 3.68 .93 3.64 .84 M 3.65 .86 3.58 .82 HGSW All 4.78 .45 4.74 .57 F 4.69 .52 4.68 .60 F= 4.04 * M 4.86 .35 4.80 .52 HGT All 3.62 .90 3.64 .96 F 3.67 .79 3.58 .99 M 3.56 1.00 3.70 .93 HGP All 3.79 .96 3.79 .91 F 3.83 .95 3.86 .91 M 3.79 .96 3.72 .91 HGPW All 4.72 .51 4.62 .64 F 4.65 .53 4.67 .56 F=3.86 * F=5.03 * M 4.79 .48 4.58 .71 HGC All 3.51 1.02 3.67 .96
F 3.63 .96 3.61 .96 F=3.88 * F=4.56 * M 3.39 1.08 3.73 .96
* p < .05 (Key: HGS: How good are you at maths; HGSW: How good would you like to be; HGT: How good does your teacher think you are; HGP; How good do your parents think you are; HGPW; How good would your parents like you to be; HGC: How good do your classmates think you are) During the Grade 6 year, students generally rated themselves as slightly
above average in ability, and although both males and females had high aims for
success in maths, male students wanted to be better at maths than female
students did. Marginally significant results for the effect of stage of study showed
that male students also felt that their parents did not expect as high a level of
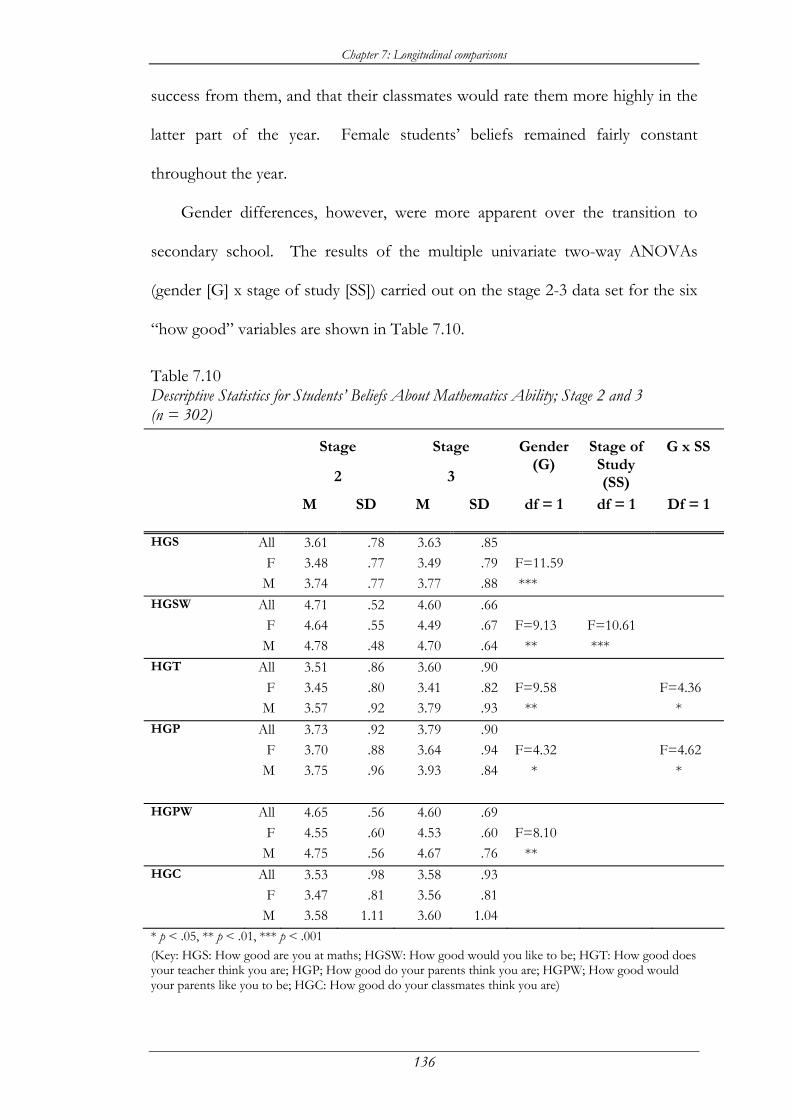
Chapter 7: Longitudinal comparisons
136
success from them, and that their classmates would rate them more highly in the
latter part of the year. Female students’ beliefs remained fairly constant
throughout the year.
Gender differences, however, were more apparent over the transition to
secondary school. The results of the multiple univariate two-way ANOVAs
(gender [G] x stage of study [SS]) carried out on the stage 2-3 data set for the six
“how good” variables are shown in Table 7.10.
Table 7.10 Descriptive Statistics for Students’ Beliefs About Mathematics Ability; Stage 2 and 3 (n = 302)
Stage
2
Stage
3
Gender (G)
Stage of Study (SS)
G x SS
M SD M SD df = 1 df = 1 Df = 1
HGS All 3.61 .78 3.63 .85 F 3.48 .77 3.49 .79 F=11.59 M 3.74 .77 3.77 .88 *** HGSW All 4.71 .52 4.60 .66 F 4.64 .55 4.49 .67 F=9.13 F=10.61 M 4.78 .48 4.70 .64 ** *** HGT All 3.51 .86 3.60 .90 F 3.45 .80 3.41 .82 F=9.58 F=4.36 M 3.57 .92 3.79 .93 ** * HGP All 3.73 .92 3.79 .90 F 3.70 .88 3.64 .94 F=4.32 F=4.62 M 3.75 .96 3.93 .84 *
*
HGPW All 4.65 .56 4.60 .69 F 4.55 .60 4.53 .60 F=8.10 M 4.75 .56 4.67 .76 ** HGC All 3.53 .98 3.58 .93 F 3.47 .81 3.56 .81 M 3.58 1.11 3.60 1.04 * p < .05, ** p < .01, *** p < .001 (Key: HGS: How good are you at maths; HGSW: How good would you like to be; HGT: How good does your teacher think you are; HGP; How good do your parents think you are; HGPW; How good would your parents like you to be; HGC: How good do your classmates think you are)
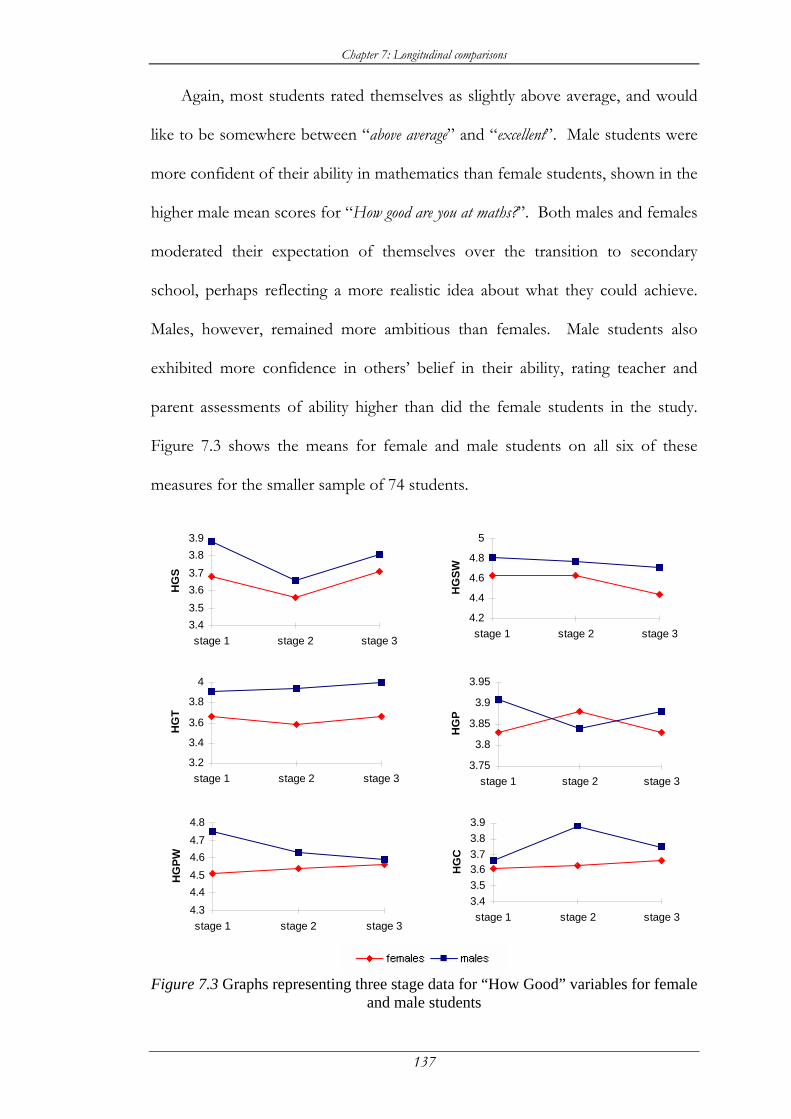
Chapter 7: Longitudinal comparisons
137
Again, most students rated themselves as slightly above average, and would
like to be somewhere between “above average” and “excellent”. Male students were
more confident of their ability in mathematics than female students, shown in the
higher male mean scores for “How good are you at maths?”. Both males and females
moderated their expectation of themselves over the transition to secondary
school, perhaps reflecting a more realistic idea about what they could achieve.
Males, however, remained more ambitious than females. Male students also
exhibited more confidence in others’ belief in their ability, rating teacher and
parent assessments of ability higher than did the female students in the study.
Figure 7.3 shows the means for female and male students on all six of these
measures for the smaller sample of 74 students.
3.43.53.63.73.83.9
stage 1 stage 2 stage 3
HG
S
4.2
4.4
4.6
4.8
5
stage 1 stage 2 stage 3
HG
SW
3.2
3.4
3.6
3.8
4
stage 1 stage 2 stage 3
HG
T
3.75
3.8
3.85
3.9
3.95
stage 1 stage 2 stage 3
HG
P
4.34.44.54.64.74.8
stage 1 stage 2 stage 3
HG
PW
3.43.53.63.73.83.9
stage 1 stage 2 stage 3
HG
C
Figure 7.3 Graphs representing three stage data for “How Good” variables for female
and male students
Chapter 7: Longitudinal comparisons
138
7.8 Autonomy
Autonomy beliefs reflect the extent to which students feel that they are involved
in behaviours or activities that they want to be involved in. For students to
maintain high motivation in mathematics, it is essential that they feel that this
motivation comes from within themselves. Students in this study were asked to
rate nine alternative answers to the question “Why do I work in maths?”. Reasons
given for working range from external, “Because the teacher says we have to”;
introjected, “Because I’ll feel guilty if I don’t”; identified “Because I think it’s
important”; and intrinsic “Because its fun”.
Tables 7.11 and 7.12 show the descriptive statistics for autonomy beliefs for
the stage 1-2 cohort and the stage 2-3 cohort respectively. At both stages in
Grade 6, students are most likely to work for identified reasons, however a
number are involved in their studies enough to say that they work because it’s
fun. External reasons are not seen as particularly significant reasons: students do
not appear to feel pressured to work in mathematics. After the transition to
secondary school however, students in this sample were significantly more likely
to work in mathematics because of external pressures, and significantly less likely
to be intrinsically motivated. External motivation appears to be an increasingly
important factor in student motivation, precisely the opposite to what teachers
would hope to be happening with students of this age.
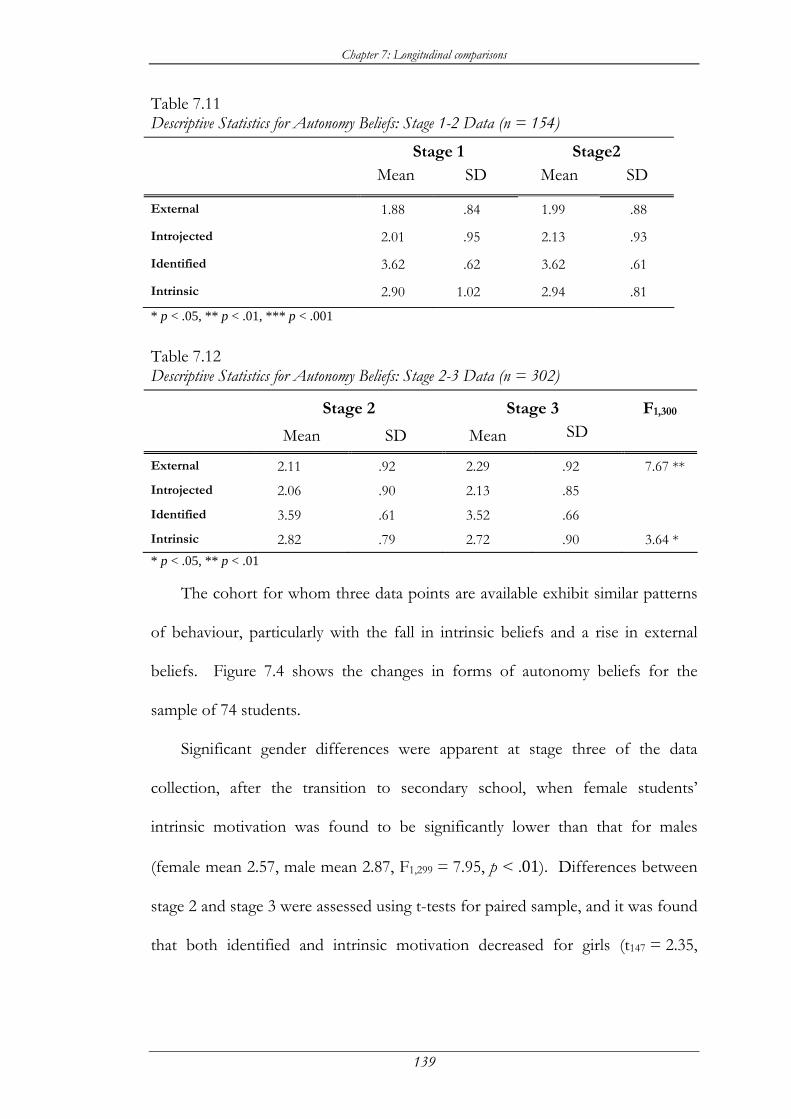
Chapter 7: Longitudinal comparisons
139
Table 7.11 Descriptive Statistics for Autonomy Beliefs: Stage 1-2 Data (n = 154)
Stage 1 Stage2 Mean SD Mean SD
External 1.88 .84 1.99 .88 Introjected 2.01 .95 2.13 .93 Identified 3.62 .62 3.62 .61 Intrinsic 2.90 1.02 2.94 .81 * p < .05, ** p < .01, *** p < .001
Table 7.12 Descriptive Statistics for Autonomy Beliefs: Stage 2-3 Data (n = 302)
Stage 2 Stage 3 F1,300 Mean SD Mean SD
External 2.11 .92 2.29 .92 7.67 ** Introjected 2.06 .90 2.13 .85 Identified 3.59 .61 3.52 .66 Intrinsic 2.82 .79 2.72 .90 3.64 * * p < .05, ** p < .01 The cohort for whom three data points are available exhibit similar patterns
of behaviour, particularly with the fall in intrinsic beliefs and a rise in external
beliefs. Figure 7.4 shows the changes in forms of autonomy beliefs for the
sample of 74 students.
Significant gender differences were apparent at stage three of the data
collection, after the transition to secondary school, when female students’
intrinsic motivation was found to be significantly lower than that for males
(female mean 2.57, male mean 2.87, F1,299 = 7.95, p < .01). Differences between
stage 2 and stage 3 were assessed using t-tests for paired sample, and it was found
that both identified and intrinsic motivation decreased for girls (t147 = 2.35,
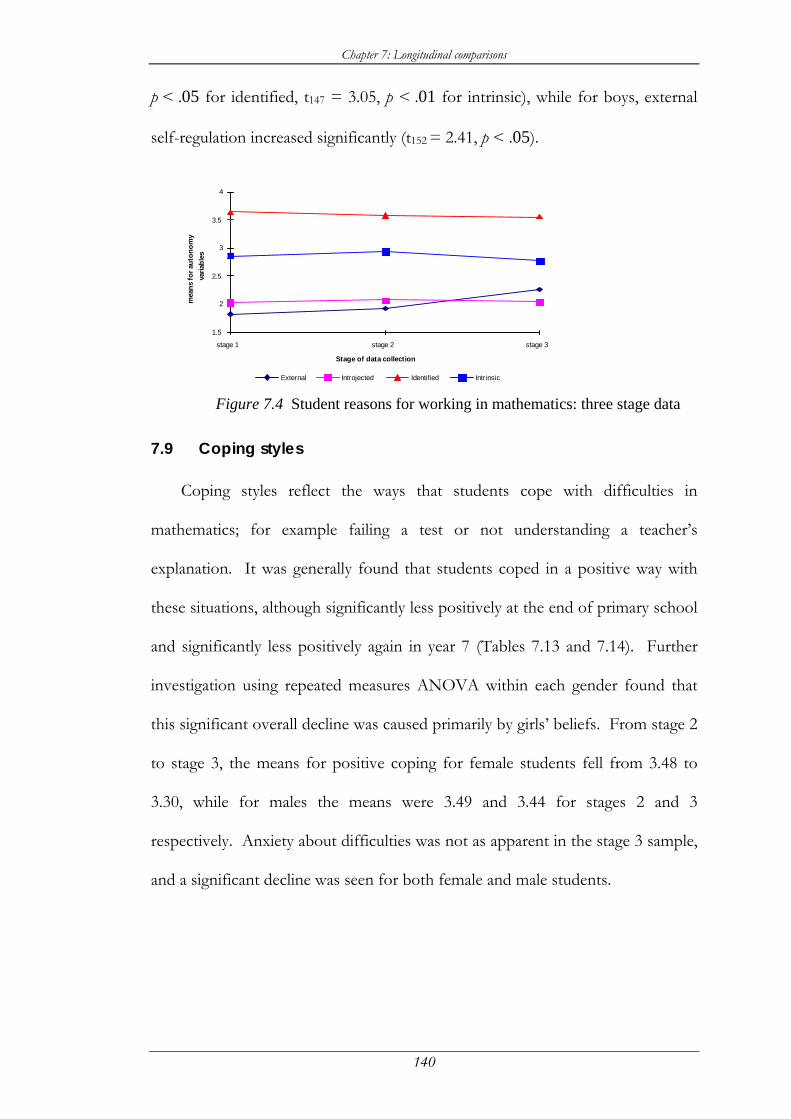
Chapter 7: Longitudinal comparisons
140
p < .05 for identified, t147 = 3.05, p < .01 for intrinsic), while for boys, external
self-regulation increased significantly (t152 = 2.41, p < .05).
Figure 7.4 Student reasons for working in mathematics: three stage data
7.9 Coping styles
Coping styles reflect the ways that students cope with difficulties in
mathematics; for example failing a test or not understanding a teacher’s
explanation. It was generally found that students coped in a positive way with
these situations, although significantly less positively at the end of primary school
and significantly less positively again in year 7 (Tables 7.13 and 7.14). Further
investigation using repeated measures ANOVA within each gender found that
this significant overall decline was caused primarily by girls’ beliefs. From stage 2
to stage 3, the means for positive coping for female students fell from 3.48 to
3.30, while for males the means were 3.49 and 3.44 for stages 2 and 3
respectively. Anxiety about difficulties was not as apparent in the stage 3 sample,
and a significant decline was seen for both female and male students.
1.5
2
2.5
3
3.5
4
stage 1 stage 2 stage 3
Stage of data collection
mea
ns fo
r aut
onom
yva
riabl
es
External Introjected Identified Intrinsic
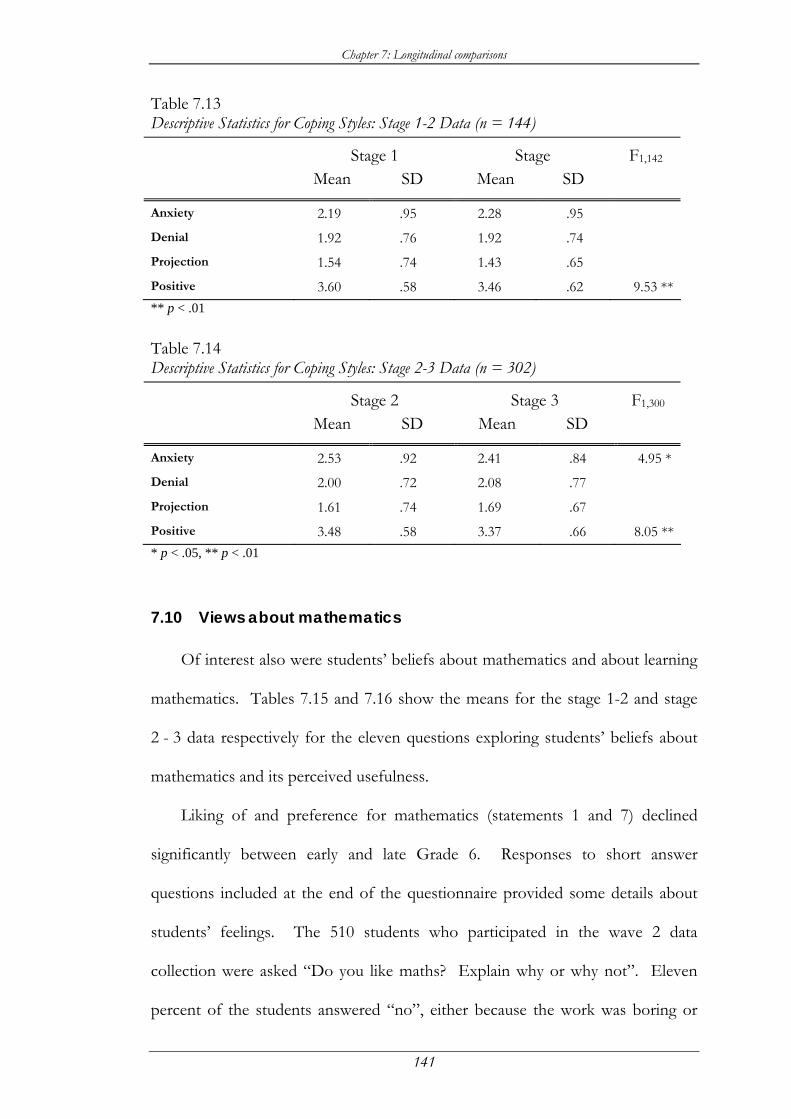
Chapter 7: Longitudinal comparisons
141
Table 7.13 Descriptive Statistics for Coping Styles: Stage 1-2 Data (n = 144)
Stage 1 Stage F1,142 Mean SD Mean SD
Anxiety 2.19 .95 2.28 .95 Denial 1.92 .76 1.92 .74 Projection 1.54 .74 1.43 .65 Positive 3.60 .58 3.46 .62 9.53 **** p < .01
Table 7.14 Descriptive Statistics for Coping Styles: Stage 2-3 Data (n = 302)
Stage 2 Stage 3 F1,300 Mean SD Mean SD
Anxiety 2.53 .92 2.41 .84 4.95 *Denial 2.00 .72 2.08 .77 Projection 1.61 .74 1.69 .67 Positive 3.48 .58 3.37 .66 8.05 *** p < .05, ** p < .01
7.10 Views about mathematics
Of interest also were students’ beliefs about mathematics and about learning
mathematics. Tables 7.15 and 7.16 show the means for the stage 1-2 and stage
2 - 3 data respectively for the eleven questions exploring students’ beliefs about
mathematics and its perceived usefulness.
Liking of and preference for mathematics (statements 1 and 7) declined
significantly between early and late Grade 6. Responses to short answer
questions included at the end of the questionnaire provided some details about
students’ feelings. The 510 students who participated in the wave 2 data
collection were asked “Do you like maths? Explain why or why not”. Eleven
percent of the students answered “no”, either because the work was boring or
Chapter 7: Longitudinal comparisons
142
repetitive or they had already covered it, while 8% said “no”, because they
weren’t very good at it, for example the students who made comments such as
“No I don’t because it’s hard and I’m dumb”. A number of strongly negative affective
comments were made by students about why they didn’t like maths, and it should
be noted with some concern that many of these involved fear, embarrassment
and ridicule. Typical comments made by the students in this study include:
“I do not like maths because when I work something out and then get it corected (sic) it is nelly (sic) always rong (sic)”
“I don't like maths much because I get a bit fritend (sic) when most people are finished there (sic) math and I am stile (sic) going”
“I don’t like maths that much because I get all tense and it makes it unjoyable (sic)”
“No I don’t really like maths because I hate it when you don’t know and answer and everyone laughs at you” and
“I do not like maths because I am afraid of muking (sic) up”.
In all, 37% of students who responded to the open ended questions
answered that, for one reason or another, that they didn’t like maths. In contrast,
eleven percent of students answered “yes” they liked mathematics, for external
reasons such as needing it later on for university, a job or shopping, while about
26% answered “yes” because the work was fun, or interesting, or because they
were good at it. A number of students who appeared to be good at maths liked it
for rather self-serving reasons, for example a number of students made
comments in a similar vein to “Yes I do like maths because it’s interesting and fun.
W hen people have trouble they’ll turn to you and you show them how to do it”.
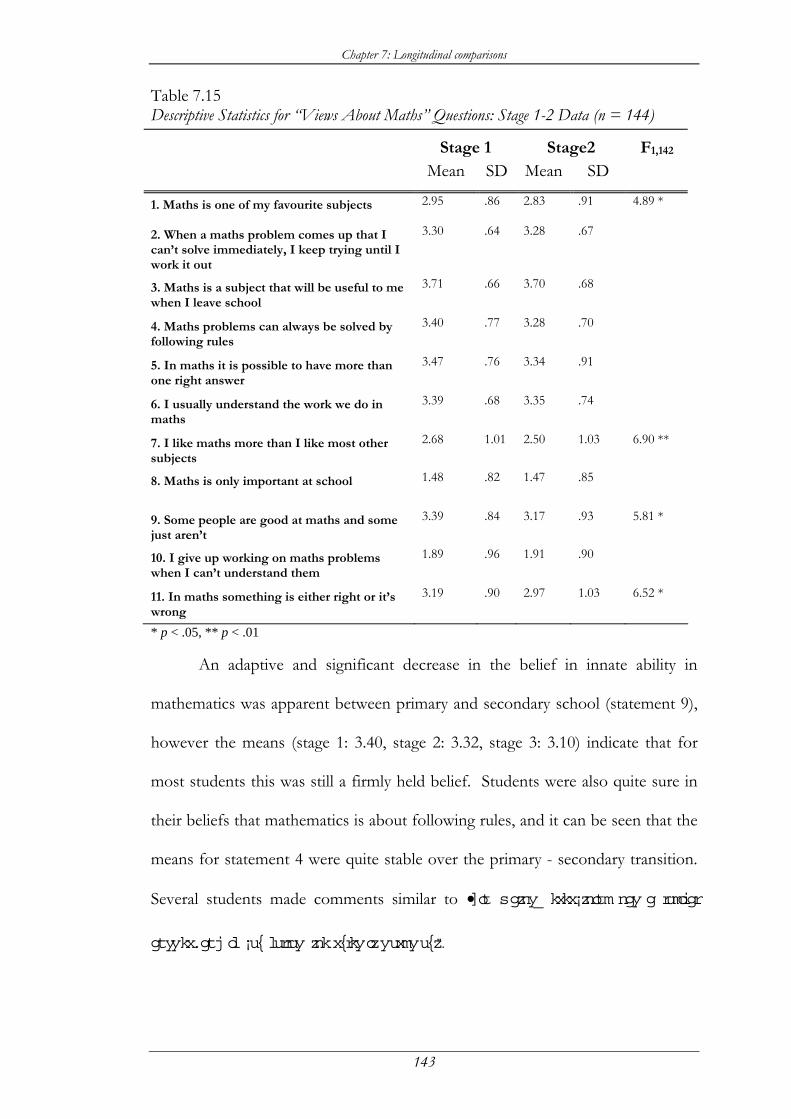
Chapter 7: Longitudinal comparisons
143
Table 7.15 Descriptive Statistics for “Views About Maths” Questions: Stage 1-2 Data (n = 144)
Stage 1 Stage2 F1,142 Mean SD Mean SD
1. Maths is one of my favourite subjects 2.95 .86 2.83 .91 4.89 *
2. When a maths problem comes up that I can’t solve immediately, I keep trying until I work it out
3.30 .64 3.28 .67
3. Maths is a subject that will be useful to me when I leave school
3.71 .66 3.70 .68
4. Maths problems can always be solved by following rules
3.40 .77 3.28 .70
5. In maths it is possible to have more than one right answer
3.47 .76 3.34 .91
6. I usually understand the work we do in maths
3.39 .68 3.35 .74
7. I like maths more than I like most other subjects
2.68 1.01 2.50 1.03 6.90 **
8. Maths is only important at school 1.48 .82 1.47 .85
9. Some people are good at maths and some just aren’t
3.39 .84 3.17 .93 5.81 *
10. I give up working on maths problems when I can’t understand them
1.89 .96 1.91 .90
11. In maths something is either right or it’s wrong
3.19 .90 2.97 1.03 6.52 *
* p < .05, ** p < .01 An adaptive and significant decrease in the belief in innate ability in
mathematics was apparent between primary and secondary school (statement 9),
however the means (stage 1: 3.40, stage 2: 3.32, stage 3: 3.10) indicate that for
most students this was still a firmly held belief. Students were also quite sure in
their beliefs that mathematics is about following rules, and it can be seen that the
means for statement 4 were quite stable over the primary - secondary transition.
Several students made comments similar to “[in maths] everything has a logical
answer, and if you follow the rules it works out”.
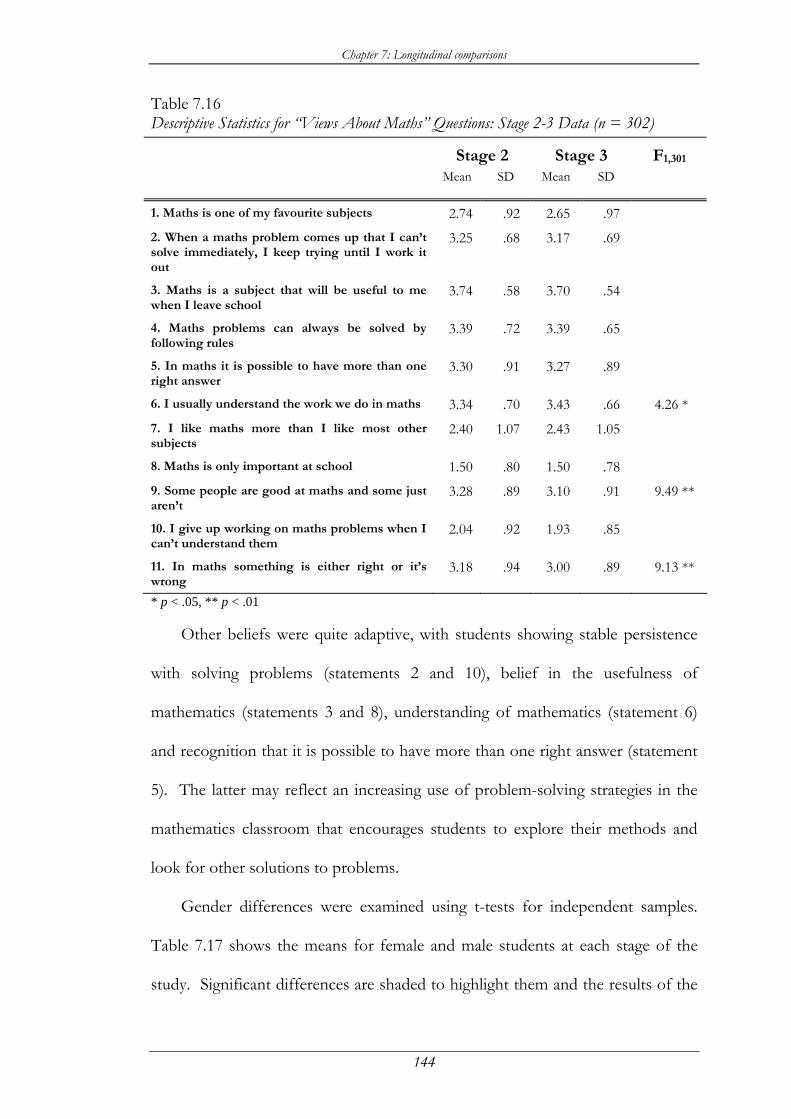
Chapter 7: Longitudinal comparisons
144
Table 7.16 Descriptive Statistics for “Views About Maths” Questions: Stage 2-3 Data (n = 302)
Stage 2 Stage 3 F1,301 Mean SD Mean SD
1. Maths is one of my favourite subjects 2.74 .92 2.65 .97 2. When a maths problem comes up that I can’t solve immediately, I keep trying until I work it out
3.25 .68 3.17 .69
3. Maths is a subject that will be useful to me when I leave school
3.74 .58 3.70 .54
4. Maths problems can always be solved by following rules
3.39 .72 3.39 .65
5. In maths it is possible to have more than one right answer
3.30 .91 3.27 .89
6. I usually understand the work we do in maths 3.34 .70 3.43 .66 4.26 * 7. I like maths more than I like most other subjects
2.40 1.07 2.43 1.05
8. Maths is only important at school 1.50 .80 1.50 .78 9. Some people are good at maths and some just aren’t
3.28 .89 3.10 .91 9.49 **
10. I give up working on maths problems when I can’t understand them
2.04 .92 1.93 .85
11. In maths something is either right or it’s wrong
3.18 .94 3.00 .89 9.13 **
* p < .05, ** p < .01 Other beliefs were quite adaptive, with students showing stable persistence
with solving problems (statements 2 and 10), belief in the usefulness of
mathematics (statements 3 and 8), understanding of mathematics (statement 6)
and recognition that it is possible to have more than one right answer (statement
5). The latter may reflect an increasing use of problem-solving strategies in the
mathematics classroom that encourages students to explore their methods and
look for other solutions to problems.
Gender differences were examined using t-tests for independent samples.
Table 7.17 shows the means for female and male students at each stage of the
study. Significant differences are shaded to highlight them and the results of the
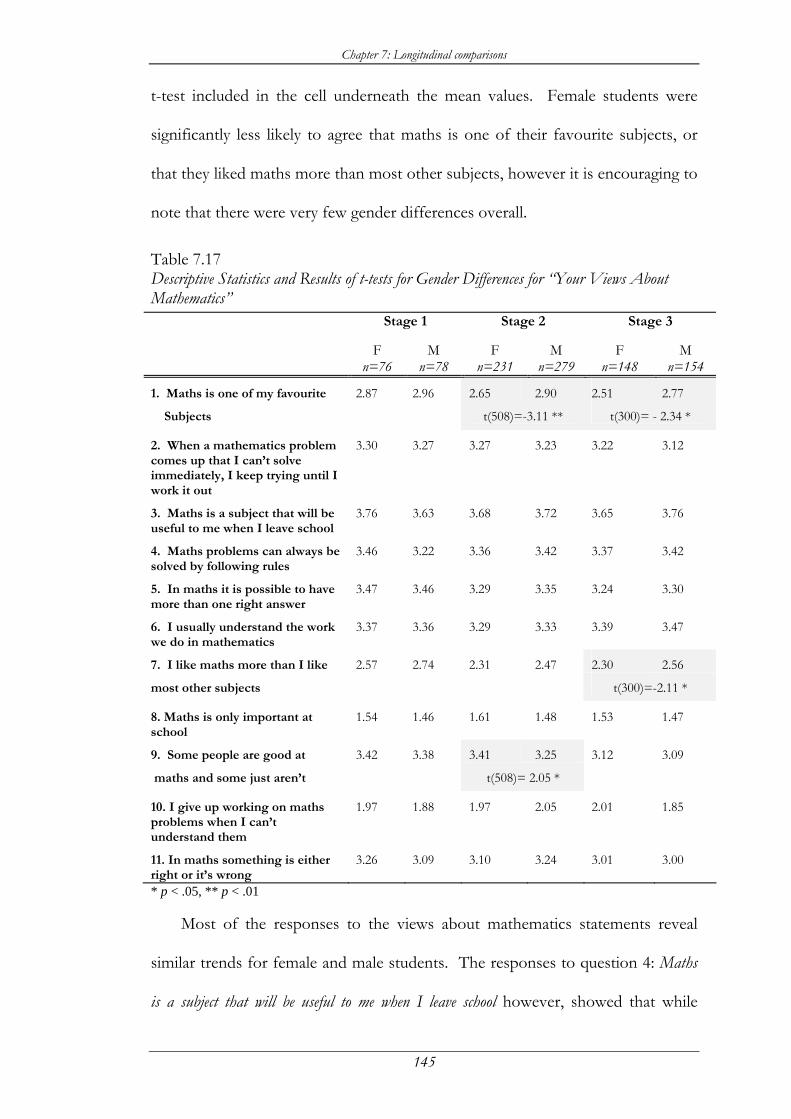
Chapter 7: Longitudinal comparisons
145
t-test included in the cell underneath the mean values. Female students were
significantly less likely to agree that maths is one of their favourite subjects, or
that they liked maths more than most other subjects, however it is encouraging to
note that there were very few gender differences overall.
Table 7.17 Descriptive Statistics and Results of t-tests for Gender Differences for “Your Views About Mathematics”
Stage 1 Stage 2 Stage 3
F n=76
M n=78
F n=231
M n=279
F n=148
M n=154
1. Maths is one of my favourite 2.87 2.96 2.65 2.90 2.51 2.77 Subjects t(508)=-3.11 ** t(300)= - 2.34 *
2. When a mathematics problem comes up that I can’t solve immediately, I keep trying until I work it out
3.30 3.27 3.27 3.23 3.22 3.12
3. Maths is a subject that will be useful to me when I leave school
3.76 3.63 3.68 3.72 3.65 3.76
4. Maths problems can always be solved by following rules
3.46 3.22 3.36 3.42 3.37 3.42
5. In maths it is possible to have more than one right answer
3.47 3.46 3.29 3.35 3.24 3.30
6. I usually understand the work we do in mathematics
3.37 3.36 3.29 3.33 3.39 3.47
7. I like maths more than I like 2.57 2.74 2.31 2.47 2.30 2.56 most other subjects t(300)=-2.11 *
8. Maths is only important at school
1.54 1.46 1.61 1.48 1.53 1.47
9. Some people are good at 3.42 3.38 3.41 3.25 3.12 3.09 maths and some just aren’t t(508)= 2.05 * 10. I give up working on maths problems when I can’t understand them
1.97 1.88 1.97 2.05 2.01 1.85
11. In maths something is either right or it’s wrong
3.26 3.09 3.10 3.24 3.01 3.00
* p < .05, ** p < .01 Most of the responses to the views about mathematics statements reveal
similar trends for female and male students. The responses to question 4: Maths
is a subject that will be useful to me when I leave school however, showed that while
Chapter 7: Longitudinal comparisons
146
males gradually perceived mathematics as more useful in their post-school life,
female students perceived it as less useful. This pattern of beliefs would provide
a stronger incentive for male students to continue their mathematics studies past
the compulsory level.
Students were also asked whether maths classes would be different in
secondary school. Almost 58% of students said that they thought it would be
harder, some with specific reasons such as “we will do algebra, the really, really, really,
really hard maths”. A number of comments reflected a fairly low opinion of
secondary mathematics teachers, such as:
“Yes it will be very hard and they just give you sheets and you have to do it without the teacher telling you how to do it”,
“Yes I do think the classes will be different because we will have to learn it ourselves”,
“Yes they [maths classes] will be harder. The teacher will not help me”, and
“W e will get a maths book and get told to do it and that’s it”.
Some students had already determined in Grade 6 that they would have
difficulties in secondary school; “M aths will be much harder. I think I will fail”,
however some looked forward to it eagerly “I reckon it will be even more fun”, and
“… it would be harder and maybe even more exciting”. Unfortunately these positive
comments were vastly outnumbered by the negative. These students had all
participated in orientation days at their secondary schools when they answered
these questions, so they had ideas about secondary school already fixed firmly in
their minds.
Chapter 7: Longitudinal comparisons
147
7.11 Summary
It has been demonstrated in this chapter that the perceived control model is
useful in describing changing beliefs about mathematics over the primary-
secondary school transition. As particular combinations of perceived control
variables were seen to affect student engagement, a summary variable
(CONMAX) was used which takes account of the strategies and capacities found
to maximise perceived control. Higher scores on this variable imply that the
student has more well-developed views about learning mathematics.
CONMAX was seen to remain stable over the Grade 6 year, but then
declined significantly after transition to secondary school. Students generally felt
less in control of their learning; less able to control their successes and failures.
Perceptions of teacher provision of autonomy support and teacher involvement
also declined significantly over the transition to secondary school. Female
students felt more engaged with their work than males at each stage of the study,
a view echoed by their teachers, and they were also more likely to maintain beliefs
about teacher involvement. Girls were also more likely to suffer from a decline
in self-esteem over the transition to secondary school, and this decline occurred
at a greater rate than for male students.
Students generally rated themselves as slightly above average in ability, and
when asked about how good they would like to be in mathematics, male students
held higher expectations than female students did. Although both female and
male students moderated their expectations somewhat over the transition to
secondary school, male students’ expectations remained higher than female
Chapter 7: Longitudinal comparisons
148
students’, and males were more confident of their higher rating with teachers,
parents and peers than females.
Self-regulation was found to be mainly due to identified reasons, and it was
shown that after transition to secondary school, external regulation increased
while intrinsic motivation tended to decrease. Intrinsic and identified self-
regulation significantly decreased for females after transition, and intrinsic self-
regulation was seen to be significantly lower than for males, while external self-
regulation increased significantly for males.
Coping styles were generally found to be positive, but declined through
Grade 6 and over the transition to secondary school, particularly for female
students.
It would appear that there were some significant changes over the transition
to secondary school. Many of these changes focus on students’ beliefs about
secondary school requiring more individual work than primary school, and
feelings of less control over their learning than they had in primary school.
However the changes described are averages over all students, and it was
hypothesised that more extreme changes could occur in particular students but
be “cancelled out” by the nature of the data analysis. Another method of data
analysis may be more fruitful in discovering particular profiles of students “at
risk” of diminished engagement in learning mathematics after the transition to
secondary school, and so the investigation moved to the more exploratory area of
cluster and discriminant analysis, which is the topic of the next chapter.
149
Chapter 8
Trajectories of perceived control
8.1 Longitudinal data analysis: A different view
The initial method of analysing the longitudinal data, as seen in the previous
chapter, was to look at differences in sample means over time, with the focus
thus being on the average change across all subjects. Univariate ANOVAs were
performed individually on each cohort and on the data sets comprising students
common to stages 1, 2 and 3, students common to stages 1 and 2, and on the
data set comprising students common to stages 2 and 3. While some significant
changes were found in perceived control beliefs, coping strategies, self-regulation
beliefs and engagement, these changes could be seen only as trends among a large
cohort of students, and were not sufficient to identify profiles of students “at
risk” in mathematics.
Hirsch, DuBois and Brownell (1993) argued that the nature of analysis of
variance is that it “identifies the modal trajectory” (p. 84), and that using
ANOVA may mask subgroup differences. For example there may have been a
balancing out of students who gained slightly with those who declined slightly, or
even a balancing of students who gained considerably with those who declined
considerably. Even the significant decline in the summary variable CONMAX
found over the primary - secondary school transition needs a more fine-grained
investigation if it is to prove a useful construct. Interventions planned might be
Chapter 8: Trajectories of perceived control
150
significantly different if the differences were found to be a slight decline over the
whole group rather than a substantial decline in one group coupled with slight
increase in the rest of the cohort. Interventions might also be more precise if it
could be determined that particular subscales of the perceived control construct
showed differential effects on different groups of students. The significantly
lower self-esteem shown by girls in early secondary school also needs further
investigation to see whether there are subgroups whose self-esteem declines
substantially, and to see whether particular factors characterise such a decline.
To investigate the major research question, it was important to analyse the
data in such a way that subgroups of children who react differently to secondary
school may be identified. These different reactions, or trajectories, were
investigated with the use of cluster analysis. Cluster analysis is a method that
attempts to define homogeneous groups within a data set. The variable used as a
criterion for defining the clusters was CONMAX, which has already been
described in previous chapters as a composite variable representing the student’s
level of perceived control in mathematics, and represents a combination of
strategy and capacity beliefs. Cluster analysis was followed by discriminant
analysis, for the purpose of determining whether particular components of the
CONMAX construct were better predictors of cluster membership than others.
8.2 Cluster analysis
Cluster analysis is a method of multivariate data analysis in which a
heterogeneous group is divided into more homogeneous sub-groups or clusters
based on the strength of the relationship between particular response variables
for individual cases. Eklund (1996, p. 1) described cluster analysis as “a
Chapter 8: Trajectories of perceived control
151
classification procedure which may be used in an exploratory or confirmatory
way. Its goal is to determine natural groups which reflect underlying structure by
relating similar measures of an observed variable”. Anderberg (1973) explained
the nature of cluster analysis, and emphasised that interpretability of a solution
should be paramount in the acceptance of a cluster solution:
Cluster analysis is a device for suggesting hypotheses. The classification of data units on variables obtained from a cluster analysis procedure has no inherent validity ... The worth of a particular classification and its underlying explanatory structure is to be justified by its consistency with known facts and without regard to the manner of its original generation. Ideally, the set of clusters generated by a cluster analysis procedure will produce combinations of entities which otherwise might never be considered for examination but reveal aspects of the data which are self-evident in retrospect (p. 22).
Cluster analysis therefore is a useful tool for grouping participants on the
basis of their similarity on a particular profile, and so was used in this study to
examine the data for differing trajectories in perceived control over the transition
to secondary school. The aim of this analysis was that the set of clusters
produced should reflect different trajectories that might otherwise be lost in the
data. Two types of cluster analysis were utilised in this data analysis; hierarchical
and non-hierarchical, and their application is discussed in the following sections.
8.2.1 Hierarchical cluster analysis
There is a number of different methods of hierarchical cluster analysis,
however the agglomerative method has been dominant in terms of frequency of
use (Aldenderfer and Blashfield, 1984). Agglomerative hierarchical clustering
starts with all cases as individuals. At the first step, two cases are merged to form
a single cluster, based on their similarity coefficient. Small values for this

Chapter 8: Trajectories of perceived control
152
coefficient indicate that clusters that are quite similar are being blended, while
large values indicate that the clusters are quite diverse. At the second and
subsequent steps, either individual cases are added to existing clusters or two
existing clusters are combined. Eventually only one cluster, containing the whole
data set, remains. Agglomerative clustering has the disadvantage that once
individuals are assigned to a cluster they will not be removed from it, even
though they may subsequently fit better with another cluster. However the
agglomerative technique is most widely supported (for example it is the only
option provided by SPSSWIN) and so this method was used in this study.
Agglomerative hierarchical clustering was used as a first step in the
exploration of the data set, using the combined perceived control measure
CONMAX as the clustering variable. The algorithm chosen for the hierarchical
clustering was Ward’s method (Ward, 1963) in which all of the possible
combinations of clusters are examined at each step of the clustering process to
find the two clusters for which minimal information loss will occur when they are
combined. The objective function formed by this method uses the error sum of
squares (ESS), and joins groups or cases that result in the minimum possible
increase in the ESS. A review of hierarchical clustering methods in Deppeler
(1994) concluded that “of the hierarchical methods, Ward’s minimum variance
method appears to perform better than all other methods tested” (p. 93).
8.2.2 Stopping rules
After the method was chosen for the hierarchical cluster analysis, the
problem of how many groups to define became apparent. Hierarchical cluster
analysis performs a series of data mergers until there is only a single cluster,
Chapter 8: Trajectories of perceived control
153
representing the entire data set. At the most basic level, a dendogram can be
produced and visually inspected for interpretable clusters. The tree structure of
the dendogram presents many different groups that may be present in the data,
however the question becomes where to “cut” the tree so as to extract the
optimal number of groups. As this method is reliant purely on the judgement of
the researcher, other methods were examined that were felt to be more objective.
In the merging process some measure of distance between two clusters is
used, referred to as similarity or agglomeration coefficients, which are produced
in the agglomeration schedule by SPSSWIN. These agglomeration coefficients can
be graphed in relation to the number of clusters, a process similar to the scree
test in factor analysis. The resulting graph can then be examined for a “marked
flattening … [which would suggest] that no new information is portrayed by the
following mergers of clusters” (Aldenderfer and Blashfield, 1984, p. 54). This
method is still somewhat subjective, and the graph frequently does not produce a
clear solution, so another more formal method of determining the number of
clusters was sought.
Mojena (1977) devised a procedure based on the relative sizes of the
similarity coefficient to determine where to stop the merging process. This
procedure determines whether a “jump” in the relative size of coefficients is large
enough to be deemed significant. The “stopping rule” is to select the number of
groups corresponding to the first stage in the agglomeration process that satisfies
the rule: α α αj ks+ > +1 , where α represents the agglomeration coefficient, and
α0, α1, …, αn-1 are the fusion levels corresponding to stages with n, n -1, … , 1
clusters. The terms α and sα represent the mean and standard deviation of the α
Chapter 8: Trajectories of perceived control
154
values and k is a constant. While Mojena (1977) suggested a value of k in the
range 2.75 to 3.5, Milligan and Cooper (1985) argued that 1.25 is a more
appropriate value for k. As this research was largely exploratory, the smaller
value was used as it was deemed more likely to produce interpretable groups.
Following this, non-hierarchical cluster analysis was employed to further
investigate the groups suggested by the hierarchical cluster analysis. This will be
discussed in the next section.
8.2.3 Non-hierarchical cluster analysis
There is a variety of non-hierarchical procedures, and in this analysis the
convergent k-means method was used. This is an iterative partitioning procedure
that works in the following manner. The algorithm begins by dividing the data
set randomly into a predetermined number of clusters, and the centroids of these
clusters are calculated. Each data point is then allocated to the cluster with the
nearest centroid, and when all data points have been assigned the centroids are
re-calculated and data points are moved to closer centroids if necessary. This
iterative procedure continues until no data points change clusters. Deppeler
(1994) concluded that “of the non-hierarchical procedures, convergent k-means
method appears to consistently outperform other non-hierarchical methods”
(p. 94). Hirsch et al. (1993) used k-means cluster analysis, arguing that “for
prevention purposes, k-means has the advantage … of being sensitive to extreme
profiles and thus does not mask atypical patterns in order to achieve similarly
sized groups” (p. 87).
Chapter 8: Trajectories of perceived control
155
8.3 Cluster analysis of the smaller data set
8.3.1 Agglom erative hierarchical clustering
Initially, data analysis focussed on the data set comprising students who
participated in each of the three stages of data collection. Although this group
was relatively small, it is deemed large enough for exploratory analysis of this
type. The mean of the agglomeration coefficients, α , was found to be 4377.61,
and the standard deviation 9100.39. Using k = 1.25, the value for αj+1 was
therefore 15 753.10, and it was apparent from the agglomeration schedule that
the gap between the second last and final cluster merges was found to be greater
than this. This then suggested a two cluster solution, which would next be
further explored using non-hierarchical clustering techniques.
Choosing the number of clusters to examine with the k-means cluster
analysis was guided by the results of the hierarchical cluster analysis. However as
the nature of the cluster analysis was exploratory, it was vital both that the
number of clusters chosen should be the most economical possible, and that
these clusters should define an interpretable number of separate groups. Eklund
(1996) argued that the researcher should have some knowledge of the
significance of the cluster groupings, and so to allow for interpretability he
recommended an examination of the cluster solutions at least one greater and
one less than that obtained from the hierarchical method. For the initial sample,
71 out of 74 cases were available for analysis, due to missing data on three cases.
It was decided that cluster solutions for two, three and four clusters would be
examined using k-means cluster analysis.
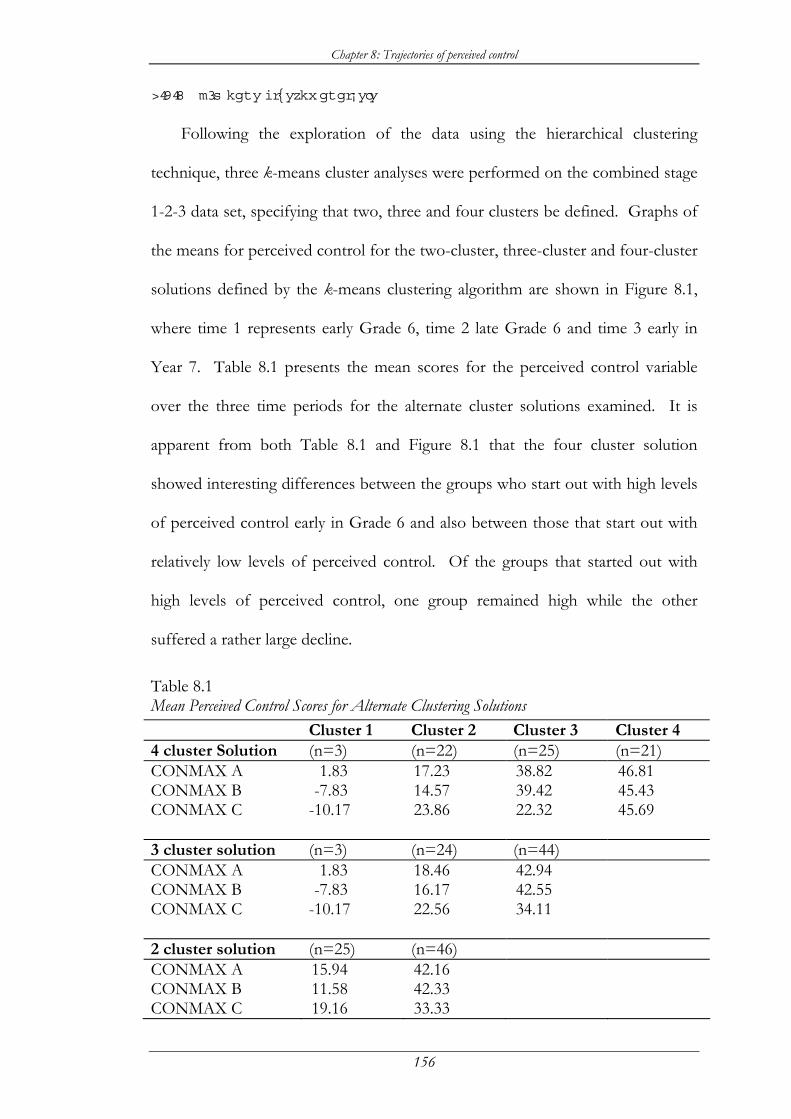
Chapter 8: Trajectories of perceived control
156
8.3.2 k-m eans cluster analysis
Following the exploration of the data using the hierarchical clustering
technique, three k-means cluster analyses were performed on the combined stage
1-2-3 data set, specifying that two, three and four clusters be defined. Graphs of
the means for perceived control for the two-cluster, three-cluster and four-cluster
solutions defined by the k-means clustering algorithm are shown in Figure 8.1,
where time 1 represents early Grade 6, time 2 late Grade 6 and time 3 early in
Year 7. Table 8.1 presents the mean scores for the perceived control variable
over the three time periods for the alternate cluster solutions examined. It is
apparent from both Table 8.1 and Figure 8.1 that the four cluster solution
showed interesting differences between the groups who start out with high levels
of perceived control early in Grade 6 and also between those that start out with
relatively low levels of perceived control. Of the groups that started out with
high levels of perceived control, one group remained high while the other
suffered a rather large decline.
Table 8.1 Mean Perceived Control Scores for Alternate Clustering Solutions Cluster 1 Cluster 2 Cluster 3 Cluster 4 4 cluster Solution (n=3) (n=22) (n=25) (n=21) CONMAX A 1.83 17.23 38.82 46.81 CONMAX B -7.83 14.57 39.42 45.43 CONMAX C -10.17 23.86 22.32 45.69 3 cluster solution (n=3) (n=24) (n=44) CONMAX A 1.83 18.46 42.94 CONMAX B -7.83 16.17 42.55 CONMAX C -10.17 22.56 34.11 2 cluster solution (n=25) (n=46) CONMAX A 15.94 42.16 CONMAX B 11.58 42.33 CONMAX C 19.16 33.33

Chapter 8: Trajectories of perceived control
157
The opposite occurred with the group whose perceived control was low to
start with; one group stayed very low, while the other group rose significantly. In
moving to a three-cluster solution, the two groups that began with high perceived
control were combined and an average group formed, while the two-cluster
solution merged the lower two clusters.
0
10
20
30
40
50
time 1 time 2 time 3time period
Perc
eive
d co
ntro
l
-20
-10
0
10
20
30
40
50
time 1 time 2 time 3time period
Per
ceiv
ed c
ontro
l
-20
-10
0
10
20
30
40
50
time 1 time 2 time 3
Per
ceiv
ed c
ontro
l
Figure 8.1 Means for perceived control over the primary-secondary transition for two, three
and four cluster solutions It would appear that interesting differences between clusters in the four-
cluster solution are masked when the number of clusters is decreased. It was
apparent that the selection of the higher level cluster solution was the most likely
to maximise cluster differences, and so the data analysis proceeded with the four-
cluster solution.
Chapter 8: Trajectories of perceived control
158
Whichever solution was chosen, there appeared to be a large group of
students who exhibited high levels of perceived control in primary school which
declined sharply on transition to secondary school. These students are
particularly at risk because it is difficult to identify them. At both instances in
primary school, most of these students held high perceived control beliefs, so
there are no obvious behavioural or motivational problems in Grade 6 that would
alert teachers to possible problems in secondary school.
8.4 Cluster solutions for the larger sample
8.4.1 Validity and replicability of cluster solutions
The next stage in the development of a cluster solution was to examine the
clustering for the larger stage 2 and 3 data set to see whether similar clusters
existed for this group. This set comprised matched data from the larger sample
of 302 students who were surveyed both late in term 4 of Grade 6 and late in
term 2 of Year 7. Aldenderfer and Blashfield (1984) argued that the degree of
replicability of a cluster solution is best examined by clustering different samples
from the same population, similar to the method of split half reliability. The
method utilised in this analysis of examining two data sets from the same
population would clearly provide some evidence of replicability for the solution.
It should be noted that while this technique may be seen as a check for the
internal consistency of a solution, Aldenderfer and Blashfield (1984) warned that
it does not guarantee the validity of a solution. They argue that a more powerful
validation of a clustering solution is to “perform significance tests that compare
the clusters on variables not used to generate the cluster solution” (p. 66).
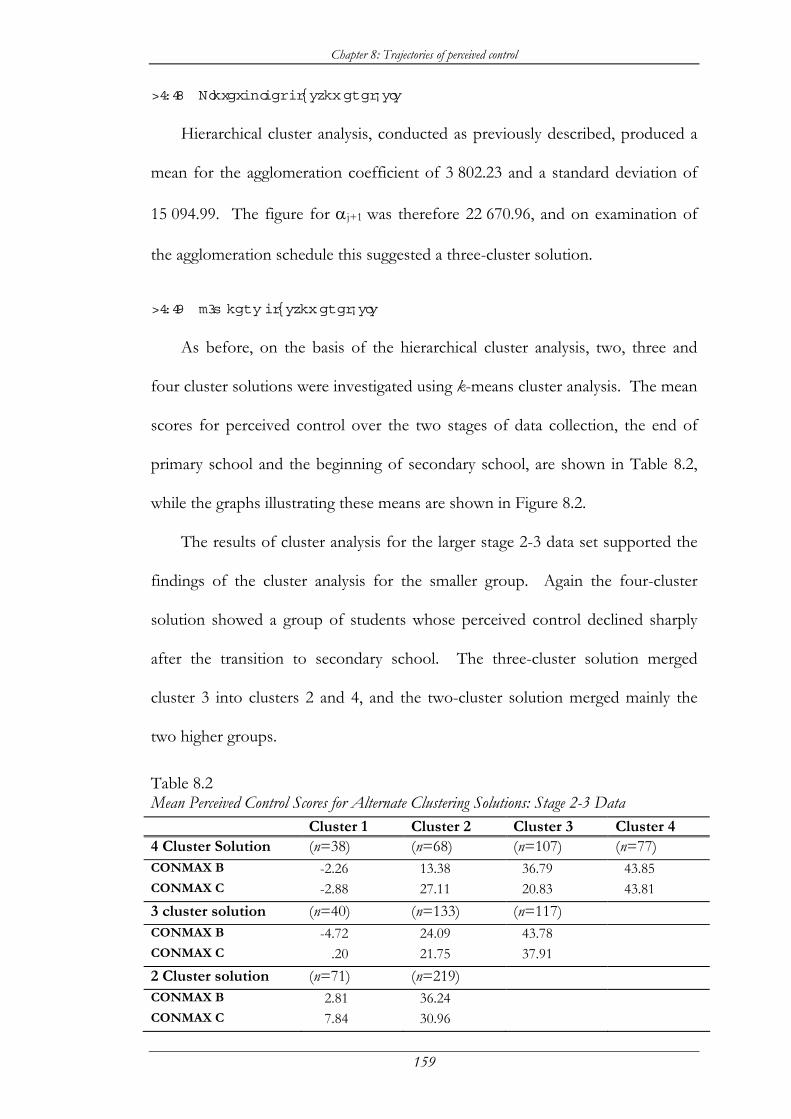
Chapter 8: Trajectories of perceived control
159
8.4.2 Hierarchical cluster analysis
Hierarchical cluster analysis, conducted as previously described, produced a
mean for the agglomeration coefficient of 3 802.23 and a standard deviation of
15 094.99. The figure for αj+1 was therefore 22 670.96, and on examination of
the agglomeration schedule this suggested a three-cluster solution.
8.4.3 k-m eans cluster analysis
As before, on the basis of the hierarchical cluster analysis, two, three and
four cluster solutions were investigated using k-means cluster analysis. The mean
scores for perceived control over the two stages of data collection, the end of
primary school and the beginning of secondary school, are shown in Table 8.2,
while the graphs illustrating these means are shown in Figure 8.2.
The results of cluster analysis for the larger stage 2-3 data set supported the
findings of the cluster analysis for the smaller group. Again the four-cluster
solution showed a group of students whose perceived control declined sharply
after the transition to secondary school. The three-cluster solution merged
cluster 3 into clusters 2 and 4, and the two-cluster solution merged mainly the
two higher groups.
Table 8.2 Mean Perceived Control Scores for Alternate Clustering Solutions: Stage 2-3 Data Cluster 1 Cluster 2 Cluster 3 Cluster 4 4 Cluster Solution (n=38) (n=68) (n=107) (n=77) CONMAX B -2.26 13.38 36.79 43.85 CONMAX C -2.88 27.11 20.83 43.81 3 cluster solution (n=40) (n=133) (n=117) CONMAX B -4.72 24.09 43.78 CONMAX C .20 21.75 37.91 2 Cluster solution (n=71) (n=219) CONMAX B 2.81 36.24 CONMAX C 7.84 30.96
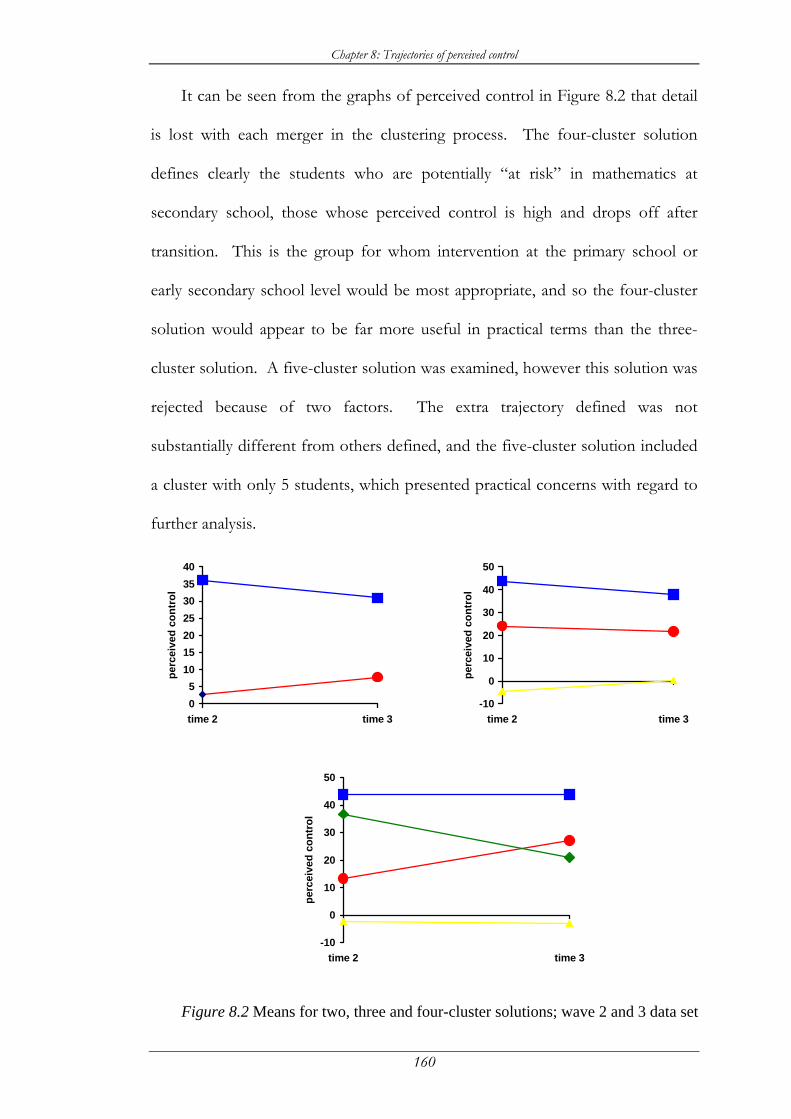
Chapter 8: Trajectories of perceived control
160
It can be seen from the graphs of perceived control in Figure 8.2 that detail
is lost with each merger in the clustering process. The four-cluster solution
defines clearly the students who are potentially “at risk” in mathematics at
secondary school, those whose perceived control is high and drops off after
transition. This is the group for whom intervention at the primary school or
early secondary school level would be most appropriate, and so the four-cluster
solution would appear to be far more useful in practical terms than the three-
cluster solution. A five-cluster solution was examined, however this solution was
rejected because of two factors. The extra trajectory defined was not
substantially different from others defined, and the five-cluster solution included
a cluster with only 5 students, which presented practical concerns with regard to
further analysis.
05
10152025303540
time 2 time 3
perc
eive
d co
ntro
l
-10
0
10
20
30
40
50
time 2 time 3
perc
eive
d co
ntro
l
-10
0
10
20
30
40
50
time 2 time 3
perc
eive
d co
ntro
l
Figure 8.2 Means for two, three and four-cluster solutions; wave 2 and 3 data set
Chapter 8: Trajectories of perceived control
161
For convenience, it was decided to attach descriptive labels to each of the
groups formed by the cluster analysis. The group whose perceived control
remained high throughout the study were named the consistently high group, while
the group whose perceived control started high in Grade 6 but dropped after the
transition to secondary school became the decliners group. The group whose
perceived control remained low was labelled the chronically low group, while those
whose perceived control was low in Grade 6 but improved markedly over the
transition to secondary school became the risers group.
As the predictor variable (CONMAX) was a combination of strategy and
capacity beliefs, a discriminant analysis was carried out using cluster membership
as the grouping variable and the strategy, capacity and control beliefs from time 2
(fourth term primary school) as independent variables. It was considered that for
intervention measures it was more important to know the predictors before
entering primary school and this is why these were the independent variables
used in the discriminant analysis.
8.5 Discriminant analysis
Discriminant analysis is a technique that examines the extent to which
multiple predictor variables are related to a categorical criterion, in this case
group membership. It is particularly useful for determining which of the
predictor variables best characterises the group differences. Discriminant analysis
forms linear combinations of the independent variables that serve as the basis for
classifying particular cases into one of the defined groups. The optimal
discriminant function will minimise the probability of misclassification (Norušis,
1993).
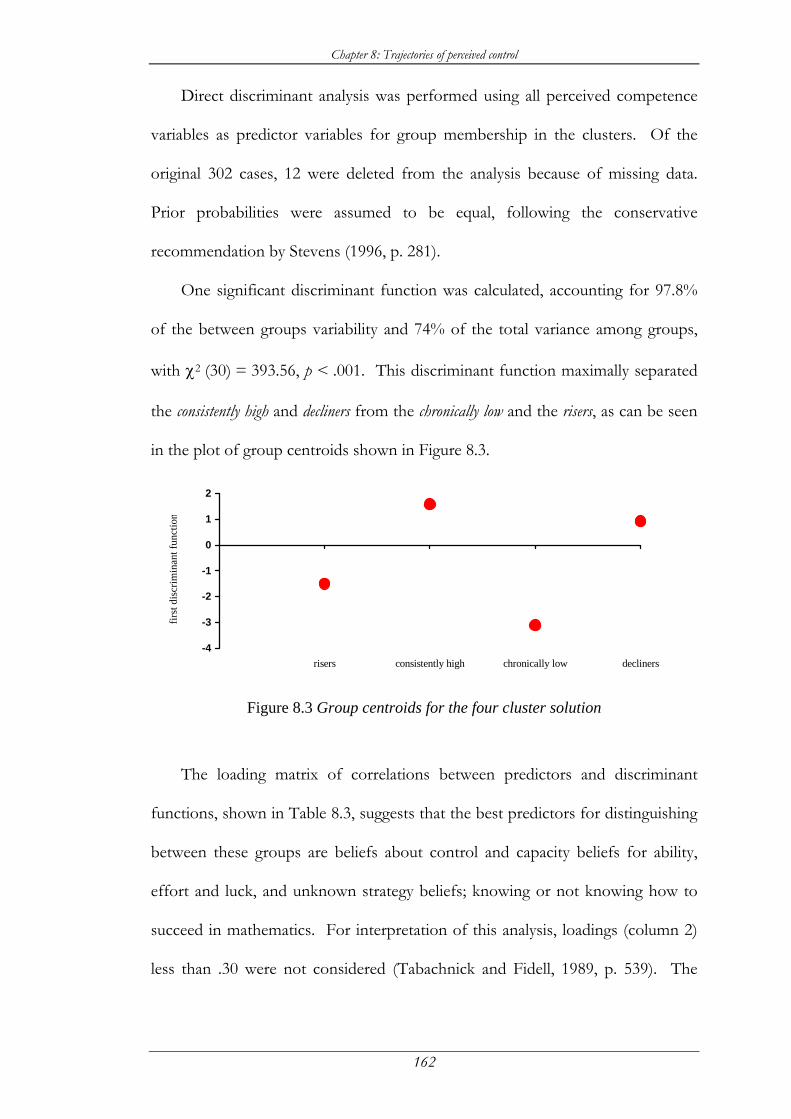
Chapter 8: Trajectories of perceived control
162
Direct discriminant analysis was performed using all perceived competence
variables as predictor variables for group membership in the clusters. Of the
original 302 cases, 12 were deleted from the analysis because of missing data.
Prior probabilities were assumed to be equal, following the conservative
recommendation by Stevens (1996, p. 281).
One significant discriminant function was calculated, accounting for 97.8%
of the between groups variability and 74% of the total variance among groups,
with χ2 (30) = 393.56, p < .001. This discriminant function maximally separated
the consistently high and decliners from the chronically low and the risers, as can be seen
in the plot of group centroids shown in Figure 8.3.
-4
-3
-2
-1
0
1
2
risers consistently high chronically low decliners
first
dis
crim
inan
t fun
ctio
n
Figure 8.3 Group centroids for the four cluster solution
The loading matrix of correlations between predictors and discriminant
functions, shown in Table 8.3, suggests that the best predictors for distinguishing
between these groups are beliefs about control and capacity beliefs for ability,
effort and luck, and unknown strategy beliefs; knowing or not knowing how to
succeed in mathematics. For interpretation of this analysis, loadings (column 2)
less than .30 were not considered (Tabachnick and Fidell, 1989, p. 539). The

Chapter 8: Trajectories of perceived control
163
canonical correlation of .86 represents a large correlation between group
membership and the significant discriminant function.
Table 8.3 Results of Discriminant Function Analysis of Individual Perceived Control Beliefs Predictor variable
Correlations of predictor variables with
discriminant functions
Univariate F3, 286
p
Control .56 81.93 *** Strategy ability - .21 11.86 *** Strategy effort .11 3.48 * Strategy luck - .29 23.24 *** Strategy powerful others - .25 17.09 *** Strategy unknown - .41 45.90 *** Capacity ability .55 84.85 *** Capacity effort .51 71.04 *** Capacity luck .41 44.93 *** Capacity powerful others .21 12.90 *** Canonical R .86 Eigenvalue 2.79
* p < .05, ** p < .01, *** p < .001
Table 8.3 also shows the univariate F-tests between each of the predictor
variables and the discriminant function. All of these are significant, indicating
that each of the predictors acts to discriminate between the groups, although as
was seen in the previous chapter, Strategy effort contributes less to the prediction
than any of the other variables. The means for the significant predictor
variables are shown in Table 8.4. The consistently high group present the most
positive profile of the four groups, with the highest scores on Capacity ability,
Capacity effort, Capacity luck and Control (I am smart, I can work hard, I’m lucky
and I can do well in maths if I want to), and the lowest on Strategy unknown (I don’t
know how to do well in maths). The groups progressively show more detrimental
belief structures, with the chronically low group exhibiting low belief in their own
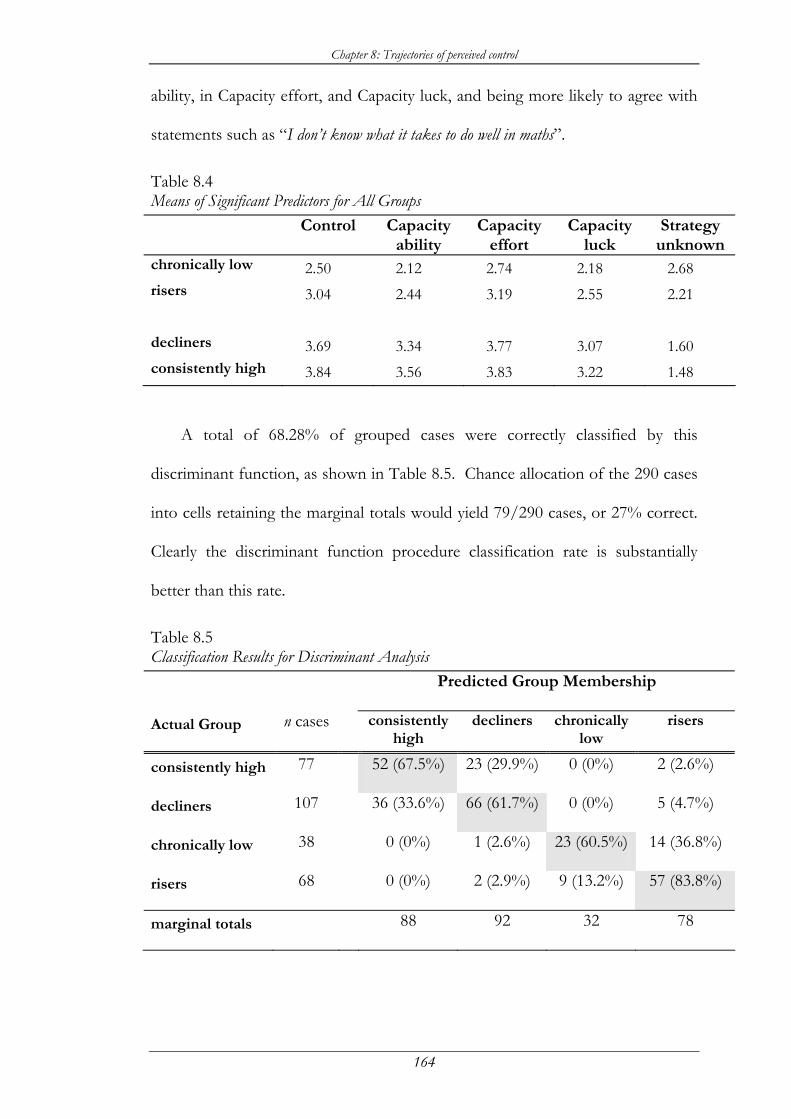
Chapter 8: Trajectories of perceived control
164
ability, in Capacity effort, and Capacity luck, and being more likely to agree with
statements such as “I don’t know what it takes to do well in maths”.
Table 8.4 Means of Significant Predictors for All Groups
Control Capacity ability
Capacity effort
Capacity luck
Strategy unknown
chronically low 2.50 2.12 2.74 2.18 2.68 risers 3.04 2.44 3.19 2.55 2.21 decliners 3.69 3.34 3.77 3.07 1.60 consistently high 3.84 3.56 3.83 3.22 1.48
A total of 68.28% of grouped cases were correctly classified by this
discriminant function, as shown in Table 8.5. Chance allocation of the 290 cases
into cells retaining the marginal totals would yield 79/290 cases, or 27% correct.
Clearly the discriminant function procedure classification rate is substantially
better than this rate.
Table 8.5 Classification Results for Discriminant Analysis Predicted Group Membership
Actual Group n cases consistently high
decliners chronically low
risers
consistently high 77 52 (67.5%) 23 (29.9%) 0 (0%) 2 (2.6%)
decliners 107 36 (33.6%) 66 (61.7%) 0 (0%) 5 (4.7%)
chronically low 38 0 (0%) 1 (2.6%) 23 (60.5%) 14 (36.8%)
risers 68 0 (0%) 2 (2.9%) 9 (13.2%) 57 (83.8%)
marginal totals 88 92 32 78
Chapter 8: Trajectories of perceived control
165
It can be seen that while the discriminant function is best at predicting the
risers group, it also performs quite respectably at predicting the decliners, who are
the critical group to try and identify.
In summary, the combination of cluster and discriminant analysis identified
four reasonably distinct sub-groups of students. A substantial number (35%) of
the students in the sample showed a decline in their perceived control over the
primary-secondary school transition. These students appear to have strategies for
or beliefs about learning that may be effective in primary school but are not
effective in secondary school.
It would appear that it is more difficult to separate the groups that are
closest together, in this instance the consistently high and decliners groups and the
chronically low and risers groups. For the purposes of intervention, it is particularly
necessary to be able to identify students in the decliners group, and the
identification of particular changes in beliefs by the risers group may provide clues
to help other groups. In order to facilitate this identification, further discriminant
analyses were carried out to examine the differences between these groups.
8.6 Differences between consistently high and decliners
One hundred and eighty-four cases were used in a direct discriminant
analysis using all perceived competence variables as predictor variables for group
membership in the consistently high and decliners clusters. A single discriminant
function was calculated, with χ2(10) = 28.10, p < .01. The loading matrix of
correlations between predictors and the discriminant function, shown in Table
8.6, suggests that the best predictors are Capacity ability, Capacity powerful
Chapter 8: Trajectories of perceived control
166
others and Control beliefs, and these are also the only predictors that serve to
discriminate between the two groups.
Table 8.6 Results of Discriminant Function Analysis of Individual Perceived Control Beliefs in Primary School for Consistently High and Decliners Groups
Predictor variable
Correlations of predictor variables with discriminant
functions
Univariate F (1, 182)
p
Control .46 6.55 * Capacity ability .49 7.58 ** Capacity effort .18 1.06 Capacity luck .34 3.70 Capacity powerful others .49 7.42 ** Strategy ability - .34 3.65 Strategy effort .32 3.08 Strategy luck - .10 .32 Strategy powerful others - .19 1.15 Strategy unknown - .23 1.73 Canonical R .38 Eigenvalue .17
* p < .05, ** p < .01 *** p < .001
It can be seen from Table 8.7 that students in the consistently high group
believed more strongly in their own ability and in their capacity for obtaining the
assistance of their teachers, and had a higher level of belief that “I can do well in
maths if I want to” than those students whose perceived control dropped in Year 7.
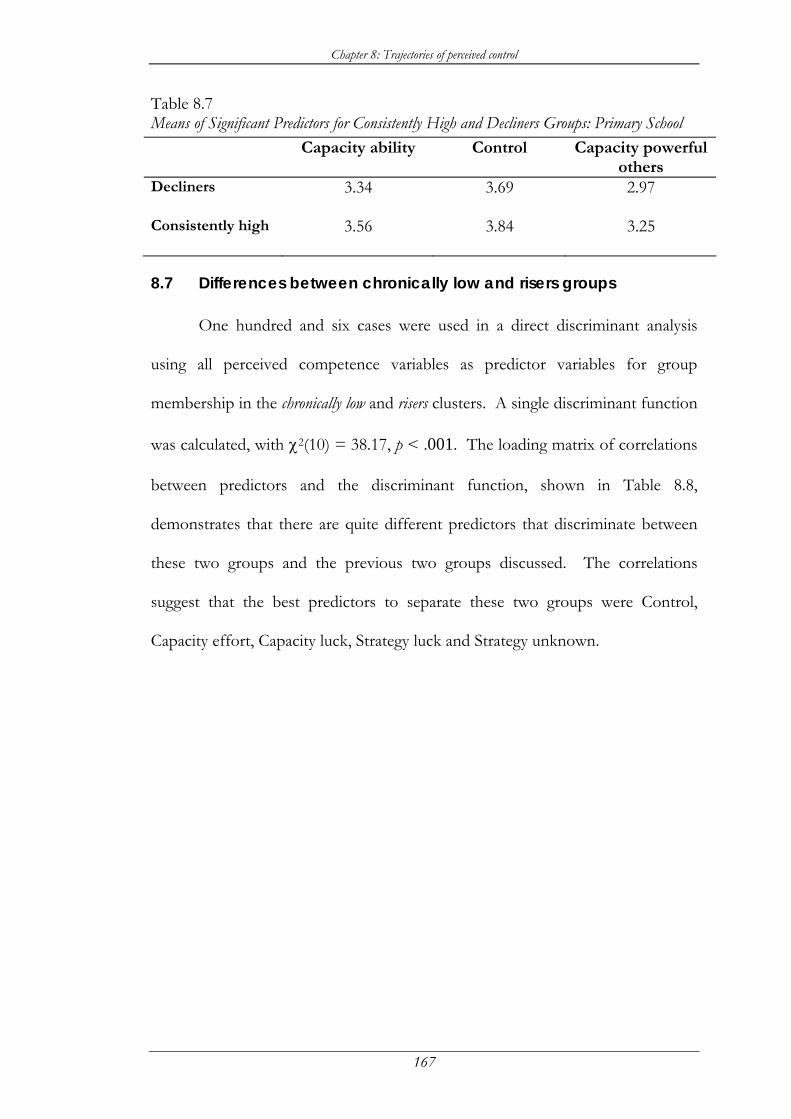
Chapter 8: Trajectories of perceived control
167
Table 8.7 Means of Significant Predictors for Consistently High and Decliners Groups: Primary School Capacity ability Control Capacity powerful
others Decliners 3.34 3.69 2.97
Consistently high 3.56 3.84 3.25
8.7 Differences between chronically low and risers groups
One hundred and six cases were used in a direct discriminant analysis
using all perceived competence variables as predictor variables for group
membership in the chronically low and risers clusters. A single discriminant function
was calculated, with χ2(10) = 38.17, p < .001. The loading matrix of correlations
between predictors and the discriminant function, shown in Table 8.8,
demonstrates that there are quite different predictors that discriminate between
these two groups and the previous two groups discussed. The correlations
suggest that the best predictors to separate these two groups were Control,
Capacity effort, Capacity luck, Strategy luck and Strategy unknown.
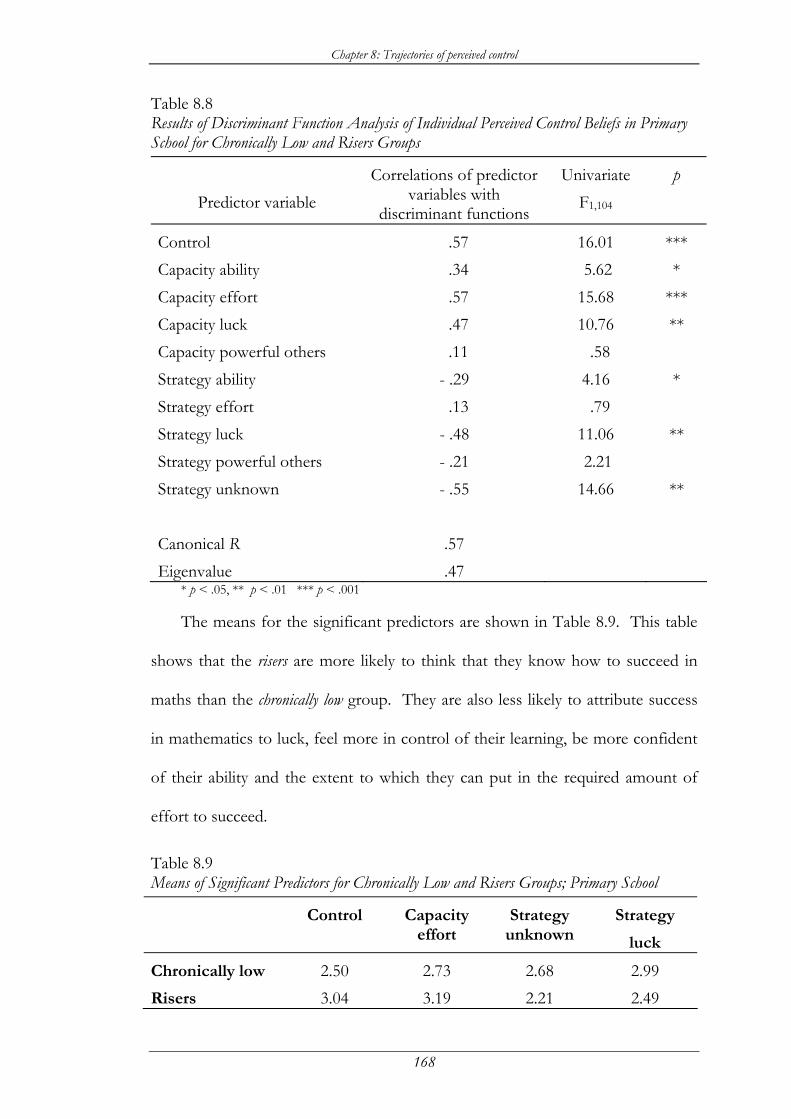
Chapter 8: Trajectories of perceived control
168
Table 8.8 Results of Discriminant Function Analysis of Individual Perceived Control Beliefs in Primary School for Chronically Low and Risers Groups
Predictor variable
Correlations of predictor variables with
discriminant functions
Univariate F1,104
p
Control .57 16.01 *** Capacity ability .34 5.62 * Capacity effort .57 15.68 *** Capacity luck .47 10.76 ** Capacity powerful others .11 .58 Strategy ability - .29 4.16 * Strategy effort .13 .79 Strategy luck - .48 11.06 ** Strategy powerful others - .21 2.21 Strategy unknown - .55 14.66 ** Canonical R .57 Eigenvalue .47
* p < .05, ** p < .01 *** p < .001
The means for the significant predictors are shown in Table 8.9. This table
shows that the risers are more likely to think that they know how to succeed in
maths than the chronically low group. They are also less likely to attribute success
in mathematics to luck, feel more in control of their learning, be more confident
of their ability and the extent to which they can put in the required amount of
effort to succeed.
Table 8.9 Means of Significant Predictors for Chronically Low and Risers Groups; Primary School
Control Capacity effort
Strategy unknown
Strategy
luck
Chronically low 2.50 2.73 2.68 2.99 Risers 3.04 3.19 2.21 2.49
Chapter 8: Trajectories of perceived control
169
8.8 Gender differences
In order to investigate gender differences within groups, separate
discriminant analyses were conducted within each cluster using gender as the
predictor variable. No significant discriminant functions were obtained for the
risers group (χ2(10) = 15.60, p > .05), the consistently high group (χ2(10) = 15.13,
p > .05), or the chronically low group (χ2(10) = 16.64, p > .01). However for the
decliners group, a significant discriminant function was obtained, χ2(10) = 28.54,
p < .001.
Differences within the decliners group were found to be on the variables
Capacity ability and Capacity luck. Males were found to be likely to have
stronger beliefs in their own ability (female mean 3.16, male mean 3.47), while
females believed that they were luckier (female mean 3.20, male mean 2.96). The
univariate F-tests for each were significant (Capacity ability F1,105 = 9.81, p < .01,
Capacity luck F1,105 = 5.76, p < .05), and the correlations between the
discriminating variables and the discriminant function were .53 and -.41 for
Capacity ability and Capacity luck respectively.
8.9 Summary
In this chapter, it was hypothesised that sub-groups of students experienced
differences in perceived control over the transition to secondary school. Cluster
analysis using the combined perceived control variable was used as a means of
exploring the general school population sampled in this study to see if
homogeneous sub-groups were apparent. A four-cluster solution was developed
that produced groups which were thought to reflect the hypothesised sub-groups.
Chapter 8: Trajectories of perceived control
170
The labels for these groups: consistently high, decliners, risers and chronically low, reflect
the changes in perceived control beliefs of each of the groups over the transition
from primary to secondary school.
Discriminant analysis was then carried out using the separate perceived
control variables as predictor variables for cluster membership. A single
discriminant function was defined that separated the four groups, and the best
predictors were found to be Control, Capacity ability, Capacity effort, Capacity
luck and Strategy unknown. Students in the consistently high group were more
confident of their ability, the amount of effort they could put into their work and
the amount of control they had over their learning, while the chronically low group
were the least confident on these variables. In conjunction with this, these
students had the highest mean for Strategy unknown, indicating that perhaps
many of them don’t have strategies for success because they really don’t have any
idea about how to be successful.
Further discriminant analysis was then carried out in an attempt to find out
whether any of the perceived control variables would discriminate between i) the
consistently high and decliners groups and ii) the chronically low and the risers groups.
The best predictors between the chronically low and decliners groups were Capacity
ability, Capacity powerful others and Control, with the decliners group losing
confidence in all three over the transition to secondary school. The best
predictors between the chronically low and risers groups were found to be Capacity
effort, Capacity luck, Control, Strategy luck and Strategy unknown. The risers
group were more confident of their ability to work hard and be lucky by being
asked the right questions, while the chronically low group are less sure about the
Chapter 8: Trajectories of perceived control
171
strategies for success, but feel perhaps it may be due to luck, which they in turn
don’t feel they have.
Gender differences were only found in the decliners group, with males having
stronger beliefs in their own ability and females being more likely to believe that
their success was due to luck. In essence, the boys are saying “I am smart at
maths”, while the girls are saying “I am lucky in maths”. This could have
consequences further along the academic track; as boys are challenged
academically the belief in their own inherent ability may be enough to get them
over any hurdles, while girls challenged may feel threatened as they are only
relying on luck.
The next chapter examines the validity of the cluster solution by examining
the effects on the different variables and subscales over the transition to
secondary school. The cluster solution should be reflected in these other
subscales if the solution is to be deemed valid.
172
Chapter 9
Other trends within and between
clusters
9.1 Introduction
The major aim of this research was to identify changes in perceived control
beliefs among students over the period of transition to secondary school. It was
hypothesised that groups of students would exhibit differing trajectories of
perceived control over transition and the analysis of the previous chapter has
confirmed that these groups are clearly definable. This chapter provides an
examination of the validity of the cluster solution determined in the previous
chapter. It also looks at the trends within the defined groups and the trends
between the groups on a range of other variables for which data were collected in
this study.
9.2 Transition trends on other variables: Research questions
In order to assess the effect of transition on each group of students, and to
provide some evidence for the validity of the clustering solution, as advocated by
Aldenderfer and Blashfield (1984), means for variables other than perceived
control, both inter-group and intra-group, were examined. A number of
comparisons were also of interest at this stage of the data analysis. These
Chapter 9: Other trends within and between clusters
173
generated several subsidiary research questions, which guided the data analysis
for this chapter.
1. Are there significant differences between the four cluster groups on variables
other than perceived control?
2. If so, are the differences apparent at Grade 6, Year 7, or both?
3. Are there significant differences on these other variables between the
“consistently high” and “decliners” groups?
4. Are there significant differences on these other variables between the
“chronically low” and “risers” groups?
5. Are there the same changes over transition between the “consistently high”
and “decliners” groups?
6. Are there the same changes over transition between the “chronically low” and
“risers” groups?
9.3 Statistical tests conducted
In order to facilitate the discussion of the results for this part of the data
analysis, the statistical techniques used will be described in this section.
Multiple univariate ANOVAs were used to examine the differences between
groups, in order to answer research questions 1 and 2. Paired samples t-tests
were then used to determine whether significant changes had occurred on each
of the variables between time 2 and time 3; over the primary secondary transition,
which would answer questions 5 and 6. Finally, independent groups t-tests were
used to examine the differences between the consistently high and decliners groups
and between the chronically low and risers groups, to answer questions 3 and 4. For
all tests, a negative prefix means that the value of the mean for the second
element in the pair is higher than the mean for the first element. For example for
the chronically low versus risers comparisons, a negative value for the t-test indicates
that the value for the mean for the risers was higher than the mean for the
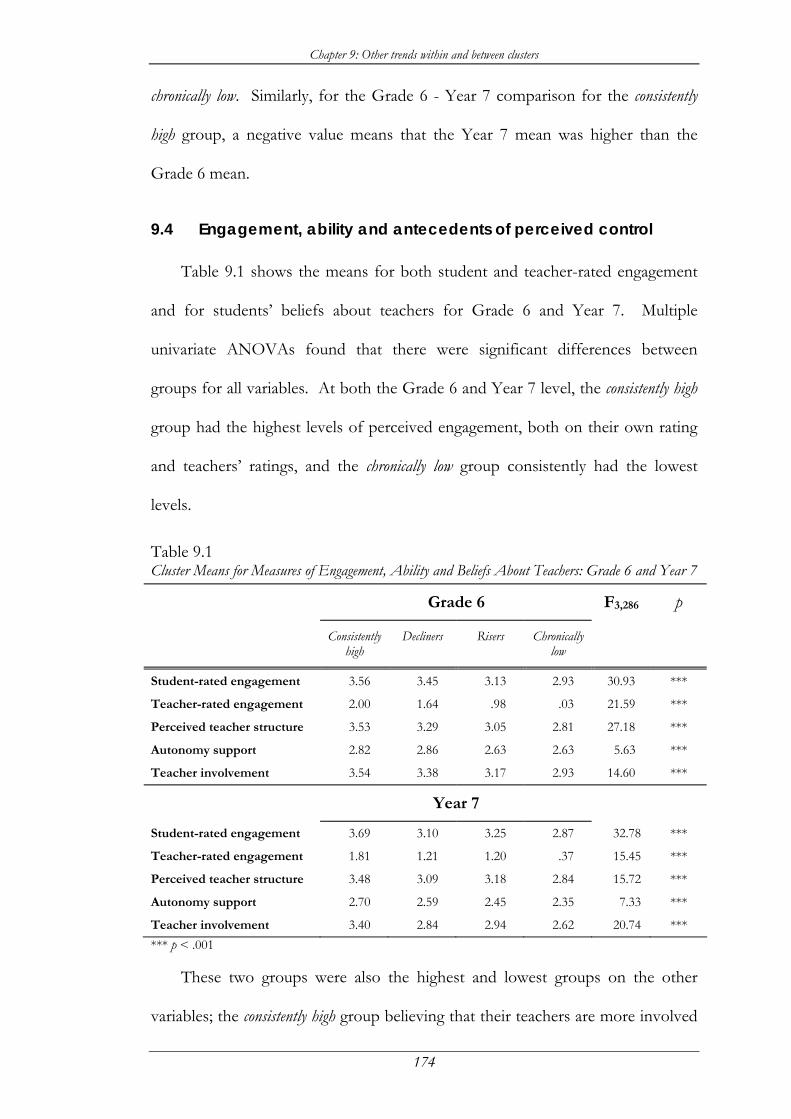
Chapter 9: Other trends within and between clusters
174
chronically low. Similarly, for the Grade 6 - Year 7 comparison for the consistently
high group, a negative value means that the Year 7 mean was higher than the
Grade 6 mean.
9.4 Engagement, ability and antecedents of perceived control
Table 9.1 shows the means for both student and teacher-rated engagement
and for students’ beliefs about teachers for Grade 6 and Year 7. Multiple
univariate ANOVAs found that there were significant differences between
groups for all variables. At both the Grade 6 and Year 7 level, the consistently high
group had the highest levels of perceived engagement, both on their own rating
and teachers’ ratings, and the chronically low group consistently had the lowest
levels.
Table 9.1 Cluster Means for Measures of Engagement, Ability and Beliefs About Teachers: Grade 6 and Year 7
Grade 6 F3,286 p
Consistently high
Decliners Risers Chronically low
Student-rated engagement 3.56 3.45 3.13 2.93 30.93 ***
Teacher-rated engagement 2.00 1.64 .98 .03 21.59 ***
Perceived teacher structure 3.53 3.29 3.05 2.81 27.18 ***
Autonomy support 2.82 2.86 2.63 2.63 5.63 ***
Teacher involvement 3.54 3.38 3.17 2.93 14.60 ***
Year 7
Student-rated engagement 3.69 3.10 3.25 2.87 32.78 ***
Teacher-rated engagement 1.81 1.21 1.20 .37 15.45 ***
Perceived teacher structure 3.48 3.09 3.18 2.84 15.72 ***
Autonomy support 2.70 2.59 2.45 2.35 7.33 ***
Teacher involvement 3.40 2.84 2.94 2.62 20.74 *** *** p < .001
These two groups were also the highest and lowest groups on the other
variables; the consistently high group believing that their teachers are more involved
Chapter 9: Other trends within and between clusters
175
with them, provide more autonomy support and more structure, and the
chronically low groups feeling more estranged from their teacher, less supported
and less structured. This finding is consistent with the findings of Skinner and
Belmont (1993), who found that teachers actually did respond more positively to
students who were perceived to be more engaged and motivated in ways that
would serve to increase this engagement. Conversely, students who are initially
passive and do not participate in class will be treated by their teachers in such a
way as to reinforce their problems; with less structure, less involvement and less
autonomy support.
It is the two groups who change during the transition that are of particular
interest here. On most of the variables the decliners’ beliefs have become more
negative while the risers’ beliefs have become more positive, indicating that the
groupings defined on perceived control are also reflected by these variables.
9.4.1 Differences betw een consistently high and decliners groups
Table 9.2 summarises the separate t-tests on these two groups. Independent
groups t-tests, testing for differences between the groups, found significant
differences between student-rated engagement at both Grade 6 and Year 7, and
for teacher-rated engagement at Year 7. The non-significance of difference of
the teacher’s rating of engagement between these two groups is important since it
demonstrates that it may not be until Year 7 that these differences become
readily apparent.
Students in the consistently high group felt that they had significantly more
structure provided by their teachers both in Grade 6 and 7, and that their teacher
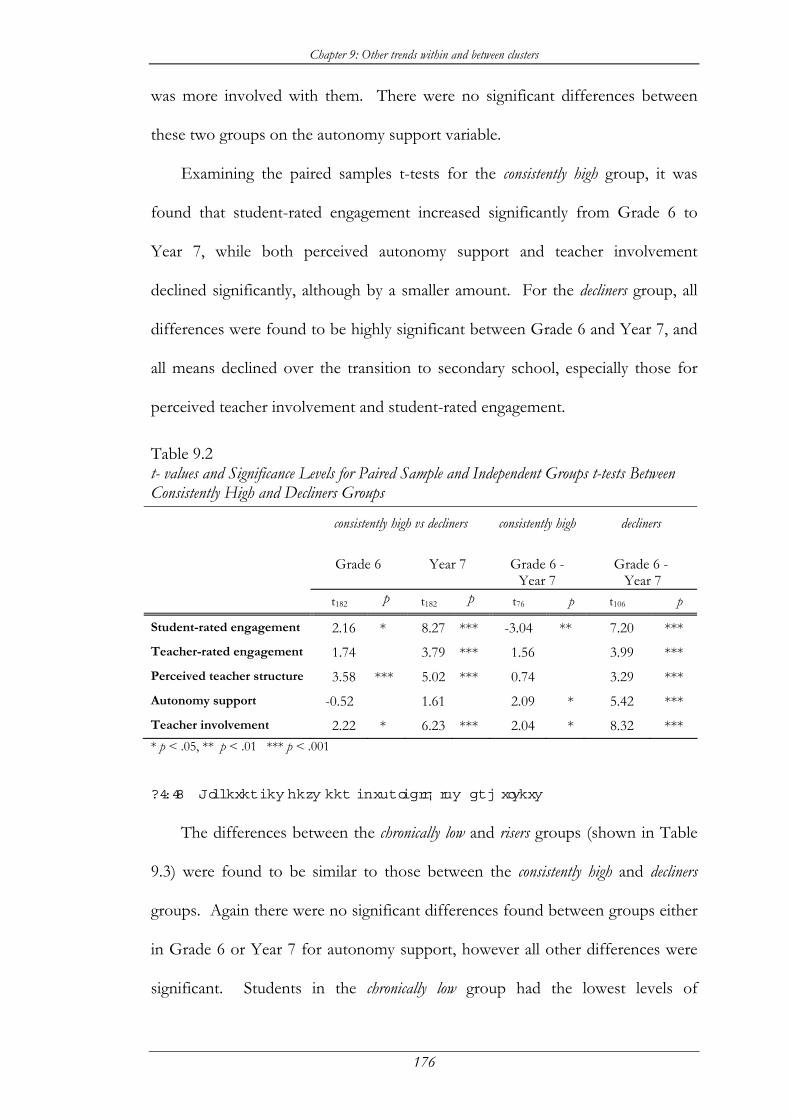
Chapter 9: Other trends within and between clusters
176
was more involved with them. There were no significant differences between
these two groups on the autonomy support variable.
Examining the paired samples t-tests for the consistently high group, it was
found that student-rated engagement increased significantly from Grade 6 to
Year 7, while both perceived autonomy support and teacher involvement
declined significantly, although by a smaller amount. For the decliners group, all
differences were found to be highly significant between Grade 6 and Year 7, and
all means declined over the transition to secondary school, especially those for
perceived teacher involvement and student-rated engagement.
Table 9.2 t- values and Significance Levels for Paired Sample and Independent Groups t-tests Between Consistently High and Decliners Groups
consistently high vs decliners consistently high decliners
Grade 6 Year 7 Grade 6 -
Year 7 Grade 6 - Year 7
t182 p t182 p t76 p t106 p
Student-rated engagement 2.16 * 8.27 *** -3.04 ** 7.20 *** Teacher-rated engagement 1.74 3.79 *** 1.56 3.99 *** Perceived teacher structure 3.58 *** 5.02 *** 0.74 3.29 *** Autonomy support -0.52 1.61 2.09 * 5.42 *** Teacher involvement 2.22 * 6.23 *** 2.04 * 8.32 *** * p < .05, ** p < .01 *** p < .001
9.4.2 Differences betw een chronically low and risers
The differences between the chronically low and risers groups (shown in Table
9.3) were found to be similar to those between the consistently high and decliners
groups. Again there were no significant differences found between groups either
in Grade 6 or Year 7 for autonomy support, however all other differences were
significant. Students in the chronically low group had the lowest levels of
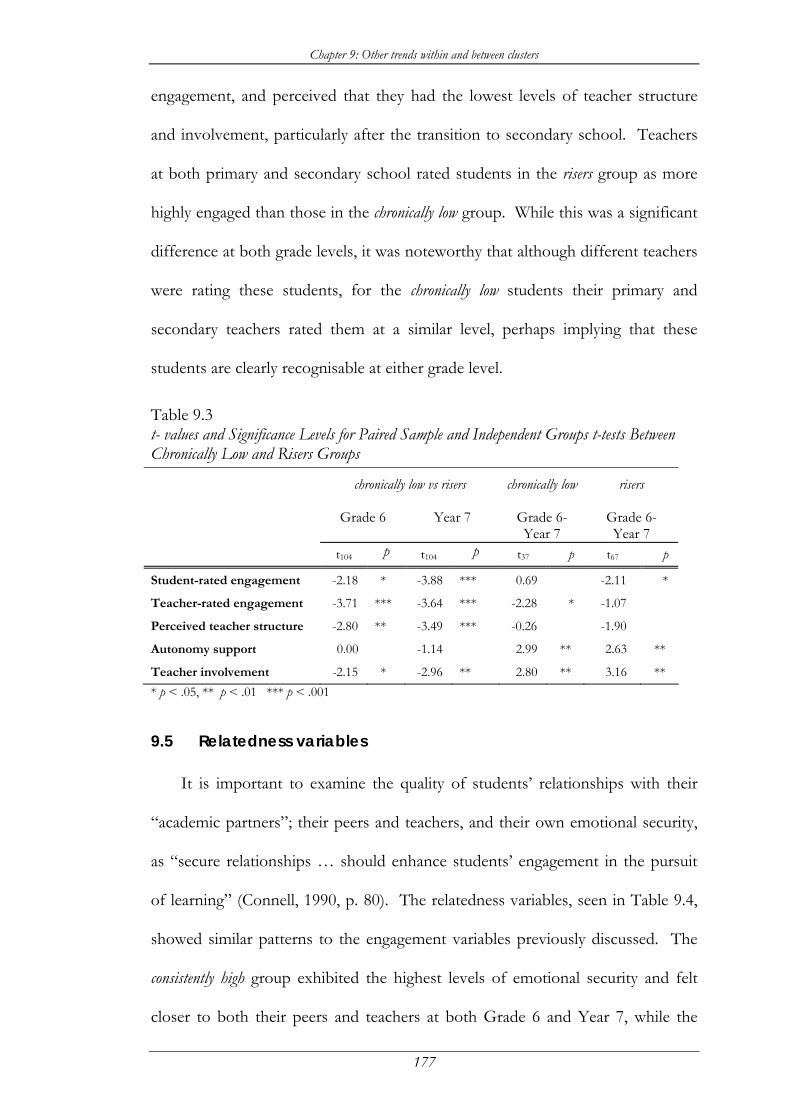
Chapter 9: Other trends within and between clusters
177
engagement, and perceived that they had the lowest levels of teacher structure
and involvement, particularly after the transition to secondary school. Teachers
at both primary and secondary school rated students in the risers group as more
highly engaged than those in the chronically low group. While this was a significant
difference at both grade levels, it was noteworthy that although different teachers
were rating these students, for the chronically low students their primary and
secondary teachers rated them at a similar level, perhaps implying that these
students are clearly recognisable at either grade level.
Table 9.3 t- values and Significance Levels for Paired Sample and Independent Groups t-tests Between Chronically Low and Risers Groups
chronically low vs risers chronically low risers
Grade 6 Year 7 Grade 6-Year 7
Grade 6- Year 7
t104 p t104 p t37 p t67 p
Student-rated engagement -2.18 * -3.88 *** 0.69 -2.11 *
Teacher-rated engagement -3.71 *** -3.64 *** -2.28 * -1.07
Perceived teacher structure -2.80 ** -3.49 *** -0.26 -1.90
Autonomy support 0.00 -1.14 2.99 ** 2.63 **
Teacher involvement -2.15 * -2.96 ** 2.80 ** 3.16 ** * p < .05, ** p < .01 *** p < .001
9.5 Relatedness variables
It is important to examine the quality of students’ relationships with their
“academic partners”; their peers and teachers, and their own emotional security,
as “secure relationships … should enhance students’ engagement in the pursuit
of learning” (Connell, 1990, p. 80). The relatedness variables, seen in Table 9.4,
showed similar patterns to the engagement variables previously discussed. The
consistently high group exhibited the highest levels of emotional security and felt
closer to both their peers and teachers at both Grade 6 and Year 7, while the

Chapter 9: Other trends within and between clusters
178
chronically low group had the lowest levels of each of these. These findings for
different groups extend those from previous research studies that have examined
relatedness to teachers and peers on a global level, and present formidable
problems for those students in the chronically low group. Midgley et al. (1989b)
found that valuing of mathematics increased for students moving to a supportive
school environment, which means that some of the students in the current study
will do well. Significant differences between groups were again found for all
variables at both grade levels.
Relatedness to peers remained strong through primary school and into
secondary school, however there were indications that the decliners group
experienced some difficulties in this area as they were the only group who
suffered a significant decline on this variable over transition.
Table 9.4 Cluster Means for Relatedness Variables: Grade 6 and Year 7
Grade 6 F3,286 p
Consistently high
Decliners Risers Chronically low
Relatedness to Self 3.20 3.00 2.79 2.57 10.06 ***
Relatedness to Peers 3.65 3.56 3.38 3.22 7.46 ***
Relatedness to Teachers 3.33 3.01 2.74 2.47 21.33 ***
Year 7
Relatedness to Self 3.34 2.96 3.03 2.61 11.06 ***
Relatedness to Peers 3.61 3.42 3.51 3.21 4.01 **
Relatedness to Teachers 3.49 2.79 2.98 2.39 34.26 *** ** p < .01, *** p < .001
9.5.1 Differences betw een consistently high and decliners groups
The results of the t-tests examining differences between these two groups
are shown in Table 9.5. Emotional security, measured by the relatedness to self
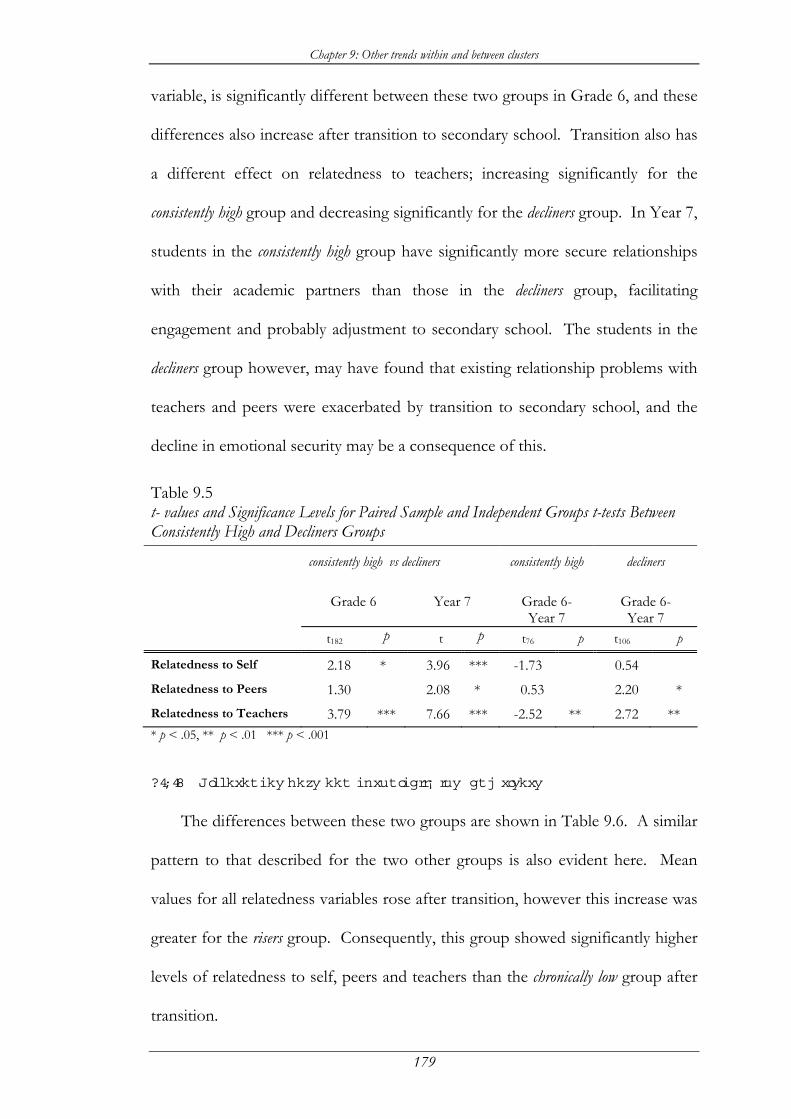
Chapter 9: Other trends within and between clusters
179
variable, is significantly different between these two groups in Grade 6, and these
differences also increase after transition to secondary school. Transition also has
a different effect on relatedness to teachers; increasing significantly for the
consistently high group and decreasing significantly for the decliners group. In Year 7,
students in the consistently high group have significantly more secure relationships
with their academic partners than those in the decliners group, facilitating
engagement and probably adjustment to secondary school. The students in the
decliners group however, may have found that existing relationship problems with
teachers and peers were exacerbated by transition to secondary school, and the
decline in emotional security may be a consequence of this.
Table 9.5 t- values and Significance Levels for Paired Sample and Independent Groups t-tests Between Consistently High and Decliners Groups
consistently high vs decliners consistently high
decliners
Grade 6 Year 7 Grade 6-
Year 7 Grade 6- Year 7
t182 p t p t76 p t106 p
Relatedness to Self 2.18 * 3.96 *** -1.73 0.54 Relatedness to Peers 1.30 2.08 * 0.53 2.20 * Relatedness to Teachers 3.79 *** 7.66 *** -2.52 ** 2.72 ** * p < .05, ** p < .01 *** p < .001
9.5.2 Differences betw een chronically low and risers
The differences between these two groups are shown in Table 9.6. A similar
pattern to that described for the two other groups is also evident here. Mean
values for all relatedness variables rose after transition, however this increase was
greater for the risers group. Consequently, this group showed significantly higher
levels of relatedness to self, peers and teachers than the chronically low group after
transition.
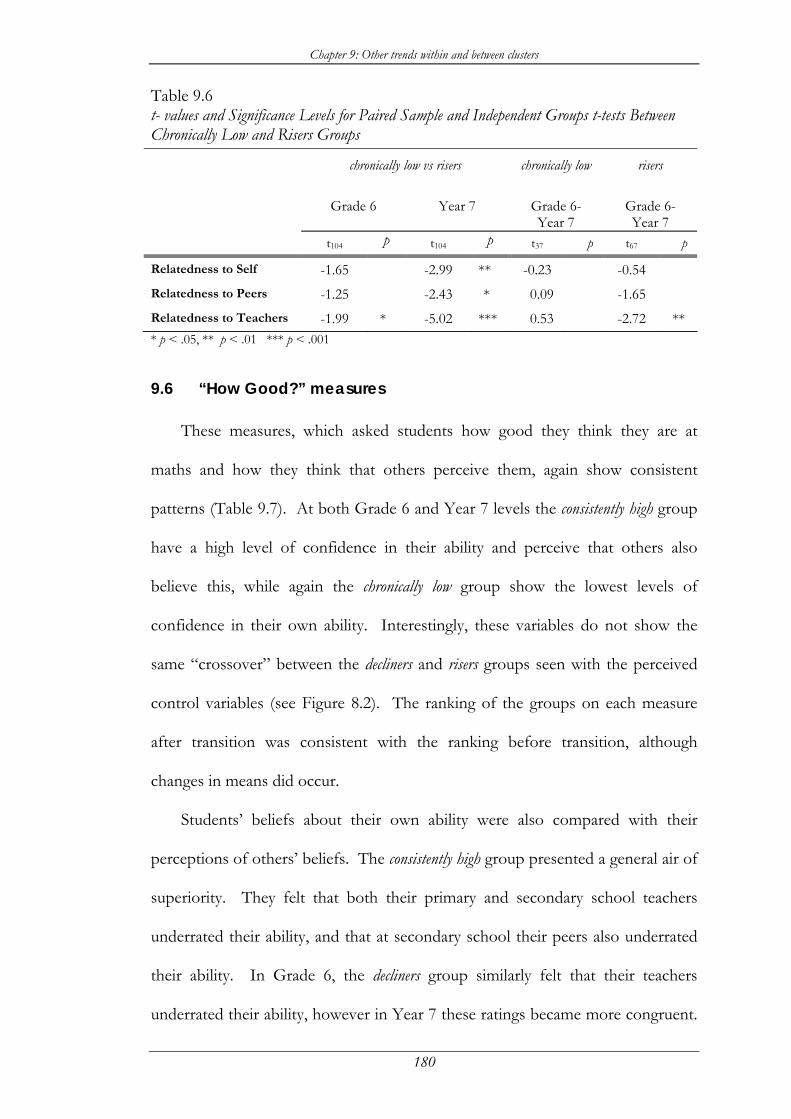
Chapter 9: Other trends within and between clusters
180
Table 9.6 t- values and Significance Levels for Paired Sample and Independent Groups t-tests Between Chronically Low and Risers Groups
chronically low vs risers chronically low risers
Grade 6 Year 7 Grade 6-
Year 7 Grade 6- Year 7
t104 p t104 p t37 p t67 p
Relatedness to Self -1.65 -2.99 ** -0.23 -0.54 Relatedness to Peers -1.25 -2.43 * 0.09 -1.65 Relatedness to Teachers -1.99 * -5.02 *** 0.53 -2.72 ** * p < .05, ** p < .01 *** p < .001
9.6 “How Good?” measures
These measures, which asked students how good they think they are at
maths and how they think that others perceive them, again show consistent
patterns (Table 9.7). At both Grade 6 and Year 7 levels the consistently high group
have a high level of confidence in their ability and perceive that others also
believe this, while again the chronically low group show the lowest levels of
confidence in their own ability. Interestingly, these variables do not show the
same “crossover” between the decliners and risers groups seen with the perceived
control variables (see Figure 8.2). The ranking of the groups on each measure
after transition was consistent with the ranking before transition, although
changes in means did occur.
Students’ beliefs about their own ability were also compared with their
perceptions of others’ beliefs. The consistently high group presented a general air of
superiority. They felt that both their primary and secondary school teachers
underrated their ability, and that at secondary school their peers also underrated
their ability. In Grade 6, the decliners group similarly felt that their teachers
underrated their ability, however in Year 7 these ratings became more congruent.
Chapter 9: Other trends within and between clusters
181
Significant differences were apparent though in perceptions about parents’
beliefs. This group felt that their parents would rate them more highly either
than they would rate themselves, or that their teachers or classmates would rate
them. This conflict could possibly be damaging to students’ self esteem or level
of anxiety, as they attempt to reconcile their parents’ expectations and their
beliefs about their own ability. It may also give rise to feelings of being an
“impostor”, that is not being as good as others think that you are.
The risers group also felt that their parents would rate them more highly than
their teachers or classmates, however this perception is congruent with the
students’ perceptions of themselves, and so the conflict described for the decliners
group is unlikely to affect this group. This group may instead feel that their
parents have confidence in them, and so feel supported. Sadly perhaps for the
chronically low group, their perceptions are all congruent; they not only rate
themselves at a fairly low level, but they believe that their parents, teachers and
peers would all rate them at a similar level. These students feel that “I’m not very
good at maths, and everyone agrees with me”, and if they also believe that
success in maths is mainly due to ability, is there any incentive for them to try any
harder, or to continue in mathematics past the compulsory level?
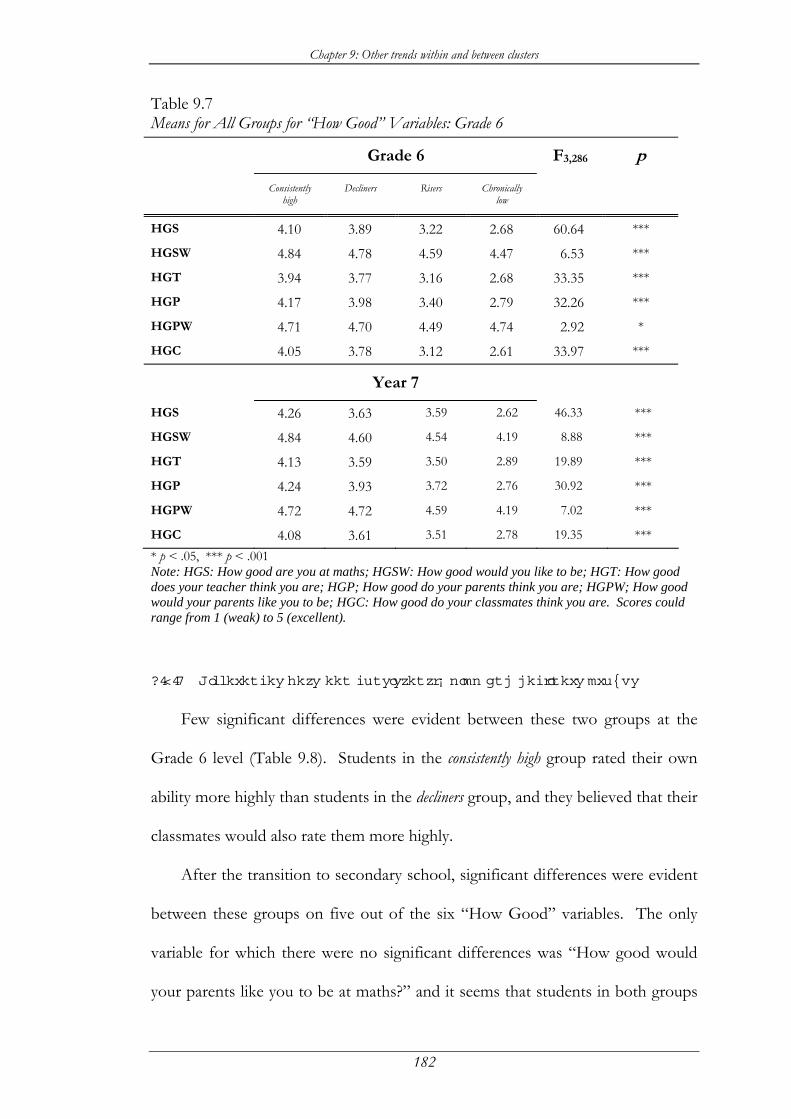
Chapter 9: Other trends within and between clusters
182
Table 9.7 Means for All Groups for “How Good” Variables: Grade 6
Grade 6 F3,286 p
Consistently high
Decliners Risers Chronically low
HGS 4.10 3.89 3.22 2.68 60.64 ***
HGSW 4.84 4.78 4.59 4.47 6.53 ***
HGT 3.94 3.77 3.16 2.68 33.35 ***
HGP 4.17 3.98 3.40 2.79 32.26 ***
HGPW 4.71 4.70 4.49 4.74 2.92 *
HGC 4.05 3.78 3.12 2.61 33.97 ***
Year 7
HGS 4.26 3.63 3.59 2.62 46.33 ***
HGSW 4.84 4.60 4.54 4.19 8.88 ***
HGT 4.13 3.59 3.50 2.89 19.89 ***
HGP 4.24 3.93 3.72 2.76 30.92 ***
HGPW 4.72 4.72 4.59 4.19 7.02 ***
HGC 4.08 3.61 3.51 2.78 19.35 *** * p < .05, *** p < .001 Note: HGS: How good are you at maths; HGSW: How good would you like to be; HGT: How good does your teacher think you are; HGP; How good do your parents think you are; HGPW; How good would your parents like you to be; HGC: How good do your classmates think you are. Scores could range from 1 (weak) to 5 (excellent).
9.6.1 Differences betw een consistently high and decliners groups
Few significant differences were evident between these two groups at the
Grade 6 level (Table 9.8). Students in the consistently high group rated their own
ability more highly than students in the decliners group, and they believed that their
classmates would also rate them more highly.
After the transition to secondary school, significant differences were evident
between these groups on five out of the six “How Good” variables. The only
variable for which there were no significant differences was “How good would
your parents like you to be at maths?” and it seems that students in both groups
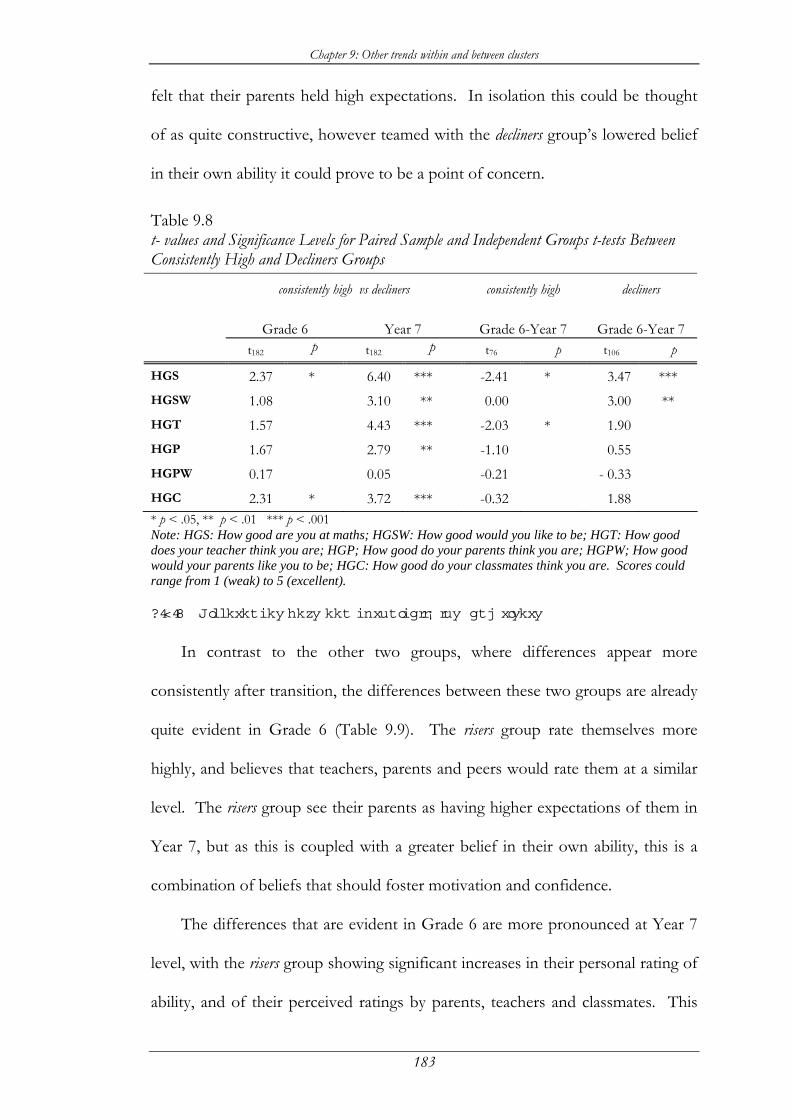
Chapter 9: Other trends within and between clusters
183
felt that their parents held high expectations. In isolation this could be thought
of as quite constructive, however teamed with the decliners group’s lowered belief
in their own ability it could prove to be a point of concern.
Table 9.8 t- values and Significance Levels for Paired Sample and Independent Groups t-tests Between Consistently High and Decliners Groups
consistently high vs decliners consistently high decliners
Grade 6 Year 7 Grade 6-Year 7 Grade 6-Year 7
t182 p t182 p t76 p t106 p
HGS 2.37 * 6.40 *** -2.41 * 3.47 *** HGSW 1.08 3.10 ** 0.00 3.00 ** HGT 1.57 4.43 *** -2.03 * 1.90 HGP 1.67 2.79 ** -1.10 0.55 HGPW 0.17 0.05 -0.21 - 0.33 HGC 2.31 * 3.72 *** -0.32 1.88 * p < .05, ** p < .01 *** p < .001 Note: HGS: How good are you at maths; HGSW: How good would you like to be; HGT: How good does your teacher think you are; HGP; How good do your parents think you are; HGPW; How good would your parents like you to be; HGC: How good do your classmates think you are. Scores could range from 1 (weak) to 5 (excellent).
9.6.2 Differences betw een chronically low and risers
In contrast to the other two groups, where differences appear more
consistently after transition, the differences between these two groups are already
quite evident in Grade 6 (Table 9.9). The risers group rate themselves more
highly, and believes that teachers, parents and peers would rate them at a similar
level. The risers group see their parents as having higher expectations of them in
Year 7, but as this is coupled with a greater belief in their own ability, this is a
combination of beliefs that should foster motivation and confidence.
The differences that are evident in Grade 6 are more pronounced at Year 7
level, with the risers group showing significant increases in their personal rating of
ability, and of their perceived ratings by parents, teachers and classmates. This
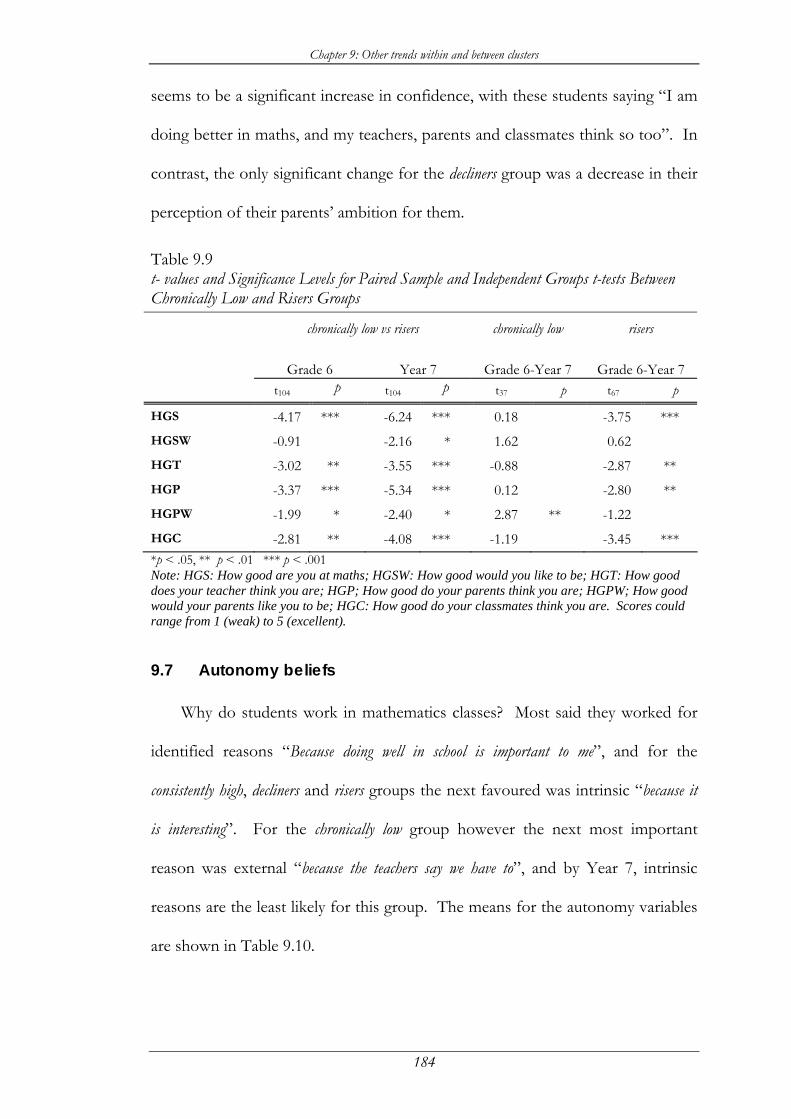
Chapter 9: Other trends within and between clusters
184
seems to be a significant increase in confidence, with these students saying “I am
doing better in maths, and my teachers, parents and classmates think so too”. In
contrast, the only significant change for the decliners group was a decrease in their
perception of their parents’ ambition for them.
Table 9.9 t- values and Significance Levels for Paired Sample and Independent Groups t-tests Between Chronically Low and Risers Groups
chronically low vs risers chronically low risers
Grade 6 Year 7 Grade 6-Year 7 Grade 6-Year 7
t104 p t104 p t37 p t67 p
HGS -4.17 *** -6.24 *** 0.18 -3.75 *** HGSW -0.91 -2.16 * 1.62 0.62 HGT -3.02 ** -3.55 *** -0.88 -2.87 ** HGP -3.37 *** -5.34 *** 0.12 -2.80 ** HGPW -1.99 * -2.40 * 2.87 ** -1.22 HGC -2.81 ** -4.08 *** -1.19 -3.45 *** *p < .05, ** p < .01 *** p < .001 Note: HGS: How good are you at maths; HGSW: How good would you like to be; HGT: How good does your teacher think you are; HGP; How good do your parents think you are; HGPW; How good would your parents like you to be; HGC: How good do your classmates think you are. Scores could range from 1 (weak) to 5 (excellent).
9.7 Autonomy beliefs
Why do students work in mathematics classes? Most said they worked for
identified reasons “Because doing well in school is important to me”, and for the
consistently high, decliners and risers groups the next favoured was intrinsic “because it
is interesting”. For the chronically low group however the next most important
reason was external “because the teachers say we have to”, and by Year 7, intrinsic
reasons are the least likely for this group. The means for the autonomy variables
are shown in Table 9.10.

Chapter 9: Other trends within and between clusters
185
Table 9.10 Means for All Groups for Autonomy Variables: Grade 6 and Year 7
Grade 6 F3,286 p
Consistently high
Decliners Risers Chronically low
External 1.81 1.91 2.43 2.71 10.70 ***
Identified 3.83 3.71 3.36 3.20 16.68 ***
Intrinsic 3.26 2.90 2.45 2.40 20.19 ***
Introjected 1.98 1.97 2.15 2.24 1.32 Year 7
External 1.94 2.41 2.21 2.72 7.78 ***
Identified 3.89 3.45 3.46 3.09 16.63 ***
Intrinsic 3.40 2.53 2.57 2.26 24.75 ***
Introjected 2.09 2.15 2.00 2.41 1.98 * p < .05, ** p < .01 *** p < .001
9.7.1 Differences betw een consistently high and decliners groups
At Grade 6 level, the consistently high students were significantly more likely to
work for intrinsic reasons, and the beliefs of this group of students did not alter
on transition to secondary school (Table 9.11). The decliners however suffered a
significant decrease in intrinsic and identified motivation and a significant
increase in external motivation, so that in Year 7 the two groups were separable
on all but introjected reasons.
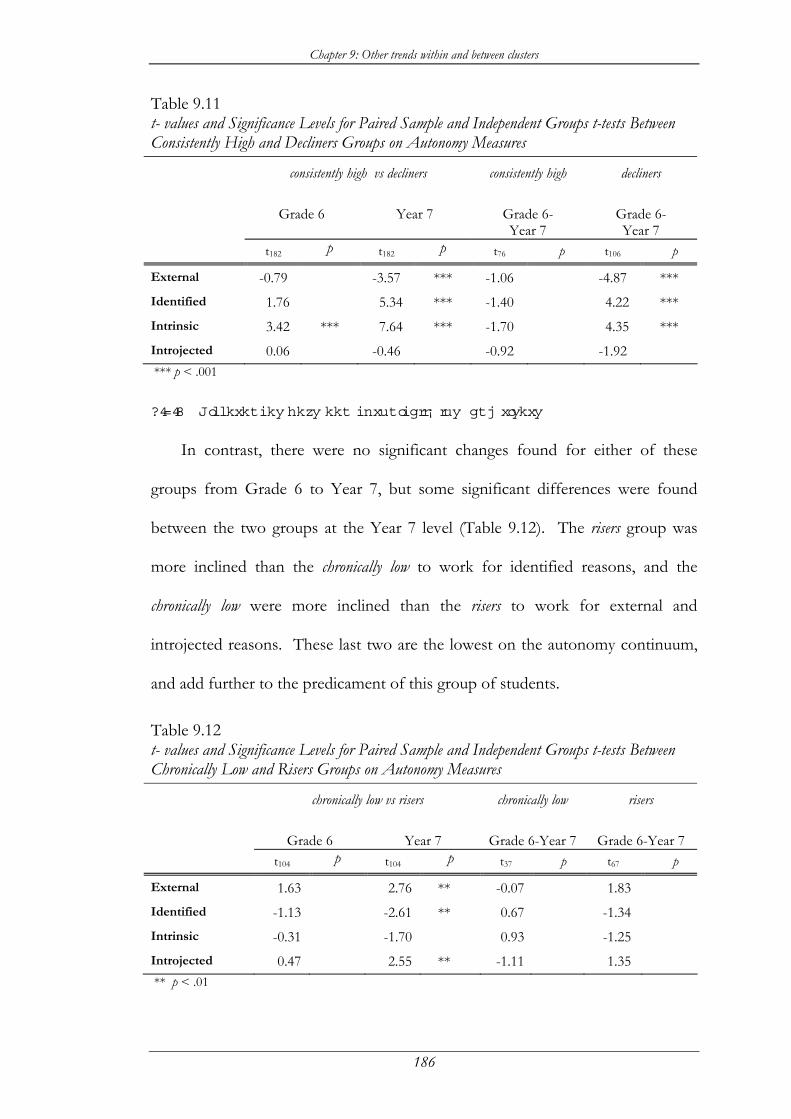
Chapter 9: Other trends within and between clusters
186
Table 9.11 t- values and Significance Levels for Paired Sample and Independent Groups t-tests Between Consistently High and Decliners Groups on Autonomy Measures
consistently high vs decliners consistently high decliners
Grade 6 Year 7 Grade 6-
Year 7 Grade 6- Year 7
t182 p t182 p t76 p t106 p
External -0.79 -3.57 *** -1.06 -4.87 *** Identified 1.76 5.34 *** -1.40 4.22 *** Intrinsic 3.42 *** 7.64 *** -1.70 4.35 *** Introjected 0.06 -0.46 -0.92 -1.92 *** p < .001
9.7.2 Differences betw een chronically low and risers
In contrast, there were no significant changes found for either of these
groups from Grade 6 to Year 7, but some significant differences were found
between the two groups at the Year 7 level (Table 9.12). The risers group was
more inclined than the chronically low to work for identified reasons, and the
chronically low were more inclined than the risers to work for external and
introjected reasons. These last two are the lowest on the autonomy continuum,
and add further to the predicament of this group of students.
Table 9.12 t- values and Significance Levels for Paired Sample and Independent Groups t-tests Between Chronically Low and Risers Groups on Autonomy Measures
chronically low vs risers chronically low risers
Grade 6 Year 7 Grade 6-Year 7 Grade 6-Year 7
t104 p t104 p t37 p t67 p
External 1.63 2.76 ** -0.07 1.83 Identified -1.13 -2.61 ** 0.67 -1.34 Intrinsic -0.31 -1.70 0.93 -1.25 Introjected 0.47 2.55 ** -1.11 1.35 ** p < .01
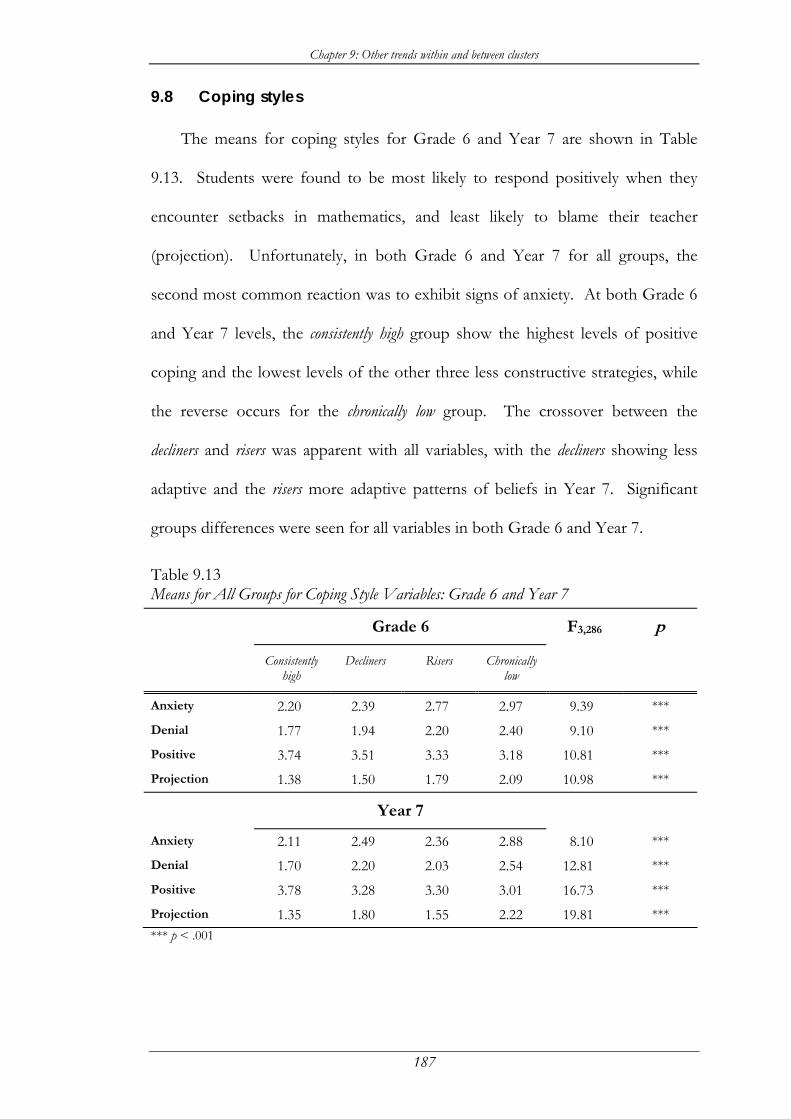
Chapter 9: Other trends within and between clusters
187
9.8 Coping styles
The means for coping styles for Grade 6 and Year 7 are shown in Table
9.13. Students were found to be most likely to respond positively when they
encounter setbacks in mathematics, and least likely to blame their teacher
(projection). Unfortunately, in both Grade 6 and Year 7 for all groups, the
second most common reaction was to exhibit signs of anxiety. At both Grade 6
and Year 7 levels, the consistently high group show the highest levels of positive
coping and the lowest levels of the other three less constructive strategies, while
the reverse occurs for the chronically low group. The crossover between the
decliners and risers was apparent with all variables, with the decliners showing less
adaptive and the risers more adaptive patterns of beliefs in Year 7. Significant
groups differences were seen for all variables in both Grade 6 and Year 7.
Table 9.13 Means for All Groups for Coping Style Variables: Grade 6 and Year 7
Grade 6 F3,286 p
Consistently high
Decliners Risers Chronically low
Anxiety 2.20 2.39 2.77 2.97 9.39 ***
Denial 1.77 1.94 2.20 2.40 9.10 ***
Positive 3.74 3.51 3.33 3.18 10.81 ***
Projection 1.38 1.50 1.79 2.09 10.98 ***
Year 7
Anxiety 2.11 2.49 2.36 2.88 8.10 ***
Denial 1.70 2.20 2.03 2.54 12.81 ***
Positive 3.78 3.28 3.30 3.01 16.73 ***
Projection 1.35 1.80 1.55 2.22 19.81 *** *** p < .001
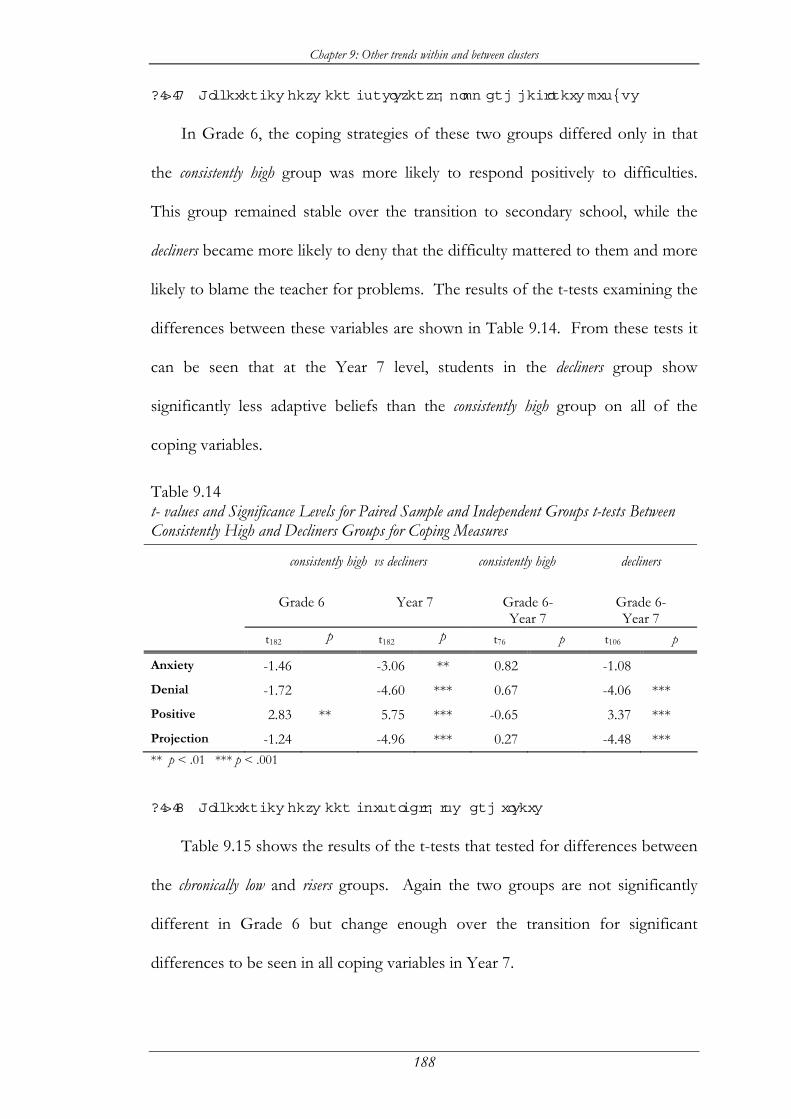
Chapter 9: Other trends within and between clusters
188
9.8.1 Differences betw een consistently high and decliners groups
In Grade 6, the coping strategies of these two groups differed only in that
the consistently high group was more likely to respond positively to difficulties.
This group remained stable over the transition to secondary school, while the
decliners became more likely to deny that the difficulty mattered to them and more
likely to blame the teacher for problems. The results of the t-tests examining the
differences between these variables are shown in Table 9.14. From these tests it
can be seen that at the Year 7 level, students in the decliners group show
significantly less adaptive beliefs than the consistently high group on all of the
coping variables.
Table 9.14 t- values and Significance Levels for Paired Sample and Independent Groups t-tests Between Consistently High and Decliners Groups for Coping Measures
consistently high vs decliners consistently high decliners
Grade 6 Year 7 Grade 6-
Year 7 Grade 6- Year 7
t182 p t182 p t76 p t106 p
Anxiety -1.46 -3.06 ** 0.82 -1.08 Denial -1.72 -4.60 *** 0.67 -4.06 *** Positive 2.83 ** 5.75 *** -0.65 3.37 *** Projection -1.24 -4.96 *** 0.27 -4.48 *** ** p < .01 *** p < .001
9.8.2 Differences betw een chronically low and risers
Table 9.15 shows the results of the t-tests that tested for differences between
the chronically low and risers groups. Again the two groups are not significantly
different in Grade 6 but change enough over the transition for significant
differences to be seen in all coping variables in Year 7.
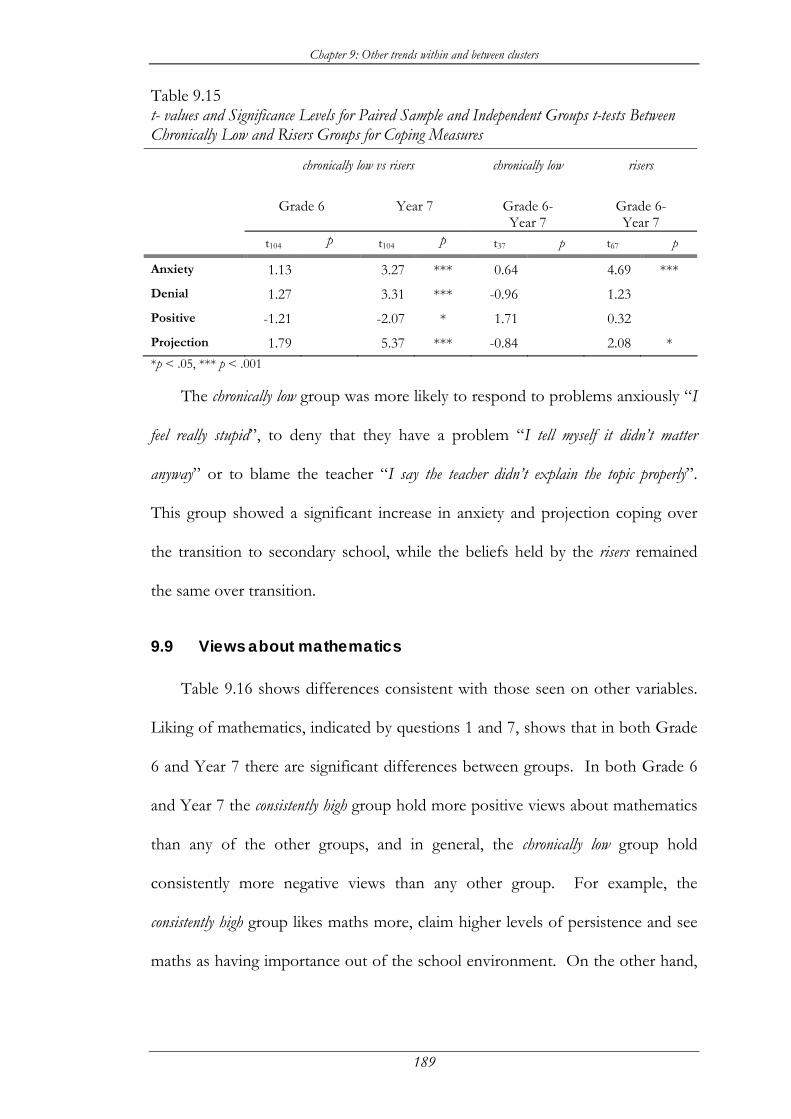
Chapter 9: Other trends within and between clusters
189
Table 9.15 t- values and Significance Levels for Paired Sample and Independent Groups t-tests Between Chronically Low and Risers Groups for Coping Measures
chronically low vs risers chronically low risers
Grade 6 Year 7 Grade 6-
Year 7 Grade 6- Year 7
t104 p t104 p t37 p t67 p
Anxiety 1.13 3.27 *** 0.64 4.69 *** Denial 1.27 3.31 *** -0.96 1.23 Positive -1.21 -2.07 * 1.71 0.32 Projection 1.79 5.37 *** -0.84 2.08 * *p < .05, *** p < .001
The chronically low group was more likely to respond to problems anxiously “I
feel really stupid”, to deny that they have a problem “I tell myself it didn’t matter
anyway” or to blame the teacher “I say the teacher didn’t explain the topic properly”.
This group showed a significant increase in anxiety and projection coping over
the transition to secondary school, while the beliefs held by the risers remained
the same over transition.
9.9 Views about mathematics
Table 9.16 shows differences consistent with those seen on other variables.
Liking of mathematics, indicated by questions 1 and 7, shows that in both Grade
6 and Year 7 there are significant differences between groups. In both Grade 6
and Year 7 the consistently high group hold more positive views about mathematics
than any of the other groups, and in general, the chronically low group hold
consistently more negative views than any other group. For example, the
consistently high group likes maths more, claim higher levels of persistence and see
maths as having importance out of the school environment. On the other hand,
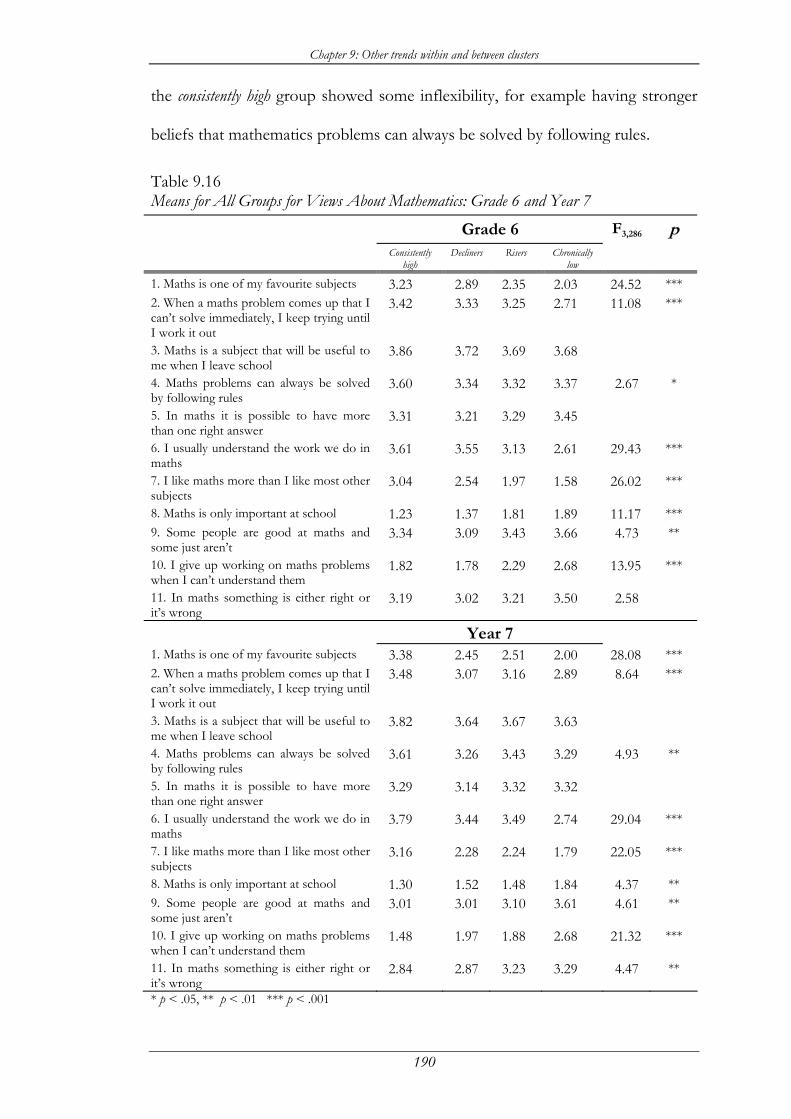
Chapter 9: Other trends within and between clusters
190
the consistently high group showed some inflexibility, for example having stronger
beliefs that mathematics problems can always be solved by following rules.
Table 9.16 Means for All Groups for Views About Mathematics: Grade 6 and Year 7 Grade 6 F3,286 p Consistently
high Decliners Risers Chronically
low
1. Maths is one of my favourite subjects 3.23 2.89 2.35 2.03 24.52 *** 2. When a maths problem comes up that I can’t solve immediately, I keep trying until I work it out
3.42 3.33 3.25 2.71 11.08 ***
3. Maths is a subject that will be useful to me when I leave school
3.86 3.72 3.69 3.68
4. Maths problems can always be solved by following rules
3.60 3.34 3.32 3.37 2.67 *
5. In maths it is possible to have more than one right answer
3.31 3.21 3.29 3.45
6. I usually understand the work we do in maths
3.61 3.55 3.13 2.61 29.43 ***
7. I like maths more than I like most other subjects
3.04 2.54 1.97 1.58 26.02 ***
8. Maths is only important at school 1.23 1.37 1.81 1.89 11.17 *** 9. Some people are good at maths and some just aren’t
3.34 3.09 3.43 3.66 4.73 **
10. I give up working on maths problems when I can’t understand them
1.82 1.78 2.29 2.68 13.95 ***
11. In maths something is either right or it’s wrong
3.19 3.02 3.21 3.50 2.58
Year 7 1. Maths is one of my favourite subjects 3.38 2.45 2.51 2.00 28.08 *** 2. When a maths problem comes up that I can’t solve immediately, I keep trying until I work it out
3.48 3.07 3.16 2.89 8.64 ***
3. Maths is a subject that will be useful to me when I leave school
3.82 3.64 3.67 3.63
4. Maths problems can always be solved by following rules
3.61 3.26 3.43 3.29 4.93 **
5. In maths it is possible to have more than one right answer
3.29 3.14 3.32 3.32
6. I usually understand the work we do in maths
3.79 3.44 3.49 2.74 29.04 ***
7. I like maths more than I like most other subjects
3.16 2.28 2.24 1.79 22.05 ***
8. Maths is only important at school 1.30 1.52 1.48 1.84 4.37 ** 9. Some people are good at maths and some just aren’t
3.01 3.01 3.10 3.61 4.61 **
10. I give up working on maths problems when I can’t understand them
1.48 1.97 1.88 2.68 21.32 ***
11. In maths something is either right or it’s wrong
2.84 2.87 3.23 3.29 4.47 **
* p < .05, ** p < .01 *** p < .001
Chapter 9: Other trends within and between clusters
191
The chronically low group hold some particularly debilitating views about
mathematics, in particular the belief that “some people are good at maths and
some just aren’t”, coupled with a viewpoint that states “I’m not very smart at
maths”. Belief in innate ability in subjects such as mathematics, and the
concurrent belief that one does not possess this innate ability, means that there is
really no incentive to try any harder, since without ability success is impossible.
9.9.1 Differences betw een consistently high and decliners groups
Table 9.17 shows the differences between the consistently high and the decliners
groups. There are few differences between the groups in Grade 6, one of the few
being that the consistently high group generally like mathematics more, however in
Year 7 there are many more differences. Decliners are more likely to believe in the
importance of mathematics to their lives, they are less persistent and less
confident, however the consistently high group are far more likely to say that
“mathematics problems can always be solved by following rules”.
After transition, students in the consistently high group feel that they
understand and like mathematics more and they are less likely to believe in innate
ability. The differences for the decliners group are negative: they like mathematics
less and feel they are less persistent.
Chapter 9: Other trends within and between clusters
192
Table 9.17 t- values and Significance Levels for Paired Sample and Independent Groups t-tests Between Consistently High and Decliners Groups for “Views About Mathematics” Measures consistently high vs decliners consistently high decliners
Grade 6 Year 7 Grade 6-
Year 7 Grade 6- Year 7
t182 p t182 p t76 p t106 p
1. Maths is one of my favourite subjects
2.73 ** 7.45 *** -1.42 4.72 ***
2. When a maths problem comes up that I can’t solve immediately, I keep trying until I work it out
0.88 4.42 *** -0.73 3.47 ***
3. Maths is a subject that will be useful to me when I leave school
1.71 2.21 * 0.77 1.38
4. Maths problems can always be solved by following rules
2.53 * 3.64 *** -0.14 0.82
5. In maths it is possible to have more than one right answer
0.66 1.02 0.18 0.67
6. I usually understand the work we do in maths
0.67 4.30 *** -2.56 ** 1.62
7. I like maths more than I like most other subjects
3.30 *** 6.10 *** -0.90 2.46 *
8. Maths is only important at school
-1.50 -2.20 * -0.80 -1.88
9. Some people are good at maths and some just aren’t
1.79 0.00 2.47 ** 0.80
10. I give up working on maths problems when I can’t understand them
0.37 -4.48 *** 2.94 ** -2.15 *
11. In maths something is either right or it’s wrong
1.20 -0.17 2.74 ** 1.44
* p < .05, ** p < .01 *** p < .001
9.9.2 Differences betw een chronically low and risers
In Table 9.18 the differences between the chronically low and the risers groups
are shown. These are again differences mainly in liking of mathematics,
persistence and confidence, with the risers group showing more adaptive beliefs.
After transition to secondary school, these problems become more obvious.
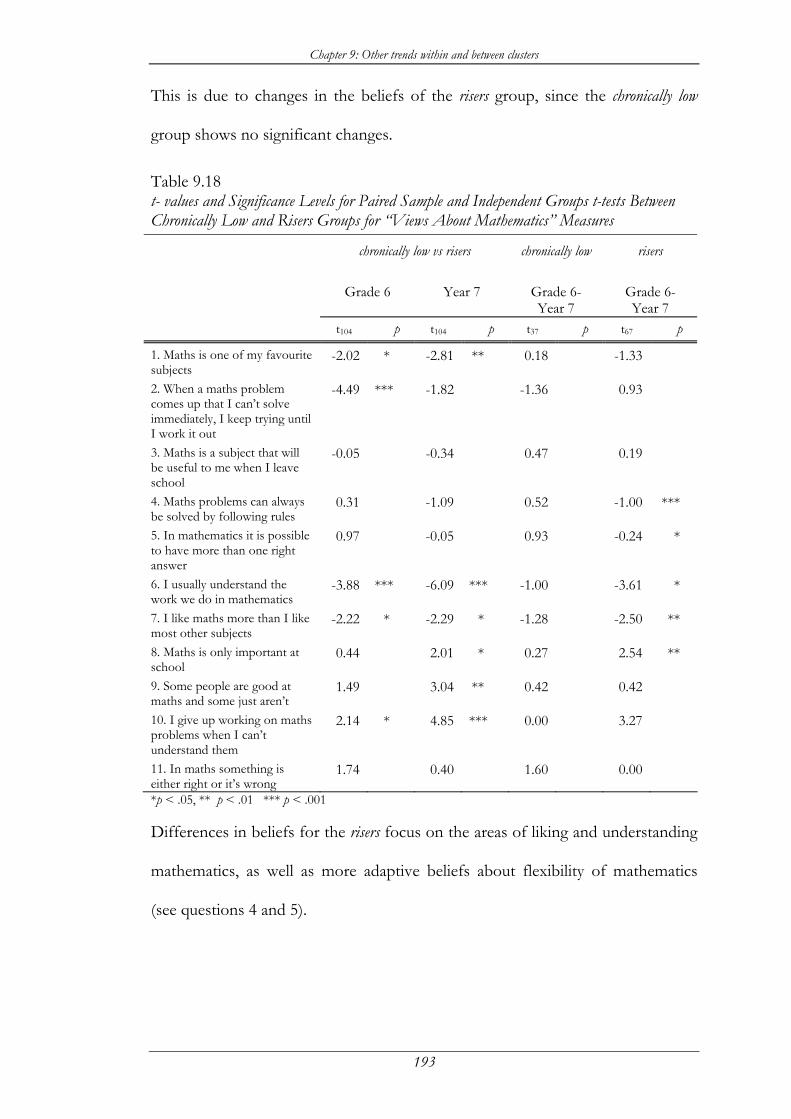
Chapter 9: Other trends within and between clusters
193
This is due to changes in the beliefs of the risers group, since the chronically low
group shows no significant changes.
Table 9.18 t- values and Significance Levels for Paired Sample and Independent Groups t-tests Between Chronically Low and Risers Groups for “Views About Mathematics” Measures chronically low vs risers chronically low risers
Grade 6 Year 7 Grade 6-
Year 7 Grade 6- Year 7
t104 p t104 p t37 p t67 p
1. Maths is one of my favourite subjects
-2.02 * -2.81 ** 0.18 -1.33
2. When a maths problem comes up that I can’t solve immediately, I keep trying until I work it out
-4.49 *** -1.82 -1.36 0.93
3. Maths is a subject that will be useful to me when I leave school
-0.05 -0.34 0.47 0.19
4. Maths problems can always be solved by following rules
0.31 -1.09 0.52 -1.00 ***
5. In mathematics it is possible to have more than one right answer
0.97 -0.05 0.93 -0.24 *
6. I usually understand the work we do in mathematics
-3.88 *** -6.09 *** -1.00 -3.61 *
7. I like maths more than I like most other subjects
-2.22 * -2.29 * -1.28 -2.50 **
8. Maths is only important at school
0.44 2.01 * 0.27 2.54 **
9. Some people are good at maths and some just aren’t
1.49 3.04 ** 0.42 0.42
10. I give up working on maths problems when I can’t understand them
2.14 * 4.85 *** 0.00 3.27
11. In maths something is either right or it’s wrong
1.74 0.40 1.60 0.00
*p < .05, ** p < .01 *** p < .001
Differences in beliefs for the risers focus on the areas of liking and understanding
mathematics, as well as more adaptive beliefs about flexibility of mathematics
(see questions 4 and 5).
Chapter 9: Other trends within and between clusters
194
9.10 Summary
In order to provide evidence for the validity of the clustering solution,
means were examined for other variables to see if the same between-group
differences existed. There were found to be significant between-group
differences on most variables examined. In all cases, the consistently high group
held the most constructive views, while the chronically low group held the most
damaging views in terms of motivation and engagement. It was clear from the
data analysis conducted so far that if there were significant between-group
differences, these would almost inevitably be apparent between the chronically low
and consistently high groups, and many of these differences would be quite obvious
to classroom teachers.
Of greater interest then, were the differences between the groups similar in
grade six but not in grade seven; between the consistently high and decliners and
between the chronically low and risers. The differences between these groups may
provide the key to identifying students who have potential problems in the
transition to secondary school.
9.10.1 A sum m ary of differences
The following table (Table 9.19) summarises the differences between the
chronically low and decliners and between the consistently high and the risers on variables
other than the perceived control variables used to define the clusters. This
provides both evidence of generality of the cluster solution and additional
knowledge about the belief systems of the students involved in this study over
the transition to secondary school. Combined with the findings from the earlier
discriminant analyses, these provide an overall characterisation of students in
Chapter 9: Other trends within and between clusters
195
each of the four groups. While some differences are apparent in Grade 6, many
more are evident in Year 7, after the transition to secondary school. It may be
that the combined pressures of adolescence and transition to secondary school
have a conjoint detrimental effect and lead to the deterioration of student beliefs
about themselves as learners of mathematics. If these problems could be
addressed either in primary school or early in secondary school, it may act to
mediate some of the problems encountered by this large group of students.
In Grade 6, the consistently high group felt that learning mathematics was
within their sphere of control; “I can succeed if I want to”. They felt more confident
of their own ability in mathematics, and felt that their teachers would help them
if they needed help. These students feel more engaged with their work, that their
teacher provided them with clear structure, and that their teacher is involved with
them on a personal level; that their teacher cares about how well they do in
mathematics. These students have a higher level of relatedness to themselves and
to their teachers, reflecting higher levels of self-esteem and self-satisfaction.
They have higher levels of intrinsic motivation, and a more positive way of
coping with failure, indicating that “I’ll try harder next time”.
More differences are apparent between the chronically low and risers groups in
Grade 6. The risers had higher levels of control beliefs, combined with higher
levels of Capacity effort beliefs. This combination of beliefs may be linked; for
example perhaps these students feel greater control over their learning because
they feel they are able to put in the required level of effort to learn. The chronically
low group, in contrast, show much higher levels of not knowing how to do well in
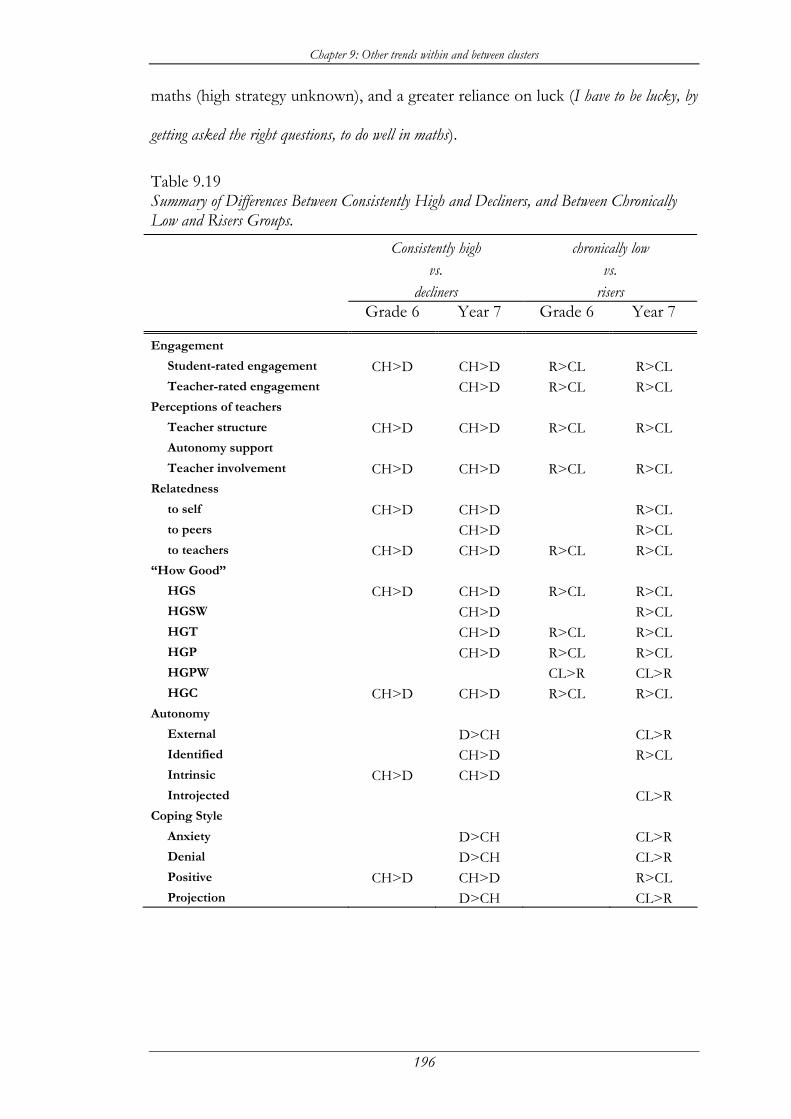
Chapter 9: Other trends within and between clusters
196
maths (high strategy unknown), and a greater reliance on luck (I have to be lucky, by
getting asked the right questions, to do well in maths).
Table 9.19 Summary of Differences Between Consistently High and Decliners, and Between Chronically Low and Risers Groups.
Consistently high vs.
decliners
chronically low vs.
risers Grade 6 Year 7 Grade 6 Year 7
Engagement Student-rated engagement CH>D CH>D R>CL R>CL Teacher-rated engagement CH>D R>CL R>CL Perceptions of teachers Teacher structure CH>D CH>D R>CL R>CL Autonomy support Teacher involvement CH>D CH>D R>CL R>CL Relatedness to self CH>D CH>D R>CL to peers CH>D R>CL to teachers CH>D CH>D R>CL R>CL “How Good” HGS CH>D CH>D R>CL R>CL HGSW CH>D R>CL HGT CH>D R>CL R>CL HGP CH>D R>CL R>CL HGPW CL>R CL>R HGC CH>D CH>D R>CL R>CL Autonomy External D>CH CL>R Identified CH>D R>CL Intrinsic CH>D CH>D Introjected CL>R Coping Style Anxiety D>CH CL>R Denial D>CH CL>R Positive CH>D CH>D R>CL Projection D>CH CL>R
Chapter 9: Other trends within and between clusters
197
The final chapter of this thesis will provide a summary and a discussion of
the results obtained from this research and their implications for classroom
practice and further research. There are many separate threads involved in a
research study such as this one, and it is essential that these are woven together in
a way that provides a model of perceived control beliefs for interpretation in the
classroom.
198
Chapter 10
Summary and Discussion
10.1 Summary
In Chapter 1 of this thesis it was stated that the major focus of the research
in this study was to be:
Are there identifiable groups of students whose beliefs about learning mathematics
could be recognised as indications of potential problems with motivation in
secondary school?
In order to investigate this challenge to teachers it was necessary to first set the
research in context. The first chapter outlined the approaches that have been
directed by various government forums and projects, underlining the significance
of the period of transition to secondary school.
Governments and researchers have recognised that transition to secondary
school is one of the “key times” in a student’s life, occurring as it does at
approximately the same time as the transition from childhood to adulthood. It is
argued that a greater focus on the middle years of schooling may help to alleviate
some of the problems seen in later secondary school, when disaffected students
opt out of the educational system (Australian Curriculum Studies Association,
1996). This is in itself a problem, but another is the number of students who
develop a strong dislike for mathematics and drop out of it as soon as they can.
Chapter 10: Summary and Discussion
199
A variety of studies have examined transition from different vantage points.
There are not a large number of these studies however, and fewer still focus on
mathematics in particular, despite research indicating that reactions to transition
vary within different learning areas (see for example Midgley et al., 1989b).
Several Australian studies have examined transition (Clarke, 1989; Ellerton and
Clements, 1988; Power and Cotterell, 1981) however none have been conducted
within the last few years in Victoria, years that have seen unprecedented changes
to the school system and to curriculum in this State.
The focus of the study was not on achievement, as is often the case with
studies on transition, but on engagement with learning. Engagement and
subsequent motivation to learn are fundamental to the concept of education as
developing a love of learning, and make it possible for all children to find
learning meaningful (Nicholls et al., 1989).
Chapter 2 examined the literature pertaining to issues about transition to
secondary school in general and then focussed on transition studies in
mathematics as a particular case. The primary education system is generally seen
as child-focussed and caring, while the secondary education system is perceived
as subject oriented and driven by largely external forces. Secondary school
teachers are seen as less caring, less warm and less supportive than their primary
school counterparts. While it is not the aim of this thesis to examine the rights
and wrongs of these positions it is certainly an area in which secondary schools
need better public relations.
A number of studies that examined transition in different subject areas
found that attitudes towards mathematics declined over the period of transition,
Chapter 10: Summary and Discussion
200
whereas attitudes towards English improved (Eccles et al., 1983). This underlined
the need to examine perceptions about subjects and beliefs about learning those
subjects separately, which provided the research design for this study. Reactions
to mathematics are often quite emotive, and is was argued that negative beliefs
and attitudes towards mathematics may actually constrain mathematical learning
(de Abreu, Bishop and Pompeu, 1997).
Several major changes that occur after transition are outlined in Chapter 2;
these include the need adolescents have for closer relationships with role models
such as teachers, changes in the school environment, and changes in the
mathematics curriculum, which becomes more formal and abstract. If these are
teamed with perceptions about secondary school teachers being more distant and
less helpful, as previous research and the comments Grade 6 children in this
study made on their questionnaires would indicate, then it is no wonder that a
great many students worry about transition.
The focus of Chapter 3 was on the motivational framework of this thesis. It
was argued in the literature that education should be seen as more than a means
to an end, and that it is more important to have learning goals than performance
goals. The difference between these is described by Dweck (1985) as the
difference between looking smart and being smart. Students oriented towards
learning goals were reported as using cognitive and metacognitive goals more
frequently and being better motivated.
Metacognition was discussed in some detail, and it was argued that it is
important that students become more aware of their own beliefs about success
and failure in school. Paris and Winograd (1990) argued that metacognition helps
Chapter 10: Summary and Discussion
201
students “become active participants … rather than passive recipients of
instruction and imposed experiences” (p. 18). Some studies suggest that
students’ beliefs about effort and ability become more fixed at about the age of
transition, giving another reason to set the study at this point of time. Selection
of goals and tasks in school are a reflection of how students believe they learn,
and for teachers to develop appropriate interventions it is necessary that they also
understand students’ beliefs about how they learn.
To examine changes in beliefs about mathematics for this study, a relatively
new instrument, the Student Perceptions of Control Questionnaire, was used to examine
perceived control beliefs over the Grade 6 to Year 7 year. This instrument had
been used in the USA and in Germany, but never with Australian students, and
never within a specific subject area. The perceived control model was originally
developed from locus of control, attributional, learned helplessness and self-
efficacy theories, and contends that engagement is maximised when the social
context (in this case the mathematics classroom) fulfils students’ basic
psychological needs for competence, autonomy and relatedness. The model
examines students’ beliefs about the amount of control they feel they have over
events in their lives, their beliefs about the effectiveness of particular strategies
for succeeding (strategy beliefs), and whether they feel they are able to enact these
strategies (capacity beliefs). The known causes examined were ability, effort,
powerful others and luck.
Skinner argued that competence research is important because a need for
competence “gives ultimate power to individuals as sources and agents of their
own motivation” (Skinner, 1995, p. 15). Perceived control acts on engagement,
Chapter 10: Summary and Discussion
202
and as such cannot increase ability but allows people access to all the resources
available to them. Patterns with perceived control are cyclical; beliefs that one is
unable to control outcomes leads to patterns of action that reinforce this belief,
so intervention into the cycle is vital.
A summary of perceived control profiles optimal for engagement was given:
high control beliefs, high effort strategy and capacity beliefs, low strategy ability
and high capacity ability beliefs, high capacity luck and capacity powerful others
beliefs. In contrast, the students most likely to be disaffected are those who
essentially feel that they are unable to control success and failure, those with low
capacity effort and ability beliefs, high strategy beliefs paired with low capacity
beliefs for powerful others and luck, and high unknown strategy beliefs.
In order to investigate the applicability of the perceived control model to
students’ beliefs about learning mathematics, a longitudinal study was developed
in which students would complete questionnaires at three stages; early in Grade
6, late in Grade 6 and mid Year 7. The methods and instruments used in this
study are described fully in Chapter 4.
Three schools participated in the initial stage of the study, involving 154
students. When it became evident that due to attrition a large proportion of
these students would be lost from the study, a further 7 primary schools were
contacted and 510 students participated in the second stage of the study. In the
following year 302 of these students completed the questionnaire at their
secondary school.
The questionnaire contained scales measuring beliefs about mathematics,
perceptions of teacher involvement, autonomy, support and provision of
Chapter 10: Summary and Discussion
203
structure, perceived control, coping style, relatedness to self, teachers and peers,
autonomy, engagement, classroom environment and ratings in mathematics.
Teachers were asked to complete a questionnaire on each student that measured
engagement in mathematics.
Chapter 5 described the validation of the scales used in the questionnaire.
Principal components analysis and reliability analysis were carried out on the
engagement questionnaire and on each section of the student questionnaire to
assess uni-dimensionality and reliability. This was especially important with the
perceived control questionnaire as it had never been used in Australia before.
The principal components analysis of the perceived control questions
provided evidence that a three factor solution was appropriate, corresponding to
strategy, capacity and control beliefs. Reliability was found to be acceptable for
the perceived control scales. Most of the other scales were found to be reliable
and principal components analysis showed that the factors loaded as predicted
from prior research.
It was disappointing however, to find that the ICEQ questions did not load
as expected. This instrument is in wide use in Australia and overseas, and yet the
factor structure for this sample was completely different to that published. As
this instrument did not possess the uni-dimensionality required for a summated
scale those data were not subject to any further analysis.
Chapter 6 reported on the cross-sectional analysis of the data obtained from
the student and teacher questionnaires. It was important at this stage of the
study to examine the relationships that existed between the perceived control
variables and teacher ratings of student engagement, and to see whether similar
Chapter 10: Summary and Discussion
204
relationships between these variables existed before and after transition. Some of
the data analysis replicated that of prior research studies which used the same
instrument, in order to compare the results obtained from a particular subject
domain with those from general beliefs about education. Initial data analysis
consisted of descriptive statistics, correlations and regression on the entire data
set at each stage of the study.
At each stage of the study effort was seen as the most important strategy for
success, and the cause that most students felt they had access to. Teacher-rated
student engagement was found to be strongly correlated positively with teacher
rating of student ability, control, capacity effort, capacity ability and capacity luck,
and negatively with strategy luck and strategy unknown. Interestingly, strategy
effort was not correlated with engagement, and it could be inferred that knowing
that effort is an appropriate strategy is not in itself enough; students have to
believe that they can exert enough effort to succeed. Teacher-rated student
engagement was also strongly correlated with teacher ratings of ability and was
also quite strongly correlated with the PAT-Mathematics score. Teachers’ rating
of ability was also strongly correlated with the PAT-Mathematics result.
Strategy ability was found to correlate negatively with both achievement and
teacher rating of ability, suggesting that weaker students may rely on ability as a
strategy. These are the students who are least likely to say that they are smart at
mathematics, so one wonders what incentive they have to try very hard. As has
been found in other studies, perception of autonomy support was found to be
negatively correlated with strategy unknown, implying that students whose
teachers don’t let them make decisions about their work are most likely to be

Chapter 10: Summary and Discussion
205
unsure of how to achieve success. Perceived teacher involvement was positively
correlated with control beliefs, indicating that students who felt that their
teachers were involved also felt in control of their learning.
Strategy and capacity beliefs for each of the known causes were separately
entered into a regression equation with teacher-rated student engagement.
Strategy luck and strategy unknown were both found to be significant negative
predictors of engagement at both stages 1 and 2, while only strategy unknown
was a predictor (negative) at stage 3. Capacity ability and capacity effort were
both significant positive predictors at stage 1, capacity ability and luck at stage 2
while at stage 3 capacity ability, effort and powerful others were all significant
positive predictors. Regression was also carried out within pairs of strategy and
capacity belief for each known cause, and for each the strategy and capacity belief
loaded differently at each stage of the study, demonstrating that the strategy and
capacity beliefs are empirically distinct from each other.
It can be concluded from the results of the regression and correlational
analyses that in mathematics, as other studies have shown for school in general,
particular combinations of beliefs about how to succeed can have positive or
negative effects on student engagement. Despite some changes, it can be seen
that similar relationships occur within cohorts before and after transition to
secondary school. In order to investigate longitudinal changes more closely,
three separate data sets were created, consisting of
a) the 74 students common to stages 1, 2 and 3, which were used for illustrative
purposes,
b) the 143 students common to stages 1 and 2, and
c) the 302 students common to stages 2 and 3 of the study.
Chapter 10: Summary and Discussion
206
From stage 1 to 2, capacity powerful others was the only significant change,
and between stage 2 and 3 it was only capacity powerful others and capacity
effort that declined. The overall perceived control measure CONMAX however
reflected negative motivational trends in many of the variables by significantly
declining over transition. Significant declines over transition were also seen for
perceived teacher provision of structure, autonomy support and involvement,
and both teacher and student ratings of engagement. This latter result is
disappointing, since teachers would hope students would be most engaged at the
start of secondary school. The results are also consistent with previous research
that has characterised secondary school as more impersonal and less supportive
than primary school.
Analysis of gender differences found that boys felt ability to be more
important than girls did, however they also rated their own ability at a higher
level. Girls felt that their primary teachers were more involved with them than
their secondary teachers, but their self-esteem was lower than the boys’ at both
primary and secondary school. After transition, boys were found to be more
confident of their ability than girls, they had higher aims than girls, and they
believed that their teachers and parents would rate them more highly than the
girls did.
In primary school, students were most likely to work in mathematics because
they feel that it is important, however after transition students were found to be
more likely to work for external reasons and significantly less likely to be
intrinsically motivated. This is precisely the opposite to what teachers would
hope to be happening at this stage of students’ lives.
Chapter 10: Summary and Discussion
207
The changes that could be seen between stage 2 and 3 of the study support
the belief that there are differing reactions to transition. The nature of analysis of
variance however, means that differences in subgroups may be masked by a
“cancelling out” effect between groups that increase with groups that decrease.
In order to investigate whether these groups existed, the data were subject to
cluster analysis.
Hierarchical cluster analysis was used first, applying Ward’s minimum
variance method with Mojena’s stopping rule to determine an approximate
number of clusters, then convergent k - means cluster analysis was used to
investigate two, three and four cluster solutions. Thee smaller group from the
stage 1-2-3 data set was clustered first and it was found that the four cluster
solution looked the most promising in that interesting group differences became
apparent as the solution moved from a two to three to four cluster solution.
The clustering process was then repeated on the larger stage 2-3 data set, as
it was argued (Aldenderfer and Blashfield, 1984) that the degree of replicability of
a cluster solution is best examined by repeating the clustering process on
different subsets from a population. The stage 1-2-3 data and the stage 2-3 data
fit this criterion, and hence duplication of the solution for the smaller data set
would provide evidence of replicability of the solution.
Using an identical clustering procedure to that used previously, k – means
cluster analysis was used to investigate two, three and four-cluster solutions.
Again, the four cluster solution was found to be most representative of the data,
confirming replicability of the solution, and so analysis proceeded with the four
Chapter 10: Summary and Discussion
208
cluster solution. These four clusters were labeled with fairly self-explanatory
labels for easier reference: consistently high, decliners, risers, and chronically low.
It was evident with both samples of students that a significant number (107
out of 302) were classified as decliners with this procedure, indicating that they
may be at-risk of alienation at secondary school.
As the predictor variable CONMAX was a combination of strategy, capacity
and control beliefs, discriminant analysis was carried out using cluster
membership as the grouping variable and the perceived control beliefs from time
two as the independent variables. The discriminant function derived maximally
separated the chronically low from the risers, and the consistently high from the decliners.
The best predictors were found to be control beliefs, capacity ability, capacity
effort and capacity luck, while strategy unknown was a significant negative
predictor. Again, strategy effort contributed least as a predictor.
The consistently high group presented a more positive profile across all
significant predictor variables at the Grade 6 level, followed by decliners, risers and
then the chronically low group. It was found to be more difficult to separate the
groups that were close together; the chronically low and risers groups and the
consistently high and decliners groups. Further discriminant analyses were carried out
to investigate the differences between these pairs of groups.
Between the consistently high and decliners groups only control, capacity ability
and capacity powerful others separated the groups, however between the
chronically low and risers, control, capacity effort, capacity luck, strategy luck and
strategy unknown (both negatively) were discriminators. An investigation of
Chapter 10: Summary and Discussion
209
gender differences found that differences were only apparent within the decliners
group, where it was found that males were more likely to believe in their ability
and females in their luck.
Chapter 9 examined the validity of the cluster solution as advocated by
Aldenderfer and Blashfield (1984). This entailed examining means for the
separate groups for variables other than the perceived control variables used to
define the clusters. It was found that the consistently high group had the highest
levels of engagement, and the chronically low had the lowest levels. A crossover
between the risers and the decliners groups was seen with these variables as with the
perceived control variables, where the risers were rated as less engaged at Grade 6
but more engaged at year 7 than the decliners group. In general, these patterns
were repeated with all variables examined in this chapter. The consistently high
group showed the most positive profile of beliefs over all variables and the
chronically low the least positive. The decliners showed the next most adaptive
profile in Grade 6 but deteriorated over transition, while the beliefs of the risers
group became far more adaptive.
What can be learnt from these results, and how can this be applied to
classrooms? The discussion section of this chapter will deal with these issues.
10.2 Discussion
The results of this study illustrate the multiple dimensions and relationships
that may combine to influence students’ beliefs about learning mathematics. The
model used in the study describes a system of actions and beliefs that is assumed
to interact dynamically within the social context of the classroom. Skinner
Chapter 10: Summary and Discussion
210
(1990b) argued that students’ control-related beliefs shape development by
impacting on motivational aspects of action. Action then effects subsequent
performances, the actual successes and failures resulting from these
performances further effect subsequent perceived control, and so the cycle
continues.
Motivational problems with students in the age group examined in this study
(11-13 years) become more critical as these students are capable of “regulating
their own actions to a standstill” (Skinner, 1990b, p. 203). Owing to the
increasing differentiation apparent in their belief systems, it also becomes more
difficult for teachers to promote engagement. Skinner argued that “interventions
would need to be more powerful and more subtle as children reach adolescence
… [which] underscores the need for early detection and treatment of
motivational problems” (p. 210).
Such early detection may be facilitated by an awareness of the perceived
control model. Awareness, for example, of students’ needs for autonomy,
competence and relatedness, and the possible effects on motivation of these
requirements not being met, form a basis of understanding student belief
systems.
In answer to the research question posed in Chapter 1, yes, there are
identifiable groups of students whose beliefs about learning mathematics could
indicate potential problems with motivation in secondary school. The perceived
control model presents a useful method of identifying groups of students who
react in differing ways to transition.
Chapter 10: Summary and Discussion
211
The consistently high group of students are similar to those students that have
been referred to by Harter and Connell (1984) as “a kind of academic super-star
whom teachers adore” (p. 247). Before and after transition this group had high
control beliefs, high capacity beliefs for effort, ability and luck, and a low score
on unknown strategy beliefs. It should be noted that these students do not
necessarily think that they are highly intelligent, just that they are smart enough to
succeed. It may say more about the level of ability these students feel is
necessary to do well in mathematics than about their own intelligence. These
students have the highest levels of engagement, and feel that their teachers
provide them with structure, autonomy support and are involved with them.
They have the highest levels of self-esteem, and get on well with their teachers
and peers. They have the lowest levels of external motivation and the highest
levels of intrinsic motivation, the lowest levels of anxiety and the highest levels of
positive coping.
In contrast, the chronically low group shows the most maladaptive profile of
all, and it is clear that these students are in great need of intervention strategies.
The profile presented by these students both before and after transition includes
low control beliefs, low capacity beliefs particularly for ability, effort, luck and
powerful others, combined with high strategy beliefs for luck and a high
unknown strategy score. These students are the least engaged and perceive the
least amount of structure, autonomy support and involvement. They have the
lowest levels of self-esteem and the lowest ratings for their relationships with
peers and teachers. Fortunately, and perhaps surprisingly, they still want to do
well in mathematics, and still feel that mathematics will be useful to them when

Chapter 10: Summary and Discussion
212
they leave school. However they don’t like mathematics, they show high levels of
anxiety, and high levels of external motivation. This illustrates neatly the
recursion of the model, as it is hard to imagine how any child with problems such
as those described could like the particular subject matter.
The other two groups fall somewhere between these two extreme profiles.
On most variables the decliners’ means are slightly below those for the consistently
high group in Grade 6, while the risers’ means are slightly above those for the
chronically low group. In Year 7 however the means for the beliefs held by the
decliners fell while those for the risers increased so that their roles were essentially
reversed. An anomaly was found on only one variable, and that was for anxiety.
Anxiety decreased for all groups over transition except for the decliners group, for
whom it rose substantially. In contrast, the mean for anxiety decreased by an
even larger amount for the risers group.
These findings are similar to those from studies such as those conducted by
Skinner, Wellborn & Connell (1990), Connell (1991), Connell and Wellborn
(1991), and Deci and Ryan (1991). Students’ engagement in the present study
was found to be undermined by beliefs in luck as a strategy for success and by
reports of not knowing what strategies are effective. The highest levels of
engagement were seen with students who held high strategy and capacity beliefs
for effort, low strategy and high capacity beliefs for ability, luck and powerful
others.
If mathematics teachers wish to promote the development of metacognitive
skills and motivation in their classrooms, to allow all students to become active
participants rather than passive recipients in their own learning experiences, there
Chapter 10: Summary and Discussion
213
needs to be a clear understanding of the psychological processes that underpin
student beliefs. The implications for teaching to try and address some of these
issues are discussed in the following section of this chapter.
10.3 Implications for teaching
The three critical antecedents to perceived control were said to be
competence, autonomy and relatedness. Competence is fostered by the
provision of a structured working environment, where expectations are realistic,
consequences are consistent and feedback is accurate and non-judgemental.
Autonomy is facilitated by autonomy support, where an individual’s perspective
is acknowledged, opportunities are provided for initiative and choice is allowed.
Relatedness develops when teachers and peers provide an involvement with the
student, when students feel that they are in an environment where others care
what happens to them.
It is also possible for school systems to block the development of
competence, autonomy and relatedness by “providing inconsistency, or chaos,
coercion, or neglect, respectively” (Miserandino, 1996, p. 203). It is consistently
emphasised in the literature, for example, that when teachers feel pressured by
the school system towards particular outcomes, such as being responsible for
their students performing to certain standards, they will be more controlling
towards their students. The result of this is that teachers tend to not want to take
risks with student learning, and so they lecture more and give their students less
choice and fewer opportunities for autonomous learning.
In order to foster motivation and enhance perceived control, it is important
for children to be made aware of the connections between their efforts and
Chapter 10: Summary and Discussion
214
outcomes. They should be encouraged to focus on their successful
performances, and should be encouraged to interpret them in terms of high
effort and ability. Instead of focussing on attributions for errors, analysis of
failures should involve learning from the error and planning strategies for dealing
with the problem next time.
These research findings may not be able to be translated directly into
classroom practice. Practitioners need to “make decisions about how to manage
the trade-offs involved in allocating limited teacher attention and classroom time
to competing goals” (Brophy, 1983, p. 283). Patrick et al. (1993) suggested that
when it is not feasible to measure perceived control, autonomy, relatedness and
engagement directly, research such as that reported in this study can be used as a
guide to the diagnosis of students’ problems directly from their behaviour.
For example when students enter secondary school full of confidence and
with good reports from their primary schools, then become disaffected and
anxious during the early stages of secondary school, teachers might suspect that
these students are similar to those from the decliners group. To increase
motivation, teachers may need to provide these students with more structure,
autonomy support and involvement, reduce their anxiety, and be explicit with
them to think about the reasons to which they attribute success and failure, and
their own beliefs about their capacities. In particular the strategy unknown belief
needs to be explicitly addressed. For the students in the chronically low group,
there is still hope, but major interventions need to be made into all facets of the
competence system, similar to those described for the decliners students. It is vital
to intervene in the self-system process because of the cyclicity of teachers’
Chapter 10: Summary and Discussion
215
responses to children’s own level of engagement. Students with high engagement
are treated in ways that are more likely to increase their engagement, while
teachers deal with students with low engagement in ways that will exacerbate
their problems and lead to lower engagement (Skinner and Belmont, 1993).
There have been a variety of strategies proposed for teachers to use to
foster engagement and promote perceived control in all students. These include
• Giving students options; about what, where, with whom, or how work is
done. Highlighting choice rather than using a controlling style encourages
the autonomous regulation of the activity,
• Letting students know what is expected and why – providing a clear
structure within which students are able to learn what it takes to do well,
• Assigning tasks that are realistic and challenging for students. Dweck
(1986) argued that success on easy tasks was ineffective in producing
stable confidence; students need tasks that incorporate challenges, even
failures, within a context that explicitly addresses motivational factors,
• Encouraging attitudes where learning is valued in its own right rather than
as a means to an end. Deci, Vallerand, Pelletier and Ryan (1991) explained
that external events designed to motivate or control people, including
awards, threatened punishment or competition, have been shown to
decrease intrinsic motivation. The common thread between these events
is that each is typically used to pressure a person to think, feel or behave
in a certain way,
• Communicating high expectations. Connell and Wellborn (1991) found
that some children “receive implicit and explicit communications of low
Chapter 10: Summary and Discussion
216
expectations, disinterest and suppressed opportunities that clearly inhibit
these children’s experiences of competence, autonomy and relatedness in
the school setting” (p. 72),
• Holding students accountable for learning and understanding, not just
remembering and getting the right answers,
• Encouraging students to “learn how to learn”, by encouraging them to be
explicit about their beliefs about learning,
• Giving students opportunities to take risks and be wrong and learn from
negative feedback. Students must learn to accept negative feedback as a
source of information that may enable them to improve rather than see it
as a negative judgement of their ability,
• Providing students with specific, constructive feedback when performance
goals have not been met,
• In mathematics in particular many students are afraid of getting the wrong
answer and will not guess because they fear this. Students need to be
reminded that the learning process is incremental, and that they can learn
and become better at a subject. Borkowski et al. (1990) argued that “…
students need to be convinced that effort is an investment in cognitive
development rather than a risk to self-esteem. It should be made clear
that the road to consistent strategy use is often filled with errors and that
failure does not imply low ability” (p. 82).
In addition to applying the psychological constructs of the perceived control
model to students, it should be noted that they are just as applicable to teachers,
who have similar motivational requirements. Teachers must also experience
Chapter 10: Summary and Discussion
217
autonomy support, relatedness and perceive themselves as competent if they are
to support the autonomy and competence of their students and provide them
with structure.
The next section provides a discussion of several issues regarding
directions for future research arising from this study, as well as a discussion of
the limitations of the present study.
10.4 Implications for research
While this study certainly extends previous research, the implications of its
findings should be discussed in light of its strengths and limitations. In
particular, the measure of student engagement rated by their teachers is
problematic. On one hand, teachers can be considered to be expert raters of
their students’ behavioural and cognitive engagement. On the other hand there is
a hint of cyclicity about this, especially considering the findings from other
studies about teachers reinforcing the beliefs of highly engaged students while
behaving in ways that continue to undermine the beliefs of weakly engaged
students. Observer reports of children’s affect and behaviour in the classroom
would add a great deal of information about their engagement.
Another limitation is that there were no schools involved in the study that
dealt with transition internally. The Department of School Education was
contacted at the beginning of this research study to find out where Prep – 12
schools in Victoria were located, however during the previous year they had
apparently been closed or converted to primary or secondary schools. Some
Prep - 12 schools are now being re-established, and a similar investigation in
these schools would answer questions about the effect of the “school switch”
Chapter 10: Summary and Discussion
218
factor in transition. However at the time this study was carried out, the only
schools that catered for the entire age range were in the non-government school
system, and the inclusion of these schools into the present study would have
introduced many more confounding variables.
Although not practical for a study for this purpose, a longer longitudinal
study would be most valuable. To follow these students into the post-
compulsory years of mathematics education could provide valuable insights and
may provide critical points at which beliefs change.
There are many directions that research into the perceived control area could
move forward. As previously mentioned, a study following students from
primary school into the later years of secondary school would be valuable.
Similarly, transition to tertiary education is another of those ‘critical points’ at
which huge changes are made in students’ lives, and at which belief structures are
particularly vulnerable.
An investigation and comparison of perceived control in a variety of
academic areas, just as is common in attributional research, might provide clues
as to why problems occur in mathematics that do not occur in other subject
areas.
The relationship between perceived control beliefs and classroom
environment was to have been examined in this study, however problems with
the instrument chosen precluded this. If an instrument was available that could
reliably measure students’ beliefs about their classroom environment this would
provide more useful data.
Chapter 10: Summary and Discussion
219
This study also has a number of strengths. The use of a longitudinal study
design provides data about beliefs of students as they mature. The study used a
new model, that of perceived control, which had not been used in Australia
before, and provided evidence of the validity of that model in Australian
classrooms. Cluster analysis is not a common tool of analysis in educational
research, but for data such as these, examining trends longitudinally, it has been
shown to be most valuable.
10.5 Final words
The present study was structured around an exploration of the perceived
control model (Skinner, Wellborn & Connell, 1990) as applied to a particular
educational context over a period of great change in a child’s life. Certain beliefs
about how to succeed in mathematics and one’s capacity to achieve that success
were found to be strong predictors of engagement, a construct that is argued
mediates between perceived control and achievement. A large number of
students were found to hold beliefs about learning mathematics that put them at-
risk of disaffection after transition to secondary school, into an environment
which is often perceived as distant and difficult. If it is true that “an overarching
objective for most classroom teaching is the development of capable,
responsible, self-motivated human beings who can carry out a variety of complex
tasks as situations demand” (Corno & Mandinach, 1983, p. 105), then classroom
teachers need to be aware of the psychological processes that underpin
motivation to learn. It is hoped that the model presented in this study can be
seen as useful to practitioners to improve student engagement and thus to foster
the love of learning.
220
Appendix 1
Ethical Approval: M onash University Standing Com m ittee on Ethics
in Research on Hum ans
221
222
Appendix 2
Letter of Approval to conduct research : Departm ent of School
Education

223
224
Appendix 3
Explanatory Statem ents for Students and Parents
225
Student (Parents) Explanatory Letter Dear Student (Parent) As part of a research project being conducted at Monash University, I would like to ask you (your child) some questions about your feelings and beliefs about maths. I believe that it’s important for researchers to ask students how they feel about school so that we can all work together to make your (their) school life successful and rewarding. This project involves following groups of students from primary to secondary school, and asks them simple questions about what they believe it takes to do well in mathematics and how they feel about mathematics.
There is no compulsion to participate in this study, but I would greatly appreciate it if you (your child) could, as it is important to find out what many students think. The answers that you (your child) gives on the questionnaires will not be seen by your (their) teachers, parents, other students, or anyone else connected with yourself (your child) or your (their) school. The answers will have no effect on your (their) grades, and you (they) are free to withdraw from the study at any time without any consequences.
I hope that you (and your child) do decide to participate in this project, and I look forward to working with you. If you agree (for your child) to be a part of the project, could you please fill in the form below and return it to your (your child’s) teacher. Thanks a lot, Sue Fullarton I .................................................. (name), of ...............................(school),
having had the research fully explained to me, agree (for my child) to
participate in the project being conducted by Sue Fullarton from Monash
University.
Signed ..................................................................................................
226
Appendix 4
Student Questionnaires: Stages 1, 2 and 3
227
MATHS IN TRANSITION PROJECT
STAGE 1
Student Background Information
Office use only
Name of School:
Student’s Name :
Sex : Female Male
Age :
Teacher’s name :
Year level at school:
Today’s date:
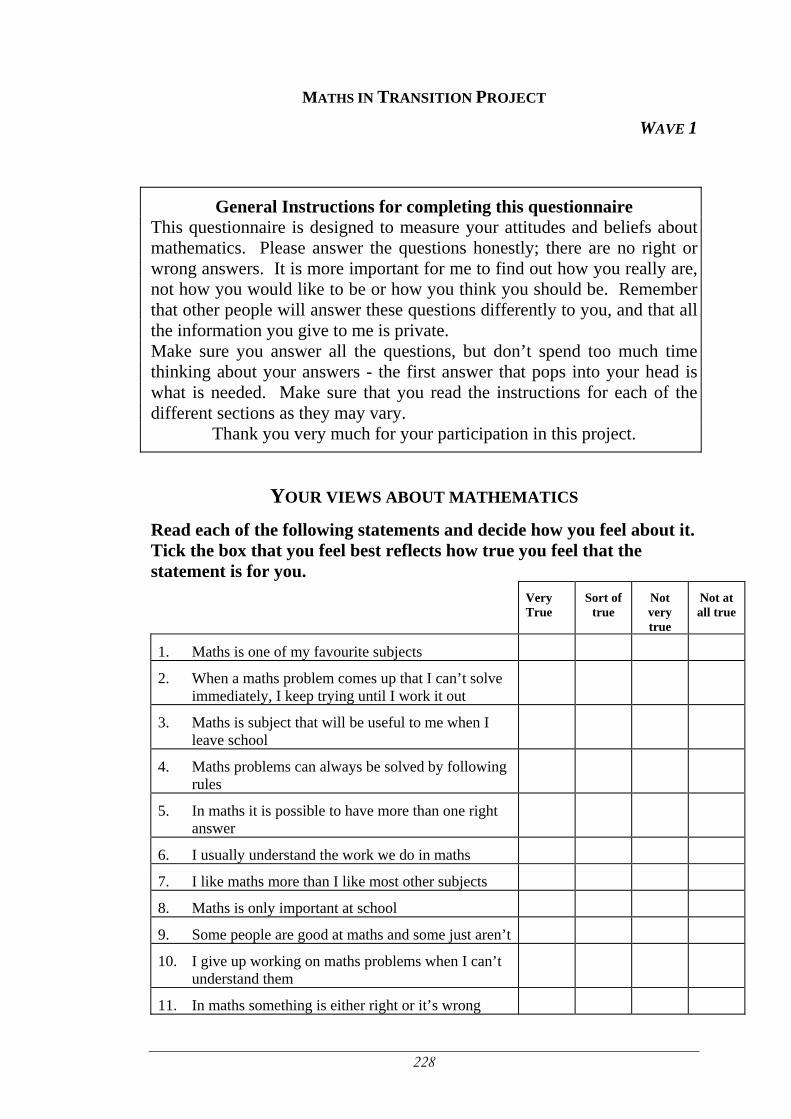
228
MATHS IN TRANSITION PROJECT
WAVE 1
General Instructions for completing this questionnaire This questionnaire is designed to measure your attitudes and beliefs about mathematics. Please answer the questions honestly; there are no right or wrong answers. It is more important for me to find out how you really are, not how you would like to be or how you think you should be. Remember that other people will answer these questions differently to you, and that all the information you give to me is private. Make sure you answer all the questions, but don’t spend too much time thinking about your answers - the first answer that pops into your head is what is needed. Make sure that you read the instructions for each of the different sections as they may vary.
Thank you very much for your participation in this project.
YOUR VIEWS ABOUT MATHEMATICS Read each of the following statements and decide how you feel about it. Tick the box that you feel best reflects how true you feel that the statement is for you.
Very True
Sort of true
Not very true
Not at all true
1. Maths is one of my favourite subjects
2. When a maths problem comes up that I can’t solve immediately, I keep trying until I work it out
3. Maths is subject that will be useful to me when I leave school
4. Maths problems can always be solved by following rules
5. In maths it is possible to have more than one right answer
6. I usually understand the work we do in maths
7. I like maths more than I like most other subjects
8. Maths is only important at school
9. Some people are good at maths and some just aren’t
10. I give up working on maths problems when I can’t understand them
11. In maths something is either right or it’s wrong
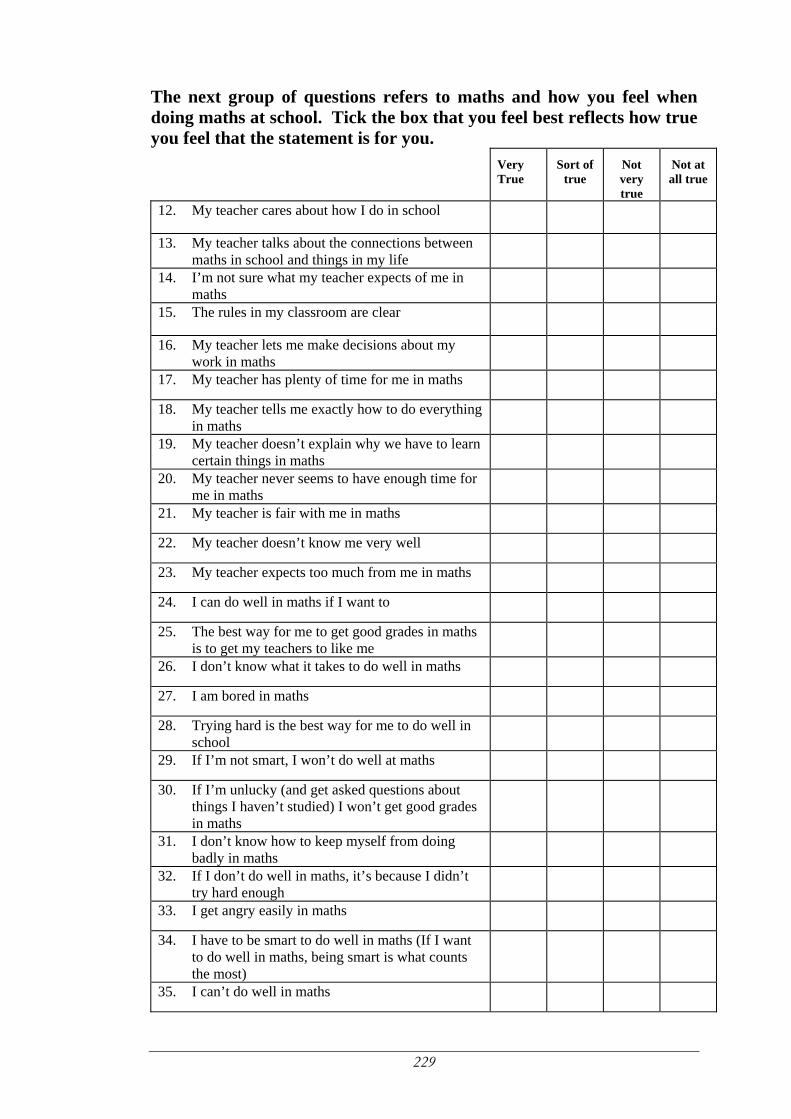
229
The next group of questions refers to maths and how you feel when doing maths at school. Tick the box that you feel best reflects how true you feel that the statement is for you. Very
True Sort of
true Not very true
Not at all true
12. My teacher cares about how I do in school
13. My teacher talks about the connections between maths in school and things in my life
14. I’m not sure what my teacher expects of me in maths
15. The rules in my classroom are clear
16. My teacher lets me make decisions about my work in maths
17. My teacher has plenty of time for me in maths 18. My teacher tells me exactly how to do everything
in maths 19. My teacher doesn’t explain why we have to learn
certain things in maths
20. My teacher never seems to have enough time for me in maths
21. My teacher is fair with me in maths 22. My teacher doesn’t know me very well 23. My teacher expects too much from me in maths 24. I can do well in maths if I want to 25. The best way for me to get good grades in maths
is to get my teachers to like me
26. I don’t know what it takes to do well in maths 27. I am bored in maths 28. Trying hard is the best way for me to do well in
school
29. If I’m not smart, I won’t do well at maths 30. If I’m unlucky (and get asked questions about
things I haven’t studied) I won’t get good grades in maths
31. I don’t know how to keep myself from doing badly in maths
32. If I don’t do well in maths, it’s because I didn’t try hard enough
33. I get angry easily in maths 34. I have to be smart to do well in maths (If I want
to do well in maths, being smart is what counts the most)
35. I can’t do well in maths
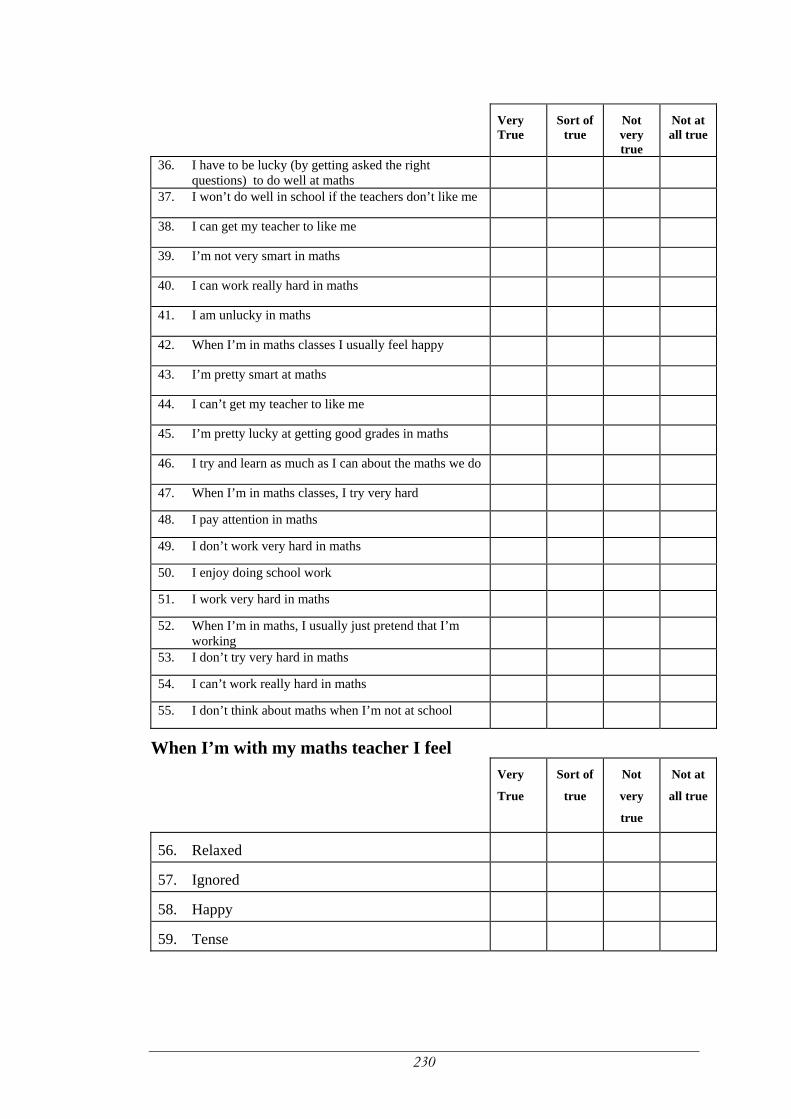
230
Very
True Sort of
true Not very true
Not at all true
36. I have to be lucky (by getting asked the right questions) to do well at maths
37. I won’t do well in school if the teachers don’t like me
38. I can get my teacher to like me
39. I’m not very smart in maths
40. I can work really hard in maths
41. I am unlucky in maths
42. When I’m in maths classes I usually feel happy
43. I’m pretty smart at maths
44. I can’t get my teacher to like me
45. I’m pretty lucky at getting good grades in maths
46. I try and learn as much as I can about the maths we do
47. When I’m in maths classes, I try very hard 48. I pay attention in maths 49. I don’t work very hard in maths 50. I enjoy doing school work 51. I work very hard in maths 52. When I’m in maths, I usually just pretend that I’m
working 53. I don’t try very hard in maths 54. I can’t work really hard in maths 55. I don’t think about maths when I’m not at school
When I’m with my maths teacher I feel Very
True
Sort of
true
Not
very
true
Not at
all true
56. Relaxed 57. Ignored 58. Happy 59. Tense
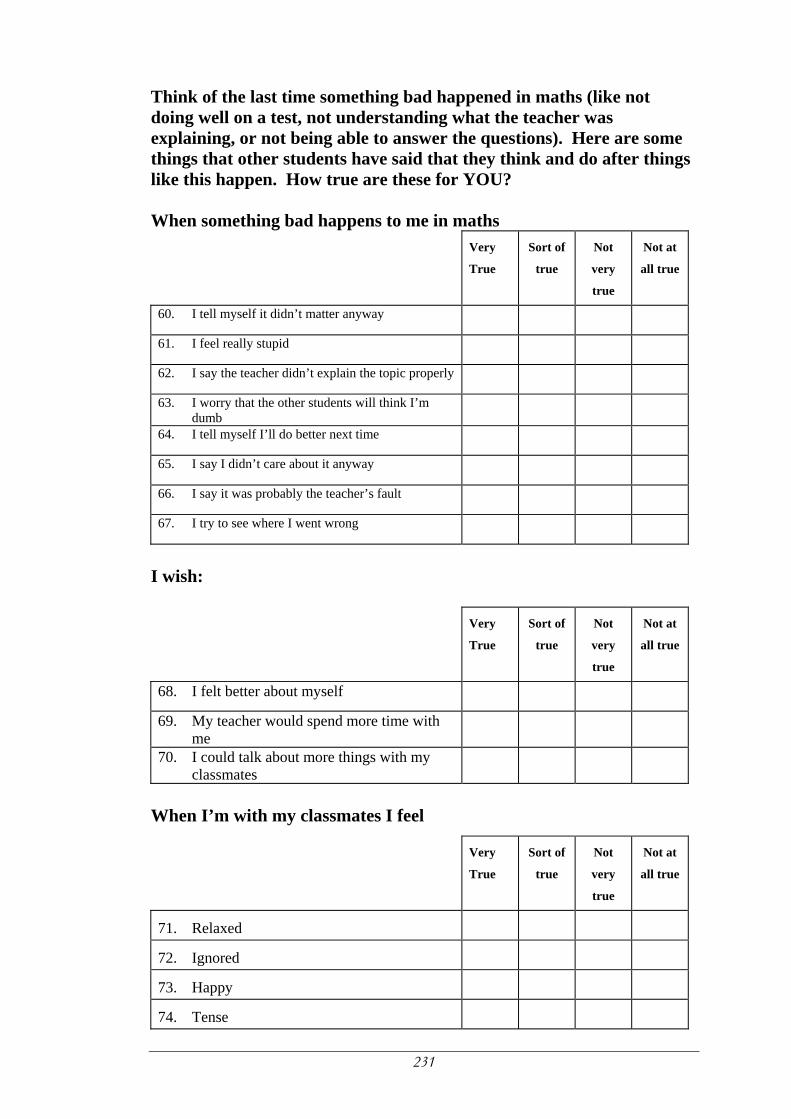
231
Think of the last time something bad happened in maths (like not doing well on a test, not understanding what the teacher was explaining, or not being able to answer the questions). Here are some things that other students have said that they think and do after things like this happen. How true are these for YOU? When something bad happens to me in maths
Very
True
Sort of
true
Not
very
true
Not at
all true
60. I tell myself it didn’t matter anyway
61. I feel really stupid
62. I say the teacher didn’t explain the topic properly
63. I worry that the other students will think I’m dumb
64. I tell myself I’ll do better next time
65. I say I didn’t care about it anyway
66. I say it was probably the teacher’s fault
67. I try to see where I went wrong
I wish:
Very
True
Sort of
true
Not
very
true
Not at
all true
68. I felt better about myself 69. My teacher would spend more time with
me 70. I could talk about more things with my
classmates When I’m with my classmates I feel
Very
True
Sort of
true
Not
very
true
Not at
all true
71. Relaxed 72. Ignored 73. Happy 74. Tense
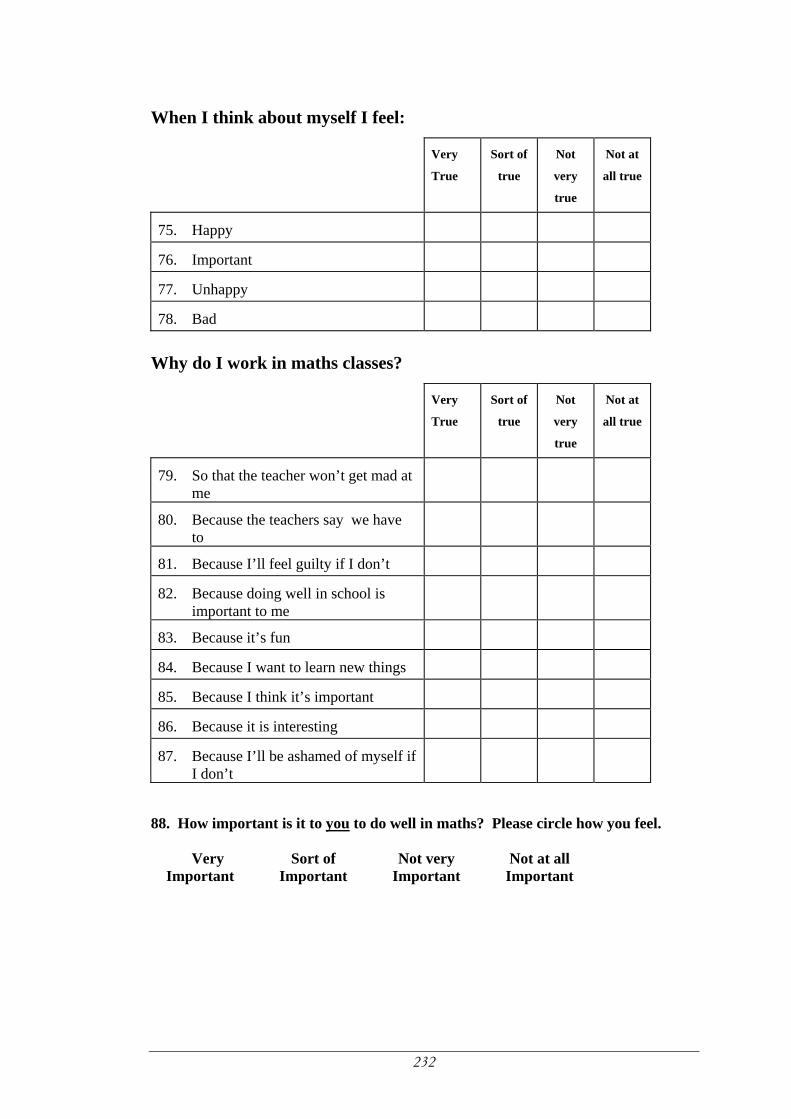
232
When I think about myself I feel:
Very
True
Sort of
true
Not
very
true
Not at
all true
75. Happy 76. Important 77. Unhappy 78. Bad
Why do I work in maths classes?
Very
True
Sort of
true
Not
very
true
Not at
all true
79. So that the teacher won’t get mad at me
80. Because the teachers say we have to
81. Because I’ll feel guilty if I don’t 82. Because doing well in school is
important to me
83. Because it’s fun 84. Because I want to learn new things 85. Because I think it’s important 86. Because it is interesting 87. Because I’ll be ashamed of myself if
I don’t
88. How important is it to you to do well in maths? Please circle how you feel.
Very Important
Sort of Important
Not very Important
Not at all Important
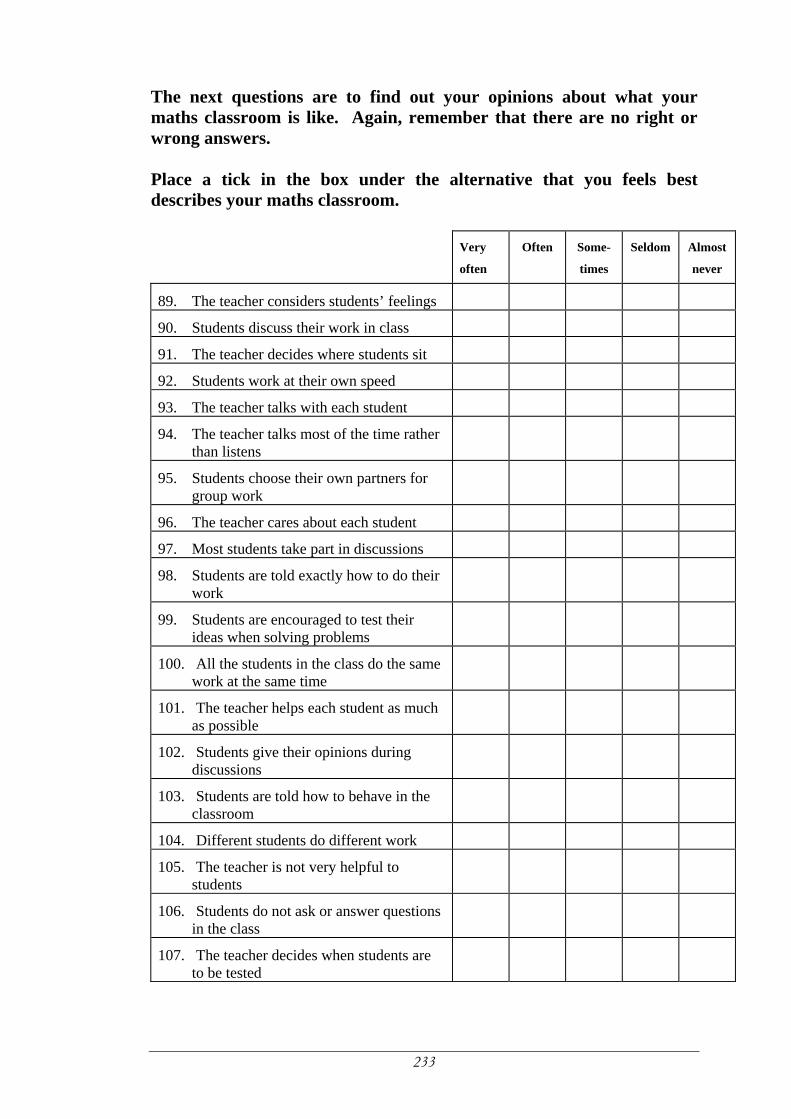
233
The next questions are to find out your opinions about what your maths classroom is like. Again, remember that there are no right or wrong answers. Place a tick in the box under the alternative that you feels best describes your maths classroom. Very
often
Often Some-
times
Seldom Almost
never
89. The teacher considers students’ feelings
90. Students discuss their work in class
91. The teacher decides where students sit
92. Students work at their own speed
93. The teacher talks with each student
94. The teacher talks most of the time rather than listens
95. Students choose their own partners for group work
96. The teacher cares about each student
97. Most students take part in discussions
98. Students are told exactly how to do their work
99. Students are encouraged to test their ideas when solving problems
100. All the students in the class do the same work at the same time
101. The teacher helps each student as much as possible
102. Students give their opinions during discussions
103. Students are told how to behave in the classroom
104. Different students do different work
105. The teacher is not very helpful to students
106. Students do not ask or answer questions in the class
107. The teacher decides when students are to be tested
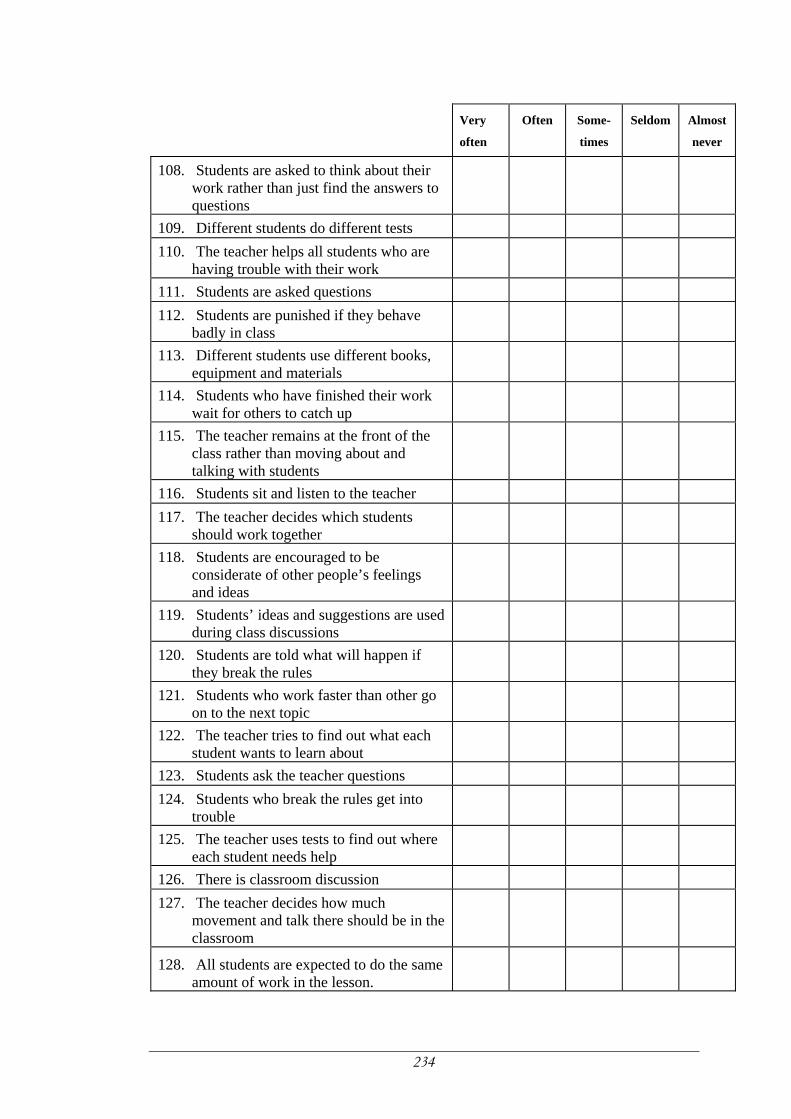
234
Very
often
Often Some-
times
Seldom Almost
never
108. Students are asked to think about their work rather than just find the answers to questions
109. Different students do different tests
110. The teacher helps all students who are having trouble with their work
111. Students are asked questions
112. Students are punished if they behave badly in class
113. Different students use different books, equipment and materials
114. Students who have finished their work wait for others to catch up
115. The teacher remains at the front of the class rather than moving about and talking with students
116. Students sit and listen to the teacher
117. The teacher decides which students should work together
118. Students are encouraged to be considerate of other people’s feelings and ideas
119. Students’ ideas and suggestions are used during class discussions
120. Students are told what will happen if they break the rules
121. Students who work faster than other go on to the next topic
122. The teacher tries to find out what each student wants to learn about
123. Students ask the teacher questions
124. Students who break the rules get into trouble
125. The teacher uses tests to find out where each student needs help
126. There is classroom discussion
127. The teacher decides how much movement and talk there should be in the classroom
128. All students are expected to do the same amount of work in the lesson.
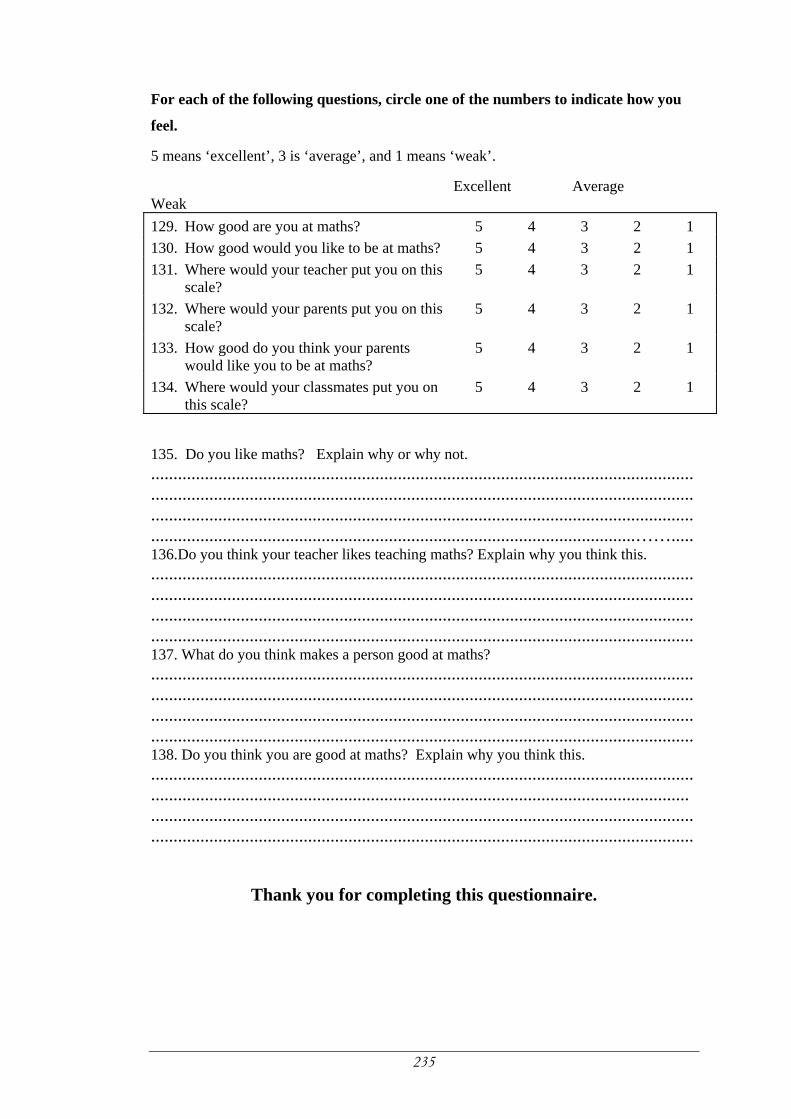
235
For each of the following questions, circle one of the numbers to indicate how you
feel.
5 means ‘excellent’, 3 is ‘average’, and 1 means ‘weak’.
Excellent Average Weak 129. How good are you at maths? 5 4 3 2 1 130. How good would you like to be at maths? 5 4 3 2 1 131. Where would your teacher put you on this
scale? 5 4 3 2 1
132. Where would your parents put you on this scale?
5 4 3 2 1
133. How good do you think your parents would like you to be at maths?
5 4 3 2 1
134. Where would your classmates put you on this scale?
5 4 3 2 1
135. Do you like maths? Explain why or why not. ......................................................................................................................... ..............................................................................................................................................................................................................................................................................................................................................................……..... 136.Do you think your teacher likes teaching maths? Explain why you think this. ......................................................................................................................... .................................................................................................................................................................................................................................................. ......................................................................................................................... 137. What do you think makes a person good at maths? ......................................................................................................................... ......................................................................................................................... ......................................................................................................................... ......................................................................................................................... 138. Do you think you are good at maths? Explain why you think this. ................................................................................................................................................................................................................................................. ......................................................................................................................... .........................................................................................................................
Thank you for completing this questionnaire.
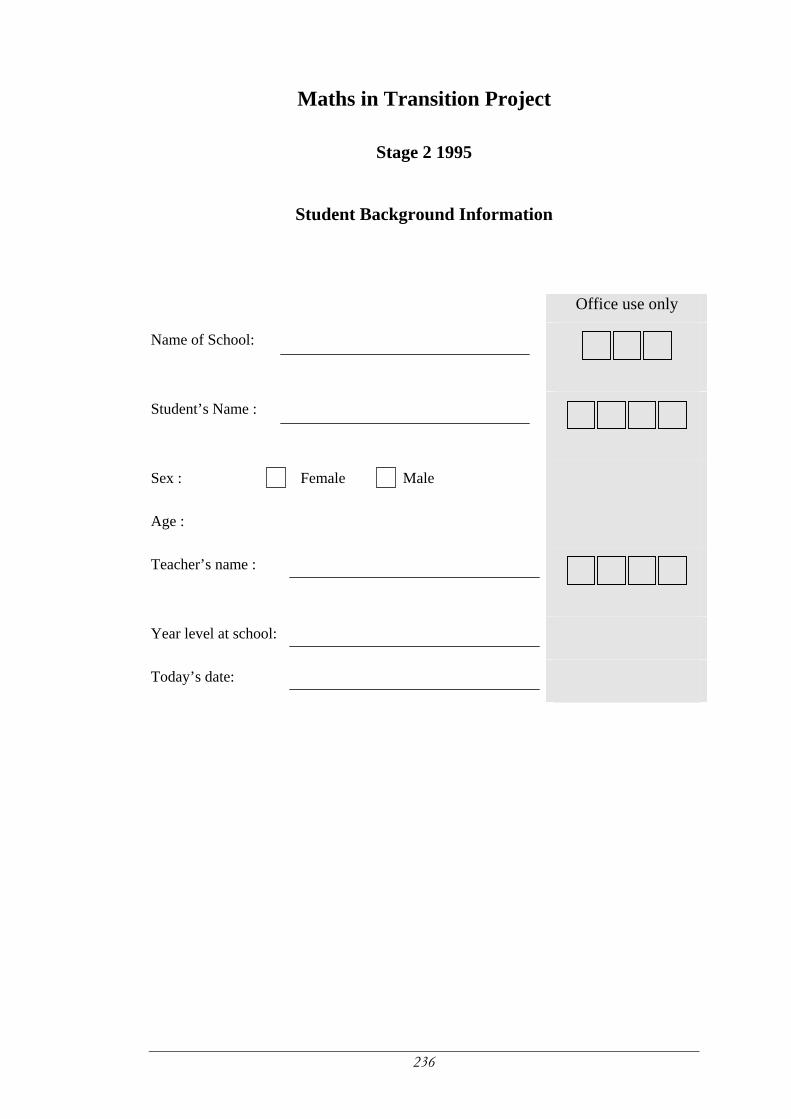
236
Maths in Transition Project
Stage 2 1995
Student Background Information
Office use only
Name of School:
Student’s Name :
Sex : Female Male
Age :
Teacher’s name :
Year level at school:
Today’s date:
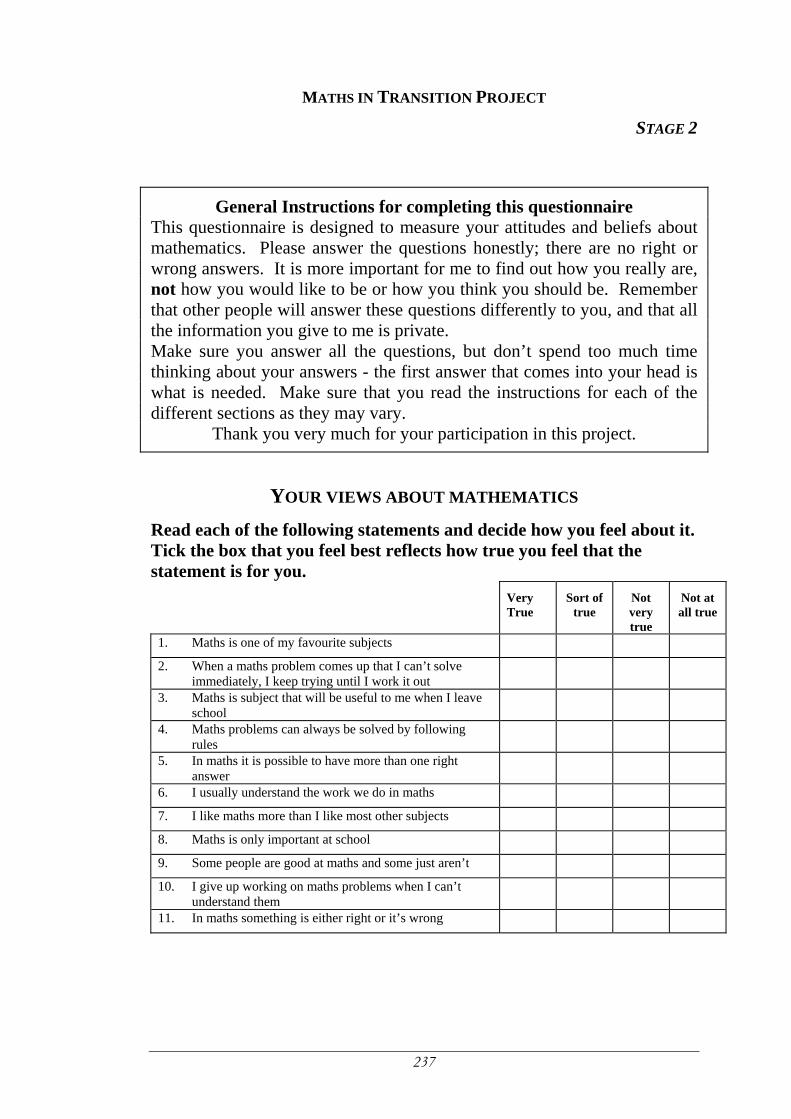
237
MATHS IN TRANSITION PROJECT
STAGE 2
General Instructions for completing this questionnaire This questionnaire is designed to measure your attitudes and beliefs about mathematics. Please answer the questions honestly; there are no right or wrong answers. It is more important for me to find out how you really are, not how you would like to be or how you think you should be. Remember that other people will answer these questions differently to you, and that all the information you give to me is private. Make sure you answer all the questions, but don’t spend too much time thinking about your answers - the first answer that comes into your head is what is needed. Make sure that you read the instructions for each of the different sections as they may vary.
Thank you very much for your participation in this project.
YOUR VIEWS ABOUT MATHEMATICS Read each of the following statements and decide how you feel about it. Tick the box that you feel best reflects how true you feel that the statement is for you.
Very True
Sort of true
Not very true
Not at all true
1. Maths is one of my favourite subjects 2. When a maths problem comes up that I can’t solve
immediately, I keep trying until I work it out
3. Maths is subject that will be useful to me when I leave school
4. Maths problems can always be solved by following rules
5. In maths it is possible to have more than one right answer
6. I usually understand the work we do in maths 7. I like maths more than I like most other subjects 8. Maths is only important at school 9. Some people are good at maths and some just aren’t 10. I give up working on maths problems when I can’t
understand them
11. In maths something is either right or it’s wrong
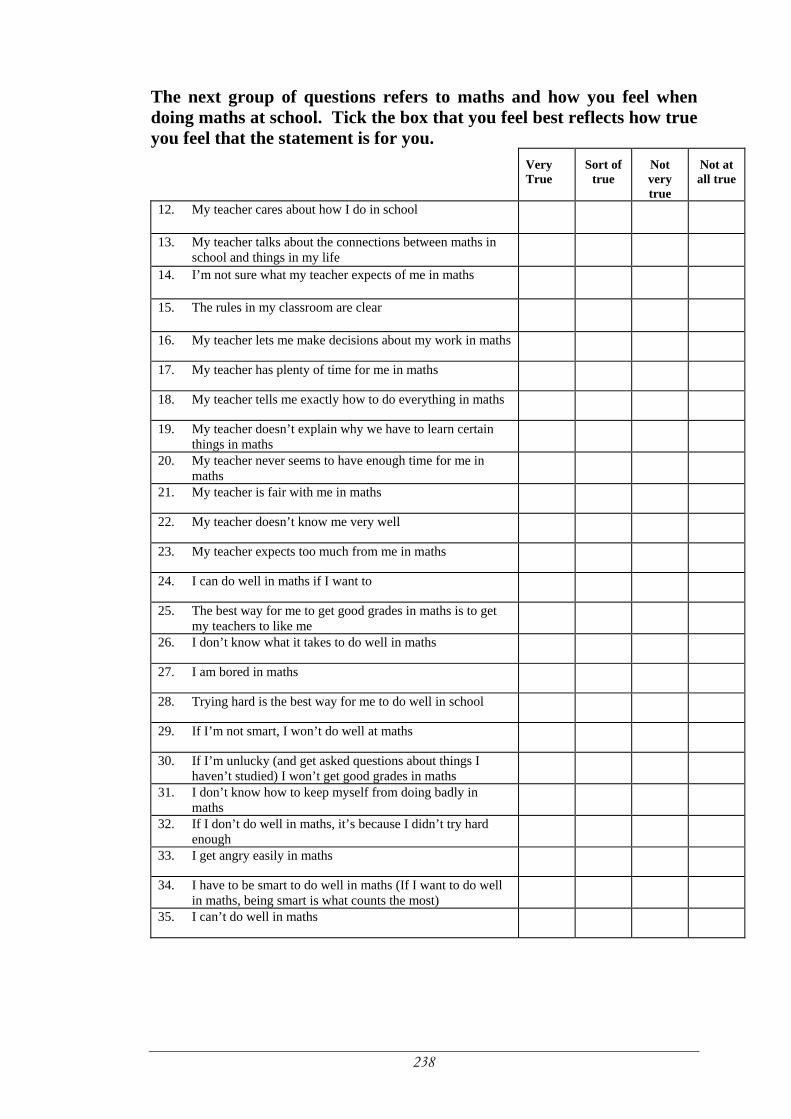
238
The next group of questions refers to maths and how you feel when doing maths at school. Tick the box that you feel best reflects how true you feel that the statement is for you.
Very True
Sort of true
Not very true
Not at all true
12. My teacher cares about how I do in school
13. My teacher talks about the connections between maths in school and things in my life
14. I’m not sure what my teacher expects of me in maths
15. The rules in my classroom are clear
16. My teacher lets me make decisions about my work in maths
17. My teacher has plenty of time for me in maths
18. My teacher tells me exactly how to do everything in maths
19. My teacher doesn’t explain why we have to learn certain things in maths
20. My teacher never seems to have enough time for me in maths
21. My teacher is fair with me in maths
22. My teacher doesn’t know me very well
23. My teacher expects too much from me in maths
24. I can do well in maths if I want to
25. The best way for me to get good grades in maths is to get my teachers to like me
26. I don’t know what it takes to do well in maths
27. I am bored in maths
28. Trying hard is the best way for me to do well in school
29. If I’m not smart, I won’t do well at maths
30. If I’m unlucky (and get asked questions about things I haven’t studied) I won’t get good grades in maths
31. I don’t know how to keep myself from doing badly in maths
32. If I don’t do well in maths, it’s because I didn’t try hard enough
33. I get angry easily in maths
34. I have to be smart to do well in maths (If I want to do well in maths, being smart is what counts the most)
35. I can’t do well in maths

239
Very
True Sort of
true Not very true
Not at all true
36. I have to be lucky (by getting asked the right questions) to do well at maths
37. I won’t do well in school if the teachers don’t like me
38. I can get my teacher to like me
39. I’m not very smart in maths
40. I can work really hard in maths
41. I am unlucky in maths
42. When I’m in maths classes I usually feel happy
43. I’m pretty smart at maths
44. I can’t get my teacher to like me
45. I’m pretty lucky at getting good grades in maths
46. I try and learn as much as I can about the maths we do
47. When I’m in maths classes, I try very hard 48. I pay attention in maths 49. I don’t work very hard in maths 50. I enjoy doing school work 51. I work very hard in maths 52. When I’m in maths, I usually just pretend that I’m working 53. I don’t try very hard in maths 54. I can’t work really hard in maths 55. I don’t think about maths when I’m not at school
When I’m with my maths teacher I feel Very
True
Sort of
true
Not
very
true
Not at
all true
56. Relaxed
57. Ignored
58. Happy
59. Tense

240
Think of the last time something bad happened in maths (like not doing well on a test, not understanding what the teacher was explaining, or not being able to answer the questions). Here are some things that other students have said that they think and do after things like this happen. How true are these for YOU? When something bad happens to me in maths
Very
True
Sort of
true
Not
very
true
Not at
all true
60. I tell myself it didn’t matter anyway 61. I feel really stupid 62. I say the teacher didn’t explain the topic properly 63. I worry that the other students will think I’m dumb 64. I tell myself I’ll do better next time 65. I say I didn’t care about it anyway 66. I say it was probably the teacher’s fault 67. I try to see where I went wrong
I wish:
Very
True
Sort of
true
Not very
true
Not at all
true
68. I felt better about myself 69. My teacher would spend more time with me 70. I could talk about more things with my classmates
When I’m with my classmates I feel
Very
True
Sort of
true
Not
very
true
Not at
all true
71. Relaxed 72. Ignored 73. Happy 74. Tense
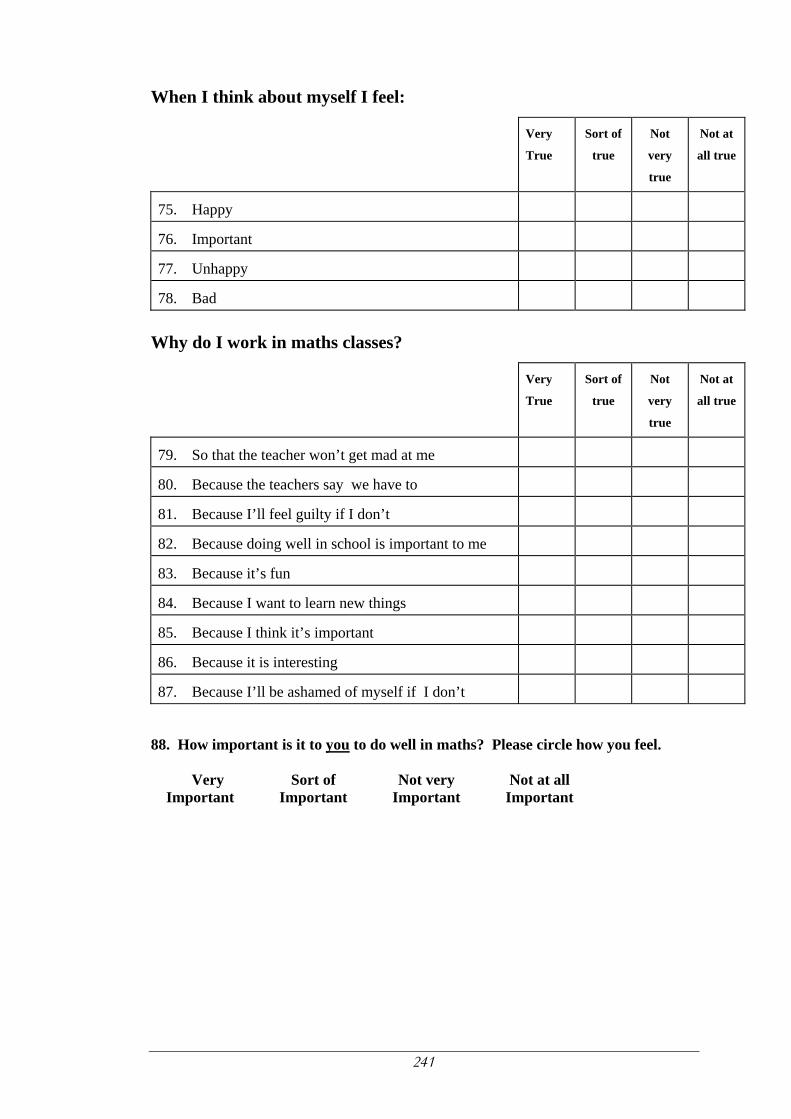
241
When I think about myself I feel:
Very
True
Sort of
true
Not
very
true
Not at
all true
75. Happy 76. Important 77. Unhappy 78. Bad
Why do I work in maths classes?
Very
True
Sort of
true
Not
very
true
Not at
all true
79. So that the teacher won’t get mad at me 80. Because the teachers say we have to 81. Because I’ll feel guilty if I don’t 82. Because doing well in school is important to me 83. Because it’s fun 84. Because I want to learn new things 85. Because I think it’s important 86. Because it is interesting 87. Because I’ll be ashamed of myself if I don’t
88. How important is it to you to do well in maths? Please circle how you feel.
Very Important
Sort of Important
Not very Important
Not at all Important
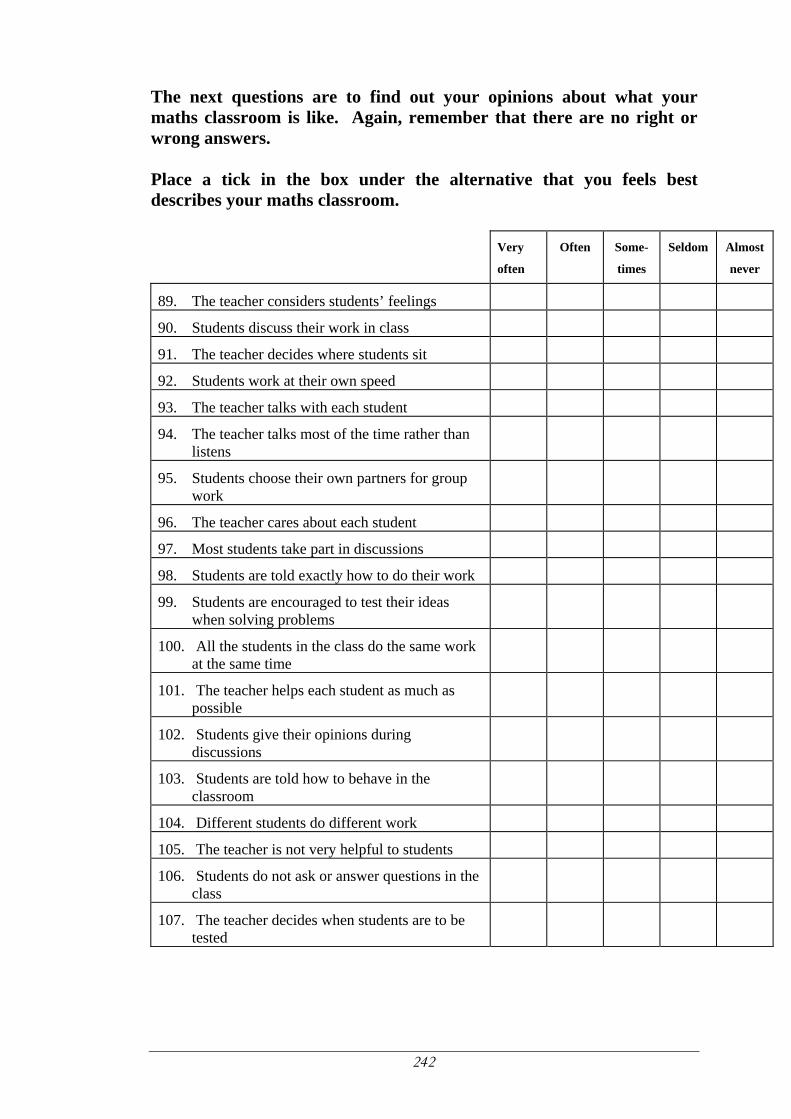
242
The next questions are to find out your opinions about what your maths classroom is like. Again, remember that there are no right or wrong answers. Place a tick in the box under the alternative that you feels best describes your maths classroom. Very
often
Often Some-
times
Seldom Almost
never
89. The teacher considers students’ feelings
90. Students discuss their work in class
91. The teacher decides where students sit
92. Students work at their own speed
93. The teacher talks with each student
94. The teacher talks most of the time rather than listens
95. Students choose their own partners for group work
96. The teacher cares about each student
97. Most students take part in discussions
98. Students are told exactly how to do their work
99. Students are encouraged to test their ideas when solving problems
100. All the students in the class do the same work at the same time
101. The teacher helps each student as much as possible
102. Students give their opinions during discussions
103. Students are told how to behave in the classroom
104. Different students do different work
105. The teacher is not very helpful to students
106. Students do not ask or answer questions in the class
107. The teacher decides when students are to be tested
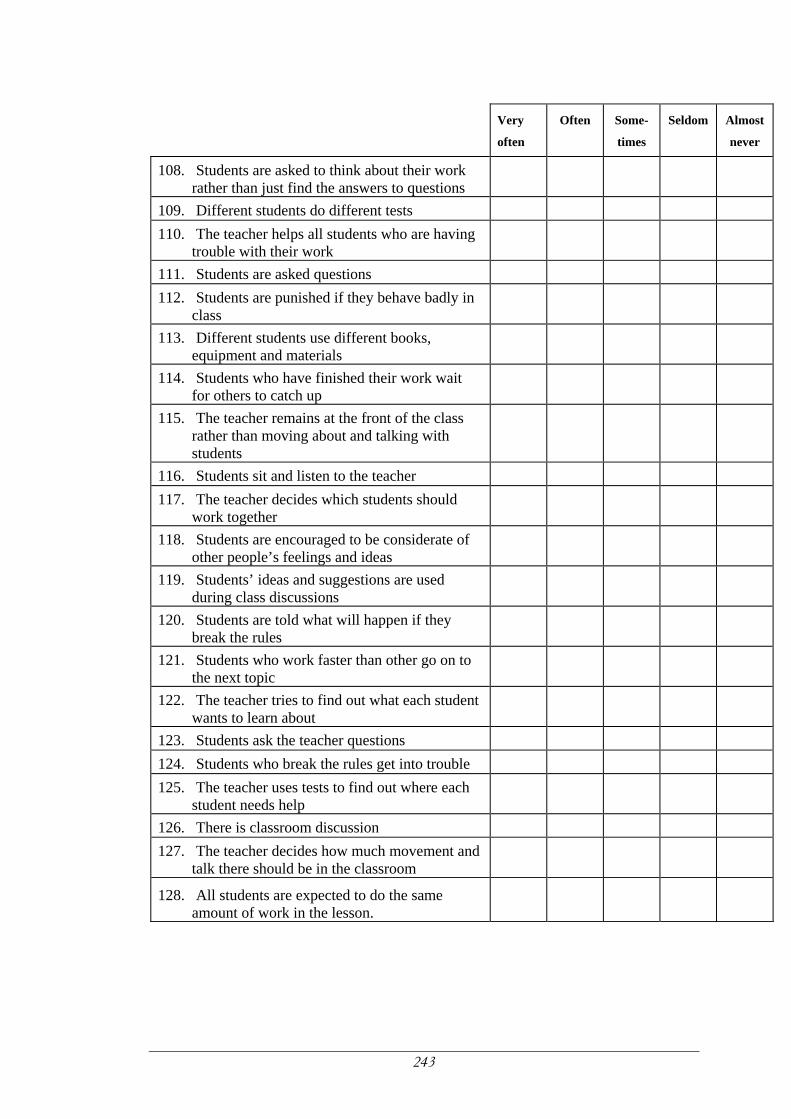
243
Very
often
Often Some-
times
Seldom Almost
never
108. Students are asked to think about their work rather than just find the answers to questions
109. Different students do different tests
110. The teacher helps all students who are having trouble with their work
111. Students are asked questions
112. Students are punished if they behave badly in class
113. Different students use different books, equipment and materials
114. Students who have finished their work wait for others to catch up
115. The teacher remains at the front of the class rather than moving about and talking with students
116. Students sit and listen to the teacher
117. The teacher decides which students should work together
118. Students are encouraged to be considerate of other people’s feelings and ideas
119. Students’ ideas and suggestions are used during class discussions
120. Students are told what will happen if they break the rules
121. Students who work faster than other go on to the next topic
122. The teacher tries to find out what each student wants to learn about
123. Students ask the teacher questions
124. Students who break the rules get into trouble
125. The teacher uses tests to find out where each student needs help
126. There is classroom discussion
127. The teacher decides how much movement and talk there should be in the classroom
128. All students are expected to do the same amount of work in the lesson.
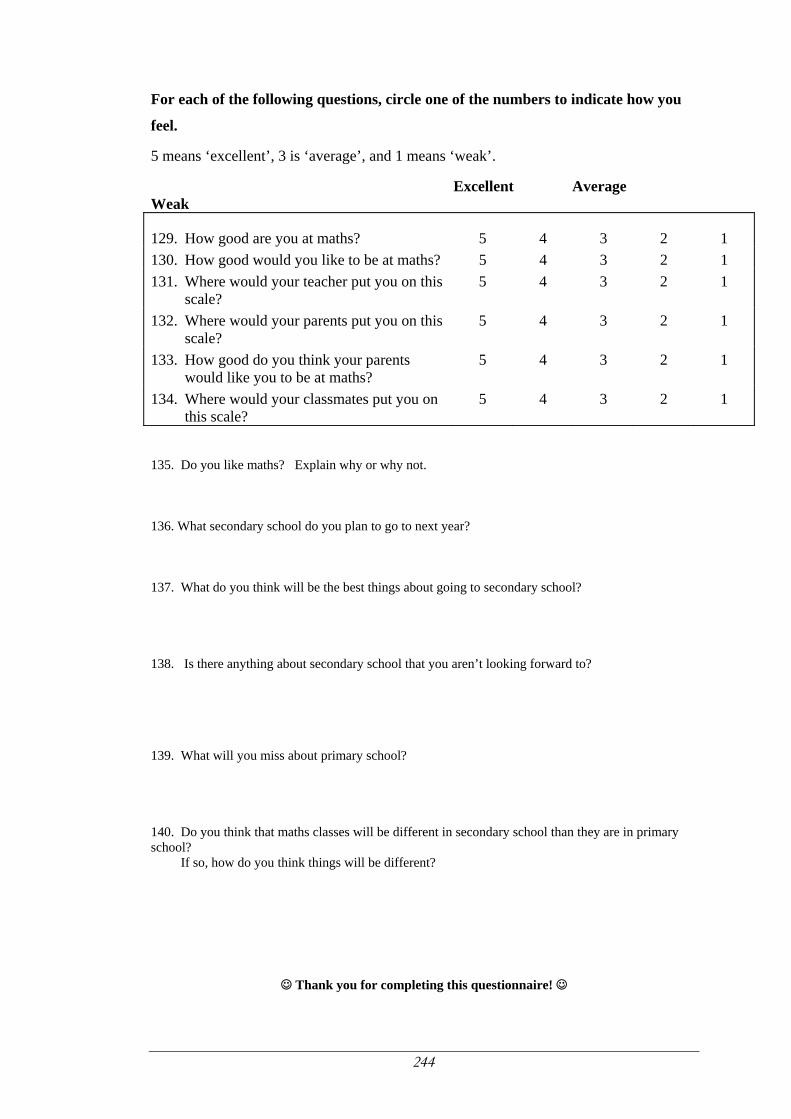
244
For each of the following questions, circle one of the numbers to indicate how you
feel.
5 means ‘excellent’, 3 is ‘average’, and 1 means ‘weak’.
Excellent Average Weak
129. How good are you at maths? 5 4 3 2 1 130. How good would you like to be at maths? 5 4 3 2 1 131. Where would your teacher put you on this
scale? 5 4 3 2 1
132. Where would your parents put you on this scale?
5 4 3 2 1
133. How good do you think your parents would like you to be at maths?
5 4 3 2 1
134. Where would your classmates put you on this scale?
5 4 3 2 1
135. Do you like maths? Explain why or why not. 136. What secondary school do you plan to go to next year? 137. What do you think will be the best things about going to secondary school? 138. Is there anything about secondary school that you aren’t looking forward to? 139. What will you miss about primary school? 140. Do you think that maths classes will be different in secondary school than they are in primary school? If so, how do you think things will be different?
☺ Thank you for completing this questionnaire! ☺
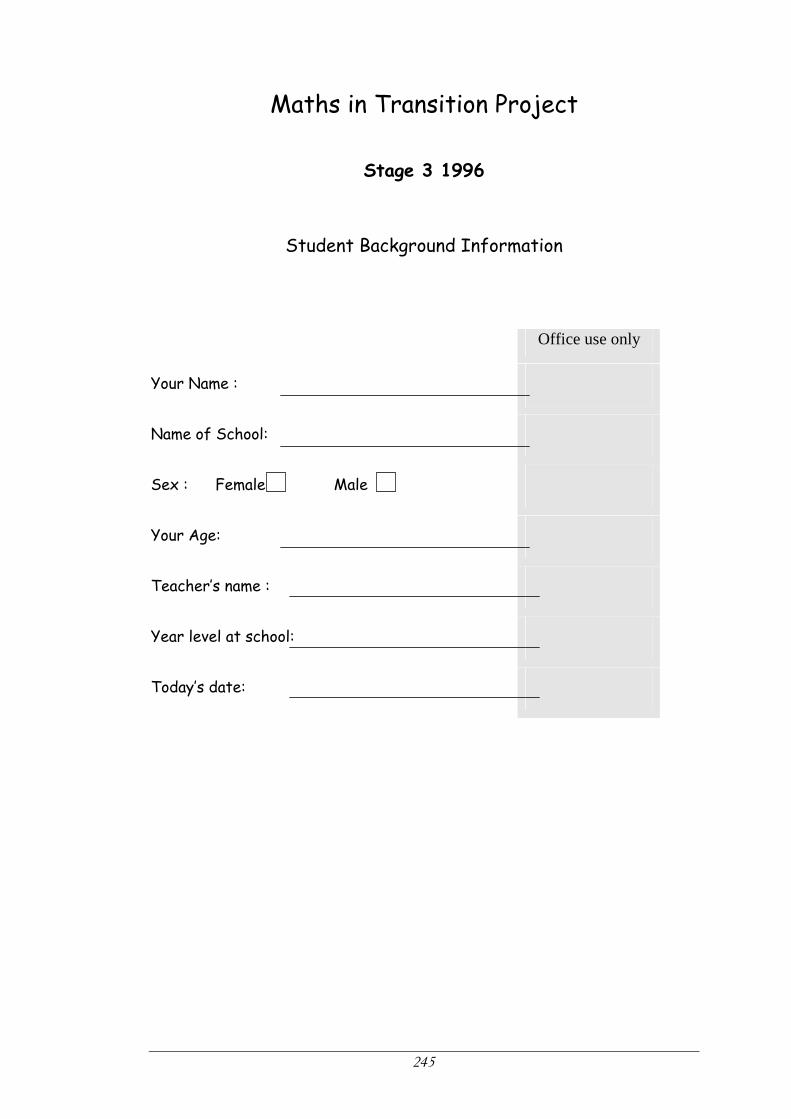
245
Maths in Transition Project
Stage 3 1996
Student Background Information
Office use only
Your Name :
Name of School:
Sex : Female Male
Your Age:
Teacher’s name :
Year level at school:
Today’s date:
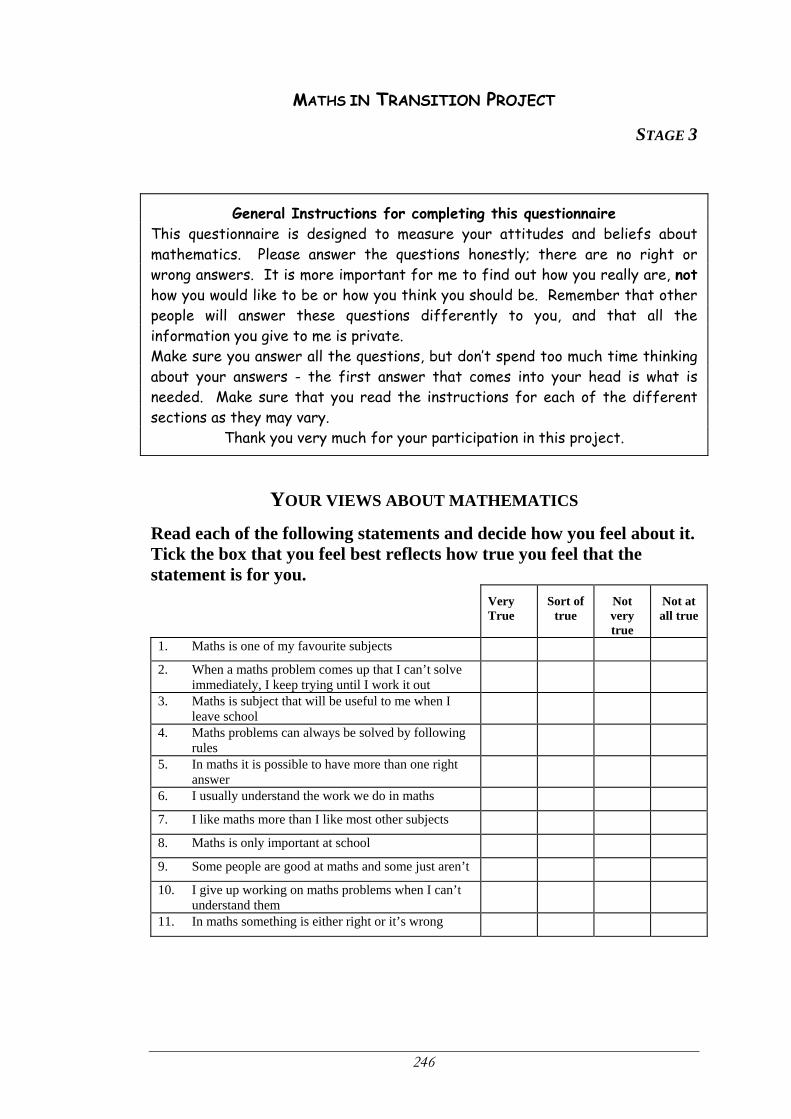
246
MATHS IN TRANSITION PROJECT
STAGE 3
General Instructions for completing this questionnaire This questionnaire is designed to measure your attitudes and beliefs about mathematics. Please answer the questions honestly; there are no right or wrong answers. It is more important for me to find out how you really are, not how you would like to be or how you think you should be. Remember that other people will answer these questions differently to you, and that all the information you give to me is private. Make sure you answer all the questions, but don’t spend too much time thinking about your answers - the first answer that comes into your head is what is needed. Make sure that you read the instructions for each of the different sections as they may vary.
Thank you very much for your participation in this project.
YOUR VIEWS ABOUT MATHEMATICS Read each of the following statements and decide how you feel about it. Tick the box that you feel best reflects how true you feel that the statement is for you.
Very True
Sort of true
Not very true
Not at all true
1. Maths is one of my favourite subjects 2. When a maths problem comes up that I can’t solve
immediately, I keep trying until I work it out
3. Maths is subject that will be useful to me when I leave school
4. Maths problems can always be solved by following rules
5. In maths it is possible to have more than one right answer
6. I usually understand the work we do in maths 7. I like maths more than I like most other subjects 8. Maths is only important at school 9. Some people are good at maths and some just aren’t 10. I give up working on maths problems when I can’t
understand them
11. In maths something is either right or it’s wrong
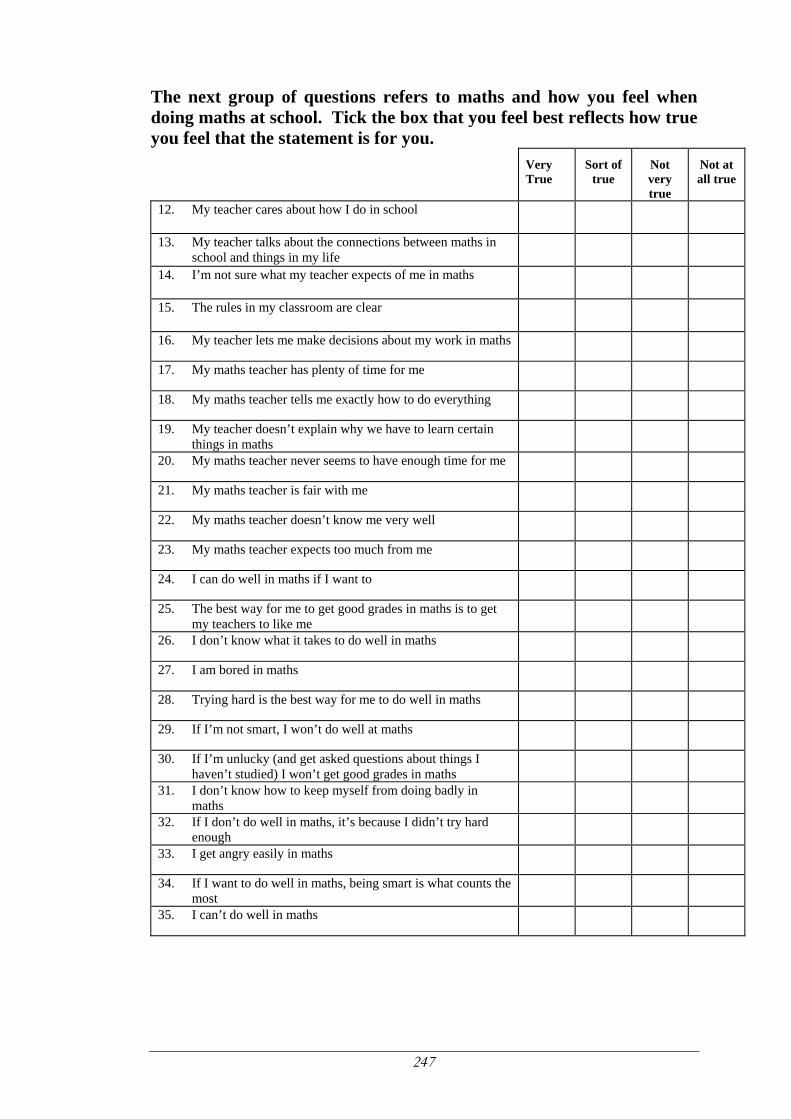
247
The next group of questions refers to maths and how you feel when doing maths at school. Tick the box that you feel best reflects how true you feel that the statement is for you.
Very True
Sort of true
Not very true
Not at all true
12. My teacher cares about how I do in school
13. My teacher talks about the connections between maths in school and things in my life
14. I’m not sure what my teacher expects of me in maths
15. The rules in my classroom are clear
16. My teacher lets me make decisions about my work in maths
17. My maths teacher has plenty of time for me
18. My maths teacher tells me exactly how to do everything
19. My teacher doesn’t explain why we have to learn certain things in maths
20. My maths teacher never seems to have enough time for me
21. My maths teacher is fair with me
22. My maths teacher doesn’t know me very well
23. My maths teacher expects too much from me
24. I can do well in maths if I want to
25. The best way for me to get good grades in maths is to get my teachers to like me
26. I don’t know what it takes to do well in maths
27. I am bored in maths
28. Trying hard is the best way for me to do well in maths
29. If I’m not smart, I won’t do well at maths
30. If I’m unlucky (and get asked questions about things I haven’t studied) I won’t get good grades in maths
31. I don’t know how to keep myself from doing badly in maths
32. If I don’t do well in maths, it’s because I didn’t try hard enough
33. I get angry easily in maths
34. If I want to do well in maths, being smart is what counts the most
35. I can’t do well in maths
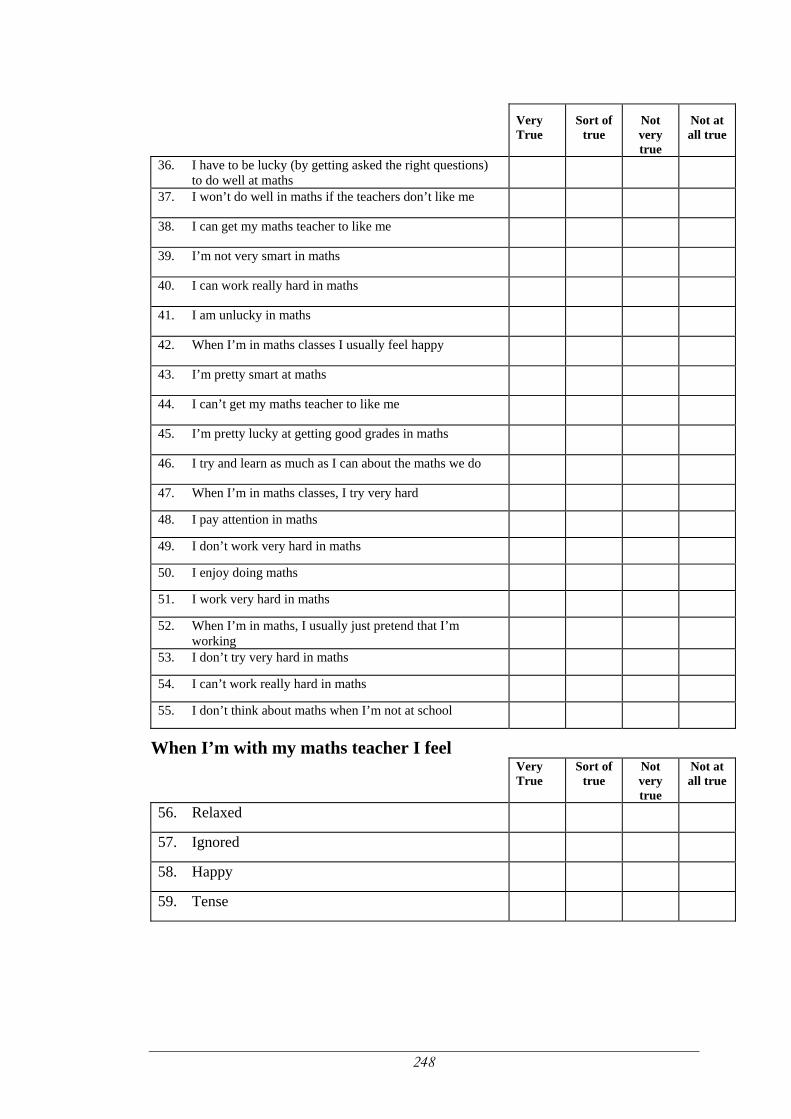
248
Very
True Sort of
true Not very true
Not at all true
36. I have to be lucky (by getting asked the right questions) to do well at maths
37. I won’t do well in maths if the teachers don’t like me
38. I can get my maths teacher to like me
39. I’m not very smart in maths
40. I can work really hard in maths
41. I am unlucky in maths
42. When I’m in maths classes I usually feel happy
43. I’m pretty smart at maths
44. I can’t get my maths teacher to like me
45. I’m pretty lucky at getting good grades in maths
46. I try and learn as much as I can about the maths we do
47. When I’m in maths classes, I try very hard 48. I pay attention in maths 49. I don’t work very hard in maths 50. I enjoy doing maths 51. I work very hard in maths 52. When I’m in maths, I usually just pretend that I’m
working 53. I don’t try very hard in maths 54. I can’t work really hard in maths 55. I don’t think about maths when I’m not at school
When I’m with my maths teacher I feel Very
True Sort of
true Not very true
Not at all true
56. Relaxed 57. Ignored 58. Happy 59. Tense
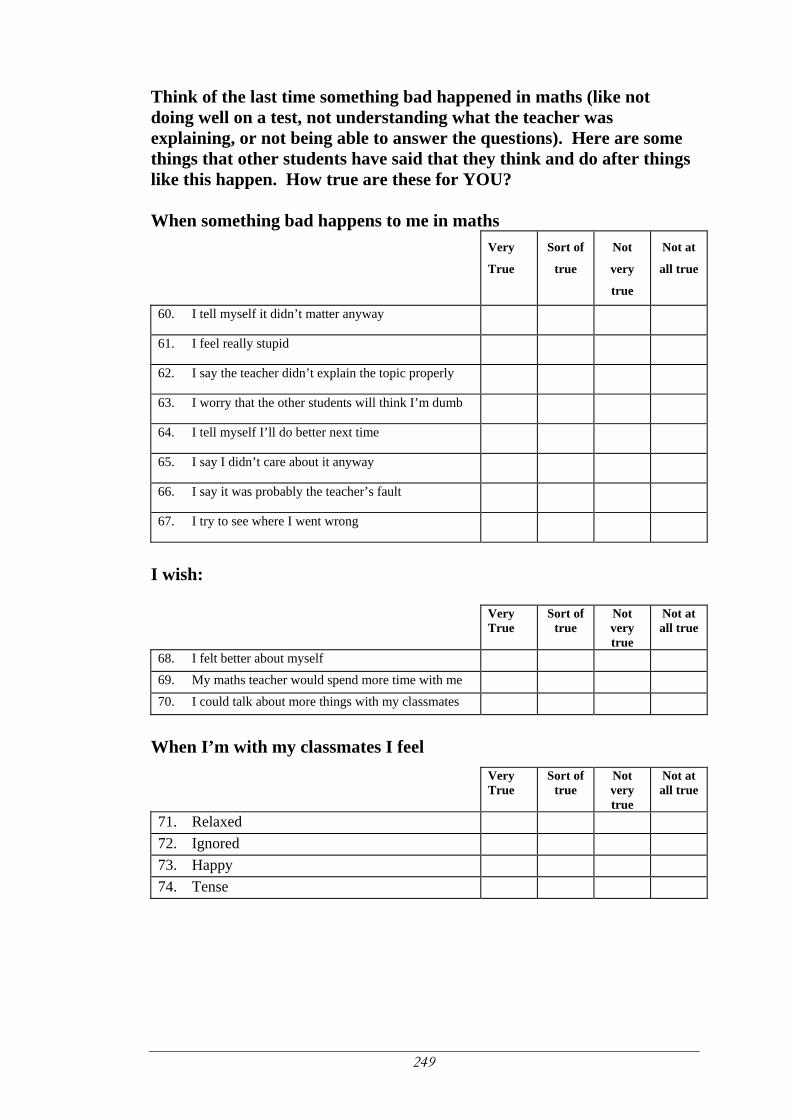
249
Think of the last time something bad happened in maths (like not doing well on a test, not understanding what the teacher was explaining, or not being able to answer the questions). Here are some things that other students have said that they think and do after things like this happen. How true are these for YOU? When something bad happens to me in maths
Very
True
Sort of
true
Not
very
true
Not at
all true
60. I tell myself it didn’t matter anyway
61. I feel really stupid
62. I say the teacher didn’t explain the topic properly
63. I worry that the other students will think I’m dumb
64. I tell myself I’ll do better next time
65. I say I didn’t care about it anyway
66. I say it was probably the teacher’s fault
67. I try to see where I went wrong
I wish:
Very True
Sort of true
Not very true
Not at all true
68. I felt better about myself 69. My maths teacher would spend more time with me 70. I could talk about more things with my classmates
When I’m with my classmates I feel
Very True
Sort of true
Not very true
Not at all true
71. Relaxed 72. Ignored 73. Happy 74. Tense
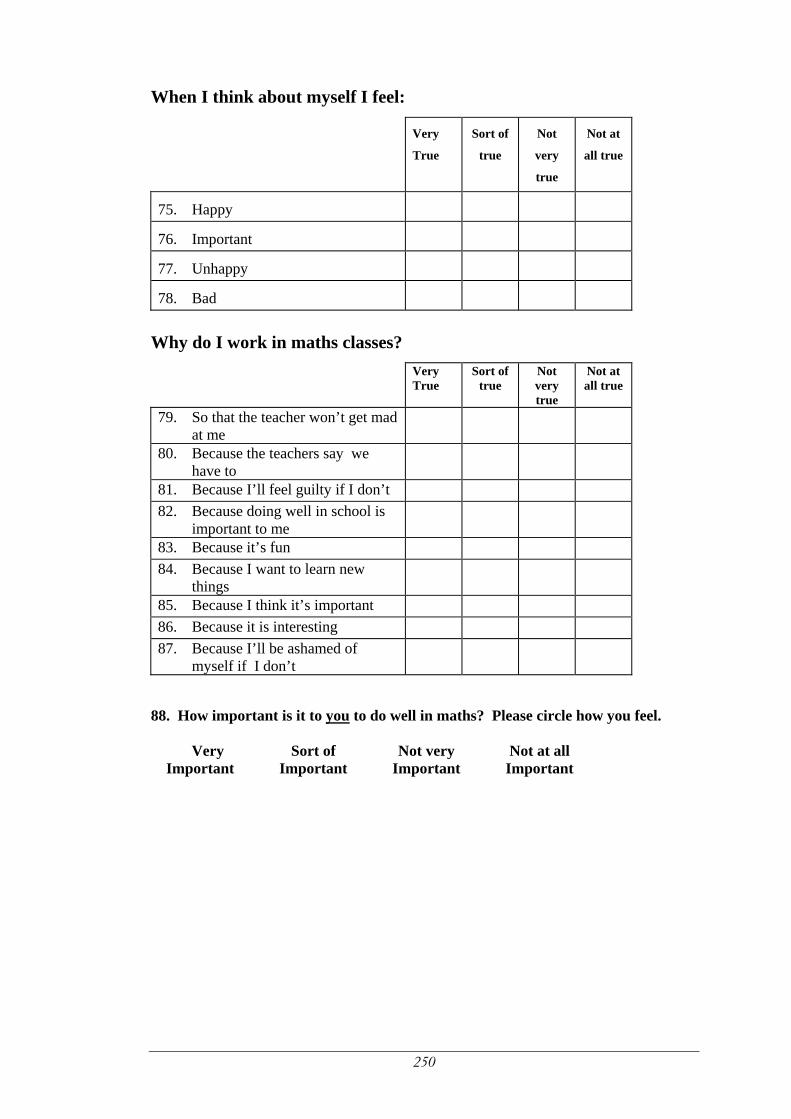
250
When I think about myself I feel:
Very
True
Sort of
true
Not
very
true
Not at
all true
75. Happy 76. Important 77. Unhappy 78. Bad
Why do I work in maths classes?
Very True
Sort of true
Not very true
Not at all true
79. So that the teacher won’t get mad at me
80. Because the teachers say we have to
81. Because I’ll feel guilty if I don’t 82. Because doing well in school is
important to me
83. Because it’s fun 84. Because I want to learn new
things
85. Because I think it’s important 86. Because it is interesting 87. Because I’ll be ashamed of
myself if I don’t
88. How important is it to you to do well in maths? Please circle how you feel.
Very Important
Sort of Important
Not very Important
Not at all Important
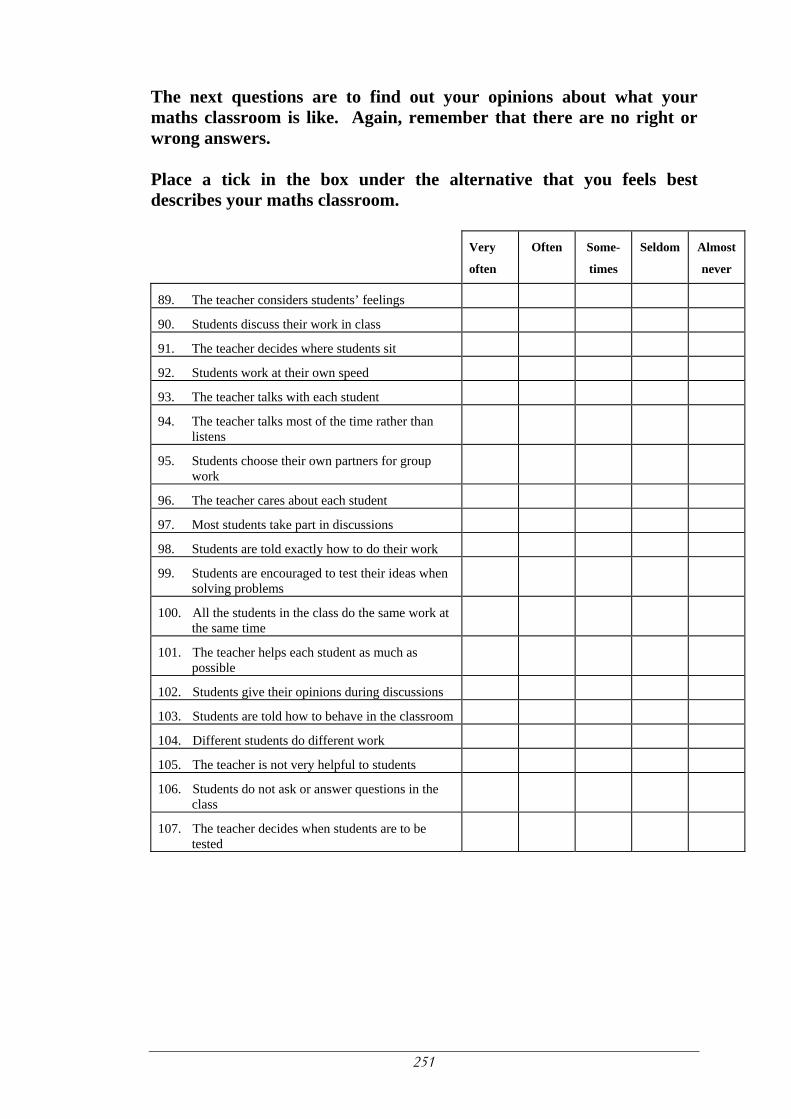
251
The next questions are to find out your opinions about what your maths classroom is like. Again, remember that there are no right or wrong answers. Place a tick in the box under the alternative that you feels best describes your maths classroom.
Very
often
Often Some-
times
Seldom Almost
never
89. The teacher considers students’ feelings
90. Students discuss their work in class
91. The teacher decides where students sit
92. Students work at their own speed
93. The teacher talks with each student
94. The teacher talks most of the time rather than listens
95. Students choose their own partners for group work
96. The teacher cares about each student
97. Most students take part in discussions
98. Students are told exactly how to do their work
99. Students are encouraged to test their ideas when solving problems
100. All the students in the class do the same work at the same time
101. The teacher helps each student as much as possible
102. Students give their opinions during discussions
103. Students are told how to behave in the classroom
104. Different students do different work
105. The teacher is not very helpful to students
106. Students do not ask or answer questions in the class
107. The teacher decides when students are to be tested
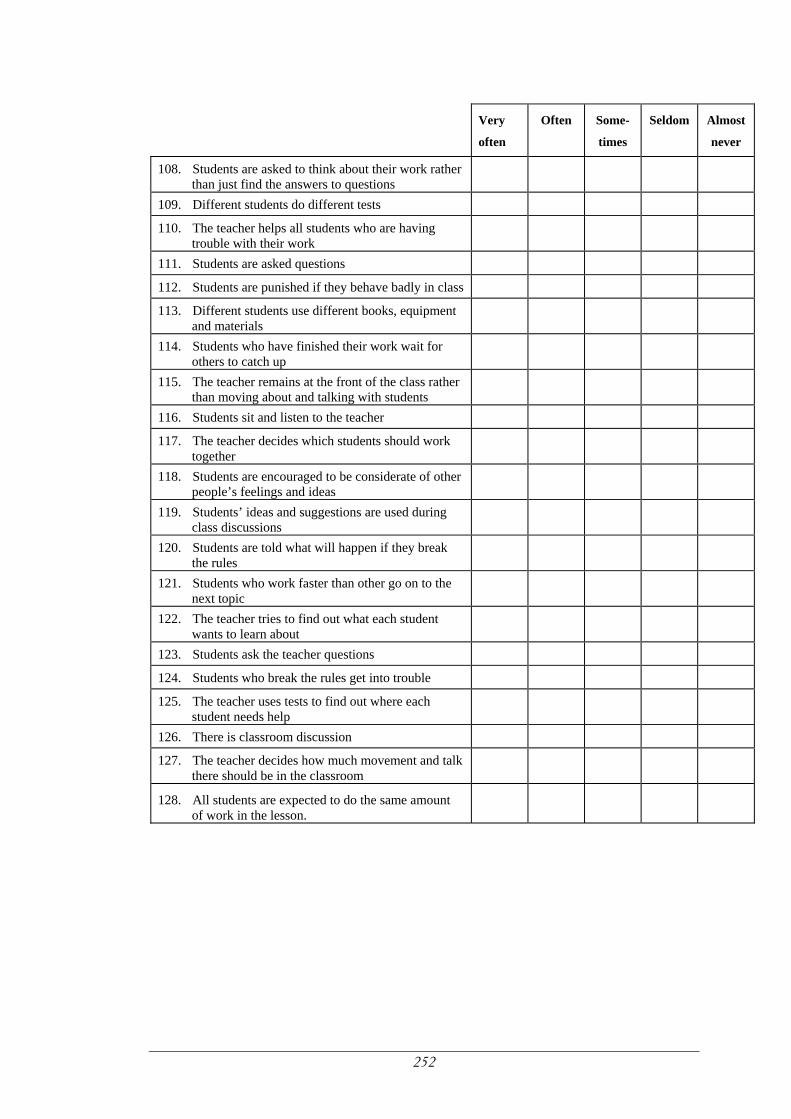
252
Very
often
Often Some-
times
Seldom Almost
never
108. Students are asked to think about their work rather than just find the answers to questions
109. Different students do different tests 110. The teacher helps all students who are having
trouble with their work
111. Students are asked questions 112. Students are punished if they behave badly in class 113. Different students use different books, equipment
and materials
114. Students who have finished their work wait for others to catch up
115. The teacher remains at the front of the class rather than moving about and talking with students
116. Students sit and listen to the teacher 117. The teacher decides which students should work
together
118. Students are encouraged to be considerate of other people’s feelings and ideas
119. Students’ ideas and suggestions are used during class discussions
120. Students are told what will happen if they break the rules
121. Students who work faster than other go on to the next topic
122. The teacher tries to find out what each student wants to learn about
123. Students ask the teacher questions 124. Students who break the rules get into trouble 125. The teacher uses tests to find out where each
student needs help
126. There is classroom discussion 127. The teacher decides how much movement and talk
there should be in the classroom
128. All students are expected to do the same amount of work in the lesson.
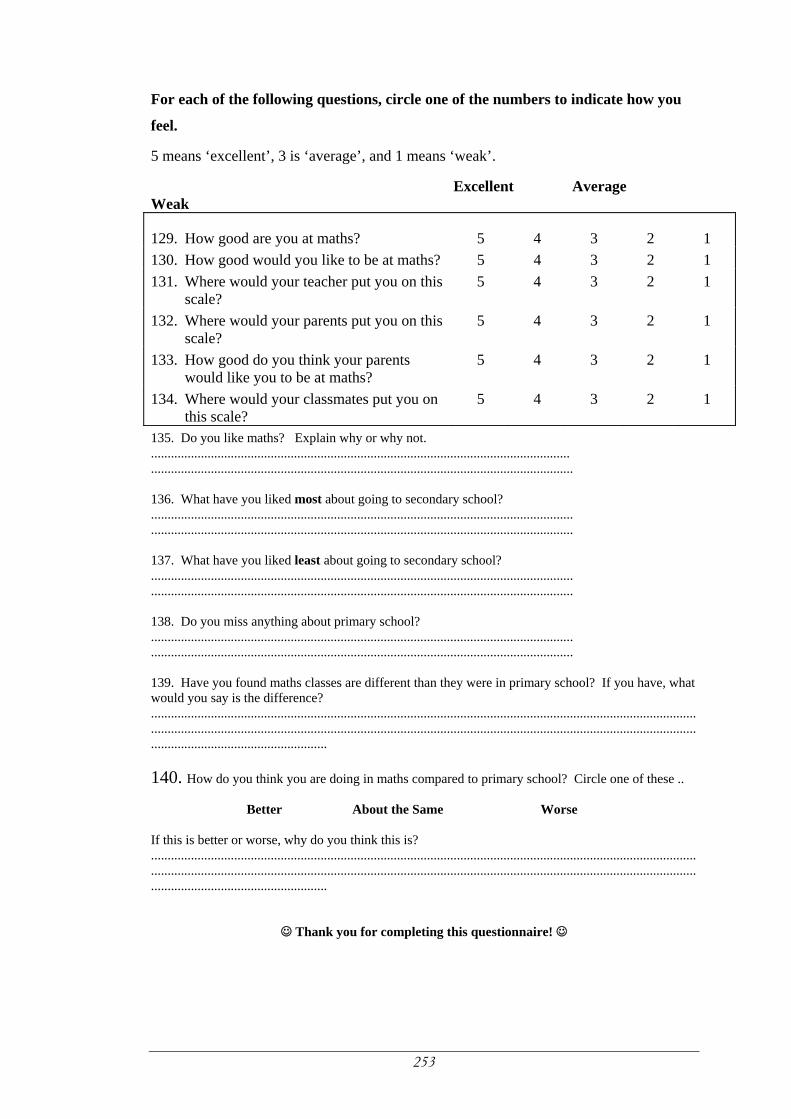
253
For each of the following questions, circle one of the numbers to indicate how you
feel.
5 means ‘excellent’, 3 is ‘average’, and 1 means ‘weak’.
Excellent Average Weak
129. How good are you at maths? 5 4 3 2 1 130. How good would you like to be at maths? 5 4 3 2 1 131. Where would your teacher put you on this
scale? 5 4 3 2 1
132. Where would your parents put you on this scale?
5 4 3 2 1
133. How good do you think your parents would like you to be at maths?
5 4 3 2 1
134. Where would your classmates put you on this scale?
5 4 3 2 1
135. Do you like maths? Explain why or why not. .............................................................................................................................. ............................................................................................................................... 136. What have you liked most about going to secondary school? ............................................................................................................................... ............................................................................................................................... 137. What have you liked least about going to secondary school? ............................................................................................................................... ............................................................................................................................... 138. Do you miss anything about primary school? ............................................................................................................................... ............................................................................................................................... 139. Have you found maths classes are different than they were in primary school? If you have, what would you say is the difference? ............................................................................................................................................................................................................................................................................................................................................................................................. 140. How do you think you are doing in maths compared to primary school? Circle one of these ..
Better About the Same Worse
If this is better or worse, why do you think this is? .............................................................................................................................................................................................................................................................................................................................................................................................
☺ Thank you for completing this questionnaire! ☺
254
Appendix 5
Teacher-rated Student Engagement Questionnaires: Stages
1, 2 and 3
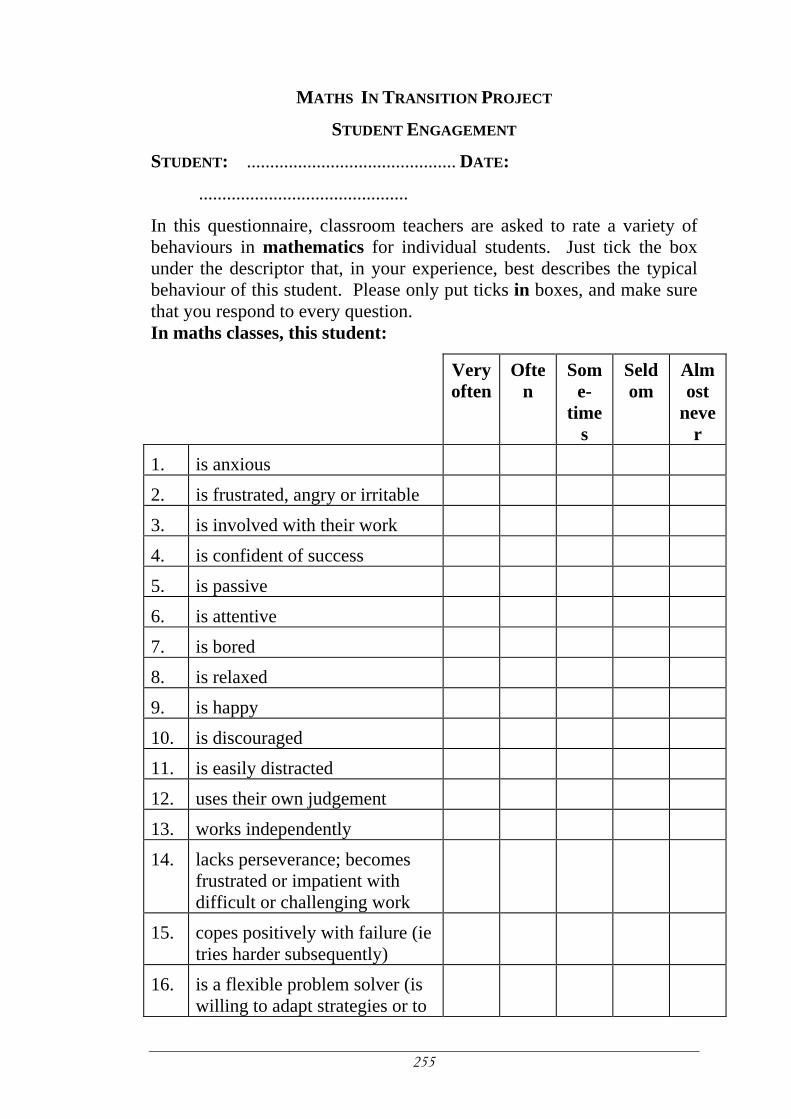
255
MATHS IN TRANSITION PROJECT
STUDENT ENGAGEMENT
STUDENT: ............................................. DATE:
.............................................
In this questionnaire, classroom teachers are asked to rate a variety of behaviours in mathematics for individual students. Just tick the box under the descriptor that, in your experience, best describes the typical behaviour of this student. Please only put ticks in boxes, and make sure that you respond to every question. In maths classes, this student:
Very often
Often
Some-
times
Seldom
Almost
never
1. is anxious 2. is frustrated, angry or irritable 3. is involved with their work 4. is confident of success 5. is passive 6. is attentive 7. is bored 8. is relaxed 9. is happy 10. is discouraged 11. is easily distracted 12. uses their own judgement 13. works independently 14. lacks perseverance; becomes
frustrated or impatient with difficult or challenging work
15. copes positively with failure (ie tries harder subsequently)
16. is a flexible problem solver (is willing to adapt strategies or to
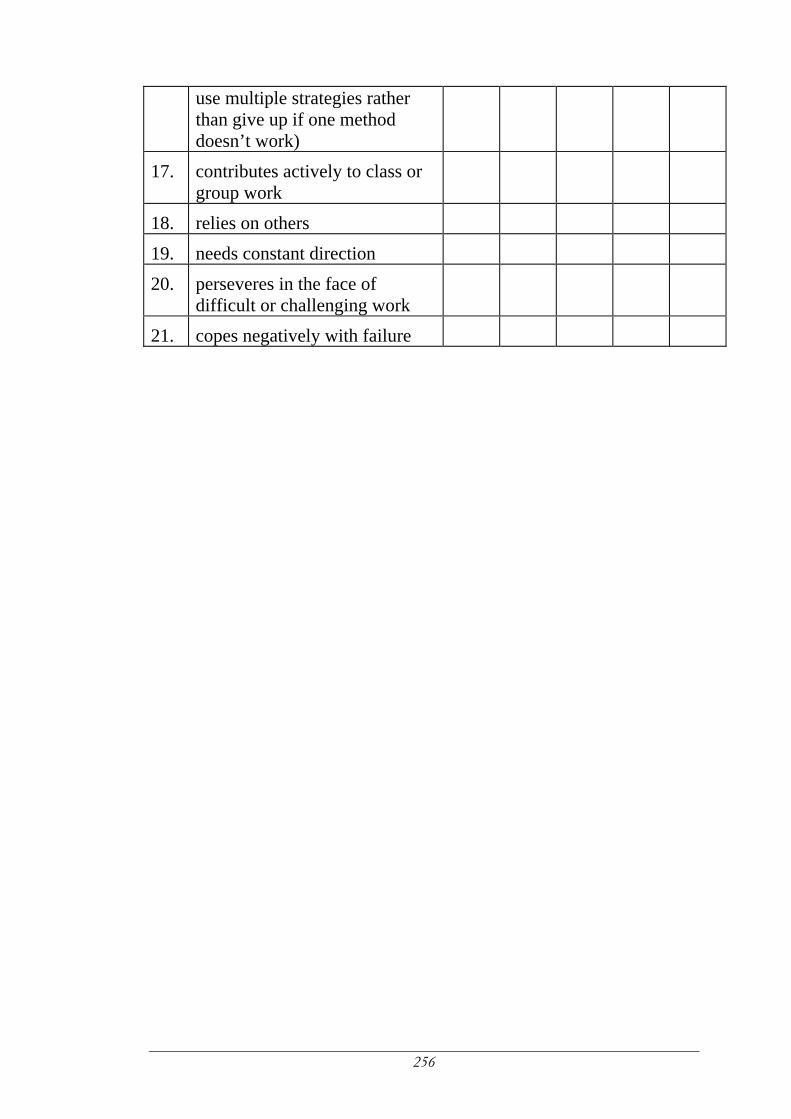
256
use multiple strategies rather than give up if one method doesn’t work)
17. contributes actively to class or group work
18. relies on others 19. needs constant direction 20. perseveres in the face of
difficult or challenging work
21. copes negatively with failure
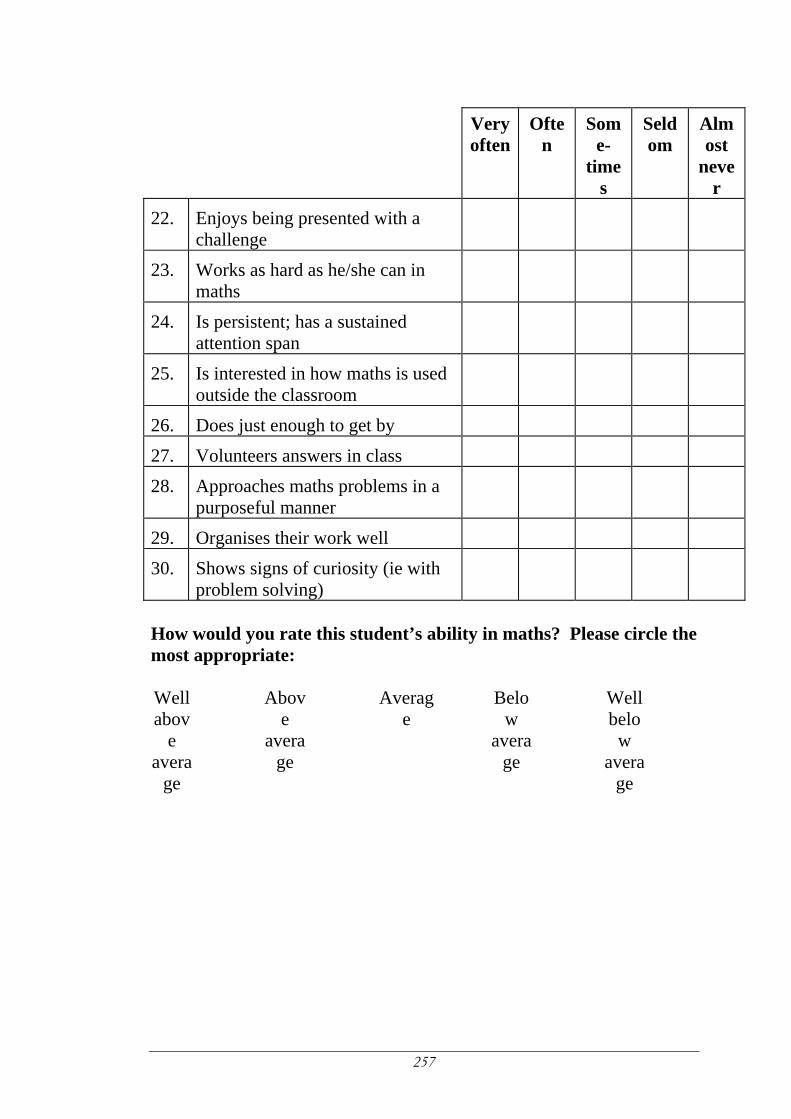
257
Very
oftenOfte
n Som
e-time
s
Seldom
Almost
never
22. Enjoys being presented with a challenge
23. Works as hard as he/she can in maths
24. Is persistent; has a sustained attention span
25. Is interested in how maths is used outside the classroom
26. Does just enough to get by 27. Volunteers answers in class 28. Approaches maths problems in a
purposeful manner
29. Organises their work well 30. Shows signs of curiosity (ie with
problem solving)
How would you rate this student’s ability in maths? Please circle the most appropriate: Well abov
e avera
ge
Above
average
Average
Below
average
Well belo
w avera
ge
258
References
Abramson, L. Y., Seligman, M. E. P., & Teasdale, J. D. (1978). Learned
helplessness in humans: Critique and reformulation. Journal of Abnormal
Psychology, 87, 49 - 74.
Aldenderfer, M. S., & Blashfield, R. K. (1984). Cluster analysis. Beverly Hills: Sage.
Ames, C. (1978). Children's achievement attributions and self-reinforcement:
Effects of self-concept and competitive reward structure. Journal of
Educational Psychology, 70(3), 345-355.
Ames, C., Ames, R., & Felker, D. W. (1977). Effects of competitive reward
structure and valence of outcome on children's achievement attributions.
Journal of Educational Psychology, 69(1), 1-8.
Anderberg, M. R. (1973). Cluster analysis for applications. New York: Academic
Press.
Australian Council for Educational Research. (1984). Progressive achievement tests in
mathematics. Hawthorn, Victoria: Author.
Australian Curriculum Studies Association. (1996). From alienation to engagement:
Opportunities for reform in the middle years of schooling (1). Canberra: Australian
Curriculum Studies Association.
Bandura, A. (1977). Self-efficacy: Toward a unifying theory of behavioural
change. Psychological Review, 84(2), 191 - 215.
Bandura, A. (1986). The social foundations of thought and action: A social cognitive theory.
Eaglewood Cliffs, NJ: Prentice Hall.
Bandura, A. (1989). Human agency in social cognitive theory. American Psychologist,
44(9), 1175 - 1184.
Board of Studies. (1995). Curriculum and standards framework. Melbourne: Board of
Studies.
259
Boomer, G. (1987). The national policy for the education of girls in Australian schools.
Canberra: Commonwealth Schools Commission.
Borkowski, J. G., Carr, M., Rellinger, E., & Pressley, M. (1990). Self-regulated
cognition: Interdependence of metacognition, attributions and self-
esteem. In B. F. Jones and L. Idol (Eds.), Dimensions of thinking and cognitive
instruction (pp. 53 - 92). Hillsdale, NJ: Lawrence Erlbaum Associates.
Bouffard, T., Boisvert, J., Vezeau, C., & Larouche, C. (1995). The impact of goal
orientation on self-regulation and performance among college students.
British Journal of Educational Psychology, 65, 317 - 329.
Brophy, J. (1983). Conceptualizing student motivation. Educational Psychologist,
18(3), 200 - 215.
Cambourne, B. (1994). Breaking the lore: An alternative view of learning. In J.
Turbill, A. Butler, B. Cambourne, & G. Langton (Eds.), Theory of others:
Frameworks . Wollongong, NSW: Illawarra Technology Corporation.
Carr, M., Borkowski, J. G., & Maxwell, S. E. (1991). Motivational components of
underachievement. Developmental Psychology, 27(1), 108 - 118.
Chapman, M., Skinner, E. A., & Baltes, P. B. (1990). Interpreting correlations
between children's perceived control and cognitive performance: Control,
agency or means-ends beliefs? Developmental Psychology, 26(2), 246 - 253.
Clarke, D. (1985). The impact of secondary schooling and secondary
mathematics on student mathematical behaviour. Educational Studies in
Mathematics, 16, 231 - 257.
Clarke, D. (1989). Mathematical behaviour and the transition from primary to secondary
school , Unpublished PhD thesis, Monash University, Melbourne.
Cockroft, W. H. (1982). Mathematics Counts . London: HMSO.
Connell, J. P. (1985). A new multidimensional measure of children's perceptions
of control. Child development, 56, 1018 - 1041.
260
Connell, J. P. (1990). Context, self, and action: A motivational analysis of self-
system processes across life span. In D. Cicchetti and M. Beeghly (Eds.),
The self in transition: Infancy to childhood (pp. 61 - 98). Chicago: University of
Chicago Press.
Connell, J. P., & Furman, W. (1984). The study of transitions. In R. N. Emde &
R. J. Harmon (Eds.), Continuities and Discontinuities in Development (pp. 153 -
173). New York: Plenum Press.
Connell, J. P., Halpern-Felsher, B. L., Clifford, E., Crichlow, W., & Usinger, P.
(1995). Hanging in there: Behavioural, psychological, and contextual
factors affecting whether African American adolescents stay in high
school. Journal of Adolescent Research, 10(1), 41 - 63.
Connell, J. P., & Ryan, R. M. (1984). A developmental theory of motivation in
the classroom. Teacher Education Quarterly, 11, 64 - 77.
Connell, J. P., & Wellborn, J. G. (1991). Competence, autonomy and relatedness:
A motivational analysis of self-system processes. In M. Gunnar & A.
Sroufe (Eds.), Minnesota Symposium on Child Psychology (Vol. 23, pp. 43 - 77).
Chicago: University of Chicago Press.
Corno, L. &Mandinach, E. B. (1983). The role of cognitive engagement in
classroom learning and motivation. Educational Psychologist, 18(2), 88 - 108.
Cotterell, J. L. (1992). School size as a factor in adolescents' adjustment to the
transition to secondary school. Journal of Early Adolescence, 12(1), 28 - 45.
Covington, M. V., & Omelich, C. L. (1979). Effort: The double-edged sword in
school achievement. Journal of Educational Psychology, 71, 169 - 182.
Curtis, M. (1997, 24.8.97). Bid to overhaul schools. The Sunday Age, p. 1.
da Vinci, L. (1982). Notebooks. (I. A. Richter, Trans.). London: Oxford
University Press. (Original work published c1500).
261
de Abreu, G., Bishop, A. J., & Pompeu, G. (1997). What children and teachers
count as mathematics. In T. Nunes & P. Bryant (Eds.), Learning and
teaching mathematics: An international perspective (pp. 233 - 264). Hove, East
Sussex: Psychology Press.
Deci, E. L., & Ryan, R. M. (1985). Intrinsic motivation and self-determination in human
behaviour. New York: Plenum Press.
Deci, E. L., & Ryan, R. M. (1991). A motivational approach to self: Integration in
personality. In R. Dienstbier (Ed.), Nebraska Symposium on Motivation (pp.
237 - 288). Lincoln: University of Nebraska Press.
Deci, E. L., Schwartz, A. J., Sheinman, L., & Ryan, R. M. (1981). An instrument
to assess adults’ orientations toward control versus autonomy with
children: Reflections on intrinsic motivation and perceived competence.
Journal of Educational Psychology, 73, 642 - 650.
Deci, E. L., Vallerand, R. J., Pelletier, L. G., & Ryan, R. M. (1991). Motivation
and education: The self-determination perspective. Educational Psychologist,
26(3 & 4), 325 - 346.
Deppeler, J. M. (1994). Characteristics of empirically derived subgroups of gifted children
based on cognitive processing patterns. Unpublished PhD thesis, Monash
University, Melbourne.
Dewey, J. (1938). Experience and Education. New York: Collier.
Dweck, C. S. (1985). Intrinsic motivation, perceived control, and self-evaluation
maintenance: An achievement goal analysis. In C. Ames and R. E. Ames
(Eds.), Research on motivation in education: Vol 2. The classroom milieu (pp. 289
- 305). San Diego, CA: Academic Press.
Dweck, C. S. (1986). Motivational processes affecting learning. American
Psychologist, 41(10), 1040 - 1048.
Dweck, C. S. (1990). Self-theories and goals: Their role in motivation,
personality, and development. Nebraska Symposium on Motivation, 38, 199 -
235.
262
Dweck, C. S., & Leggett, E. L. (1988). A social-cognitive approach to motivation
and personality. Psychological Review, 95, 256 - 273.
Eccles (Parsons), J. (1983). Expectancies, values and academic behaviours. In J.
T. Spence (Ed.), Achievement and achievement motives (pp. 75 - 146). San
Francisco: W. H. Freeman and Company.
Eccles (Parsons), J., Midgely, C., & Adler, T. F. (1984). Grade-related changes in
the school environment. Advances in motivation and achievement, 3, 283 - 331.
Eccles, J., Adler, T. F., Futterman, R., Goff, S. B., Kaczala, C. M., Meece, J. L., &
Midgley, C. (1983). Expectancies, values, and academic behaviors. In J. T.
Spence (Ed.), Achievement and achievement motivation (pp. 75-146). San
Francisco: W. H. Freeman.
Eklund, J. (1996). Cluster analysis: Telling fortunes from tea-leaves, [Online]. Available:
http://mac-30.aded.uts.edu.au/staff/john_eklund/Cluster.html.[March,
1997].
Ellerton, N. F., & Clements, M. A. (1988). The transition from year 6 to year 7: A
problem or an opportunity? In D. Firth (Ed.), Mathematics counts: Who cares?
(pp. 134-140). Melbourne: Mathematical Association of Victoria.
Feldlaufer, H., Midgley, C., & Eccles, J. S. (1988). Student, teacher, and observer
perceptions of the classroom environment before and after the transition
to junior high school. Journal of Early Adolescence, 8, 133-156.
Flavell, J. H. (1976). Metacognitive aspects of problem solving. In L. Resnick
(Ed.), The nature of intelligence (pp. 231 - 236). Hillsdale, NJ: Erlbaum.
Fraser, B. J. (1990). Individualised classroom environment questionnaire. Melbourne:
Australian Council for Educational Research Ltd.
Gardner, P. L. (1996). The dimensionality of attitude scales: a widely
misunderstood idea. International Journal of Science Education, 18(8), 913 -
919.
Garofalo, J., & Lester, F. K. (1985). Metacognition, cognitive monitoring and
mathematical performance. Journal for Research in Mathematics Education,
16(3), 163 - 176.
263
Gottfried, A. E. (1985). Academic intrinsic motivation in elementary and junior
high school students. Journal of Educational Psychology, 77(6), 631 - 635.
Harter, S. (1982). The perceived competence scale for children. Child development,
53, 87 - 97.
Harter, S. & Connell, J. P. (1984). A model of children's achievement and related
self-perceptions of competence, control and motivational orientation.
Advances in Motivations and Achievement, 3, 219 - 250.
Heider, F. (1958). The psychology of interpersonal relations. New York: Wiley.
Henderson, V., & Dweck, C. S. (1990). Adolescence and achievement. In S.
Feldman & G. Elliot (Eds.), At the threshold: Adolescent development.
Cambridge: Harvard University Press.
Hirsch, B. J., DuBois, D. L., & Brownell, A. B. (1993). Trajectory analysis of the
transition to junior high school: Implications for prevention and policy.
Prevention in Human Services, 10(2), 83 - 101.
Kelly, H. (1994, July). The transition from primary to secondary. Board of Studies
Newsletter, 7.
Kloosterman, P. (1988). Self-confidence and motivation in mathematics. Journal of
Educational Psychology, 80, 345 - 351.
Kloosterman, P. (1990). Attributions, performances following failure, and
motivation in mathematics. In E. Fennema & G. C. Leder (Eds.),
Mathematics and Gender (pp. 96 - 127). New York: Teachers College Press.
Kowalski, P. S., Harter, S., & Whitesell, N. (1986). Self-perceptions in the transition to
seventh grade. Paper presented at the Biennial Meeting of the Society for
Research on Adolescence, Madison, Wisconsin.
Kurtz, B. E., & Borkowski, J. G. (1984). Children’s metacognition: Exploring
relations among knowledge, process, and motivational variables. Journal of
Experimental Child Psychology, 37, 335 - 354.
264
Lester, F. K., & Garofalo, J. (1982, March). Metacognitive aspects of elementary school
students' performance on arithmetic tasks. Paper presented at the Annual
Meeting of the American Educational Research Association, New York.
Levine, G. (1991). A guide to SPSS for Analysis of Variance. Hillsdale, NJ: Lawrence
Erlbaum Associates.
Lubbock, J. (1897). The pleasures of life. London: MacMillan.
Lynch, M., & Cicchetti, D. (1997). Children's relationships with adults and peers:
An examination of elementary and junior high school students. Journal of
School Psychology, 35(1), 81 - 99.
McLeod, D. B. (1990). Research on affect in mathematics education: A
reconceptualization. In D. Grouws (Ed.), Handbook of research in mathematics
teaching and learning (pp. 575 - 596) . New York: Mc Millan.
Midgley, C., & Feldlaufer, H. (1987). Students' and teachers' decision-making fit
before and after the transition to junior high school. Journal of Early
Adolescence, 7, 225-241.
Midgley, C., Feldlaufer, H., & Eccles, J. S. (1989a). Change in teacher efficacy and
student self- and task-related beliefs in mathematics during the transition
to junior high school. Journal of Educational Psychology, 81(2), 247 - 258.
Midgley, C., Feldlaufer, H., & Eccles, J. S. (1989b). Student/teacher relations and
attitudes towards mathematics before and after the transition to junior
high school. Child Development, 60, 981 - 992.
Milligan, G. W., & Cooper, M. C. (1985). An examination of procedures for
determining the number of clusters in a data set. Psychometrika, 50, 159 -
179.
Miserandino, M. (1996). Children who do well in school: Individual differences in
perceived competence and autonomy in above-average children. Journal of
Educational Psychology, 88(2), 203 - 214.
Mojena, R. (1977). Hierarchical grouping methods and stopping rules: An
evaluation. Computer Journal, 20, 359 - 363.
265
National Board of Employment Education and Training. (1993). In the middle:
Schooling for young adolescents (Compulsory years of schooling Project paper
no.7). Canberra: Australian Government Publishing Service.
Nicholls, J. G. (1983). Conceptions of ability and achievement motivation: A
theory and its implications for education. In S. G. Paris, G. M. Olson, and
H. W. Stevenson (Eds.), Learning and motivation in the classroom (pp. 211 -
237). Hillsdale, New Jersey: Lawrence Erlbaum Associates.
Nicholls, J. G. (1984a). Achievement motivation: Conceptions of ability,
subjective experience, task choice and performance. Psychological Review, 91,
328 - 346.
Nicholls, J. G. (1984b). Conceptions of ability and achievement motivation. In C.
Ames and R. E. Ames (Eds.), Research on motivation in education. Vol 1.
Student Motivation (pp. 39 - 73). San Diego, CA: Academic Press.
Nicholls, J. G., Cheung, P. C., Lauer, J., & Patashnick, M. (1989). Individual
differences in academic motivation: Perceived ability, goals, beliefs, and
values. Learning and Individual Differences, 1(1), 63 - 84.
Nicholls, J. G., & Miller, A. T. (1984). Development and its discontents: The
differentiation of the concept of ability. Advances in Motivation and
Achievement, 3, 185 - 218.
Nisbet, J. D., & Entwistle, N. J. (1969). The transition to secondary education. London:
University of London Press.
Nolen-Hoeksema, S., Girgus, J. S., & Seligman, M. E. P. (1986). Learned
helplessness in children: A longitudinal study of depression, achievement,
and explanatory style. Journal of Personality and Social Psychology, 52, 435 -
442.
Norušis, M. J. (1993). SPSS for Windows (Version 6.01). Chicago: SPSS Inc.
Paris, S. G., & Winograd, P. (1990). How metacognition can promote academic
learning and instruction. In B. F. Jones & L. Idol (Eds.), Dimensions of
thinking and cognitive instruction (pp. 15 - 52). Hillsdale, NJ: Lawrence
Erlbaum Associates.
266
Patrick, B. C., Skinner, E. A., & Connell, J. P. (1993). What motivates children’s
behaviour and emotion? Joint effects of perceived control and autonomy
in the academic domain. Journal of Personality and Social Psychology, 65(4), 781
- 791.
Pedro, J. D., Wolleat, P., Fennema, E., & Becker, A. D. (1981). Election of high
school mathematics by females and males: Attributions and attitudes.
American Educational Research Journal, 18, 207 - 218.
Pierson, L. H., & Connell, J. P. (1992). Effect of grade retention on self-system
processes, school engagement, and academic performance. Journal of
Educational Psychology, 84(3), 300 - 307.
Pintrich, P. R., & Blumenfeld, P. C. (1985). Classroom experience and children’s
self-perceptions of ability, effort, and conduct. Journal of Educational
Psychology, 77(6), 646 - 657.
Power, C., & Cotterell, J. (1981). Changes in students in the transition between primary
and secondary school . Canberra: Australian Government Publishing Service.
Reuman, D. A. (1989). Effects of between- classroom ability grouping in mathematics at the
transition to junior high school. Paper presented at the Annual Meeting of the
American Educational Research Association, San Francisco.
Rotter, J. B. (1966). Generalized expectancies for internal versus external control
of reinforcement. Psychological Monographs, 80.
Ryan, R. M., & Connell, J. P. (1989). Perceived locus of causality and
internalization: Examining reasons for acting in two domains. Journal of
Personality and Social Psychology, 57(5), 749 - 761.
Ryan, R. M., Connell, J. P., & Deci, E. L. (1985). A motivational analysis of self-
determination and self-regulation in the classroom. In C. Ames and R.
Ames (Eds.), Research on motivation in education: Vol 2. The classroom milieu.
San Diego, CA: Academic Press.
267
Ryan, R. M., & Grolnick, W. S. (1986). Origins and pawns in the classroom: Self-
report and projective assessments of individual differences in children's
perceptions. Journal of Personality and Social Psychology, 50, 550 - 558.
Ryan, R. M., Stiller, J. D., & Lynch, J. H. (1994). Representations of relationships
to teachers, parents, and friends as predictors of academic motivation and
self-esteem. Journal of Early Adolescence, 14(2), 226 - 249.
Ryckman, D. B., & Peckham, P. (1987). Gender differences in attributions for
success and failure across subject areas. Journal of Educational Research, 81,
120 - 125.
Schmitz, B., & Skinner, E. (1993). Perceived control, effort, and academic
performance: Interindividual, intraindividual, and multivariate time-series
analyses. Journal of Personality and Social Psychology, 64(6), 1010 - 1028.
Schoenfeld, A. H. (1981, April). Episodes and executive decisions in mathematical problem
solving. Paper presented at the Annual Meeting of the American
Educational Research Association, Los Angeles.
Schunk, D. H. (1990). Goal-setting and self-efficacy during self-regulated
learning. Educational Psychologist, 25, 71 - 86.
Sells, L. W. (1992). Mathematics: A critical filter. In M. Wilson (Ed.), Options for
Girls - A Door to the Future (pp. 79 - 82). Texas: Pro. Ed.
Silver, E. A. (1982). Thinking about problem solving: Towards an understanding of
metacognitive aspects of problem solving (manuscript ). San Diego: Department
of Mathematical Sciences, San Diego State University.
Simmons, R. G., Blyth, D. A., Van Cleave, E. F., & Bush, D. M. (1979). Entry
into early adolescence: The impact of school structure, puberty and early
dating on self-esteem. American Sociological Review, 44, 948 - 967.
Simmons, R. G., & Rosenberg, F. (1975). Sex, sex-roles and self-image. Journal of
Youth and Adolescence, 4, 229 - 258.
268
Skinner, E. A. (1990a). Age differences in the dimensions of perceived control
during middle childhood: Implications for development;
conceptualizations and research. Child development, 61, 1882 - 1890.
Skinner, E. A. (1990b). Development and perceived control: A dynamic model
of action in context. In M. R. Gunnar and L. A. Sroufe (Eds.), Minnesota
symposium on child psychology (Vol. 23, pp. 167 - 216). Chicago: University of
Chicago Press.
Skinner, E. A. (1995). Perceived Control, Motivation and Coping. Thousand Oaks,
California: Sage Publications.
Skinner, E. A., & Belmont, M. J. (1993). Motivation in the classroom: Reciprocal
effects of teacher behaviour and student engagement across the school
year. Journal of Educational Psychology, 85(4), 571 - 581.
Skinner, E. A., Chapman, M., & Baltes, P. B. (1988). Beliefs about control,
means-end and agency: A new conceptualization and its measurement
during childhood. Journal of Personality and Social Psychology, 54, 117 - 133.
Skinner, E. A., Schindler, A., & Tschechne, M. (1990). Self-other differences in
children’s perceptions about the causes of important events. Journal of
Personality and Social Psychology, 58(1), 144- 155.
Skinner, E. A., Wellborn, J. G., & Connell, J. P. (1990). What it takes to do well
in school and whether I’ve got it: The role of perceived control in
children’s engagement and school achievement. Journal of Educational
Psychology, 82, 22 - 32.
Stevens, J. (1996). Applied multivariate statistics for the social sciences. Mahwah, New
Jersey: Lawrence Erlbaum Associates.
Stiller, J. D., & Ryan, R. M. (1992). Teachers, parents and student motivation: The effects
of involvement and autonomy support. Paper presented at the Annual meeting of
the American Educational Research Association, San Francisco.
Tabachnick, B. G., & Fidell, L. S. (1989). Using multivariate statistics. (second ed.).
New York: Harper Collins.
269
Tero, P. F., & Connell, J. P. (1984, April). When children think they've failed: An
academic coping inventory. Paper presented at the Annual Meeting of the
American Educational Research Association, New Orleans, L.A.
Ward, J. H. (1963). Hierarchical grouping to optimize an objective function.
American Statistical Association Journal, 58, 236 - 244.
Weiner, B. (1972). Attribution theory, achievement motivation, and the
educational process. Review of Educational Research, 42(2), 203 - 214.
Weiner, B. (1974). Achievement motivation and attribution theory. Morristown, NJ:
General Learning Press.
Weiner, B. (1985). An attributional theory of motivation and emotion. New York:
Springer Verlag.
Weiner, B., Graham, S., Stern, P., & Lawson, M. E. (1982). Using affective cues
to infer causal thoughts. Developmental Psychology, 18(2), 278 - 286.
Wellborn, J. G., & Connell, J. P. (1987). Manual for the Rochester assessment package
for schools. Rochester, NY: University of Rochester.
White, R. W. (1959). Motivation reconsidered: The concept of competence.
Psychological Review, 66, 297 - 333.
Wiersma, W. (1995). Research methods in education. Boston: Allyn and Bacon.
Wigfield, A., Eccles, J. S., MacIver, D., Reuman, D. A., & Midgley, C. (1991).
Transitions during early adolescence: Changes in children’s domain-
specific self - perceptions and general self-esteem across the transition to
junior high school. Developmental Psychology, 27(4), 552 - 565.
Wolleat, P. L., Pedro, J. D., Becker, A. D., & Fennema, E. (1980). Sex differences
in high school students' causal attributions of performance in mathematics.
Journal for Research in Mathematics Education, 11, 35.