Embed Size (px)
DESCRIPTION
Building a Culture of Quality. Engaging Our Providers Presented by: Linda Weiland, MBA Deborah Donovan, MLLS, RHIA, CPHQ. Agenda. Introduction Overview of the Highmark Pay for Performance Programs Our Engagement Philosophy Supporting the Spread Program Results and Outcomes - PowerPoint PPT Presentation
Citation preview

1
Engaging Our Providers
Presented by:
Linda Weiland, MBADeborah Donovan, MLLS, RHIA, CPHQ
Building a Culture of Quality

2
Agenda
Introduction Overview of the Highmark Pay for Performance
Programs Our Engagement Philosophy Supporting the Spread Program Results and Outcomes Highmark’s Future Provider Quality Vision

3
Today’s Landscape
Institute of Medicine’s Landmark Report
Errors…are costly in terms of loss of trust in the health care system by patients and diminished satisfaction by both patients and health professionals.
More commonly, errors are caused by faulty systems, processes, and conditions that lead people to make mistakes or fail to prevent them.
The process of developing and adopting standards also helps to form expectations for safety among providers and consumers.

4
Today’s Landscape
IOM’s Crossing the Quality Chasm• A new health system for the 21st century
The right care for every person every time that is……
•Safe
•Effective
•Efficient
•Patient Centered
•Timely
•Equitable

5
Today’s Landscape
Institute for Healthcare Improvement• 1 Million and 5 Million Lives Campaign
National Quality Forum• Measurement Standardization and Endorsement
Four Cornerstones for Value Driven Healthcare• Interoperable Health Information Technology• Measure and Publish Quality Information• Measure and Publish Cost Information• Promote Efficiency and Quality through Incentives
Consumer Disclosure Project – Patient Charter

6
Profiling and Pay for PerformanceWhy Profile Providers and Pay for
Performance?:o Address consumer demands for increased
information about provider quality & safety.
o Align a portion of provider reimbursement with performance.
o Support the evolution of quality improvement and hardwiring excellence
Quality
Value
Cost

7
The National P4P Industry Evolution
PCP HEDIS measures PCP + Facility Measures, multiple specialties
Enhanced data collection, clinical data exchanges, data aggregation
Hospital measures Balanced scorecard Standardized measures + outcomes + attribution methodologies
Minimal consumer Reporting
EB quality and affordability measures
Efficiency
POS and HMO product lines
Open access products; High deductible health plans; PPO prevalence (commercial)
Actionable information – registries, reminder alerts – Genesis of the Patient Centered Medical Home concept.
Withhold or bonus based payouts (utilization focused)
Differential fee schedules
(clinical outcome improvement focused)
PHR – eHR integration
“Quest” for Interoperability and data aggregation.
Transparency
Enhanced provider directories (ratings)
Informational Static consumer report cards Demonstrable ROI
Low impact on cost Safety and medication errors Member Engagement
Preventive care Provider IT investment Point of care notification
Existing data sets Collection of non-claims data Patient centered coordinated care
Features
Stage 11996 - 2003
Stage 32007 - 2010
Stage 22004 - 2006
Benefits

88
Our Programs

99
10
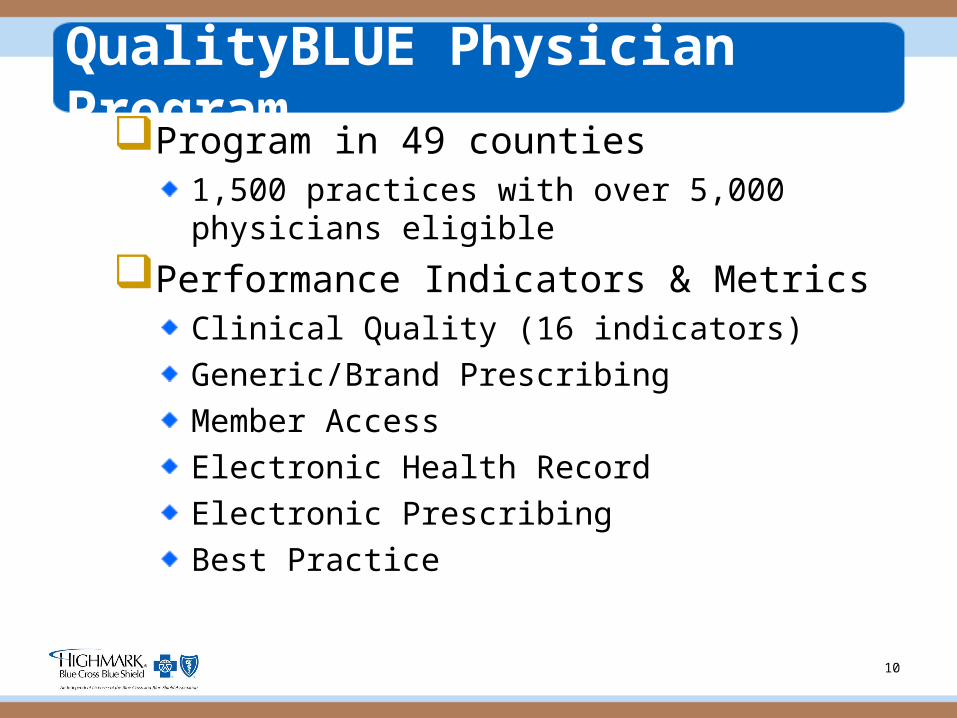
QualityBLUE Physician ProgramProgram in 49 counties
1,500 practices with over 5,000 physicians eligible
Performance Indicators & MetricsClinical Quality (16 indicators)
Generic/Brand Prescribing
Member Access
Electronic Health Record
Electronic Prescribing
Best Practice
11
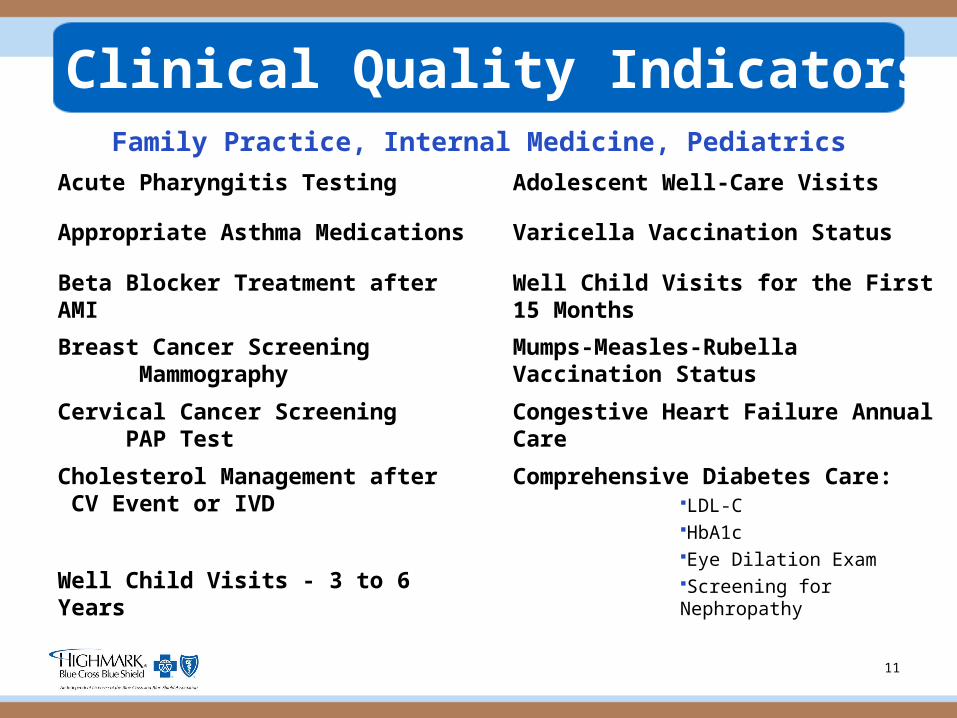
Clinical Quality Indicators
o Acute Pharyngitis Testing o Adolescent Well-Care Visits
o Appropriate Asthma Medications o Varicella Vaccination Status
o Beta Blocker Treatment after AMI o Well Child Visits for the First 15 Months
o Breast Cancer Screening Mammography
o Mumps-Measles-Rubella Vaccination Status
o Cervical Cancer Screening PAP Test
o Congestive Heart Failure Annual Care
o Cholesterol Management after CV Event or IVD
o Well Child Visits - 3 to 6 Years
o Comprehensive Diabetes Care: LDL-CHbA1cEye Dilation ExamScreening for Nephropathy
Family Practice, Internal Medicine, Pediatrics

12
Best Practice Innovative practice improvements focusing on medical
management and clinical quality issues that are not focus
areas within the QualityBLUE program (innovation and
core problem solving)
Reinforces and teaches Continuous Quality Improvement
model for primary care practice
Accept: ABIM, ABFM and ABP Performance in Practice Modules
AAFP Metric Program
NCQA Certifications
13
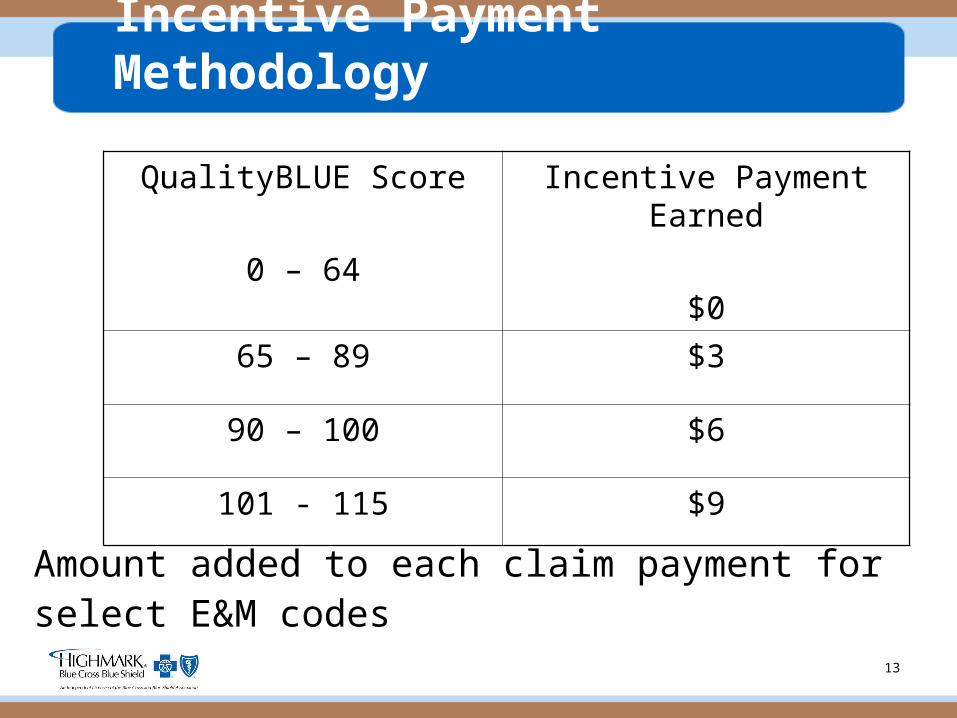
Incentive Payment Methodology
QualityBLUE Score
0 – 64
Incentive Payment Earned
$0
65 – 89 $3
90 – 100 $6
101 - 115 $9
Amount added to each claim payment for select E&M codes

14
Practice Performance(all specialties 4th Quarter 2008)
Total Quality Score Range
Incentive Number Percentage
Below 64 $0 535 41%
65-89 $3 601 46%
90-100 $6 149 11%
Over 100 $9 27 2%
Total 1,312 100
1515
16
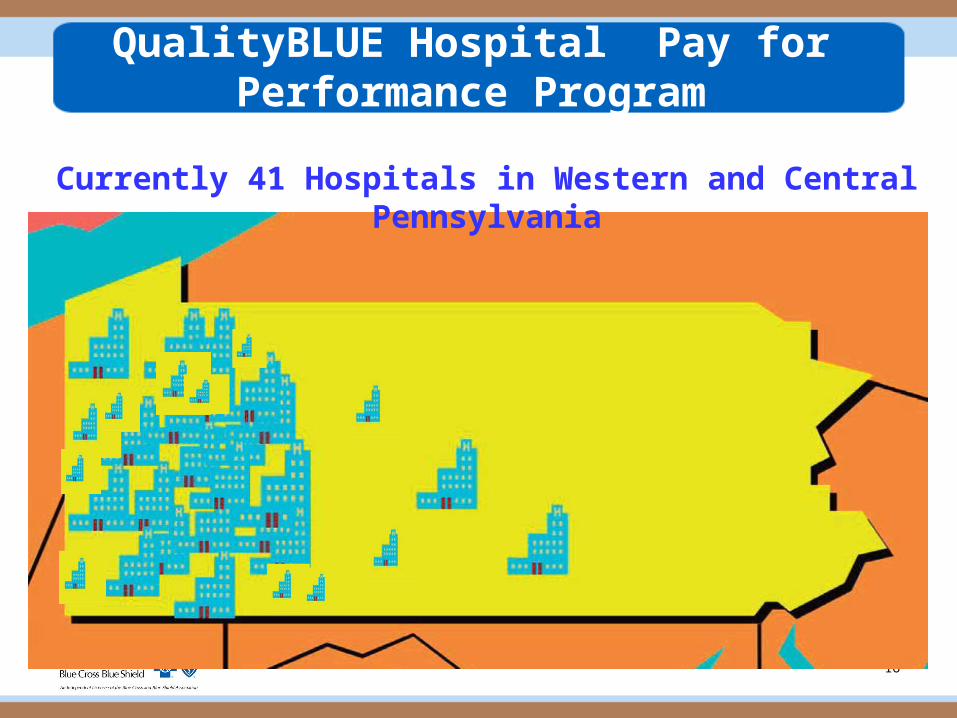
QualityBLUE Hospital Pay for Performance Program
Currently 41 Hospitals in Western and Central Pennsylvania

17
Alignment with National Programs
Surgical Care Improvement Project (SCIP)
“Get With The Guidelines”
National Healthcare Safety Network
Hospital Compare
Program Growth & Enhancement
Program Standardization 2001 -2008 Clinical Indicators Administrative Processes Improved Standardized measurement, tracking, reporting
Quality & Compliance Reviews Conducted by Highmark’s Internal Audit Department & Quality Insights of PA
Alignment with National Programs National Quality Forum measures American Heart Association – Get With the Guidelines Surgical Care Improvement Project CMS Hospital Compare Centers for Disease Control IHI 5 Million Lives

18
Performance-Based Evaluation
Program evaluation based on hospital’s performance on established program indicators (90%)
CMS Quality Measurement Set Performance (10%)
The number of CMS Quality Measures
at or above
the PA State Average

19
CMS Hospital Compare
Dates of Report: July 07-June 08
Measure set Measure PA Avg. Hospital
Heart Attack
ACE Inhibitor or ARB for LVSD 82% NA
Aspirin at arrival 95% 92%
Aspirin prescribed at d/c 93% NA
Beta blocker at arrival 92% 100%
Beta blocker prescribed at d/c 95% NA
PCI within 90 minutes 58% NA
Fibrinolytic Medication Within 30 Minutes Of Arrival if appropriate 33% NA
Smoking Cessation 90% NA
Heart Failure
ACE or ARB for LVSD 83% 62%
Assessment of LVF 90% 89%
Discharge Instruction 68% 73%
Smoking Cessation 88% NA

20
Performance Indicators & MetricsClinical Indicators:
Reduction of Methicillin Resistant Staphylococcus aureus (MRSA)
Reduction of Central Line Associated Bloodstream Infections (CLAB)
Perinatal Elective Induction Surgical Care Improvement Project (SCIP)
Infection Prevention SCIP VTE Prevention SCIP and ICU
Get With The Guidelines (GWTG) (AHA) Stroke
Clostridium difficile (CDAD) Catheter Associated Urinary Tract Infection (UTI)

21
Why These Indicators Matter
More than 1,700 reports related to methicillin-resistant Staphylococcus aureus (MRSA), including 14 deaths, have been submitted to the Pennsylvania Patient Safety Authority since June 2004 through October 2007. (2008 Patient Safety Authority Advisory)
In 2006, hospitals reported that 30,237 patients contracted an infection during their hospitalization, a rate of 19.2 per 1,000 cases. (PHC4 2008 Hospital Acquired Infection Report)
The urinary tract is the most common site of healthcare-associated infection, accounting for more than 40% of the total number reported by acute-care hospitals and affecting an estimated 600,000 patients per year. (CDC)

22
Why These Indicators Matter About 780,000 Americans each year suffer a new or recurrent
stroke. That means, on average, a stroke occurs every 40 seconds.(AHA)
Adverse events during labor and delivery can impose a heavy physical, psychological, and financial toll on the baby, family, care providers, and the community. In 2005, obstetrical physicians were involved in 1,258 (down from 2004) obstetrics-related award payments at a mean payment of $523,534 and a median payment of $300,000.
From 1993 through 2003 the number of reported cases of C. difficile colitis in hospitalized patients doubled, associated mortality increased by 150%, and the number of colectomies attributable to the infection increased by 50%, according to an article in the July issue of Archives of Surgery.

23
Reimbursement Strategies
QualityBLUE Hospital Pay for Performance offered via Provider Contracting discussion
Hospitals place portion of reimbursement at risk Lump Sum and Rate Based Reimbursement
Over $42 Million in Performance Based
Reimbursement

2424
Highmark’s Engagement Philosophy

25
Highmark’s Engagement Philosophy
Highmark - Healthcare Provider-Account-Member Collaboration
Improved Health Status – Patients; Shared Savings and Efficiencies
Dedicated Clinical Consultants
Evidence Based Care Tools, Best Practices and
Information
Dedicated Medical Directors
Clinical Pharmacist
Network, Peer, Customized Data, Trends
Reports, Action Plans, Performance Targets
Network Provider Relations Representatives
Accounts, Clients Members
26
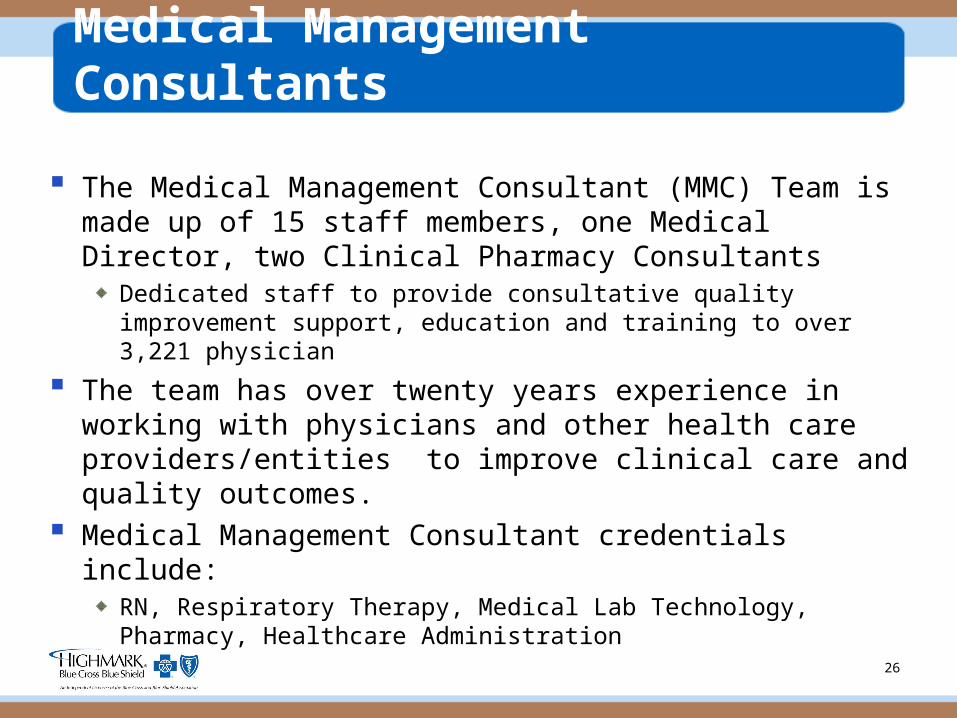
Medical Management Consultants
The Medical Management Consultant (MMC) Team is made up of 15 staff members, one Medical Director, two Clinical Pharmacy Consultants
Dedicated staff to provide consultative quality improvement support, education and training to over 3,221 physician
The team has over twenty years experience in working with physicians and other health care providers/entities to improve clinical care and quality outcomes.
Medical Management Consultant credentials include:RN, Respiratory Therapy, Medical Lab Technology, Pharmacy, Healthcare Administration

27
OUR PROCESSES
Medical Management Role Assess where the practice lies against quality performance criteria - the
Quality Improvement Roadmap to Success Evaluate the practice office operations to determine process
improvement opportunities - Clinical Office Process Evaluation Key Questions
Meet with the physicians and staff to provide feedback and recommend a course of action to improve clinical quality and office operations
Collaborate with the physicians and staff to create a work plan that:• defines the problem; • establishes baseline measures; • specifies action steps; • designates responsible team member; • establishes a timeline for expected outcomes; and • incorporates a control mechanism to ensure the operations don’t
falter. Scheduled meetings to monitor and report on the practice’s
performance against their clinical quality and process improvement activities

28
What’s Different? Activity
Medical ManagementConsultants
Provider Relations
ClinicalQuality
Outcomes Nurses
Provide consultative support and education on QualityBLUE program administrative guidelines and operations X X
Provides administrative support to physicians on Highmark activities such as contracting and credentialing X X X
Establishes and facilitates quality committees of physician leaders X X
Develops clinical business rules for PCP and Specialist profiles X
Provides high level intervention and education on clinical operations and evidence based medicine guidelines
X
Develops practice specific clinical quality profiles, outcomes data and pharmacy reports X
Collaborates with physicians and administrators in the development of targeted performance improvement work plans
X
Provides on-site process engineering based and process improvement focused on evidence based care protocols X
Identifies Best Practice opportunities to incorporate into practice operations X
Works with external vendors to incorporate new tools into the physician offices such as Generic Sampling Machines, GSK Diabetes Education Series, etc.
X
Conducts data analysis of physician performance to determine gaps in practice operations and opportunities for improvement as shown by practice trends and variances
X
Acts as an incubator for carrying out new and exploratory initiatives such as the NCQA Pilot Program for Physician Recognition, CHRPC Urgent Care Pilot, Drugs to void in the Elderly, etc.
X
Establishes long-term relationships with physicians and their staff to allow for partnering with Highmark in the advancement of quality initiatives as the single point of clinical contact with the providers
X

29
Hospital QualityBLUE Team
Team background and credentials:• Medical Technology• RN• Certified Infection Control Professional• Speech Pathology• Nursing Home Administrator• Registered Health Information Administrator• Certified Professional Healthcare Quality

30
Hospital Engagement
Pre-engagement program overview QualityBLUE Orientation and on site visit for new
participants Mid Year and Year End hospital visits with
hospital quality improvement teams and hospital executive team
Lunch and Learn for new program year Best Practices Forum Focus Groups

3131
Supporting the Spread

32
QualityBLUE Best Practices Forum
QualityBLUE Hospital

33
QualityBLUE Best Practices Forum
QualityBLUE Physician

34
Newsletters

35
NCQA Quality Recognition Pilot

36
NCQA Physician Recognition Pilot
The Medical Management Consultant Team collaborated with physicians to enhance their practice processes and improve their delivery of care.
The goal of the Pilot Program was to increase the number of physicians designated as a provider of high quality care in Diabetes, Heart/Stroke and/or utilizing systematic processes in the delivery of care (Physician Practice Connections – PPC) by attaining NCQA recognition by 80% within a one year period.
Over 500 physician applied for the pilot and 370 physicians achieved NCQA designation

3737
Provider Transparency
38
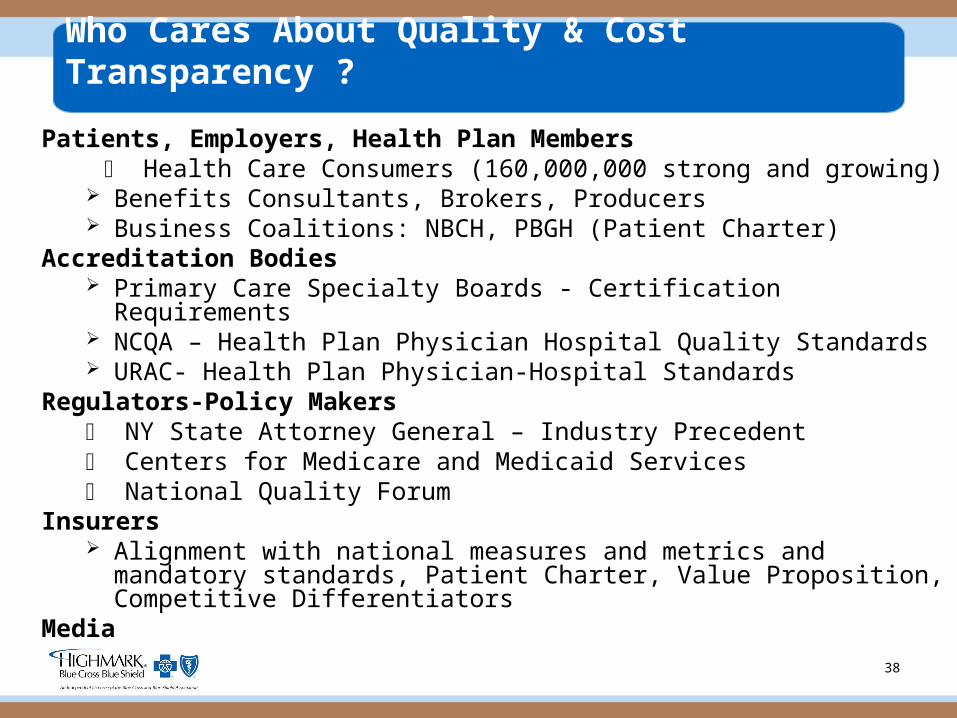
Who Cares About Quality & Cost Transparency ?
Patients, Employers, Health Plan Members Health Care Consumers (160,000,000 strong and growing) Benefits Consultants, Brokers, Producers Business Coalitions: NBCH, PBGH (Patient Charter)
Accreditation Bodies Primary Care Specialty Boards - Certification Requirements NCQA – Health Plan Physician Hospital Quality Standards URAC- Health Plan Physician-Hospital Standards
Regulators-Policy Makers NY State Attorney General – Industry Precedent Centers for Medicare and Medicaid Services National Quality Forum
Insurers Alignment with national measures and metrics and mandatory
standards, Patient Charter, Value Proposition, Competitive Differentiators
Media

39
Physician Transparency Addition of Quality Data December 2007
• Initial launch in Western Pennsylvania Based on QualityBLUE data Available to members only Modifications based on physician feedback Physician’s own data viewable on NaviNet Data refreshed quarterly
Physician transparency across network in 2009

40

41

42
Physician Transparency
Coordination with future Blue Cross Blue Shield Association Clinical Quality and Transparency
• Evolving National Strategy• Attribution, Clinical Quality, Efficiency Index• Evaluation of Consumer Disclosure Project –
Patient Charter • NCQA Physician Hospital Quality Standards• URAC Standards (in public comment)

4343
Results & Outcomes

44
Case Study: Chestnut Ridge Primary Care (CRPC)
CRPC partnered with Highmark to implement an initiative on-site Urgi-Care Center to reduce unnecessary Emergency Room (ER) visits and decrease care costs.
CRPC established extended non-traditional hours and reserved open slots for same day urgent care visits.
CRPC developed patient letters, office posters and informational brochures. brochures
• 13,391 letters and educational to approximately 20,000 Highmark members
• “Train the Trainer” methodology• Physicians volunteered to work the extended hours
Results:21% reduction in ER visitsDecline in the number of admissions via the ERSavings ranging from $220 - $831 per episode of care
Urgi-Care vs. the ER during the two month pilot period.

45
“BEST of BLUES” AWARD
The QualityBLUE Physician P4P Program was the recipient of a Best of Blues Award in 2007 from the Blue Cross Blue Shield Association
The Physician P4P Program is based upon a strategy that includes:• fair and reasonable base pay; • additional incentives tied to the successful achievement
of various quality and service indicators; and • dynamic measures that are • adjusted and/or replaced over time to reflect market
changes.
The one feature that sets Highmark’s Physician P4P Program apart from other health plans is the added support the physicians are given via Medical Management Consultants

46
Generic/Brand Prescribing
Performance assessed relative to network specialty average, recalculated quarterly
The 2003 generic prescribing rate was 49%
Currently the network percentage is 65-70%, depending on specialty

4747
Improvement in Generic Prescribing Rates

48
Generic Prescribing Journal of Managed Care Pharmacy published a
recent Highmark study• Employers and Highmark saved a combined
total of $850,000 in 2005 and 2006 attributed to higher generic drug disbursement
Since 2003, Highmark and its Western Pennsylvania
members have saved $2.5 million through the use of
MedVantix kiosks

49
QualityBLUE FY08: MRSA Impacts & Outcomes
MRSA A: Community Acquired
Admission Cultures B: Hospital Acquired
Discharge Cultures C: A & B Combined
5,349 (3.7%) patients were identified as positive for MRSA
4,597 (4.9%) patients identified upon admission implemented appropriate
precautions Reduced transmission
94,147
4,597 +
50,570
752+144,717
5,349+
0
50,000
100,000
150,000
A B C
Identification of "Unknown"MRSA Carriers
# of Cultures # Positive
4.9%
1.5%
3.7%

50
QualityBLUE FY08: CLAB Impacts & Outcomes
CLAB National rate: 2.7 infections/ 1000 line
days (CDC-NHSN) 907 CLABs expected
QB actual for 08 = 341 566 CLABs averted Cost of a CLAB
($38,703) X 566 = $21.9 Million
4
19
3 2 1
0
5
10
15
20
# o
f H
os
pit
als
0 0.01-0.99
1.01-1.49
1.50-1.99
>2.0
Rate/1000 line days
QualityBlue Hospital CLAB Performance
N=29
Four Hospitals at Zero!
Lives Saved:
68-142

51
40.0%
60.0%
80.0%
100.0%
% Co
mplia
nce
3Q07 4Q07 1Q08 2Q08
Quarters
QB Hospitals PA State Average
QB Hospitals vs. PA State AverageQB Hospitals vs. PA State Average
QualityBLUE FY08: GWTG CAD - Defect Free Care
Sustained Improvement

52
QualityBLUE FY08: SCIP Normothermia 1st vs 3rd Quarter by Hospital
020406080
100
30 3 29 6 8 9 10 25 11 26 15 16 17 18 12 19 20 22 23 24 14 31
Hospital Number
% Co
mplian
ce
1st Quarter 3rd Quarter
22 Hospitals Participating /14 Improved

5353
Future Vision

54
Where Are We Going?
2009 and BeyondAlignment with National Quality Standards – Patient CharterPrescription for Pennsylvania – Governor’s Chronic Care Commission
“Coordination of Care”NQF Membership – “A Voice at the Table”Shift Reimbursement Paradigm to Performance based “Earning”Legislative Movement - Never Events – Hospital Acquired ConditionsMeet Value Based Purchasing ObjectivesContinued Engagement of the Provider CommunityEnhanced Clinical Quality & Cost Measurement
Development of Efficiency Index/Medical Episode GroupingPilot Demonstrations
CMS EHR Demonstration – Pittsburgh Regional Healthcare Initiative Community Partner

55
Future Vision
Continued Pursuit of Excellence by Raising the Bar on Quality Performance
ProfilingTransparencyPay for PerformanceInnovation, Collaboration, Engagement

56
Thank You
Questions or Follow-up:
Linda Weiland Vice President, Provider Operations (412) [email protected]
Deborah DonovanDirector, Provider Quality Performance Mgmt.(412) [email protected]