Embed Size (px)
Citation preview
ENGINEER 2010 Carbon Footprint Control Project
‘Realise’ & ‘Neutralise’ Project Report
November 2010
Prepared by:
Vivek Gilani Environmental Engineer (E.I.T)
Research Assistants:
Bhaskar Govindrajan (B.E)
Savita Vijayakumar (BMM)
NITK ‘ENGINEER 2010’ – ‘Realise’ and ‘Neutralise’ Report Page 2
Table of Contents
1 Executive Summary .................................................................................................... 4
2 Introduction ................................................................................................................. 5
3 Project Goals ............................................................................................................... 6
4 Project Scope .............................................................................................................. 7
4.1 Activity Boundaries ............................................................................................ 7
4.2 Stakeholder Boundaries ...................................................................................... 9
4.3 Life-cycle Boundaries ......................................................................................... 9
5 Research Methodology ............................................................................................. 11
5.1.1 General Activity Data Research ................................................................ 11
5.1.2 Visitor Travel Activity Data Research ...................................................... 11
6 Analysis Methodology .............................................................................................. 13
6.1 Resource / Activity Tagging ............................................................................. 13
6.2 GHG Emission Factors ..................................................................................... 15
7 Results ....................................................................................................................... 16
7.1 Resource Consumption Inventory ..................................................................... 16
7.2 Total Carbon Footprint ..................................................................................... 17
7.2.1 Activity-Differentiated Carbon Footprint ................................................. 17
7.2.2 Stakeholder Contributions to Activity-Differentiated Carbon Footprint .. 20
8 Context of Total Carbon Footprint ........................................................................... 22
9 Discussion ................................................................................................................. 23
9.1 Assumptions ...................................................................................................... 23
9.2 Data Gaps .......................................................................................................... 24
10 Limitations ............................................................................................................ 24
10.1 Water Footprint ................................................................................................. 24
11 Conclusions and Recommendations ..................................................................... 25
11.1 Conclusions ....................................................................................................... 25
11.2 Carbon Footprint Offsetting Recommendations ............................................... 26
NITK ‘ENGINEER 2010’ – ‘Realise’ and ‘Neutralise’ Report Page 3
Table of Figures
Figure 1 – ENGINEER 2010 Activity Contributions to Carbon Footprint ...................... 19
Figure 2 – Total Carbon Footprint Summary – Stakeholder Groups Breakdown ............ 21
List of Tables
Table 1 - Activity Boundary Summary ............................................................................... 8
Table 2 - Stakeholder Boundary Summary ........................................................................ 9
Table 3 - Emission Factor LCA Status ............................................................................ 10
Table 4 - Resource / Activity Tagging .............................................................................. 13
Table 5 - ENGINEER 2010 Resource Consumption Inventory ....................................... 16
Table 6 - ENGINEER 2010 Activity-Differentiated Total Carbon Footprint .................. 18
Table 7 - ENGINEER 2010 Stakeholder-Differentiated Total Carbon Footprint ............ 20

NITK ‘ENGINEER 2010’ – ‘Realise’ and ‘Neutralise’ Report Page 4
1 Executive Summary
Eliminate Carbon Emissions (ECE) Pvt. Ltd was contracted by the ‘ENGINEER 2010’
CORE to calculate their Carbon Footprint Calculation (i.e. an inventory of the total
Greenhouse Gas Emissions (GHGs) that contribute to Climate Change), resulting from
direct and indirect resource consumption through the annual technical fest’s operations.
The Total Carbon Footprint of ENGINEER 2010, estimated to be 29.3 tons CO2e, is
comprised of the following activity-related Footprints, in order of decreasing magnitude:
Travel and Logistics (11.2 tons CO2e – 38.4%), Electricity (9.6 tons CO2e – 32.8%),
Food, Beverage, and Waste (4.4 tons CO2e – 14.9%) and Cooking & Diesel Fuel (4.0
tons CO2e – 13.5%). These activities would be considered to be the ‘Key Source
Category’ activities for ENGINEER 2010
The Carbon Footprint estimate of 29.3 tons CO2e, to serve a outstation participants
(1233) and local visitor base (3000) of 4,233 persons lead to a per-participant served
Carbon Footprint of approximately 6.9 kg CO2e.
The results make it clear that the primary stakeholder contributions arise from activities
related to the ENGINEER CORE (9.7 tons CO2e – 33.0%), Event Participants and
Visitors (5.3 tons CO2e – 18.0%), Food Court (4.9 tons CO2e – 16.6%), and
Judges/Guest Speakers (4.8 tons CO2e – 16.4%).
A noteworthy aspect of the event organization was the fact that guest accommodation
was handled using in-house facilities; this elimination of luxury hotel accommodation
helped curb a component of Carbon Footprint which is usually significant for most mass
events. This arrangement allows for energy efficiency control and monitoring within the
event premises and diminishes the likelihood of extravagant energy consumption
prevalent in the hospitality industry in India.
NITK ‘ENGINEER 2010’ – ‘Realise’ and ‘Neutralise’ Report Page 5
2 Introduction
Eliminate Carbon Emissions (ECE) Pvt. Ltd was contracted by the ‘ENGINEER 2010’
CORE to calculate their Carbon Footprint Calculation (i.e. an inventory of the total
Greenhouse Gas Emissions (GHGs) that contribute to Climate Change), resulting from
direct and indirect resource consumption through the annual technical fest’s operations.
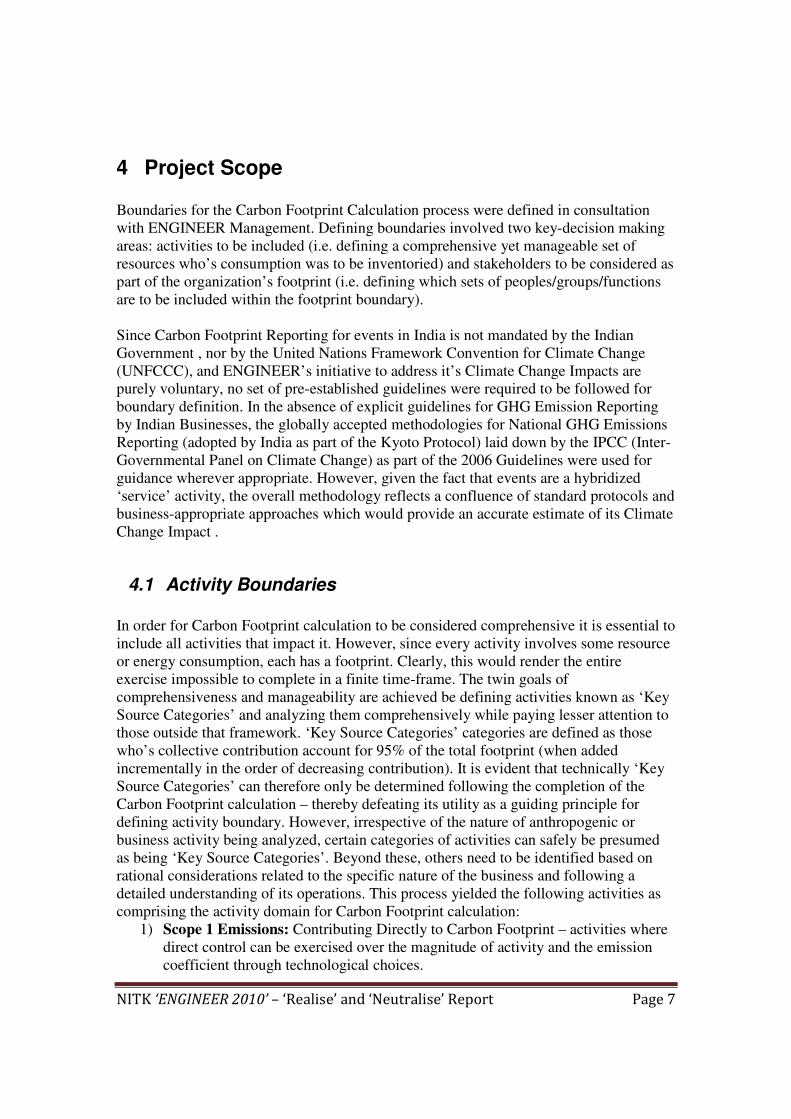
‘Engineer 2010’ embarked upon this unprecedented approach towards achieving total
environmental accountability motivated by personal conviction about the reality of
Climate Change and its direct relationship with resource consumption of educational
enterprises. NIT (K)’s ENGINEER 2010 CORE recognized its prestigious position
amongst all Technical Fests held in India and clearly identified the immense leveraging
possibilities available to it to infuse climate change consciousness into its student and
participant base; inspiring its network of stakeholders to recognize their potential as
individual Climate Change ‘solvers’.
This report encompasses the first phase i.e. ‘Realise’, of the three-phase project
comprising of Carbon Footprint Calculation (‘Realise’), Carbon Footprint Minimisation
(‘Minimise’) and Carbon Footprint Neutralisation (‘Neutralise’). Pre-Tournament Carbon
Footprint Estimation commenced in September 2010 subsequently followed by the final
Carbon Footprint Activity data gathering research process commencing during the
Festival held from 21st to 24
th October 2010. The time-period of analysis chosen was the
entire planning, execution and hosting period – including pre-event activities and
consumption related directly with the festival planning.

NITK ‘ENGINEER 2010’ – ‘Realise’ and ‘Neutralise’ Report Page 6
3 Project Goals
The goals of the ‘Realise’ phase of the project were to determine, with the greatest
possible degree of accuracy, the following for ENGINEER 2010:
1. Total Resource Consumption Inventory.
2. Total Carbon Footprint
3. Activity-Differentiated Annual Carbon Footprint
4. Stakeholder-Differentiated Annual Carbon Footprint..
5. Contextualization of Total Carbon Footprint and Carbon Emissions Intensity of
Stakeholder Operations.
The collective analysis of the above aspects of operation would represent the GHG
Emissions Baseline for the Annual Event against which future efforts would be
benchmarked for assessing the magnitude and impact of measurable and verifiable
Carbon Footprint mitigation measures.
Finally, the aggregate and dissected Carbon Footprints were to be understood and
explained in the context of easily understandable terms (i.e. commonly understood units
of Climate Change impacts) to provide perspective that serves to inspire and define
actions towards participative (i.e. involving all Stakeholders) mitigation of impact on
Climate Change through footprint minimization.
Results of the above research and analysis were intended to serve as a diagnostic tool to
synthesize a rational, prioritized roadmap for Carbon Footprint and Resource
consumption Minimization without hindering the fundamental pre-requisites of
ENGINEER’s operations and service delivery.
NITK ‘ENGINEER 2010’ – ‘Realise’ and ‘Neutralise’ Report Page 7
4 Project Scope
Boundaries for the Carbon Footprint Calculation process were defined in consultation
with ENGINEER Management. Defining boundaries involved two key-decision making
areas: activities to be included (i.e. defining a comprehensive yet manageable set of
resources who’s consumption was to be inventoried) and stakeholders to be considered as
part of the organization’s footprint (i.e. defining which sets of peoples/groups/functions
are to be included within the footprint boundary).
Since Carbon Footprint Reporting for events in India is not mandated by the Indian
Government , nor by the United Nations Framework Convention for Climate Change
(UNFCCC), and ENGINEER’s initiative to address it’s Climate Change Impacts are
purely voluntary, no set of pre-established guidelines were required to be followed for
boundary definition. In the absence of explicit guidelines for GHG Emission Reporting
by Indian Businesses, the globally accepted methodologies for National GHG Emissions
Reporting (adopted by India as part of the Kyoto Protocol) laid down by the IPCC (Inter-
Governmental Panel on Climate Change) as part of the 2006 Guidelines were used for
guidance wherever appropriate. However, given the fact that events are a hybridized
‘service’ activity, the overall methodology reflects a confluence of standard protocols and
business-appropriate approaches which would provide an accurate estimate of its Climate
Change Impact .
4.1 Activity Boundaries
In order for Carbon Footprint calculation to be considered comprehensive it is essential to
include all activities that impact it. However, since every activity involves some resource
or energy consumption, each has a footprint. Clearly, this would render the entire
exercise impossible to complete in a finite time-frame. The twin goals of
comprehensiveness and manageability are achieved be defining activities known as ‘Key
Source Categories’ and analyzing them comprehensively while paying lesser attention to
those outside that framework. ‘Key Source Categories’ categories are defined as those
who’s collective contribution account for 95% of the total footprint (when added
incrementally in the order of decreasing contribution). It is evident that technically ‘Key
Source Categories’ can therefore only be determined following the completion of the
Carbon Footprint calculation – thereby defeating its utility as a guiding principle for
defining activity boundary. However, irrespective of the nature of anthropogenic or
business activity being analyzed, certain categories of activities can safely be presumed
as being ‘Key Source Categories’. Beyond these, others need to be identified based on
rational considerations related to the specific nature of the business and following a
detailed understanding of its operations. This process yielded the following activities as
comprising the activity domain for Carbon Footprint calculation:
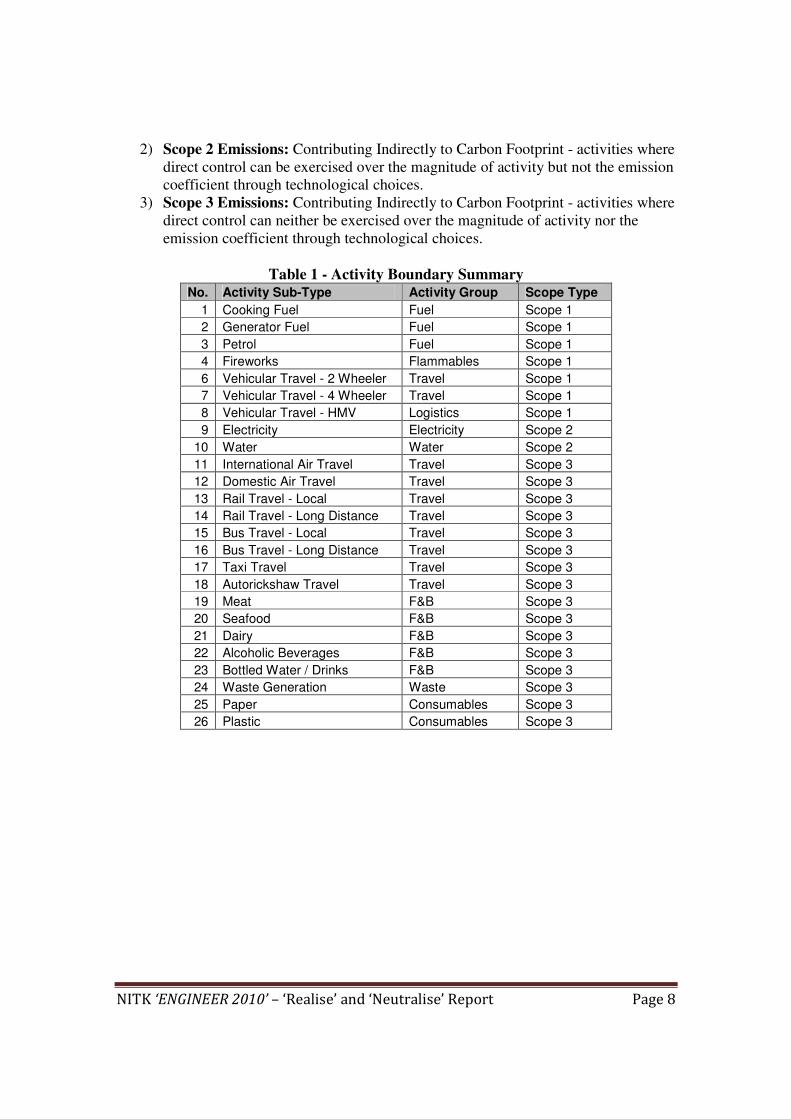
1) Scope 1 Emissions: Contributing Directly to Carbon Footprint – activities where
direct control can be exercised over the magnitude of activity and the emission
coefficient through technological choices.
NITK ‘ENGINEER 2010’ – ‘Realise’ and ‘Neutralise’ Report Page 8
2) Scope 2 Emissions: Contributing Indirectly to Carbon Footprint - activities where
direct control can be exercised over the magnitude of activity but not the emission
coefficient through technological choices.
3) Scope 3 Emissions: Contributing Indirectly to Carbon Footprint - activities where
direct control can neither be exercised over the magnitude of activity nor the
emission coefficient through technological choices.
Table 1 - Activity Boundary Summary No. Activity Sub-Type Activity Group Scope Type
1 Cooking Fuel Fuel Scope 1
2 Generator Fuel Fuel Scope 1
3 Petrol Fuel Scope 1
4 Fireworks Flammables Scope 1
6 Vehicular Travel - 2 Wheeler Travel Scope 1
7 Vehicular Travel - 4 Wheeler Travel Scope 1
8 Vehicular Travel - HMV Logistics Scope 1
9 Electricity Electricity Scope 2
10 Water Water Scope 2
11 International Air Travel Travel Scope 3
12 Domestic Air Travel Travel Scope 3
13 Rail Travel - Local Travel Scope 3
14 Rail Travel - Long Distance Travel Scope 3
15 Bus Travel - Local Travel Scope 3
16 Bus Travel - Long Distance Travel Scope 3
17 Taxi Travel Travel Scope 3
18 Autorickshaw Travel Travel Scope 3
19 Meat F&B Scope 3
20 Seafood F&B Scope 3
21 Dairy F&B Scope 3
22 Alcoholic Beverages F&B Scope 3
23 Bottled Water / Drinks F&B Scope 3
24 Waste Generation Waste Scope 3
25 Paper Consumables Scope 3
26 Plastic Consumables Scope 3
NITK ‘ENGINEER 2010’ – ‘Realise’ and ‘Neutralise’ Report Page 9
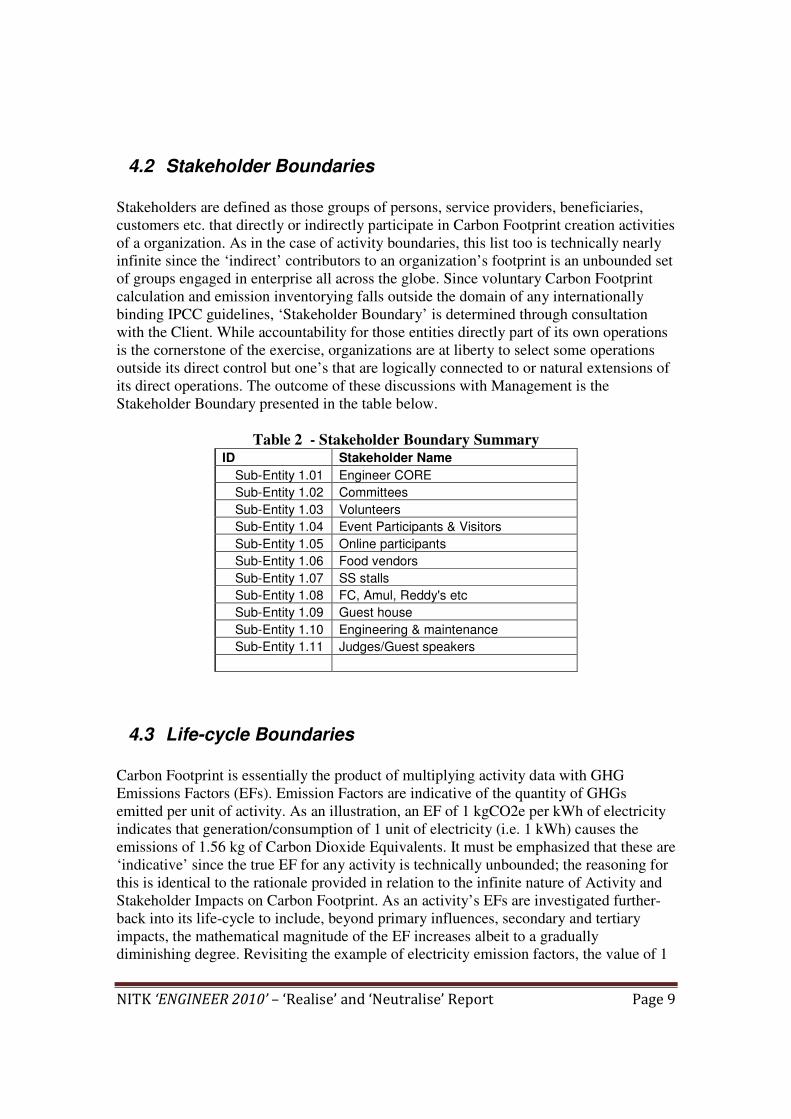
4.2 Stakeholder Boundaries
Stakeholders are defined as those groups of persons, service providers, beneficiaries,
customers etc. that directly or indirectly participate in Carbon Footprint creation activities
of a organization. As in the case of activity boundaries, this list too is technically nearly
infinite since the ‘indirect’ contributors to an organization’s footprint is an unbounded set
of groups engaged in enterprise all across the globe. Since voluntary Carbon Footprint
calculation and emission inventorying falls outside the domain of any internationally
binding IPCC guidelines, ‘Stakeholder Boundary’ is determined through consultation
with the Client. While accountability for those entities directly part of its own operations
is the cornerstone of the exercise, organizations are at liberty to select some operations
outside its direct control but one’s that are logically connected to or natural extensions of
its direct operations. The outcome of these discussions with Management is the
Stakeholder Boundary presented in the table below.
Table 2 - Stakeholder Boundary Summary ID Stakeholder Name
Sub-Entity 1.01 Engineer CORE
Sub-Entity 1.02 Committees
Sub-Entity 1.03 Volunteers
Sub-Entity 1.04 Event Participants & Visitors
Sub-Entity 1.05 Online participants
Sub-Entity 1.06 Food vendors
Sub-Entity 1.07 SS stalls
Sub-Entity 1.08 FC, Amul, Reddy's etc
Sub-Entity 1.09 Guest house
Sub-Entity 1.10 Engineering & maintenance
Sub-Entity 1.11 Judges/Guest speakers
4.3 Life-cycle Boundaries
Carbon Footprint is essentially the product of multiplying activity data with GHG
Emissions Factors (EFs). Emission Factors are indicative of the quantity of GHGs
emitted per unit of activity. As an illustration, an EF of 1 kgCO2e per kWh of electricity
indicates that generation/consumption of 1 unit of electricity (i.e. 1 kWh) causes the
emissions of 1.56 kg of Carbon Dioxide Equivalents. It must be emphasized that these are
‘indicative’ since the true EF for any activity is technically unbounded; the reasoning for
this is identical to the rationale provided in relation to the infinite nature of Activity and
Stakeholder Impacts on Carbon Footprint. As an activity’s EFs are investigated further-
back into its life-cycle to include, beyond primary influences, secondary and tertiary
impacts, the mathematical magnitude of the EF increases albeit to a gradually
diminishing degree. Revisiting the example of electricity emission factors, the value of 1
NITK ‘ENGINEER 2010’ – ‘Realise’ and ‘Neutralise’ Report Page 10
kgCO2e/kWh would increase if analysis boundaries were expanded beyond the impacts
of direct combustion of coal, diesel and other fossil fuels used for power generation to
then include the energy expenditure to mine the fossil fuels. Its magnitude would further
increase if the analysis boundary were radially extended to envelop the resource and
energy consumption to create the capital goods (machinery, factories etc.) required to
harness these natural resources. This expansion can be understood as ‘penetrating deeper
into the life-cycle of a product or service. Concisely stated, EF magnitudes are a dynamic
function of the extent of life-cycle impacts selected for analysis in relation to the
manufacturing process involved in creation of goods and services for human
consumption.
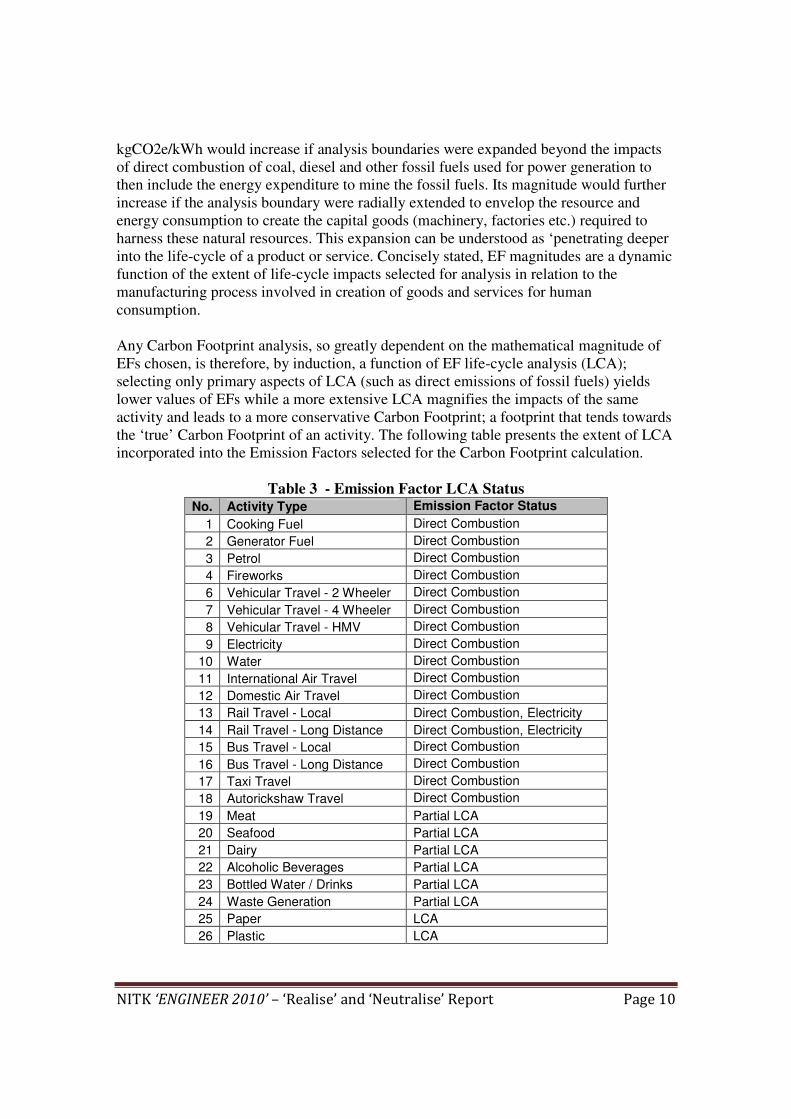
Any Carbon Footprint analysis, so greatly dependent on the mathematical magnitude of
EFs chosen, is therefore, by induction, a function of EF life-cycle analysis (LCA);
selecting only primary aspects of LCA (such as direct emissions of fossil fuels) yields
lower values of EFs while a more extensive LCA magnifies the impacts of the same
activity and leads to a more conservative Carbon Footprint; a footprint that tends towards
the ‘true’ Carbon Footprint of an activity. The following table presents the extent of LCA
incorporated into the Emission Factors selected for the Carbon Footprint calculation.
Table 3 - Emission Factor LCA Status No. Activity Type Emission Factor Status
1 Cooking Fuel Direct Combustion
2 Generator Fuel Direct Combustion
3 Petrol Direct Combustion
4 Fireworks Direct Combustion
6 Vehicular Travel - 2 Wheeler Direct Combustion
7 Vehicular Travel - 4 Wheeler Direct Combustion
8 Vehicular Travel - HMV Direct Combustion
9 Electricity Direct Combustion
10 Water Direct Combustion
11 International Air Travel Direct Combustion
12 Domestic Air Travel Direct Combustion
13 Rail Travel - Local Direct Combustion, Electricity
14 Rail Travel - Long Distance Direct Combustion, Electricity
15 Bus Travel - Local Direct Combustion
16 Bus Travel - Long Distance Direct Combustion
17 Taxi Travel Direct Combustion
18 Autorickshaw Travel Direct Combustion
19 Meat Partial LCA
20 Seafood Partial LCA
21 Dairy Partial LCA
22 Alcoholic Beverages Partial LCA
23 Bottled Water / Drinks Partial LCA
24 Waste Generation Partial LCA
25 Paper LCA
26 Plastic LCA
NITK ‘ENGINEER 2010’ – ‘Realise’ and ‘Neutralise’ Report Page 11
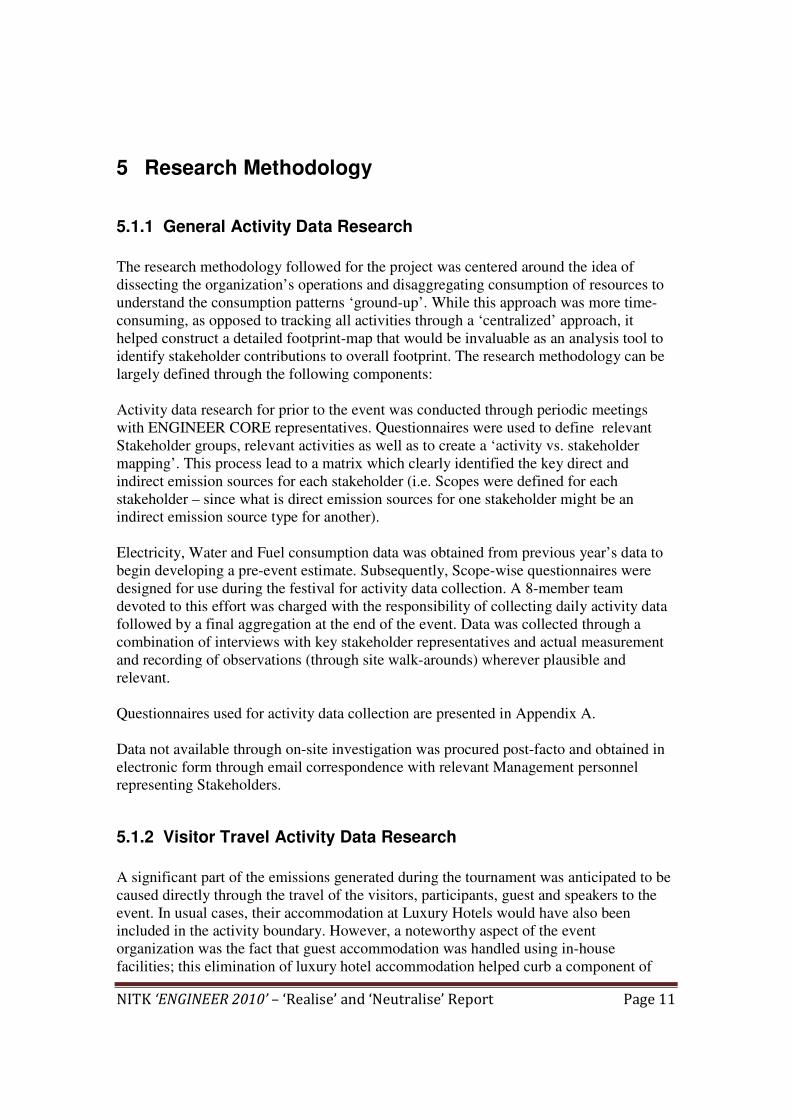
5 Research Methodology
5.1.1 General Activity Data Research
The research methodology followed for the project was centered around the idea of
dissecting the organization’s operations and disaggregating consumption of resources to
understand the consumption patterns ‘ground-up’. While this approach was more time-
consuming, as opposed to tracking all activities through a ‘centralized’ approach, it
helped construct a detailed footprint-map that would be invaluable as an analysis tool to
identify stakeholder contributions to overall footprint. The research methodology can be
largely defined through the following components:
Activity data research for prior to the event was conducted through periodic meetings
with ENGINEER CORE representatives. Questionnaires were used to define relevant
Stakeholder groups, relevant activities as well as to create a ‘activity vs. stakeholder
mapping’. This process lead to a matrix which clearly identified the key direct and
indirect emission sources for each stakeholder (i.e. Scopes were defined for each
stakeholder – since what is direct emission sources for one stakeholder might be an
indirect emission source type for another).
Electricity, Water and Fuel consumption data was obtained from previous year’s data to
begin developing a pre-event estimate. Subsequently, Scope-wise questionnaires were
designed for use during the festival for activity data collection. A 8-member team
devoted to this effort was charged with the responsibility of collecting daily activity data
followed by a final aggregation at the end of the event. Data was collected through a
combination of interviews with key stakeholder representatives and actual measurement
and recording of observations (through site walk-arounds) wherever plausible and
relevant.
Questionnaires used for activity data collection are presented in Appendix A.
Data not available through on-site investigation was procured post-facto and obtained in
electronic form through email correspondence with relevant Management personnel
representing Stakeholders.
5.1.2 Visitor Travel Activity Data Research
A significant part of the emissions generated during the tournament was anticipated to be
caused directly through the travel of the visitors, participants, guest and speakers to the
event. In usual cases, their accommodation at Luxury Hotels would have also been
included in the activity boundary. However, a noteworthy aspect of the event
organization was the fact that guest accommodation was handled using in-house
facilities; this elimination of luxury hotel accommodation helped curb a component of

NITK ‘ENGINEER 2010’ – ‘Realise’ and ‘Neutralise’ Report Page 12
Carbon Footprint which is usually significant for most mass events. To ensure an
exhaustive GHG Emissions Inventory of the Tech Fest, it was imperative to analyze the
footprint of the participants that physically attended the event. Note: this excluded travel
conducted by other stakeholder groups such as Judges, Guests Speakers, and the
ENGINEER 2010 Management CORE/Committees/Volunteers prior to and during the
event.
Methodology
A detailed, quantitative audience research was conducted to measure the emission whose
various elements are as under:
a) Sample Size: A sample size of 101 respondents (approximately 10% of the overall
expected attendance) was covered to ensure a statistically valid base. Since many of these
participants traveled in groups, the total population ‘represented’ by the survey was 432.
b) The respondents were chosen at random – to ensure no bias while conducting the
research.
c) Questionnaire and Administration:
The questionnaire was of the close-ended, multiple choice type and administered by
surveyors who were specifically trained to record the various elements of information
required for the overall study. Each questionnaire contained 12 questions and required
approximately 2 minutes to record.
The questionnaire used for capturing travel activity data is presented in Appendix A.
NITK ‘ENGINEER 2010’ – ‘Realise’ and ‘Neutralise’ Report Page 13
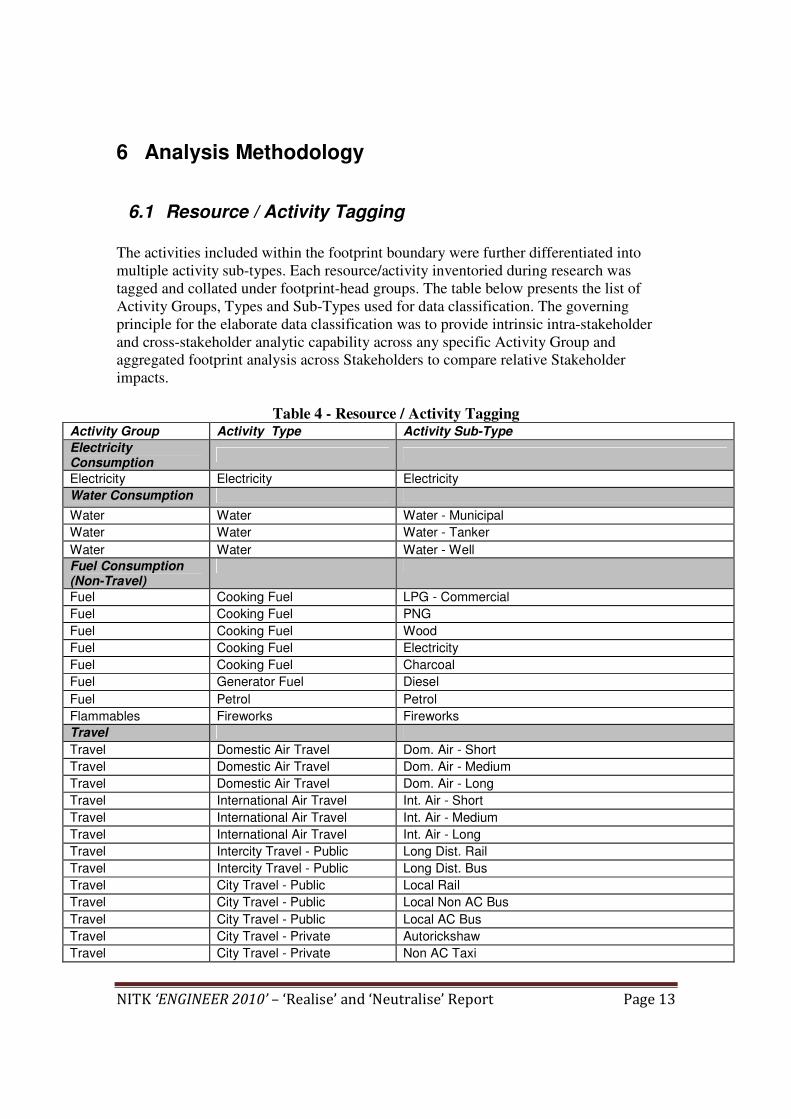
6 Analysis Methodology
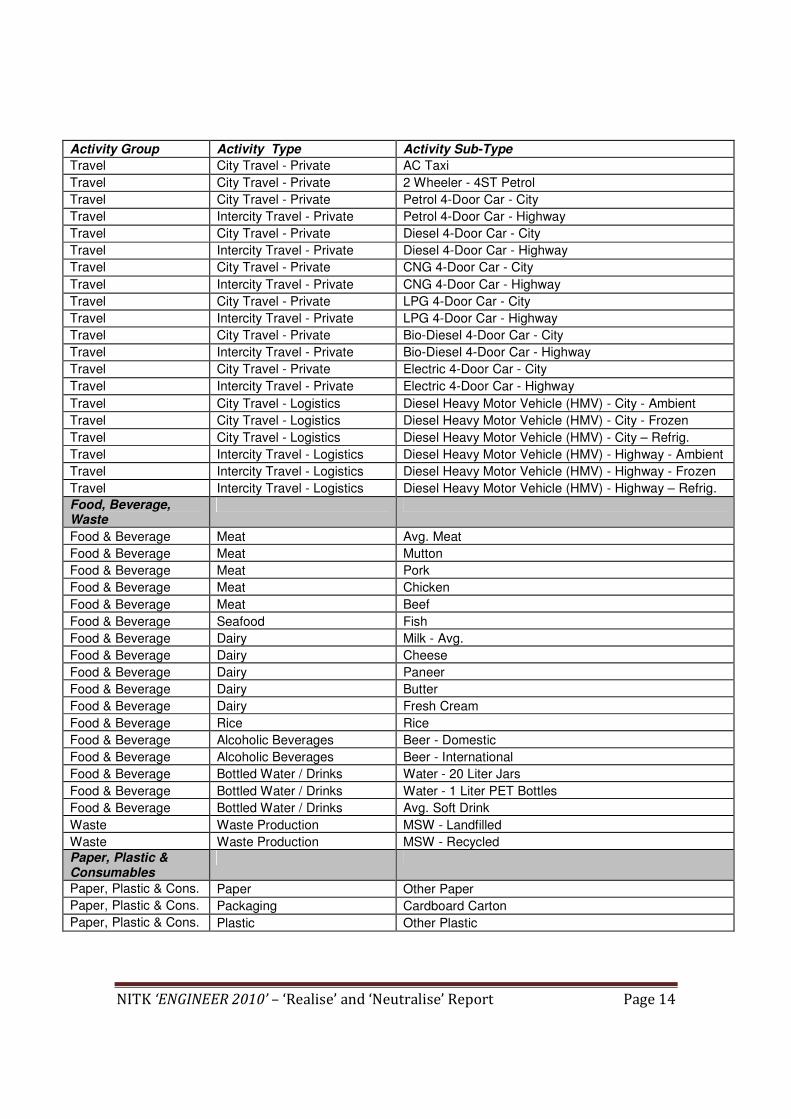
6.1 Resource / Activity Tagging
The activities included within the footprint boundary were further differentiated into
multiple activity sub-types. Each resource/activity inventoried during research was
tagged and collated under footprint-head groups. The table below presents the list of
Activity Groups, Types and Sub-Types used for data classification. The governing
principle for the elaborate data classification was to provide intrinsic intra-stakeholder
and cross-stakeholder analytic capability across any specific Activity Group and
aggregated footprint analysis across Stakeholders to compare relative Stakeholder
impacts.
Table 4 - Resource / Activity Tagging Activity Group Activity Type Activity Sub-Type
Electricity Consumption
Electricity Electricity Electricity
Water Consumption
Water Water Water - Municipal
Water Water Water - Tanker
Water Water Water - Well
Fuel Consumption (Non-Travel)
Fuel Cooking Fuel LPG - Commercial
Fuel Cooking Fuel PNG
Fuel Cooking Fuel Wood
Fuel Cooking Fuel Electricity
Fuel Cooking Fuel Charcoal
Fuel Generator Fuel Diesel
Fuel Petrol Petrol
Flammables Fireworks Fireworks
Travel
Travel Domestic Air Travel Dom. Air - Short
Travel Domestic Air Travel Dom. Air - Medium
Travel Domestic Air Travel Dom. Air - Long
Travel International Air Travel Int. Air - Short
Travel International Air Travel Int. Air - Medium
Travel International Air Travel Int. Air - Long
Travel Intercity Travel - Public Long Dist. Rail
Travel Intercity Travel - Public Long Dist. Bus
Travel City Travel - Public Local Rail
Travel City Travel - Public Local Non AC Bus
Travel City Travel - Public Local AC Bus
Travel City Travel - Private Autorickshaw
Travel City Travel - Private Non AC Taxi
NITK ‘ENGINEER 2010’ – ‘Realise’ and ‘Neutralise’ Report Page 14
Activity Group Activity Type Activity Sub-Type
Travel City Travel - Private AC Taxi
Travel City Travel - Private 2 Wheeler - 4ST Petrol
Travel City Travel - Private Petrol 4-Door Car - City
Travel Intercity Travel - Private Petrol 4-Door Car - Highway
Travel City Travel - Private Diesel 4-Door Car - City
Travel Intercity Travel - Private Diesel 4-Door Car - Highway
Travel City Travel - Private CNG 4-Door Car - City
Travel Intercity Travel - Private CNG 4-Door Car - Highway
Travel City Travel - Private LPG 4-Door Car - City
Travel Intercity Travel - Private LPG 4-Door Car - Highway
Travel City Travel - Private Bio-Diesel 4-Door Car - City
Travel Intercity Travel - Private Bio-Diesel 4-Door Car - Highway
Travel City Travel - Private Electric 4-Door Car - City
Travel Intercity Travel - Private Electric 4-Door Car - Highway
Travel City Travel - Logistics Diesel Heavy Motor Vehicle (HMV) - City - Ambient
Travel City Travel - Logistics Diesel Heavy Motor Vehicle (HMV) - City - Frozen
Travel City Travel - Logistics Diesel Heavy Motor Vehicle (HMV) - City – Refrig.
Travel Intercity Travel - Logistics Diesel Heavy Motor Vehicle (HMV) - Highway - Ambient
Travel Intercity Travel - Logistics Diesel Heavy Motor Vehicle (HMV) - Highway - Frozen
Travel Intercity Travel - Logistics Diesel Heavy Motor Vehicle (HMV) - Highway – Refrig.
Food, Beverage, Waste
Food & Beverage Meat Avg. Meat
Food & Beverage Meat Mutton
Food & Beverage Meat Pork
Food & Beverage Meat Chicken
Food & Beverage Meat Beef
Food & Beverage Seafood Fish
Food & Beverage Dairy Milk - Avg.
Food & Beverage Dairy Cheese
Food & Beverage Dairy Paneer
Food & Beverage Dairy Butter
Food & Beverage Dairy Fresh Cream
Food & Beverage Rice Rice
Food & Beverage Alcoholic Beverages Beer - Domestic
Food & Beverage Alcoholic Beverages Beer - International
Food & Beverage Bottled Water / Drinks Water - 20 Liter Jars
Food & Beverage Bottled Water / Drinks Water - 1 Liter PET Bottles
Food & Beverage Bottled Water / Drinks Avg. Soft Drink
Waste Waste Production MSW - Landfilled
Waste Waste Production MSW - Recycled
Paper, Plastic & Consumables
Paper, Plastic & Cons. Paper Other Paper
Paper, Plastic & Cons. Packaging Cardboard Carton
Paper, Plastic & Cons. Plastic Other Plastic
NITK ‘ENGINEER 2010’ – ‘Realise’ and ‘Neutralise’ Report Page 15
Data collation done in such a manner allowed for quantities (i.e. liters, kgs, pieces of
items, kilometers of air travel etc.) of the same resources or activities to be aggregated
across Stakeholders. This would prove to be of utility as an overall planning and
organizational tool for tournament operations redesign and other administrative
interventions, if desired, beyond the purposes of Carbon Footprint analysis.
6.2 GHG Emission Factors
Activity data collated according to the framework described earlier was multiplied by the
appropriate Greenhouse Gas (GHG) Emissions Factors specifically developed for India.
These coefficients are presented in Appendix B. The product of the resource quantities
and the GHG Emission Factors yielded the Carbon Footprint for the particular activity.
NITK ‘ENGINEER 2010’ – ‘Realise’ and ‘Neutralise’ Report Page 16
7 Results
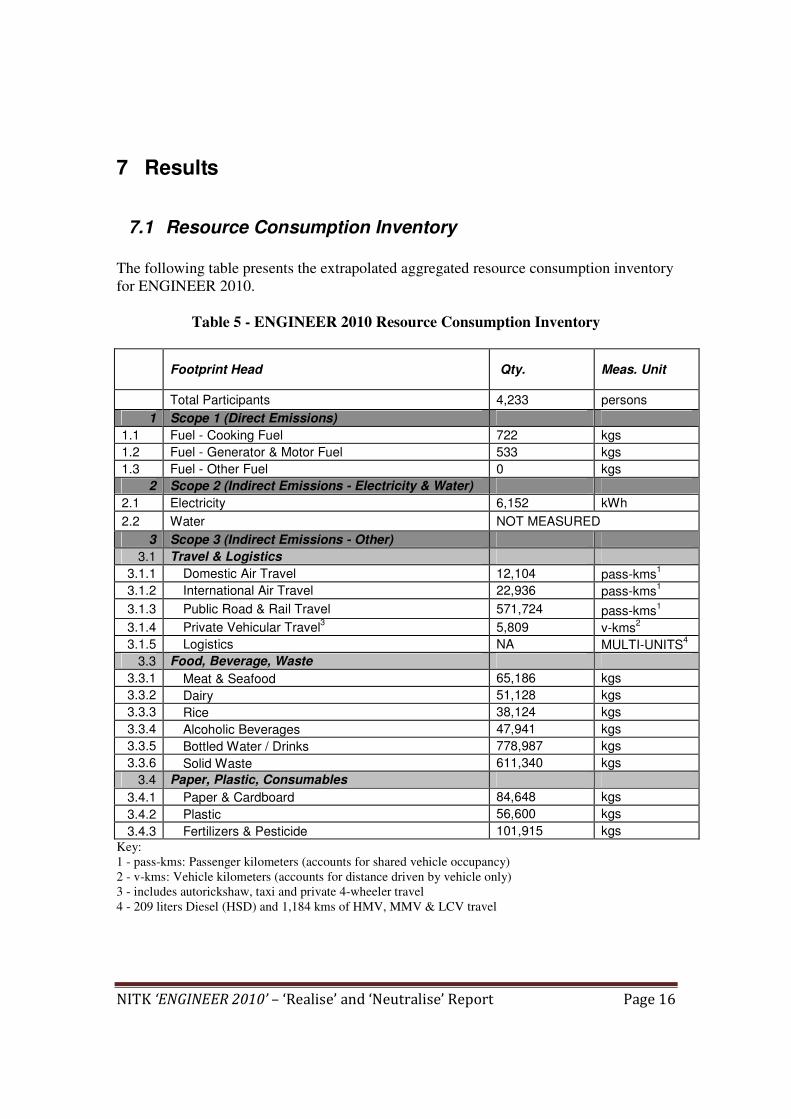
7.1 Resource Consumption Inventory
The following table presents the extrapolated aggregated resource consumption inventory
for ENGINEER 2010.
Table 5 - ENGINEER 2010 Resource Consumption Inventory
Footprint Head Qty. Meas. Unit
Total Participants 4,233 persons
1 Scope 1 (Direct Emissions)
1.1 Fuel - Cooking Fuel 722 kgs
1.2 Fuel - Generator & Motor Fuel 533 kgs
1.3 Fuel - Other Fuel 0 kgs
2 Scope 2 (Indirect Emissions - Electricity & Water)
2.1 Electricity 6,152 kWh
2.2 Water NOT MEASURED
3 Scope 3 (Indirect Emissions - Other)
3.1 Travel & Logistics
3.1.1 Domestic Air Travel 12,104 pass-kms1
3.1.2 International Air Travel 22,936 pass-kms1
3.1.3 Public Road & Rail Travel 571,724 pass-kms1
3.1.4 Private Vehicular Travel3 5,809 v-kms
2
3.1.5 Logistics NA MULTI-UNITS4
3.3 Food, Beverage, Waste
3.3.1 Meat & Seafood 65,186 kgs
3.3.2 Dairy 51,128 kgs
3.3.3 Rice 38,124 kgs
3.3.4 Alcoholic Beverages 47,941 kgs
3.3.5 Bottled Water / Drinks 778,987 kgs
3.3.6 Solid Waste 611,340 kgs
3.4 Paper, Plastic, Consumables
3.4.1 Paper & Cardboard 84,648 kgs
3.4.2 Plastic 56,600 kgs
3.4.3 Fertilizers & Pesticide 101,915 kgs
Key:
1 - pass-kms: Passenger kilometers (accounts for shared vehicle occupancy)
2 - v-kms: Vehicle kilometers (accounts for distance driven by vehicle only)
3 - includes autorickshaw, taxi and private 4-wheeler travel
4 - 209 liters Diesel (HSD) and 1,184 kms of HMV, MMV & LCV travel

NITK ‘ENGINEER 2010’ – ‘Realise’ and ‘Neutralise’ Report Page 17
7.2 Total Carbon Footprint
The Total Carbon Footprint of ENGINEER 2010, for the activities presented in Table 1
and stakeholders presented in Table 2, is estimated to be 29.3 tons of CO2e.
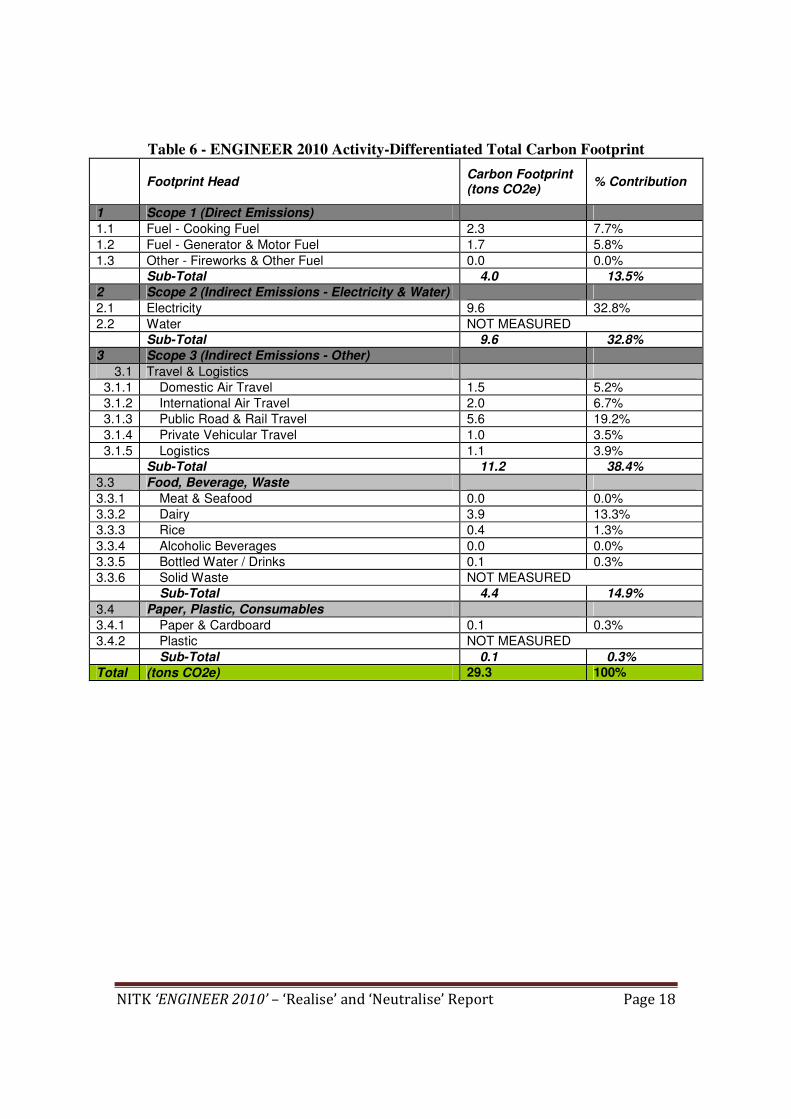
7.2.1 Activity-Differentiated Carbon Footprint
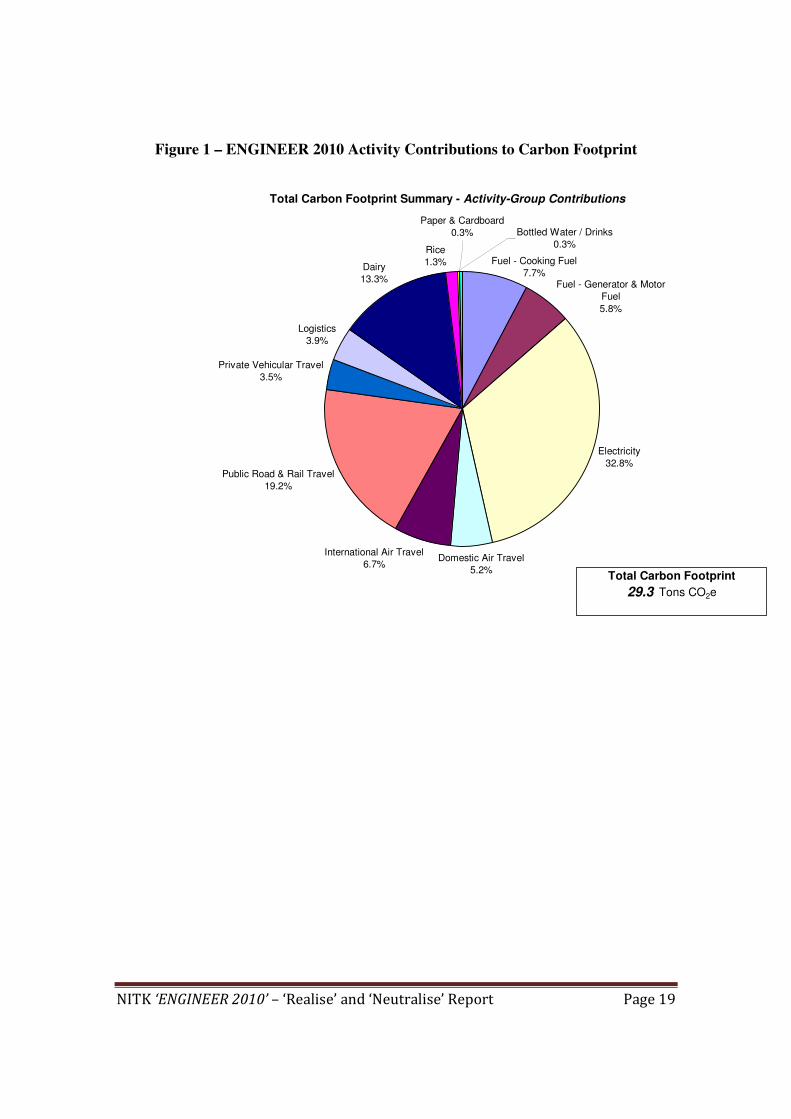
The following table presents the contributions to Total Carbon Footprint differentiated
across all activity groups. The percent contributions are depicted in Figure 1. The results
make it clear that the primary activities contributing to the ENGINEER 2010 Carbon
Footprint are Travel and Logistics (11.2 tons CO2e – 38.4%), Electricity (9.6 tons CO2e
– 32.8%), Food, Beverage, and Waste (4.4 tons CO2e – 14.9%) and Cooking & Diesel
Fuel (4.0 tons CO2e – 13.5%). These activities would be considered to be the ‘Key
Source Category’ activities for ENGINEER 2010 as defined earlier in the report.
NITK ‘ENGINEER 2010’ – ‘Realise’ and ‘Neutralise’ Report Page 18
Table 6 - ENGINEER 2010 Activity-Differentiated Total Carbon Footprint
Footprint Head Carbon Footprint (tons CO2e)
% Contribution
1 Scope 1 (Direct Emissions)
1.1 Fuel - Cooking Fuel 2.3 7.7%
1.2 Fuel - Generator & Motor Fuel 1.7 5.8%
1.3 Other - Fireworks & Other Fuel 0.0 0.0%
Sub-Total 4.0 13.5%
2 Scope 2 (Indirect Emissions - Electricity & Water)
2.1 Electricity 9.6 32.8%
2.2 Water NOT MEASURED Sub-Total 9.6 32.8%
3 Scope 3 (Indirect Emissions - Other)
3.1 Travel & Logistics
3.1.1 Domestic Air Travel 1.5 5.2%
3.1.2 International Air Travel 2.0 6.7%
3.1.3 Public Road & Rail Travel 5.6 19.2%
3.1.4 Private Vehicular Travel 1.0 3.5%
3.1.5 Logistics 1.1 3.9%
Sub-Total 11.2 38.4%
3.3 Food, Beverage, Waste
3.3.1 Meat & Seafood 0.0 0.0%
3.3.2 Dairy 3.9 13.3%
3.3.3 Rice 0.4 1.3%
3.3.4 Alcoholic Beverages 0.0 0.0%
3.3.5 Bottled Water / Drinks 0.1 0.3%
3.3.6 Solid Waste NOT MEASURED
Sub-Total 4.4 14.9%
3.4 Paper, Plastic, Consumables
3.4.1 Paper & Cardboard 0.1 0.3%
3.4.2 Plastic NOT MEASURED
Sub-Total 0.1 0.3%
Total (tons CO2e) 29.3 100%
NITK ‘ENGINEER 2010’ – ‘Realise’ and ‘Neutralise’ Report Page 19
Figure 1 – ENGINEER 2010 Activity Contributions to Carbon Footprint
Total Carbon Footprint Summary - Activity-Group Contributions
Electricity
32.8%
Domestic Air Travel
5.2%
International Air Travel
6.7%
Public Road & Rail Travel
19.2%
Private Vehicular Travel
3.5%
Logistics
3.9%
Dairy
13.3%
Rice
1.3%
Paper & Cardboard
0.3% Bottled Water / Drinks
0.3%
Fuel - Cooking Fuel
7.7%Fuel - Generator & Motor
Fuel
5.8%
Total Carbon Footprint
29.3 Tons CO2e
NITK ‘ENGINEER 2010’ – ‘Realise’ and ‘Neutralise’ Report Page 20
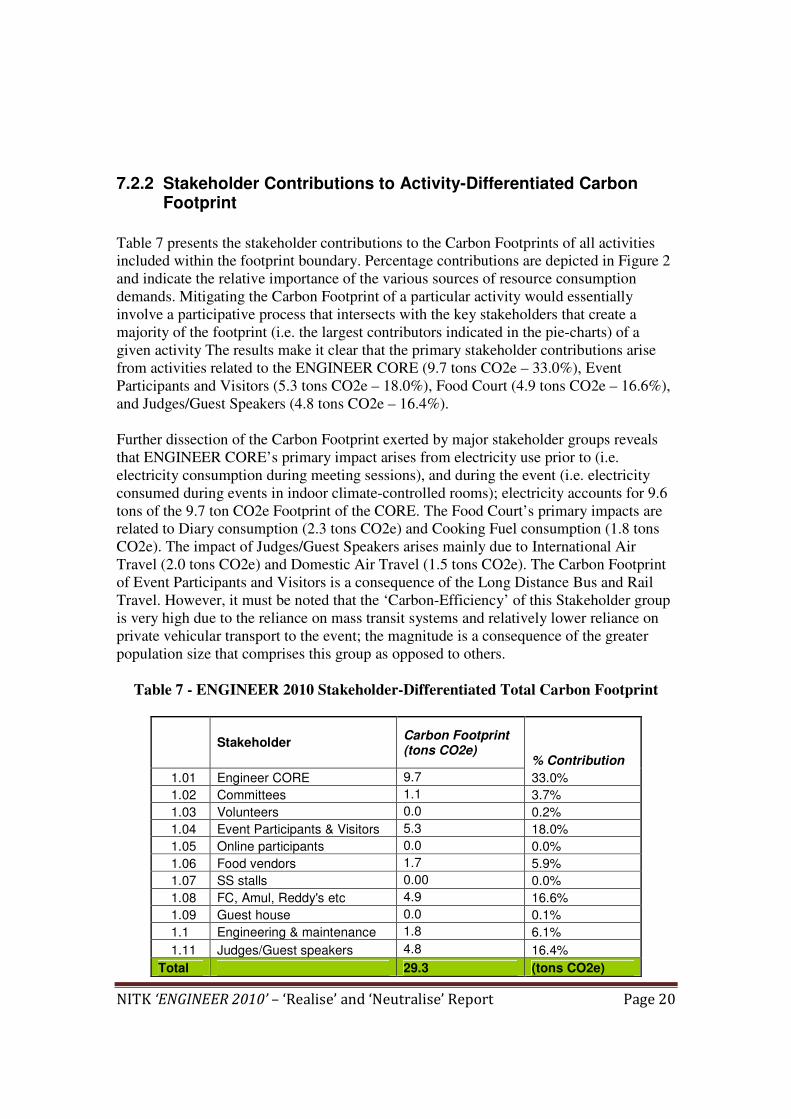
7.2.2 Stakeholder Contributions to Activity-Differentiated Carbon Footprint
Table 7 presents the stakeholder contributions to the Carbon Footprints of all activities
included within the footprint boundary. Percentage contributions are depicted in Figure 2
and indicate the relative importance of the various sources of resource consumption
demands. Mitigating the Carbon Footprint of a particular activity would essentially
involve a participative process that intersects with the key stakeholders that create a
majority of the footprint (i.e. the largest contributors indicated in the pie-charts) of a
given activity The results make it clear that the primary stakeholder contributions arise
from activities related to the ENGINEER CORE (9.7 tons CO2e – 33.0%), Event
Participants and Visitors (5.3 tons CO2e – 18.0%), Food Court (4.9 tons CO2e – 16.6%),
and Judges/Guest Speakers (4.8 tons CO2e – 16.4%).
Further dissection of the Carbon Footprint exerted by major stakeholder groups reveals
that ENGINEER CORE’s primary impact arises from electricity use prior to (i.e.
electricity consumption during meeting sessions), and during the event (i.e. electricity
consumed during events in indoor climate-controlled rooms); electricity accounts for 9.6
tons of the 9.7 ton CO2e Footprint of the CORE. The Food Court’s primary impacts are
related to Diary consumption (2.3 tons CO2e) and Cooking Fuel consumption (1.8 tons
CO2e). The impact of Judges/Guest Speakers arises mainly due to International Air
Travel (2.0 tons CO2e) and Domestic Air Travel (1.5 tons CO2e). The Carbon Footprint
of Event Participants and Visitors is a consequence of the Long Distance Bus and Rail
Travel. However, it must be noted that the ‘Carbon-Efficiency’ of this Stakeholder group
is very high due to the reliance on mass transit systems and relatively lower reliance on
private vehicular transport to the event; the magnitude is a consequence of the greater
population size that comprises this group as opposed to others.
Table 7 - ENGINEER 2010 Stakeholder-Differentiated Total Carbon Footprint
Stakeholder Carbon Footprint (tons CO2e)
% Contribution
1.01 Engineer CORE 9.7 33.0%
1.02 Committees 1.1 3.7%
1.03 Volunteers 0.0 0.2%
1.04 Event Participants & Visitors 5.3 18.0%
1.05 Online participants 0.0 0.0%
1.06 Food vendors 1.7 5.9%
1.07 SS stalls 0.00 0.0%
1.08 FC, Amul, Reddy's etc 4.9 16.6%
1.09 Guest house 0.0 0.1%
1.1 Engineering & maintenance 1.8 6.1%
1.11 Judges/Guest speakers 4.8 16.4%
Total 29.3 (tons CO2e)
NITK ‘ENGINEER 2010’ – ‘Realise’ and ‘Neutralise’ Report Page 21
Figure 2 – Total Carbon Footprint Summary – Stakeholder Groups Breakdown
Total Carbon Footprint Summary - Stakeholder-Group Contributions
Engineer CORE
33.0%
Committees
3.7%
Volunteers
0.2%
Event Participants
18.0%
Food vendors
5.9%
SS stalls
0.0%
FC, Amul, Reddy's etc
16.6%
Guest house
0.1%
Engineering & maintenance
6.1%
Judges/Guest speakers
16.4%
Online participants
0.0% Total Carbon Footprint
28.7 Tons CO2e

NITK ‘ENGINEER 2010’ – ‘Realise’ and ‘Neutralise’ Report Page 22
8 Context of Total Carbon Footprint
The ENGINEER 2010 Carbon Footprint estimate of 29.3 tons CO2e was created by
activities to serve a participant and visitor base of 4,233 persons. Based on this, the per-
participant Carbon Footprint is estimated to be approximately 6.9 kg CO2e.
The quantity of Carbon Dioxide absorbed by a tree is a direct function of the growth
stage (young, mature or old tree), the specific species of the tree, the quantity of foliage
(leaves), size of tree etc., and hence it is incorrect to think of the Carbon Dioxide
absorption capacity of a tree as being a simple static number that applies in all instances.
However, for indicative purposes (to present some perspective on the relative Climate
Change impacts of activities) it becomes necessary to arrive at some general consensus
about the number of trees that would be required to ‘offset’ the Greenhouse Gas
emissions from human activities. Research presented by the United Nations Environment
Program (UNEP) as part of its ‘Billion Tree Campaign’ states that an average tree
absorbs 12 kgs of CO2 per year. Assuming an average life-span of 20 years for a tree
(accounting for tree-planting mortality rates etc.), this equates to 240 kgs or
approximately 0.25 tons of CO2e as the Carbon Dioxide absorption capacity of a tree
over its lifetime. Thus, a Carbon Footprint of 1 ton of CO2e can be thought of as
requiring the planting of approximately 4 trees to ‘neutralize’ its impact. It must be
emphasized that this shouldn’t be misconstrued as an endorsement of tree planting for
neutralizing carbon footprint.
Based on the above approximations, the Total Carbon Footprint of ENGINEER 2010 can
be thought of as requiring 117 trees to ‘neutralize’ its impact on Climate Change.

NITK ‘ENGINEER 2010’ – ‘Realise’ and ‘Neutralise’ Report Page 23
9 Discussion
9.1 Assumptions
Electricity:
1) Energy consumption of fans, lighting fixtures and Air Conditioning/Cooling
equipment not measured values; obtained/calculated from technical literature or
power ratings displayed on appliance.
2) Room usage hours (for defining electrical energy use profile) for pre-event and
during event use based on approximations by ENGINEER CORE and not actual
measured time values.
Paper, Plastic:
1) Paper content assumed to contain 0% post-consumer recycled content and
assumed to be equivalent to A4 copier paper for the purposes of GHG
inventorying.
2) Plastic not measured
Bottled Water:
1) Soft drinks assumed to be equivalent to Bottled Water for the purposes of GHG
inventorying.
2) Proportion of plastic/water weight assumed to be constant across various bottled
water categories and hence only total litres measured to estimate GHG emissions.
Food:
1) GHG Emissions coefficients for Chicken, Cheese, Cream, Butter and Yogurt
based on international LCA data from 'Gemis 45' database.
2) All Ice Cream modeled as Fresh Cream
3) All Yogurt modeled as Milk
Travel:
1) All inter-city flight distances calculated using travelmath.com
2) All Car Travel (unless explicitly stated by Client) was assumed to be Petrol-fuel
based
Water:
1) Quantity not measured. Based on pre-event interviews with operations personnel
no extra water is purchased for event.
NITK ‘ENGINEER 2010’ – ‘Realise’ and ‘Neutralise’ Report Page 24
9.2 Data Gaps
The existing resource consumption inventory and Total Carbon Footprint magnitude is
influenced by a few clearly identified data-gaps (in the context of the finite Footprint
calculation boundary). Their impact on Total Carbon Footprint and the resultant Activity
and Stakeholder differentiations is not expected to be significant but nonetheless critical
for purposes of completeness. Primary amongst these data gaps are:
1. Lack of measurable verifiable data for Water Consumption during festival.
2. Electricity Billing information for all Event facilities.
3. Marketing and Advertising related Paper and Plastic (flex) consumption.
4. Solid Waste generation data to estimate methane emissions from landfilling of
Municipal Solid Waste and determining recyclable resource wastage / potential
for recycle during future events.
10 Limitations
10.1 Water Footprint
Water is a scarce resource and warrants study as a distinct entity beyond the Carbon
Footprint implications involved in its processing and public supply distribution systems
as well as on-site pumping. However, while this does study does quantify the total annual
quantity of water used and its associated Carbon Footprint, it does not provide an
estimate of the other (and possibly more significant) ecological impacts associated with
high quantities of water usage. Moreover, the study does not include the ‘embedded’
Water Footprint implicit in the resources purchased and consumed themselves. Including
this quantity would possibly exponentially increase the Total Water Footprint of
ENGINEER 2010. However, state-of-art prevents such an exhaustive assessment to be
conducted at this point in time.
NITK ‘ENGINEER 2010’ – ‘Realise’ and ‘Neutralise’ Report Page 25
11 Conclusions and Recommendations
11.1 Conclusions
The Total Carbon Footprint of ENGINEER 2010, estimated to be 29.3 tons CO2e, is
comprised of the following activity-related Footprints, in order of decreasing magnitude:
Travel and Logistics (11.2 tons CO2e – 38.4%), Electricity (9.6 tons CO2e – 32.8%),
Food, Beverage, and Waste (4.4 tons CO2e – 14.9%) and Cooking & Diesel Fuel (4.0
tons CO2e – 13.5%). These activities would be considered to be the ‘Key Source
Category’ activities for ENGINEER 2010
The Carbon Footprint estimate of 29.3 tons CO2e, to serve a participant and visitor base
of 4,233 persons lead to a per-participant served Carbon Footprint of approximately 6.9
kg CO2e.
The results make it clear that the primary stakeholder contributions arise from activities
related to the ENGINEER CORE (9.7 tons CO2e – 33.0%), Event Participants and
Visitors (5.3 tons CO2e – 18.0%), Food Court (4.9 tons CO2e – 16.6%), and
Judges/Guest Speakers (4.8 tons CO2e – 16.4%).
Activity analysis for the major Stakeholder groups reveals that ENGINEER CORE’s
primary impact arises from electricity use - accounting for 9.6 tons of the 9.7 ton CO2e
Footprint of the CORE. The Food Court’s primary impacts are related to Diary
consumption (2.3 tons CO2e) and Cooking Fuel consumption (1.8 tons CO2e). The
impact of Judges/Guest Speakers arises mainly due to International Air Travel (2.0 tons
CO2e) and Domestic Air Travel (1.5 tons CO2e). The Carbon Footprint of Event
Participants is a consequence of the Long Distance Bus and Rail Travel. However, it
must be noted that the ‘Carbon-Efficiency’ of this Stakeholder group is very high due to
the reliance on mass transit systems and relatively lower reliance on private vehicular
transport to the event; the magnitude is a consequence of the greater population size that
comprises this group as opposed to others.
A noteworthy aspect of the event organization was the fact that guest accommodation
was handled using in-house facilities; this elimination of luxury hotel accommodation
helped curb a component of Carbon Footprint which is usually significant for most mass
events. This arrangement allows for energy efficiency control and monitoring within the
event premises and diminishes the likelihood of extravagant energy consumption
prevalent in the hospitality industry in India.

NITK ‘ENGINEER 2010’ – ‘Realise’ and ‘Neutralise’ Report Page 26
11.2 Carbon Footprint Offsetting Recommendations
An innovative offsetting method that is recommended for ENGINEER 2010 is a
‘portfolio’ of in-house measures to optimize resource and energy consumption. This
approach, as compared to a conventional approach of purchasing CERs, is far more
potent in its potential for creating sustainable behavioral change and inculcation of
individual accountability for Climate Change amongst the students of NIT (K). Besides,
these measures can be seen as net financial gains as they will invariably reduce operating
costs for the educational facility as opposed to the increased expenses resulting from
purchasing of expensive Carbon Credits from the international CER or VER market.
The recommended offsetting portfolio of in-house measures comprises the following:
1) Establishing a committee of students that will propagate the ‘upby2’ campaign
devised by the Climate Change Research Analysis and Outreach Body -
no2co2.in. A target of 8,000 ‘upby2’ actions during December 2011 to October
2012 is suggested. This will lead to a estimated Carbon Footprint ‘offsetting’ of 2
tons CO2e.
2) 2 ‘earth-hours’ per week (i.e. 8 per month) during December 2011 to October
2012 – with atleast 2,000 numbers of 40W tubelights switched-off for 1-hour.
This would ‘offset’ an estimated 10 tons CO2e.
3) Setting up/fabricating low-cost in-house composting systems (community scale
models – ‘Manthans’ – available through www.dailydump.org) for composting .
Composting approximately 75 kgs biodegradable waste per day for a 12-month
period will ‘offset’ the remainder of the 17.3 tons CO2 Carbon Footprint.