Embed Size (px)
Citation preview

ENHANCEMENT OF THE INTERFACIAL TRANSFER
OF IODINE BY CHEMICAL REACTION
Juliette Roseanne Ling
A thesis submitted in conformity with the requirernents for the degree of
Master of Applied Science
Graduate Department of Chemical Engineering and Applied Chemistry
University of Toronto
O Copyright by Juliette Roseanne Ling 1997

~ib i io~raphic Services services bibliographiques
395 Wellington Street 395, rue Wellington Ottawa ON K I A ON4 Ottawa ON KI A ON4 Canada Canada
Your Irle Votre reterence
Our file Notre reterence
The author has granted a non- exclusive licence allowing the National Library of Canada to reproduce, loan, distribute or sel1 copies of this thesis in rnicroform, paper or electronic formats.
The author retains ownership of the copyright in this thesis. Neither the thesis nor substantial extracts from it may be printed or otherwise reproduced without the author's permission.
L'auteur a accordé une licence non exclusive permettant à la Bibliothèque nationale du Canada de reproduire, prêter, distribuer ou vendre des copies de cette thèse sous la forme de microfiche/filrn, de reproduction sur papier ou sur format électronique.
L'auteur conserve la propriété du droit d'auteur qui protège cette thèse. Ni la thèse ni des extraits substantiels de celle-ci ne doivent être imprimés ou autrement reproduits sans son autorisation.

Enhancement of the Interfacial Transfer of Iodine by Chemical Reaction
Juliette Roseanne Ling, M.A.Sc. Thesis. 1997, Graduate Department of Chemical
Engineering and Applied Chemistry, University of Toronto
Enhancement of the interfacial transfer of iodine by chernical reaction was studied by
developing a mechanistic model to simulate the interfacial transfer of iodine, and then testing
the model experimentally. The reactions considered were those of iodine with thiosulphate,
iodide, and hydroxide ions and radiolytic reactions. Two separate systems were studied; one
for evaporation and one for absorption of iodine. It was found that impingement had a
significant effect on interfaciai transfer, promoting absorption into solution and impeding
evaporation from solution. Also, the overall mass transfer coefficient of iodine was
dependent upon the concentration of Iz(g) in the system andor the equilibrium constant of the
reaction, depending on the reaction involved. As well, radioIytic reactions enhanced the
interfacial transfer of iodine, and the degree of enhancement was dependent upon the dose
rate of the radiation field present and the pH of the solution.
1 would like to thank the following people for their contribution to the completion of this
project :
Dr. Evans, for his guidance and supervision
the members of the Environmental and NucIear Engineering Group, especially Fariborz,
Sevana, Tutun, Mark, Phi1 and Nawal, for their advice, assistance and encouragement
my family, for their support and tolerance
and my sister Nicole, for everything
Most of all, 1 would like to thank God for surrounding me with ail these people, who have
been there for me when 1 was most in need of comfort and support.

Nomenclature
List of Figures
List of Tables
1. Introduction
2. Theoretical Principles
2.1 Diffusion equations
2.2 Gas-liquid interfacial mass transfer principles
2.3 Mass transfer models
2.4 Liquid and gas phase limitations
2.5 Enhancement of mass transfer by chemical reaction
2.5.1 First order reactions
2.5.2 Second order reactions
2.5.3 Pseudo first order reactions
3. Literature Survey
3.1 Evidence for the enhancement of mass transfer by chemical
reaction
3.2 Experimental inethods of determining mass transfer
coefficients
3.3 Enhancement of the mass transfer of iodine by chemical
reaction
. . . V l l l
x
xii
1
3
3
3
5
6
7
7
8
9
10

transfer
4. Experimental Procedure
4.1 Evaporation of water
4.2 Absorption of iodine into sodium thiosulphate
4.2.1 Initial preparation
4.2.2 Experimental procedure
4.2.3 Sample removal
4.2.4 Charcoal trap changeover
4.3 Evaporation of iodine from solutions containing iodine,
iodide ions and triiodide ions
4.3.1 Solution preparation
4.3.2 Experimental procedure
4.3.3 Evaporation of iodine from an aqueous solution of
molecular iodine
4.4 Absorption of iodine into iodide ion solutions
4.4.1 Initial preparation
4.4.2 Experimental procedure
4.4.3 Absorption of iodine into water
5. Cornputer Modelling
5.1 The basic mode1
5.2 Modelling of absorption

5.2.2 Absorption of iodine gas into thiosulphate solutions
5.2.3 Absorption of iodine gas into iodide solutions
5.2.4 Absorption of iodine gas into hydroxide solutions
5.3 Modelling of evaporation
5.3.1 Evaporation of iodine from aqueous iodine
5.3.2 Evaporation of iodine from solutions containing iodine,
iodide ions and triiodide ions
5.3.3 Evaporation of iodine in the presence of radiolytic
reactions
6. Results and Discussion
6.1 Mass transfer without chernical reaction
6.1.1 Experimental results
6.1.2 Modelling
6.2 Mass transfer accompanied by reaction with thiosulphate ions
6.2.1 Experimental results
6 .22 Modelling
6.3 Mass transfer accompanied by reaction with iodide ions
6.3.1 Evaporation
6.3.2 Absorption
6.4 Mass transfer accompanied by reaction with hydroxide ions

radiation field
7. Conclusions
8. References
List of Appendices
Appendix A - Specifications of Instruments and Chemicals Used
Appendix B - Calibration of Instruments
Appendix C - Experirnental Data
Appendix D - Calculations and Error Analysis
Appendix E - Listings of the Computer Models

gas-liquid interfacial surface area (cm2)
concentration of X at equilibrium (M)
concentration of X at the gas-liquid interface (M)
diffusivity (cm21s)
thickness of the gas side film (cm)
thickness of the liquid side film (cm)
flow rate of air (crn31s)
the enhancement factor
the maximum enhancement factor
iodine waterlair equilibrium partition constant
concentration of iodine gas entering the reaction vesse1 (M)
aqueous concentration of iodine (M)
reverse reaction rate constant of a reversible reaction
fonvard reaction rate constant of a reversible reaction
gas phase mass transfer coefficient (crnls)
liquid phase mass transfer coefficient (cm/s)
enhanced liquid phase mass transfer coefficient (cm/s)
rate constant of a second order irreversible reaction
pseudo first order rate constant of a reaction
equilibrium constant of a reversible reaction
overall mass transfer coefficient based on the gas side (cmls)
overall mass transfer coefficient based on the liquid side (cm/s)
rate of mass transfer (molls)
partial pressure of the ambient water vapour
saturation partial pressure of water at temperature T
fractional rate of surface renewal, as defined by the surface renewal
theory

1
contact time, as defined by the penetration theory
volunie of the liquid phase (cm3)
volume of the gas phase (cm3)

the reaction vessel used in experiments
diagram showing the direction of the flow of air through the flow meters
apparatus used for the experiments on the evaporation of water
apparatus used for the experiments on the absorption of iodine into sodium thiosulphate
apparatus used for the experiments on the evaporation of iodine from triiodide solutions
apparatus used for the experiments on the absorption of iodine into iodide solutions
division of the liquid phase film into zones
configuration of the reaction vessel in the (a) nomal and (b) reversed experiments
plot of ln(absorbance) against time for the evaporation of I2 from an aqueous solution of molecular iodine
plot of ln(H[12]gain-[12]) against time for the absorption of I2 into water
approach of the overall mass transfer coefficient to a steady state value
the effect of increasing the number of zones in the film
rate of absorption of I2 gas into a O. 1 M sodium thiosulphate solution
comparison of experimental and modelling resuIts for the absorption of I2 into ~ 2 0 ~ ~ ' solutions
dependence of KOL on [IZ]gaiii for the absorption of I2 into solutions

for the absorption of I2 gas into O M, 1 x 1 O-' M and 1 x 1 O-' M ~ 2 0 3 ~ - solutions
6.10 rate of change of ln[12] for the evaporation of I2 frorn a 0.05 M 1-/13- M solution
6.1 1 dependence of KOL on the 1- concentration for the evaporation of Iz from 13- solutions 61
6.12 plot of ln(HII~]g,isi~-[Iz]) against time for the absorption of I2 into a 0.5 M 1- solution 62
6.13 diagram showing how impingement might affect interfacial transfer 66
6.14 dependence of KOL on 1- concentration for the absorption of I2 into 1- solutions
6.15 effect of changes in kb and [IZlgasin on the mode1 output for the absorption of 12 into 1- solutions
6.16 effect of [121gain and k, on the absorption of I2 into hydroxide solutions
6.17 dependence of KOL on reactant concentration for the absorption models
6.18 dependence of KOL on the volatility of atomic 1
6.19 effect of pH on the evaporation of I2 frorn an irradiated iodide solution
B.1 calibration curve for triiodide solutions at a wavelength of 350 nm

summary of KoLAN values calculated from Polissar's data [ I l ] for the evaporation of iodine from triiodide solutions
experimental values of the gas phase rnass transfer coefficient of water
values of kl based on the evaporation of I2 from aqueous I2
values of kl based on the absorption of I2 into water
modelling results for the rnass transfer of I2 withowt chernical reaction
dependence of K O ~ on the number of zones in the liquid phase film
KOL values for the absorption of Iz into O. 1 M sodium thiosulphate
KOL values for the absorption of I2 into sodium thiosulphate solutions
enhancement factors for the absorption of I2 into sodium thiosulphate
effect of increasing the fonvard rate constants of reactions 6-5 to 6-9 on KOL
KOL frorn the experiments on the evaporation of I2 from 0.05 M I'/13- solutions
KOL for the evaporation of I2 from Im/13- solutions
comparison of KOL values for triiodide evaporation experiments with and without charcoal traps
KoL- values from the experiments on the absorption of I2 into 0.5 M 1-
Kot values for the absorption of I2 into 1- solutions
comparison of Koi, values for the normal and reversed systems
kg values for the normal and reversed systeins
comparison of kg values from evaporation and absorption experiments
dependence of Koia on the forward rate, reverse rate and equilibriuin constants
xii

determined Irom the iodide absorption mode1
D. 1 formulas used for the propagation of mors
D.2 errors associated with the parameters of the experiment
... X l l l
Interfacial mass transfer, which is the transfer of material from one phase to another,
is of particular importance in industry. It occurs in many facets of engineering, including
separation and recovery operations, chemical manufacturing processes, electrochemical
deposition processes, distillation and gas chromatography. It has long been recognised that
the efficiency of many of these processes c m be improved by enhancing mass transfer. This
can be accomplished by changing the design of the system, adjusting operating conditions, or
by chemical reaction.
This study is concerned with gas-liquid interfacial transfer. There are many different
types of gas-liquid mass transfer equipment. Examples of these are packed and plate
columns, trickle bed reactors, scrubbers, agitated vessels and bubble columns. These pieces
of equipment are al1 designed with the idea of promoting the rate of gas absorption or
desorption. Large surface area to volume ratios, long residence times and fluid agitation are
factors that are common to almost al1 gas-liquid mass transfer equiprnent. It was early in the
twentieth century that the almost limitless potential of chemical reaction to enhance mass
transfer was recognised. Specifically, it was observed that rapid chemical conversion of a
molecule in a liquid phase could greatly reduce the time required for its transfer from an
interface to the bulk fluid, thereby increasing its liquid phase mass transfer coefficient.
In this study, the effect of various chemical reactions on the interfacial transfèr of
iodine was studied. The objectives were: (1) to measure the enhancement as a function of the
concentration of the reactants, (2) to create a mechanistic model to simulate these systems
and (3) to extend this model to predict the extent of enhancement due to radiolytic reactions.
The reactions that were investigated in this research were those between iodine and
thiosulphate ions, iodide ions and hydroxide ions. Iodine was an ideal choice for this study
because it is volatile, is easily measured, and the kinetics of the reactions had already been
determined. There was also some industrial significance in the choice of iodine for this
study. Iodine-13 1, in the form of caesium iodide, is a fission product produced in nucleas
reactors. Under conditions that could arise inside the containment structure of a reactor,
some of this caesium iodide might be converted to iodine via radiolytic reactions. If the mass

volatilisation of radioiodine may be accelerated, increasing the amount of gas phase iodine
potentially available for release to the environment. Conversely, the high concentrations of
thiosulphate in the sprays that might be used in some containment structures could also
enhance interfacial transfer, thereby improving the scrubbing efficiency of these sprays. It
was therefore worthwhile to investigate whether or not the mass transfer of iodine is
enhanced by chemical reaction, and, if it is, under what conditions.
The study was divided into two main parts: (1) experimental collection of mass
transfer data and (2) computer simulation of mass transfer with chemical reaction. The first
part was perforrned for simple systems in which iodine gas was either absorbed into solution
or evaporated from solution, in the absence and in the presence of various chemical reactions.
The system basically consisted of a flow of gas impinging ont0 a stagnant pool. The methods
used for deterrnining the aqueous concentration of iodine in the system were radioactive
tracing and ultra-violet spectrophotometry. The extent of the enhancement of mass transfer
was measured by comparing mass transfer parameters in the presence of chemical reaction to
those for physical absorption alone. The second part of the study was done by using the
FACSIMILE program to model the mass transfer of iodine in the presence of the chemical
reactions that were investigated in the first part. This was done to veriS, that the model
worked. Once this was accomplished, the model was extended to include mass transfer in the
presence of a radiation field.
In this document, the basic principles behind mass transfer are outlined in chapter 2.
Chapter 3 provides a review of published literature on the effect of chemical reactions on the
rate of mass transfer. Chapter 4 gives a detailed description of the experimental procedures
followed in performing the experimental part of the project, and chapter 5 provides details on
the computer modelling part of the project. Chapter 6 presents the results of the study,
together with a discussion of these results. Finally, conclusions are made in chapter 7.

2.1 DIFFUSION EQUATIONS
Diffusion is the random motion of particles in a fluid. The driving force for diffusion
is concentration gradients within the fluid. The equations governing one-dimensional
diffusion of a species A are
where a is the concentration of A as a function of space and time and R is the flux of A
across a unit area perpendicular to the direction of diffusion. Equation 2-1 is Fick's second
law of diffusion, and can be derived from the continuity equation by assuming constant
density and diffiisivity, and a stagnant fluid. For a gas, A, being absorbed into a liquid,
equation 2-2 defines the rate of absorption of A, where x is the distance from the gas-liquid
interface. For a system in which diffusion is accompanied by chernical reaction, equation 2-2
is unchanged but equation 2-1 becomes
where ra is the rate at which A is consumed by the reaction. Solutions to equations 2-1, 2-2
and 2-3 are given in most mass transfer texts [ l , 2,3].
2.2 GAS-LIQUID INTERFACIAL MASS TRANSFER PRINCIPLES
A molecule diffusing from the gas phase to the liquid phase or vice versa is said to
undergo interphase mass transfer. The rate of mass transfer across the gas-liquid interface is
given by equations 2-4 and 2-5 [2,3,4].

In these equations, Ci and Cg denote the bulk concentrations in the liquid and gas phases
respectively, Ci,i and Cg,i denote the liquid and gas interfacial concentrations and ki and k, are
the liquid and gas phase mass transfer coefficients. If the mass transfer system is closed.
equilibrium will be achieved. At this stage, the concentrations in the gas and liquid phases
will be reiated by equation 2-6. Subscript eq indicates equilibrium concentrations
the liquid-gas equilibrium partition coefficient.
Cl., - H -- cg$,
and H is
2-6
It is experimentally difficult to measure concentrations at the interface, and therefore it is
more usefùl to describe the rate of diffusion in terrns of bulk concentrations. Equations 2-7
and 2-8 give the rate of mass transfer in terms of the concentrations of the diffusing species in
the bulk gas and bulk liquid phases.
The terms Kor, and KOG denote the overall mass transfer coefficients using, respectively, the
liquid and gas side as the basis, and are defined by equations 2-9 and 2-1 0.
In this study, KoId will be the parameter used to describe mass transfer, and hence al1
subsequent reference to the overall mass transfer coefficient will pertain to KoI..
It is generally believed that in interfacial mass transfer, there exists two films which
impede mass trmsfer, and hence the rate of rnass transfer is dependent upon transfer through
these two films. The films are located immediately above and below the mass transfer
interface; one in the gas phase and one in the liquid phase. Many theories have been
proposed to explain the phenornenon of mass transfer inside these two films, but only three
are widely accepted today [2,3,4].
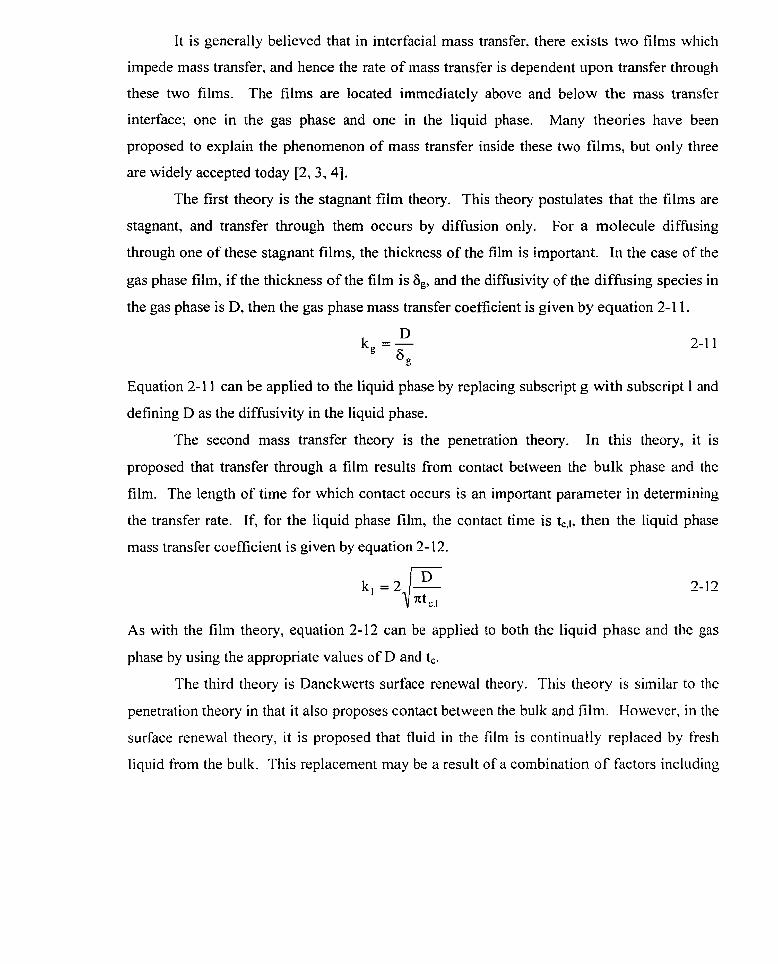
The first theory is the stagnant film theory. This theory postulates that the films are
stagnant, and transfer through them occurs by diffusion only. For a molecule diffusing
through one of these stagnant films, the thickness of the film is important. In the case of the
gas phase film, if the thickness of the film is 6,, and the diffusivity of the diffusing species in
the gas phase is D, then the gas phase mass transfer coefficient is given by equation 2-1 1.
Equation 2-1 1 can be applied to the liquid phase by replacing subscript g with subscript 1 and
defining D as the diffusivity in the liquid phase.
The second mass transfer theory is the penetration theory. In this theory, it is
proposed that transfer through a film results from
film. The length of time for which contact occurs
the transfer rate. If, for the liquid phase film, the
mass transfer coefficient is given by equation 2- 12.
contact between the bulk phase and the
is an important parmeter in determining
contact time is t,,~, then the liquid phase
As with the film theory, equation 2-12 can be applied to both the liquid phase and the gas
phase by using the appropriate values of D and tc,
The third theory is Danckwerts surface renewal theory. This theory is si~nilar to the
penetration theory in that it also proposes contact between the bulk and film. However, in the
surface renewal theory, it is proposed that fluid in the film is continually replaced by fresh
liquid from the bulk. This replacement may be a result of a combination of factors includiiig

- A
is given by equation 2-13, which, as with the other theories, can also be applied to the gas
phase.
k , =fi 2-1 3
In equation 3-1 3, s is the fractional rate of surface renewal.
The parameters 6, t, and s are al1 difficult to measure directly, and c m only be
estimated from mass transfer rates. They are highly dependent on experimental conditions,
including temperature, pressure, fluid flow rate and geometry of the system.
Although the three mass transfer models are very different, they are al1 based on
plausible theories. For example, the stagnant film theory suggests that the mass transfer
coefficient is directly proportional to diffusivity, whereas the other two models suggest that
the mass transfer coefficient is related to the square root of the diffusivity. However, in many
empirical correlations ki is proportional to D"~, ,/3 being between and 1. Shenvood,
Pigford and Wilke [3] compared the three models in terms of mass transfer enhancement, and
conciuded that al1 three models are adequate in predicting mass transfer enhancement due to
chernical reaction.
2.4 LIQUID AND GAS PHASE LIMITATIONS
As with any rate, the rate of mass transfer depends on the slowest step in the process.
If mass transfer through the liquid phase boundary is slower than transfer through the gas
phase film, then the rate of mass transfer will depend more on the liquid phase than on the
gas phase, and vice versa.
If the stagnant film theory is used, then the ratio of diffusivity to film thickness will
determine which film is rate Iimiting. The film for which this ratio is smaller will be the rate
limiting film. If the penetration theory is used, then the ratio of diffusivity to contact time
will determine which film is rate limiting, and if the surface renewal theory is used, the
product of diffusivity and fractional rate of surface renewal will determine which film is rate
limiting. In extreme cases, it is possible for the mass transfer rate to be limited by one of the
phases to suc11 an extent that the rate depends totally on that one phase. I n these cases, the

kg/H, then KOL will depend on kg only, and the rate of mass transfer will be gas phase limited.
If, on the other hand. kCH is infinitely large compared to kl, then KOL will be equal to kl, and
the rate of mass transfer will be totally liquid phase limited.
2.5 THE ENHANCEMENT OF MASS TRANSFER BY CHEMICAL REACTION
If mass transfer occurs in the presence of chemical reaction in the liquid phase, then
equation 2-4 has to be modified to account for the enhancement of mass transfer by the
reaction. Equation 2-14 defines the new rate of mass transfer, kif being the enhanced liquid
phase mass transfer coefficient.
N = k , ' ( ~ , - Ci) 2-14
The extent of the enhancement is measured by the enhancement factor, q, defined as the ratio
of the liquid phase mass transfer coefficient in the presence of chemical reaction to the liquid
phase mass transfer coefficient for physical absorption alone [2, 3,4].
The enhancement factor is a function of the rate constant of the reaction and the
concentration of reactant.
There are many different types of chemical reactions, and different conditions under
which each reaction takes place. In this study, first order reactions will be considered with
respect to reversibility of reaction and rate of reaction. Reactions wilI be categorised as slow,
fast or instantaneous and either irreversible or reversible. Second order and pseudo-first
order reactions will also be discussed.
2.5.1 FIRST ORDER REACTIONS
Consider gas A being absorbed into a liquid and undergoing irreversible reaction in
the liquid to form B.
A + B

" I A - - - - - - - - - -
reaction occurs, and hence, most of the reaction will occur in the bulk layer. In this case, the
absorption process will be the same as for physical absorption without reaction, and mass
transfer will not be enhanced. If the reaction is fast enough, then most of the reaction will
occur in the liquid phase film and mass transfer will be significantly enhanced. Using the
surface renewal model, an equation for approximating a value of the enhancement factor is
given by
Using the stagnant film theory, the enhancement factor is given by
If the reaction is instantaneous, then al1 of the reaction will occur in the liquid phase film. If
k, is large enough, then both equations 2-1 6 and 2-1 7 predict that the enhancernent of the
liquid side mass transfer can be practically infinite [2, 31.
The above discussion for slow reactions would still apply if the reaction was
reversible rather than irreversible.
A t , B
However, for an instantaneous, reversible first order reaction with finite equilibrium constant
K,,, the enhancement is limited. The maximum value that the enhancement factor can attain
is given by equation 2-1 8 [33.
'Pm, = 1 + K,, 2-1 8
2.5.2 SECOND ORDER REACTIONS
For an irreversible second order reaction of the form
A + P B + y C
the tnaximum value of cp is given by equatioil 2- 19 [2, 31.

In this equation, [BIinitial is the initial concentration of reactant B and [Ali is the concentration
of A at the interface. For second order reversible reactions of the form
A + P B t , y C
the derivation of an equation for the enhancement factor is complicated. However,
combining appropriate forms of equations 2-4 and 2-1 5 , cp may be obtained from equation 3-
20.
2.5.3 PSEUDO FIRST ORDER REACTIONS
In speciai cases, the behaviour of second order reactions can be approximated by first
order kinetics. Consider the following irreversible reaction:
A + B + C
The rate of the reaction is r = kr[A][B]. If the concentration of B is approximately constant,
then the rate of the reaction can be approximated by r .;: k,'[A], where k,' is equal to k,[B]. In
mass transfer theory, the condition that must be satisfied for a second order reaction to be
considered pseudo first order is
(P mm >> m where q,, is given by equation 2-19 and M is given by equation 2-22 [2].
M = DA r [BI initiai
k :

The enhancement of mass transfer by chemical reaction has been studied both
theoretically and experimentally for many different systems. Due to the empirical nature of
many of the parameters used to describe mass transfer, most of these studies have been based
on experimental verification of theoretically derived models. In addition to the different
mass transfer systems investigated, many different analytical methods have been used to
quantify mass transfer enhancement, ranging from comparison of mass transfer rates to
calculation of dimensionless parameters based on mass transfer coefficients.
3.1 EVIDENCE FOR THE ENHANCEMENT OF MASS TRANSFER BY
CHEMICAL REACTION
Enhancement of mass transfer by chemical reaction has been observed experimentally
by a number of authors. Many of these used plots of cp against JM to study mass transfer
enhancement. For example, Brian, Vivian and Habib [5] studied the effect of the hydrolysis
of chlorine on the absorption of chlorine into water in a wetted-wall column. They plotted cp
against 4~ and compared predictions based on the penetration theory to experimental results.
The conclusions that they made were: (1) the mode1 predictions agreed well with the
experimental results and (2) the hydrolysis of chlorine enhances the absorption of chlorine
into water, with enhancement factors ranging from 1.3 to 3. Because hydrochloric acid
suppresses the hydrolysis reaction of chlorine, absorption of chlorine into 0.2N hydrochloric
acid was studied to obtain data for the physical absorption of chlorine unaccompanied by
chemical reaction.
Another simpler method of studying mass transfer enhancement involves combining
equations 2-4, 2-12 and 2-1 5. Using this method, Takahashi, Hatanaka and Konaka [6]
studied the effect of reaction on the rate of absorption of chlorine using a stopcock absorber.
They analysed mass transfer enhancernent by plotting the rate of absorption against the
inverse square root of the contact time for the absorption of chlorine into a number of liquids.
The siopes of the plots were proportional to the product of the enhancement factor and the

absorption of chlorine into water was approximately 30% greater than that for physical
absorption alone. Since the concentration of chlorine at the interface would have decreased
due to the reaction between chlorine and water, the enhancement factor must have been
greater than one if the slope of the plot increased. This demonstrates the mass transfer
enhancement of chlorine due to the reaction between chlorine and water. Takahashi et al
also showed that the reaction between chlorine and sodium hydroxide also enhances the mass
transfer of chlorine, and the enhancement increases as the concentration of sodium hydroxide
increases.
Reaction in the bulk liquid can be divided into three different categories [ 2 ] : very
slow reaction, slow reaction and fast reaction. For very slow reaction the enhancement factor
is one, and mass transfer occurs as physical absorption only. For slow reaction with rate
constant k,, the rate of absorption increases without an increase in the enhancement factor
only if the condition d~ << 1 is met, where M is given by equation 2-22. For fast reaction,
the enhancement factor is greater than one. These three categories provide another useful
method of studying the enhancement of mass transfer by chemical reaction. Hix and Lynn
171 performed a study on the enhancement of the absorption of sulphur dioxide into solution
by reaction with hydrogen sulphide. They were able to conclude that the reaction between
hydrogen sulphide and sulphur dioxide was a slow reaction and so did not cause
enhancement of the liquid phase mass transfer coefficient of sulphur dioxide. Wowever, the
rate of absorption was increased due to the decrease in the concentration of H2S in the bulk
solution.
A study involving mass transfer with chemical reaction from gas bubbies was done by
Johnson, Hamielec and Houghton [8]. The system used in their study involved mass transfer
of carbon dioxide from single gas bubbles into aqueous solutions of monoethanolamine. As
in previous studies, the experimental results were compared to mode1 predictions based on
theory. They analysed their data by comparing the Shenvood number to R~"~SC"~. The
Sherwood number was used to demonstrate mass transfer enhancement because it is directly
proportional to the liquid phase mass transfer coefficient. The experimental plot of Sh
agaiiist R~"SC" shows that for the same value of R~"sc", Sh increased as the mole % of
therefore enhanced by reaction with monoethanolamine, and the enhancement was greater for
higher mole % of monoethanolamine.
3.2 EXPERIMENTAL METHODS OF DETERMINING MASS TRANSFER
COEFFICIENTS
It is more difficult to determine liquid and gas phase mass transfer coefficients than to
determine overall mass transfer coefficients. This is because of the difficulty in measuring
physical quantities at the mass transfer interface as opposed to measuring properties in the
bulk phases.
The most obvious method of determining overall mass transfer coefficients is by
direct measurement of bulk concentrations and relevant parameters, and subsequent
substitution into equation 2-7. Whitmore and Corsi [9] used this method to deterrnine overall
mass transfer coefficients for volatile organic compounds found in sewers. The experiments
were performed by introducing volatile tracer into wastewater in the sewer and collecting
bulk gas and liquid phase sarnples for analysis. The concentrations of the volatile tracer in
the gas and liquid bulk phases were determined by analysis of the sarnples with a Hewlett-
Packard gas chromatograph and mass selective detector. The experimental uncertainty in this
method of determining the overall mass transfer coefficient was approximately a factor of
two.
An indirect method of determining gas phase mass transfer coefficients was suggested
by Danckwerts [2]. By absorbing a gas into a solution with which the gas undergoes
instantaneous, irreversible reaction, it should be possible to determine the gas phase
coefficient. The rate of absorption would be proportional to k&, where Cg is the bulk gas
phase concentration.
Another indirect method of calculating gas phase mass transfer coefficients involves
using enipirical correlations. Trabold and Obot [IO] performed experiments on the
evaporation of water with impinging air jets and provided an equation for calculating the
mass transfer coefficient of water from the experimental data. Danckwerts [2] suggested that,

can be calculated from the gas phase mass transfer coefficient of water using equation 3-1.
In equation 3-1. the value of n is one if the film theory is used, and l/2 if the penetration
theory is used. In most empirical correlations, n is taken to be ?43.
3.3 ENHANCEMENT OF THE MASS TRANSFER OF IODINE BY CHEMICAL
REACTION
Iodine is important in nuclear technology because it is produced in nuclear reactors
and is a potential hazard to humans. Hence, a number of studies have been done on the rates
of transfer of iodine between the liquid and gas phases. An experimental study on the rates
of evaporation of chlorine, bromine and iodine from aqueous solutions was performed by
Polissar [ I I l . In his experiments, samples were periodically taken from a beaker containing
the aqueous solution under investigation. Using a titrimetric method of analysis, the
concentrations of the halogen in the samples were determined. In the case of iodine, he also
performed experiments to investigate the effect that reaction with iodide ions has on the rate
of evaporation of iodine. He analysed the results by plotting the concentration of the halogen
in the system against time and evaluating the rate of evaporation. For solutions of free iodine
and solutions in which the concentration of potassium iodide was less than 0.006 M, he found
that the rates of evaporation were approximately constant and equal. For solutions in which
the concentration of potassium iodide was between 0.066 M and 0.361 M, as the
concentration of potassium iodide increased, the rate of evaporation decreased. Polissar
concluded that the diminished rate of evaporation at higher potassium iodide concentrations
was due to a decrease in the amount of free iodine available for evaporation, resulting in a
decrease in the driving force for mass transfer. For solutions in which the concentration of
potassium iodide was 1 .O0 M and greater. the concentration of total iodine in the solution
actually increased. Polissar explained this increase by the rate of evaporation being so small
that the oxygen reaction more than compensated for the decrease in concentration. When

effect that the reaction between iodine and iodide ions might have had on the mass transfer
coefficient. However it was possible, using his experimental results, to estimate values of
KoLAN from the dopes of the plots. Table 3.1 shows a summary of the estimated values of
KoLA/V, based on Polissar's data, for the evaporation of iodine from solution.
Table 3.1 : summary of KoLAN values calculated from Polissar's data [1 I l for the
evaporation of iodine from triiodide solutions
1 Total Iodide Concentration (M) 1 KoLAN (8) 1
Comparing the values obtained for K o ~ A N , it c m be seen that for the evaporation of iodine
from solutions in which the iodide concentration was 0.0005 M or less, the overall mass
transfer coefficient was unaffected by the presence of iodide ions. As the concentration of
iodide ions increased above 0.0005 M however, the overall mass transfer coefficient also
increased, dernonstrating significant enhancement of iodine inass transfer. No upper limit on
the mass transfer coefficient was observed, and so a value for the gas pliase mass trai-isfèi
coefficient could not be estirnated. Values of cp could not be calculated without knowledge of
the gas phase mass transfer coefficient, but an estimation of the enhancement factor was
possible using equation 3-2.

In equation 3-2, H/kg is constant for both the nurnerator and the denominator. Assuming the
evaporation of iodine from the 0.25 M iodide ion solution to be close to gas phase limitation,
an upper bound on H/kg was estimated to be 220 slcm. Substituting this value of Hlk, into
equation 3-2 and using the data for the evaporation of iodine from a solution containing 0.15
M iodide ion, the enhancement factor was estimated to be 30 for the evaporation of iodine
from a solution containing 0.15 M iodide ions. In reality, the enhancement factor is larger
than this value because the actual maximum value of Hlk, is less than 220 slcrn.
Because sodium thiosulphate sprays are used inside containment structures, the effect
of the reaction between iodine and thiosulphate ions on the transfer of iodine inside
containment is important. Taylor [12] investigated the effect of various reactions, including
the reaction between iodine and thiosulphate ions, on the absorption of iodine into solution.
His absorption apparatus consisted of a disc-type laboratory column. By comparing KOG
values, he found that for the absorption of iodine into sodium thiosulphate and iodide
solutions of concentration greater than 0.08 M, the absorption of iodine was gas phase
limited. For the absorption of iodine into water, the absorption was appreciably limited by
the liquid phase. The overall reactions between iodine and thiosulphate ions and between
iodine and iodide ions are given in reactions 3-3 and 3-4.
I2 + 2 ~ 2 0 ~ ~ - 21- + ~ 4 0 6 ~ - 3 -3
I2 + I- t) 13- 3 -4
Reaction 3-3 and the forward reaction of 3-4 are fast, second order reactions, reaction 3-3
being almost instantaneous. If reactions 3-3 and 3-4 are assumed to be pseudo-first order
reactions, then using equations 2- 16 and 2-1 9, upper limits on the enhancement factor can be
estimated for both. Since kr is large for both reaction 3-3 and the forward reaction of'3-4, the
maximum enhancement factor will be large for both reactions for high reactant concentration.
Taylor's observation that the enhancernent was the sarne for both reactions for reactant
concentrations above 0.08 M suggests that at these concentratioiis maximum enliancement
had already been achieved and mass transfer was indeed limited by the gas side.

3.4 PREDICTION OF REACTION RATE CONSTANTS FROM RATES OF
MASS TRANSFER
Using Danckwerts' [2] method of categorizing reactions by their rate, it should be
possible to estimate the rate constant of a reaction at some intermediate rate of reaction. For
a gas A being absorbed into a liquid and undergoing an irreversible, second order reaction
with a solute B dissolved in the liquid, Hix and Lynn [7] suggested a method of calculating
the rate constant, k,, of the reaction. In a sieve-tray absorber, the mass balance equation is
where QL is the volumetric flow of liquid to the tray and HL is the holdup volume of liquid in
the tray, CAO and CBo are the bulk concentrations, and CAi and CAinit are the interfacial and
initial concentrations of A respectively. For this system, the rate of absorption per unit
volume is given by equation 3-6,
where T is the residence time of liquid in the tray. If the reaction is too slow, then the last
term on the right of equation 3-6 is negligible. If the reaction is too fast, then most of the
reaction will occur in the film and CAO will be negligible. If, however, the reaction is slow
enough that the enhancement factor is one, and yet the rate of absorption is increased due to a
decreased amount of A in the bulk, then by rearranging equation 3-6, an equation for k, can
be obtained.
Hix and Lynn used this method to calculate the rate constant for the reaction between sulphur
dioxide and hydrogen sulphide, and reported that their results were in fair agreement with
previous measurements of the same rate constant.

In this chapter, a detailed description of al1 the experiments performed during this
study is provided. The experiments described are: (i) the evaporation of water, (ii) the
absorption of iodine gas into sodium thiosulphate solutions, (iii) the evaporation of iodine
from solutions containing iodine, iodide ions and triiodide ions, and (iv) the absorption of
iodine gas into iodide ion solutions. See appendix A for specifications on the equipment and
chernicals used.
Certain terms and parameters are relevant to more than one type of experiment and
will be defined now.
The reaction vessel: for experiments involving evaporation, this term refers to the
flask containing the solution being evaporated. For experiments involving absorption of
iodine gas, this term refers to the flask containing the absorbing solution. The volume of
liquid contained in the flask never exceeded 100 mL, and, at the liquid level, the diarneter of
the flask was measured with a vernier calliper to be 7.3 cm. A diagram of the reaction vessel
is shown in figure 4.1.
SAMPLE REMOVAL TUBE
AIR
Figure 4.1 : the reaction vessel used in experiments

" - - - - - - - , - - . - - - - - - - - - . - - -. . - - . ---O ----
absorption of iodine gas into solution, and refers to the flask containing the source of iodine
gas.
Air flow rate: for al1 the different types of experiments, one consistent flow rate was
used, and the choice of this flow rate was very important. If the flow rate chosen was too
slow or too fast, then the rate of mass transfer would be dependent upon the flow rate rather
than upon the mass transfer characteristics of the system. An intermediate flow rate was
therefore chosen that allowed the mass transfer characteristics of the system to be
investigated. The flow rate of 18 k 2 mL/s was the same as was used by the author in a
previous study [13]. One of two Cole Parmer flow meters were used to set the flow rate.
One flow meter was equipped with a medium flow tube, tube number N034-39 and a glass
float. The other flow meter used a high flow tube, tube number N044-40 together with a
glass float. Both meters were constructed such that the flow of air through them was metered
at the top of the tube. Al1 experiments were performed under vacuum. Figure 4.2 is a
diagrarn of the flow meters, showing their orientation in the experiments.
VALVE
AIR OUT OF METER TO PUMP/ASPIRATOR
AIR INTO METER
7&
Figure 4.2: Diagram showing the direction of the flow of air through the flow nieters
Plastic tubing: the plastic tubing used in al1 the experiments was clear plastic tubing
with an inside diameter of 1/4 ".

Experiments were performed on the rate of evaporation of water in order to determine
the gas phase mass transfer coefficient of water, and hence determine via empirical
correlations, the gas phase mass transfer coefficient of iodine.
In these experiments, a stream of air at the flow rate specified above was passed
through the system. The stream of air impinged upon 100 mL of water held in the reaction
vessel. The initial volume of water was measured using a 100 mL measuring cylinder. Using
a Cole Parmer humidity probe and a Barnant humidity probe, the relative humidity of the
incoming and exiting air strearns were measured. Two vessels were used to hold the
humidity probes. Each vessel was stoppered with a rubber bung, through which two holes
had been bored: one to allow air to enter the vessel and one to hold the humidity probe
upright in the vessel. Air was removed from the humidity probe vessel by an outlet on the
side of the vessel. A diagrarn of the apparatus used in these experiments is shown in figure
RH PROBE 1 RH PROBE 2 n n
VESSEL
Figure 4.3: apparatus used for the experirnents on the evaporation of water
At the begiiming and end of each experirnent, the temperature of the water was measured
using a FISHER thermometer with a temperature range of -10 O C to 260 OC. The temperature
of the water was taken as the average of these two ternperatures. The 100 mL measuring
cyIinder used to nleasure the initial volume of water was dried with a paper towel and used at

experiments were performed using the above procedure, each experiment being run for
between 3 and 8 hours.
4.2 ABSORPTION OF IODINE INTO SODIUM THIOSULPHATE SOLUTION
These experiments were perforrned for two main reasons. The first purpose was to
observe the effect that reaction with sodium thiosulphate has on the rate of absorption of
iodine gas, and the second purpose was to obtain a value for the gas phase mass transfer
coefficient of iodine from the experiments on the higher concentrations of thiosulphate ion
solutions. The value of kg that was obtained from these experiments was compared to the
value obtained from the experiments described in section 4.1. The concentrations of sodium
thiosulphate solutions used in the experiments were 1 x 10⁴ M, 2 x 10⁴ M, 5 x 1 o4 M, 1 x
10') M, 2 x 10" M, 5 x 10⁵ M, 1 x 1 0 - ~ M, 5 x 1 0 - ~ M and 1 x IO-' M. At least two runs were
performed for each concentration.
4.2.1 INITIAL PREPARATION
Firstly, a constant source of iodine gas was prepared by dissoiving 11.76 g of
potassium iodide and 0.77 g of molecular iodine in deionized water in a 250 mL volumetric
flask. The flask was filled up to the mark with deionized water. The iodine molecules
reacted with the iodide ions to form triiodide ions such that the initial concentrations in the
solution were: 6 x 10-j M free molecular iodine, 0.012 M triiodide ions and 0.28 M iodide
ions. To this iodine gas source, 67 pCi of 1-13 1 tracer, in the form of iodide ions, was added.
Using a 100 mL measuring cyiinder, 100 mL of this gas source was then measured out and
poured into the iodine gas source vessel. This vessel was then covered and al1 openings
sealed with stopcocks until ready for an actual experiment. A lubricant was used to ensure
that al1 the seals were secure.
The mass of sodium thiosulphate needed to make a specific solution of sodium
thiosulphate was determined and weighed out on an OHAUS mass balance. The sodium
thiosulphate solution was then prepared by dissolving the mass of solid sodium thiosulphate
- - - - - - - - - - - - - ------ u ---- ------- -r
to the mark with deionized water.
Charcoal traps were prepared by cutting 6 cm lengths of plastic tubing and plugging
one end with glass wool. Using a spatula, charcoal was then poured into the other end of the
tubing, such that the charcoal was loosely packed, and the length of the charcoal packing was
approximately 4 cm. The other end of the tubing was then plugged with glass wool. For each
experiment, at least four charcoal traps were prepared in advance.
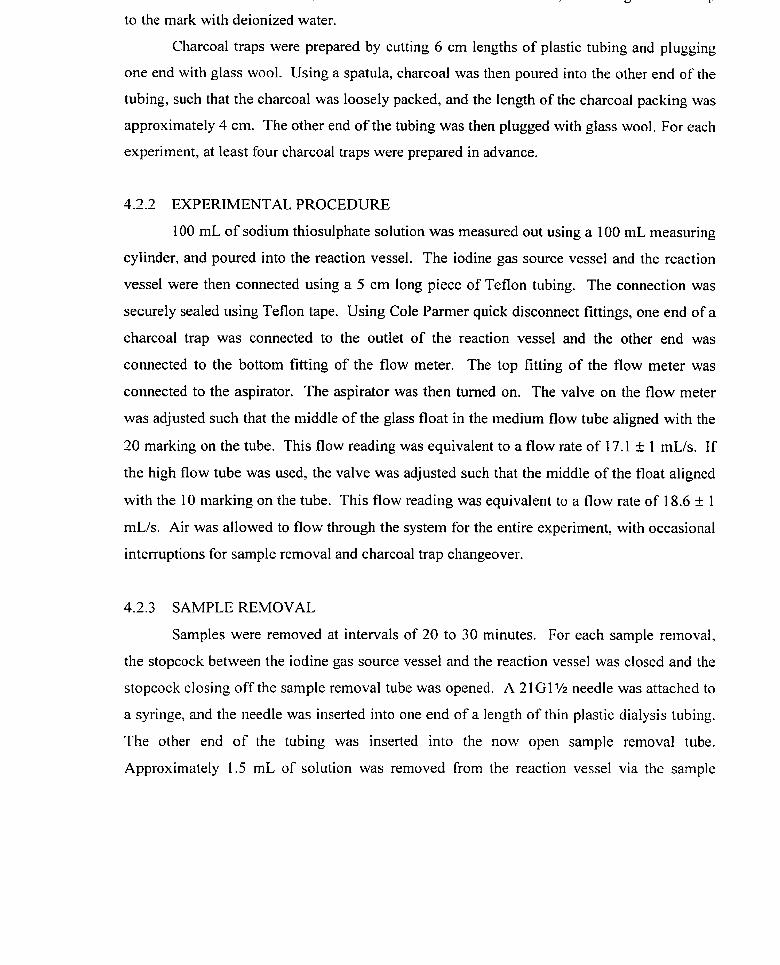
4.2.2 EXPERIMENTAL PROCEDURE
100 mL of sodium thiosulphate solution was measured out using a 100 mL measuring
cylinder, and poured into the reaction vessel. The iodine gas source vessel and the reaction
vessel were then connected using a 5 cm long piece of Teflon tubing. The connection was
securely sealed using Teflon tape. Using Cole Parmer quick disconnect fittings, one end of a
charcoal trap was connected to the outlet of the reaction vessel and the other end was
connected to the bottom fitting of the flow meter. The top fitting of the flow meter was
connected to the aspirator. The aspirator was then turned on. The valve on the flow meter
was adjusted such that the middle of the glass float in the medium flow tube aligned with the
20 marking on the tube. This flow reading was equivalent to a flow rate of 17.1 + 1 mL/s. If
the high flow tube was used, the valve was adjusted such that the middle of the float aligned
with the 10 marking on the tube. This flow reading was equivalent to a flow rate of 18.6 k 1
mWs. Air was allowed to flow through the system for the entire experiment, with occasional
interruptions for sarnple removal and charcoal trap changeover.
4.2.3 SAMPLE REMOVAL
Samples were removed at intervals of 20 to 30 minutes. For each sample removal,
the stopcock between the iodine gas source vessel and the reaction vessel was closed and the
stopcock closing off the sample removal tube was opened. A 21 G1 l/2 needle was attached to
a syringe, and the needle was inserted into one end of a
The other end of the tubing was inserted into the
Approximately 1.5 mL of solution was removed from
ength of thin plastic dialysis tubing.
now open sample removal tube.
the reaction vessel via the sample

then removed from the reaction vessel, the stopcock at the top of the sample removal tube
was closed and the stopcock between the iodine gas source and the reaction vessel was
reopened. The solution in the syringe was transferred to a 3 mL scintillation vial. Using an
Eppendorf 1 mL micropipette, 1 mL of solution was removed from the scintillation via1 and
placed in a new 3 mL scintillation vial labelled with the number of the sampte. The vial was
then placed in a rack for counting in an LKB gamma counter. Using this procedure, 5 to 6
samples were collected for each experiment.
4.2.4 CHARCOAL TRAP CHANGEOVER
At intervals of 25 minutes, the charcoal traps were changed, a total of 4 to 6 traps
being used in each experiment. Before changing each trap, the stopcock between the iodine
gas source vessel and the reaction vessel was closed. Using the quick disconnect fittings, the
charcoal trap was quickly removed and replaced by a new charcoal trap. The stopcock was
then reopened. The old charcoal trap was fieed from al1 fittings and placed in a test tube,
with the end of the charcoal trap that was nearest to the reaction vessel at the bottom, rounded
end of the test tube. A piece of parafilm was then used to seal the rnouth of the test tube, and
the test tube was placed in a rack, rounded end facing down, to await counting in an LKB
gamma counter. A diagram of the experimental set-up used in these experiments is shown in
figure 4.4.
SAMPLE REM OVAL
--71 \ \ / /
AIR AIR TO IN ASPIRATOR
FLOW IODINE REACTIO N METER GAS VESSEL
SOURCE
Figure 4.4: apparatus used for the experiments on the absorption of iodine into sodium
thiosulphate

by placing two charcoal traps in series, downstream of the reaction vessel. It was found that
less than 2 % of iodine leaving the reaction vessel reached the second charcoal trap.
Therefore, only one charcoal trap was used in subsequent experiments.
Each experiment was run for a duration of 100 to 180 minutes. At the end of each
experiment, the aspirator was turned off, al1 stopcocks attached to the iodine gas source
vessel were closed and appropriate procedures were followed to dispose of al1 radioactive
waste.
4.3 THE EVAPORATION OF IODINE FROM SOLUTIONS CONTAINING
IODINE, IODIDE IONS AND TRIIODIDE IONS
These experiments were performed to observe the effect that the presence of iodide
ions has on the mass transfer of iodine. A Varian Cary 3 UV-Vis spectrophotometer was
used to analyse the sarnples in these experiments for iodine content. The total iodide
concentration in the solutions used were 1 x 1 o4 M, 1 x 1om3 M, 2.5 x 10⁵ M, 5 x 1 M, 1 x
1 O-' M, 2.5 x 1 0-2 M, 5 x 1om2 M, 1 x 10" M, 2 x IO-' M and 5 x 1 O-' M. For each of these
concentrations, more than one experimental run was performed.
4.3.1 SOLUTION PREPARATION
Al1 solutions prepared and used in these experiments were categorized by the
concentration of iodide ions in them. These solutions of molecular iodine, iodide ions and
triiodide ions were prepared by weighing out the amount of potassium iodide required to
make a solution of specific iodide ion concentration. This potassium iodide was then
dissolved in deionized water in a 100 mL, 250 mL or 500 mL volumetric flask, together with
a small amount of molecular iodine. Enough deionized water was then added to fil1 the
volumetric flask up to the mark. The arnount of molecular iodine added was determined by
requiring that the concentration of triiodide ions in the final solution be suc11 that its
absorbance at 350 nm was less than 2.0.

Using a 100 inL measuring cylinder, 100 mL of the prepared iodine, iodide ion and
triiodide ion solution was poured into the reaction vessel. 'The vessel was then closed of'I: the
inlet tube being left open to the surrounding air, and the outlet tube being connected to the
flow meter with a charcoal trap between the reaction vessel and the flow meter. The purpose
of this charcoal trap was to keep the flow meter free from contamination by iodine gas, which
is corrosive. The flow meter was connected to the aspirator, and the aspirator was turned on.
Using the valve on the flow meter the flow was adjusted as described in section 4.2.2. The
sarnple removal method was the sarne as that described in section 4.2.3. Once the samples
were removed, they were transferred to a cuvette and placed in the sample compartment of
the Cary 3 UV spectrophotometer, which had been previously zeroed with water at a
wavelength of 350 nm. The effect of using water to zero the spectrophotometer rather than a
solution of the appropriate iodide ion concentration was investigated. It was found that
iodide ions have negligible absorbance at 350 nrn, and therefore did not have to be taken into
account when zeroing the machine. For each experiment, 4 to 6 samples were taken, sample
removal intervals varying from 15 minutes for low iodide ion concentrations to 4 hours for
high iodide ion concentrations. Experiments on 0.2 M and 0.5 M iodide solutions were
repeated with a charcoal trap attached to the apparatus upstrearn of the flow meter. Figure
4.5 shows a diagram of the apparatus.
SAMPLE REMOVAL
-III AIR IN
REACTIO N VESSEL
u FLOW METER
Figure 4.5: apparatus used for experiments on the evaporation of 12 from triiodide solutions

IODINE
These experiments were performed in order to determine a value for the liquid phase
mass transfer coefficient of iodine in the absence of chemical reaction. The procedure was
the same as in section 4.3.2, but instead of a solution containing iodine, iodide ions and
triiodide ions in the reaction vessel, the reaction vessel contained a saturated solution of
molecular iodine only. The saturated sokution of rnolecular iodine was prepared by placing
about 5 g of iodine crystals in 500 mL of deionized water and allowing the iodine to dissolve
over two weeks or more. The method of sarnple removal was also the same as in section
4.3.2. The concentration of iodine in the samples was measured at a wavelength of 460 nm
using the UV-Vis spectrophotometer.
4.4 ABSORPTION OF IODINE INTO IODIDE ION SOLUTIONS
These experiments were performed to observe the effect that the direction of mass
transfer has on the mass transfer coefficients. For the experiments on evaporation, overall
mass transfer occurred from the liquid to the gas phase, whereas in these experiments overall
mass transferred occurred frorn the gas to the liquid phase. The concentrations of iodide
solutions used were, 1 x 10" M, 1 x 1 0 - ~ M, 1 x 10-' M, 5 x 10-' M and 1 M. At least two
experimental runs were performed for each concentration.
4.4.1 INITIAL PREPARATION
Solutions for the iodine gas source were prepared by the same method described in
section 4.3.1. In some of these experiments, however, samples were periodically removed
from the iodine gas source vessel and analysed in the Cary 3 UV spectrophotometer.
Therefore, in these cases, the total iodine content of the iodine gas source was kept low to
allow for analysis in the spectrophotometer.
A humidifier was placed upstream of the apparatus so that the incoming air was pre-
humidified. This was to compensate for any water that miglit have evaporated due io
convection. The humidifier was simple in design. It consisted of a flask filled with
flask by an outlet tube at the top of the humidifier.
For each experiment, one charcoal trap was prepared using the same method as
described in section 4.2.1. This charcoal trap was placed before the humidifier to ensure that
the air entering the system was free of al1 iodine.
Instead of using charcoal traps to remove al1 the iodine leaving the system, as was
done in the experiments on the absorption of iodine into sodium thiosulphate, solutions of
high iodide ion concentration were used as traps. Each iodide trap contained 500 mL of O. 1
M potassium or sodium iodide inside a bubbler. Iodine leaving the reaction vessel was
bubbled through the first iodide trap and reacted with the iodide ions in the trap to form
involatile triiodide ions. Any iodine that escaped the first bubbler was trapped in the second
iodide bubbler.
Potassium iodide solutions were prepared, 100 mL at a time, using deionized water in
a 100 mL volumetric flask. These solutions were then poured into the reaction vessel for the
experiment. The solutions were prepared less than one hour before the start of each
experiment to ensure that as little of the iodide ions as possible were oxidized to molecular
iodine.
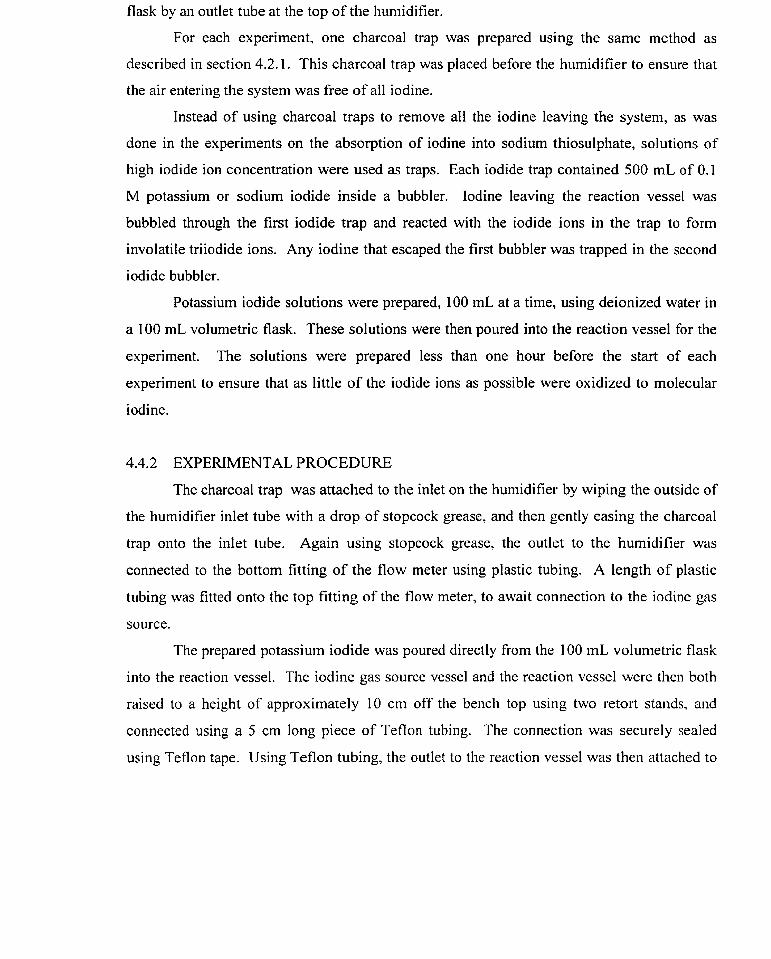
4.4.2 EXPERIMENTAL PROCEDURE
The charcoal trap was attached to the inlet on the humidifier by wiping the outside of
the humidifier inlet tube with a drop of stopcock grease, and then gently easing the charcoal
trap ont0 the inlet tube. Again using stopcock grease, the outlet to the humidifier was
connected to the bottom fitting of the flow meter using plastic tubing. A length of plastic
tubing was fitted ont0 the top fitting of the flow meter, to await connection to the iodine gas
source.
The prepared potassium iodide was poured directly from the 100 mL volumetric flask
into the reaction vessel. The iodine gas source vessel and the reaction vessel were then both
raised to a height of approximately 10 cm off the beiich top using two retort stands, and
connected using a 5 cm long piece of Teflon tubing. The connection was securely sealed
using Teflon tape. Using Teflon tubing, the outlet to the reaction vessel was then attaclied to

the second iodide trap, again using Teflon tubing. The outlet from the second iodide trap was
connected to a length of plastic tubing, the end of which was fitted with one half of a quick
disconnect fitting. The other half of the quick disconnect fitting was fitted onto a length of
plastic tubing, and this plastic tubing was then attached to the pump, which was set to draw
air through the system.
The connections between the humidifier and the flow meter and between the second
iodide trap and the pump were made, and the pump was turned on. The valve on the flow
meter was adjusted as described in section 4.2.2. Air was allowed to flow through the system
for the entire experiment, with occasional interruptions to allow for sample removal .
Samples were removed from the reaction vessel and the iodine gas source vessel using the
procedure described in section 4.2.3, and were analysed using the procedure described in
section 4.3.3. If the absorbance of any sample exceeded 2.0, then the sample was diluted
with the appropriate iodide ion solution and re-analysed in the Cary 3 UV spectrophotometer.
The intervals between sample removals ranged from I O minutes to 2 hours. A diagram of the
experimental set-up is shown in figure 4.6.
SAMPLE
HUMIDIFIER SOURCE VESSEL
IODIDE TRAPS
Figure 4.6: apparatus used for the experiments on the absorption of Iz into iodide solutions
sample from each of the iodine gas source vessel, the reaction vessel. the first iodide trap and
the second iodide trap were removed and analysed in the UV spectrophotometer.
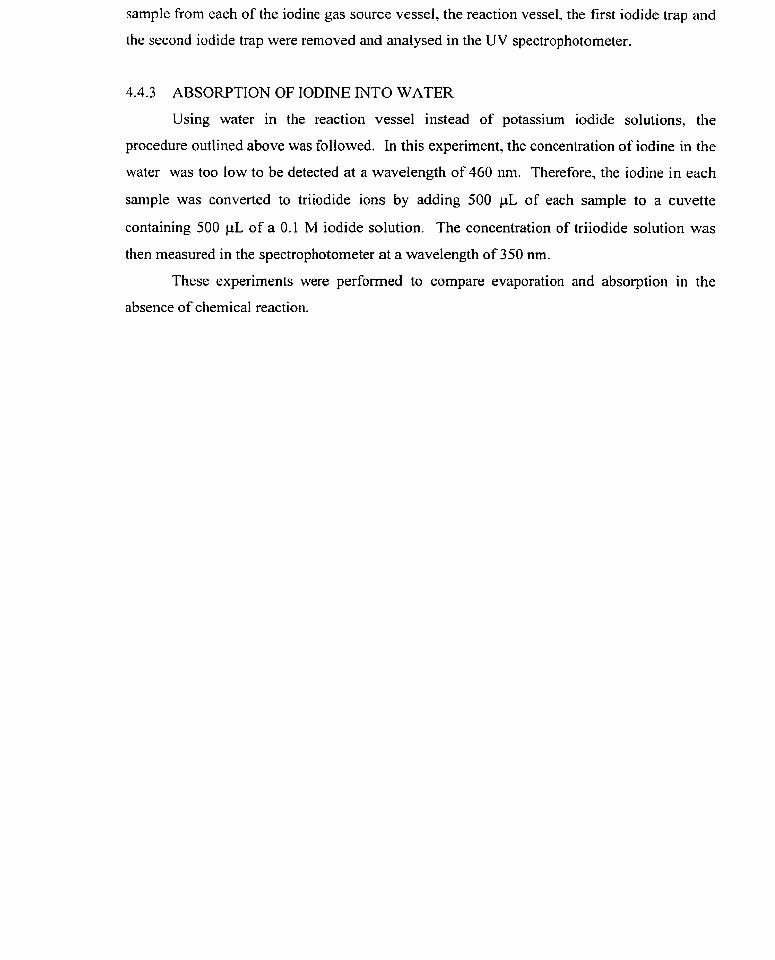
4.4.3 ABSORPTION OF IODINE N T 0 WATER
Using water in the reaction vessel instead of potassium iodide solutions, the
procedure outlined above was followed. In this experiment, the concentration of iodine in the
water was too low to be detected at a wavelength of 460 nm. Therefore, the iodine in each
sample was converted to triiodide ions by adding 500 pL of each sample to a cuvette
containing 500 pL of a 0.1 M iodide solution. The concentration of triiodide solution was
then measured in the spectrophotometer at a wavelength of 350 nm.
These experiments were performed to compare evaporation and absorption in the
absence of chemical reaction.

In this chapter, details of the FACSIMILE models constructed to simulate the
interfacial transfer of iodine are presented. Seven models were created; the first two involved
the transfer of iodine in the absence of chemical reaction, and the other five involved the
transfer of iodine in the presence of various chemical reactions. The seven models were:
the absorption of iodine into water
the absorption of iodine into thiosulphate solutions
the absorption of iodine into iodide solutions
the absorption of iodine into hydroxide solutions
the evaporation of iodine from an aqueous solution of molecular iodine
the evaporation of iodine from solutions containing iodine, iodide ions and
triiodide ions
the evaporation of iodine from solution in the presence of radiolytic reactions
Al1 seven models were constructed by modieing one basic model. The parameters
and conditions used in the basic model were the same as those used in the experimental part
of the project. The models are listed in appendix D.
5.1 THE BASIC MODEL
The reactions considered in this study are al1 aqueous reactions, and hence
enhancement of mass transfer due to these reactions occurs in the liquid phase. Therefore, in
the basic model, focus was placed on the liquid phase.
For the diffusion of a species C through a column of water, the equivalent forn-i of
equation 2-1 is equation 5- 1,
where [Cl is the aqueous concentration of species C, Dc is the diffusion coefficient of C in
water and x is the direction of diffusion. If the column is divided into a number of smaller

equation 5-2 [14].
In equation 5-2, subscript i denotes the ith zone, subscript i-1 denotes the zone above zone i
and subscript i+l denotes the zone below zone i. Equation 5-2 describes a set of ordinary
differential equations that is easier to work with than equation 5-1. The TRANSPORT
routine of FACSIMILE was used to set up equation 5-2 for the model.
The liquid phase film was divided into a number of zones of height s, the total
number of zones being denoted by #NZONE in the model. Using TRANSPORT, the transfer
of species between the liquid phase zones was modelled. The thickness of the liquid phase
film, Si, and hence the value of s, was determined by using the stagnant film theory.
Rearranging equation 2-1 1 yielded equation 5-3 for Si.
The height of each zone, s, was calculated using equation 5-4.
S = 6, 5-4
# NZONE - 1
was determined to be 1.2 x cm/s by averaging the values of D12,H20 calculated
frorn the Othrner and Thakar, Wilke and Chang, and Hayduk and Minhas diffusivity
equations [4, 18, 191, and the value of ki was the value obtained from experirnent. The only
equations that had to be defined for TRANSPORT were those involving the boundary
conditions. Transfer between the gas phase and the first zone in the liquid phase film was
modelled by using the value of kg determined from the experiment described in section 4.2
for high thiosulphate concentration. Transfer between the last zone and the bulk liquid was
modelled by assuming rapid transfer between the two layers. Bulk liquid concentrations were
therefore equal to the concentrations in the last zone of the liquid phase film.
In the experiments, a flow of air was passed through the system at a flow rate of 18
rnL/s. In the models, this flow of air was simulated by including an appropriate forni of
equation 5-5 in the TRANSPORT routine.

In this equation, [Cl,, is the gaseous concentration of C in contact with the interface, [Clgzin
is the concentration of C in the gas phase entering the system, and KVENT is equal to the
flow rate of air divided by the volume of gas in the system. Figure 5.1 is a diagrarn showing
how the liquid phase film was divided into zones.
I gas-liquid interface /
bulk liquid
Figure 5.1 : division of the liquid phase film into zones
Three output files were created for each model. The first output file showed the bulk
concentrations of iodine at specified times, the second output file showed the rates of the
reactions at specified times, and the third output file showed the concentrations in each zone
at any time. The output data was imported into Microsofi Excel version 5.0 as delimited files
and analysed using the tools available in Excel.
5.2 MODELLING OF ABSORPTION
Absorption of iodine into solution was modelled by defining the initial aqueous
iodine concentration to be zero and [IzIgsin to be greater than zero. Four absorption models
were created; one to siinulate the absorption of iodine into water and three to simulatc thc
absorption of iodine into solution in the presence of various chernical reactions. The

(iii) hydroxide ions.
5.2.1 ABSORPTION OF IODINE N T 0 WATER
No initial concentrations were specified, the default value being zero, and only one
TRANSPORT routine for the diffusion of iodine was included in the model. The
TRANSPORT routine is given below.
TRANSPORT <#nzone> 12 f12 fl2; * inlet condition at gas/liquid interface; % Kgas*A*(I2gas*80 - 12<0>)/(80*s*A) : = 12<0>; % Kgas*A*(I2<0> - 12gas*SO)/(Vgas*80) : = 12gas; % Kvent*(IZgasin - I2gas) : = I2gas; * outlet condition at film/bulk interface; % fi2*le06*(12<#1> - ISbulk)/(Vliq) : = 12bulk; % fI2* l e06*(12bulk - I2<# 1 >)/(s*A) : = I2<# 1 >; **.
7
The value of [121gasin used in the model was 5 x 10" M. This value was an approximation of
the gas phase concentrations in the experiments described in sections 4.2 and 4.4. The
program was compiled for tirne intervals of I00 seconds for a total time of one hour.
5.2.2 ABSORPTION OF IODINE GAS INTO THIOSULPHATE SOLUTIONS
The reactions that occur when iodine reacts with thiosulphate ions is given in
The forward, ks, and reverse, kt,, rate constants for the reactions at 25OC are as follows [15,
161: for reaction 5-6, k f = 7.8 x 10' M-'s-' and kb = 2.5 x 10² s-l, for reaction 5-7, kr= 4.2 x
1 o8 M-*s-' and kh = 9.5 x 1 o'M''s-', for reaction 5-8, kf / kb = 0.245, for reaction 5-9. k = 1 2 9
x 106 M-'s-', and for reaction 5-1 0, ks= 5.6 x 10' M-'I' and k b = 7.5 x 10" s".

concentrations in the zones and the bulk layer. The initial concentrations of al1 other species
were set at the default value of zero. The concentration of iodine gas entering the system was
the same as that in the model in section 5.2.1. Seven TRANSPORT routines were created,
one each for 12, 1-, 13', s ~ o ~ ~ - , 12~2032-7 1S2o3- and s40b2-. The TRANSPORT routines for the
ions did not include a boundary condition for the gstdfirst zone interface because ions are
essentially involatile. The program was compiled for a range of initial thiosulphate
concentrations, and using the output files, the effect of thiosulphate concentration on the
absorption of iodine into solution was studied. The effect of the size of the rate constants on
the output was aIso studied by recompiling the program with different values of the rate
constants.
5.2.3 THE ABSORPTION OF IODINE GAS INTO IODIDE SOLUTIONS
The initial concentrations defined in this model were those of iodide ions in the bulk
and the zones. Iodine reacts with iodide ions by reaction 5- 1 1.
Iz + 1- t, Ij- 5-1 1
The fonvard and reverse rate constants for the reaction are given in section 5.2.2. For this
model, three TRANSPORT routines were needed to describe the diffusion of each of the
species present in solution: iodine molecules, iodide ions and triiodide ions. The
TRANSPORT routine for iodine incorporated transfer between the gas phase and the first
zone, but the TRANSPORT routines for iodide and triiodide ions did not.
The model was run for the same time and time intervals as the model in section 5.2.1.
The effect of concentration on the mass transfer of iodine was studied by compiling the
program for a range of initial iodide concentrations. By changing the values of the forward
and reverse rate constants, the effect of these constants on the output data was also
investigated.
5.2.4 ABSORPTION OF IODINE GAS INTO HYDROXIDE SOLUTIONS
Iodine reacts with hydroxide ions by reactions 5- 13 to 5- 14.
Iz + OH- t, 120H-

- L - - - - - - - - - - - A -
I- + Iz t, 13- 5- 14
For reaction 5-1 2, kf = 8 x 1 o8 M%-' and kb = 5 x 1 o4 S- ' and for reaction 5-1 3, kf=l .4x 1 o6 S.'
and kb = 4 x 10' M-'s-'. TRANSPORT routines were set up as for the previous absorption
rnodels. By changing the appropriate parameters in the model, the effect of concentration and
inlet iodine gas concentration on the absorption of iodine gas into hydroxide solutions were
studied.
5.3 MODELLING OF EVAPORATION
Evaporation was modelled by defining [I~]gsin to be zero and the initial aqueous
iodine concentration to be greater than zero. Three evaporation models were created; one for
the evaporation of iodine from a solution of aqueous iodine, one for the evaporation of iodine
from solutions containing iodine, iodide ions and triiodide ions, and one for the evaporation
of iodine from solution in the presence of radiolytic reactions. Models for the evaporation of
iodine in the presence of reaction with thiosulphate and hydroxide ions were not constructed
because of the almost irreversible, instantaneous nature of these reactions.
5.3.1 EVAPORATION OF IODINE FROM AQUEOUS IODINE
The initial concentrations defined in this model were those of iodine in the zones and
the bulk layer. The initial iodine concentration was set at 1.1 x 10" M, which is the
concentration of a saturated solution of iodine. Only one TRANSPORT routine was needed,
and that was used to model the diffusion of I2 through the system. The TRANSPORT routine
used is given below.
TRANSPORT <#nzone> 12 fi2 fl2;
* inlet condition at gaslliquid interface;
% Kgas*A*(12<0> - 12gas*80)/(80*Vgas) : = 12gas;
% Kgas*A*(12gasS80 - 12<0>)/(s*A*80) : = I2<0>;
% Kvent*(O - I2gas) : = 12gas;
% 2*Kvent*Vgas*12gas : = TRAP;
* outlet condition at film/bulk interface;

The model was run using one hour as the total tirne, with data recordings at time intervals of
100 seconds.
5.3.2 EVAPORATION OF IODINE FROM SOLUTIONS CONTAINING IODINE,
IODIDE IONS AND TRIlODIDE IONS
The model for the evaporation of iodine from solutions containing iodine, iodide ions
and triiodide ions was the same as the model for the absorption of iodine into iodide
solutions. The initial concentration of iodide ions was defined in this model as well as that of
iodine, in both the bulk layer and the zones. The initial concentration of triiodide ions was
calculated from the FACSIMILE form of reaction 5-1 1 describing the kinetics of the reaction.
The model was run for the sarne time and time intervals as the model in section 5.3.1.
The effect of concentration on the mass transfer of iodine was studied by compiling the
program for a range of initial iodide concentrations.
5.3.3 EVAPORATION OF IODINE IN THE PRESENCE OF RADIOLYTIC
REACTIONS
Radiolytic reactions are reactions that occur as a result of the presence of a radiation
field. The radiolytic reactions considered in this model are those that occur when an aqiieous
iodide solution is exposed to a radiation field. The complete set of radiolytic reactions
included in the model contains 63 reaction equations, and is given in appendix D. Unlike the
two previous models, an initial aqueous iodine concentration was not defined in the model.
The only initial concentration specified was an initial iodide concentration of 1 x 10"' M. A
TRANSPORT routine was created for each species in the mode]. The program was
compiled, and by changing the radiation dose rate input to the model, the effect of dose rate
on ilie mass transfer of iodine was investigated.

In this chapter, the experimental results of this study are presented. The first
experiments that were performed were those to determine the liquid and gas phase mass
transfer coefficients in the absence of chemical reaction. Having obtained these coefficients,
experiments were then performed to determine the overall mass transfer coefficient of iodine
for three systems: (1) absorption of iodine gas into solutions containing thiosulphate ions, (2)
evaporation of iodine from solutions containing triiodide ions and (3) absorption of iodine
into solutions containing iodide ions. Each of the above systems were exarnined using a
range of solution concentrations.
Using the empirical values of the Iiquid and gas phase mass transfer coefficients
together with the FACSIMILE prograrn, models were constructed to simulate the mass
transfer of iodine, first in the absence of chemical reaction and then in the presence of
chemical reaction. The output files from the programs were manipulated to yield overall
mass transfer coefficients for different conditions and reactions. These coefficients were then
compared to the experimental results obtained from systems under the same conditions. This
was to verifi that the FACSIMILE models constructed to simulate the interfacial transfer of
iodine in the presence of chemical reaction correctly imitate the real system. The effect of
concentration of solution and reaction rate constants on the overall mass transfer coefficient
were considered with respect to both the experimental and modelling data. Once the models
were validated, a new mode1 was constructed to simulate the mass transfer of iodine in the
presence of a radiation field and al1 the accompanying radiolytic reactions.
6.1 MASS TRANSFER WITHOUT CHEMICAL REACTION
6.1.1 EXPERIMENTAL RESULTS
THE GAS PHASE MASS TRANSFER COEFFICIENT OF IODINE
The experiment outlined in section 4.1 was performed seven times. Based on the rate
of evaporation of water, a gas phase rnass transfer coefficient of water was obtained from

1 - . -.- ----- -, -.. - --"""" "'-"'.,UV. A.' C.*W
first method, the rate of evaporation was based on the total change in the volume of water
during the experiment. In the second method, the evaporation rate was based on the
difference in the relative humidity o f the inlet and outlet air streams. Generally, the volumes
of water evaporated over periods of 5 to 11 hours ranged from 4 mL to 8 mL. The difference
in the percent relative humidity between the inlet and outlet air streams varied from 45% to
78%. The temperature of the water was approximately constant for the duration of each
experiment, but varied between 21°C and 24OC from day to day. The results of these
experiments are given in table 6.1.
Table 6.1 : experimental values of the gas phase rnass transfer coefficient of water
Using the values in table 6.1, the average gas phase mass transfer coefficient based on
the change in volume of water was calculated to be 0.29 cmk. The standard deviation
between tliesc values was 0.05. The average gas phase mass transfer coefficient based on the
difference in the %RH between the inlet and outlet air streanls was 0.3 1 cm/s. The standard
deviation between these values was 0.04. These two mass transfer coefficients are in very
good agreement, and so were averaged to obtain a value of 0.30 + 0.05 cnds for the gas phase
mass transfer coefficient of water. The gas phase mass transfer coefficient of iodine is related
to the gas phase mass transfer coefficient of water by equation 6- 1.
l runii l kgJ120 (cmls)
(based on change in volume of water)
(cmls)
(based on change in %RH of air stream)
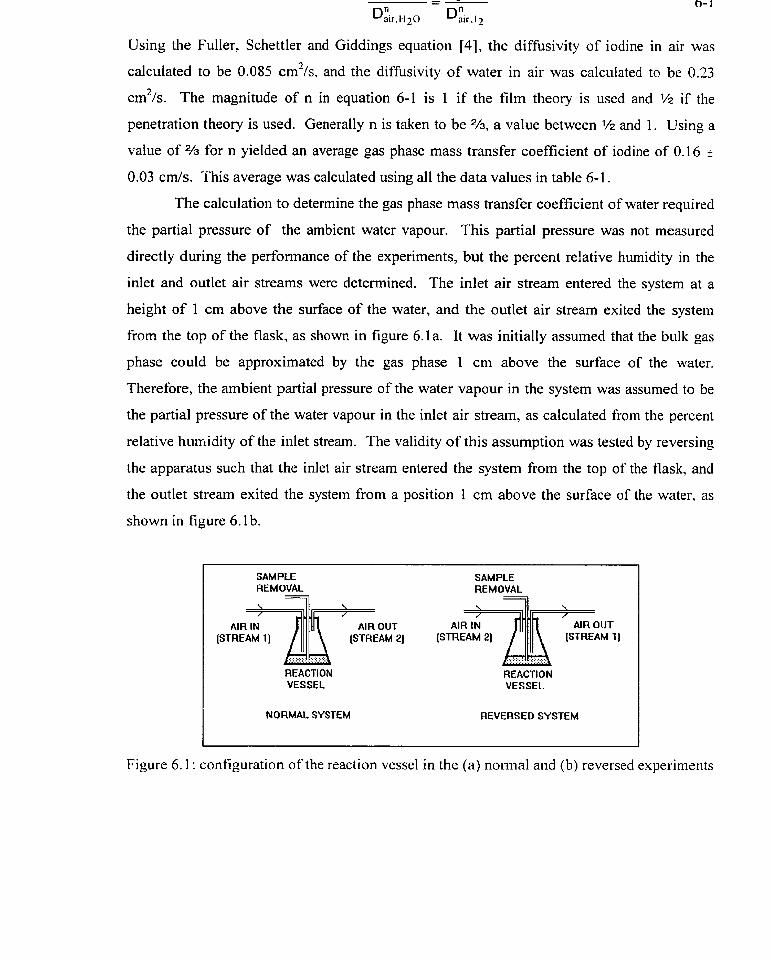
Using the Fuller, Schettler and Giddings equation [4], the diffusivity of iodine in air was
calculated to be 0.085 cm2/s. and the diffusivity of water in air was calculated to be 0.23
cm2/s. The magnitude of n in equation 6-1 is 1 if the film theory is used and 1/2 if the
penetration theory is used. Generally n is laken to be 2/3, a value between l/2 and 1. Using a
value of 2/3 for n yielded an average gas phase mass transfer coefficient of iodine of 0.1 6 t
0.03 cm/s. This average was calculated using al1 the data values in table 6-1.
The calculation to determine the gas phase mass transfer coefficient of water required
the partial pressure of the ambient water vapour. This partial pressure was not measured
directly during the performance of the experiments, but the percent relative hurnidity in the
inlet and outlet air strearns were detemined. The inlet air strearn entered the system at a
height of 1 cm above the surface of the water, and the outlet air stream exited the system
from the top of the flask, as shown in figure 6.la. It was initially assumed that the bulk gas
phase could be approximated by the gas phase 1 cm above the surface of the water.
Therefore, the arnbient partial pressure of the water vapour in the system was assumed to be
the partial pressure of the water vapour in the inlet air strearn, as calculated from the percent
relative humidity of the inlet stream. The validity of this assumption was tested by reversing
the apparatus such that the inlet air stream entered the system from the top of the flask, and
the outlet stream exited the system from a position 1 cm above the surface of the water, as
shown in figure 6.1 b.
SAMPLE SAMPLE REMOVAL REMOVAL
AIR IN (STREAM 11 (STREAM 21 [SmEAM 21 [STREAM 1 j
.'.'.'.'.'. .'...'.'... , . , . . . , . , . . . . . . . . . . . . . . . . REACTION VESSEL
REACTION VESSEL
NORMAL SYSTEM REVERSED SYSTEM
Figure 6.1 : configuration of the reaction vesse1 in the (a) normal and (b) reversed experiments

analysing the data from the experiment, the ambient partial pressure of the water vapour in
the system was assumed to be the partial pressure of the water vapour in the outlet air stream,
rather than in the inlet air stream. The gas phase mass transfer coefficient of water from the
reversed experiment was calculated to be 0.22 -i 0.03 cm/s, as compared to 0.16 t 0.03 cm/s
from the previous experiments. It was postulated that the actual partial pressure of the water
vapour above the surface of the water was a linear function of both the inlet and outlet water
vapour partial pressures, such that
P b u ~ c = a P i + S P ~ 6-2
where a and p are constants, and pl and p2 are the partial pressures of the water vapour in air
streams 1 and 2, as s h o w in figures 6.1 a and 6.1 b. The experimental data was re-analysed
using equation 6-2 to describe the ambient partial pressure of the water vapour. Two
equations for kg were obtained from the experimental data, one each for the normal system
and the reversed system. Solving these equations by trial and error produced values of 0.9
and 0.1 for a and p respectively. Therefore, water vapour in the bulk air above the surface of
the water was made up of approximately 90% air stream 1 and 10% air stream 2. This
supports the assumption that the partial pressure of the water vapour above the surface of the
water could be approximated by the partial pressure of the water vapour in the inlet air stream
for the normal systems. It should be noted that the value of Kola may not have been solely
dependent upon the amount of water vapour in the bulk air. As will be discussed later in
section 6.3, another factor that might have contributed to the difference between the Kol,'s for
the two systems is the effect of the impingement of the air ont0 the interface for the normal
system.
ERROR iN THE MASS TRANSFER COEFFICIENTS
In determining each of the above inass transfer coefficients, two or more experimental
runs were performed. The mass transfer coefficients found from these runs were thcn
averaged and the standard deviation between the results calculated. An error associated with
the performance of each individual experiinent was also determined using the propagation of
uncertainties, air flow rate fluctuations and relative humidity variations.
However, for these gas phase mass transfer coefficients, the standard deviation in the
results was greater than that estimated based on the propagation of known errors. Hence. the
mass transfer coefficient quoted is the average of a number of data points, and the error
associated with this coefficient is the standard deviation arnongst the data points. A detailed
table of the standard deviations and performance errors for al1 the experiments is presented in
appendix C.
THE LIQUID PHASE MASS TRANSFER COEFFICIENT OF IODINE
Using the experimental procedure given in section 4.3.3, eight similar experiments
were perfonned in order to detemine the overall mass transfer coefficient of iodine for
evaporation in the absence of chernical reaction. A value of the liquid phase mass transfer
coefficient was obtained for each experiment frorn the slope of a plot of ln[abs] against time,
where abs = constant*[12]. Figure 6.2 shows one such plot. The initial aqueous iodine
concentration was 2.2 x 10⁴ M, and the concentration dropped to 1.2 x 1 o4 M after 120
minutes. Table 6.2 summarizes the values of KOL and ki obtained from al1 eight experiments.
Using the results in table 6.2, an average empirical value for the liquid phase mass transfer
coefficient of iodine of 2.0 x 10⁴ cmls was obtained. The standard deviation associated with
this rnean is 5 x 10-~.
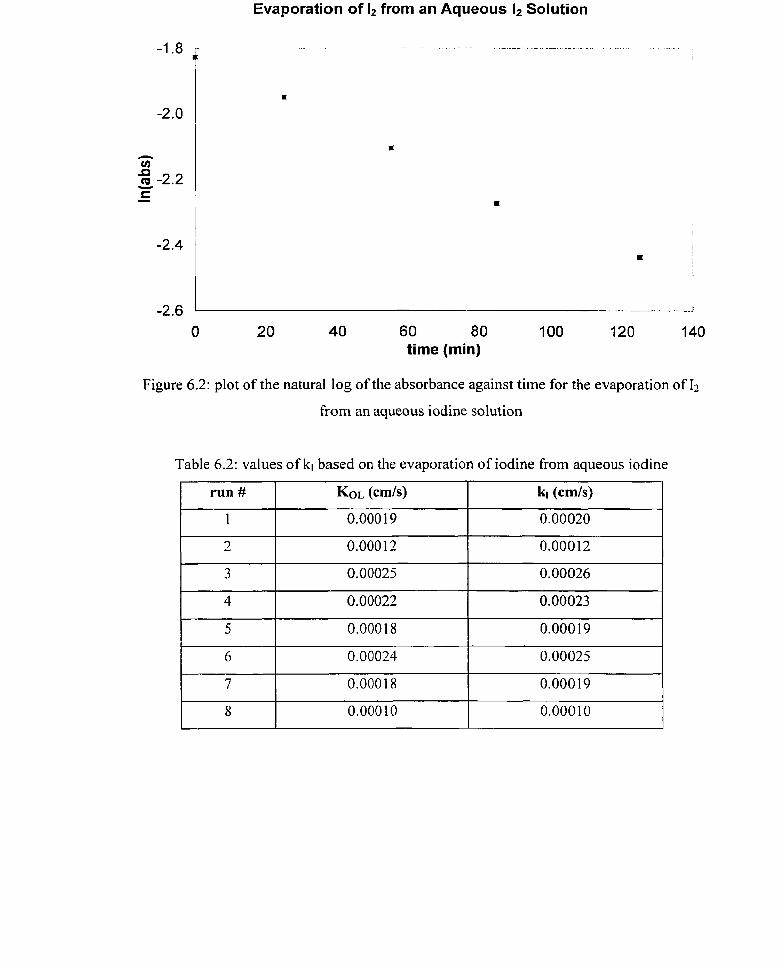
Evaporation of l2 from an Aqueous I2 Solution
O 20 40 60 80 IO0 120 140 time (min)
Figure 6.2: plot of the natural log of the absorbance against time for the evaporation of I2
from an aqueous iodine solution
Table 6.2: values of ki based on the evaporation of iodine from aqueous iodine
1 run # I KOL (cmW I kl (cm/s) I

- performed to determine the overall mass transfer coefficient of iodine for absorption into
water in the absence of chernical reaction. For each experiment, the overall mass transfèr
coefficient was calcdated from the slope of a plot of ln(H[12]gasin -[12]aq) against time. Figure
6.3 shows the plot obtained from one of the experiments. The iodine gas concentration in the
inlet air was 2 x 1 o - ~ M.
Absorption of l2 into Water
e n Cu
t 'c -1 1.6 - VI
m 'ni 5
-12.0 Z
time (min)
Figure 6.3: plot of ln(H[12p,i,]-[12]) against time for the absorption of 12 into water.
Table 6.3: values of kI based on the absorption of iodine into water

transfer coefficient of 5.1 x 1 o4 cm/s. The standard deviation amongst the data was 3 x 1 O-'.
It was expected that the liquid phase rnass transfer coefficients for absorption and evaporation
would be equal. While these numbers are in agreement within experimental error, there is a
57% difference between them. The value obtained based on the evaporation of iodine from
an aqueous solution of iodine was taken to be the more reliable result because the standard
deviation for this result was less.
The iodine concentration in the evaporation experiments was more than a factor of 5
greater than the concentration in the absorption experiments. The aqueous iodine
concentrations in the evaporation experiments ranged from 6.5 x 10" M to 1 x 10"' M, while
in the experiments on the absorption of iodine into water, the maximum aqueous iodine
concentration observed was 1.5 x 1 o - ~ M.
Comparing the magnitude of the gas phase mass transfer coefficient to that of the
liquid phase mass transfer coefficient in the absence of chemical reaction, it is evident that
the gas phase mass transfer coefficient is a factor of 2000 larger than the liquid phase mass
transfer coefficient. Thus, in the absence of chemical reaction, the mass transfer of I2 is
limited by transfer on the liquid side.
6.1.2 MODELLING
Two simple rnodels were constructed to mimic the mass transfer of iodine between
the gas phase and water in the absence of chemical reaction; the first model simulated the
evaporation of iodine from an aqueous solution containing molecular iodine, and the second
model simulated the absorption of iodine gas into water. Details of the models are given in
sections 5.2.1 and 5.3.1. The empirical value for the gas phase mass transfer coefficient was
input into the models to simulate mass transfer in the gas phase. Transfer in the liquid phase
was based on the thickness of the liquid phase film, as calculated using the film theory
together with the empirical value of the liquid phase mass transfer coefficient. The
diffusivity of iodine used in the model was the average of the diffusivities calculated using
the equations given by Othmer and Thakar, Wilke and Chang, and Hayduk and Minhas [4,

- - , - , - -. - - ..------.- - -.- --..- - -- - - - - - - - .--- -.--- - .- - - - -.- - -.--..- -. -- - ... -.---- -'-- - -
equations was less than 5%.
Output files containing the concentrations of iodine in the liquid and gas phases at
specific time intervals were created. The output files from the models were imported into
Microsof? Excel version 5.0 and the output data was analysed. From the output data, the
overall mass transfer coefficient was calculated. The rate of mass transfer of iodine in the gas
phase is given by equation 6-3.
The output files contained al1 the information needed to calculate KOL. By rearranging
equation 6-3. an equation for KOL was obtained.
F(Cg.in - Cg.out - A(C, - HC,)
Figure 6.4 is a plot of KOL against time for the evaporation of 12 from an 12(aq) solution.
The Approach of KOL to a Steady State Value
- -. - - - - .. . . -
OE+OO ---1
O 1 O0 200 300
time (s)
Figure 6.4 : approach of the overall mass transfer coefficient to a steady state valrie

- -- - - - - - - - e - - - - - - - - -
initial decrease in Koi. . This decrease was a result of the initial conditions input to the
model. The initial concentration of 12 in the liquid side film was equated to the bulk 12
concentration. At the interface, however, [Iz],, would be less than the bulk concentration.
Tlierefore. there was an initial period during which iodine was depleted from the liquid side
film. This resulted in an apparent initial decrease in KOL, as calculated from equation 6-4.
The steady state value of KOL was compared to the overall mass transfer coefficient
expected, based on the gas and liquid phase mass transfer coefficients input into the model.
This was done to veri@ that the modeIs correctly mimic the real system. Table 6.4 below
summarizes the results from the models.
Table 6.4 : modelling results for the mass transfer of iodine without chemical reaction
1 expected value 1 1.91 x 1 o4 1 absorption model 1 1.90 x 1 o4 1 evaporation model 1 1.89 x 1 o4
It has been proven that, for no chemical reaction, the model adequately mimics the real
system. Therefore, the method of dividing the liquid phase film into a number of thinner
zones is suitable for modelling the mass transfer of iodine in the aqueous phase. Also the
assumptions made in the mode1 have been justified and can be used in future models
involving chemical reaction. These assumptions were :
the thickness of the liquid phase film can be estimated by using equation 2-1 1 and the
empirical value obtained for the liquid phase mass transfer coefficient. The thickness
of the liquid phase film was estiinated to be 0.06 cm.
diffusion in the bulk aqueous phase occurs so rapidly that the mass transfèr
coefficient can be arbitrarily increased by a large amount
The effect of the nurnber of zones in the liquid phase film on the mass transfer coefficient
was investigated by varying the number of zones used in the model from 2 to 20. The result

shows the dependence of the overall mass transfer coefficient on the number of zones in the
liquid phase film for the evaporation model.
Table 6.5 : dependence of the overall mass transfer coefficient on the nurnber of zones in the
As the number of zones in the liquid phase film was increased, the overall mass transfer
coefficient also increased and, in fact, approached the value expected based on the gas and
liquid phase mass transfer coefficients input into the model. This demonstrates that not only
is the method of dividing the liquid phase film into a number of thinner zones an adequate
way of simulating the mass transfer of iodine between the gas and liquid phases, but also. the
greater the nurnber of zones in the liquid phase film, the more closely the model simulates the
real system. Figure 6.5 is a graphical representation of how the number of zones in the film
affects the concentration of iodine in the film of the evaporation model. During evaporation,
the aqueous iodine concentration is lowest at the gaslliquid interface and highest in the bulk
solution. As the number of zones increases, the model output approaches the result expected
based on theoretical predictions. That is, in the film the aqueous concentration of iodine
varies linearly with the distance from the gaslliquid interface.
liquid phase fiIm
# zones in Liquid Phase Film
2
4
6
8
1 O
KOL (cm/s)
(evaporation model)
1.867 x 1 0 - ~
1.886 x 1 o - ~ 1.889 x l o 4 1.891 x l o 4 1.892 x 1 o4

[1&, in the Liquid Film
liquid film bulk x 1 zone - - - 5 zones - infinite zones
Figure 6.5: the effect of increasing the number of zones in the film
6.2 MASS TRANSFER ACCOMPANIED BY REACTION WITH
THIOSULPHATE IONS
6.2.1 EXPERIMENTAL RESULTS
Using the experimental procedure given in section 4.2, experiments were performed
on the absorption of iodine into solutions of sodium thiosulphate ranging in concentration
from 1 x to 0.1 M.
Three experiments were done on the absorption of iodine gas into 0.1M sodium
thiosulphate. Figure 6.6 shows the plot of activity against time that was made froin the
results of one of these experiments. The rate of absorption of iodine gas into the 0.1M
sodium thiosulphate solution equaled the rate of increase of activity in the solution. This
rate, equal to the slope of the plot shown in figure 6.6, was calculated to be 3.2 cpm/mL-min
using the linear regression tool in Microsoft Excel version 5.0. By perforining an activity

were determined to be 0.4 cpm/mL and 0.1 cpm/mL respectively. Using these results. the
overall mass transfer coefficient for the absorption of iodine gas into 0.1M sodium
thiosulphate was calculated to be 0.0044 cm/s.
Absorption of 1, into a 0.1M ~~0,'- Solution
O 20 40 60 80 1 O0 time (min)
Figure 6.6: rate of absorption of 12 gas into a O. 1 M sodium thiosulphate solution
Table 6.6 below shows the overall mass transfer coefficients obtained from the three
experiments performed on the absorption of iodine gas into O. 1 M sodium thiosulphate.
The experinlents were reproducible, with a standard deviation between the data points of 8%.
Table 6.6: Koi. values for the absorption of iodine into O. 1M sodium thiosulphate

- - - - - - - - - - - - - - - -- . - - - ---- -- - . -- --- - - - . - - . - ----- - '-' .." overall mass transfer coefficient, with a standard deviation of 8% between the values.
Using the above procedure, average values of the overall mass transfer coefficients
were obtained from replicate experiments on a range of thiosulphate concentrations. These
average overa1l mass transfer coefficients are summarized in table 6.7. The error associated
with each average is the standard deviation between the results from the replicate
experiments used to calculate that average.
These average mass transfer coefficients demonstrate that the reaction between iodine and
sodium thiosulphate has a significant impact on the mass transfer of iodine. As the
concentration of the sodium thiosulphate solution increased from M to 105 M, the
overall mass transfer coefficient also increased. For concentratio~x of thiosulphate ions
Table 6.7: KOL values for the absorption of iodine into sodium thiosulphate solutions
above 1 x 10" M, the overall mass transfer coefficient was a constant, limiting value. This
shows that, for concentrations of sodium thiosulphate of 1 x 1 o5 M or greater, the absorption
of iodine into sodium thiosulphate solution is only limited by thc transfer of iodine tliroiigh
the gas side film, with no resistance due to transfer through the liquid side layer. For the
absorption or iodine gas into sodium thiosulpliate solutions of concentrations less than I x 1 O-'
[szo?] (M)
1 IO-^ 2 x 10⁴
5 x 10⁴
1 x 1 0 - ~
2 x 1 0 - ~
5 IO-^ 1 x 1 0 - ~
5 x IO-^ 1 x IO-'
KOL @mis)
9 104
23 x 104
21 104
42 x 104
4 3 ~ 1o4
43 x 1 0 - ~
44 1 o - ~ 42 x 104
44 x 104
% error
32
3
1
2
3
1
2
4
3
liquid side films.
By averaging the average overall mass transfer coefficients for experiments involving
thiosulphate solutions of concentrations 10" M and greater. a mean value for the lirniting
value was obtained. This mean value was 0.0045 cmls with a standard deviation of 0.0008.
Using equation 2-9 with H =80, and assuming a large value of ki, the gas phase mass transfer
coefficient of iodine was estimated from this constant value to be 0.36 I 0.06 cmls.
Comparing this value of the gas phase mass transfer coefficient to that of 0.16 cmls obtained
in sec 6.1.1 above shows a factor of two difference between the two values. This unexpected
difference is due to the effect of impingement on the interface, and will be discussed in
section 6.3.2.
The concentration of iodine gas in the bulk gas phase was determined by using the
same assumptions as in the experiments to determine the gas phase mass transfer coefficient
of water. That is, the concentration of iodine in the bulk gas phase was assumed to be
approximately equal to the concentration of iodine gas at the inlet, located at a height of 1 cm
above the surface of the solution. The inlet and outlet iodine gas concentrations were
calculated by performing a baIance on the total activity in the system.
THE ENHANCEMENT FACTOR
Enhancement factors for the absorption of iodine into sodium thiosulphate ranged
from 3 to 450. A summary of the enhancement factors is given in table 6.8.

1 [ S ~ O ~ ~ . ] (M) 1 Liquid phase mass transfer
I I coefficient (cm/s)
Enhancement
factor
The values of ki were calculated from the difference between two large numbers. Therefore,
the uncertainties in ki, and hence cp, were large. Within these uncertainties however, it is
evident that for thiosulphate concentrations greater than 1 x 10" M, the enhancement factors
were greater than 100.
62 .2 MODELLING RESULTS
The absorption of iodine gas into thiosulphate ion solutions was modelled using the
FACSIMILE program together with reactions 6-5 to 6-9. Figure 6.7 depicts the relationship
between the overall mass transfer coefficient and the concentration of thiosulphate ions in the
absorbing solution, as predicted by the model. The model results are compared to the
experimentally determined mass transfer coefficients.
I2 f I- f) 13- 6-5
I2 + C) I ~ s ~ o ~ ~ - 6-6
Ii- + ~ 1 0 3 ' - tt 12~203 ' - + 1- 6-7
1 2 ~ 2 0 , ~ - C> Is203- + 1- 6-8

Model and Experimental Results for the Absorption of l 2 into
~ 2 0 3 ~ - Solutions
-MODEL EXPT
Figure 6.7: cornparison of experimental and modelling results for the absorption of I2 into
~ 2 0 3 ~ - solutions
In figure 6.7, the concentration at which KOL started to increase was dependent upon the
value of [I2Igaip In the experiments, the initial [I2lgXin produced by the iodine gas source was
estimated to have been 1 x 1 0 ' ~ M. It was not expected that this value would change
significantly over the course of the experiments for two reasons. Firstly, the initial iodide
concentration in the gas source was 0.3 M, which was high enough to ensure that almost al1
of the iodine in the solution was in the form of involatile triiodide ions. The concentration of
I2 in the solution, and hence the rate of evaporation of 12, were therefore very sinall.
Secondly, enough iodine crystals were initially added to the iodine gas source suc11 that
significant depletion of iodine from the source would only occur after atl the experiments

arbitrarily chosen because although the initial [12]gasiri was known, the final [Iz]g,in produced
by the gas source was not determined. The model and the experimental results agree well,
suggesting that the value of [121gain chosen was in the right range. For both the model and
experiments, the trend was the same. As the concentration of thiosulphate ions was
increased, the overall mass transfer coefficient also increased, until a limiting value of the
mass transfer coefficient was reached. Beyond this point, increasing the concentration of
thiosulphate ions had no effect on the overall mass transfer coefficient.
The dependence of the values of KOL on [I2Ig,in is demonstrated in figure 6.8. For the
lower [hlgarin , the enhancement of the absorption of 12 started at a lower thiosulphate
concentration.
Effect of [12]g,1n on the Absorption of l2 into ~ ~ 0 ~ ~ - Solutions
Figure 6.8: dependence of Koi. on [I2Ignsin for the absorption of Iz into thiosulphate solutions

transfer coefficient was investigated by increasing the forward rate constants of the reactions,
one at a time, and observing the effect on the model output. The initial thiosulphate
concentration input into the model was 5 x IO-' M. This concentration was chosen because
for this concentration, the mass transfer of iodine is limited by both the gas and the liquid
side films. Table 6.9 summarizes the results of the changes to the model.
Table 6.9: effect of increasing the fonvard rate constants of reactions 6-5 to 6-9 by a factor of
10' on the overall mass transfer coefficient.
Reaction that was changed
no change
kf.nn6-j increased by 1 o3
I krmn6-s increased by 10' I 0.0003 1
Kot (cm/s)
0.0003 1
0.00 135
increased by 10'
kcnn6-7 increased by 10)
0.0003 1
0.0003 1
The only change that had any effect on the overall mass transfer coefficient was the
increase in kf,nn6-5, and hence K,,, of reaction 6-5 by a factor of 1000.
Combining reactions 6-6, 6-7, 6-8 and 6-9, the overall reaction between iodine and
thiosulphate ions can be represented by reaction 6-1 0, which is practically irreversible.
I2 + 2 ~ ~ 0 , ~ - 2 1- + ~ ~ 0 ~ ~ - 6-1 0
This reaction is a second order reaction, with 12 and ~ 2 0 ~ ~ - having sirnilar diffusivities in
water. Therefore, using equation 2-1 9, an equation for cp,,,, for this reaction can be written.
I
I
(Pnilis = 1 + ['203~- ]initial
'LI2 l i i i i erlàcc
klmn6-9 increased by 1 o3
At the interface equilibrium concentrations are present, and tlierefore [ I ~ j i i i k r t ~ c e = H[Izlg; , r .
Equation 6- 1 1 then becomes
0.0003 1
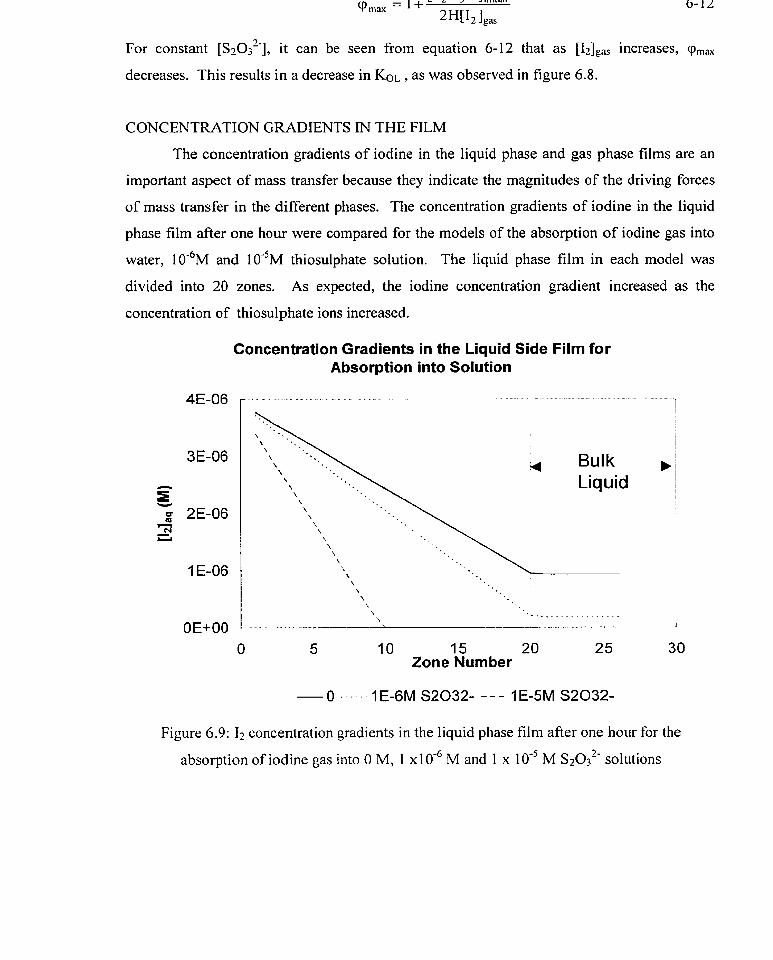
For constant [ S ~ O ~ ~ - ] , it can be seen from equation 6-12 that as [ I Z ] ~ ~ increases, cp,,,
decreases. This results in a decrease in KOL , as was observed in figure 6.8.
CONCENTRATION GRADIENTS IN THE FILM
The concentration gradients of iodine in the liquid phase and gas phase films are an
important aspect of mass trmsfer because they indicate the magnitudes of the driving forces
of mass transfer in the different phases. The concentration gradients of iodine in the liquid
phase film after one hour were compared for the models of the absorption of iodine gas into
water, ~ o - ~ M and 1 0 " ~ thiosulphate solution. The liquid phase film in each mode1 was
divided into 20 zones. As expected, the iodine concentration gradient increased as the
concentration of thiosulphate ions increased.
Concentration Gradients in the Liquid Side Film for Absorption into Solution
O 5 I O 15 20 25 30 Zone Number
Figure 6.9: Iz concentration gradients in the liquid phase film after one hour for the
absorption of iodine gas into O M, 1 x1 M and 1 x 1 o - ~ M s20j2- solutions
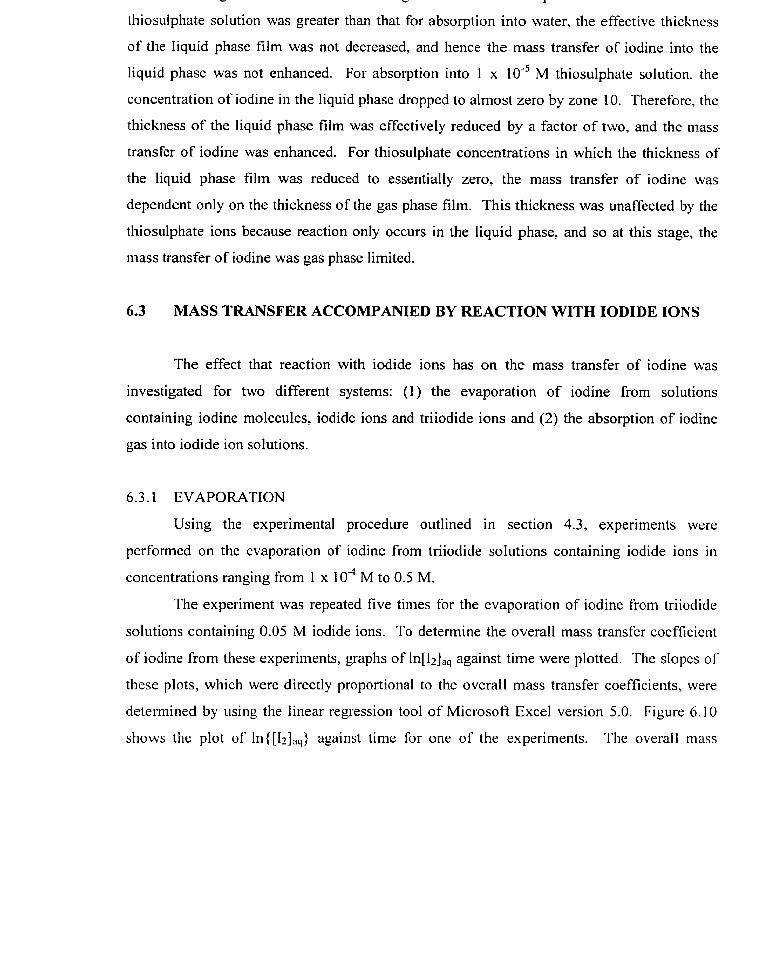
U - - - - - - - - - - - - - - - . - . - - . - " - - - - ---- ----- - - - - - - - - - - - - - - - - - - - a - . . -
thiosulphate solution was greater than that for absorption into water, the effective thickness
of the liquid phase film was not decreased, and hence the mass transfer of iodine into the
liquid phase was not enhanced. For absorption into 1 x 1od5 M thiosulphate solution. the
concentration of iodine in the liquid phase dropped to almost zero by zone 10. Therefore, the
thickness of the liquid phase film was effectively reduced by a factor of two, and the mass
transfer of iodine was enhanced. For thiosulphate concentrations in which the thickness of
the liquid phase film was reduced to essentially zero, the mass transfer of iodine was
dependent only on the thickness of the gas phase film. This thickness was unaffected by the
thiosulphate ions because reaction only occurs in the liquid phase, and so at this stage, the
mass transfer of iodine was gas phase limited.
6.3 MASS TRANSFER ACCOMPANIED BY REACTION WITH IODIDE IONS
The effect that reaction with iodide ions has on the mass transfer of iodine was
investigated for two different systems: (1) the evaporation of iodine from solutions
containing iodine molecules, iodide ions and triiodide ions and (2) the absorption of iodine
gas into iodide ion solutions.
6.3.1 EVAPORATION
Using the experimental procedure outlined in section 4.3, experiments were
perforined on the evaporation of iodine from triiodide solutions containing iodide ions in
concentrations ranging from 1 x 10" M to 0.5 M.
The expriment was repeated five times for the evaporation of iodine from triiodide
solutions containing 0.05 M iodide ions. To determine the overall mass transfer coefficient
of iodine from these experiments, graphs of ln[Iz],, against time were plotted. The slopes of
these plots, which were directly proportional to the overall mass transfer coefficients, were
determined by using the linear regression tool of Microsoft Excel version 5.0. Figure 6.10
shows the plot of ln{[I~],,,) against time for one of the experiments. The overall mass

plot.
Evaporation of l 2 frorn a 0.05 M I-/i3- Solution
-12.9 - - . . - - - - . -. - - " -- - -
-13.3 1
O 50 1 O0 1 50 200 250 300 time (min)
Figure 6.1 O: rate of change of In[I2] for the evaporation of Iz from a 0.05 M 1- II3- Solution
The overall mass transfer coefficients obtained from the two experiments on the evaporation
of iodine from 0.05 M iodideltriiodide solutions are summarized in table 6. f O. These results
were averaged to yield an average overall mass transfer coefficient of 0.0016 cm/s for the
evaporation of iodine from 0.05M I-.
Table 6.1 O: Kol, from the experirnents on the evaporation of I2 from a 0.05 M I l 3 - solution

- - U - - - - - - - - -
ion concentration. For each iodide ion concentration, the overall mass transfer coefficients
were averaged. The mean mass transfer coefficients obtained are summarized in table 6.1 1.
The errors in the overall mass transfer coefficients are the standard deviations between the
results of replicate experiments.
Table 6.1 1 : KoL values for the evaporation of iodine from 1-/13- solutions
The trend between the overall mass transfer coefficient and the concentration of the solution
was the same as for the absorption of iodine gas into sodium thiosulphate solution. For
iodide ion concentrations of 1 x 10⁴ M and lower, the overall mass transfer coefficient was
constant. As the iodide ion concentration was increased past 1 x 1 0 - ~ MM. the overall mass
transfer coefficient increased dramatically with iodide ion concentration. As the iodide ion
concentration was increased past 0.1 M, the increase in the overall mass transfer coefficient
diminished, and in fact, the overall mass transfer coefficient approached a limiting value.
The assuinption that the concentration of iodine gas in the bulk gas phase could be
approximated by the concentration of iodine gas in the inlet Stream was again used in
calculating the overall mass transfer coefficients for the evaporation of iodine froni solutions
[I'I (M)
O
1 1 0 - ~
KOL (cm/s)
0.000 19
0.000 18
% error
29
17

in the inlet air, which was taken from the laboratory environment, was assumed to be zero. It
was found that for the evaporation of iodine from triiodide solutions with iodide
concentratio:is greater than O. 1 M, the rate of decrease of iodine in the system was a factor of
I O smaIler than expected based on the trends observed so far. It was speculated that if the
concentration of iodine gas entering the system was not zero as assumed, then the rate of
mass transfer would be smaller, as was observed. Therefore, these experiments were
repeated, but with a charcoal trap pIaced before the inlet air stream. This was to ensure that
the inlet stream was free of any iodine gas that might be in the laboratory surroundings.
Table 6.12 shows the values obtained for the mass transfer coefficient for the experiments
performed with and with out charcoal traps.
Table 6.12: cornparison of KOL values for triiodide evaporation experiments with and without
charcoal traps
Adding charcoal traps to the experimental apparatus dramatically increased the rate of
volatilization of iodine from the triiodide solution. This suggested that the iodine gas
concentration in the ambient air was not zero, and raised questions with regards to the overall
mass transfer coefficients previously calculated from the experiments involving low iodide
ion concentr5tions. Therefore the experiments performed on the evaporation of iodine froin
triiodide solutions with low iodine ion concentration were re-performed with the new
experimental set-up to observe if there would be any difference in the overall mass transfer
coefficients. The overall mass transfer coefficients were experimentally sirnilar whether the
inlet air stream was passed through a charcoal trap before entering the system or not. It was
therefore concluded that the concentration of iodine Sas in the laboratory surroundings was
with charcoal
sufficiently low that it had no effect on the evaporation of iodine fkom triiodide solutions
without charcoal

evaporation of iodine from triiodide solutions containing high iodide concentrations. Based
on the experimental results, the concentration of iodide ions at which the iodine gas in the
laboratory surroundings started to have an impact on the rate of iodine mass transfer was
o. 1 M.
MODELLING
Iodine reacts with iodide ions by reaction 6-13 to form triiodide ions. The forward
rate constant of this reaction is 5.6 x 10' M%' and the reverse rate constant is 7.5 x 10⁶ s-l.
The equilibrium constant of the reaction is 747 M-'.
I2 + I- f) 13- 6-13
Using the model created to simulate the evaporation of iodine from solutions
containing iodide ions, triiodide ions and iodine molecules, a graph depicting the dependence
of the overall mass transfer coefficient on the iodide ion concentration of the solution was
obtained. The modelling results agree well with the experimental results for the lower iodide
concentrations, as shown in figure 6.1 1. For the higher iodide concentrations however, the
experimental results deviate from the modelling results. The value of kg input to the model
was the value determined from the experiments on the absorption of I2 into high thiosulphate
concentration solutions. It is at high reactant concentration, when mass transfer is gas-side
limited. that any inaccuracy in kg will be reflected in the lirniting value of Koi-. As was
mentioned in section 6.2.1, the values of kg determined from the absorption of I2 into
thiosulphate solution and from the evaporation of water differed by more than a factor of 2.
This difference, which is essentially a difference between evaporation and absorption, is the
reasoi-i for the deviation between the experimental and modelling results at high [I-1. The
difference between absorption and evaporation is discussed in section 6.3.2.

Evaporation of l2 from 13- Solutions
1 E-07 1 E-05 1 E-03 1 E-O1
initial [Il (M)
-MODEL = EXPT
Figure 6.1 1 : dependence of KOL on 1- concentration for the evaporation of I2 from 13-solutions
6.3.2 ABSORPTION
Experiments on the absorption of iodine gas into solutions of iodide ions were
performed using the procedure given in section 4.4. Iodide ion concentrations ranged from
1 o ' ~ M to 0.5 M. Graphs of In(HIIz]g,in -[12],} were plotted and from the slopes, the overall
mass transfer coefficients were calculated. The slopes were deterrnined by using linear
regression from Microsoft excel 5.0. Three identical experiments were performed on the
absorption of iodine into a 0.5 M iodide solution. Figure 6.12 shows the plot of In(HIIZ]g~s~n -
[I2Iaq) against time for one of these experiments.

nusurpiion o r 12 inro a u.;>ivi ioaiae aoiurion
O 50 1 O0 150 200 250
time (min)
Figure 6.12: plot of In{H[12J,in-[12]qJ against time for the absorption of 12 into a 0.5 M
iodide ion solution
Table 6.13 summarizes the overall mass transfer coefficients obtained from the three
experiments. These values were averaged to obtain an average value of 0.0037 cm/s for the
absorption of iodine into 0.5 M I-.
Table 6.13: KoiA values from the experiments on absorption of iodine into 0.5 M 1-
Two or more experiments were performed for the absorption of iodine into iodide ions
solutions. The overall mass transfer coefficients obtained for each iodide ion concentration

Y "
In general, the overall mass transfer coefficients follow the same trend as those produced by
the absorption of iodine gas into sodium thiosulphate solutions and the evaporation of iodine
from triiodide ion solutions. However, the experiments to determine these overall mass
transfer coefficients were less reproducible than al1 previous experiments, with percent
standard deviations in the coefficients ranging from 70 % to 6 %.
Table 6.14: KOL values for the absorption of iodine into iodide solutions
THE EFFECT OF REVERSING THE FLASK ON THE MASS TRANSFER
COEFFICIENT
The assumption that the iodine gas concentration in the bulk gas phase could be
approximated by the inlet concentration if the inlet stream entered at a height of 1 cm above
the solution surface was tested with the experimental apparatus used for these absorption
experirnents. Using the experimental procedure outlined in section 4.4, an experiment was
performed on the absorption of iodine gas into a 0.1M iodide soiution. Assuming that the
bulk iodine gas concentration was equal to the inlet iodine gas concentration the overall mass
transfer coefficient was calculated to be 0.0037 cmls. The experiment was then performed
again, but this time witli the absorption flask reversed such that iodine gas entered the system
from the top of the flask and exited from a height of 1 cm above the surface of the iodidc
soIution. Assumiiig that the bulk iodine gas concentration was equal to the iodine gas
concentration leaving the system, the overall mass transfer coefficient of iodine was
[ I I (M)
O
1 IO-^ 1 x 1 0 - ~
1 x 1 O-'
5 x 10-l
1 x loO
KOL (cm/s)
0.0004
0.0005
0.0020
0.0028
0.0037
0.0036
% error
55
70
20
4
7
5

concentrations at the inlet and outlet to the system were determined by performing a mass
balance on the system. The above procedure was repeated for the following four experiments:
(1 ) evaporation of water, (2) absorption of iodine gas into 0.1 M sodium thiosulphate. (3)
evaporation of iodine from 0.005 M and 0.5 M iodidekriiodide ion solutions and (4)
absorption of iodine into 0.1M iodide solution. Table 6.15 sumrnarizes the results obtained.
The normal system is shown in figure 6. la and the reversed system is shown in figure 6.1 b.
Table 6.15: comparison of KOL values for the normal and reversed systems
l experiment
normal system 1 reversed system
evaporation of water I
O. 16*
evaporation from 0.005M 1'
evaporation from 0.5M 1-
0.22*
absorption into 0.1 M ~ 2 0 3 ~ -
I 1 I I
* these values are gas phase mass transfer coefficients. Al1 other values are overall mass
0.00077
0.0024
L
absorption into 0SM 1-
transfer coefficients.
0.00056
0.001 8
0.0044
Using the last three rows in table 6.15, gas phase mass transfer coefficients were
calculated for the normal system by assuming that for thiosulphate and iodide solutions of
concentration 0.1 M and greater, the absorption of iodine into solution was limited by transfer
through the gas side. Equation 6-14 was used to calculate kg. The calculated values of kg are
summarized in table 6.16.
0.0033
0.0037 0.0022
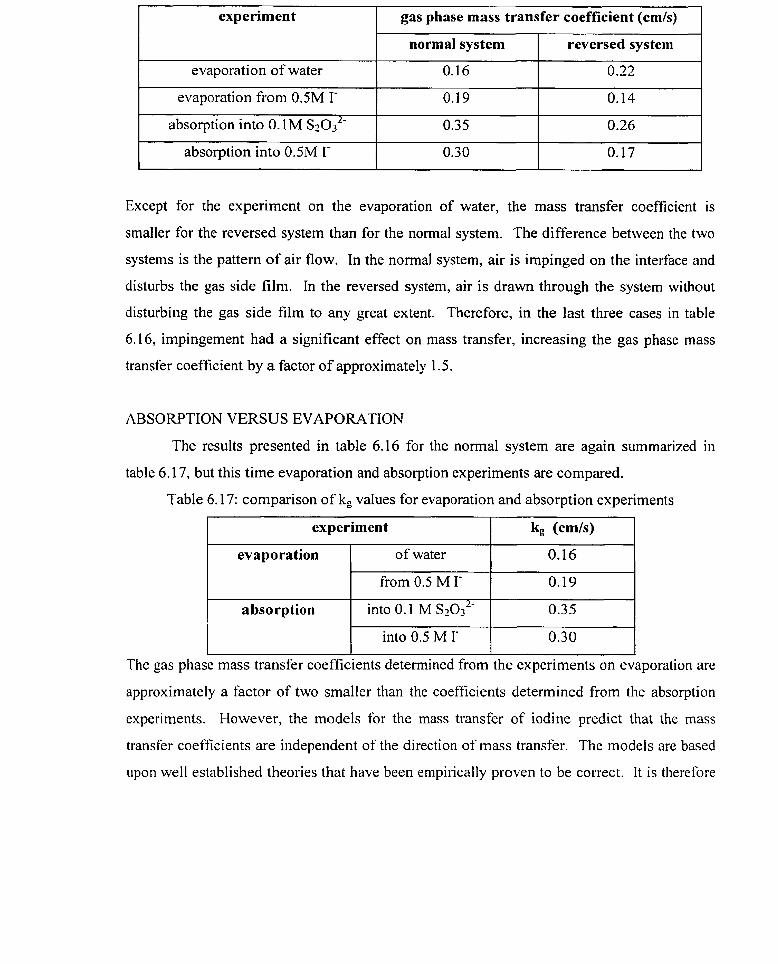
I experiment 1 gas phase mass transfer coefficient (cmls)
normal system
1 evaporation from 0.5M 1- 1 0.19 1 0.14
reversed system
evaporation of water
1 absorption into 0.1 M ~ ~ 0 , ' - I 0.35 I 0.26
0.16
Except for the experiment on the evaporation of water, the mass transfer coefficient
0.22
absorption into 0.5M 1-
smaller for the reversed system than for the normal system. The difference between the two
systems is the pattern of air flow. In the normal system, air is impinged on the interface and
disturbs the gas side film. In the reversed system, air is drawn through the system without
disturbing the gas side film to any great extent. Therefore, in the last three cases in table
6.16, impingement had a significant effect on mass transfer, increasing the gas phase mass
transfer coefficient by a factor of approximately 1 S.
ABSORPTION VERSUS EVAPORATION
The results presented in table 6.16 for the normal system are again summarized in
table 6.17, but this time evaporation and absorption experiments are compared.
Table 6.17: comparison of kg values for evaporation and absorption experiments
0.30 0.17
evaporation
absorption
The gas phase mass transfer coefficients determined from the experiments on evaporation are
approximately a factor of two smaller than the coefficients determined from the absorption
experiments. However, the models for the mass transfer of iodine predict that the mass
transfer coefficients are independent of the direction of mass transfer. The rnodels are based
iipon well established theories that have been empirically proven to be correct. It is therefore
into 0.5 M 1-
of water
from 0.5 M 1-
into 0.1 M ~ 2 0 ~ ~ -
0.30
O. 16
0.19
0.35

experimental conditions. Tt has already been shown that the impingement of air on the
interface had a significant effect on the mass transfer of iodine. This effect of irnpingement
was not incorporated into the models. If the force of impingement was strong enough, it
could explain why the mass transfer coefficients were not equal for absorption and
evaporation. Figure 6.13 illustrates how impingement may have resulted in an increase in the
rate of absorption andor a decrease in the rate of evaporation of iodine.
Figure 6.13: diagram showing how impingement might affect interfacial mass transfer.
In both the evaporation and absorption experiments, the direction of air flow is down ont0 the
interface. As shown in figure 6.13, the impinging air strearn might hamper evaporation by
providing an extra resistive force to upward traiisfer. Specifically, I2 evaporating from the
surface would have to diffuse in a countercurrent fiow of impinging air. Siniilarly, the
impinging air might also promote absorption by decreasing the resistive force to downward
transfer.
MODELLING
Using the nlodel for the absorption of iodine into iodide ion solutions, a graph
showing the dependence of the overall mass transfer coefficient on the iodide ion

follow the same trend, as shown in figure 6.14.
Absorption of l2 into lodide Solutions
- MODEL -. EXPT
Figure 6.14: dependence of KOL on 1- concentration for the absorption of I2 into 1- ion
solutions
SENSITIVITY OF THE MODEL TO CHANGES IN THE RATE AND EQUILIBRIUM
CONSTANTS
The effect of changing the forward and/or reverse rate constant for the reaction
between iodine and iodide ions was investigated using the mode1 for the absorption of iodine
gas into iodide solutions.
I2 + 1' t) 13-

constant. Keq, is 747 M-' . The value of k b was decreased by a factor of ten and input into the
model. Figure 6.15 shows how this change in kbarsn6-* affected the model output.
Model of the Absorption of l2 into 1' Solutions
Figure 6.15: effect of changes in kb and [I2lgaSin on the model output for the absorption of I2
into iodide solutions
The effects of other changes in the forward and reverse rate constants were investigated for
the absorption of iodine into a 0.01 M iodide solution. The results of the investigation are
summarized in table 6.18.

It is evident that changes in kLnn6-15 and k b . n n 6 - ~ ~ did not affect Km, as long as K,, was kept
constant. In the model for the absorption of 12 into thiosulphate solutions, it was observed
that the value of [Iz]gsin was an important factor. This was not the case for the model for the
absorption of Iî into iodide solutions. As s h o w in figure 6.15, the curve for [I2Iguin = 5 x
10" M lies on top of the curve for [I2lgUin = 5 x 1 0 - ~ M, both curves having a kb,mna-lS = 7.5 x
The forward reaction of 6-1 5 is a second-order reaction between iodine and iodide
ions. If the reaction can be assumed to be pseudo-first order, then the pseudo first order
forward rate constant would be ktmn6-is[I'], and the equilibrium constant would be K&].
For a range of iodide concentrations, values of tp,,, could then be estimated from equation 2-
18, and cornpared to values of cp from the model. Table 6.19 presents the results of such a
cornparison.
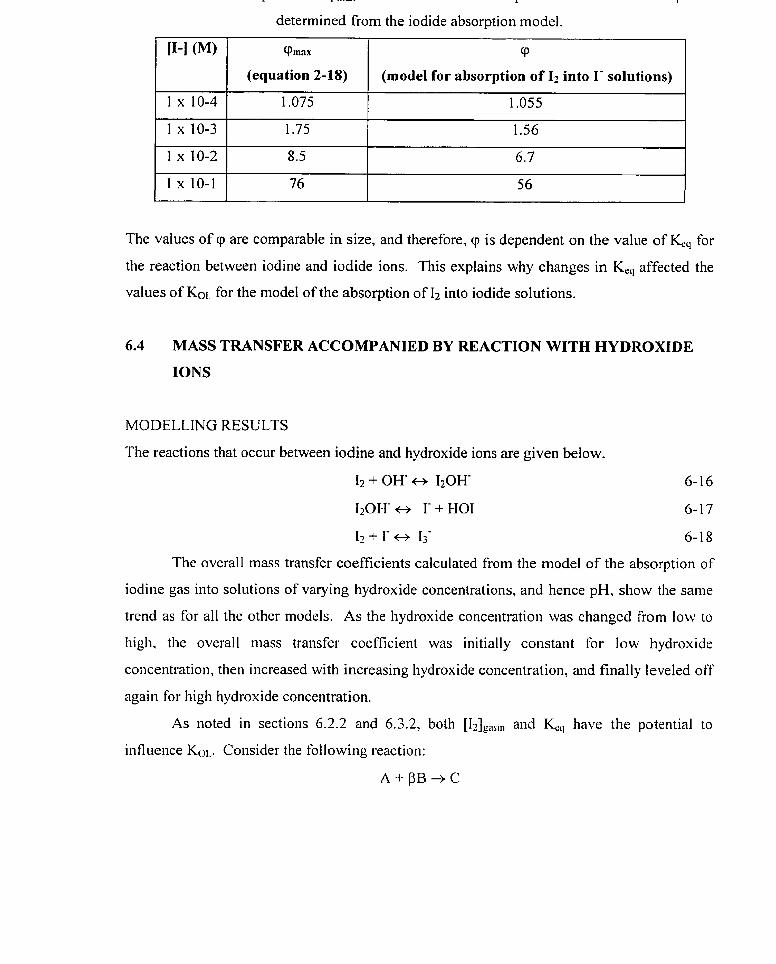
deterrnined from the iodide absorption model.
I 1 (equation 2-18) 1 (model for absorption of I2 into 1- solutions)
The values of cp are comparable in size, and therefore, cp is dependent on the value of K,, for
the reaction between iodine and iodide ions. This explains why changes in K,, affected the
values of Kor for the model of the absorption of I2 into iodide solutions.
6.4 MASS TRANSFER ACCOMPANIED BY REACTION WITH HYDROXIDE
IONS
MODELLING RESULTS
The reactions that occur between iodine and hydroxide ions are given below.
12 + OH' t, 120H' 6-16
120H- t, 1- + HO1 6-17
I2 + 1' t, 13- 6-1 8
The overall mass transfer coefficients calculated from the mode1 of the absorption of
iodine gas into solutions of varying hydroxide concentrations, and hence pH, show the same
trend as for al1 the other models. As the hydroxide concentration was changed from low to
high, the overall mass transfer coefficient was initially constant for low hydroxide
concentration, then increased with increasing hydroxide concentration, and finally leveled off
again for high hydroxide concentration.
As noted in sections 6.2.2 and 6.3.2, bot11 [I2lgaSin and K,, have the potential to
influence KOL. Consider the following reaction:
A + p B + C

Case (i) (Prnax.1 = 1 + LBIinitiat = 1 + [BIinitiai P[*Iint crface PHIAIga
Case (ii) [Cl , cp ,,,,, = 1 + K , ' [BI\ = 1 + -
[Al,
If [C]/[A] is large compared to [BIinitiai / [Alinterraw, then the value of [121gain will determine
how KOL changes with the concentration of the reactant. If the opposite is true then K,, will
be the important factor. The reaction between Iz and ~ 2 0 , ' - ions is very rapid and alrnost
irreversible, hence [A],, is very small. Therefore [C],,/[A],, is large and case (i) prevails.
The reaction between 12 and 1- ions has a finite K,,, and so case (ii) prevails. Both these
reactions have already been discussed in sections 6.2.2 and 6.3.2. The effect of the reaction
between Iz and OH- on the mass transfer enhancement of I2 is now considered with respect to
[I2lgasin and the rate constant of reaction.
The effect of the inlet iodine gas concentration and the rate constant of the reaction on
the overall mass transfer coefficient was investigated for the absorption of I2 into hydroxide
solutions. The model was run for three different conditions:
(i) [I2lgain = 5 X IO-' M and ktnn6-l6 = 8.0 X 1 o8 M-'s"'
(ii) [12 ]p i , = 5 X 10" M and kCnn6-16 = 8.0 X 1 o8 M-'s-'
(iii) [121garin = 5 X 1 om8 M and kCnn6-16 = 8.0 X 1 o9 M-'s-'
The results are depicted in figure 6.16. Unlike the thiosulphate and iodide cases, the OH-
model output was dependent upon the values of both [Illsain and K,,.

Absorption ot l2 ïnto OH- soiutions
Figure 6.16: effect of [12]gasiii and rate constant on the absorption of iodine into hydroxide
solutions.
In figure 6.17, the models for the absorption of I2 into thiosulphate, iodide and hydroxide
solutions are compared. As expected , the hydroxide mode1 lies between the thiosulphate and
iodide models.

1 E-05 1 E-03 1 E-O1
Initial Reactant Concentration (M)
Figure 6.17: dependence of KOL on the reactant concentration for the absorption models.
6.5 MODEL OF THE MASS TRANSFER OF IODINE IN THE PRESENCE OF
A RADIATION FIELD
When an aqueous iodide solution is irradiated, the 1- ions are oxidized to I2 molecules,
which are then volatilized. Enhancement of the volatilization of 12 under these conditions
was studied using the mode1 for the evaporation of iodine from solution. The model wüs
adjusted to incorporate the radiolytic reactions that I2 undergoes in the presence of a radiation
field. These reactions are listed in appendix E.7.
In the model, the only initial concentration specified was 10" M 1'. The overall mass
transfer coefficient of Iz was calculated from the model output using the same rnethod as for
al1 previous models.
Atomic 1 is an intermediate species in the oxidation of 1- to 12. 1 is believed to be very
volatile, although this is still subject to debate. Two variations of the model were compiled;

6.18 compares the results from the two compilations.
The Effect of I Volatility on the Radiolytic Reactions Model
0.004
1 E-07 1 E-05 1 E-03 1 E-O1 1 E+01
dose rate (kgraylh) - I volatile, pH=6 - - - l involatile, pH=6
Figure 6.18: dependence of KOL on the volatility of atomic 1
In figure 6.1 8 it can be seen that for the same dose rate, enhancement of the interfacial
transfèr of iodine was greater for the model in which 1 was assumed to be involatile. In this
model, the atomic 1, being involatile, accumulated in the liquid side filni. It then reacted to
produce more I2 than would othenvise have been produced in the liquid side film, increasing
the enhancement of the interfacial transfer of iodine. Some of the important reactions
involving 1 are given below.
1 + 1 + 1 2 6-2 1
I + e- + 1- 6-23
I + 1- t, 12- 6-32
12- + OH + I2 + OH- 6-24
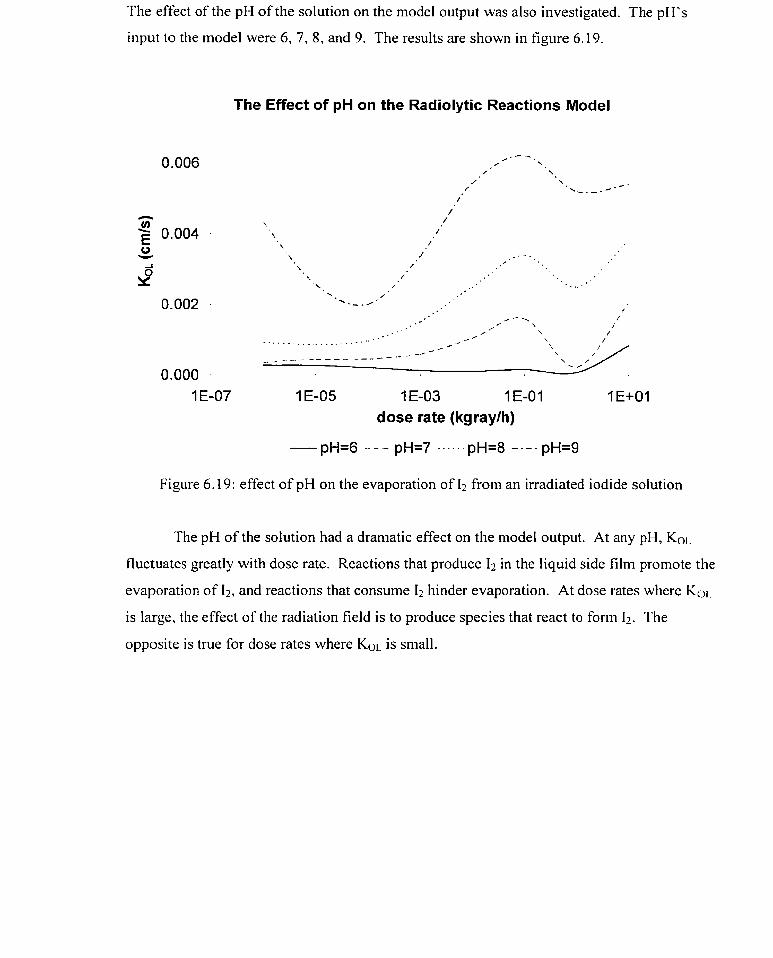
The effect of the pH of the solution on the model output was also investigated. The pH's
input to the model were 6, 7, 8, and 9. The results are shown in figure 6.19.
The Effect of pH on the Radiolytic Reactions Model
dose rate (kgraylh)
Figure 6.19: effect of pH on the evaporation of I2 frorn an irradiated iodide solution
'The pH of the solution had a dramatic effect on the model output. At any pH, Koi-
fluctuates greatly with dose rate. Reactions that produce I2 in the liquid side film promote the
evaporation of 12, and reactions that consume I2 hinder evaporation. At dose rates where Kol.
is large, the effect of the radiation field is to produce species that react to form Il. The
opposite is true for dose rates where KOL is small.

In the absence of chernical reaction, the interfacial transfer of iodine is limited by
transfer through the liquid side of the interface.
Enhancement of the interfacial transfer of iodine by chernical reaction is dependent
upon the concentration of the reactants, enhancement being larger for higher concentrations.
For reaction with thiosulphate ions, infinite enhancement of the transfer of iodine through the
liquid phase is possible. At this stage, transfer is lirnited by the gas side. For the reaction
between iodine and iodide ions, enhancement becomes significant at iodide concentrations of
1 M, and increases as the iodide concentration increases. For iodide concentrations greater
than O. 1 M, enhancement is at a maximum, and the mass transfer of iodine is limited by the gas
side.
The reaction between iodine and thiosulphate ions is so rapid that enhancement of the
mass transfer of iodine does not depend on the kinetics of the reaction, but rather on the
concentration of iodine in the gas phase. The enhancement is greater for low 12(g)
concentrations than for high 12 (g) concentrations.
The method of modeIling interfacial transfer by dividing the liquid phase film into a
number of smaller zones can be applied to more cornplicated systems in which many
simultaneous reactions occur.
When an iodide solution is exposed to a radiation field, molecular iodine is produced.
Interfacial transfer of this molecular iodine is enhanced by the radiolytic reactions that
accompany irradiation. Because of the hazardous nature of iodine, the conditions under which
this enhancement occurs must be known. The method of modelling interfacial transfer by
dividing the liquid phase film into a number of smaller zones was used for this purpose. It was
found that enhancement is a function of the dose rate of the radiation field and the pH of the
solution. As the dose rate and pH increase, the enhancement also increases. Further study on
the effect of the radiolytic reactions on enhancement of the interfacial transfer of iodine is
needed to better assess the conditions under which this enhancement may create a high risk
situation.

Bird, R. B., Stewart, W. E., and Lightfoot, E. N., "Transport Phenornena", John
Wiley & Sons ( 1 960).
Danckwerts, P. V., "Gas-Liquid reactions", McGraw-Hill (1 970).
Sherwood, T. K., Pigford, R. L., and Wilke, C. R., "Mass Transfer", McGraw-Hill
(1 975).
Perry, R. H., and Green, D. W., "Perry's Chernical Engineers' Handbook", 6th ed.,
McGraw-Hi11 (1 984).
Brian, P. L. T., Vivian, J. E., and Habib, A. G., "The Effect of Hydrolysis Reaction
Upon the Rate of Absorption of Chlorine into Water", A.1.Ch.E. Journal, 8, p.205-2 1 O
(1 962).
Takahashi, T., Hatanaka, M., and Konaka, R., "Absorption of Chlorine into Still
Liquid in a Simple Stop-Cock Type Absorber", The Canadian Journal of Chemical
Engineering, 45, p. 145-1 49 (1 967).
Marshall Hix, R., and Lynn. S., "Reactive Absorption of H2S by a Solution of SOz
in Poly(glyco1 ether): Effect of a Volatile Dissolved Reactant on Mass-Transfer
Enhancement", Ind. Eng. Chem. Res., 30, p.930-939 (1 991).
Johnson, A. I., Hamielec, A. E., and Houghton, W. T., "An Experimental Study of
Mass Transfer with Chemical Reaction from Single Gas Bubbles", The Canadian
Journal of Chemical Engineering, 45, p. 140-1 44 (1 967).
Whitrnore, A., and Corsi, R. L., "Measurement of Gas-Liquid Mass Transfer
Coefficients for Volatile Organic Compounds in Sewers", Environmental Progress,
13,p.114-123 (1994).
Trabold, T. A., and Obot, N. T., "Evaporation of Water With Single and Multiple
Impinging Air Jets", Journal of Heat Transfer, 1 13, p.696-704 (1 991).
Polissar, M. J., "The Rates of Evaporation of Chlorine, Bromine, and Iodine from
Aqueous Solutions", Journal of Chemical Education, 12, p.89-92 (1 935).
Taylor, R. F., "Absorption of iodine vapour by aqueous solutions", Chernical
Engineering Science, 10, p.68-79 (1 959).

Undergraduate Thesis, University of Toronto, Toronto (1 995)
14. "FACSIMILE v3.0 USER GUIDE", AEA Technology, Oxfordshire, U.K. (1 994)
15. Scheper, W. M., and Margenim, D. W., "Non-Meta1 Redox Kinetics of Iodine and
Triiodide with Thiosulfate via 1 2 ~ 2 0 ~ ~ - and &O3' Intermediates", Inorganic
Chemistry, 3 1. p.5466-5473 (1 992).
16. Ruasse, M., Aubard, J., Galland, B., and Adenier, A., "Kinetic Study of the Fast
Halogen-Trihalide Ion Equilibria in Protic Media by the Raman-Laser
Temperature-Jump Technique. A Non-Diffusion-Controlled Ion-Molecule
Reaction", J. Phys. Chem., 90, p.4382-4388 (1 986).
1 7. "1 st Year Physics Laboratory Manual", unpublished, University of Toronto (1 991 ).
18. Reid, R. C., and Sherwood, T. K., "The Properties of Gases and Liquids", 2nd ed.,
McGraw-Hill(l966).
19. Reid, R. C., Prausnitz, J. M., and Poling, B. E., "The Properties of Gases and
Liquids", 4th ed., McGraw-Hi11 ( 1987).
20. Moran, M. J., and Shapiro, H., N., "Fundamentals of Engineering Thermodynamics",
2nd ed., John Wiley & Sons (1992).

CHEMICALS USED
INSTRUMENTS
Mass balance:
Gamma counter:
Flow meters:
Spectrophotometer:
Thermorneter:
Al1 solids were weighed out using an OHAUS mass
balance, mode1 number TS 120s. The sensitivity of the
baIance was 0.00 1 g
The activity of sarnples was measured in a 1282 Compu
Gamma counter.
Relative humidity probes: Two relative humidity and temperature probes were used in
the experiments. One was a Barnant probe, model number
637-0050 and the other was a Cole-Parmer probe, model
number 37000-50. The sensitivity of both probes was 0.1
%, and the accuracy was f 2 %.
Two Cole-Parmer flow meters were used. One was
equipped with a medium flow tube and the other was
equipped with a high flow tube. The model number of the
medium flow tube was N034-39. This flow meter was
capable of measuring flow rates of air between 357 mL/min
and 9229 mllmin. The high flow tube used was model
N044-40 and was capable of measuring air flow rates
between 1 1 15 mL1min and 23 12 1 mllmin.
The absorbance of al1 liquid sarnples was measured using a
Varian Cary 3 UV-Vis Spectrophotometer with a
wavelength range of 200 nm to 900 nm. The sensitivity of
the instrument was 0.00 1.
Al1 temperature readings were recorded with a FISHER
thermometer. The thermometer had a temperature range of
-10°C to 260°C, and a sensitivity of 1 OC.

CHEMICALS AND SUPPLIES
Needles and Syringes: The needles and syringes used were manufactured by
Becton Dickinson and Co. The needles were 2 1 G 1 Y 2
needles and the syringes were 3cc LuerLok syringes.
Plastic tubing: The plastic tubing used in al1 the experiments was ciear
plastic tubing with an inside diameter of Y4".
Sodium thiosulphate: The sodium thiosulphate used was manufactured by
Caledon and had a minimum assay of 99.5 %.
Sodium iodide: The sodium iodide used was manufactured by BDH
Chemicals and had a minimum assay of 99.5 %.
Potassium iodide: The potassium iodide used was rnanufactured by BDH
Chemicals and had a minimum assay of 99.8 %.
Sodium chloride: The sodium chloride used was manufactured by BDH
Chemicals and had a minimum assay of 99.9 %.
Iodine crystals: The iodine crystals used were manufactured by either BDH
Chemicals or Mallinckrodt.

ACCURACY OF THE MASS BALANCE
Using a 500 pL Cole-Parmer micropipette, 500 pL samples of water were weighed
out. The reading on the balance was compared to the expected mass of water based on the
density of water at the room temperature. It was found that the balance was accurate to
0.002g.
ACCURACY OF THE RELATIVE HUMIDITY PROBES
The accuracy of the relative humidity probes was detemined by placing each probe
above a saturated solution of sodium chloride in a closed system. The relative humidity in
such a system is 75.3 %. The Barnant probe was accurate to 5 %, and the Cole-Parmer probe
was accurate to 25 %.
CALIBRATION OF THE UV-VIS SPECTROPHOTOMETER
A calibration curve of absorbance against concentration was constructed for aqueous
triiodide ions at a wavelength of 350 nm using the Cary 3 UV-Vis spectrophotometer. Data
for the calibration curve was obtained by measuring the absorbance of solutions of known
triiodide concentration.
The triiodide solution for the calibration was prepared by weighing out known
amounts of potassium iodide and iodine crystals and dissolving them in deionized water in a
100 mL volumetric flask. Another solution of potassium iodide of the same iodide
concentration as the triiodide solution was prepared. Using this second solution as a diluent,
a number of solutions of the sarne iodide concentration as the first, but different triiodide
concentrations, were prepared for the calibration. Figure B. 1 shows the calibration curve for
triiodide solutions at a wavelength of 350 nm. Using the regression tool of Microsoft Excel
version 5.0, the extinction coefficient of triiodide solutions at 350 nm was determined to be
26800.

Figure B. 1: calibration curve for triiodide solutions at a wavelength of 350 nm

C. 1 EXPEIUMENTS ON THE EVAPORATION OF WATER
run 1 duration of1 T of water 1 %RH in 1 %RH out I V O I . of water 1
EXPERIMENTS ON THE ABSORPTION OF IODINE GAS INTO WATER
A B C D
run A run B run C time (min) 1 [12] (M)
O I O
run (min) 344 645 460 550
run D ml
(K) 294 297 296 294
time (min) O
run E -1
1121 (M) O
C.3 EXPERIMENTS ON THE EVAPORATION OF IODINE FROM
27.0 22.8 6.8 1.7
AQUEOUS IODINE absorbances were measured at a wavelength of 460 nm
8 1 .O 63.0 65.6 66.0
run A
evaporated (mL) 4.4 6.5 i 6.0 7.0
run B pppiJ run C ml

run G 1 time (min) 1 Abs 1
time (min) O
run H 1 time (min) 1 Abs 1
Abs 0.476
1 time (min) 1 Abs 1
C.4 EXPERIMENTS ON THE ABSORPTION OF IODINE INTO SODIUM THIOSULPHATE
C.4.1 ABSORPTION INTO 1 x 1 o4 M THIOSULPHATE SOLUTIONS
run A
run C laaueous sam~les lcharcoal s a m ~ l e s 1
aqueous sarnples time 1 activity (min)
O
tirne activity (min) (min)
charcoal sarnples time 1 activity
run B
(cpm) 18
run D
(min) 2 5
aqueous samples charcoal samptes time 1 activity time 1 activity
aqueous samples
( c ~ m ) 422 19
(min) @lm (min) (cpm) O 9 2 5 16389
tirne (min)
charcoal samples activity (cpm)
time (min)
activity (cpm>

aqueous sampies ~cnarcoai sampies time 1 activity 1 time 1 activity (min) (min)
17357
9 O 2 5 18347 1 04 20 176
80 132
(min) (min)
3773 6 O 3 6 2 5 42 74
aqueous sampies time 1 activity
C.4.2 ABSORPTION INTO 2 x 10⁴ M THIOSULPHATE SOLUTIONS
cnarcoai sampies time 1 activity
run A run B
C.4.3 ABSORPTION INTO 5 x 10⁴ M THIOSULPHATE SOLUTIONS
run A laaueous sam~les lcharcoal s a m ~ l e s 1
tirne activity time activity (min) (min)
15 789
run B
(min) (min) 1 1974 1664 1
40 229 25 18643 60 309 25 20040
aqueous samples
time 1 activity
C.4.4 ABSORPTION INTO 1 x 10'~ M THIOSULPHATE SOLUTIONS
charcoal samples
time 1 activity
run A run B a ueous sam les charcoal sam les
time activity time activity (min) (min) (min) (min)
2828 40 153 2 5 2770 6 O 245 25 2520
aqueous samples time 1 activity
charcoal samples time [ activity

run A run B
time activity time activity (min) (min)
aqueous samples time 1 activiîy
charcoal samples time 1 activity
C.4.6 ABSORPTION INTO 5 x 1 O-' M THIOSULPHATE SOLUTIONS
(min) O
run A run B
(cprn) 7
C.4.7 ABSORPTION INTO 1 x 1 O-' M THIOSULPHATE SOLUTIONS
(min) 2 5
aqueous samples
run A run B
(cpm) 2402
time (min)
aqueous sarnples charcoal samples
(min) ( C P ~ ) - (min) ( c ~ m ) activity (cpm)
time time (min)
charcoal samples activity activity
(cpm) time activity
aqueous samples time 1 activity
aqueous samples
C.4.8 ABSORPTION N T 0 5 x IO-' M THIOSULPHATE SOLUTIONS
run A run B
charcoal samples time 1 activity
charcoal samples time (min)
O (min)
O
time (min)
2 5
activity (cpm)
2
activity (cpm) 3093
( c ~ m ) O
- - -
aqueous ~amples time 1 activity
charcoal samples time 1 activity
aqueous samples time 1 activity
(min) 2 5
charcoal samples time 1 activity
(cpm) 2895
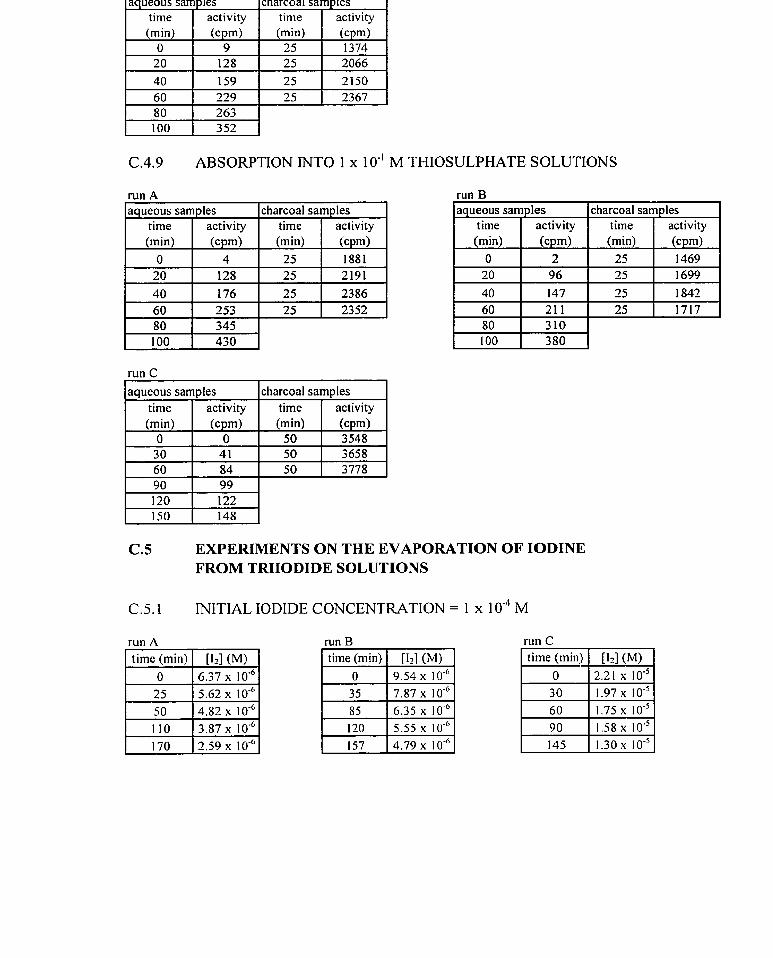
aqueous samples time 1 activity
C.4.9 ABSORPTION INTO 1 x IO-' M THIOSULPHATE SOLUTIONS
charcoal samples time 1 activity
(min) 1 (cpm) O 9
run A laaueous sam~les lcharcoal samdes 1
run B laaueous s a m ~ l e s rcharcoal sam~les 1
(min) 2 5
time activiîy (min)
40 2386
m m ) 1374
run C
time (min)
O
aqueous samples time 1 activity
EXPERIMENTS ON THE EVAPOMTION OF IODINE FROM TRIIODIDE SOLUTIONS
activity (cpm)
2
charcoal samples time 1 activity
(min) O 3 O 60
CS. 1 INITIAL IODIDE CONCENTRATION = 1 x 1om4 M
run A .
tirne (min)
2 5
(cpm) O
4 1 84
run B
activity ( c m 1469
run C
(min) 5 0 5 0 5 O
( c ~ m ) 3548 3658 3778

C.5.2 INITIAL IODIDE CONCENTRATION = 1 x 1 o - ~ M
time (min) O 30 60 9 5
run A run B run C 1 time (min) 1 [12] (M) ]
135 1.1 1 x 135
[I-1 (M) 2.15 x IO-^ 1 .86~10" 1.59 x IO-^ 140 x 1om5
1 time(min) 1 [12] (M) 1
time (min)
C.5.3 INITIAL IODIDE CONCENTRATION = 2.5 x 1 o - ~ M
run D run E
run C time (min)
O
run F time (min) [12] (M)
O 2.23 x 1
[12] (M) 8.03 x Ioe6
run Ci
r
- -- - -
time (min) O 20 53 85 1 1 5
time (min) [ i2] (M) 2.19 x 10m5 1.97 x 1 O-' 1.69 x
- - - - -
time (min) O 20 45 85 135
[12] (M) 7.62 x 1 6.78 x 5.83 x IO-^ 4.95 x IO-" 4.44 x 1 O-"
[12] (hl) 7.35 x 6.74 x 1 0 - ~ 6 .02x10-~ 4.99 x 4 .02~10-"
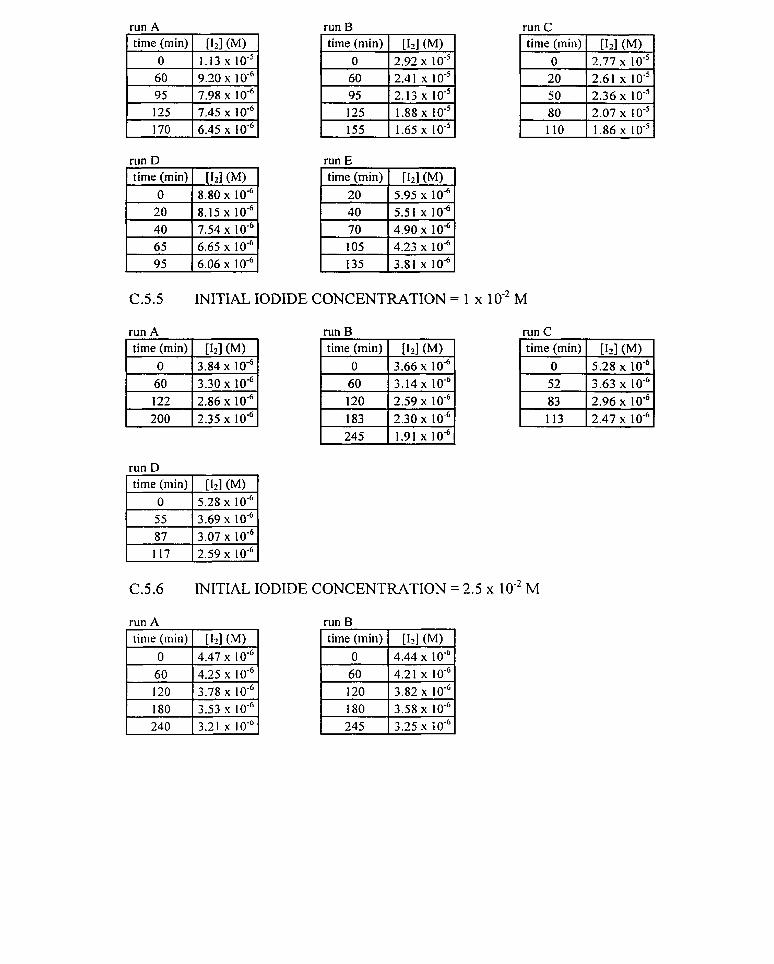
run D run E
run A run B run C time (min)
O 60 95 125 1 70
time (min) O
C.5.5 INITIAL IODIDE CONCENTRATION = 1 x 10" M
[12] (M) 1.13 x IO-^ 9.20 x IO-^ 7.98 x 1om6 7.45 x 10" 6.45 x 1 om6
[II] (M) 8.80 x 1 0 - ~
time (min) 20
run A run B time (min) [ [12] (M) time (min) 1 [II] (M)
time (min) O 60 95 125 155
[Iz] (M) 5.95 x 1 0 - ~
run D
[12] (M) 2.92 x 10" 2.41 x 1oW5 2.13 x IO-^ 1.88 x 1.65x10-~
time (min) O
20 50 80 110
run C
[II] (M) 2.77 x IO-' 2.61 x 10" 2.36 x IO-' 2.07 x IO-^ 1.86 x IO-^
1 rime (min) 1 [12] (M) ]
C.5.6 INITIAL IODIDE CONCENTRATION = 2.5 x IO-' M
run A time (min) Liz] (M) l 7 i i z G d
run B
4.44 10"

run A run B time (min) 1 [12J (M) time (min) 1 [LI (M)
C.5.8 INITIAL IODIDE CONCENTRATION = 1 x IO- '
run A run B h
run D run E
M
run C
time (min) 1 [12] (M)
O 1 6.00 x 1 0 - ~
tirne (min) O 120 240 363 500
tirne (min) [12] (M) tot,,,oil
[12] (M) 7.38 x 6.70 x 1 0 - ~ 5.94 x 1 5.29 x IO-^ 4.67 x 1
run A no charcoal upstream of air flow , 1 time (min) 1 [ I l ] (M) ]
run F
C.5.9 INITIAL IODIDE CONCENTRATION = 2 x 10"
run B charcoal tra time (min)
C)
run C

run A run B no charcoal umtream of air flow no charcoal upstream of air flow
run C run D charcoal trap upstream 01
1 time (min) 1 [I?] (M) 1 fair flow charcoal tra u stream of air flow
-1
C.6 EXPERIMENTS ON THE ABSOWTION OF IODINE INTO POTASSIUM IODIDE
C.6.1 ABSORPTION INTO 1 x 1 0 - ~ M IODIDE SOLUTIONS
run A
[12] vasin = 4.4 x 1 O-' M run B
run D [ l ] g s i n = 1 . 5 x 1 0 ' ~ M time (min) 1 [12] (M)
run C
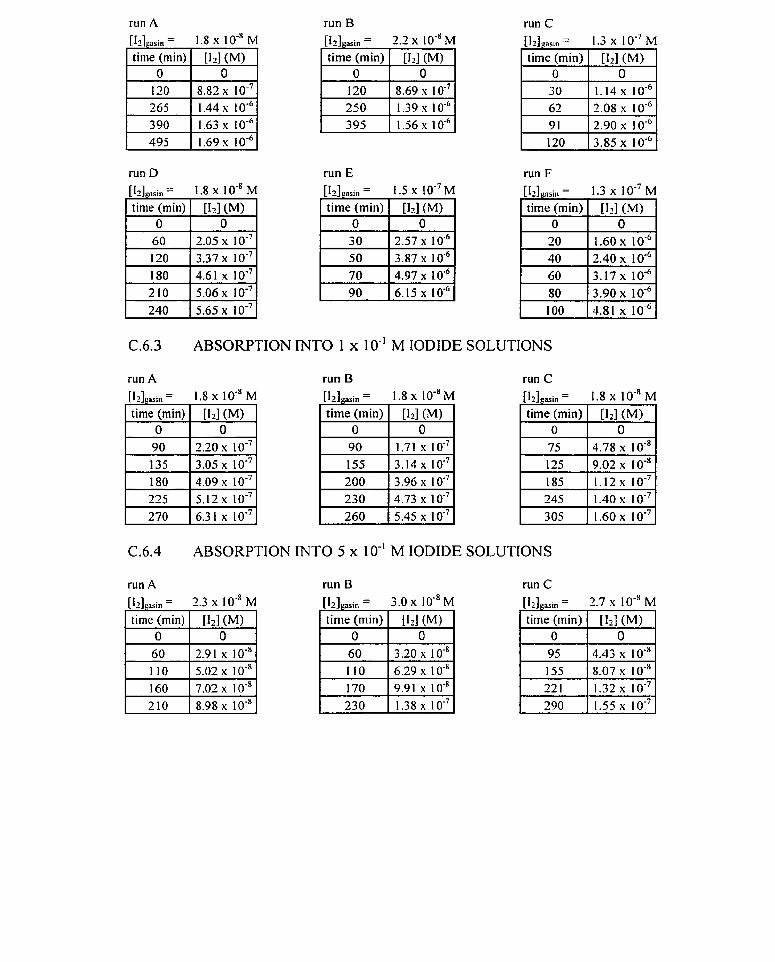
run A run B run C [IzlPsin = 1.8 x 1 O-' M time (min) 1 [LI (M)
[I2]pSin = 2.2 x 10'~ M 1 time (min) 1 [12] (M) 1
run D = 1.8 x IO" M
[ time (min) 1 [12] (M) 1 run E run F
time (min) [12] (M) k k d
C.6.3 ABSORPTION lNTO 1 x IO-' M IODIDI E SOLUTIONS
run A [Iz]gaSin = 1.8 x 1 M
run B
[12]si , , = 1.8 x 1 O-' M time (min) 1 [12] (M)
run C
[Il ] vasin = 1.8 x 1 O-' R time (min) Elz] (M)
125 9.02 x 1 O-" 185 1.12 x IO-^
C.6.4 ABSORPTION iNTO 5 x IO-' M IODIDI Z SOLUTIONS
run A
[l2lWin = 2.3 x 10" M run B run C
1 time Amin) 1 [12]oM) 1
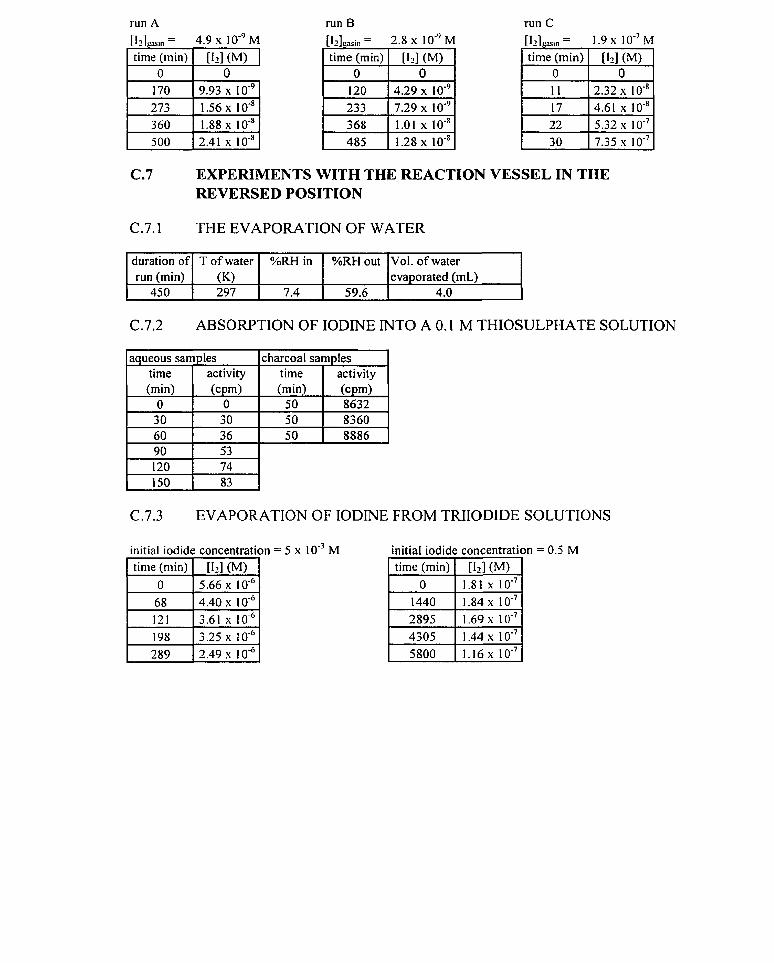
run A run B run C [I~],,,,, = 4.9 IO-^ M
1 time (min) 1 [12] (M) 1
C.7 EXPERIMENTS WITH THE REACTION VESSEL IN THE REVERSED POSITION
= 2.8 x I O-' M [i21,,,,, = I .9 IO-? M
C.7.1 THE EVAPORATION OF WATER
l
I
C.7.2 ABSORPTION OF IODINE INTO A O. 1 M THIOSULPHATE SOLUTION
duration of run (min)
450
time (min) O 120
[12] (M) O
4.29 x
time (min) O 1 1 17 22 3 0
T of water (K) 297
aqueous samples time 1 activity
C.7.3 EVAPORATION OF IODINE FROM TRIIODIDE SOLUTIONS
[Iz] (M) O
2.32 x IO-' 4.61 x 10'~ 5.32 x 1 7.35 IO-?
charcoal samples time 1 activity
(min) O
initial iodide concentratic
233 368 485
%RH in
7.4
7.29 x 1 0 - ~ 1.01x10-~ 1.28 x 10"
( c ~ m ) O
%RH out
59.6
m = 5 x 10" M initial iodide concentration = 0.5 M
Vol. of water evaporated (ml)
4.0
(min) 5 O
time (min) O
1440 2895 4305 5800
( c ~ m ) 8632
[12J (M) 1.81 x 1 1.84 x IO-^ 1.69 x 1
1.44 x 1 O-? 1.16 x IO-^

[12],,,,,= 2 . 7 x 1 0 - ~ M time (min)
O
135 228 301 404 47 1
[12] (M) O
2.63 x 1 0 - ~ 4.37 x 1 5.89 x 1 0 ' ~ 8.79 x 1 1 -06 x 10"

The values of the parameters that were assumed to be constant during the performance of al1
the experiments are given below.
V, average volume of solution = 0.097 I 0.001 L
A, surface area of solution = 0.42 k 0.01 dm2
F, flow rate of air = 0.01 8 -t 2 LIS
H, iodine air-water partition constant = 80
D. 1 CALCULATION OF THE GAS PHASE MASS TRANSFER COEFFICIENT OF
WATER USING THE DATA FROM RUN A IN SECTION C. 1
The rate of evaporation of water is given by equation D- 1.
W c = kc A(Pvu, - 'umh ) D- 1
The parameter k, is related to the gas phase mass transfer coefficient of water by equation D-
2.
The rate of evaporation was calculated from equation D-3, P,,, was obtained from steam
tables [20] and Pamb was calculated from equation D-4.
mass of water evnporated - volume eva~orated x W,. = - D-3
total tirne of evaporation total lime of evaporntion
Using equations D-1, D3 and D-4, the following values were obtained from the data for run
A of section C. 1
P,,, = 2645 Pa
Panib = 7 14.2 Pa
w, /A = 5.08 x 10" kglm2-s

Substituting the above values into equation D-3, the gas phase mass transfer coefficient of
water was calculated to be 3.6 x 1 O--' cmls.
D.2 CALCULATION OF KOL FOR THE ABSORPTION OF IODINE INTO WATER
USING THE DATA FROM RUN A IN SECTION C.2
Using the data from run A in section (2.2, a plot of ln(H[I2]gasin - [I2],,) against time was
constructed, and using the linear regression tool of Microsoft Excel version 5.0, the siope of
this plot was deterrnined to be -2.2 x 10⁴ s-'. Using equation D-5, KOL was calculated to be
5.2 x 1 o4 crnk
D.3 CALCULATION OF KOL FOR THE EVAPORATION OF IODINE FROM
AQUEOUS IODTNE USING THE DATA FROM RUN A IN SECTION C.3
Using the data from run A in section C.3, a plot of ln{[I2],,) against tirne was constructed,
and using the linear regression tool of Microsoft Excel version 5.0, the slope of this plot was
determined to be -8.3 x IO-' s-'. Using equation D-5, KOL was calculated to be 1.9 x
cmls.
D.4 CALCULATION OF KOL FOR THE ABSORPTION OF IODINE INTO SODIUM
THIOSULPHATE USING THE DATA FROM RUN A IN SECTION C.4
Using the linear regression tool in Microsoft Excel version 5.0, the slope of the plots of
activity against time were obtained. The value of [Izjgain was determined by performing an
activity balance on the system. Equation D-6 shows how [I~]ysin was calculated.

- 1'1 Jrcr ts~ i i - - v - O
F x tirne of exp eriment F x tirne of exp erirnent
KoiA was calculated from equation D-7.
For the data in run A of section (2.4, the slope of the plot of activity against time was 1.35
cpm/mL-min and [I2Igsin was 1.5 cpm/mL. Substituting these values into equation D-7
yielded a value of 4.0 x 10 '~ cmls for KOL.
D.5 CALCULATION OF KOL FOR THE EVAPORATION OF IODINE FROM A
TRIIODIDE SOLUTION USING THE DATA FROM RUN A IN SECTION C.5
Using the data from run A in section C.5, a plot of ln{[I2],,} against time was constructed,
and using the linear regression tool of Microsoft Excel version 5.0, the slope of this plot was
determined to be -8.5 x 1 0 - ~ ss". KOL was calculated from equation D-8, in which kf and kb
were the forward and reverse rate constants of the reaction between iodine and iodide ions.
KOL was calculated to be 2.1 x 1 o4 c d s .
D.6 CALCULATION OF Koid FOR THE ABSORPTION OF IODINE INTO AN
IODIDE ION SOLUTION USING THE DATA FROM RUN A IN SECTION C.6
Using the data from run A in section C.6, a plot of ln{ H[I2]gasin - [I2],,) against time was
constructed, and using the linear regression tool of Microsoft Excel version 5.0, the slope of
this plot was determined to be -2.4 x 8 ' . Using equatioii D-8, Koi. was calculated to be
9.5 x 1 O-' cnds.
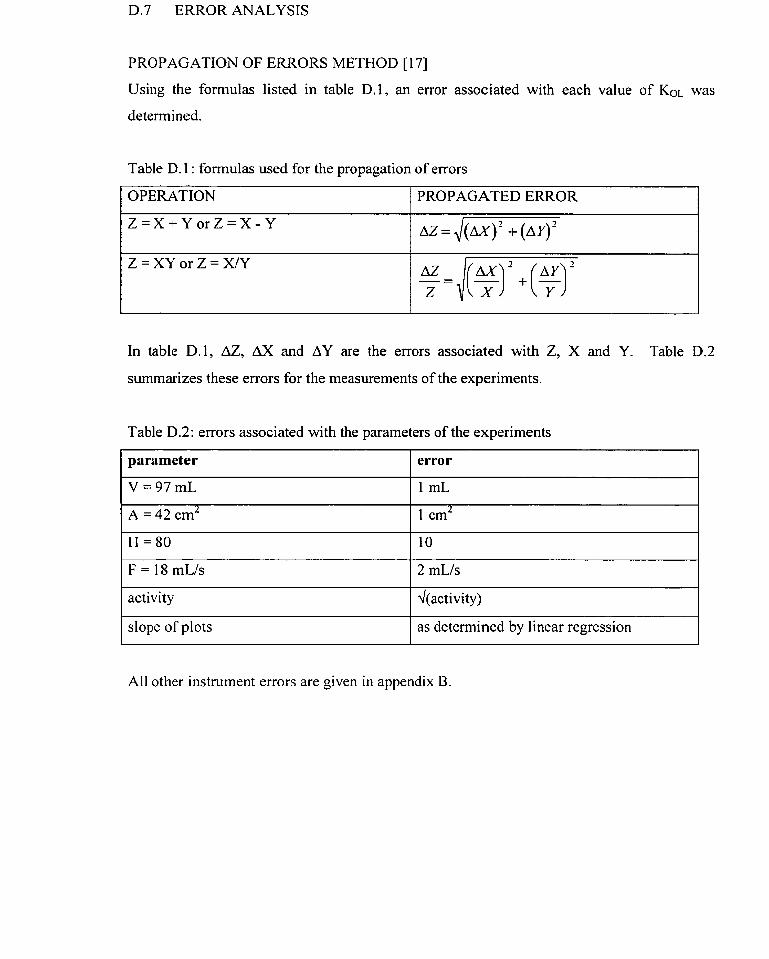
D.7 ERROR ANALYSIS
PROPAGATION OF ERRORS METHOD [ I 71
Using the formulas listed in table D.1, an error associated with each value of KOL was
determined.
Table D. 1 : formulas used for the propagation of errors
In table D.1, AZ, AX and AY are the errors associated with Z, X and Y. Table D.2
summarizes these errors for the measurements of the experiments.
OPERATION
Table D.2: errors associated with the parameters of the experiments
PROPAGATED ERROR
1 parameter 1 error I
1 activity
Al1 other instrument errors are given in appendix B.
dope of plots as determined by linear regression

E.1 LISTING FOR THE MODEL SIMULATING THE EVAPORATION OF IODiNE FROM AQUEOUS IODINE
* mode1 of the evaporation of iodine from a solution of molecular iodine; * the liquid film is divided into #nzone zones; * the bulk layer is designated as the #nzone-t-l zone;
PERMIT + -; INTEGER #nzone 20; * 12 is iodine conc., 12bulk is the conc. of iodine in the bulk liquid phase; VARIABLE 12bulk 1.1 e-03 I2gas ; VARIABLE <#nzone> 12;
* s is height of a zone (dm); * BL is thickness of the liquid film (dm); * dl2 is the diffusion coefficient of iodine in water (dm2ls); * 12gas is iodine gas conc. (M); * Vgas is the volume of the gas phase (dm3); * A is the surface area of solution (dm2); * flow is the flowrate of air through the system (dm3/s), Kvent = flowlvgas; * 120 is the initial concentration of iodine (M); * Kgas and Kliq are the gas and liquid phase mass transfer coefficients (dds) ; PARAMETER s Kliq 2.OE-5 BL d12 1.2e-07 Kgas 0.036 Kvent; PARAMETER A 0.42 Vliq O. 1 Vgas 0.2 120 1.1 e-03 flow 0.0171;
* coefficients of transport; PARAMETER f12;
* workspace array for array code; PARAMETER <200> WORK;
* parameters needed for output; * 12end (=I2bulk) is the iodine conc. in the last zone, 12n is iodine conc. in nth zone; PARAMETER 12end; PARAMETER ZONE 0.0 I2n;
* initialization of variables; COMPILE INITIAL; DO 1 FOR # 1 = O (1) (#NZONE - 1); 12<# 1 > = 120; LABEL 1; 1 3 0 > = 120; **.
9
COMPlLE INSTANT; OPEN I I "12evapl .outu; OPEN 13 "12evap2.out"; OPEN 6 "12evap.log";
* calculate height, s, of each zone; BL = dl2IKliq;

Kvent = flow1Vgas; * define transport coefficients; fl2 = dlî/(s*s); **.
9
COMPILE EQUATIONS; * set index register for last elernent in arrays; FOR # 1 =#nzone - I ; ARRAY <#nzone> WORK; ARRAY END; * add diffusion terms; TRANSPORT <#nzone> 12 fi2 fi 2; * inlet condition at gadliquid interface; % Kgas*A*(12<0> - 12gas*80)/(80*Vgas) : = I2gas; % Kgas*A*(12gas*80 - 12<0>)/(s*A*80) : = ECO>; % Kvent*(O - I2gas) : = 12gas; * outlet condition at film/bulk interface; % fi2* le06*(12<#I> - 12bulk)/(Vliq) : = I2bulk; % fi2* le06*(12bulk - I2<# 1 >)/(s'A) : = 12<# 1 >; * *.
PSTREAM 5 1 1 ; time I2end 12bulk I2gas; * *.
7
PSTREAM 7 13; zone I2n; **.
9
COMPILE TABLE; * set up tables of results; FOR #3=#NZONE - 1 ; 12end = 13<#3>; PSTREAM 5; **.
COMPILE DELTA; DO 2 FOR #6=O (1) (#NZONE - 1); zone = zone + 1 ; 12n=12<#6>; PSTREAM 7; LABEL 2; **.
7
WHENEVER tirne = 0.0 + 100.0 * 36% CALL TABLE; **.
WHENEVER time = 3600 % CALL DELTA; **.
BEGIN; STOP;

INTO WATER
* program to mode1 the absorption of iodine gas into water; * the Iiquid film is divided into #nzone zones; * the bulk layer is designated as the #nzone+I zone;
PERMIT + -; INTEGER #nzone 20; * 12 is iodine conc., Iîbulk is the conc. of iodine in the bulk liquid phase; VARIABLE Iîbulk 0.0 I2gas 5E-08 TRAP; VARIABLE <#nzone> 12;
* s is height of a zone (dm); * BL is thickness of the liquid film (dm); * d12 is the diffusion coefficient of iodine in water (dm21s); * 12gasin is the concentration of iodine gas entering the system (M); * A is the surface area of solution (dm2); * 120 is the initial concentration of iodine (M); * Kgas and Kliq are the gas and liquid phase mass transfer coefficients (dm/s); * flow = flow rate of air (dm3/s), Kvent = flow/Vgas (s- 1); PARAMETER s Kliq 2.OE-5 BL d12 1.2e-07 I2gasin 5E-08 fiow 0.0 17 1
A 0.42 120 0.0 Vliq O. 1 Vgas 0.2 Kgas 0.036 Kvent;
* coefficients of transport; PARAMETER fl2;
* workspace array for array code; PARAMETER <200> WORK;
* parameters needed for output; * l2end is the iodine conc. in the last zone, 12n is the iodine conc. in zone n; PARAMETER I2end ZONE 0.0 1211;
* initialization of variables; COMPILE INITIAL; DO 1 FOR # 1 = O(I) (#NZONE - 1); I2<# 1 > = 120; LABEL 1; 12<0> = 120; **;
COMPILE INSTANT; OPEN I 1 "ISabs 1 .outM; OPEN 13 "12abs3.out"; OPEN 6 "12abs.lcg";
* calculate height, s, of each zone; BL = dI2lKliq; s = BL/(FLOAT(#nzone) - 1 .O); Kvent = flowlvgas; * define transport coefficients; fI2 = dI2/(s*s); **.

COMPILE EQUATIONS; * set index register for last element in arrays; FOR # 1 =#nzone - I ; ARRAY <#nzone> WORK; ARRAY END; * add diffusion ternis; TRANSPORT <#nzone> 12 f12 fi?; * inlet condition at gaslliquid interface; % Kgas*A*(i2gas*80 - I2<0>)/(80*s*A) : = 12<0>; % Kgas*A*((I2<0> - 12gas*80)/(Vgas*80) : = I2gas; % Kvent*(I2gasin - 12gas) : = 12gas; * outlet condition at filmlbulk interface; % fi2* le06*(13<#I> - 12bulk)/(Vliq) : = 12bulk; % fl2* l e06*(12bulk - 12<# l >)/(s*A) : = I2<# 1 >; **.
PSTREAM 5 1 1 ; time I2end 12bulk I2gas; **;
PSTREAM 7 13; TIME zone 1211; **;
COMPILE TABLE; * set up tables of results; FOR #3=#nzone - 1 ; Iîend = 12<#3>; PSTREAM 5; **.
7
COMPILE DELTA; DO 2 FOR #6=0 (1) (#NZONE - 1); zone = zone + 1 ; I2n=l2<#6>; PSTREAM 7; LABEL 2; **;
WHENEVER time = 0.0 + 100.0 * 36 % CALL TABLE; **.
7
WHENEVER time = 3600 % CALL DELTA; * * -
9
BEGIN; STOP;
E.3 LISTING FOR THE MODEL SIMULATING THE ABSORPTION OF IODINE INTO THIOSULPHATE SOLUTIONS
* mode1 of the absorption of iodine into solutions of SZO32- ions; * the liquid filni is divided into ttnzone zones;

* allow variable and parameter names to include + and -; PERMlT -t- -; INTEGER #nzone 20; * species present in solution are: I2,I-, 13-, $2032-, 54062-, I2S2032- and IS203-; * XbuIk is conc of species X in the bulk liquid phase (moVdm3); VARIABLE ISbuIk S2032-bulk 1 E-6 I2S2032-bulk 1-b~lk 13-bulk; VARIABLE IS203-bulk S4062-bulk 12gas 5E-08; VARIABLE <#nzone> 12 1- 13- S2032- 12S2032- IS203- S4062-; * s is height of a zone. BL is thickness of liquid film (dm); * dX is the diffusion coefficient of species X in water (dm%); * I2gasin is concentration of iodine gas entering the system (molldm3); * BL is the thickness of the liquid phase film (dm); * A is the surface area of solution (dm2); * X-O is the initial concentration of species X (molldm3); * flow is the flow rate of air through the system (dm3/s), Kvent = flowlvgas (s- 1); * Vgas and Vliq are the volumes of the gas and liquid phases (dm3); * Kgas and Kliq are the gas and liquid phase mass transfer coefficients (dm/s); PARAMETER s Kliq 2E-5 BL dl2 1 .Se-O7 dl- 1 .Se-07 dI3- 9.0e-08; PARAMETER dS2032- 1.2E-07 d12S2032- 7.7E-O8 dIS203- 92E-08
dS4062- 7.6E-08; PARAMETER I2gasin 5E-08 flow 0.0 186 A 0.42 1-0 0.0 S2032-0 1 E-6; PARAMETER kfl 5.6e09 kbl 7.5e06 kf2 7.8E09 kb2 2.5E2 k B 4.2E08
kb3 9.5E03 kf4 2.5E02 K4 0.245 kb4 k5 1.29E06 k6 1.29E05 k7 1.29E05 Kexpt 6.16e08 Vgas 0.2 Kgas 0.036 Kvent Vliq 0.1 ;
* declaration of rates of reactions; PARAMETER RI R2 R3 R4 R5 R8; * coefficients of transport; PARAMETER f12 fl- fl3- 6 2 0 3 2 - fI2S2032- flS203- fS4062-;
* workspace array for array code; PARAMETER <ZOO> WORK;
* parameters needed for output; * Xend is the conc. of species X in the last zone (rnolldm3); * Xn is conc. of species X in nth zone; PARAMETER I2end 1-end 13-end S2032-end 12S2032-end
IS203-end S4062-end; PARAMETER ZONE 0.0 I2n 1-n 13-n S2032-n I2S2032-n IS203-n S4062-n;
* initialization of variables; COMPILE INITIAL; DO 1 FOR # l = O ( l ) (#NZONE - 1); 12<# 1 > = 0.0; 1-<# 1 > = 1-0; 13-<# 1 > = 0.0; S2O32-<# 1 > = S2032-O; I2S2032-<# 1 > = 0.0; 1 ~ 2 0 3 - < # I > = 0.0; S4062-<# l> = 0.0; LABEL 1; 1 -<O> = 1-0; 13-<O> = 0.0;

COMPILE INSTANT;
OPEN 1 1 "thio l .outw; OPEN 13 "thio3.outW; OPEN 6 "thioA.logM;
* calculate height, s, of each zone; BL = dl2lKliq; s = BL/(FLOAT(#nzone) - 1 .O); Kvent = flow/Vgas; * calculate backward rate constant for equation 4; kb4 = kf4lK4; * define transport coefficients; f12 = dI2/(s*s); fl- = dI-/(s*s); fl3- = d13-/(s*s); 6 2 0 3 2 - = dS2032-l(s*s); fl2S2032- = d12S2032-/(s*s); fIS203- = dIS203-/(s*s); fS4062- = dS4062-/(s*s); * *.
Y
COMPILE EQUATIONS; * set index register for last element in arrays; FOR # 1 = #nzone - 1; * reaction equation for each zone; ARRAY <#nzone> WORK; R l % k f l % k b l : 1 2 +1- =I3-; R2 % kf i % kb2 : 12 + S2032- = I2S2032-; R3 % kt3 % kb3 : 13- + S2032- = I2S2032- + 1-; R4 % kf4 % kb4 : 12S2032- = IS203- + 1-; R5 % k5 : IS203- + S2033- = 1- + S4062-; * for experimentally predicted rate constant; * R8 % Kexpt : 12 + S2032- + S2032- = 1- + 1- + S4062-; ARRAY END; * add diffusion terms; TRANSPORT <#nzone> 12 f12 f12; * inlet condition; % Kgas*A*(80*12gas - 12<O>)/(s*A*80) : = I2<0>; % Kgas*A*(I2<0> - 80*12gas)/(Vgas*80) : = I2gas; % Kvent*(ISgasin - 12gas) : = 12gas; * outlet condition; % fl2* le06*(12<# I > - 12bulk)/(Vliq) : = l2bulk; % fl2* l e06*(12bulk - 12<#l>)/(s*A) : = 12<# 1>; TRANSPORT <ffnzone> 1- fl- fl-; * no inlet condition; * outlet condition; % fi-* 1 eO6*(I-<# I > - 1-buIk)/(Vliq) : = 1-bulk;
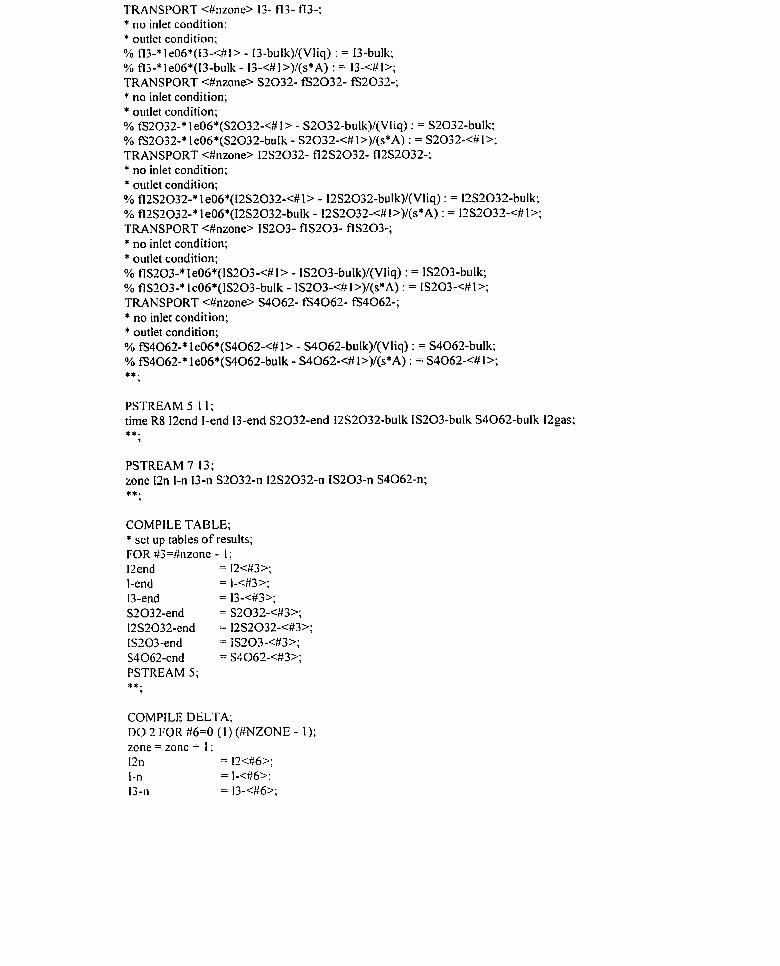
TRANSPORT <#nzone> 13- fI2- fI3-; * no inlet condition; * outlet condition; % fl3-* l e06*(13-<# 1> - 13-bulk)/(Vliq) : = 13-bulk; % f13-* l e06*(I3-bulk - 13-<# l >)/(s*A) : = 13-€# 1>; TRANSPORT <#nzone> S2032- fS2032- fS2032-; * no inlet condition; * outlet condition; % fS2032-* 1 eO6*(S2033-<# 1 > - S2032-bulk)/(VIiq) : = S2032-bulk; % fS2032-* 1 e06*(S2032-bulk - S2032-<# l >)/(s*A) : = S2032-<# I >; TRANSPORT <#nzone> I2S2032- fl2S2032- fi2S2032-; * no inlet condition; * outlet condition; % fl2S2032-* 1 eO6*(12SSO32-<# 1 > - 12S2032-bulk)/(Vliq) : = 12S2032-bulk; % fl WO32-* 1 eO6*(12S2032-bulk - I2S2032-<# l >)/(s*A) : = 12S2032-<# 1 >; TRANSPORT <#nzone> 1 S2O3- fTS203- fIS203-; * no inlet condition; * outlet condition; % fIS303-* I eO6*(lS203-<# 1 > - IS203-bulk)/(Vliq) : = IS203-bulk; % flS203-* le06*(1S203-bulk - ISZO3-<# l >)I(s*A) : = IS203-<#1>; TRANSPORT <#nizone> S4062- fS4062- 64062-; * no inlet condition; * outlet condition; % 64062-* 1 e06*(S4062-<# 1 > - S4062-bulk)/(Vliq) : = S4062-bulk; % PS4062-* 1 e06*(S4062-bulk - S4062-<# l>)/(s*A) : = S4062-<# 1 >; **;
PSTREAM 5 1 1 ; time R8 12end 1-end 13-end S2032-end 12S2032-bulk IS203-bulk S4063-bulk 12gas; **.
9
PSTREAM 7 13; zone 12n 1-n 13-n SL032-n I2S2032-n IS203-n S4062-n; **.
7
COMPILE TABLE; * set up tables of results; FOR #3=#nzone - 1 ; I2end = 12€#3>; 1-end = 1-<#3>; 13-end = 13-<#3>; S2032-end = S2032-<#3>; 12S2032-end = 12S2032-<#3>; IS203-end = IS203-<#3>; S40G3-end = 54063-<#3>; PSTREAM 5; **;
COMPILE DELTA; DO 2 FOR #6=0 ( 1 ) (#NZONE - 1 ); zone = zone + t ; 1211 = 12<#6>; I -n = 1-<#6>; 13-n = 13-<#6>;

12S2032-n = 12S2032-<#6>; IS203-n = 1 S203-<#6>; S3062-n S4062-<#6>; PSTREAM 7; LABEL 2; **.
7
WHENEVER time = 0.0 + 100.0 * 36 % CALL TABLE; **:
WHENEVER tirne =3600 % CALL DELTA; **.
9
BEGIN; STOP:
E.4 LISTING FOR THE MODEL SIMULATING THE ABSORPTION OF IODINE INTO IODIDE SOLUTIONS
* mode1 of the absorption of iodine into a O. 1 M solution of iodide ions; * the liquid film is divided into #nzone zones; * the bulk layer is designated as the #nzone+ l zone;
PERMIT + -; INTEGER #nzone 20; * Xbulk is the concentration of species X in the bulk liquid phase; * 12 is iodine conc., I- is iodide conc. and 13- is tri-iodide conc; VARIABLE 12bulk 0.0 I-bulk le-3 13-bulk 0.0 I2gas 5E-8; VARIABLE <#nzone> 12 1- 13-;
* s is height of a zone (dm); * BL is thickness of the liquid film (dm); * dX is the diffusion coefficient of species X in water (dm21s); * 12gasin is the concentration of iodine gas entering the system (rnolfdrn3); * A is the surface area of solution (dm2); * 1-0 is the initial concentration of iodide ions (moVdm3); * flow is the flow rate of air through the system (dm3/s), Kvent = flow/Vgas (s-1); * Vgas and Vliq are the volumes of the gas and liquid phases (dm3); * Kgas and Kliq are the gas and liquid phase mass transfer coefficients (dm/s); * kf (M.s)- l and kb (s- 1)are fonvard and reverse rate constants; PARAMETER s BL 0.0 1 dl2 1.2e-07 dl- 1.8e-07 dI3- 9.0e-08 13gasin 5E-8 flow 0.01 7 1
A 0.42 1-0 le-3 kb 7.5e6 kf 5.6e9 Vgas 0.2 Kgas 0.036 Kvent Vliq O . 1 ;
* coefficients of transport; PARAMETER fl2 fl- fl3- ;
* workspace array for array code; PARAMETER <200> WORK;
* parameters needed for output; * Xend is the conc. of species X in the last zone; * Xn is the conc. of species X in zone n; PARAMETER I2end I-end 13-end ZONE 0.0 I2n l-n 13-n;

* declaration of the rate of the reaction; PARAMETER R;
* initialization of variables; COMPILE INITIAL; DO 1 FOR#l =O(I)(#NZONE- 1); 12<# 1> = 0.0; 1-<# 1> = 1-0; 13-<# 1 > = 0.0; LABEL 1; [-<O> = 1-0; 13-<O> = 0.0; 12-=0> = 0.0; * *.
7
COMPILE INSTANT; OPEN I t "1-absl .outv; OPEN 13 "1-abs3.outV; OPEN 6 "1-abs.logU;
* calculate height, s, of each zone; s = BL/(FLOAT(#nzone) - 1 .O); Kvent = flowlvgas; * define transport coefficients; f12 = dI2/(s*s); fl- = dl-/(s*s); fl3- = dl3-/(s*s); * *.
9
COMPILE EQUATIONS; * set index register for last element in arrays; FOR # 1 =#nzone - 1 ; * reaction equation for each zone; ARRAY <#nzone> WORK; R % kf % kb : 12 + 1- = 13-; ARRAY END; * add diffusion terms; TRANSPORT <#rizone> 12 f12 fl2; * inlet condition at gaslliquid interface; % Kgas*A*(80*12gas - 12<0>)/(s*A*80) : = 12<0>; % Kgas*A*(12<0> - 80*12gas)/(Vgas*80) : = 12gas; % Kvent*(lî,gasin - 12gas) : = I2gas; * outlet condition at filmlbulk interface; % fl2* l eO6*(I2<# 1> - I2bulk)/(Vliq) : = 12bulk; % fl2* l eO6*(12bulk - I3<# l>)/(s*A) : = I2<# 1 >; TRANSPORT <#nzone> 1- f l - fl-; * no transfer at gaslliquid interface; * outlet condition at film/bulk interface; % fl-* 1 e06*(I-<# 1> - 1-bulk)/(Vliq) : = 1-bulk; % fl-* 1 eO6*(1-bulk - 1-<# 1 >)/(s*A) : = 1-<# 1 >; TRANSPORT <#nzoiie> 13- fl3- f13-; * no transfer at gaslliquid interface; * outlet condition at filmlbulk interface; % fl3-* l e06*(13-<# I > - 13-bulk)/(Vliq) : = 13-bulk;

PSTREAM 5 1 1 ; time Iîend 1-end 13-end 12gas; **.
PSTREAM 7 13; zone 12n 1-n 13-11; **.
7
COMPILE TABLE; * set up tables of results; FOR #3=#nzone - 1 ; l2end = 12<#3>; 1-end = 1-<#3>; 13-end = 13-<#3>; PSTREAM 5; **.
9
COMPILE DELTA; DO 2 FOR #6=0 ( 1 ) (#NZONE - 1 ); zone = zone + 1 ; 12n =12<#6>; 1 -n =1-<#6>; 13-11 =13-<#6>; PSTREAM 7; LABEL 2; **.
'l
WHENEVER tirne = 0.0 + 100.0 *36 % CALL TABLE; **.
'l
WHENEVER time =3600 % CALL DELTA; **. ,
BEGIN; STOP;
E.5 LISTING FOR THE MODEL SIMULATING THE EVAPORATION OF IODINE FROM TRIIODIDE SOLUTIONS
* inodel of the evaporation of iodine from a solution of tri-iodide ions; * the liquid film is divided into #nzone zones; * the bulk layer is designated as the #nzone+ l zone;
PERMIT + - ; INTEGER #nzone 20; * Xbulk is the concentration of species X in the bulk liquid phase; * 12 is iodine conc., 1- is iodide conc. and 13- is tri-iodide conc; VARIABLE Iîbulk le-06 1-bulk le-3 13-bulk 12gas TRAP; VARIABLE <#nzone> 12 1- 13-;
* s is height of a zone (d~n), BL is thickness of the liquid filin (dm);

- ugas is me concentration or ioaine in [ne gas pnase (ivi); * Vgas and Vliq are the volumes of the gas and liquid phases (dni3); * A is the surface area of solution (dm2); * flow is the flowrate of air (dm3/s), Kvent = flowlvgas (s-1); * XO is the initial concentration of species X (M); * kf (M.s)- 1 and kb (s-l )are fonvard and reverse rate constants; + Kgas and Kliq are the gas and liquid phase mass transfer coefficients (drnls); PARAMETER s BL 0.01 dl2 1.2e-07 dI- 1.8e-07 dI3- 9.0e-08 A 0.42 Vgas 0.2
1-0 l e-3 120 1 e-06 13-0 flow 0.0 17 1 kf 5.6eO9 kb 7.5e06 Kgas 0.036 Kvent Vliq O. 1 ;
* coefficients of transport; PARAMETER fl2 fl- fl3-;
* workspace array for array code; PARAMETER <ZOO> WORK;
* parameters needed for output; * Xend is the conc. of species X in the last zone; * Xn is the conc. of species X in the nth zone; PARAMETER I3end 1-end I3-end ZONE 0.0 12n I-n 13-11;
* declaration of the rate of the reaction; PARAMETER R;
COMPILE INSTANT; OPEN 1 I " I-evap I .outn; OPEN 13 " 1-evap3.out"; OPEN 6 "I-evap.logW;
* calculate height, s, of each zone; s = BL/(FLOAT(#nzone) - 1 .O); Kvent = flowlvgas; * define transport coefficients; f i2 = dl2/(s*s); fl- = dl-/(s*s); fl3- = dl3-/(s*s); **.
Y
* initialization of variables; COMPILE INITIAL; DO 1 FOR #I = O (1) (#NZONE - 1); 12<#1> = 120; I-<Hl> =]-O; 13-<#1> = 13-0; LABEL 1; ]-<O> = 1-0; 13-<O> = 13-0; 12<0> = 120; **. ,
COMPl LE EQUATIONS; * set index register for last elernent in arrays;

R 941 kf % kb : 12 + 1- = 13-; ARRAY END; * add diffusion tems; TRANSPORT <#nzone> 12 fI2 fl2; * inlet condition at gaslliquid interface; % Kgas*A*(12<0> - SO*Egas)/(8O*Vgas) : = Ugas; % Kgas*A*(12gas*80 - 12<O>)I(s*A*80) : = 12<0>; % Kvent*(O - 12gas) : = I2gas; * outlet condition at film/bulk interface; % ff 2* 1 e06*(12<# 1> - 12bulk)/(Vliq) : = I2bulk; % ff2* 1 e06*(12bulk - I2<# 1 >)/(s*A) : = 12<# 1 >; TRANSPORT <#nzone> 1- fi- fI-; * no transfer across the gastliquid interface; * outlet condition at filmlbulk interface; % fl-* I e06*(I-<# 1 > - 1-bulk)/(Vliq) : = 1-bulk; % fl-* 1 e06*(I-bulk - 1-<# 1 >)/(s*A) : = 1-<# 1 >; TRANSPORT <#nzone> 13- f13- fi3-; * no transfer across the gaslliquid interface; * ooutlet condition at film/buIk interface; % ff3-* le06*(13-<#1> - 13-bulk)/(Vliq) : = 13-bulk; % fl3-* l e06*(13-bulk - 13-<# 1 >)/(s*A) : = 13-<# 1 >; **. ,
PSTREAM 5 1 1 ; time 12end I-end 13-end 12gas; **.
9
PSTREAM 7 13; zone 12n 1-n 13-11; **.
COMPILE TABLE; * set up tables of results; FOR #3=#NZONE - 1 ; I2end = I2<#3>; 1-end = 1-<#3>; 13-end = 13-<#3>; PSTREAM 5; **.
9
COMPILE DELTA; DO 2 FOR #6=O ( 1 ) (#NZONE - I ); zone = zone + I ; 12n =12<#6>; 1 -n =1-<#6>; 13-n =13-€#6>; PSTREAM 7; LABEL 2; **.
1
WHENEVER time = 0.0 + 100.0 * 36 O h CALL TABLE; **.
9

WHCNCVCK rime = ~ o u v -/O LHLL UCLIN; * * - ,
BEGIN: STOP:
E.6 LISTING FOR THE MODEL SIMULATING THE ABSORPTION OF IODINE INTO HYDROXIDE SOLUTIONS
* model of the absorption of iodine into a solution of hydroxide ions; * the liquid film is divided into #nzone zones; * the bulk layer is designated as the #nzone+ l zone;
PERMIT + - ; INTEGER #nzone 20; * Xbulk is the concentration of species X in the bulk liquid phase; * species in solution are: 12, OH-, 1-, 13-, 120H- and HOI; * &as is the concentration of iodine in the gas phase (M); VARIABLE I2bulk 1-bulk 13-bdk OH-bulk 1 E-6 I20H-bulk
HOlbulk 12gas 5e-9 ISTRAP; VARIABLE <#nzone> 12 1- 13- OH- I20H- HOI;
* DIMENSIONAL PARAMETERS; * s is height of a zone (dm); * BL is thickness of the liquid film (dm); * Vgas and Vliq are the volumes of the gas and liquid phases (dm3); * A is the surface area of solution (dm2); * flow is the flowrate of air (dm3/s), Kvent = flow/Vgas (s- 1); * Kgas and Kliq are the gas and liquid phase mass transfer coefficients (drnls); * H is the airlwater iodine equilibrium partition constant; PARAMETER s Kliq 2E-5 BL flow 0.01 86 Kgas 0.036 Kvent Vliq O. I pH
A 0.42 Vgas 0.2 H 80 I3gasin 5E-9;
* dX is the diffusion coefficient of species X in water (dm21s); PARAMETER dl2 1.2e-07 dI- 1.8e-07 d13- 9.0e-08 dOH- 3.4e-07
dHOI 1 Se-07 dI2OH- 1. l e-07;
* XO is the initial concentration of species X (M); PARAMETER 130 1-0 13-0 HO10 I20H-0 OH-O 1 E-6;
* kf3 and kb# are forward and reverse rate constants for rxn#; PARAMETER kfl 8.0e08 kbl 5.0e04 kf2 1.4e06 kb2 4e08
kf3 5.6e09 kb3 7.5e06 Kps 260; * coefficients of transport; PARAMETER fl3 fI- f l3- fOH- fl20H- WOI;
* workspace array for array code; PARAMETER <200> WORK;
* parameters needed for output; * Xend is the conc. of species X in the last zone; PARAMETER 12end OH-END I20H-END HOIEND 1-END 13-END;

COMPILE INSTANT; OPEN 1 1 "OH-ABS 1 .out"; OPEN 6 "OH-ABS.logM;
* calculate height, s, of each zone; BL = dI2Kliq; s = BLl(FLOAT(#nzone) - 1 .O); Kvent = flowNgas; * calculate pH; pH = 14 + LOG 1 O(0H-0); * define transport coefficients; fi2 = dI2/(s*s); fi- = dl-/(s*s); f13- = dI3-/(s*s); fOH- = dOH-/(s*s); fl20H- = dI20H-/(s*s); fH01 = dHOI/(s*s); **.
9
* initialization of variables; COMPILE INITIAL; DO 1 FOR # I = O (1) (#NZONE - 1); 12<# 1 > = 120; 1-<# 1> = 1-0; 13-<# 1> = 13-0; OH-<# l> = OH-O; 120H-<# 1 > = 120H-0; HO[<# l > = HOIO; LABEL 1; ]-<O> = 1-0; 13 -<O> = 13-0; 12<0> = 120; OH-<O> = OH-O; 120H-<O> = I20H-0; HOI<O> = HOIO; **.
COMPl LE EQUATIONS; * set index register for last element in arrays; FOR # 1 =#nzone - 1 ; * reaction equation for each zone; ARRAY <#nzone> WORK; R l % k f l % k b l : 1 2 +OH-=I2OH- ; R2 % kf2 % kb2 : 120H- = HO1 + 1-; R3 % kf3 % kb3 : 12 + 1- = 13- ; * % kps : 12 -t- OH- = 120H-; ARRAY END; * add diffusion terins; TRANSPORT <#nzone> 12 f12 fl2; * inlet condition at gaslliquid interface; O/o Kgas*A*(12<0> - H*12gas)/(H*Vgas) : = I2gas;
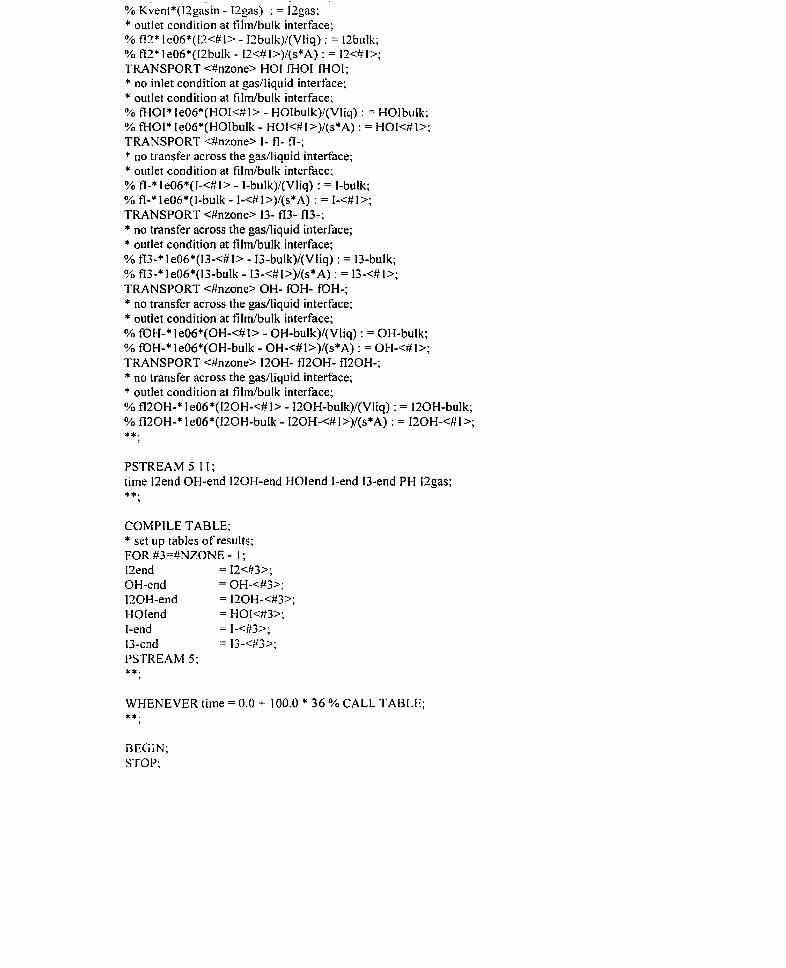
-
% Kvent*(12gasin - 12gas) : = I2gas: * outlet condition at film/bulk interface; 96 f12* leO6*(I?<# I> - I2bulk)l(Vliq) : = Iîbulk; % flî* l e06*(12bulk - 12<# l>)/(s*A) : = 1 2 4 1>; TRANSPORT <#nzone> HO1 fH01 fHOI; * no inlet condition at gaslliquid interface; * outlet condition at film/bulk interface; % AIOI* le06*(HOI<#I> - HOlbulk)/(Vliq) : = HOlbuIk; % fHOI* leO6*(HOibulk - Hot<# I>)/(s*A) : = HO]<# l>; TRANSPORT <#nzone> 1- fl- fl-; * no transfer across the gadliquid interface; * outlet condition at filmlbulk interface; % fl-*le06*(1-<#1> - 1-bulk)/(Vliq) : = 1-bulk; % fl-* l e06*(l-bulk - 1-<# 1 >)/(s*A) : = 1-<# 1 >; TRANSPORT <#nzone> 13- fl3- fl3-; * no transfer across the gaslliquid interface; * outlet condition at film/bulk interface; % fl3-*le06*(13-<#1> - 13-bulk)/(Vliq) : = 13-bulk; % fl3-* le06*(13-bulk - I W # t >)/(s*A) : = 13-<# 1>; TRANSPORT <#rizone> OH- fOH- fOH-; * no transfer across the gaslliquid interface; * outlet condition at filmlbulk interface; % fOH-* l eOG*(OH-<#l> - OH-bulk)/(Vliq) : = OH-bulk; % fOH-* le06*(OH-bulk - OH-<#l>)/(s*A) : = OH-<# l>; TRANSPORT <#nzone> 120H- fl20H- fl2OH-; * no transfer across the gaslliquid interface; * outlet condition at film/bulk interface; % fl2OH-* 1 e06*(120H-<# 1 > - I20H-bulk)/(Vliq) : = I20H-bulk; % fl2OH-* le06*(120H-bulk - I20H-<#l >)/(s*A) : = I20H-<# 1>; **.
3
PSTREAM 5 1 1 ; time Iîend OH-end I20H-end HOIend 1-end 13-end PH I2gas; **.
1
COMPILE TABLE; * set up tables of results; FOR #3=#NZONE - I ; Iîend = I2<#3>; OH-end = OH-<#3>; 12OH-end = 120H-<#3>; HOlend = HOI<#3>; 1-end = 1-<#3>; 13-end = 13-<#3>; PSTREAM 5; **;
WHENEVER time = 0.0 + 100.0 * 36 % CALL TABLE; * *.
9
BEGIN; STOP;

* mode1 of the evaporation of iodine from solution in the presence of a radiation field; * the Iiquid film is divided into #NZONE zones, the #NZONE +I being the bulk layer;
* SIMPLIFIED LlRlC DATA BASE IN FACSIMILE FORM (5194) * INPUT pH, 1- * NO THERMAL OXIDATION O F 1-. DUSHMAN. RH, ADSORPTION * BASED ON GEOMETRY O F EXPERIMENTAL APPARATUS * NO TEMPERATURE VARIATION;
* RADlOLYSlS O F WATER * BASED ON WATER SET IN LlRIC 2 * EDITED Oct 5 1995 BY G.EVANS;
COMPILE INSTANT; OPEN 6 "RADEVP.LOGW; OPEN 1 O "RADEVP I .OUT"; OPEN 11 "RADEVP2.0UT"; OPEN 12 "RADEVP3 .OUT";
* ** DON'T RUSH ME, I'M THINKING * **
PERMIT + - ; INTEGER #nzone 20; * XBULK is the concentration of species X in the BULK liquid phase (M); VARIABLE I2BULK I-BULK le-4 13-BULK OI-BULK HOIBULK IBULK 12-BULK
IO-2BULK I02HBULK H02BULK O-BULK H+BULK HBULK H2BULK OHBULK 02-BULK I2OH-BULK OH-EULK 02BULK H02-BULK H202BULK S203-2BULK 13S203-2BULK IS203-BULK S406-2BULK 02Gin;
VARIABLE <#NZONE> 12 I- 13- 01- HO1 1 12- 10-2 PROD I02H HO2 O- H HZ OH 0 2 - 120H- OH- 0 2 H02- H 2 0 2 H+ S203-2 I2S203-2 IS203- S406-2;
* XG is the concentration of species X in the gas phase; VARIABLE E- 12G IG 0 2 G H2G;
* s is height of each zone (dm); * BL is thickness of the liquid phase film (dm); * AGL is the surface area of solution (dm2); * XO- is the initial concentration of species X; * FLOW is the flow rate of air through the system (din31s); * VG and VL are the volumes of the gas and liquid phases (dm3); PARAMETER s BL AGL 0.42 IO- l e-04 S203-20 O

* dX is the diffusion coefficient of species X in water (dm%); PARAMETER dl3 1.3e-07 dl- 1.8e-07 dI3- 9.0e-08 dOI- 1 SE-07 dHO1 1 SE-07
di 1 .SE-07 dI3- I .2E-07 dIO-2 1.5E-07 d102H l.3E-07 dH02 2.1 E-07 d o - 3.3E-07 dH 6.OE-07 dH+ 6.OE-07 dH2 4.2E-07 dOH 2.8E-07 d02- 3.3E-07 d120H- 1.1 E-07 dOH- 2.8E-07 do2 2.3E-07 dH02- 2.1 E-07 dH202 2.OE-07 dS203-2 1.2E-07 dI2S203-2 7.7E-08 dIS203- 9.2E-08 dS406-2 7.6E-08;
* coefficients of transport; PARAMETER f12 fi- f13- fol- fNOI fl f12- fl0-2 fl02H fH02 fO-
fH fH2 fOH f02- fl20H- fOH- f 0 2 fH02- W202 6203-2 fl3S203-2 flS203- 6 4 0 6 - 2 fH+;
* workspace array for array code; PARAMETER <200> WORK;
* parameters needed for OUTput; * XOUT is the concentration of species X in the last zone (M); * XALL refers to the concentration of species X in ALL the zones (M); * zone is the zone number; PARAMETER 12OUT 1-OUT 13-OUT S203-20UT S406-20UT; PARAMETER ZONE 0.0 I2ALL 1-ALL 13-ALL; PARAMETER 01-OUT HOIOUT IOUT 12-OUT IO-20UT 102HOUT H020UT O-OUT
H+OUT HOUT H20UT OHOUT 02-OUT I20H-OUT OH-OUT OSOUT H02-OUT H2020UT I2S203-20UT 13203-OUT;
* rates of reactions; PARAMETER RI R2 R3 R4 R5 R6; * DO is dissolved oxygen, PH is pH of solution; PARAMETER H20 55.51 DO 8 PH 6; * AN is Avogadro's number, DR is dose rate (LGRAYh); PARAMETER AN 6.023E23 DR I PR; PARAMETER GE- 2.7 CH 0.6 GH2 0.45 GOH 2.7 GH202 0.7 CH+ 2.7;
* HEX is the equilibrium partition ceofficient of species X; PARAMETER HE02 2.6354E-2 HEH2 1.7569E-2 HE12 80 HE1 1.85 ; * K values are the mass transfer coefficients; * KVENT = volumetric flow rate of air 1 volume (s- 1); PARAMETER KTL 2E-05 KTG 3.6E-02 KVENT;
* initialization of variables; COMPILE INITIAL; 02Gin = DO*2.5E-04/(8*HE02) ; DO 1 FOR #I =O (1 ) (#NZONE - 1); 1 2 d 1 > = 0.0; 1-<# 1 > = IO-; 13-<# 1 > = 0.0; H+c# 1 > = IO.@(- PH); OH-<# l > = 1 .OE-14/(1 O.@(- PH)); 02<# 1 > = DO*2.5E-418; S203-2<# I > = S303-20; LABEL 1; ]-<O> = IO-;

.- " Y . " ,
H+<O> = IO.@(- PH); OH-<O> = 1 .OE- 144 1 O.@,(- PH)): 02<0> = DO*2.5E-418; $203-2<0> = S203-70; **.
COMPILE INSTANT; * calculate height, s, of each zone; BL = dl2/KTL; s = BL/(FLOAT(#nzone) - 1 .O); * define transport coefficients; f12 = dl2/(s*s); fl- = dl-/(s*s); fi3 - = dl3-/(s*s); fol- = dOI-/(s*s); fHOI = dHOI/(s*s); fl = dl/(s*s); f12- = dl2-/(s*s); fl0-2 = dlO-~/(s*s); fl02H = dl02H/(s*s); fH02 = dH02/(s*s); f0- = do-/(s*s); fH = dH/(s*s); fH+ = dH+/(s*s); fH2 = dH2/(s*s); fOH = dOH/(sSs); f02- = d02-/(s*s); fl20H- = dl20H-/(s*s); fOH- = dOH-/(s*s); f02 = d02/(s*s); fHO2- = dH03- / (~*~) ; fH202 = dH202/(s*s); * fE- = dE-/(s*s); fS203 -2 = dS203-Y(s*s); fl2S303-2 = d12S203-~/(s*s); flS203- = dIS203-/(s*s); fS406-2 = dS406-~/(s*s); **- ,
COMPILE GENERAL; KVENT=FLOW/VG; PR =DR* 1 E3/(1.6E-I 9*36OO*AN* 100.); **.
3
COMPILE EQU ATIONS; * set index register for last elernent in arrays; FOR # 1 =#nzone - 1 ; * reaction equations for eacli zone; ARRAY <#nzoile> WORK; * REACTIONS OF OH; * --------------,------------. % PR*GOH = O H :


RI % KTGSAGL*(12<0> - I2G * HE12)/(VG*HE12) := I2G; R 3 O h KTG*AGL*(12G * HE12 - I2<0>)/(s*AGL*HE12) := 12<0>; ~3 O ' ,O KVENT*(O - 12G) : = I2G ;
* outlet condition at film1BULK interface; R5 % fl2* le06*(12<#1> - 1SBULK)lVL : = ISBULK; R6 % fl2* 1 e06*(12BULK - I2<# l >)/(s*AGL) : = I2<# 1 >; TRANSPORT <#nzone> I- fl- fi-; * no transfer across gaslliquid interface; * outlet condition at filmlBULK interface; % fl-* 1 e06*(I-<# 1 > - I-BULK)/VL : = I-BULK; % fi -* l eO6*(I-BULK - I-<# l >)/(s*AGL) : = I-<# 1 >; TRANSPORT <#nzone> 13- fl3- fi 3-; * no transfer across gaslliquid interface; * outlet condition at fiIdBULK interface; % fl3-* 1 e06*(13-<# I > - 13-BULK)NL : = 13-BULK; n/0 fl3-* 1 e06*(13-BULK - 13-<# l>)/(s*AGL) : = I3-<# l>; TRANSPORT <#nzone> 01- fOI- FOI-; * no transfer across gas/liquid interface; * outlet condition at fildBULK interface % fol-* l e06*(OI-<# 1 > - OI-BULK)/VL : = OI-BULK; % fol-* l e06*(OI-BULK - OI-<# l >)l(s*AGL) : = OI-<# l>; TRANSPORT <#nzone> 12- fl2- fI2-; * no transfer across gadliquid interface; * outlet condition at film/BULK interface; % fl2-* 1 e06*(12-<# I > - I2-BULK)/VL : = 12-BULK; % fl2-* l e06*(12-BULK - 12-<# l >)/(s*AGL) : = 12-<# 1 >; TRANSPORT <#nzone> 10-2 flO-2 fl0-2; * no transfer across gadliquid interface; * outlet condition at f i ldBULK interface; % fi 0-2* le06*(10-2<# 1> - IO-SBULK)/VL : = IO-2BULK; % fI O-2* 1 e06*(IO-2BULK - IO-2<# l >)/(s*AGL) : = 10-2<# 1 >; TRANSPORT <#nzone> O- fO- fO-; * no transfer across gaslliquid interface; * outlet condition at film1BULK interface; % f0-* l e06*(O-<# 1 > - O-BULK)/VL : = O-BULK; % f0-* l e06*(0-BULK - O-<# 1 >)/(s*AGL) : = 0-44 1 >; TRANSPORT <#nzone> 02- fO2- f02-; * no transfer across gaslliquid interface; * outlet condition at film/BULK interface; % f02-* 1 e06*(02-<# 1 > - 02-BULK)/VL : = 02-BULK; 5% f02-* 1 e06*(02-BU LK - 02-<# 1 >)/(s*AGL) : = 02-<# 1 >; TRANSPORT <#nzone> I2OH- fl20H- fI20H-; * no transfer across gaslliquid interface; * outlet condition at film/BULK interface; % fl20H-* l eO6*(12OH-<# 1 > - I20H-BULK)/VL : = I2OH-BULK; % fl20H-* I e06*(120H-BULK - I20H-<# I >)/(s*AGL) : = I2OH-<# I >; TRANSPORT <#nzone> OH- fOH- fOH-; * no transfer across gaslliquid interface; * outlet condition at film1BULK interface; % fOH-* l e06*(OH-<# l> - OH-BULK)/VL : = OH-BULK; % fOH-* leO6*(OH-BULK - OH-<#l>)/(s*AGL) : = OH-<# 1>; TRANSPORT <#nzone> H02- fH02- fH02-; * no transfer across gaslliquid interface; * outlet condition at film/ BULK interface;

% fH02-* l eO6*(H02-BULK - H02-<# I>)/(s*AGL) : = H02-<# I >; TRANSPORT <#inzone> HO1 fHOI fH01; * no inlet condition at gaslliquid interface; * outlet condition at filmIBULK interface; O% fHOI* 1 eO6*(HOI<#l> - HO1BULK)lVL : = HOIBULK; % fH01* 1 e06*(HOIBULK - HOI<#l>)/(s*AGL) : = HOI<#l>; TRANSPORT <+Inzone> 1 fI fI; * inlet condition at gaslliquid interface; % KTG*((dIIdl2)@0.6)*AGL*(IG * HE1 - I<O>)/(s*AGL*HEi):=I<O>; VO KTG*((dildI2)@0.6)*AGL*(I<O> - IG * HEI)/(VG*HEI) :=IG; % KVENT*(O - IG):=IG; * outlet condition at f i l d B U L K interface; % fI*le06*(I<#l> - 1BULK)lVL : = IBULK; % fl *le06*(IBULK - I<#l>)l(s*AGL) : = I<#l>; TRANSPORT <#nzone> I 0 2 H flO2H fl02H; * no transfer across gaslliquid interface; * outlet condition at f i l d B U L K interface; % fl02H* le06*(102H<#l> - IO2HBULK)lVL : = I02HBULK; % fi02H* IeO6*(102HBULK - I02H<# l>)/(s*AGL) : = 102H<# 1>; TRANSPORT <#nzone> HO2 fN02 fH02; * no transfer across gaslliquid interface; * outlet condition at film/BULK interface; % fH02* 1 eO6*(HOX# 1 > - H02BULK)lVL : = H02BULK; % fH02* 1 e06*(H02BULK - H02<# l>)/(s*AGL) : = H 0 2 d 1 >; TRANSPORT <#nzone> H fH fH; * no transfer across gaslliquid interface; * outlet condition at film interface; % fH* le06*(H<# I> - HBULK)/VL : = HBULK; % fH* le06*(HBULK - H<# 1 >)/(s*AGL) : = H<#l>; TRANSPORT <#nzone> H+ fH+ fH+; * no transfer across gaslliquid interface; * outlet condition at film interface; % fH+* l eO6*(H+<# l > - H+BULK)/VL : = H+BULK; % fH+* 1 e06*(H+BULK - H+<#l>)/(s*AGL) : = H+<#1>; TRANSPORT <#nzone> H2 M 2 fH2; * inlet condition at gasAiquid interface; % KTG*((dH2/dI2)@0.6)*AGL*(H2G * HEH3 - H~<O>)I(S*AGL*HEH~):=H~<O>; % KTG*((dH2ldI2)@0.6)*AGL*(H2<0> - H2G * HEH2)/(VG*HEH2) :=H2G; % KVENT*(O - H2G):=H2G; * outlet condition at filmIBULK interface; % fH2* I eO6*(H2<# I > - H2BULK)IVL : = H2BULK; % fH2* l eO6*(H2BULK - HZ<# l >)I(s*AGL) : = Hz<# l>; TRANSPORT <#nzone> OH fOH fOH; * no transfer across gaslliquid interface; * outlet condition at film1BULK interface; % fOH*I eO6*(OH<#l> - 0HBULK)lVL : = OHBULK; % fol-1* l e06*(OHBULK - OH<# l >)/(s*AGL) : = OH<# l>; TRANSPORT <#nzone> 0 2 f 0 2 f02; * inlet condition at gaslliquid interface; % KTG*(d02/dI2)@0.6*AGL*(02G * HE02 - 02<0>)/(s*AGL*HE02):=02<0>; % KTG*(d02IdI2)@0.6*AGL*(03<0> - 0 3 G * H E02)/(VG *H EO2) :=02G; % KVENT*(02Gin - 02G):=02G; * outlet condition at FilmIBULK interface; % fOZ* l eO6*(02<# I > - 02BULK)lVL : = 02BULK;

TRANSPORT <#nzone> H202 fH202 fH202; * no transfer across gaslliquid interface; * outlet condition at filrn1BULK interface; O h fH202* leO6*(H?OS<# 1 > - H202BULK)lVL : = H202BULK; % fH202* le06*(H202BULK - H202<#l>)/(s*AGL) : = H202<#1>; TRANSPORT <#nzone> S203-2 f5203-2 fS203-2; * no transfer across gaslliquid interface; * outlet condition at fildBULK interface; % fS203-2* 1e06*(S203-2<# 1> - S203-2BULK)NL : = S203-2BULK; % tS203-2* Ie06*(S203-2BULK - S203-2<# I>)/(s*AGL) : = S203-2<# 1 >; TRANSPORT <#nzone> 12S203-2 fl2S203-2 fi2S203-2; * no transfer across gaslliquid interface; * outlet condition at filrn/BULK interface; % fl2S203-2* 1 eO6*(lBSO3-2<# 1> - 12S203-2BULK)lVL : = I2S203-2BULK; % flzS203-2* le06*(12S203-2BULK - 12S203-2<# 1 >)/(s*AGL) : = ISS203-2<# 1 >; TRANSPORT <#nzone> IS203- flS203- flS203-; * no transfer across gaslliquid interface; * outlet condition ai film/BULK interface; % flS203-* 1 e06*(IS203-<# 1> - IS203-BULK)/VL : = IS203-BULK; % flS203-* 1 e06*(IS203-BULK - IS203-<# l>)/(s*AGL) : = IS203-<# 1>; TRANSPORT <#nzone> S406-2 6406-2 fS406-2; * no transfer across gadliquid interface; * outlet condition at film/BULK interface; % 6406-2* 1 eO6*(S406-2<# 1 > - S406-2BULK)lVL : = S406-2BULK; % 6406-2* 1 e06*(S406-2BULK - S406-2<# l>)/(s*AGL) : = S406-2<# 1 >; * *.
9
PSTREAM 4 10; time 120UT LOUT I-BULK 13-OUT Oi-OUT HOIOUT IOUT 12-OUT 10-20UT; **.
7
PSTREAM 5 1 1; TIME R1 R2 R3 R4 R5 R6; **;
PSTREAM 6 13; time I02HOUT IîOH-OUT 123203-20UT IS203-OUT 12G 02G; **.
COMPILE TABLE; * set up tables of results; FOR #3=#nzone - 1 ; 120UT = I2<#3>; 1-OUT = 1-<#3>; 13-OUT = I3-<#3>; S203-20UT = S203-2<#3>; S406-20UT = S406-2<#3>; OI-OUT = 01-<#3>; HOIOUT = HOI<#3>; IOUT = 1<#3>; 13-OUT = 1 2 4 3 ~ ; IO-2OUT = ]0-2<#3>; I02HOUT = 102H<#3>;

O-OUT H+OUT HOUT H2OUT OHOUT 02-OUT I2OH-OUT OH-OUT 020UT H02-OUT H2020UT 12S203-20UT IS203-OUT PSTREAM 4; PSTREAM 6 ; PSTREAM 5; * *;
WHENEVER time = 0.0 + 200.0 * 50 % CALL TABLE; **;
BEGIN; STOP;

L L , LLL I I I I I ~ 11111I.I 1 1 1 1 1 ~
APPLIED - IMAGE. lnc = 1653 East Main Street - W . - , Rochester, NY 14609 USA -- -- - - Phone: 7161482-0300 -- -- - - Fax: 7161288-5989
O 1993, Applied Image, Inc.. All Righls Reserved