Embed Size (px)
Citation preview
Engineering and Technology Journal Vol. 38, Part A (2020), No. 08, Pages 1236-1245
Engineering and Technology Journal Journal homepage: engtechjournal.org
1236 Publishing rights belongs to University of Technology’s Press, Baghdad, Iraq.
Effect of Filler Metals on Microstructure and Mechanical
Properties of GTAW Welded Joints of Aluminum Alloy
(AA2024-T3)
Muna K. Abbass a, Jihad G. Abd Ul-Qader b*
a Production Engineering and Metallurgy Dept. Baghdad, Iraq, [email protected]
b Production Engineering and Metallurgy Dept. Baghdad, Iraq, [email protected]
*Corresponding author.
Submitted: 17/11/2019 Accepted: 22/12/2019 Published: 25/08/2020
K E Y W O R D S A B S T R A C T
GTAW, aluminum alloy
(AA2024-T3), filler
metals, microstructure,
mechanical properties.
This study presents an appropriate filler metal or welding electrode to join
aluminum alloy (AA2024-T3) sheet of 3.2 mm thickness with a square butt
joint using Gas Tungsten Arc Welding (GTAW) process. This process was
carried out at three different welding currents with three various filler
metals: ER4047 (12% Si), ER4043 (5% Si), and ER5356 (5% Mg).
Experiments were conducted to investigate the microstructure and the
mechanical properties. The effect of various filler metals upon the weld
joints quality were analyzed via an X-ray radiographic and tensile test.
Hardness test, microstructures, SEM, and XRD also conducted to the
welded specimens. It was found that the best result was at 100 Ampere
with using filler metal (ER5356) which produced the highest strength of
240 MPa in comparison with welded joints with utilizing fillers (ER4043)
and (ER4047) having values of 235 MPa and 225 MPa, correspondingly.
The hardness results showed that the highest hardness values were at the
weld metal for ER4047 and ER4043, then decreased to HAZ and increased
in the base metal. While in the case of ER5356, the highest hardness was
in HAZ and decreased in the weld metal. The fractography of the fracture
surface of the welded joints after the tensile test was analyzed using SEM.
M. K. Abbass, J. G. Abd Ul-Qader, “Effect of Filler Metals on Microstructure and Mechanical Properties of
GTAW Welded Joints of Aluminum Alloy (AA2024-T3),” Engineering and Technology Journal, Vol. 38,
Part A, No.08, pp. 1236-1245, 2020.
DOI: https://doi.org/10.30684/etj.v38i8A.1277
1. Introduction
Al alloys are presently utilized in different sectors due to their higher characteristics of quality, such
as resistance to corrosion, recyclability, and less specific gravity [1, 2]. Today, their use is still
widening, highly in the aerospace and automobile and industries [3]. As indicated in the investigation
via Fortain and Gadrey [4], the principal uses of products of Al have been in construction (20%),
transportation (27%), electricity supply (10%), packaging (16%), machinery and equipment (8%) as
Engineering and Technology Journal Vol. 38, Part A, (2020), No. 08, Pages 1236-1245
1237
well as in sectors that relate to the sustainable products (7%), where the exceptional growth that
reaches to (60) million tons by (2020) has been forecasted. Nevertheless, the Al alloys joining
unremittingly meant an incredible test for assembling engineers. Specifically, the heat treatable
aluminum alloys such as 2024 alloy and its combination to other materials are difficult to fabricate
using conventional fusion welding methods [5, 6]. The coefficient of thermal expansion of aluminum
and thermal conductivity of aluminum is quite high in comparison with the steel, thus it’s prone to
the inducement of distortion and stress when the proper welding method isn’t followed. Aluminum is
a reactive metal, which rapidly makes a surface oxide layer, and the weld area strength becomes
feeble [7]. Accordingly, aluminum welding via the traditional process of arc welding becomes
difficult. The highly familiar commercial welding methods of the aluminum and aluminum alloy
utilize either lasting tungsten (W) electrode using an (AC) current or using a (DC) current with and
without pulsation [8, 9]. Weldments after fusion welding resulted in the formation of some welding
defects like porosity, micro-cracks in fusion zone during the weld pool solidification from the molten
state to solid-state. Also, there are lots of different difficulties are consorted to this type of joining
method, specifically, these are associated with the presence of persistent oxide layer, solidification
shrinkage, thermal expansion, high thermal conductivity and high hydrogen solubility and different
gases in weld pool [10, 11]. There are limited researches and few published data are available about
the effect of filler metals (welding electrode) in GTAW on microstructure and mechanical properties.
Indira Rani [12] in 2012 performed a study upon the mechanical characteristics of a (TIG) welded Al
alloy. A plate having a dimension of (300 mm x 150 mm x 6 mm) was used in the experiments. The
parameters of welding were pulse frequency (3-7 Hz), arc travel speed (700-760 mm/min), and
current (70-74A). From the experiment, it was inferred that the welded joint yield strength and the
ultimate tensile strength were near to those for the parent metal. The joint’s failure occurred at the
heat-affected zone (HAZ) which resulted that the weldments possess less strength than the base
metal. The test results included the ultimate tensile strength of 281 MPa, and the hardness of weld
metal is 73.5 HVN. The shielding gas flow rate (15 l/min) and the welding current (200A) are
obtained to yield a better outcome. Gurjinder Singh et al. [13] in 2013 investigated the influence of
current on the microstructure and hardness of butt welding aluminum alloy AA 6082 with filler metal
ER4043 by using GTAW process. Also, it was noted that a fine interdendritic network of aluminum
phase was existed with much Mg2Al3 particles precipitated close the grain boundaries. The
microstructure and (SEM) of the specimen at a current of (140 A) are the indication of the higher
tensile strength owing to the uniform dimples and fine grain. At low current, the hardness was high
and decreased as the current increased; moreover, hardness was low at nugget zone and it increases
towards the base metal.
Krishnaja Devireddy et al. [14] (2018) studied the effect analysis of the friction stir processing (FSP)
on the (GTAW) of aluminum alloy (AA2024) in the weld zone with using filler metal ER5356, the
result showed that the defects and porosities formed in the GTAW weldments are completely reduced
by using FSP process, the tensile test of GTAW weldments was higher than FSPed specimen, and the
hardness of the GTAW+FSPed specimen was greater than that of the GTAW weldments owing to the
formation of fine grain structure in the GTAW+FSP weldments. This work aims to study the effect of
filler metals on the microstructure and mechanical properties of GTAW welded joints of aluminum
alloy AA2024-T3.
2. Experimental Work
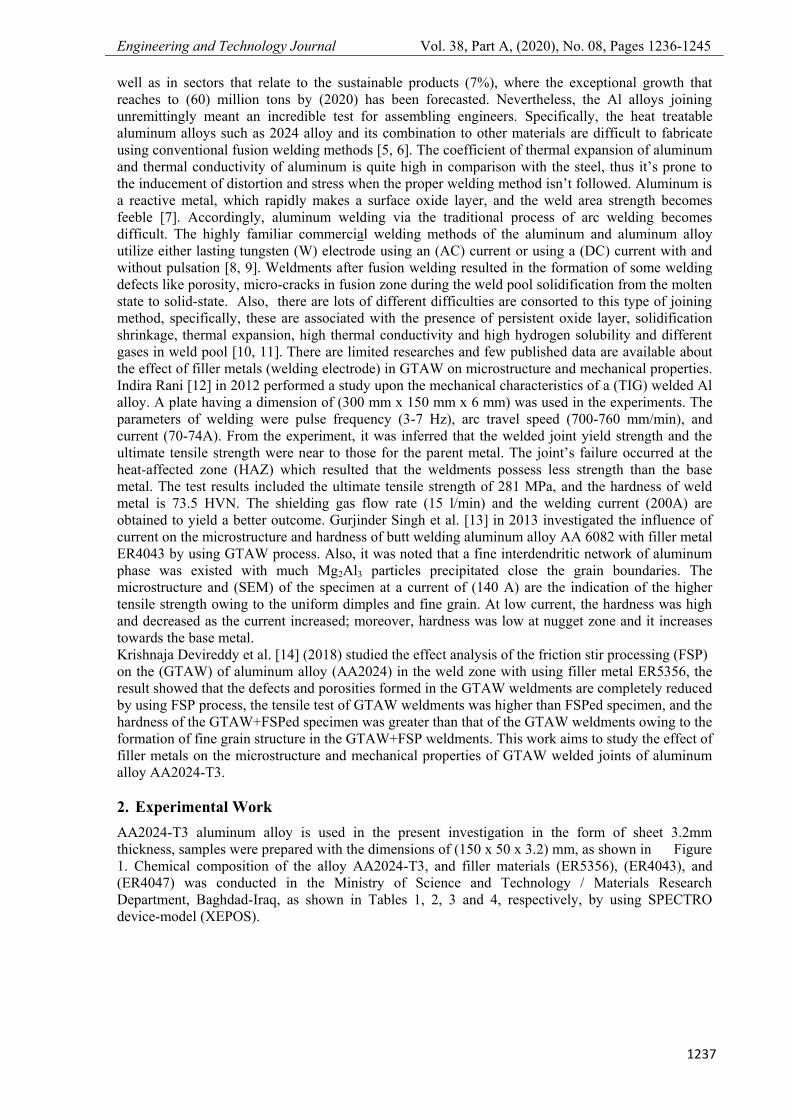
AA2024-T3 aluminum alloy is used in the present investigation in the form of sheet 3.2mm
thickness, samples were prepared with the dimensions of (150 x 50 x 3.2) mm, as shown in Figure
1. Chemical composition of the alloy AA2024-T3, and filler materials (ER5356), (ER4043), and
(ER4047) was conducted in the Ministry of Science and Technology / Materials Research
Department, Baghdad-Iraq, as shown in Tables 1, 2, 3 and 4, respectively, by using SPECTRO
device-model (XEPOS).
Engineering and Technology Journal Vol. 38, Part A, (2020), No. 08, Pages 1236-1245
1238
Table 1: Nominal and measured chemical composition of aluminum alloy AA2024-T3
Eleme
nt
wt% Cu Mg Fe Mn Si Zn Cr Ti Pb V Al
Nomin
al
value[
16]
3.8mi
n.
4.9ma
x.
1.2mi
n.
1.8ma
x.
0.
5
ma
x.
0.3mi
n.
0.9ma
x.
0.5
ma
x.
0.2
5
ma
x.
0.1
max.
0.15
max.
0.05
max.
0.05
max.
Ba
l.
Measu
red
Value 4.25 1.27
0.
33 0.507
0.1
5
0.1
5
0.00
2
0.00
1
0.02
4
0.00
9
Ba
l.
T3: Solution heat treated and cold work and naturally aged.
Table 2: Nominal and measured chemical composition of the filler wire ER5356
Elemen
t
wt% Mg Mn Si Zn Ti Fe Cu Be Cr Al
Nomina
l
value[1
6]
4.5-
5.5
0.05-
0.2
0.25
max.
0.10
max.
0.06-
0.20
0.4
max.
0.10
max
.
0.0008
max.
0.05
-0.2
Bal
.
Measur
ed
Value 5.0 0.15 0.06 0.05 0.11 0.24 0.05 0.007 0.04
Bal
.
Table 3: Nominal and measured chemical composition of the filler wire ER4043
Element
wt% Mg Mn Si Zn Ti Fe Cu Be Al
Nomina
l
value[1
6]
0.05
max.
0.05
max
4.5-
6.0
0.10
max.
0.20
max.
0.80
max.
0.30
max.
0.000
8
max.
Bal
.
Measur
ed
Value 0.014 0.038 5.0 0.083 0.014 0.21 0.26 0.005
Bal
.
Table 4: Nominal and measured chemical composition of the filler wire ER4047
Element
wt% Mg Mn Si Zn Fe Cu Be Al
Nominal
value[16
]
0.01
max.
0.15
max
11.0-
13.0
0.20
max.
0.8
max.
0.30
max.
0.0008
max. Bal.
Measure
d
Value 0.022 0.017 12.0 0.10 0.15 0.054 0.008 Bal.
Figure 1: Joint design and dimensions of sheet AA2024-T3 in (mm)
The sheets were cleaned with acetone to remove the dirt, oil, etc., and brushed with a brush having
steel wires for evacuating the layer of oxide, before the GTAW, samples were cleaned with alcohol
and dried to remove the moisture in the sheets. After removal of the oxide layer, edge preparation
Engineering and Technology Journal Vol. 38, Part A, (2020), No. 08, Pages 1236-1245
1239
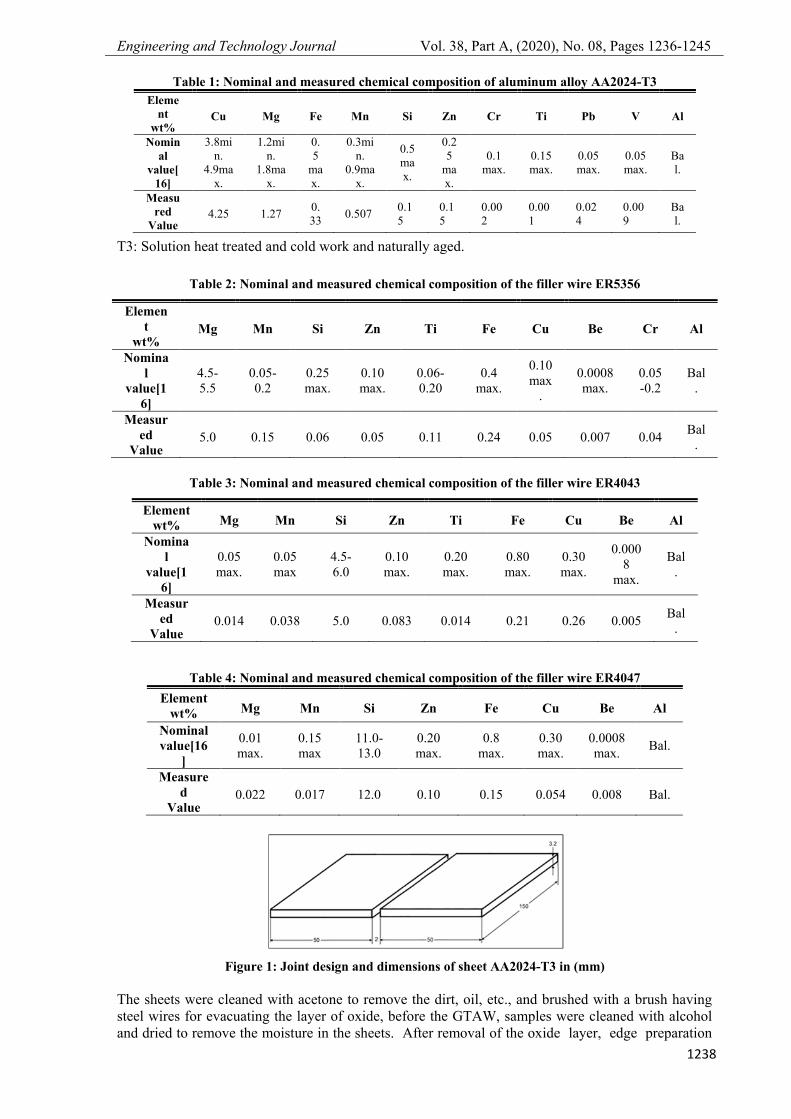
was done for making the butt joint and spaced by a gap of about (2 mm) to allow the molten filler
metal to diffuse, GTAW Syncrowave 350 LX Model Miller welding machine shown in Figure 2 was
used for the welding operation. This operation was performed via Alternating Current (AC) at a high
frequency, and the welding parameters of GTAW are shown in Table 5.
Figure 2: GTAW machine (Miller) used in this work
Table 5: Details of GTAW process used in this study
Weld characteristic Weld detail
Material type AA2024-T3
Joint type Square Butt joint
Sample dimensions 50 × 150 × 3.2 mm3
Tungsten electrode Rod type Pure tungsten(EWP)
Tungsten electrode diameter 2.4 mm
Cup Size 10 mm
Filler metal type ER5356 ER4043 ER4047
Filler rod diameter 2.4 mm 2.4 mm 2 mm
Polarity Alternating Current(AC high frequency)
Amperes Range (Amp)
100A
115A
130A
Voltage (V) 12.5-13.5V
Frequency 100Hz
Shielding gas Argon
Gas composition 99.99999
Argon shielding gas 8L/min.
Gas flow rate 17cf/h or 20psi
Post welding Gas Flow Time 10sec.
AC Balance Balance wave ( 50% Electrode positive- 50%
Electrode Negative)
Welding speed 12inches per minute
Backing Tape type (CBT-CG)Ceramic Backing Tape – Curved
Groove
TIG Setup Manual
The GTAW welded joint specimen were cut across the weld , and are prepared for the
microstructural examination as per the standard metallographic procedures. To reveal the
microstructural features, polished samples were etched with Keller's reagent (components: 95 ml
H2O , 2.5 ml HNO3, 1.5 ml HCl , and 1.0 ml HF), and then washed with water and alcohol and then
dried within an oven to remove moisture from the specimen. The microstructural analysis was
completed by an optical microscope, and the Vicker’s microhardness test was conducted via using a
digital micro-hardness tester type (Laryee, Model HVS-1000) used for hardness measurements across
Engineering and Technology Journal Vol. 38, Part A, (2020), No. 08, Pages 1236-1245
1240
the cross-section of the welds, according to the (ASTM). Microhardness tests were carried out at the
situations on the two sides of GTAW welded joint by using three filler metals. The measurement’s
reading was obtained for every distance of (1 mm). A load of 200 gm was exerted on the welded joint
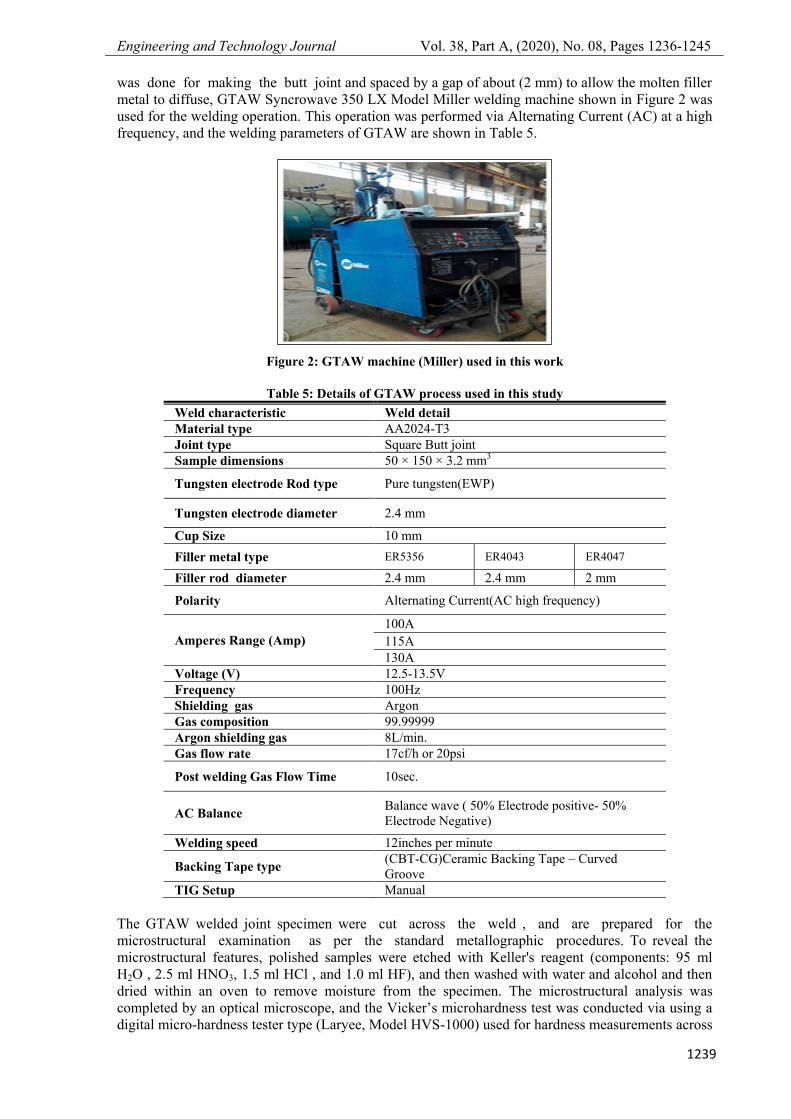
cross-section for 15 sec. The ASTM E8 standard was used for preparing the tensile samples shown in
Figure 3, by utilizing the Universal Testing Machine (WDW-200E model) available in the
Department of Production Engineering and Metallurgy. All the samples were tested at room
temperature using a crosshead speed of 0.5 mm/min to obtain reliable strengths.
Figure 3: ASTM- E8M for Tensile Test, all dimensions are in mm [16].
3. Results and Discussion I. Macro and Microstructure for GTAW welded joints
GTAW is commonly used for welding aluminum and aluminum alloys AA2024-T3 which is selected
as the base material. It is extensively used in defense, aerospace, automobiles and other industries.
AA2024-T3 contains Cu in its composition which reduces its ductility and corrosion resistance.
Hence, susceptibility to solidification cracking of Al-Cu alloy is increased. This alloy hardened by
precipitation heat treatment.
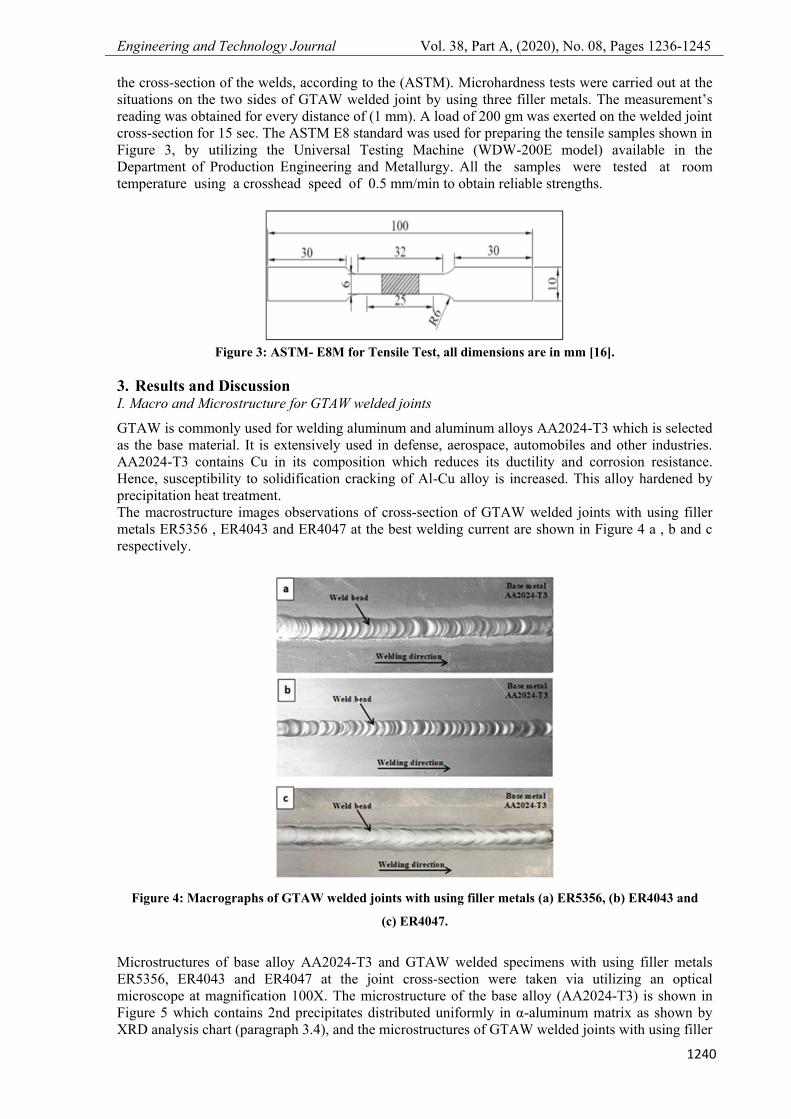
The macrostructure images observations of cross-section of GTAW welded joints with using filler
metals ER5356 , ER4043 and ER4047 at the best welding current are shown in Figure 4 a , b and c
respectively.
Figure 4: Macrographs of GTAW welded joints with using filler metals (a) ER5356, (b) ER4043 and
(c) ER4047.
Microstructures of base alloy AA2024-T3 and GTAW welded specimens with using filler metals
ER5356, ER4043 and ER4047 at the joint cross-section were taken via utilizing an optical
microscope at magnification 100X. The microstructure of the base alloy (AA2024-T3) is shown in
Figure 5 which contains 2nd precipitates distributed uniformly in α-aluminum matrix as shown by
XRD analysis chart (paragraph 3.4), and the microstructures of GTAW welded joints with using filler
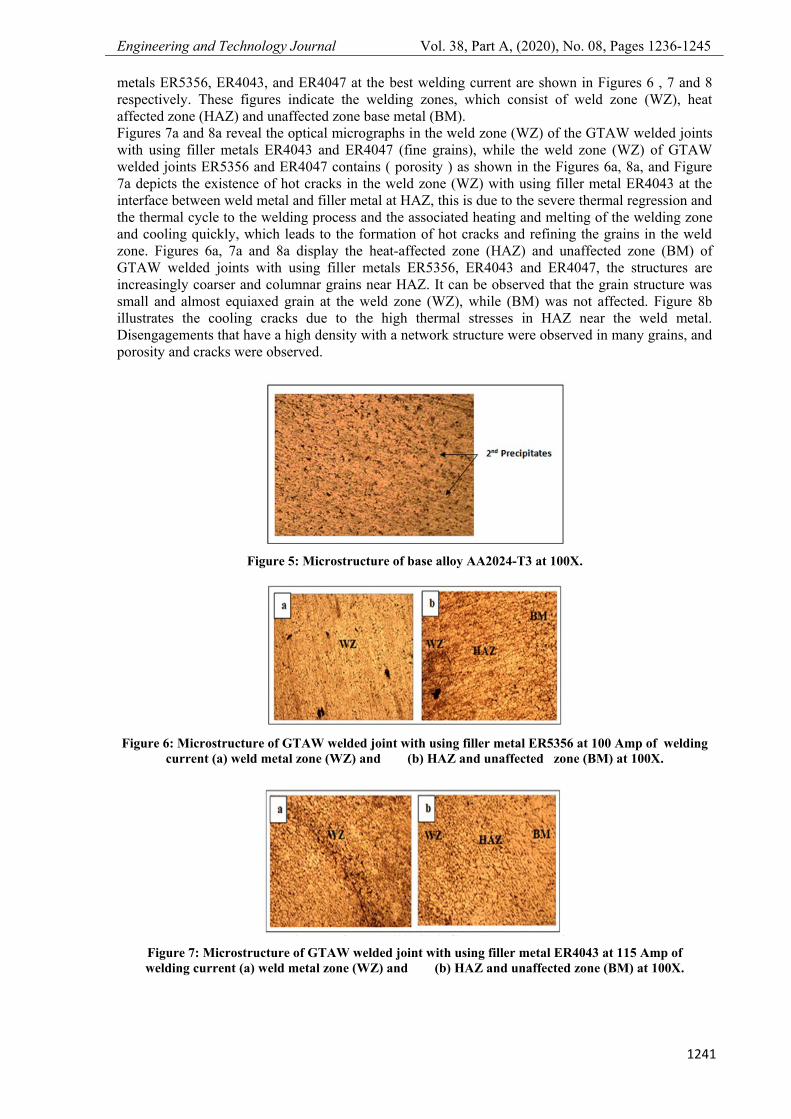
Engineering and Technology Journal Vol. 38, Part A, (2020), No. 08, Pages 1236-1245
1241
metals ER5356, ER4043, and ER4047 at the best welding current are shown in Figures 6 , 7 and 8
respectively. These figures indicate the welding zones, which consist of weld zone (WZ), heat
affected zone (HAZ) and unaffected zone base metal (BM).
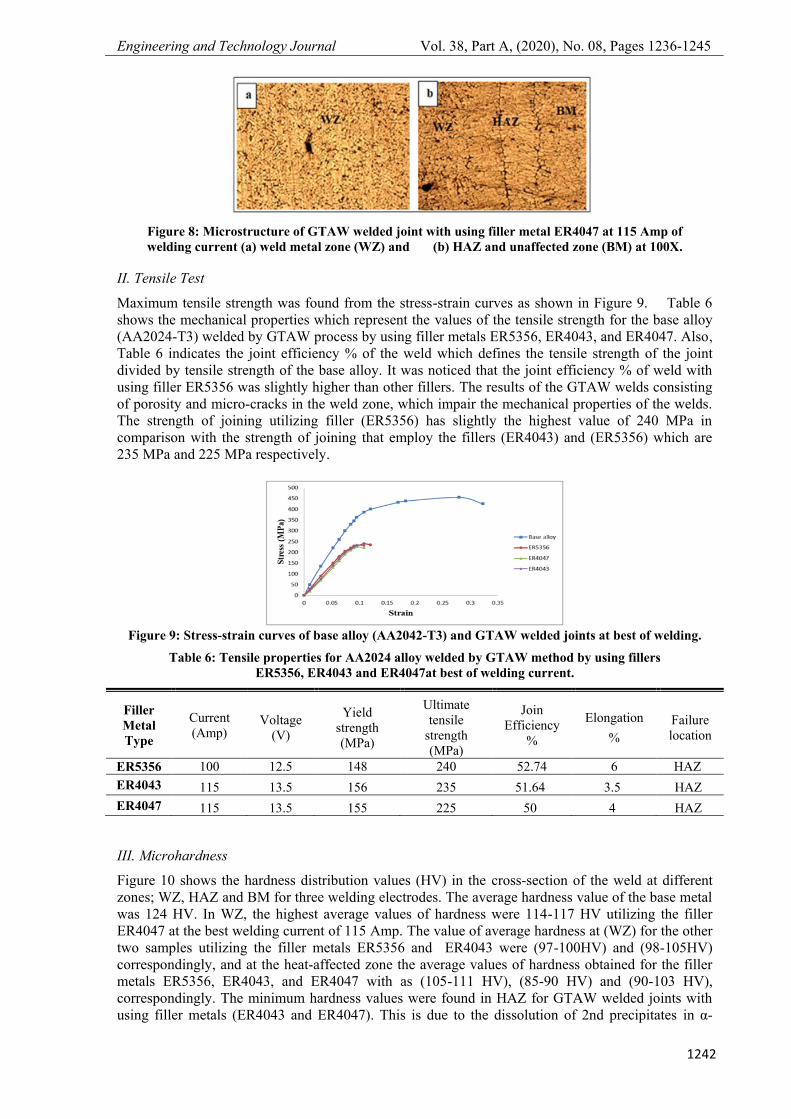
Figures 7a and 8a reveal the optical micrographs in the weld zone (WZ) of the GTAW welded joints
with using filler metals ER4043 and ER4047 (fine grains), while the weld zone (WZ) of GTAW
welded joints ER5356 and ER4047 contains ( porosity ) as shown in the Figures 6a, 8a, and Figure
7a depicts the existence of hot cracks in the weld zone (WZ) with using filler metal ER4043 at the
interface between weld metal and filler metal at HAZ, this is due to the severe thermal regression and
the thermal cycle to the welding process and the associated heating and melting of the welding zone
and cooling quickly, which leads to the formation of hot cracks and refining the grains in the weld
zone. Figures 6a, 7a and 8a display the heat-affected zone (HAZ) and unaffected zone (BM) of
GTAW welded joints with using filler metals ER5356, ER4043 and ER4047, the structures are
increasingly coarser and columnar grains near HAZ. It can be observed that the grain structure was
small and almost equiaxed grain at the weld zone (WZ), while (BM) was not affected. Figure 8b
illustrates the cooling cracks due to the high thermal stresses in HAZ near the weld metal.
Disengagements that have a high density with a network structure were observed in many grains, and
porosity and cracks were observed.
Figure 5: Microstructure of base alloy AA2024-T3 at 100X.
Figure 6: Microstructure of GTAW welded joint with using filler metal ER5356 at 100 Amp of welding
current (a) weld metal zone (WZ) and (b) HAZ and unaffected zone (BM) at 100X.
Figure 7: Microstructure of GTAW welded joint with using filler metal ER4043 at 115 Amp of
welding current (a) weld metal zone (WZ) and (b) HAZ and unaffected zone (BM) at 100X.
Engineering and Technology Journal Vol. 38, Part A, (2020), No. 08, Pages 1236-1245
1242
Figure 8: Microstructure of GTAW welded joint with using filler metal ER4047 at 115 Amp of
welding current (a) weld metal zone (WZ) and (b) HAZ and unaffected zone (BM) at 100X.
II. Tensile Test
Maximum tensile strength was found from the stress-strain curves as shown in Figure 9. Table 6
shows the mechanical properties which represent the values of the tensile strength for the base alloy
(AA2024-T3) welded by GTAW process by using filler metals ER5356, ER4043, and ER4047. Also,
Table 6 indicates the joint efficiency % of the weld which defines the tensile strength of the joint
divided by tensile strength of the base alloy. It was noticed that the joint efficiency % of weld with
using filler ER5356 was slightly higher than other fillers. The results of the GTAW welds consisting
of porosity and micro-cracks in the weld zone, which impair the mechanical properties of the welds.
The strength of joining utilizing filler (ER5356) has slightly the highest value of 240 MPa in
comparison with the strength of joining that employ the fillers (ER4043) and (ER5356) which are
235 MPa and 225 MPa respectively.
Figure 9: Stress-strain curves of base alloy (AA2042-T3) and GTAW welded joints at best of welding.
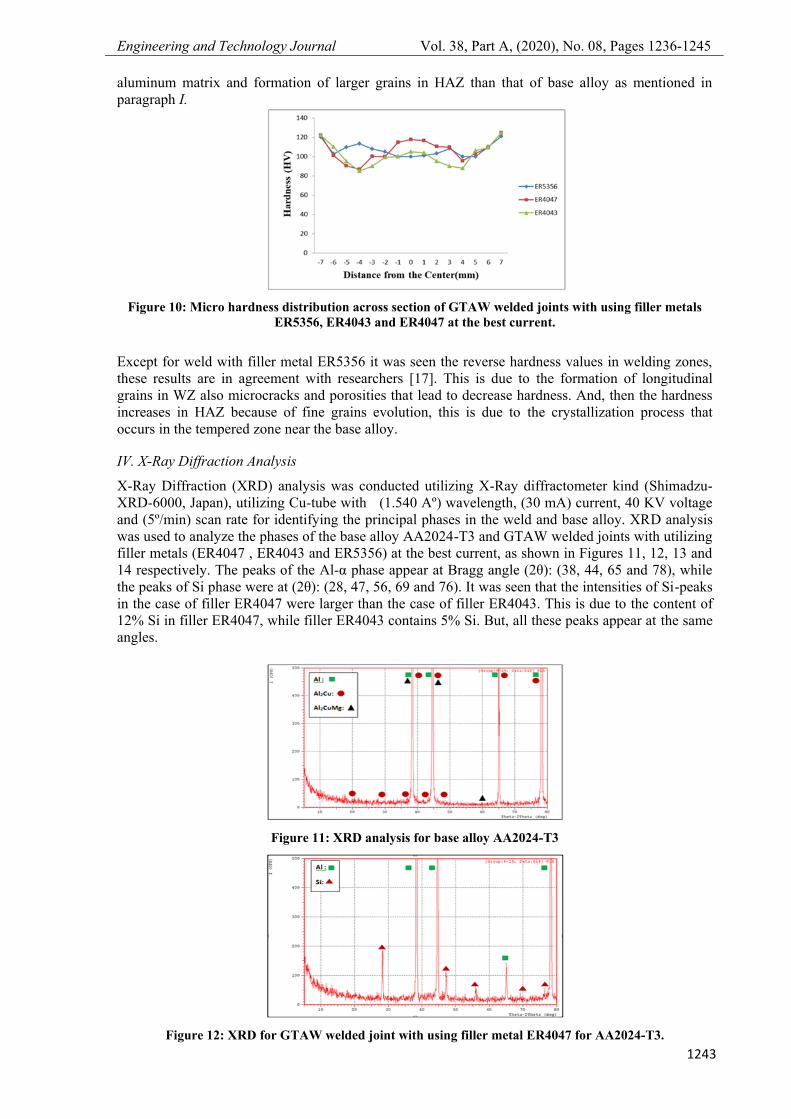
III. Microhardness
Figure 10 shows the hardness distribution values (HV) in the cross-section of the weld at different
zones; WZ, HAZ and BM for three welding electrodes. The average hardness value of the base metal
was 124 HV. In WZ, the highest average values of hardness were 114-117 HV utilizing the filler
ER4047 at the best welding current of 115 Amp. The value of average hardness at (WZ) for the other
two samples utilizing the filler metals ER5356 and ER4043 were (97-100HV) and (98-105HV)
correspondingly, and at the heat-affected zone the average values of hardness obtained for the filler
metals ER5356, ER4043, and ER4047 with as (105-111 HV), (85-90 HV) and (90-103 HV),
correspondingly. The minimum hardness values were found in HAZ for GTAW welded joints with
using filler metals (ER4043 and ER4047). This is due to the dissolution of 2nd precipitates in α-
Table 6: Tensile properties for AA2024 alloy welded by GTAW method by using fillers
ER5356, ER4043 and ER4047at best of welding current.
Filler
Metal
Type
Current
(Amp) Voltage
(V)
Yield
strength
(MPa)
Ultimate
tensile
strength
(MPa)
Join
Efficiency
%
Elongation
%
Failure
location
ER5356 100 12.5 148 240 52.74 6 HAZ
ER4043 115 13.5 156 235 51.64 3.5 HAZ
ER4047 115 13.5 155 225 50 4 HAZ
Engineering and Technology Journal Vol. 38, Part A, (2020), No. 08, Pages 1236-1245
1243
aluminum matrix and formation of larger grains in HAZ than that of base alloy as mentioned in
paragraph I.
Figure 10: Micro hardness distribution across section of GTAW welded joints with using filler metals
ER5356, ER4043 and ER4047 at the best current.
Except for weld with filler metal ER5356 it was seen the reverse hardness values in welding zones,
these results are in agreement with researchers [17]. This is due to the formation of longitudinal
grains in WZ also microcracks and porosities that lead to decrease hardness. And, then the hardness
increases in HAZ because of fine grains evolution, this is due to the crystallization process that
occurs in the tempered zone near the base alloy.
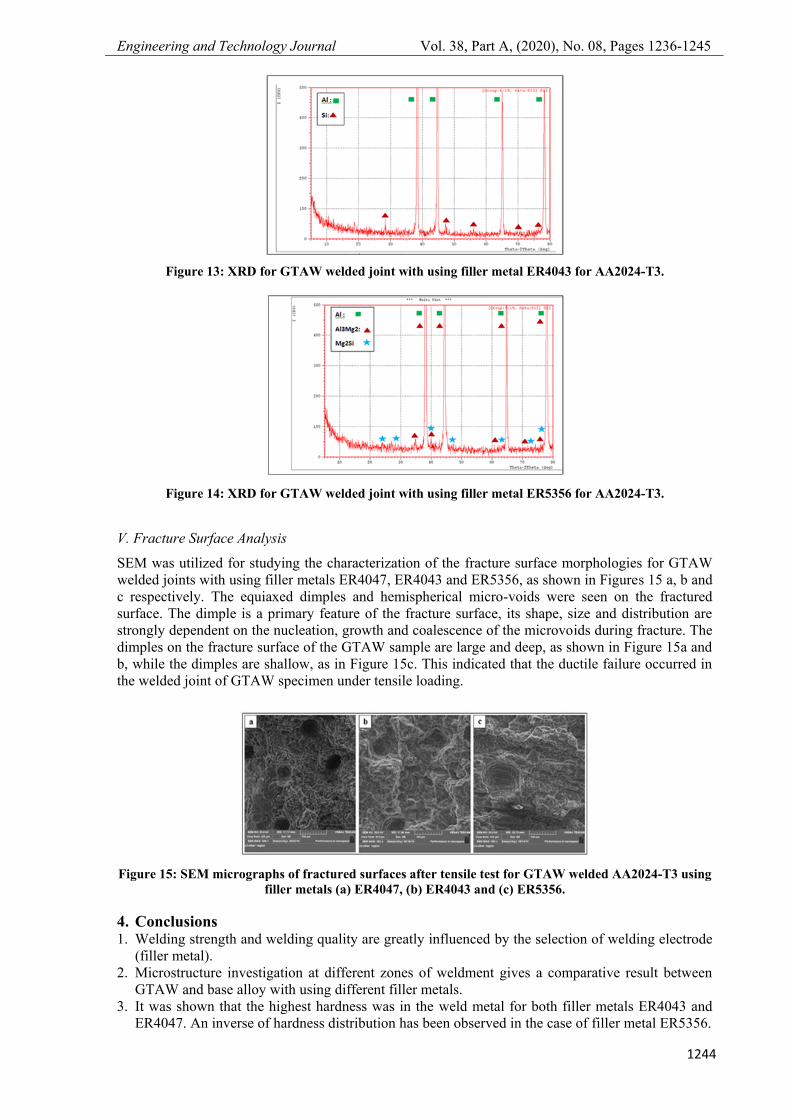
IV. X-Ray Diffraction Analysis
X-Ray Diffraction (XRD) analysis was conducted utilizing X-Ray diffractometer kind (Shimadzu-
XRD-6000, Japan), utilizing Cu-tube with (1.540 Aº) wavelength, (30 mA) current, 40 KV voltage
and (5º/min) scan rate for identifying the principal phases in the weld and base alloy. XRD analysis
was used to analyze the phases of the base alloy AA2024-T3 and GTAW welded joints with utilizing
filler metals (ER4047 , ER4043 and ER5356) at the best current, as shown in Figures 11, 12, 13 and
14 respectively. The peaks of the Al-α phase appear at Bragg angle (2θ): (38, 44, 65 and 78), while
the peaks of Si phase were at (2θ): (28, 47, 56, 69 and 76). It was seen that the intensities of Si-peaks
in the case of filler ER4047 were larger than the case of filler ER4043. This is due to the content of
12% Si in filler ER4047, while filler ER4043 contains 5% Si. But, all these peaks appear at the same
angles.
Figure 11: XRD analysis for base alloy AA2024-T3
Figure 12: XRD for GTAW welded joint with using filler metal ER4047 for AA2024-T3.
Engineering and Technology Journal Vol. 38, Part A, (2020), No. 08, Pages 1236-1245
1244
Figure 13: XRD for GTAW welded joint with using filler metal ER4043 for AA2024-T3.
Figure 14: XRD for GTAW welded joint with using filler metal ER5356 for AA2024-T3.
V. Fracture Surface Analysis
SEM was utilized for studying the characterization of the fracture surface morphologies for GTAW
welded joints with using filler metals ER4047, ER4043 and ER5356, as shown in Figures 15 a, b and
c respectively. The equiaxed dimples and hemispherical micro-voids were seen on the fractured
surface. The dimple is a primary feature of the fracture surface, its shape, size and distribution are
strongly dependent on the nucleation, growth and coalescence of the microvoids during fracture. The
dimples on the fracture surface of the GTAW sample are large and deep, as shown in Figure 15a and
b, while the dimples are shallow, as in Figure 15c. This indicated that the ductile failure occurred in
the welded joint of GTAW specimen under tensile loading.
Figure 15: SEM micrographs of fractured surfaces after tensile test for GTAW welded AA2024-T3 using
filler metals (a) ER4047, (b) ER4043 and (c) ER5356.
4. Conclusions 1. Welding strength and welding quality are greatly influenced by the selection of welding electrode
(filler metal).
2. Microstructure investigation at different zones of weldment gives a comparative result between
GTAW and base alloy with using different filler metals.
3. It was shown that the highest hardness was in the weld metal for both filler metals ER4043 and
ER4047. An inverse of hardness distribution has been observed in the case of filler metal ER5356.
Engineering and Technology Journal Vol. 38, Part A, (2020), No. 08, Pages 1236-1245
1245
4. The welded joint using filler metal ER5356 gives slightly higher tensile strength (240MPa) than
that of filler metals ER4043 and ER4047, (235MPa) and (225MPa) respectively.
5. From SEM images, it was observed that the fracture surfaces have dimples in different depths and
sizes.
References
[1] V.A. Mosneaga, T. Mizutani, T. Kobayashi and H. Toda, “Impact toughness of weldments in Al–Mg–Si
alloys”, Materials Transactions. Vol.43,No.6, pp.1381 – 1389, 2002.
[2] M. Ishak, L.H. Shah, I.S.R. Aisha, W. Hafizi and M.R. Islam, “Study of resistance spot welding between
AISI 301 stainless steel and AISI 1020 carbon steel dissimilar alloys”, Journal of Mechanical Engineering
and Sciences, Vol.6,No.1, pp.793-806, 2014.
[3] N. Karunakaran, “Effect of pulsed current on temperature distribution and characteristics of GTA welded
magnesium alloy”, IOSR Journal of Mechanical and Civil Engineering, Vol. 4, No.6, pp.1-8, 2013.
[4] J. M. Fortain and S. Gadrey, “How to select a suitable shielding gas to improve the performance of MIG
and TIG welding of aluminum alloys”, Welding International, Vol.7, No.12, pp.936-947, 2013.
[5] B. S. Yigezu, D. Venkateswarlu, M. M. Mahapatra, P. K. Jha, and N. R. Mandal, “On friction stir butt
welding of Al +12Si/10 wt% TiC in situ composite”, Materials and Design. Vol.54, pp.1019-1027, 2014.
[6] H. Aydın, A. Bayram, A. Uguz, and K. S. Akay, “Tensile properties of friction stir welded joints of 2024
aluminum alloys in different heat-treated state”, Materials and Design, Vol.30, pp. 2211-2221, 2009.
[7] A. Kumar and S. Sundarrajan, “Optimization of pulsed TIG welding process parameters on mechanical
properties of AA 5456 aluminum alloy weldments”, Journals of Science Direct (SP), Vol.30, pp.188-1297,
2008.
[8] Liu Xu-hel, Gu Shi-hai1, Wu Rui-zhi, Leng Xue-song, Yan Jiu-chun and Zhang Mi-li, “Microstructure and
mechanical properties of Mg-Li alloy after TIG welding”, Journals of Science Direct (SP), pp.477-481,
2011.
[9] L. Singh, “An Evaluation of TIG welding parametric influence on tensile strength of 5083 aluminum
alloy”, International Journal of Mechanical, Aerospace, Industrial, Mechatronic and Manufacturing
Engineering, Vol. 7, pp.1262-1265, 2013.
[10] C.H. Muralimohan, S. Haribabu, Y.H. Reddy, V. Muthupandi, and K. Sivaprasad, “Joining of AISI 1040
steel to 6082-T6 aluminum alloy by friction welding”, Journal of Advances in Mechanical Engineering
and Science, Vol.1, No.1, pp.57-64, 2015.
[11] R. P. Matrukanitz, “Selection and weldability of heat-treatable aluminum alloys”, ASM Handbook-
Welding, Brazing and Soldering, Ohio: ASM International, Vol. 6, 1990.
[12] Indira Rani, “Effect of Pulsed current TIG welding parameters on mechanical properties of J-joint strength
of AA6351”, The International Journal of Engineering and Science (IJES), Vol.1, No.1, pp. 2319-1805,
2012.
[13] S. Gurjinder, K. Sunil and S. Amrik, “Influence of current on microstructure and hardness of butt welding
aluminum AA6082 using GTAW process”, International Journal of Research in Mechanical Engineering
& Technology International (IJRMET) Vol. 3, Issue 2, pp.143-146, 2013.
[14] D. Krishnaja, D. Venkateswarlu, C. Muralimohan and B. K. Kumar, “Analysis of the influence of friction
stir processing on gas tungsten Arc welding of 2024 aluminum alloy weld zone”, Vol. 8, No.1, pp. 243-
252, 2018.
[15] ASM Handbook, “Properties and selection: nonferrous alloys and special-purpose materials”, American
society for Metals, Vol. 2, pp.1328, 1990.
[16] “Standard test methods for tension testing of metallic materials”, ASTM E-8, American Association State,
2010.
[17] M. K. Abbass and H. H. Abd, “A comparison study of mechanical properties between friction stir welding
and TIG welded joints of aluminum alloy (Al 6061-T6)”, Engineering and Technology Journal. Vol. 31,
No.14, pp. 2701-2715, 2013.