Embed Size (px)
DESCRIPTION
Exergy analysis is performed based on the first and secondlaws of thermodynamics for power generation systems and The engineering design is based on inlet air-cooling and natural gas preheating for increasing the net power output and efficiency.
Citation preview
� Corresponding author. PreseSec. 1, Taipei, Taiwan, 106, ROCE-mail address: [email protected]
0360-5442/$ - see front matter #doi:10.1016/j.energy.2004.02.027
nt address: Pacific Engineers & Constructors, Ltd., 6th Fl., 3. Tel.: +886-227-558-093; fax: +886-227-022-557.m.tw (D.-C. Sue).
2004 Elsevier Ltd. All rights reserved.
Energy 29 (2004) 1183–1205
www.elsevier.com/locate/energy
Engineering design and exergy analyses for combustiongas turbine based power generation system
Deng-Chern Sue �, Chia-Chin Chuang
Institute of Mechanical and Electrical, National Taipei University of Technology, Taiwan
Received 5 September 2002
Abstract
This paper presents the engineering design and theoretical exergetic analyses of the plant for combustiongas turbine based power generation systems. Exergy analysis is performed based on the first and secondlaws of thermodynamics for power generation systems. The results show the exergy analyses for a steamcycle system predict the plant efficiency more precisely. The plant efficiency for partial load operation islower than full load operation. Increasing the pinch points will decrease the combined cycle plantefficiency. The engineering design is based on inlet air-cooling and natural gas preheating for increasingthe net power output and efficiency. To evaluate the energy utilization, one combined cycle unit and onecogeneration system, consisting of gas turbine generators, heat recovery steam generators, one steamturbine generator with steam extracted for process have been analyzed. The analytical results are used forengineering design and component selection.# 2004 Elsevier Ltd. All rights reserved.
Keywords: Exergy; Gas turbine; Inlet air-cooling; Natural gas preheating; Combined cycle
1. Introduction
Studies of engineering designs and exergy analyses for power generation systems are of scien-
tific interest and also essential for the efficient utilization of energy resources. For this reason,
the exergy analysis has drawn much attention by scientists and system designers in recent years.
Some devoted their studies [1,2] to component exergy analyses [3] and efficiency improvement;
others concentrate on systems design and analyses [4–8].
25 Tun Hua S. Road,
Nomenclature
Bf fuel exergy (kJ/s)Bp process heat exergy (kJ/s)e exergy (kJ/kg)ef fuel exergy factores steam/water heat exergy factorEf fuel energy (kJ/s)H enthalpy (kJ/s)h enthalpy of produced steam/water (kJ/kg)hc enthalpy of feed water return to HRSG (kJ/kg)ma mass flow rate of air (kg/s)mf mass flow rate of fuel (kg/s)me mass flow rate of exhaust flue gas (kg/s)ms mass flow rate of steam/water (kg/s)msH mass flow rate of high-pressure steam (kg/s)msL mass flow rate of low-pressure steam (kg/s)p pressure absolute (MPa)Qp process heat ¼ Ho �Hi (kJ/s)R power-to-heat ratios entropy (kJ/kg
vC)
T temperature (vC)
To atmospheric temperature (vC)
WE electrical gross power output of plant (kW)WGT gas turbines gross power output (kW)WST steam turbine gross power output (kW)gCC thermal efficiency for combined cycle plantgGT thermal efficiency for gas turbinegHRSG thermal efficiency for heat recovery steam generatorgST thermal efficiency for steam cyclegRankinethermal efficiency for Rankine cycleg1st first law efficiencyg2nd second law efficiency
Subscript
i inleto outlet
Abbreviation
CCPP combined cycle power plantCP condensate pumpGTG gas turbine generator
D.-C. Sue, C.-C. Chuang / Energy 29 (2004) 1183–12051184
HP high pressureHRSG heat recovery steam generatorHT heaterISO International Standards OrganizationLP low pressureLHV lower heating valueMSL mean sea levelRH relative humiditySC simple cycleSTG steam turbine generator
1185D.-C. Sue, C.-C. Chuang / Energy 29 (2004) 1183–1205
A computerized thermodynamic analyses of a gas turbine based combined cycle power plant(CCPP) fitted with a triple pressure HRSG and hot reheat foresees the efficiency reaching a valueof 62% [4]. Huang [5] shows that the performance evaluation of a CCPP based only on the firstlaw of thermodynamics is not adequate, but the second law of thermodynamics must betaken into consideration to get a better evaluation. Verkhivker and Kosoy [6] pointed outthe principal processes which cause the destruction of exergy in a power generation cycle arethe combustion process, the subsequent heating of the working fluid and the heat transfer inthe heat exchangers. For a combined triple (Brayton/Rankine/Rankine)/(gas/steam/ammonia) power cycle, Marrero et al. [7] also confirms that the largest irreversibility is pro-duced in the combustion process. It decreases with the increase of the gas turbine inlet tem-perature. Parametric studies performed by Bilgen [8] show that the first law and second lawefficiencies are decreased with the increase of the power-to-heat ratio. The first law efficiencyis strongly related to the power-to-heat ratio in a cogeneration plant. The efficiency isreduced around 40% when the power-to-heat ratio increases from 1 to 20. On the otherhand, the second law efficiency is degraded only about 2% when the power-to-heat ratioincreases from 1 to 20. It complies with the second law of thermodynamics—work is thevaluable commodity of a power plant. Work can be completely and continuously convertedto heat. Heat is not completely converted to work in a cycle.
For engineering and system design, gas turbines are the main power producers in the CCPP,and great progress has been made in recent decades to enhance the efficiency of gas turbines. Onthe other hand, researchers also look for methods to improve the power output and thermalefficiency of already installed gas turbines. System modifications can include cooling the com-pressor inlet air and preheating of the fuel gas. Such modifications have been applied to somepower plants installed in Taiwan [9,10]. Power output and efficiency enhancement methods pro-posed in the past years [9–12] include mechanical refrigeration or absorption chillers for coolingthe inlet air entering the compressor, preheating the fuel gas, and lastly, supplemental firing ofthe HRSG to increase the steam turbine power output. The related literature [11] shows thatCCPP performance is strongly related to the temperature of the ambient air drawn into the gasturbine compressor inlet. Gas turbines typically produce 20% more power when supplied withambient air at a temperature of 7.2
vC than at 35
vC [12]. Although the benefit of inlet air-
cooling for CCPP has been explored in many investigations, we still need to consider the specific
D.-C. Sue, C.-C. Chuang / Energy 29 (2004) 1183–12051186
climatic data and the gas turbine unit characteristic to assess the benefits for individual powerplants. Additionally, several CCPPs in Taiwan are designed with a natural gas (NG) preheatingsystem to improve the efficiency. Flue gas heat energy is recovered to preheat the NG. Thisenergy recovery decreases the flue gas exhaust temperature by only 3
vC, keeping the flue gas
higher than its dew point. Therefore, the steam turbine power output will not be affected. How-ever, such an application has seldom been discussed in related studies.
The power generation industry in Taiwan, at the end of year 2001, had the total installedcapacity of about 30,203 MW. Statistical data [13] reveal that the capacity provided by CCPP is21.1% (6367 MW) of this capacity. Also, the CCPP share will continue to expand, reaching anestimated 34.5% (14,294 MW), raising Taiwan’s total installed capacity to an estimated 41,428MW in the coming 10 years. Of the projected increase, around 70% will be CCPP installations.In addition, other predictions indicate that over 50% of new power plants in America will beCCPP installations [14]. Therefore, the power producers are interested in power output andefficiency improvement technologies for these CCPPs.
This study investigates the gas turbine based power generation systems, and the exergy analy-ses are compared with the CCPP operating data for engineering design improvement. Then, theengineering designs and analyses for compressor inlet air-cooling and fuel gas preheating sys-tems are presented to study the feasibility of the two approaches to gain gas turbine power out-put and efficiency improvement in operating power plants.
2. Power plants description
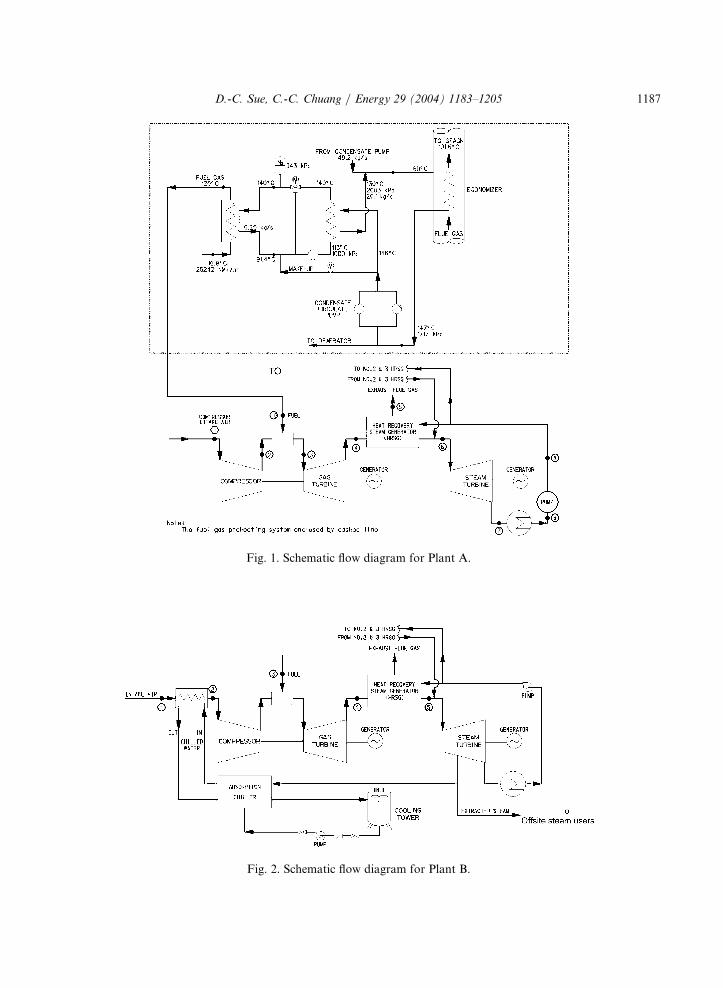
To analyze the engineering system design and enhance gas turbine performance, two differentpower plants were selected to perform the experiments in this study. The first one is combinedcycle Plant A; the other one is cogeneration Plant B. Fig. 1 illustrates the schematic flow dia-gram for Plant A; Fig. 2 shows the schematic flow diagram for Plant B. Plant B is not equippedwith NG preheating. The processes for Plants A and B are similar when no steam is extractedfor offsite steam users from the Plant B steam turbine. These plants are briefly described inTable 1.
Taiwan is located in a sub-tropical zone; the temperature difference between summer and win-ter is moderate. However, the power output decreases when operated in the warmer ambient airconditions due to the lower air mass flow rate.
2.1. Gas turbine design information
The gas turbines information of Plants A and B are presented in Table 2.Normally, the gas turbine manufacturers quote performance based on ISO and LHV con-
ditions. ISO conditions mean 15vC ambient air temperature, 101.325 kPa barometric pressure,
and 60% relative humidity. LHV means the lower heating value of the fuel being used. ASTMD3588 is the method used to determine the lower heating value of the NG fuel supplied to bothPlants A and B.
1187D.-C. Sue, C.-C. Chuang / Energy 29 (2004) 1183–1205
Fig. 2. Schematic flow diagram for Plant B.
Fig. 1. Schematic flow diagram for Plant A.
D.-C. Sue, C.-C. Chuang / Energy 29 (2004) 1183–12051188
TD
P
C
TSAHADPAC
3. Results and discussion
3.1. Exergy analyses of CCPP
A CCPP as shown in Fig. 1 includes both the Brayton cycle and Rankine cycle. It joins oper-
ation of the gas turbine at the ‘‘hot end’’ and the steam turbine at the ‘‘cold end.’’ The scale
diagram of temperature vs. entropy for Plant A is plotted on Fig. 3. Referring to Figs. 1 and 3,
gas turbine operates on the Brayton Cycle, i.e., intake air is compressed nearly isentropically
from point 1 to 2, combusted at constant pressure from point 2 to 3, and then expanded nearly
isentropically in the gas turbine from point 3 to 4, exhausting gas from point 4 to 5. The
Brayton cycle as applied to a gas turbine is an open cycle, temperature at point 5 is higher than
100vC and does not form a closed loop with the inlet air of point 1. For the Rankine cycle,
points 9 to 6 shown on Fig. 3 are a heating process at constant pressure (pressure drop is shown
Table 2Gas turbine design information for Plants A and B
Type
Plant A Plant BHeavy duty A
ero derivativeNo. of compressor stages per GTG
17 1 9 (14 HP þ 5 LP) No. of turbine stages per GTG 4 7 (2 HP þ 5 LP) No. of shaft per GTG 1 2 Shaft rotor Solid H ollow concentric Shaft speed (rpm) 3600 H P ¼ 10; 000;LP ¼ 3; 600 No. of combustors 2 1 annular No. of burners per combustor 6 3 0 Compression ratio of GT 10.2 2 9.4able 1escription of Plants A and B
lant type P
lant A Plant B5 combined cycle units
1 cogeneration cycle unitsombination 3
GTGs þ 3 HRSGs þ 1 STG 3 aero derivative GTGs þ3 HRSGs þ 1 STGotal installed capacity (MW) 2
200 150 þ 45 ton=h steam ite elevation (meter above MSL) 4 138 nnual average RH (%) 8 0 78.5 ighest/lowest daily T (vC) 3
5.4/7.4 38/6verage annual T (vC) 2
5.1 22.3esign condition (vC and %RH) 3
2% and 90% 32% and 90%reheated fuel gas T (vC) 1
20 N/Air inlet cooling T (vC) N
/A 5:5 þ 0:5ommercially operated date J
anuary 1999 January 2000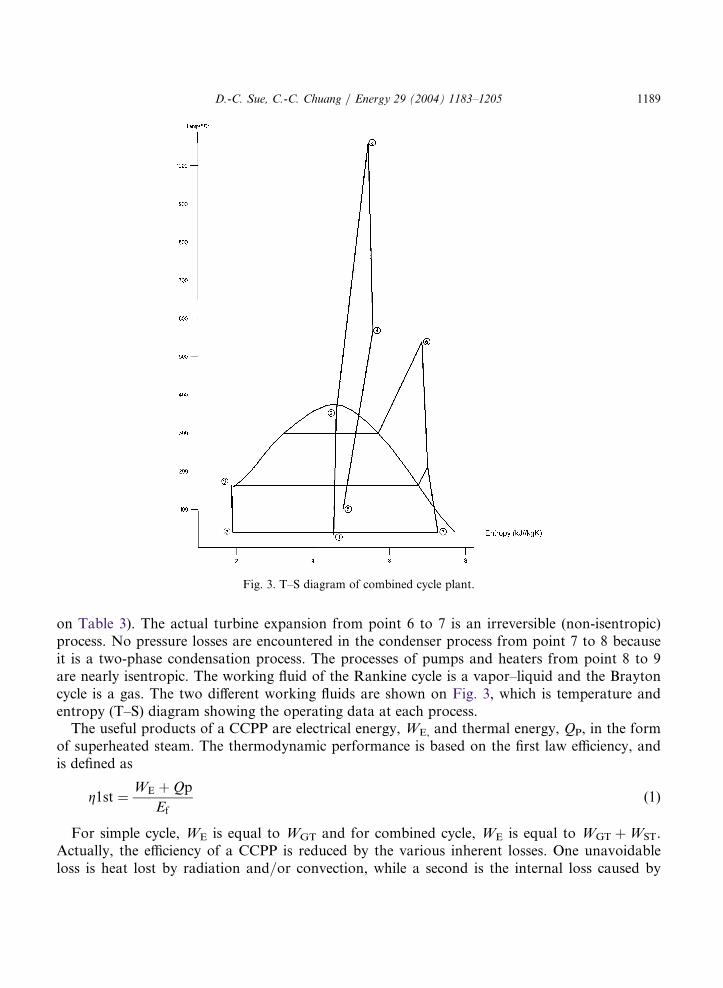
1189D.-C. Sue, C.-C. Chuang / Energy 29 (2004) 1183–1205
on Table 3). The actual turbine expansion from point 6 to 7 is an irreversible (non-isentropic)process. No pressure losses are encountered in the condenser process from point 7 to 8 becauseit is a two-phase condensation process. The processes of pumps and heaters from point 8 to 9are nearly isentropic. The working fluid of the Rankine cycle is a vapor–liquid and the Braytoncycle is a gas. The two different working fluids are shown on Fig. 3, which is temperature andentropy (T–S) diagram showing the operating data at each process.
The useful products of a CCPP are electrical energy, WE, and thermal energy, QP, in the formof superheated steam. The thermodynamic performance is based on the first law efficiency, andis defined as
g1st ¼ WE þQp
Ef(1)
For simple cycle, WE is equal to WGT and for combined cycle, WE is equal to WGT þWST.Actually, the efficiency of a CCPP is reduced by the various inherent losses. One unavoidableloss is heat lost by radiation and/or convection, while a second is the internal loss caused by
Fig. 3. T–S diagram of combined cycle plant.
Table
3Exer
gy
analy
ses
for
stea
mcy
cle
ofPla
ntA
(100%
pow
eroutp
ut)
Equip
men
tD
esig
nco
nditio
ns
M(k
g/s)
T(v
C)
P(M
Pa)
h(k
J/kg)H
(kJ/
s)Q
p(k
J/s)
s (kJ/
kg.K
)e
(kJ/
kg)B
p(k
J/s)
P Bp
(kJ/
s)
HR
SG
HP
i136.2
58
158.1
13.0
25
674.8
91,9
47
383,8
39
1.9
096
92.3
712,5
86
�194,1
70
o136.2
58
538
8.0
04
3491.8
475,7
86
6.8
418
1405.1
191,4
56
LP
i23.3
62
155.9
1.0
91
658.2
15,3
77
51,7
09
1.9
011
78.3
61831
o23.3
62
210.1
0.6
01
2871.6
67,0
86
7.0
108
733.2
817,1
31
STG
HP
i136.2
58
536.3
7.6
04
3491.8
475,7
86
180,4
26
6.8
643
1398.2
190,5
16
198,0
40
LP
i20.9
11
208.8
0.5
42
2871.7
60,0
50
7.0
573
719.2
215,0
40
ST
o156.8
140
0.0
074
2266.5
355,4
10
7.2
740
47.9
37516
Con-
den
ser
i156.8
140.1
0.0
074
2267
355,4
88
329,1
31
7.2
740
48.4
37594
8699
o157.1
69
40.1
0.0
074
167.7
26,3
57
0.5
729
�7.0
3�
1105
CP
i157.1
69
40.1
0.0
074
167.7
26,3
57
267
0.5
729
�7.0
3�
1105
�190
o157.1
69
40.2
1.2
0169.4
26,6
24
0.5
745
�5.8
2�
915
HT
LP
i2.4
51
209.3
0.5
65
2871.6
7038
71272
7.0
386
724.8
1776
�11,5
35
Cond
i157.1
69
40.2
1.2
0169.4
26,6
24
0.5
745
�5.8
2�
915
FW
o159.6
2155.8
0.5
55
657.4
104,9
34
1.9
008
77.6
612,3
96
FP
HP
i136.2
58
155.8
0.5
55
657.4
89,5
76
2371
1.9
008
77.6
610,5
82
�2021
o136.2
58
158.1
13.0
25
674.8
91,9
47
1.9
096
92.3
712,5
86
LP
i23.3
62
155.8
0.5
55
657.4
15,3
58
19
1.9
008
77.6
61814
o23.3
62
155.9
1.0
91
658.2
15,3
77
1.9
011
78.3
61831
Note
:(1
)T
o¼
32
vC¼
305
K:
(2)e
isca
lcula
ted
from
Eq.(2
),B
P—
exer
gy
isca
lcula
ted
from
Eq.(3
)of2nd
law
.
D.-C. Sue, C.-C. Chuang / Energy 29 (2004) 1183–12051190
1191D.-C. Sue, C.-C. Chuang / Energy 29 (2004) 1183–1205
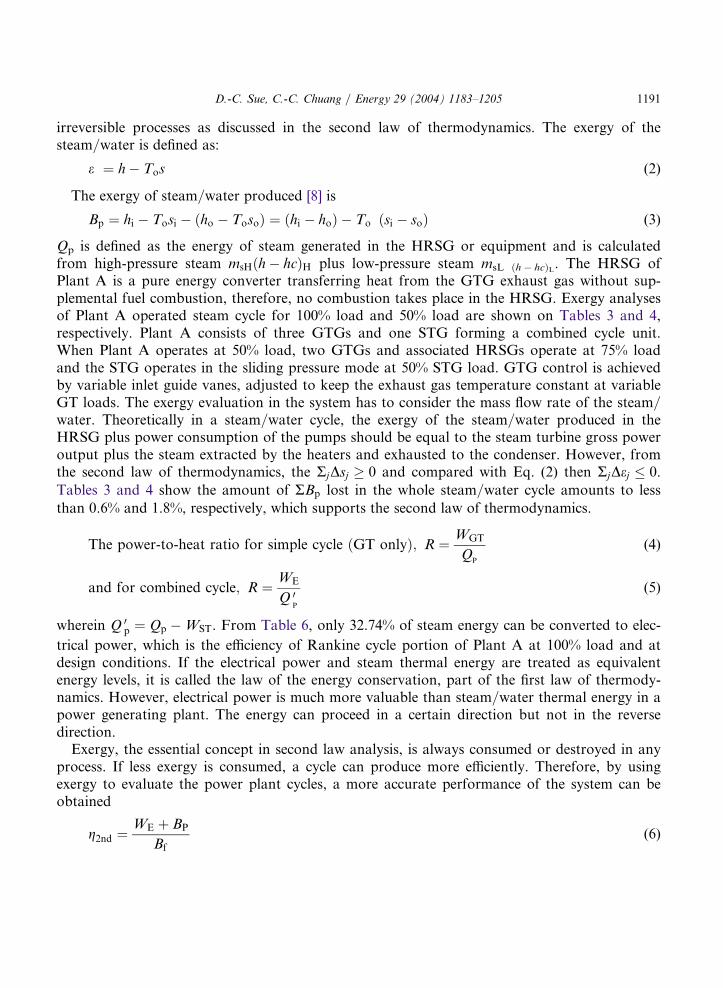
irreversible processes as discussed in the second law of thermodynamics. The exergy of thesteam/water is defined as:
e ¼ h� Tos (2)
The exergy of steam/water produced [8] is
Bp ¼ hi � Tosi � ðho � TosoÞ ¼ ðhi � hoÞ � To ðsi � soÞ (3)
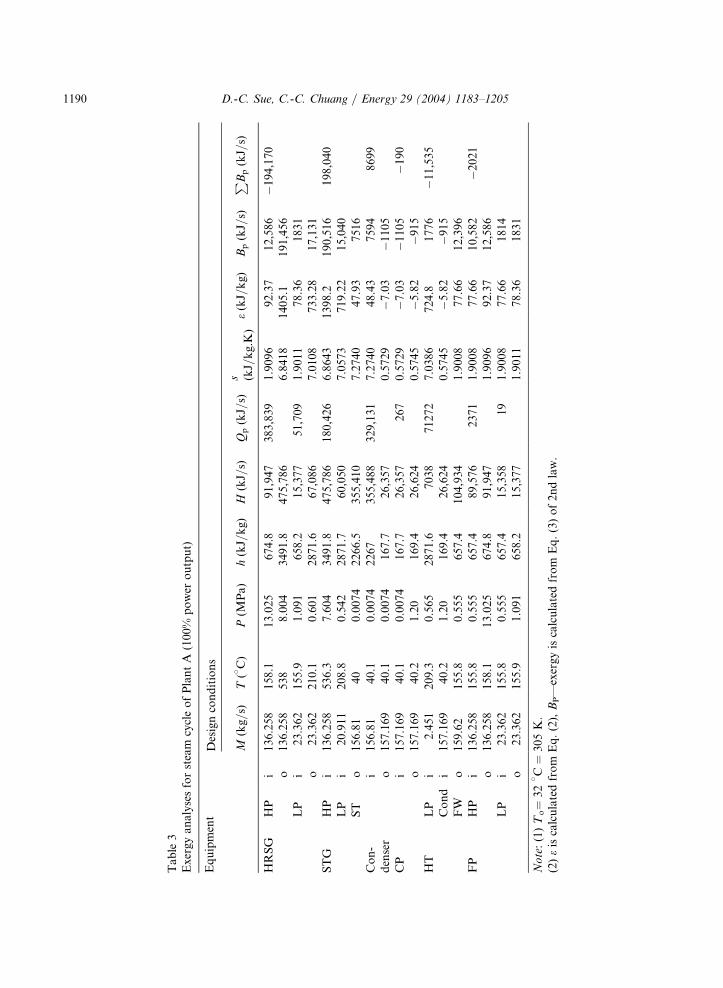
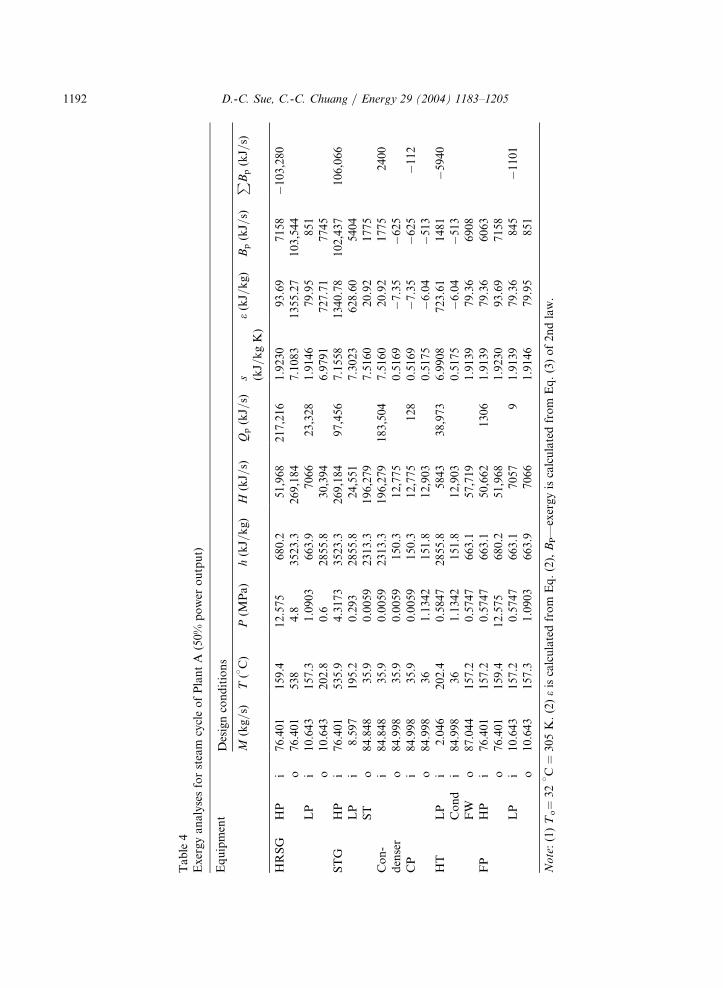
Qp is defined as the energy of steam generated in the HRSG or equipment and is calculatedfrom high-pressure steam msHðh� hcÞH plus low-pressure steam msL ðh� hcÞL. The HRSG ofPlant A is a pure energy converter transferring heat from the GTG exhaust gas without sup-plemental fuel combustion, therefore, no combustion takes place in the HRSG. Exergy analysesof Plant A operated steam cycle for 100% load and 50% load are shown on Tables 3 and 4,respectively. Plant A consists of three GTGs and one STG forming a combined cycle unit.When Plant A operates at 50% load, two GTGs and associated HRSGs operate at 75% loadand the STG operates in the sliding pressure mode at 50% STG load. GTG control is achievedby variable inlet guide vanes, adjusted to keep the exhaust gas temperature constant at variableGT loads. The exergy evaluation in the system has to consider the mass flow rate of the steam/water. Theoretically in a steam/water cycle, the exergy of the steam/water produced in theHRSG plus power consumption of the pumps should be equal to the steam turbine gross poweroutput plus the steam extracted by the heaters and exhausted to the condenser. However, fromthe second law of thermodynamics, the RjDsj � 0 and compared with Eq. (2) then RjDej � 0.
Tables 3 and 4 show the amount of RBp lost in the whole steam/water cycle amounts to less
than 0.6% and 1.8%, respectively, which supports the second law of thermodynamics.
The power-to-heat ratio for simple cycle ðGT onlyÞ; R ¼ WGT
QP
(4)
and for combined cycle; R ¼ WE
Q 0P
(5)
wherein Q 0p ¼ Qp �WST. From Table 6, only 32.74% of steam energy can be converted to elec-
trical power, which is the efficiency of Rankine cycle portion of Plant A at 100% load and atdesign conditions. If the electrical power and steam thermal energy are treated as equivalentenergy levels, it is called the law of the energy conservation, part of the first law of thermody-namics. However, electrical power is much more valuable than steam/water thermal energy in apower generating plant. The energy can proceed in a certain direction but not in the reversedirection.
Exergy, the essential concept in second law analysis, is always consumed or destroyed in anyprocess. If less exergy is consumed, a cycle can produce more efficiently. Therefore, by usingexergy to evaluate the power plant cycles, a more accurate performance of the system can beobtained
g2nd ¼ WE þ BP
Bf(6)
Table
4Exer
gy
analy
ses
for
stea
mcy
cle
ofPla
ntA
(50%
pow
eroutp
ut)
Equip
men
tD
esig
nco
nditio
ns
M(k
g/s)
T(v
C)
P(M
Pa)
h(k
J/kg)H
(kJ/
s)Q
p(k
J/s)
s (kJ/
kg
K)
e(k
J/kg)B
p(k
J/s)
P Bp
(kJ/
s)
HR
SG
HP
i76.4
01
159.4
12.5
75
680.2
51,9
68
217,2
16
1.9
230
93.6
97158
�103,2
80
o76.4
01
538
4.8
3523.3
269,1
84
7.1
083
1355.2
7103,5
44
LP
i10.6
43
157.3
1.0
903
663.9
7066
23,3
28
1.9
146
79.9
5851
o10.6
43
202.8
0.6
2855.8
30,3
94
6.9
791
727.7
17745
STG
HP
i76.4
01
535.9
4.3
173
3523.3
269,1
84
97,4
56
7.1
558
1340.7
8102,4
37
106,0
66
LP
i8.5
97
195.2
0.2
93
2855.8
24,5
51
7.3
023
628.6
05404
ST
o84.8
48
35.9
0.0
059
2313.3
196,2
79
7.5
160
20.9
21775
Con-
den
ser
i84.8
48
35.9
0.0
059
2313.3
196,2
79
183,5
04
7.5
160
20.9
21775
2400
o84.9
98
35.9
0.0
059
150.3
12,7
75
0.5
169
�7.3
5�
625
CP
i84.9
98
35.9
0.0
059
150.3
12,7
75
128
0.5
169
�7.3
5�
625
�112
o84.9
98
36
1.1
342
151.8
12,9
03
0.5
175
�6.0
4�
513
HT
LP
i2.0
46
202.4
0.5
847
2855.8
5843
38,9
73
6.9
908
723.6
11481
�5940
Cond
i84.9
98
36
1.1
342
151.8
12,9
03
0.5
175
�6.0
4�
513
FW
o87.0
44
157.2
0.5
747
663.1
57,7
19
1.9
139
79.3
66908
FP
HP
i76.4
01
157.2
0.5
747
663.1
50,6
62
1306
1.9
139
79.3
66063
o76.4
01
159.4
12.5
75
680.2
51,9
68
1.9
230
93.6
97158
LP
i10.6
43
157.2
0.5
747
663.1
7057
91.9
139
79.3
6845
�1101
o10.6
43
157.3
1.0
903
663.9
7066
1.9
146
79.9
5851
Note
:(1
)T
o¼
32
vC¼
305
K.(2
)e
isca
lcula
ted
from
Eq.(2
),B
P—
exer
gy
isca
lcula
ted
from
Eq.(3
)of2nd
law
.
D.-C. Sue, C.-C. Chuang / Energy 29 (2004) 1183–12051192
1193D.-C. Sue, C.-C. Chuang / Energy 29 (2004) 1183–1205
The exergy factor of generated steam/water (es) and the exergy factor of fuel input (ef ) can beexpressed as follows:
es ¼BP
QP(7)
ef ¼Bf
Ef¼ 1 (8)
[5]. Substituting in Eq. (6)
g2nd ¼ WE þ esQP þQP QP
efEf¼ WE þQP þ ðes 1ÞQP
efEf¼ g1st
ef1 þ ef
g1st
hðes 1ÞQPÞ
efEf
� �
¼ g1st
ef
WE þ BP
g1stEf
� �¼ g1st
ef
Rþ es
Rþ 1
� �(9)
3.1.1. Brayton cycle theoretical efficiencyThe ideal Brayton cycle is composed of two adiabatic–reversible (isentropic) and two constant
pressure processes (as shown in Fig. 3). The theoretical Plant A GTG efficiency (gGT) at ISOconditions with a flue gas inlet temperature of 1060
vC and exhaust temperature of 556.4
vC is
37.78%. This theoretical efficiency is 5.39% higher than the actual gas turbine operatingefficiency of 32.39% due to the mechanical losses and non-isentropic processes existing in theoperation.
3.1.2. Rankine cycle theoretical efficiencyThe conditions of the steam generated from the HRSG will affect the steam cycle efficiency.
The Rankine cycle of the steam turbine for Plant A utilizes steam as a working fluid and thecondenser as a heat rejection reservoir, operating at constant pressure. Assume the turbineexpansion and the feed water pumping processes are isentropic. The Rankine cycle efficiency isdefined as the turbine work (enthalpy difference between the steam at the turbine inlet and atthe turbine exhaust outlet) divided by the inlet steam enthalpy. The ideal Rankine cycleefficiency for Plant A with superheated dual pressure steam conditions is 38.37% at a condenserpressure of 0.0074 MPa.
Three cases of inlet steam conditions are analyzed, two at different saturated steam pressures of7.604 and 0.542 MPa and one with superheated steam at 7.604 MPa and 536.3
vC to evaluate the
Rankine cycle efficiency as shown in Table 5. All three cases supply single pressure steam to theturbine. Using superheated steam (7.604 MPa and 536.3
vC) definitely promotes a higher steam
cycle thermal efficiency of 3.41% and 16.2% over using saturated steam at 7.604 and 0.542 MPapressure, respectively. Similarly, a higher saturated steam at 7.604 MPa pressure has 12.79% betterefficiency than the lower pressure saturated steam at 0.542 MPa due to its higher temperature.
Plant A is a dual pressure steam cycle, with the HP steam conditions the same as the super-heated steam of the single pressure case and the LP steam flow is 15% of the total steam flow ofthe cycle. But, the Plant A efficiency of 38.37% is 2.44% lower than the theoretical efficiencywhen using single pressure superheated steam. However, adding the LP steam features recoversmore flue gas energy in the LP stage of the HRSG with less heat loss to the stack. The gain in
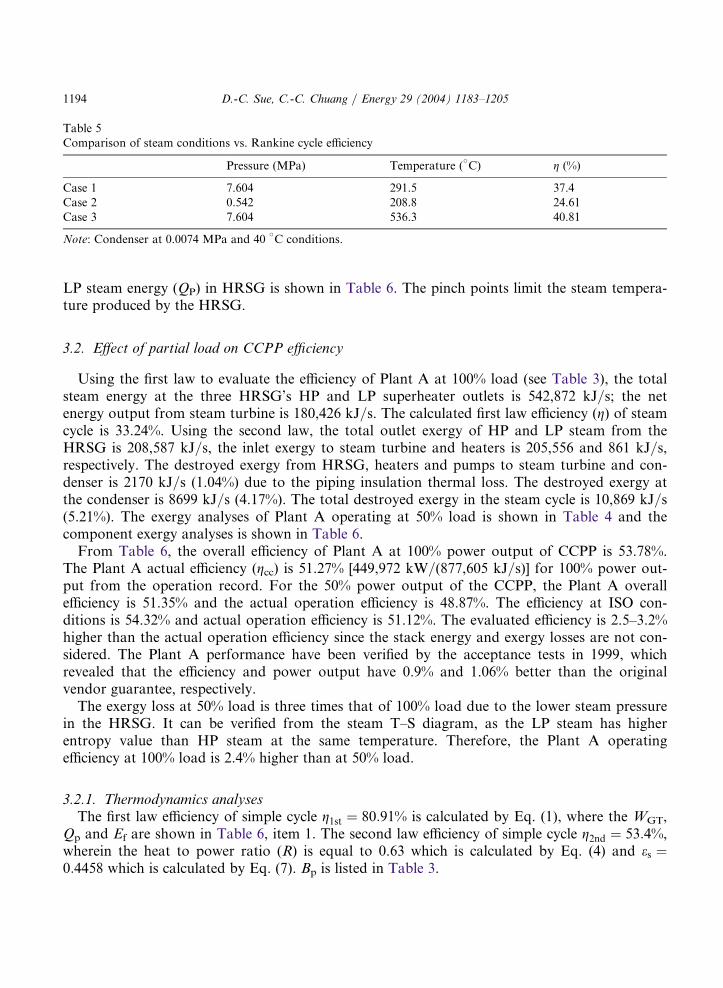
D.-C. Sue, C.-C. Chuang / Energy 29 (2004) 1183–12051194
LP steam energy (QP) in HRSG is shown in Table 6. The pinch points limit the steam tempera-ture produced by the HRSG.
3.2. Effect of partial load on CCPP efficiency
Using the first law to evaluate the efficiency of Plant A at 100% load (see Table 3), the totalsteam energy at the three HRSG’s HP and LP superheater outlets is 542,872 kJ/s; the netenergy output from steam turbine is 180,426 kJ/s. The calculated first law efficiency (g) of steamcycle is 33.24%. Using the second law, the total outlet exergy of HP and LP steam from theHRSG is 208,587 kJ/s, the inlet exergy to steam turbine and heaters is 205,556 and 861 kJ/s,respectively. The destroyed exergy from HRSG, heaters and pumps to steam turbine and con-denser is 2170 kJ/s (1.04%) due to the piping insulation thermal loss. The destroyed exergy atthe condenser is 8699 kJ/s (4.17%). The total destroyed exergy in the steam cycle is 10,869 kJ/s(5.21%). The exergy analyses of Plant A operating at 50% load is shown in Table 4 and thecomponent exergy analyses is shown in Table 6.
From Table 6, the overall efficiency of Plant A at 100% power output of CCPP is 53.78%.The Plant A actual efficiency (gcc) is 51.27% [449,972 kW/(877,605 kJ/s)] for 100% power out-put from the operation record. For the 50% power output of the CCPP, the Plant A overallefficiency is 51.35% and the actual operation efficiency is 48.87%. The efficiency at ISO con-ditions is 54.32% and actual operation efficiency is 51.12%. The evaluated efficiency is 2.5–3.2%higher than the actual operation efficiency since the stack energy and exergy losses are not con-sidered. The Plant A performance have been verified by the acceptance tests in 1999, whichrevealed that the efficiency and power output have 0.9% and 1.06% better than the originalvendor guarantee, respectively.
The exergy loss at 50% load is three times that of 100% load due to the lower steam pressurein the HRSG. It can be verified from the steam T–S diagram, as the LP steam has higherentropy value than HP steam at the same temperature. Therefore, the Plant A operatingefficiency at 100% load is 2.4% higher than at 50% load.
3.2.1. Thermodynamics analysesThe first law efficiency of simple cycle g1st ¼ 80:91% is calculated by Eq. (1), where the WGT,
Qp and Ef are shown in Table 6, item 1. The second law efficiency of simple cycle g2nd ¼ 53:4%,wherein the heat to power ratio (R) is equal to 0.63 which is calculated by Eq. (4) and es ¼0:4458 which is calculated by Eq. (7). Bp is listed in Table 3.
Table 5Comparison of steam conditions vs. Rankine cycle efficiency
Pressure (MPa)
Temperature (vC) g (%)Case 1
7.604 291.5 37.4 Case 2 0.542 208.8 24.61 Case 3 7.604 536.3 40.81Note: Condenser at 0.0074 MPa and 40vC conditions.
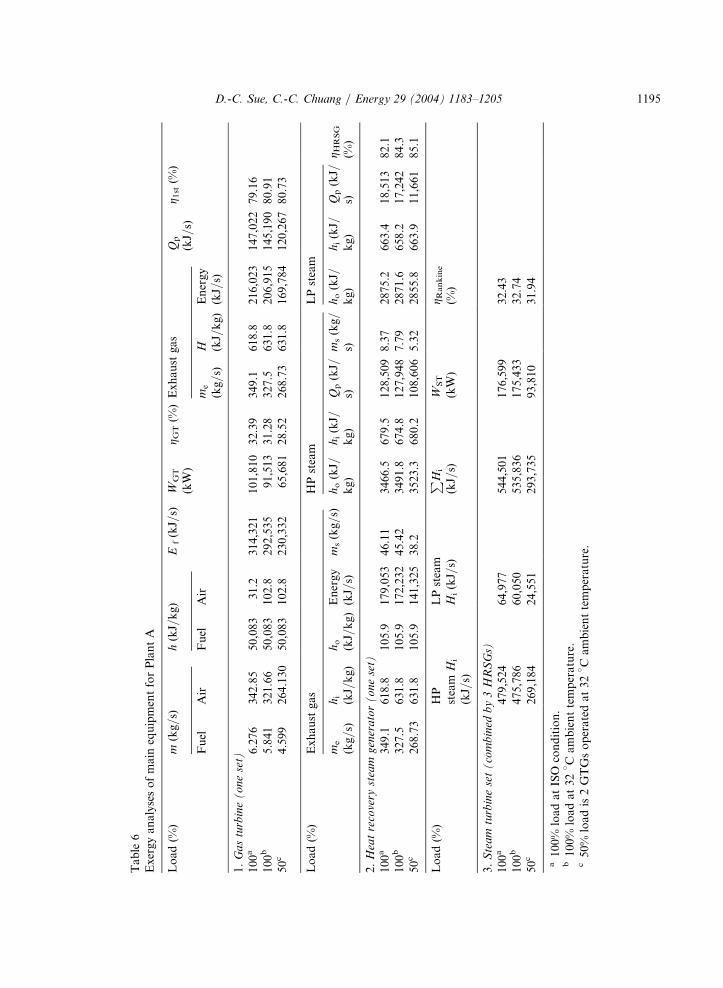
Table
6Exer
gy
analy
ses
ofm
ain
equip
men
tfo
rPla
ntA
Load
(%)
m(k
g/s)
h(k
J/kg)
Ef(k
J/s)
WG
T
(kW
)g G
T(%
)Exhaust
gas
Qp
(kJ/
s)g 1
st(%
)
Fuel
Air
Fuel
Air
me
(kg/s)
H (kJ/
kg)
Ener
gy
(kJ/
s)
1.Gasturbine(oneset)
100
a6.2
76
342.8
550,0
83
31.2
314,3
21
101,8
10
32.3
9349.1
618.8
216,0
23
147,0
22
79.1
6100
b5.8
41
321.6
650,0
83
102.8
292,5
35
91,5
13
31.2
8327.5
631.8
206,9
15
145,1
90
80.9
150c
4.5
99
264.1
30
50,0
83
102.8
230,3
32
65,6
81
28.5
2268.7
3631.8
169,7
84
120,2
67
80.7
3
Load
(%)
Exhaust
gas
HP
stea
mLP
stea
m
me
(kg/s)
hi
(kJ/
kg)ho
(kJ/
kg)
Ener
gy
(kJ/
s)m
s(k
g/s)
ho
(kJ/
kg)
hi(k
J/kg)
Qp
(kJ/
s)m
s(k
g/
s)ho
(kJ/
kg)
hi(k
J/kg)
Qp
(kJ/
s)g H
RSG
(%)
2.Heatrecoverysteamgenerator(oneset)
100
a349.1
618.8
105.9
179,0
53
46.1
13466.5
679.5
128,5
09
8.3
72875.2
663.4
18,5
13
82.1
100
b327.5
631.8
105.9
172,2
32
45.4
23491.8
674.8
127,9
48
7.7
92871.6
658.2
17,2
42
84.3
50c
268.7
3631.8
105.9
141,3
25
38.2
3523.3
680.2
108,6
06
5.3
22855.8
663.9
11,6
61
85.1
Load
(%)
HP
stea
mH
i
(kJ/
s)
LP
stea
mH
i(k
J/s)
P Hi
(kJ/
s)W
ST
(kW
)g R
ankin
e
(%)
3.Steamturbineset(combinedby3HRSGs)
100
a479,5
24
64,9
77
544,5
01
176,5
99
32.4
3100
b475,7
86
60,0
50
535,8
36
175,4
33
32.7
450c
269,1
84
24,5
51
293,7
35
93,8
10
31.9
4
a100%
load
atIS
Oco
nditio
n.
b100%
load
at32
vC
am
bie
ntte
mper
atu
re.
c50%
load
is2
GTG
soper
ate
dat32
vC
am
bie
ntte
mper
atu
re.
1195D.-C. Sue, C.-C. Chuang / Energy 29 (2004) 1183–1205
D.-C. Sue, C.-C. Chuang / Energy 29 (2004) 1183–12051196
The first law efficiency of combined cycle is same as simple cycle; however, the steam turbine
power output needs to be deducted from Qp to obtain Q 0p, which is equal to 260,115 kJ/s. The
second law efficiency of combined cycle g2nd ¼ 73:4%, wherein R is equal to WE=Q0p ¼ 1:73 and
es ¼ Bp=Q0p ¼ 0:7465.
The exhaust gas leaves the gas turbine through a horizontal outlet. Then the gas enters a 90v
upward bend at the base of the vertical tower section, which contains the HRSG heating surfa-
ces. The HRSG heating surfaces arranged in the direction of gas flow are HP superheater, HP
evaporator, HP economizer, LP superheater, LP evaporator, and a common condensate pre-
heater, forming a dual pressure boiler. The three main parts producing HP steam are firstly, the
HP economizer, secondly, the HP evaporator, and the lastly, HP superheater, all working at a
HP steam pressure. The condensate at 60vC enters the common condensate preheater and exits
(at 147vC) to the feed water tank. It is heated to saturation and deaerated in the feed water
tank. Then, the low-pressure feed pump takes some deaerated water from the feed tank and dis-
charges this deaerated feed to the LP evaporator TfL at 162.5vC and the feed water is evapo-
rated. The vapor after being separated from the unevaporated water in the LP steam drum
passes to the LP superheater. Finally, the vapor passes through the LP superheater and exits at
a superheated temperature of T ¼ 210vC. The HP feedwater pump takes the balance of the
deaerated water from the feed tank and discharges it into the HP economizer. The feedwater
temperature at HP economizer inlet is TcH (156vC), a sub-cooled liquid state. The sub-cooled
liquid is heated in the economizer and exits at TfH (298vC) to the HP evaporator, where it is
changed to the saturated vapor state. The vapor is separated from the liquid in the HP drum
and the saturated vapor enters the HP superheater exiting at a superheated temperature of
537.3vC.
The combustion gas, in counter flow, enters the HP superheater at the gas turbine exit con-
dition of Tt (568vC), goes through the HP superheater and then the HP evaporator where it
exits at a temperature of TppH (304vC). The flue gas enters the common condensate preheater
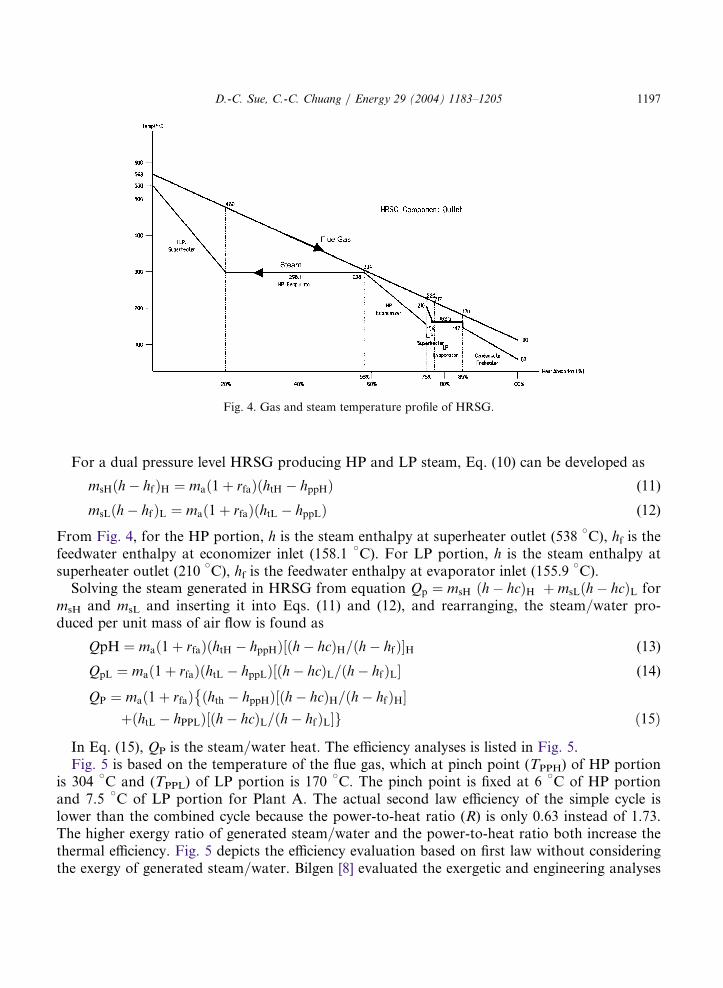
at TppL and exit at Te (100vC). The gas and steam temperatures profile of the HRSG are
shown in Fig. 4.For simplicity, it is assumed that the pressure drop in the flue gas side of the HRSG is negli-
gible and the HRSG is well insulated. Energy balance of the flue gas in the single pressure
HRSG consisting of a superheater and evaporator becomes
msðh� hfÞ ¼ mað1 þ rfaÞðht � hppÞ (10)
where ma is the mass of air in gas turbine, rfa is the fuel–air ratio used in combustion process
(rfa ¼ 0:01816 for Plant A), ht is the enthalpy of flue gas at the turbine exit, hpp is the enthalpy
of flue gas leaving the evaporator.In a dual pressure system, there is a substantial increase in the amount of heat recovered in
the HRSG. Usually, the HP steam can be optimized at a higher pressure than the single press-
ure cycle; more of the energy is transferred into exergy. In addition, LP steam is produced,
recovering the heat at the low temperature end of the HRSG and lowering the stack gas tem-
perature by the addition of economizer and preheater.
1197D.-C. Sue, C.-C. Chuang / Energy 29 (2004) 1183–1205
For a dual pressure level HRSG producing HP and LP steam, Eq. (10) can be developed as
msHðh� hfÞH ¼ mað1 þ rfaÞðhtH � hppHÞ (11)
msLðh� hfÞL ¼ mað1 þ rfaÞðhtL � hppLÞ (12)
From Fig. 4, for the HP portion, h is the steam enthalpy at superheater outlet (538vC), hf is the
feedwater enthalpy at economizer inlet (158.1vC). For LP portion, h is the steam enthalpy at
superheater outlet (210vC), hf is the feedwater enthalpy at evaporator inlet (155.9
vC).
Solving the steam generated in HRSG from equation Qp ¼ msH ðh� hcÞH þmsLðh� hcÞL formsH and msL and inserting it into Eqs. (11) and (12), and rearranging, the steam/water pro-duced per unit mass of air flow is found as
QpH ¼ mað1þ rfaÞðhtH � hppHÞ½ðh� hcÞH=ðh� hfÞ�H (13)
QpL ¼ mað1þ rfaÞðhtL � hppLÞ½ðh� hcÞL=ðh� hfÞL� (14)
QP ¼ mað1þ rfaÞ ðhth � hppHÞ½ðh� hcÞH=ðh� hfÞH��
þðhtL � hPPLÞ½ðh� hcÞL=ðh� hfÞL�g ð15Þ
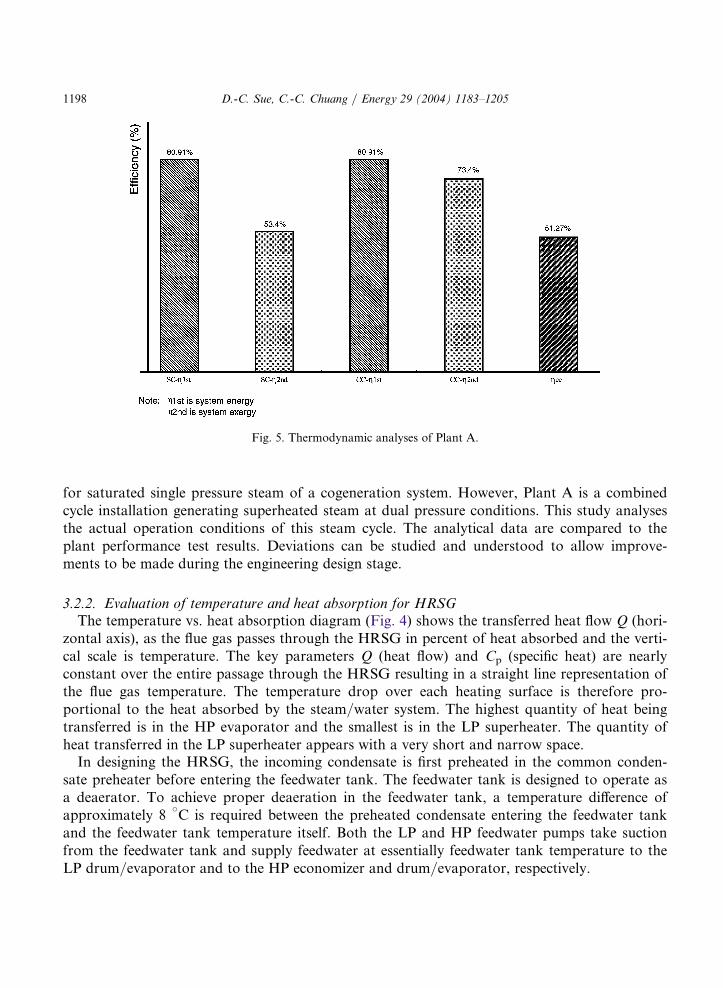
In Eq. (15), QP is the steam/water heat. The efficiency analyses is listed in Fig. 5.Fig. 5 is based on the temperature of the flue gas, which at pinch point (TPPH) of HP portion
is 304vC and (TPPL) of LP portion is 170
vC. The pinch point is fixed at 6
vC of HP portion
and 7.5vC of LP portion for Plant A. The actual second law efficiency of the simple cycle is
lower than the combined cycle because the power-to-heat ratio (R) is only 0.63 instead of 1.73.The higher exergy ratio of generated steam/water and the power-to-heat ratio both increase thethermal efficiency. Fig. 5 depicts the efficiency evaluation based on first law without consideringthe exergy of generated steam/water. Bilgen [8] evaluated the exergetic and engineering analyses
Fig. 4. Gas and steam temperature profile of HRSG.
D.-C. Sue, C.-C. Chuang / Energy 29 (2004) 1183–12051198
for saturated single pressure steam of a cogeneration system. However, Plant A is a combinedcycle installation generating superheated steam at dual pressure conditions. This study analysesthe actual operation conditions of this steam cycle. The analytical data are compared to theplant performance test results. Deviations can be studied and understood to allow improve-ments to be made during the engineering design stage.
3.2.2. Evaluation of temperature and heat absorption for HRSGThe temperature vs. heat absorption diagram (Fig. 4) shows the transferred heat flow Q (hori-
zontal axis), as the flue gas passes through the HRSG in percent of heat absorbed and the verti-cal scale is temperature. The key parameters Q (heat flow) and Cp (specific heat) are nearlyconstant over the entire passage through the HRSG resulting in a straight line representation ofthe flue gas temperature. The temperature drop over each heating surface is therefore pro-portional to the heat absorbed by the steam/water system. The highest quantity of heat beingtransferred is in the HP evaporator and the smallest is in the LP superheater. The quantity ofheat transferred in the LP superheater appears with a very short and narrow space.
In designing the HRSG, the incoming condensate is first preheated in the common conden-sate preheater before entering the feedwater tank. The feedwater tank is designed to operate asa deaerator. To achieve proper deaeration in the feedwater tank, a temperature difference ofapproximately 8
vC is required between the preheated condensate entering the feedwater tank
and the feedwater tank temperature itself. Both the LP and HP feedwater pumps take suctionfrom the feedwater tank and supply feedwater at essentially feedwater tank temperature to theLP drum/evaporator and to the HP economizer and drum/evaporator, respectively.
Fig. 5. Thermodynamic analyses of Plant A.
1199D.-C. Sue, C.-C. Chuang / Energy 29 (2004) 1183–1205
The inlet temperature of the feedwater entering the HP economizer is nearly the same as thefeedwater entering the LP drum, as both are fed from the common feedwater tank via separatefeedwater pumps. Due to the different pressure levels, the HP feedwater will be heated slightlymore by the feedwater pump than the LP feedwater.
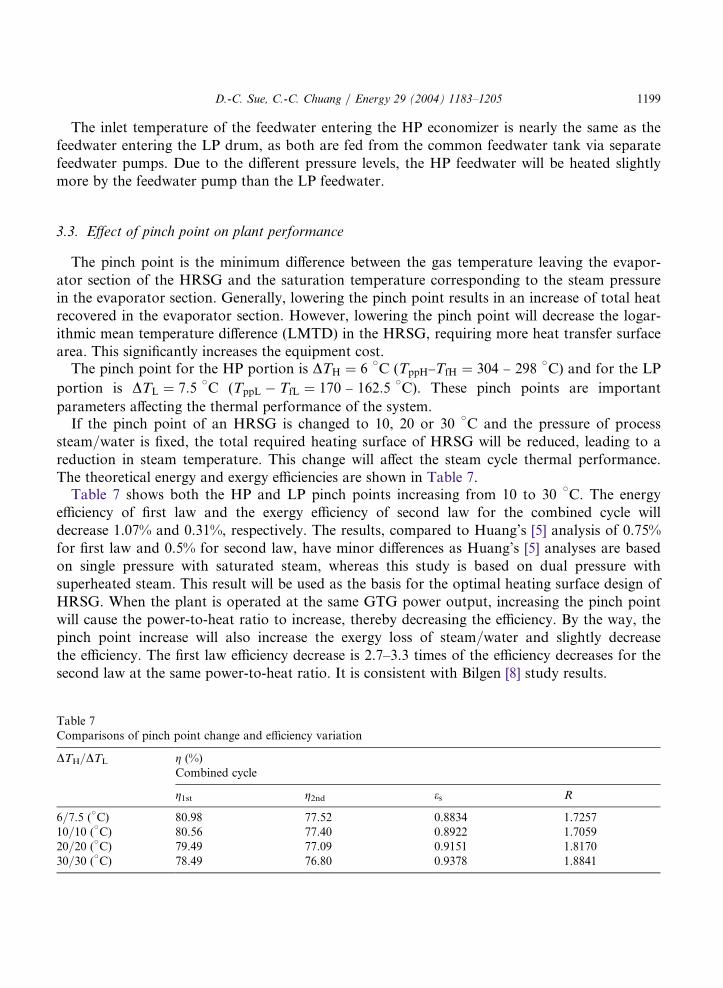
3.3. Effect of pinch point on plant performance
The pinch point is the minimum difference between the gas temperature leaving the evapor-ator section of the HRSG and the saturation temperature corresponding to the steam pressurein the evaporator section. Generally, lowering the pinch point results in an increase of total heatrecovered in the evaporator section. However, lowering the pinch point will decrease the logar-ithmic mean temperature difference (LMTD) in the HRSG, requiring more heat transfer surfacearea. This significantly increases the equipment cost.
The pinch point for the HP portion is DTH ¼ 6vC (TppH TfH ¼ 304 298
vC) and for the LP
portion is DTL ¼ 7:5vC (TppL � TfL ¼ 170 162:5
vC). These pinch points are important
parameters affecting the thermal performance of the system.If the pinch point of an HRSG is changed to 10, 20 or 30
vC and the pressure of process
steam/water is fixed, the total required heating surface of HRSG will be reduced, leading to areduction in steam temperature. This change will affect the steam cycle thermal performance.The theoretical energy and exergy efficiencies are shown in Table 7.
Table 7 shows both the HP and LP pinch points increasing from 10 to 30vC. The energy
efficiency of first law and the exergy efficiency of second law for the combined cycle willdecrease 1.07% and 0.31%, respectively. The results, compared to Huang’s [5] analysis of 0.75%for first law and 0.5% for second law, have minor differences as Huang’s [5] analyses are basedon single pressure with saturated steam, whereas this study is based on dual pressure withsuperheated steam. This result will be used as the basis for the optimal heating surface design ofHRSG. When the plant is operated at the same GTG power output, increasing the pinch pointwill cause the power-to-heat ratio to increase, thereby decreasing the efficiency. By the way, thepinch point increase will also increase the exergy loss of steam/water and slightly decreasethe efficiency. The first law efficiency decrease is 2.7–3.3 times of the efficiency decreases for thesecond law at the same power-to-heat ratio. It is consistent with Bilgen [8] study results.
Table 7Comparisons of pinch point change and efficiency variation
DTH/DTL g
(%)Combined cycleg1st
g2nd es R6/7.5 (vC) 8
0.98 77.52 0.8834 1 .725710/10 (vC) 8
0.56 77.40 0.8922 1 .705920/20 (vC) 7
9.49 77.09 0.9151 1 .817030/30 (vC) 7
8.49 76.80 0.9378 1 .8841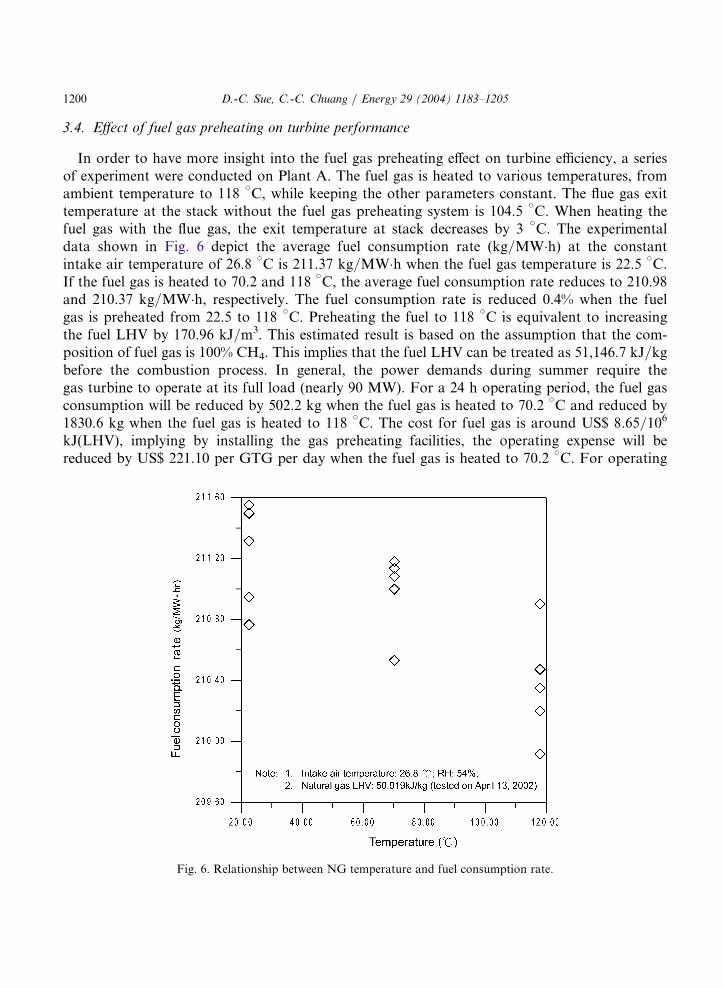
D.-C. Sue, C.-C. Chuang / Energy 29 (2004) 1183–12051200
3.4. Effect of fuel gas preheating on turbine performance
In order to have more insight into the fuel gas preheating effect on turbine efficiency, a seriesof experiment were conducted on Plant A. The fuel gas is heated to various temperatures, fromambient temperature to 118
vC, while keeping the other parameters constant. The flue gas exit
temperature at the stack without the fuel gas preheating system is 104.5vC. When heating the
fuel gas with the flue gas, the exit temperature at stack decreases by 3vC. The experimental
data shown in Fig. 6 depict the average fuel consumption rate (kg/MW h) at the constantintake air temperature of 26.8
vC is 211.37 kg/MW h when the fuel gas temperature is 22.5
vC.
If the fuel gas is heated to 70.2 and 118vC, the average fuel consumption rate reduces to 210.98
and 210.37 kg/MW h, respectively. The fuel consumption rate is reduced 0.4% when the fuelgas is preheated from 22.5 to 118
vC. Preheating the fuel to 118
vC is equivalent to increasing
the fuel LHV by 170.96 kJ/m3. This estimated result is based on the assumption that the com-position of fuel gas is 100% CH4. This implies that the fuel LHV can be treated as 51,146.7 kJ/kgbefore the combustion process. In general, the power demands during summer require thegas turbine to operate at its full load (nearly 90 MW). For a 24 h operating period, the fuel gasconsumption will be reduced by 502.2 kg when the fuel gas is heated to 70.2
vC and reduced by
1830.6 kg when the fuel gas is heated to 118vC. The cost for fuel gas is around US$ 8.65/106
kJ(LHV), implying by installing the gas preheating facilities, the operating expense will bereduced by US$ 221.10 per GTG per day when the fuel gas is heated to 70.2
vC. For operating
Fig. 6. Relationship between NG temperature and fuel consumption rate.
1201D.-C. Sue, C.-C. Chuang / Energy 29 (2004) 1183–1205
with the fuel gas heated to 118vC, the savings in operating cost is US$ 805.90 per GTG per
day. The Plant A currently contains 15 sets of gas turbine with 40% capacity factor and25 years design operation life. The total cost saving for this plant is US$ 44.1 million when thefuel gas is heated to 118
vC during the operating period.
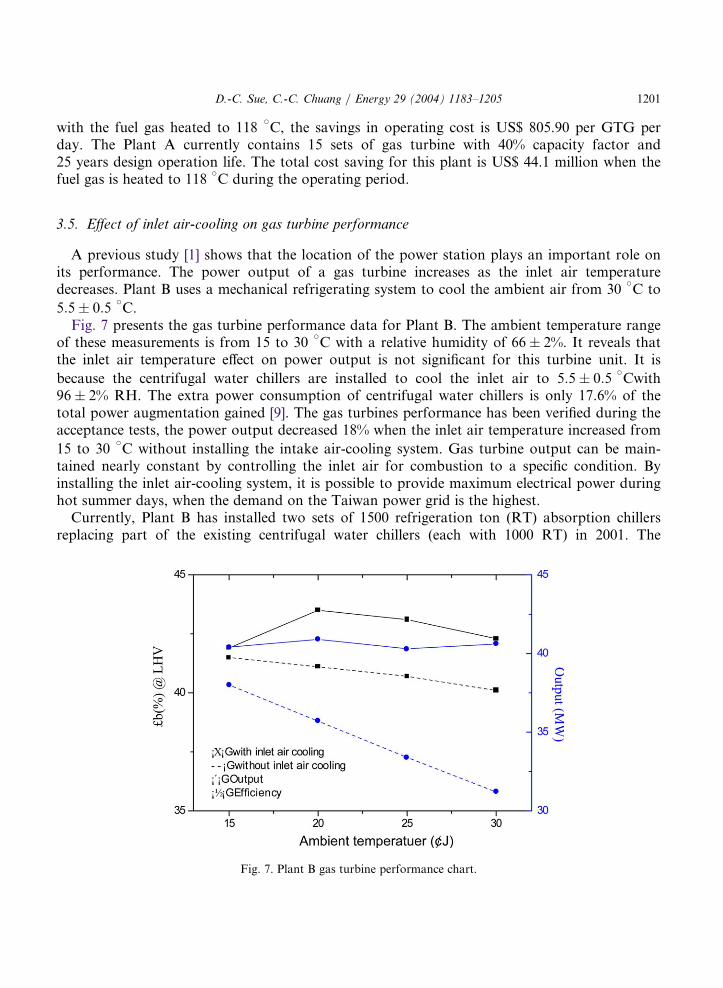
3.5. Effect of inlet air-cooling on gas turbine performance
A previous study [1] shows that the location of the power station plays an important role onits performance. The power output of a gas turbine increases as the inlet air temperaturedecreases. Plant B uses a mechanical refrigerating system to cool the ambient air from 30
vC to
5:5 � 0:5vC.
Fig. 7 presents the gas turbine performance data for Plant B. The ambient temperature rangeof these measurements is from 15 to 30
vC with a relative humidity of 66 � 2%. It reveals that
the inlet air temperature effect on power output is not significant for this turbine unit. It is
because the centrifugal water chillers are installed to cool the inlet air to 5:5 � 0:5vCwith
96 � 2% RH. The extra power consumption of centrifugal water chillers is only 17.6% of thetotal power augmentation gained [9]. The gas turbines performance has been verified during theacceptance tests, the power output decreased 18% when the inlet air temperature increased from
15 to 30vC without installing the intake air-cooling system. Gas turbine output can be main-
tained nearly constant by controlling the inlet air for combustion to a specific condition. Byinstalling the inlet air-cooling system, it is possible to provide maximum electrical power duringhot summer days, when the demand on the Taiwan power grid is the highest.
Currently, Plant B has installed two sets of 1500 refrigeration ton (RT) absorption chillersreplacing part of the existing centrifugal water chillers (each with 1000 RT) in 2001. The
Fig. 7. Plant B gas turbine performance chart.
D.-C. Sue, C.-C. Chuang / Energy 29 (2004) 1183–12051202
operation records show that the auxiliary power consumption is reduced about 2215 kW due tothe introduction of two (2) sets of 1500 RT absorption chillers. For the sizing of the new chill-ers, another issue is to select an optimum inlet air temperature to gain the maximum power out-put without additional power consumption. If we provide the chilled water instead of theprocess steam to the offsite steam users, many problems with steam supply (traps and expan-sion) and condensate recovery (contamination, water hammer and flashing water) will beavoided. It is relatively cheap to pump cold water (no user tanks, or pumps, only flow controlsat user’s end to regulate room temperature).
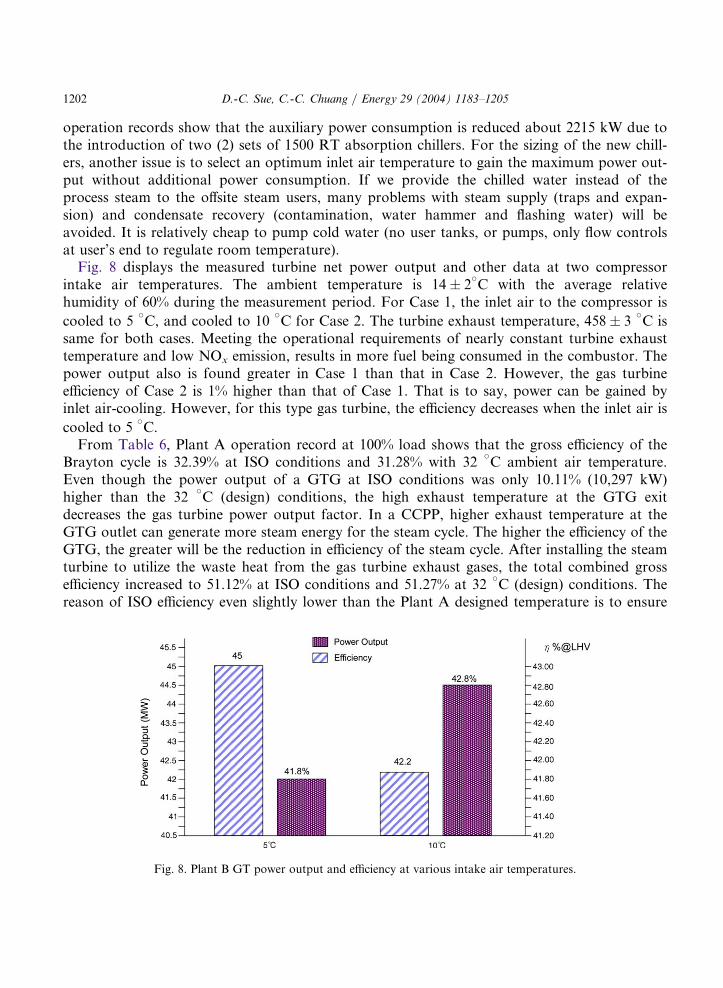
Fig. 8 displays the measured turbine net power output and other data at two compressorintake air temperatures. The ambient temperature is 14 � 2
vC with the average relative
humidity of 60% during the measurement period. For Case 1, the inlet air to the compressor is
cooled to 5vC, and cooled to 10
vC for Case 2. The turbine exhaust temperature, 458 � 3
vC is
same for both cases. Meeting the operational requirements of nearly constant turbine exhausttemperature and low NOx emission, results in more fuel being consumed in the combustor. Thepower output also is found greater in Case 1 than that in Case 2. However, the gas turbineefficiency of Case 2 is 1% higher than that of Case 1. That is to say, power can be gained byinlet air-cooling. However, for this type gas turbine, the efficiency decreases when the inlet air is
cooled to 5vC.
From Table 6, Plant A operation record at 100% load shows that the gross efficiency of theBrayton cycle is 32.39% at ISO conditions and 31.28% with 32
vC ambient air temperature.
Even though the power output of a GTG at ISO conditions was only 10.11% (10,297 kW)higher than the 32
vC (design) conditions, the high exhaust temperature at the GTG exit
decreases the gas turbine power output factor. In a CCPP, higher exhaust temperature at theGTG outlet can generate more steam energy for the steam cycle. The higher the efficiency of theGTG, the greater will be the reduction in efficiency of the steam cycle. After installing the steamturbine to utilize the waste heat from the gas turbine exhaust gases, the total combined grossefficiency increased to 51.12% at ISO conditions and 51.27% at 32
vC (design) conditions. The
reason of ISO efficiency even slightly lower than the Plant A designed temperature is to ensure
Fig. 8. Plant B GT power output and efficiency at various intake air temperatures.
1203D.-C. Sue, C.-C. Chuang / Energy 29 (2004) 1183–1205
that Plant A has a better performance during summer operation. It is an optimum engineeringdesign for CCPP in Taiwan.
Ondryas et al. [11] indicated gas turbine output could be increased by 0.72% with each 1vC
inlet air temperature reduction for the Model 7E gas turbines. Analytical data reveal that theselected gas turbine can gain 1.12% output with each 1
vC inlet air temperature reduction in the
ambient temperature range between 15 and 40vC. This difference is mainly attributed to the dif-
ferent gas turbines in original design including the blade geometry and the combustion featuresand is not discussed herein. The unit capital cost increment is US$ 230/kW [9] for inlet air-cooling system, which is less than half of the unit cost of power generating equipment installation.
3.6. Effect of exergy efficiency with variation of the compressor inlet and of the fuel temperatures
Fig. 7 shows that an ambient temperature change from 15 to 30vC decreases the efficiency by
1.5%. With the increase in ambient temperature, the airflow mass and power density are bothdecreased. The power output is decreased 18% with only a 6% decrease in fuel consumption.When the gas turbine operates at varying ambient temperatures, the exergy loss at a lowerambient temperature is less than at a higher ambient temperature as indicated by Eq. (2). Thegas turbine is a volume displacement system operating at a constant speed and without inletcontrol vanes. The inlet air is induced into the compressor at a constant volume during oper-ation. Ambient air density varies inversely with its temperature, directly affecting the inlet airmass flow rate and thus directly impacting the power output [9]. Therefore, by cooling the inletair, the inlet air mass flow is increased, enabling the gas turbine to operate at higher power out-put and higher exergy efficiency as in Plant B operating condition.
Recovering some energy from the exhaust flue gas before it enters the stack to preheat thefuel returns otherwise wasted energy back into the cycle. The fuel gas, after conditioning at thefacility, averages to 118
vC. Any increase in temperature, prior to entering the combustion pro-
cess, reduces the amount of fuel needed to bring the incoming fuel up to the combustion tem-perature. Transferring heat from the stack gases to preheat the incoming fuel results in a directfuel saving. Lowering the temperature at the exhaust stack reduces the overall energy loss,which enhances the system performance proportionally.
4. Conclusions
Based on first law (energy) and second law (exergy) analyses, the formulas for dual pressureHRSG have been developed for thermodynamic performance and engineering betterment ofcombustion gas turbine based power generation systems. The plant performance can beimproved by improving the system design such as using dual pressure steam cycles, inlet air-cooling for the gas turbine, and fuel gas preheating, etc. From Fig. 5, the efficiency difference ofCCPP between second law and actual plant operation at design condition is 22.13%, which iscaused by a steam cycle efficiency of only 32.74% as shown in Table 6. The efficiency deviationbetween exergy analyses and performance test results can be improved by engineering design.The higher exergy destruction occurs because the lower pressure steam has high entropy valueat same temperature level. Therefore, the CCPP operated at 50% load has an efficiency of 2.4%
D.-C. Sue, C.-C. Chuang / Energy 29 (2004) 1183–12051204
lower than the 100% load. The HRSG pinch point increased 10vC only affects the overall com-
bined cycle efficiency by 0.3%. The pinch point design value has to be carefully evaluated basedon anticipated operating factors to obtain an optimum design.
Experiments conducted on the 90 MW rated gas turbines of Plant A, show that, with theinstallation of a fuel gas preheating system from 22.5 to 118
vC, less fuel consumption can be
achieved under the same power output. Operating records indicate fuel savings and a slightimprovement in efficiency (0.06%) for the whole plant.
The gas turbine Plant B produces 18% greater power output using 15vC intake air than
30vC air. In many power purchase agreements (PPA), the capacity charge is based on the peak
output that can be demonstrated on a predetermined hot summer day. In such cases, the poweroutput reduction in summer is economically unacceptable to the power producer. On the otherhand, the plant operational data depict that the efficiency will be 1% lower when compressorinlet air is cooled from 10 to 5
vC. The trend of energy efficiency is not proportional to the
power output. Therefore, the optimum operational inlet air temperature to the compressor willdepend on the gas turbine design under the consideration of energy saving and contractualrequirements.
From the engineering design point of view, if the offsite steam user uses process steamexclusively for absorption chillers associated with air conditioning, the power facility caninstall the chillers and directly provide the chilled water instead of the process steam. It willeliminate many problems such as steam traps, expansion joints, and return condensate con-tamination, etc.
References
[1] Badran OO. Gas-turbine performance improvements. Applied Energy 1999;64:263–73.[2] Abdel-Rahim YM. Exergy analysis of radial inflow expansion turbines for power recovery. Heat Recovery Sys-
tem & CHP 1995;15(8):775–85.[3] Chuang CC, Ishida M. Exergy analysis of an absorption heat pump by energy utilization diagrams. A future for
Energy (FLOWERS ‘90). Tokyo (Japan): Pergamon Press; 1990, p. 309–21.[4] Carcasci C, Facchini B. Comparison between two gas turbine solutions to increase combined power plant
efficiency. Energy Conversion and Management 2000;41:757–73.[5] Huang FF. Performance evaluation of selected combustion gas turbine cogeneration systems based on first and
second-law analysis. Journal of Engineering for Gas Turbines and Power 1990;112:117–21.[6] Verkhivker GP, Kosoy BV. On the exergy analysis of power plants. Energy Conversion and Management
2001;42:2053–9.[7] Marrero IO, Lefsaker AM, Razani A, Kim KJ. Second law analysis and optimization of a combined triple
power cycle. Energy Conversion and Management 2002;43:557–73.[8] Bilgen E. Exergetic and engineering analyses of gas turbine based cogeneration systems. Energy 2000;25:
1215–1229.[9] Sue DC, Chuang CC, Lin PH. Performance improvement for gas turbine combined cycle power plants
(GTCCPP) in Taiwan. In: Johnson D, editor. Electric Power 2002 4th Annual Conference and Exhibition, vol.4A. Missouri (USA): America Center St. Louis; 2002, p. 1–15.
[10] Chuang CC, Sue DC, Lin PH. Efficiency improvement for combined cycle power plants: installation of BOP sys-tem to enhance power output. In: D’auria F, editor. ASME Conference, 6th Biennial Conference on EngineeringSystems Design and Analysis. Istanbul (Turkey): ESDA/AES-008; 2002, p. 1–6 July 8–11.

1205D.-C. Sue, C.-C. Chuang / Energy 29 (2004) 1183–1205
[11] Ondryas IS, Wilson DA, Kawamoto M, Haub GL. Options in gas turbine power augmentation using inlet airchilling. Journal of Engineering for Gas Turbines and Power 1991;113:203–11.
[12] Tawney RK, Narula RG, Boswell MJ, DeCandia F. Power output enhancement options for combined cyclepower plants. Kansas City (MO): International Joint Power Generation Conference; 1993.
[13] Taiwan Power Company. Taiwan Power Company 2001 Annual Report. 2002; www.taipower.com.tw/5htm.Address: 242 Roosevelt Road, Sec. 3, Taipei 100, Taiwan (ROC).
[14] Tawney RK, Ugolini DJ, Wengert TJ, Narula RG. Steam cycle selection considerations for combined cycleplant. Boston (MA): Presented at the Joint Power Generation Conference; October 1990.