Embed Size (px)
Citation preview
Engineering Fracture Mechanics xxx (2012) xxx–xxx
Contents lists available at SciVerse ScienceDirect
Engineering Fracture Mechanics
journal homepage: www.elsevier .com/locate /engfracmech
Simulation of the damage behaviour of electron beam welded jointswith the Rousselier model
H.Y. Tu a,⇑, S. Schmauder a, U. Weber a, Y. Rudnik b, V. Ploshikhin b,c
a Institute for Materials Testing, Materials Science and Strength of Materials (IMWF), University of Stuttgart, Pfaffenwaldring 32, D-70569 Stuttgart, Germanyb Neue Materialien Bayreuth GmbH, Gottlieb-Keim-Straße 60, D-95448 Bayreuth, Germanyc ISEMP, University of Bremen, TAB Building, Entrance 1 A, 3rd Floor, Am Fallturm 1, 28359 Bremen, Germany
a r t i c l e i n f o a b s t r a c t
Article history:Available online xxxx
Keywords:Electron beam welded jointRousselier modelCrack growthFinite element method
0013-7944/$ - see front matter � 2012 Elsevier Ltdhttp://dx.doi.org/10.1016/j.engfracmech.2012.07.002
⇑ Corresponding author. Tel.: +49 711 685 63075E-mail address: [email protected]
Please cite this article in press as: Tu HY et amodel. Engng Fract Mech (2012), http://dx.do
Experimental and numerical investigations of crack propagation on S355NL steel electronbeam welded joints are presented. Mechanical properties were obtained from tensile testresults of flat specimens extracted from the base material, the fusion zone and heataffected zone, respectively. Based on metallographic investigations, numerical calibrationof Rousselier parameters were performed on notched round specimens. The same param-eters were used to predict the ductile fracture of compact tension specimens with initialcrack located at different regions. Numerical results were compared with the experimentsin terms of force vs. crack opening displacement as well as fracture resistance curves.
� 2012 Elsevier Ltd. All rights reserved.
1. Introduction
Nowadays advanced welding techniques, such as electron beam welding (EBW) are used widely in transportation andaircraft industries. As the properties of welded joints influence the mechanical behaviour of welded constructions, attentionhas been focused on the fracture behaviour of welded joints in a numerical way.
In ductile material, failure can be described by void initiation, growth and coalescence. Various models exist for thedescription of void growth alone [1–3]. Similar to the GTN model [4–7], based on a thermodynamical framework, a modelwas developed by Rousselier which involves less model parameters [8,9]. Besides solving fracture problems of differenthomogeneous materials [10,11] and inhomogeneous structures [12,13], scientists are trying to investigate the fracturebehaviour of conventional fusion welded joints [14–16]. After the initial study of the fracture behaviour of a laser weldedjoint [17,18], the GTN model was used to study the ductile fracture behaviour of a laser welded joint [19–22]. However,whether the Rousselier model can be used to solve the problem of an EBW joint is unknown. In this article, the Rousseliermodel will be used to study the fracture behaviour of EBW joints.
2. Material properties and experiments
Low-alloyed structural steel S355NL is chosen as the base material (BM) to make welded joints. After the electron beamwelding process, a butt joint is obtained from two S355NL plates with the thickness of 60 mm. The chemical components ofS355NL are shown in Table 1, which is obtained from spectrometric analysis.
In order to identify the different weld regions, especially the fusion zone (FZ) and the heat affected zone (HAZ), the hard-ness is measured across the weld. From the hardness test results, the dimensions of FZ and HAZ are found to be 2.8 mm and
. All rights reserved.
; fax: +49 711 685 62635.e (H.Y. Tu).
l. Simulation of the damage behaviour of electron beam welded joints with the Rousselieri.org/10.1016/j.engfracmech.2012.07.002
Nomenclature
req von Mises equivalent stressrm hydrostatic stressrK material constantDa crack extensionDD cross section reductionA strain at ruptureAg uniform strainBM the base materialCOD crack opening displacementC(T) the compact tension specimenD material constantEBW electron beam weldingf void volume fractionF forcef0 initial void volume fractionFZ the fusion zoneGTN the Gurson–Tvergaard–Needleman modelHAZ the heat affected zoneJ J-integrallc main distance between two neighbouring voidsRe yield stressRm tensile strengthR(p) actual yield limit
2 H.Y. Tu et al. / Engineering Fracture Mechanics xxx (2012) xxx–xxx
3.1 mm, respectively. Local mechanical properties of different weld regions of S355 EBW joints are obtained from flat spec-imens along the weld line of which the gauge length is 50 mm. These local stress strain curves are used as finite elementmodel input data. Table 2 shows the mechanical properties of the welded joints containing yield stress Re, tensile strengthRm, uniform strain Ag and strain at rupture A.
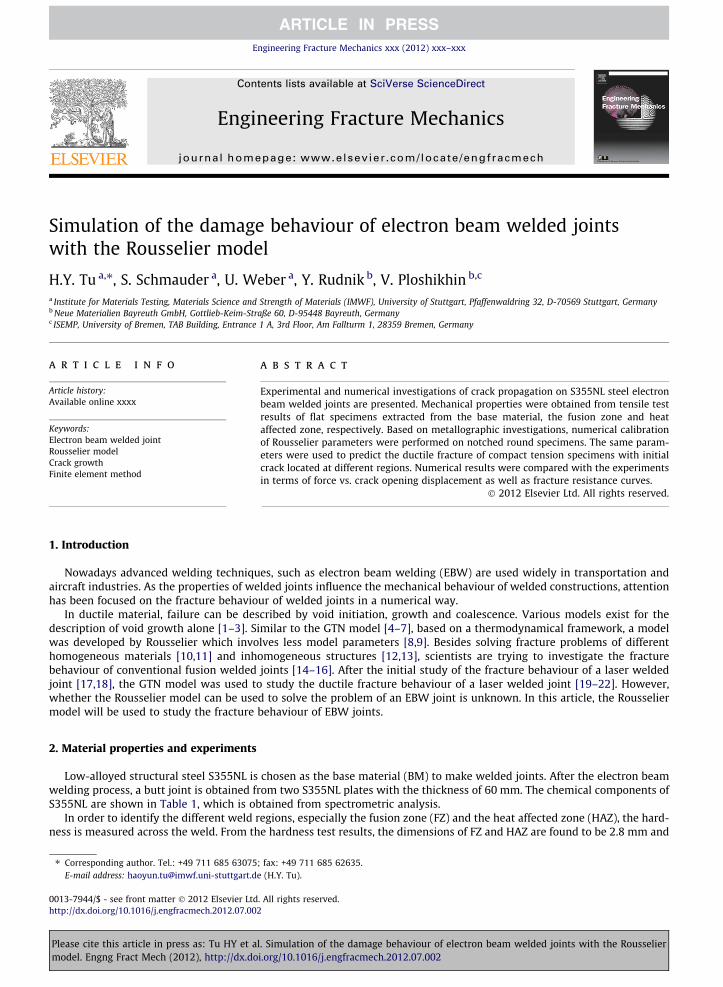
After surface etching, the microstructures of different weld regions are shown in Fig. 1(a–c). As shown in Fig. 1a, the BMshows typical dual phase structures, which is comprised of Ferrite and Perlite. The microstructure of the HAZ around thefusion line can be found in Fig. 1b, which is a transitional region between the BM and the FZ. In Fig. 1c, acicular martensitestructures can be found in the FZ. This can explain the brittle behaviour of the fusion zone.
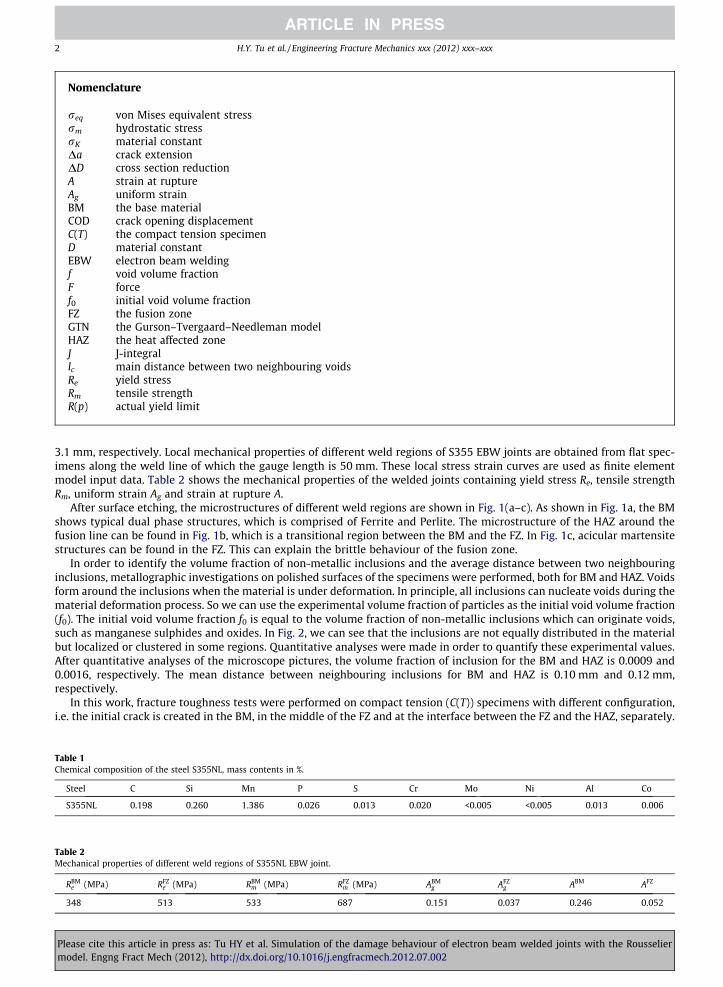
In order to identify the volume fraction of non-metallic inclusions and the average distance between two neighbouringinclusions, metallographic investigations on polished surfaces of the specimens were performed, both for BM and HAZ. Voidsform around the inclusions when the material is under deformation. In principle, all inclusions can nucleate voids during thematerial deformation process. So we can use the experimental volume fraction of particles as the initial void volume fraction(f0). The initial void volume fraction f0 is equal to the volume fraction of non-metallic inclusions which can originate voids,such as manganese sulphides and oxides. In Fig. 2, we can see that the inclusions are not equally distributed in the materialbut localized or clustered in some regions. Quantitative analyses were made in order to quantify these experimental values.After quantitative analyses of the microscope pictures, the volume fraction of inclusion for the BM and HAZ is 0.0009 and0.0016, respectively. The mean distance between neighbouring inclusions for BM and HAZ is 0.10 mm and 0.12 mm,respectively.
In this work, fracture toughness tests were performed on compact tension (C(T)) specimens with different configuration,i.e. the initial crack is created in the BM, in the middle of the FZ and at the interface between the FZ and the HAZ, separately.
Table 1Chemical composition of the steel S355NL, mass contents in %.
Steel C Si Mn P S Cr Mo Ni Al Co
S355NL 0.198 0.260 1.386 0.026 0.013 0.020 <0.005 <0.005 0.013 0.006
Table 2Mechanical properties of different weld regions of S355NL EBW joint.
RBMe (MPa) RFZ
e (MPa) RBMm (MPa) RFZ
m (MPa) ABMg AFZ
g ABM AFZ
348 513 533 687 0.151 0.037 0.246 0.052
Please cite this article in press as: Tu HY et al. Simulation of the damage behaviour of electron beam welded joints with the Rousseliermodel. Engng Fract Mech (2012), http://dx.doi.org/10.1016/j.engfracmech.2012.07.002
(a)
Ferrite Martensite
(c)(b)
Perlite
Fig. 1. Microstructures of different weld regions of an S355 EBW joint: (a) base material (BM), (b) heat affected zone (HAZ) and (c) fusion zone (FZ).
Fig. 2. Typical micrographs of different weld regions of an S355 EBW joint: (a) base material and (b) heat affected zone (dark regions: inclusions).
H.Y. Tu et al. / Engineering Fracture Mechanics xxx (2012) xxx–xxx 3
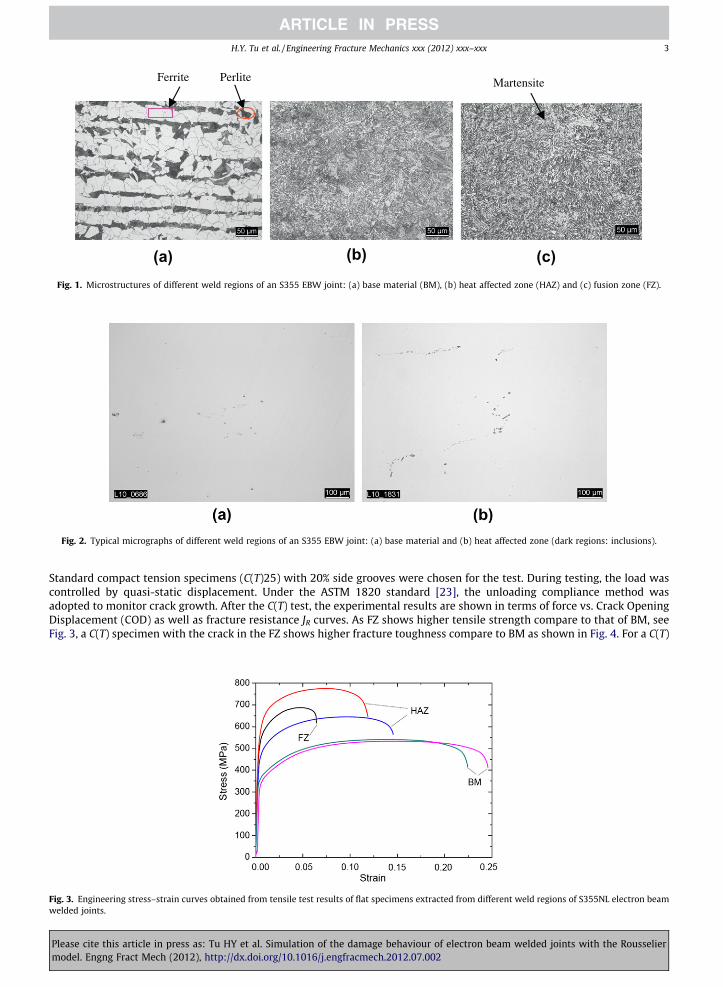
Standard compact tension specimens (C(T)25) with 20% side grooves were chosen for the test. During testing, the load wascontrolled by quasi-static displacement. Under the ASTM 1820 standard [23], the unloading compliance method wasadopted to monitor crack growth. After the C(T) test, the experimental results are shown in terms of force vs. Crack OpeningDisplacement (COD) as well as fracture resistance JR curves. As FZ shows higher tensile strength compare to that of BM, seeFig. 3, a C(T) specimen with the crack in the FZ shows higher fracture toughness compare to BM as shown in Fig. 4. For a C(T)
Fig. 3. Engineering stress–strain curves obtained from tensile test results of flat specimens extracted from different weld regions of S355NL electron beamwelded joints.
Please cite this article in press as: Tu HY et al. Simulation of the damage behaviour of electron beam welded joints with the Rousseliermodel. Engng Fract Mech (2012), http://dx.doi.org/10.1016/j.engfracmech.2012.07.002
0
10
20
30
40
50
F (K
N)
CT--BM CT--FZ CT--HAZ
3.02.52.01.51.00.50COD (mm)
Fig. 4. Force vs. Crack Opening Displacement (COD) curves of compact tension (C(T)25) specimens with initial crack located in the base material (BM), thefusion zone (FZ) and the heat affected zone (HAZ), respectively.
4 H.Y. Tu et al. / Engineering Fracture Mechanics xxx (2012) xxx–xxx
specimen with the crack in the FZ, the specimen suddenly ruptures, showing more brittle fracture behaviour. This coincideswith the material character of the FZ. In this paper, the Rousselier model has been used to study the ductile crack growth ofthe BM and HAZ structures.
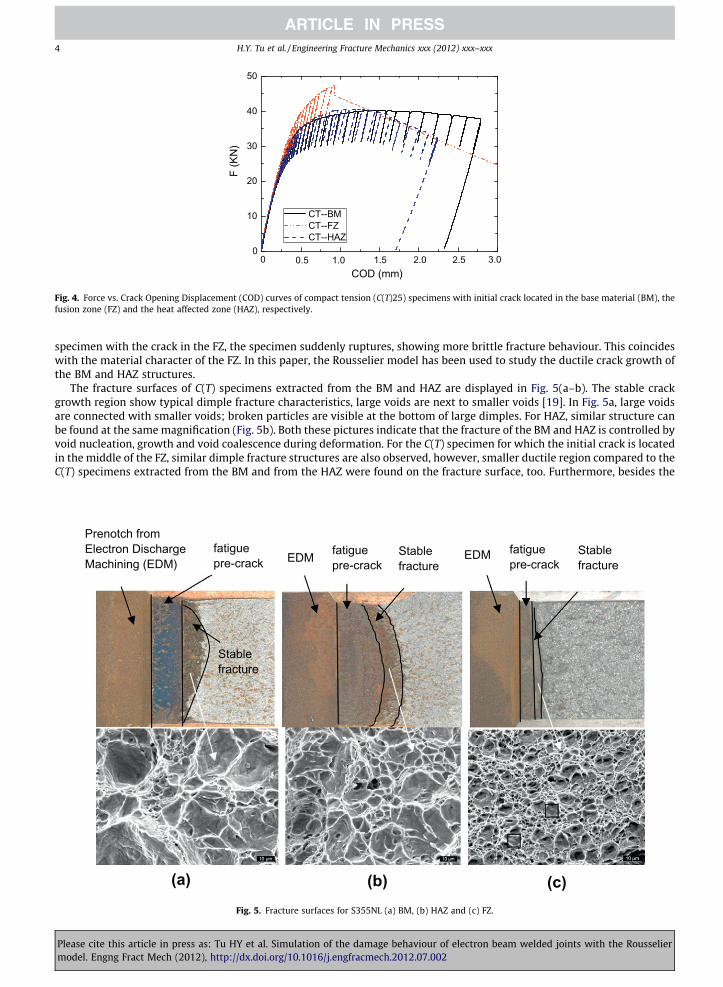
The fracture surfaces of C(T) specimens extracted from the BM and HAZ are displayed in Fig. 5(a–b). The stable crackgrowth region show typical dimple fracture characteristics, large voids are next to smaller voids [19]. In Fig. 5a, large voidsare connected with smaller voids; broken particles are visible at the bottom of large dimples. For HAZ, similar structure canbe found at the same magnification (Fig. 5b). Both these pictures indicate that the fracture of the BM and HAZ is controlled byvoid nucleation, growth and void coalescence during deformation. For the C(T) specimen for which the initial crack is locatedin the middle of the FZ, similar dimple fracture structures are also observed, however, smaller ductile region compared to theC(T) specimens extracted from the BM and from the HAZ were found on the fracture surface, too. Furthermore, besides the
(a) (b) (c)
Stable fracture
fatigue pre-crack
Prenotch from Electron Discharge Machining (EDM) EDM EDM Stable
fracturefatigue pre-crack
Stable fracture
fatigue pre-crack
Fig. 5. Fracture surfaces for S355NL (a) BM, (b) HAZ and (c) FZ.
Please cite this article in press as: Tu HY et al. Simulation of the damage behaviour of electron beam welded joints with the Rousseliermodel. Engng Fract Mech (2012), http://dx.doi.org/10.1016/j.engfracmech.2012.07.002
H.Y. Tu et al. / Engineering Fracture Mechanics xxx (2012) xxx–xxx 5
dimple areas, some flat regions (marked regions in Fig. 5c) can be observed on the fracture surface, which are due to theunstable fracture of the FZ. This leads to the brittle behaviour of the FZ.
3. Finite element simulations and results
In the frame of continuum damage mechanics a model for porous metal plasticity is presented by Rousselier [8,9]. In theRousselier model, damage is defined by the variation of the void volume fraction. Rousselier suggested in the case of a dam-aged material that the yield surface had to be corrected as follows:
Fig. 6.specim
Pleasemodel
U ¼ req
1� fþ DfrK exp
rm
rKð1� f Þ
� �� RðpÞ ¼ 0 ð1Þ
where req is the von Mises equivalent stress, rm is the hydrostatic stress, f is the void volume fraction (initial value f0), D is amaterial independent constant where D = 2 and R(p) is the actual yield limit of the material. In this paper, rk = 445 MPa waschosen, which is widely used for steel [10,11].
The initial void volume fraction, f0, depends on the volume fraction of non-metallic inclusions, like sulphides and oxides,as explained, e.g. by Schmauder et al. [11]. When the critical void volume fraction (fc = 0.05) is reached, the element stiffnesswill be set to zero, as suggested by Seidenfuss [10]. For ductile fracture, within the framework of damage models, it is as-sumed that a crack propagates from void to void. This can be simulated by the finite element model that a crack propagatesfrom integration point to integration point. As voids originate mainly from non-metallic inclusions, square finite elementswith four integration points (in ABAQUS: CPE8R for BM and CPE4 for HAZ) are used for the calculation, and the main distancebetween voids (lc) is equal to half of the element size. When choosing CPE8R elements for the C(T)-HAZ situation, a numericalproblem appears during the early stage of calculation. In order to avoid such a convergence problem, CPE4 elements werechosen for the HAZ. In this work, the Rousselier parameters can be fixed based on combined experimental investigationsand numerical calibration about the notched round specimens. The same Rousselier parameters are used to predict the crackpropagation of C(T) specimens. For the simulation, the current crack length is the product of the number of current damagedelements times the size of damaged elements when they are in the same size. All the simulation works are performed onABAQUS platform with the Rousselier model as a user subroutine (UMAT) [24].
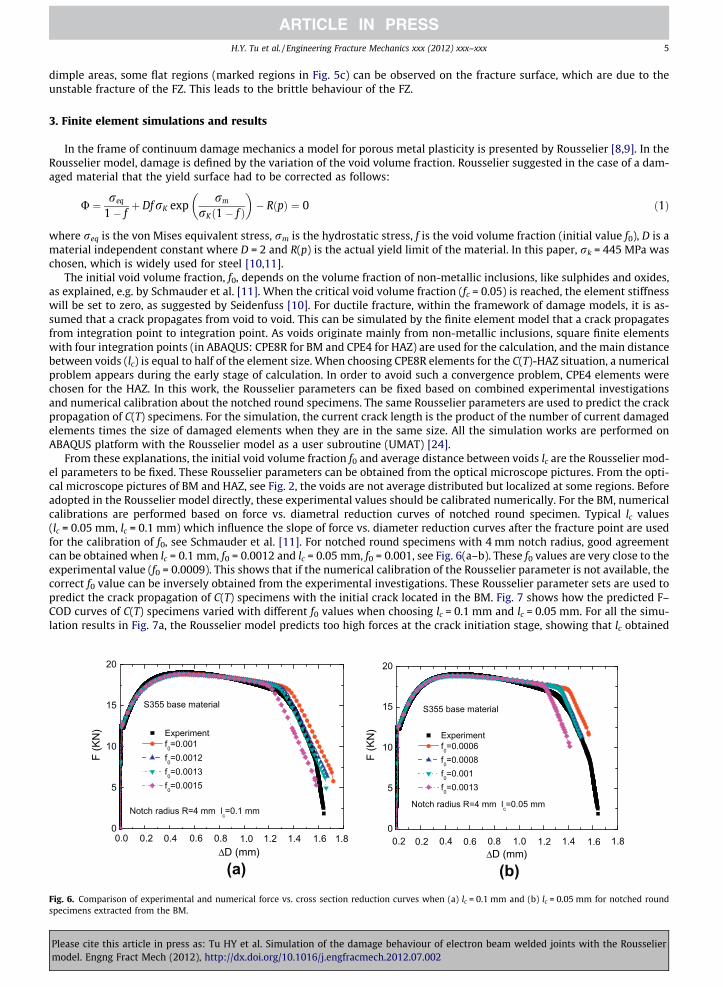
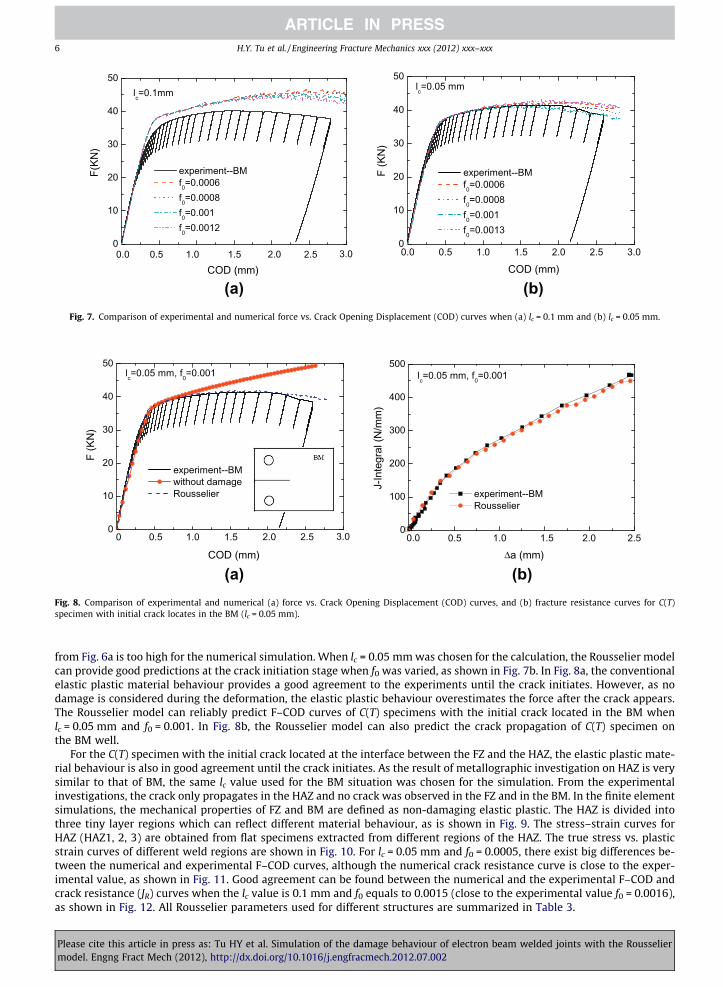
From these explanations, the initial void volume fraction f0 and average distance between voids lc are the Rousselier mod-el parameters to be fixed. These Rousselier parameters can be obtained from the optical microscope pictures. From the opti-cal microscope pictures of BM and HAZ, see Fig. 2, the voids are not average distributed but localized at some regions. Beforeadopted in the Rousselier model directly, these experimental values should be calibrated numerically. For the BM, numericalcalibrations are performed based on force vs. diametral reduction curves of notched round specimen. Typical lc values(lc = 0.05 mm, lc = 0.1 mm) which influence the slope of force vs. diameter reduction curves after the fracture point are usedfor the calibration of f0, see Schmauder et al. [11]. For notched round specimens with 4 mm notch radius, good agreementcan be obtained when lc = 0.1 mm, f0 = 0.0012 and lc = 0.05 mm, f0 = 0.001, see Fig. 6(a–b). These f0 values are very close to theexperimental value (f0 = 0.0009). This shows that if the numerical calibration of the Rousselier parameter is not available, thecorrect f0 value can be inversely obtained from the experimental investigations. These Rousselier parameter sets are used topredict the crack propagation of C(T) specimens with the initial crack located in the BM. Fig. 7 shows how the predicted F–COD curves of C(T) specimens varied with different f0 values when choosing lc = 0.1 mm and lc = 0.05 mm. For all the simu-lation results in Fig. 7a, the Rousselier model predicts too high forces at the crack initiation stage, showing that lc obtained
(a)
0
5
10
15
20
S355 base material
F (K
N) Experiment
f0=0.001 f0=0.0012 f0=0.0013 f0=0.0015
Notch radius R=4 mm lc=0.1 mm
0.80.60.4 1.0 1.2 1.4 1.6 1.80.20.0ΔD (mm)
(b)
0
5
10
15
20
S355 base material
8.12.0 1.61.41.21.00.80.60.40.2
Notch radius R=4 mm lc=0.05 mm
F (K
N)
ΔD (mm)
Experiment f0=0.0006 f0=0.0008 f0=0.001 f0=0.0013
Comparison of experimental and numerical force vs. cross section reduction curves when (a) lc = 0.1 mm and (b) lc = 0.05 mm for notched roundens extracted from the BM.
cite this article in press as: Tu HY et al. Simulation of the damage behaviour of electron beam welded joints with the Rousselier. Engng Fract Mech (2012), http://dx.doi.org/10.1016/j.engfracmech.2012.07.002
(a)
0
10
20
30
40
50
3.02.52.01.51.00.50.0
lc=0.1mmF(
KN)
COD (mm)
experiment--BM f0=0.0006 f0=0.0008 f0=0.001 f0=0.0012
(b)
0.0 0.5 1.0 1.5 2.0 2.5 3.00
10
20
30
40
50lc=0.05 mm
COD (mm)
experiment--BM f0=0.0006 f0=0.0008 f0=0.001 f0=0.0013
F (K
N)
Fig. 7. Comparison of experimental and numerical force vs. Crack Opening Displacement (COD) curves when (a) lc = 0.1 mm and (b) lc = 0.05 mm.
(a)
0
10
20
30
40
50lc=0.05 mm, f0=0.001
3.02.52.01.51.00.50
F (K
N)
COD (mm)
experiment--BM without damage Rousselier
(b)
0
100
200
300
400
500lc=0.05 mm, f0=0.001
2.52.01.51.00.50.0
J-In
tegr
al (N
/mm
)
Δa (mm)
experiment--BM Rousselier
Fig. 8. Comparison of experimental and numerical (a) force vs. Crack Opening Displacement (COD) curves, and (b) fracture resistance curves for C(T)specimen with initial crack locates in the BM (lc = 0.05 mm).
6 H.Y. Tu et al. / Engineering Fracture Mechanics xxx (2012) xxx–xxx
from Fig. 6a is too high for the numerical simulation. When lc = 0.05 mm was chosen for the calculation, the Rousselier modelcan provide good predictions at the crack initiation stage when f0 was varied, as shown in Fig. 7b. In Fig. 8a, the conventionalelastic plastic material behaviour provides a good agreement to the experiments until the crack initiates. However, as nodamage is considered during the deformation, the elastic plastic behaviour overestimates the force after the crack appears.The Rousselier model can reliably predict F–COD curves of C(T) specimens with the initial crack located in the BM whenlc = 0.05 mm and f0 = 0.001. In Fig. 8b, the Rousselier model can also predict the crack propagation of C(T) specimen onthe BM well.
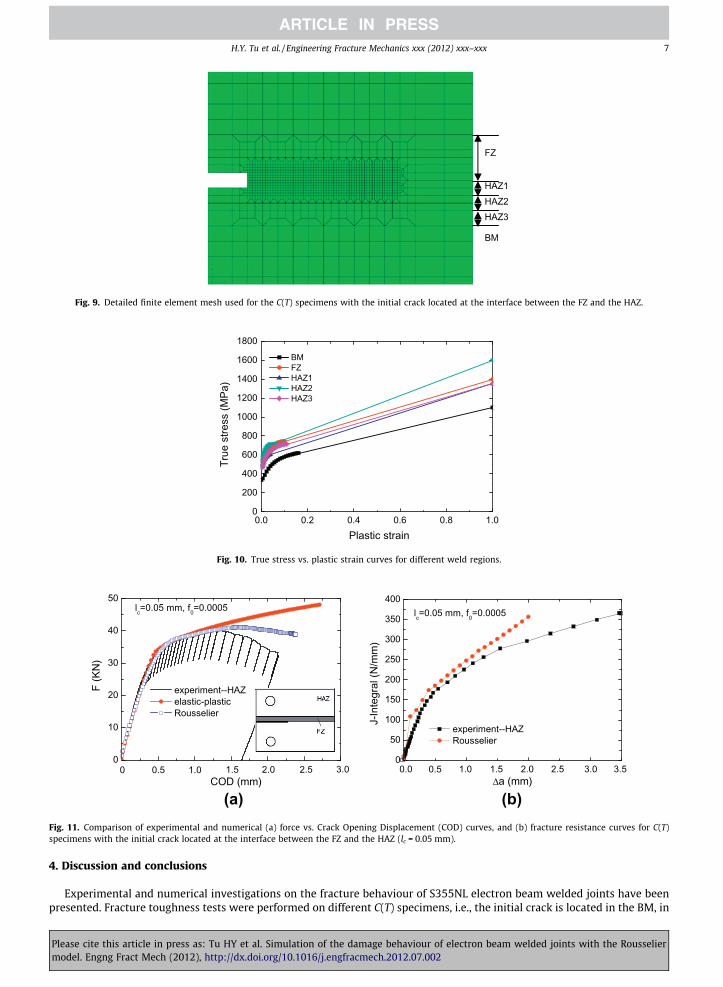
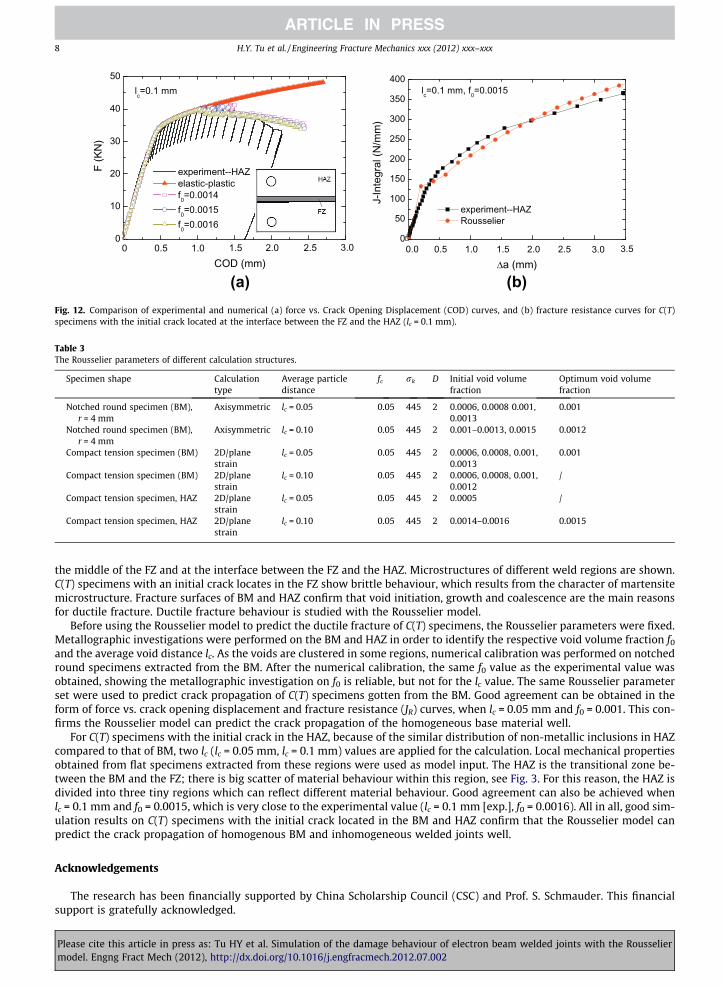
For the C(T) specimen with the initial crack located at the interface between the FZ and the HAZ, the elastic plastic mate-rial behaviour is also in good agreement until the crack initiates. As the result of metallographic investigation on HAZ is verysimilar to that of BM, the same lc value used for the BM situation was chosen for the simulation. From the experimentalinvestigations, the crack only propagates in the HAZ and no crack was observed in the FZ and in the BM. In the finite elementsimulations, the mechanical properties of FZ and BM are defined as non-damaging elastic plastic. The HAZ is divided intothree tiny layer regions which can reflect different material behaviour, as is shown in Fig. 9. The stress–strain curves forHAZ (HAZ1, 2, 3) are obtained from flat specimens extracted from different regions of the HAZ. The true stress vs. plasticstrain curves of different weld regions are shown in Fig. 10. For lc = 0.05 mm and f0 = 0.0005, there exist big differences be-tween the numerical and experimental F–COD curves, although the numerical crack resistance curve is close to the exper-imental value, as shown in Fig. 11. Good agreement can be found between the numerical and the experimental F–COD andcrack resistance (JR) curves when the lc value is 0.1 mm and f0 equals to 0.0015 (close to the experimental value f0 = 0.0016),as shown in Fig. 12. All Rousselier parameters used for different structures are summarized in Table 3.
Please cite this article in press as: Tu HY et al. Simulation of the damage behaviour of electron beam welded joints with the Rousseliermodel. Engng Fract Mech (2012), http://dx.doi.org/10.1016/j.engfracmech.2012.07.002
FZ
HAZ2HAZ3
HAZ1
BM
Fig. 9. Detailed finite element mesh used for the C(T) specimens with the initial crack located at the interface between the FZ and the HAZ.
0.0 0.2 0.4 0.6 0.8 1.00
200
400
600
800
1000
1200
1400
1600
1800
True
stre
ss (M
Pa)
Plastic strain
BM FZ HAZ1 HAZ2 HAZ3
Fig. 10. True stress vs. plastic strain curves for different weld regions.
(a)
0
10
20
30
40
50lc=0.05 mm, f0=0.0005
3.02.52.01.51.00.50
F (K
N)
COD (mm)
experiment--HAZ elastic-plastic Rousselier
(b)
0
50
100
150
200
250
300
350
400
experiment--HAZ Rousselier
lc=0.05 mm, f0=0.0005
J-In
tegr
al (N
/mm
)
3.53.02.52.01.51.00.50.0Δa (mm)
Fig. 11. Comparison of experimental and numerical (a) force vs. Crack Opening Displacement (COD) curves, and (b) fracture resistance curves for C(T)specimens with the initial crack located at the interface between the FZ and the HAZ (lc = 0.05 mm).
H.Y. Tu et al. / Engineering Fracture Mechanics xxx (2012) xxx–xxx 7
4. Discussion and conclusions
Experimental and numerical investigations on the fracture behaviour of S355NL electron beam welded joints have beenpresented. Fracture toughness tests were performed on different C(T) specimens, i.e., the initial crack is located in the BM, in
Please cite this article in press as: Tu HY et al. Simulation of the damage behaviour of electron beam welded joints with the Rousseliermodel. Engng Fract Mech (2012), http://dx.doi.org/10.1016/j.engfracmech.2012.07.002
(a)
0
10
20
30
40
50lc=0.1 mm
3.02.52.01.51.00.50
F (K
N)
COD (mm)
experiment--HAZ elastic-plastic f0=0.0014 f0=0.0015 f0=0.0016
(b)
0
50
100
150
200
250
300
350
400
experiment--HAZ Rousselier
lc=0.1 mm, f0=0.0015
J-In
tegr
al (N
/mm
)
3.0 3.52.52.01.51.00.50.0
Δa (mm)
Fig. 12. Comparison of experimental and numerical (a) force vs. Crack Opening Displacement (COD) curves, and (b) fracture resistance curves for C(T)specimens with the initial crack located at the interface between the FZ and the HAZ (lc = 0.1 mm).
Table 3The Rousselier parameters of different calculation structures.
Specimen shape Calculationtype
Average particledistance
fc rk D Initial void volumefraction
Optimum void volumefraction
Notched round specimen (BM),r = 4 mm
Axisymmetric lc = 0.05 0.05 445 2 0.0006, 0.0008 0.001,0.0013
0.001
Notched round specimen (BM),r = 4 mm
Axisymmetric lc = 0.10 0.05 445 2 0.001–0.0013, 0.0015 0.0012
Compact tension specimen (BM) 2D/planestrain
lc = 0.05 0.05 445 2 0.0006, 0.0008, 0.001,0.0013
0.001
Compact tension specimen (BM) 2D/planestrain
lc = 0.10 0.05 445 2 0.0006, 0.0008, 0.001,0.0012
/
Compact tension specimen, HAZ 2D/planestrain
lc = 0.05 0.05 445 2 0.0005 /
Compact tension specimen, HAZ 2D/planestrain
lc = 0.10 0.05 445 2 0.0014–0.0016 0.0015
8 H.Y. Tu et al. / Engineering Fracture Mechanics xxx (2012) xxx–xxx
the middle of the FZ and at the interface between the FZ and the HAZ. Microstructures of different weld regions are shown.C(T) specimens with an initial crack locates in the FZ show brittle behaviour, which results from the character of martensitemicrostructure. Fracture surfaces of BM and HAZ confirm that void initiation, growth and coalescence are the main reasonsfor ductile fracture. Ductile fracture behaviour is studied with the Rousselier model.
Before using the Rousselier model to predict the ductile fracture of C(T) specimens, the Rousselier parameters were fixed.Metallographic investigations were performed on the BM and HAZ in order to identify the respective void volume fraction f0
and the average void distance lc. As the voids are clustered in some regions, numerical calibration was performed on notchedround specimens extracted from the BM. After the numerical calibration, the same f0 value as the experimental value wasobtained, showing the metallographic investigation on f0 is reliable, but not for the lc value. The same Rousselier parameterset were used to predict crack propagation of C(T) specimens gotten from the BM. Good agreement can be obtained in theform of force vs. crack opening displacement and fracture resistance (JR) curves, when lc = 0.05 mm and f0 = 0.001. This con-firms the Rousselier model can predict the crack propagation of the homogeneous base material well.
For C(T) specimens with the initial crack in the HAZ, because of the similar distribution of non-metallic inclusions in HAZcompared to that of BM, two lc (lc = 0.05 mm, lc = 0.1 mm) values are applied for the calculation. Local mechanical propertiesobtained from flat specimens extracted from these regions were used as model input. The HAZ is the transitional zone be-tween the BM and the FZ; there is big scatter of material behaviour within this region, see Fig. 3. For this reason, the HAZ isdivided into three tiny regions which can reflect different material behaviour. Good agreement can also be achieved whenlc = 0.1 mm and f0 = 0.0015, which is very close to the experimental value (lc = 0.1 mm [exp.], f0 = 0.0016). All in all, good sim-ulation results on C(T) specimens with the initial crack located in the BM and HAZ confirm that the Rousselier model canpredict the crack propagation of homogenous BM and inhomogeneous welded joints well.
Acknowledgements
The research has been financially supported by China Scholarship Council (CSC) and Prof. S. Schmauder. This financialsupport is gratefully acknowledged.
Please cite this article in press as: Tu HY et al. Simulation of the damage behaviour of electron beam welded joints with the Rousseliermodel. Engng Fract Mech (2012), http://dx.doi.org/10.1016/j.engfracmech.2012.07.002
H.Y. Tu et al. / Engineering Fracture Mechanics xxx (2012) xxx–xxx 9
References
[1] McClintock FA. A criterion for ductile fracture by growth of holes. J Appl Mech 1968;35:363–71.[2] Rice JR, Tracey DM. On the ductile enlargement of voids in triaxial stress fields. J Mech Phys Solids 1969;17:201–17.[3] Bishop JFW, Hill R. A theory of the plastic distortion of a polycrystalline aggregate under combined stress. Philos Mag 1951;42:414–27.[4] Gurson AL. Continuum theory of ductile rupture by void nucleation and growth: Part I-Yield criteria and flow rules for porous ductile media. J Eng
Mater Techno-Trans ASME 1977;99:2–15.[5] Tvergaard V. Influence of void nucleation on ductile shear fracture at a free surface. J Mech Phys Solids 1982;30:399–425.[6] Tvergaard V, Needleman A. Analysis of the cup-cone fracture in a round tensile bar. Acta Metall 1984;32:157–69.[7] Tvergaard V. Material failure by void growth to coalescence. Adv Appl Mech 1989;27:83–151.[8] Rousselier G. Ductile fracture models and their potential in local approach of fracture. Nucl Eng Des 1987;105:97–111.[9] Rousselier G. The Rousselier model for porous metal plasticity and ductile fracture. Handbook of materials behaviour models 2001:436–45.
[10] Seidenfuß M. Untersuchungen zur Beschreibung des Versagensverhaltens mit Hilfe von Schädigungsmodellen am Beispiel des Werkstoffes20MnMoNi55. Dissertation, Universität Stuttgart; 1992.
[11] Schmauder S, Uhlmann D, Zies G. Experimental and numerical investigations of two material states of the material 15NiCuMoNb5 (WB 36). CompMater Sci 2002;25:174–92.
[12] Østby E, Thaulow C, Zhang ZL. Numerical simulations of specimen size and mismatch effects in ductile crack growth - Part I: tearing resistance andcrack growth paths. Eng Fract Mech 2007;74:1770–92.
[13] Østby E, Thaulow C, Zhang ZL. Numerical simulations of specimen size and mismatch effects in ductile crack growth - Part II: near-tip stress fields. EngFract Mech 2007;74:1793–809.
[14] Needleman A, Tvergaard V. A micromechanical analysis of ductile–brittle transition at a weld. Eng Fract Mech 1999;62:317–38.[15] Tvergaard V, Needleman A. Analysis of the Charpy V-notch test for welds. Eng Fract Mech 2000;65:627–43.[16] Tvergaard V, Needleman A. 3D analyses of the effect of weld orientation in Charpy specimens. Eng Fract Mech 2004;71:2179–95.[17] Çam G, Koçak M, Dos Santos JF. Developments in laser welding of metallic materials and characterization of the joints. Weld World 1999;43:13–26.[18] Dos Santos JF, Çam G, Torster F, Insfran A, Riekehr S, Ventzke V. Properties of power beam welded steel, Al-and Ti alloys: significance of strength
mismatch. Weld World 2000;44:42–64.[19] Nègre P, Steglich D, Brocks W. Crack extension in aluminium welds: a numerical approach using the Gurson–Tvergaard–Needleman model. Eng Fract
Mech 2003;71:2365–83.[20] Cambrésy P. Damage and fracture mechanisms investigations of an aluminium laser beam weld. Ph.D. dissertation, GKSS Research Center; 2006.[21] Nègre P, Steglich D, Brocks W. Crack extension at an interface. prediction of fracture toughness and simulation of crack path deviation. Int J Fract
2005;134:209–29.[22] Nonn A, Dahl W, Bleck W. Numerical modelling of damage behaviour of laser-hybrid welds. Eng Fract Mech 2008;75:3251–63.[23] ASTM E1820–96. Standard test method for measurement of fracture toughness. In: Annual Book of ASTM Standards, Vol. 03.01. America Society for
Testing and Materials Philadelphia, PA, USA.[24] Mühlich U, Steglich D, Besson J, Brocks W. A user-material subroutine of the Rousselier-model of porous metal plasticity, Technical Note GKSS/WMS/
00/02, GKSS Research Center; 2000.
Please cite this article in press as: Tu HY et al. Simulation of the damage behaviour of electron beam welded joints with the Rousseliermodel. Engng Fract Mech (2012), http://dx.doi.org/10.1016/j.engfracmech.2012.07.002