Embed Size (px)
Citation preview
CONFIDENTIAL REPORT
ESA CONTRACT 15689/01/NL/ND TECHNICAL NOTE 71.7 EWC 1
ENGINEERING OF
THE WASTE COMPARTMENT
ESA contract 15689/01/NL/ND
TECHNICAL NOTE 71.7
Instruments review, trade-off and selection
Version : 1
Issue : 2
Name Signature
Prepared by: Frankie Van Houteghem
Farida Doulami
Approved by: Henk Vanhooren
Dries Demey
17 May 2004
CONFIDENTIAL REPORT
ESA CONTRACT 15689/01/NL/ND TECHNICAL NOTE 71.7 EWC 2
DOCUMENT CHANGE LOG
Version Issue Date Observation
1 0 24 February 2004 Draft
1 1 24 March 2004 Draft
1 2 17 May 2004 Draft
DISTRIBUTION LIST
Quantity Company/Department Name 2 ESA C. Lasseur
1 EPAS D. Demey
N. Michel
F. Van Houteghem
1 UAB J.Albiol
F. Godia
1 UBP C.G. Dussap
L. Poughon
1 VITO H. De wever
1 LabMET W. Verstraete
1 U. Guelph M.A. Dixon
1 SCK M. Mergeay
CONFIDENTIAL REPORT
ESA CONTRACT 15689/01/NL/ND TECHNICAL NOTE 71.7 EWC 3
CONTENT
INTRODUCTION 11
1. GENERAL 12
1.1 FITTINGS AND CONNECTIONS 12 1.1.1 TRI-WELD ® / TRI-CLAMP ® (TRI-CLOVER) 12 1.1.2 TUBE CONNECTIONS 12 1.1.3 INGOLD PORTS AND HOUSINGS FOR SENSOR FITTING 13 1.2 PRESSURE TRANSDUCER 14 1.2.1 REVIEW 14 1.2.2 MEASUREMENT PRINCIPLES 14 1.2.3 TRADE-OFF 15 1.2.4 SELECTION 16
2. BIOREACTOR 17
2.1 LEVEL (LD-R-001) 18 2.1.1 REVIEW 18 2.1.2 MEASUREMENT PRINCIPLES 18 2.1.3 TRADE-OFF 20 2.1.4 SELECTION 21 2.2 HEAT EXCHANGER (HX-R-001) 21 2.3 TEMPERATURE (TT-R-001) 22 2.3.1 REVIEW 22 2.3.2 MEASUREMENT PRINCIPLES 22 2.3.3 TRADE-OFF 23 2.3.4 SELECTION 24 2.4 PH (PHS-R-001) 25 2.4.1 REVIEW 25 2.4.2 MEASUREMENT PRINCIPLES 25 2.4.3 TRADE-OFF 26 2.4.4 SELECTION 26 2.5 REDOX POTENTIAL (ORPS-R-001) 27 2.6 ELECTRICAL CONDUCTIVITY (EC) (ECD-R-001) 27 2.6.1 REVIEW 27 2.6.2 MEASUREMENT PRINCIPLES 28 2.6.3 TRADE-OFF 28 2.6.4 SELECTION 29 2.7 TRANSMITTER (PHT-R-001, PHT-R002, ORPT-R-001, ECT-R-001) 29 2.8 ON-LINE MEASUREMENT OF SOLIDS CONTENT IN THE REACTOR (SS-R-001) 30 2.8.1 REVIEW 30 2.8.2 MEASUREMENT PRINCIPLES 30 2.8.3 TRADE-OFF 31 2.8.4 SELECTION 31 2.9 ALKALINITY (AD-R-001) 32 2.10 VIABLE BIOMASS MONITORING (BD-R-001) 33 2.10.1 REVIEW 33 2.10.2 MEASUREMENT PRINCIPLES 33 2.10.3 TRADE-OFF AND SELECTION 34
CONFIDENTIAL REPORT
ESA CONTRACT 15689/01/NL/ND TECHNICAL NOTE 71.7 EWC 4
2.11 VALVES 34 2.11.1 LIQUID SAMPLING (V-R-001) 34 2.11.2 GAS SAMPLING (V-R-002) 34 2.11.3 PRESSURE RELIEF VALVE (V-R-003) 34 2.12 CONNECTIONS 35
3. LIQUID LOOP 36
3.1 BUFFER REACTOR (R-F-001) 36 3.2 RECIRCULATION PUMP (PMP-F-001) 38 3.3 PRESSURE TRANSDUCERS (PD-F-001, PD-F-002, PD-F-003) 38 3.4 FLOW METER (FI-F-001, FD-F-001, FD-F-002) 39 3.4.1 REVIEW 39 3.4.2 MEASUREMENT PRINCIPLES 39 3.4.3 TRADE-OFF 40 3.4.4 SELECTION 41 3.5 WEIGHING BALANCE (WD-F-001) 41 3.6 VFA ANALYZER 41 3.6.1 MEASUREMENT PRINCIPLES TRADE-OFF AND SELECTION 41 3.6.2 TRADE-OFF OF GAS CHROMATOGRAPHS 44 3.6.3 SELECTION OF GAS CHROMATOGRAPH 46 3.6.4 SAMPLING METHODS FOR ON-LINE ANALYSIS 46 3.6.5 ON-LINE VFA ANALYSIS 48 3.7 ON-LINE AMMONIUM ANALYSERS 50 3.7.1 REVIEW 50 3.7.2 MEASUREMENT PRINCIPLES 50 3.7.3 TRADE-OFF 52 3.7.4 SELECTION 54 3.8 VALVES (V-F-0XX) 55 3.9 PIPING 56 3.10 CONNECTIONS 56
4. GAS LOOP 57
4.1 EXHAUST GASES POMP (PMP-G-001) 57 4.2 CONDENSATE REMOVAL FROM BUFFER VESSEL 59 4.3 HEAT-EXCHANGER (HX-G-001) 60 4.4 PRESSURE MEASUREMENT (PD-G-001, PD-G-002, PD-G-003, PD-G-004) 60 4.5 PRESSURE INDICATOR (PI-G-001, PI-G-002, PI-G-003) 61 4.6 PRESSURE REGULATORS 61 4.6.1 LOCAL CONTROL (HARDWARE BASED) 61 4.6.2 PLC CONTROL (SOFTWARE BASED) 62 4.6.3 CONCLUSION 63 4.7 FLOW (FI-G-001, FI-G-002, FI-G-003) 63 4.7.1 REVIEW 63 4.7.2 MEASUREMENT PRINCIPLES 63 4.7.3 TRADE-OFF 66 4.7.4 SELECTION 66 4.8 GAS ANALYSERS 67 4.8.1 REVIEW 67 4.8.2 TRADE-OFF AND SELECTION OF CH4 AND CO2 MEASUREMENT APPARATUS 68 4.9 VALVES 70 4.9.1 OTHER VALVES (V-G-00X) 70 4.10 TUBING 71
CONFIDENTIAL REPORT
ESA CONTRACT 15689/01/NL/ND TECHNICAL NOTE 71.7 EWC 5
4.11 CONNECTIONS 71
CONCLUSION 73
CONFIDENTIAL REPORT
ESA CONTRACT 15689/01/NL/ND TECHNICAL NOTE 71.7 EWC 6
LIST OF FIGURES
Figure 1: Fittings welded onto a reactor..............................................................................................................12
Figure 2: Swagelok tube fitting............................................................................................................................12
Figure 3: InTrac SL-fitting...................................................................................................................................13
Figure 4: Average roughness Ra ..........................................................................................................................16
Figure 5: Reactor configuration and instrumentation .........................................................................................17
Figure 6: Different types of level sensors............................................................................................................18
Figure 7: Julabo heat circulator............................................................................................................................22
Figure 8: Optek turbidity meter with proces connections...................................................................................31
Figure 9: Lambert-Beer law.................................................................................................................................31
Figure 10: Flow of yeast suspension in pipe work past the Yeast Monitor Probe ............................................33
Figure 11: Biomass probe (Aber) ........................................................................................................................33
Figure 12: Biomass probe (NTE) ........................................................................................................................33
Figure 13: Liquiphant T FTL 260........................................................................................................................36
Figure 14: General concept of the liquid loop with filtration module................................................................37
Figure 15: Picture of progressive cavity pump ...................................................................................................38
Figure 16: Principle of an electromagnetic flow meter.......................................................................................40
Figure 17: Principle of a coriolis flow meter.......................................................................................................40
Figure 18: Principle of vortex flow meter ...........................................................................................................40
Figure 19: Principle of ultrasonic flow meter......................................................................................................40
Figure 20: GC-2010 from Shimadzu Benelux....................................................................................................43
Figure 21: Shimadzu AOC-5000 for on-line VFA analysis...............................................................................48
Figure 22: Data acquisition of the VFA analyser................................................................................................49
Figure 23: Measurement principle with the standard addition method .............................................................50
Figure 24: Schematic representation of the principle and components of a diaphragm pump.........................57
Figure 25: General concept of the gas loop.........................................................................................................58
Figure 26: Dimensions of an automatic liquid drain...........................................................................................60

CONFIDENTIAL REPORT
ESA CONTRACT 15689/01/NL/ND TECHNICAL NOTE 71.7 EWC 7
Figure 27: Schematic representation of an electronic liquid drain.....................................................................60
Figure 28: Working of a rotameter ......................................................................................................................64
Figure 29: Orifice plate ........................................................................................................................................64
Figure 30: Flow nozzle.........................................................................................................................................64
Figure 31: Measurement principle of Coriolis flow meter .................................................................................65
CONFIDENTIAL REPORT
ESA CONTRACT 15689/01/NL/ND TECHNICAL NOTE 71.7 EWC 8
LIST OF TABLES
Table 1: List of abbreviations...............................................................................................................................10
Table 2: Comparison of the InTrac models.........................................................................................................14
Table 3: Comparison of the pressure transducers ...............................................................................................15
Table 4: Overview of all pressure transducers ....................................................................................................16
Table 5: Specification for bioreactor level ..........................................................................................................18
Table 6: Comparison of level sensors..................................................................................................................21
Table 7: Specification for bioreactor temperature measurement .......................................................................23
Table 8: Comparison of temperature sensors......................................................................................................24
Table 9: Specifications of pH electrode...............................................................................................................25
Table 10: Comparison of pH electrodes..............................................................................................................26
Table 11: Specifications of EC transducer ..........................................................................................................27
Table 12: Comparison of the conductivity sensors.............................................................................................28
Table 13: Comparison of 2 Knick transmitters: Stratos and Protos...................................................................29
Table 14: Specifications of solid content measurement .....................................................................................30
Table 15: Comparison of turbidity measurements in the bioreactor..................................................................32
Table 16: Overview of the connections on the bioreactor..................................................................................35
Table 17: Specifications of flow meter................................................................................................................39
Table 18: Comparison of flow meters.................................................................................................................41
Table 19: Trade-off of Infrared spectroscopy and gas chromatography............................................................42
Table 20: Component requirement sheet of the VFA-analyser..........................................................................44
Table 21: Proposed gas chromatographs.............................................................................................................45
Table 22: Trade-off of the VFA analyser............................................................................................................46
Table 23: Liquid injection....................................................................................................................................49
Table 24: Headspace and SPME injection..........................................................................................................49
Table 25: Component requirement sheet of the NH4+-analyser .........................................................................51
Table 26: Comparison of ammonium analysers .................................................................................................53
CONFIDENTIAL REPORT
ESA CONTRACT 15689/01/NL/ND TECHNICAL NOTE 71.7 EWC 9
Table 27: Trade-off of the ammonium analyser .................................................................................................54
Table 28: Overview of the valves in the liquid loop...........................................................................................55
Table 29: Prices of valves in liquid loop .............................................................................................................56
Table 30: Comparison of exhaust gases pumps..................................................................................................59
Table 31: Specifications of flow meter in gas loop.............................................................................................63
Table 32: Comparison of flow measurement principle ......................................................................................66
Table 33: Selection of flow meters in gas loop...................................................................................................67
Table 34: Major components of the gas phase of the first compartment..........................................................67
Table 35: Trade-off of the gas analyser...............................................................................................................69
Table 36: Overview of the valves in the gas loop...............................................................................................70
Table 37: Manual valves in the gas loop.............................................................................................................71
Table 38: Comparison of polymers .....................................................................................................................71
Table 39: Examples of connection and ordering code........................................................................................72
Table 40: Overview of all selected hardware in CI.............................................................................................73

CONFIDENTIAL REPORT
ESA CONTRACT 15689/01/NL/ND TECHNICAL NOTE 71.7 EWC 10
LIST OF ABBREVIATIONS
POM Poly-oxy-methylene
PVDF Poly-vinlylidene-fluoride
PP Polypropylene
FPM Fluoro-carbon elastomer (Viton®) (DIN/ISO 1629 designation)
PTFE Poly-tetra-fluoro-ethylene
PFA Per-fluor-alkoxy
PA Poly-amide (Nylon®)
PEEK Poly-ether-ether-ketone
EPDM Ethylene-propylene-diene-terpolymer
EPR Ethylene-propylene rubber
PVC Poly-vinyl-choride
PUR Polyurethane
SS Stainless steel
VMQ Vinyl-methyl-silicone rubber
DXK Polymer used in pH electrodes (Xerolyt®)
Bar Bar (relative to atmospheric pressure)
Bara Bar (absolute)
Psi Pounds per square inch
Psig Pounds per square inch (relative to atmospheric pressure)
CI Compartment I (first compartment of the MELiSSA loop)
ORP Oxydation reduction potential
EC Electro conductivity
VFA Volatile fatty acid
GC Gas chromatography
FID Flame ionisation detection
TCD Valco thermal conductivity
ECD Electron capture detector
NPD Neutral particle detector
FPD Flame photometric detector
MSD Mass-selective detector
IR Infrared
SPME Solid phase micro extraction
ISE Ion selective electrode
PLC Programmable logic control
CIP Cleaning in place
SIP Sterilisation in place
FS(O) Full scale (of operation)
Ra R = roughness ; a = average (see p 15)
VAT Value added tax
E+H Endress+Hauser
MT Mettler Toledo
AISI American Iron and Steel Institute
ISO International Organisation for Standardisation
Table 1: List of abbreviations
CONFIDENTIAL REPORT
ESA CONTRACT 15689/01/NL/ND TECHNICAL NOTE 71.7 EWC 11
Introduction
This technical note describes the pathway that was followed in order to select the most appropriate instrumentation associated with Compartment I (CI). This note describes the trade-off and selection of the measurement equipment but also of the actuators.
Chapter 1 discusses pressure transducers and several types of connections, which are used in whole compartment I. Chapter 2 of this note discusses the instruments of the bioreactor. Chapter 3 reviews the liquid loop and chapter 4 is devoted to the instrumentation in the gas loop.
The working principles of the measurement equipment were already extensively discussed in TN 72.2, TN 72.4 and TN 72.5 (as requested by ESA), and this will be partially repeated. Furthermore, available instruments on the market based on the selected measurement principle will be compared and selected.
Selection criteria for measurement equipment are:
• Measurement principle
• Measurement range
• Accuracy
o Long term stability
o Signal stability
o Repeatability
o Linearity
• Interferences
• Response time
• Temperature range
• Pressure range
• Material/corrosion resistance
• Connection
• Price
For measuring equipment a 4-20 mA signal is always selected as output signal. Instrument-specific selection criteria are stated in the review of each instrument.
Only instruments that can be delivered and maintained in Belgium, where compartment I is built, as well as in Spain, where the pilot plant will be operated at UAB, are considered. Furthermore, sensors and transmitters must be compatible with the MELiSSA Pilot Plant hardware to enhance uniformity between the MELiSSA compartments.
Based on all selection criteria instruments are compared. The most suited instrument is selected, purchased, tested and evaluated. The end of this TN describes the selected instrument in the form of a data sheet. More technical data and manuals from the manufacturer will be provided in TN 71.9. Pressure values are always relative, unless stated otherwise. After a type of instrument, the company name can be found in brackets. All prices are given excluding VAT.
CONFIDENTIAL REPORT
ESA CONTRACT 15689/01/NL/ND TECHNICAL NOTE 71.7 EWC 12
1. General
1.1 Fittings and connections
All sensors, which are mounted on the reactor should easily be mounted and removed from the bioreactor, without disturbing the process. pH sensors for example must be checked every 2 weeks. This can be done using a retractable fitting.
The retractable fittings will be used for the pH sensors, ORP and conductivity measurement. They are discussed in paragraph 2.4, paragraph 2.5 and paragraph 2.6.
1.1.1 Tri-weld ® / Tri-Clamp ® (Tri-Clover)
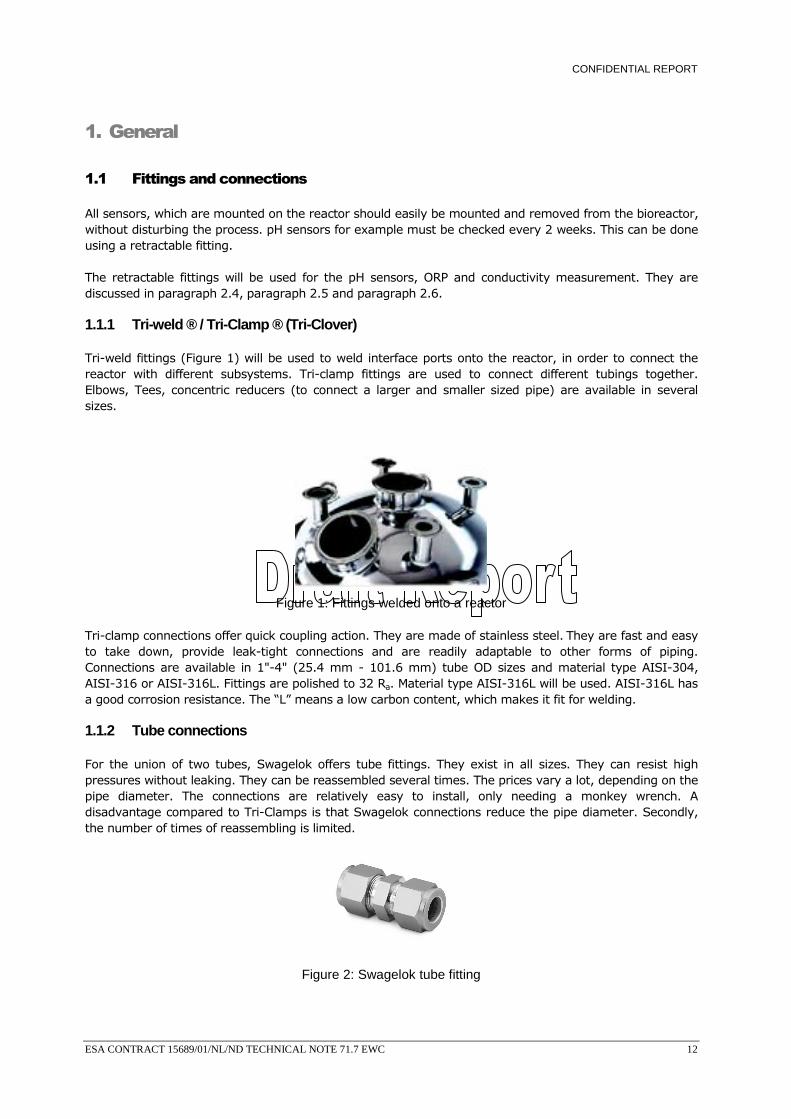
Tri-weld fittings (Figure 1) will be used to weld interface ports onto the reactor, in order to connect the reactor with different subsystems. Tri-clamp fittings are used to connect different tubings together. Elbows, Tees, concentric reducers (to connect a larger and smaller sized pipe) are available in several sizes.
Figure 1: Fittings welded onto a reactor
Tri-clamp connections offer quick coupling action. They are made of stainless steel. They are fast and easy to take down, provide leak-tight connections and are readily adaptable to other forms of piping. Connections are available in 1"-4" (25.4 mm - 101.6 mm) tube OD sizes and material type AISI-304, AISI-316 or AISI-316L. Fittings are polished to 32 Ra. Material type AISI-316L will be used. AISI-316L has a good corrosion resistance. The “L” means a low carbon content, which makes it fit for welding.
1.1.2 Tube connections
For the union of two tubes, Swagelok offers tube fittings. They exist in all sizes. They can resist high pressures without leaking. They can be reassembled several times. The prices vary a lot, depending on the pipe diameter. The connections are relatively easy to install, only needing a monkey wrench. A disadvantage compared to Tri-Clamps is that Swagelok connections reduce the pipe diameter. Secondly, the number of times of reassembling is limited.
Figure 2: Swagelok tube fitting
CONFIDENTIAL REPORT
ESA CONTRACT 15689/01/NL/ND TECHNICAL NOTE 71.7 EWC 13
1.1.3 Ingold ports and housings for sensor fitting
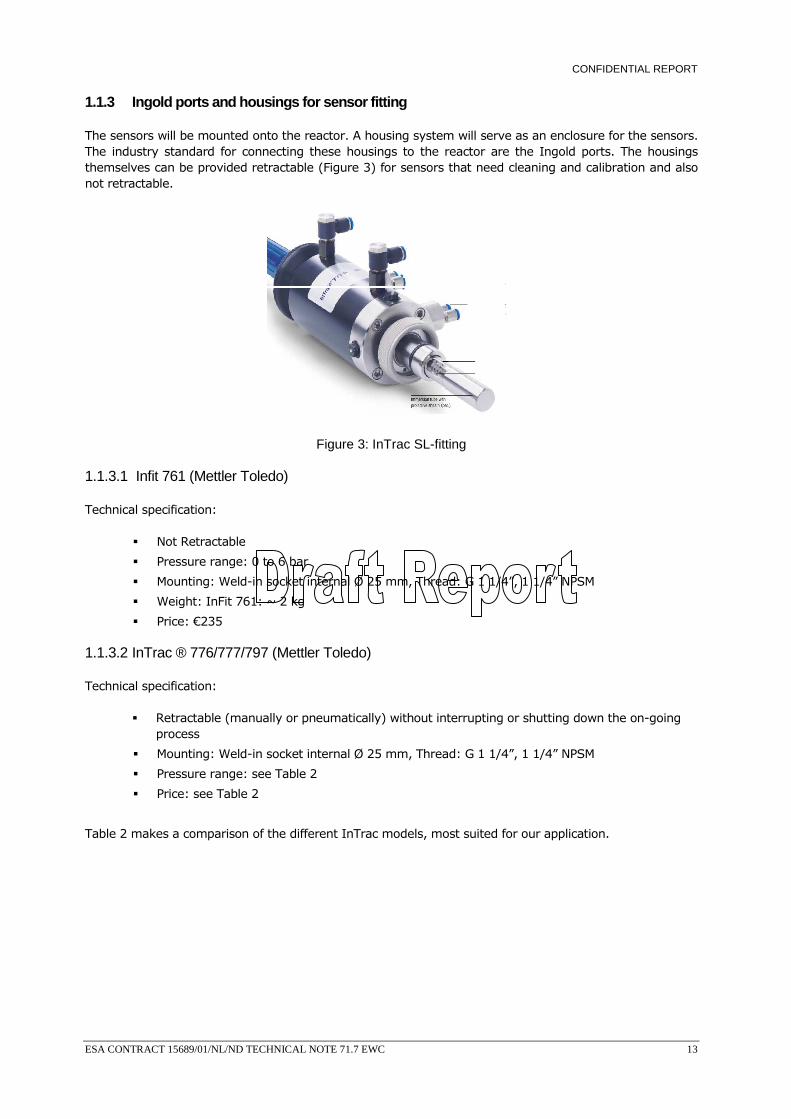
The sensors will be mounted onto the reactor. A housing system will serve as an enclosure for the sensors. The industry standard for connecting these housings to the reactor are the Ingold ports. The housings themselves can be provided retractable (Figure 3) for sensors that need cleaning and calibration and also not retractable.
Figure 3: InTrac SL-fitting
1.1.3.1 Infit 761 (Mettler Toledo)
Technical specification:
Not Retractable
Pressure range: 0 to 6 bar
Mounting: Weld-in socket internal Ø 25 mm, Thread: G 1 1/4”, 1 1/4” NPSM
Weight: InFit 761: ~ 2 kg
Price: €235
1.1.3.2 InTrac ® 776/777/797 (Mettler Toledo)
Technical specification:
Retractable (manually or pneumatically) without interrupting or shutting down the on-going process
Mounting: Weld-in socket internal Ø 25 mm, Thread: G 1 1/4”, 1 1/4” NPSM
Pressure range: see Table 2
Price: see Table 2
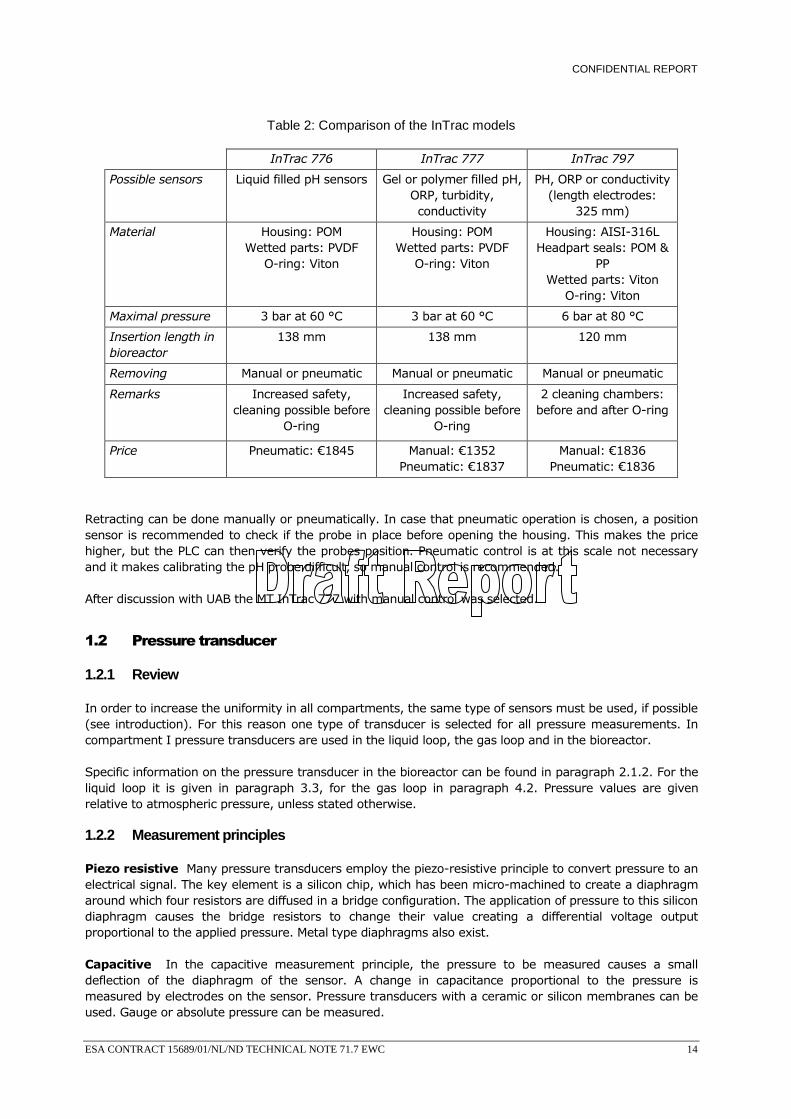
Table 2 makes a comparison of the different InTrac models, most suited for our application.
CONFIDENTIAL REPORT
ESA CONTRACT 15689/01/NL/ND TECHNICAL NOTE 71.7 EWC 14
Table 2: Comparison of the InTrac models
InTrac 776 InTrac 777 InTrac 797
Possible sensors Liquid filled pH sensors Gel or polymer filled pH, ORP, turbidity, conductivity
PH, ORP or conductivity (length electrodes:
325 mm)
Material Housing: POM Wetted parts: PVDF
O-ring: Viton
Housing: POM Wetted parts: PVDF
O-ring: Viton
Housing: AISI-316L Headpart seals: POM &
PP Wetted parts: Viton
O-ring: Viton
Maximal pressure 3 bar at 60 °C 3 bar at 60 °C 6 bar at 80 °C
Insertion length in bioreactor
138 mm 138 mm 120 mm
Removing Manual or pneumatic Manual or pneumatic Manual or pneumatic
Remarks Increased safety, cleaning possible before
O-ring
Increased safety, cleaning possible before
O-ring
2 cleaning chambers: before and after O-ring
Price Pneumatic: €1845 Manual: €1352 Pneumatic: €1837
Manual: €1836 Pneumatic: €1836
Retracting can be done manually or pneumatically. In case that pneumatic operation is chosen, a position sensor is recommended to check if the probe in place before opening the housing. This makes the price higher, but the PLC can then verify the probes position. Pneumatic control is at this scale not necessary and it makes calibrating the pH probe difficult, so manual control is recommended.
After discussion with UAB the MT InTrac 777 with manual control was selected.
1.2 Pressure transducer
1.2.1 Review
In order to increase the uniformity in all compartments, the same type of sensors must be used, if possible (see introduction). For this reason one type of transducer is selected for all pressure measurements. In compartment I pressure transducers are used in the liquid loop, the gas loop and in the bioreactor.
Specific information on the pressure transducer in the bioreactor can be found in paragraph 2.1.2. For the liquid loop it is given in paragraph 3.3, for the gas loop in paragraph 4.2. Pressure values are given relative to atmospheric pressure, unless stated otherwise.
1.2.2 Measurement principles
Piezo resistive Many pressure transducers employ the piezo-resistive principle to convert pressure to an electrical signal. The key element is a silicon chip, which has been micro-machined to create a diaphragm around which four resistors are diffused in a bridge configuration. The application of pressure to this silicon diaphragm causes the bridge resistors to change their value creating a differential voltage output proportional to the applied pressure. Metal type diaphragms also exist.
Capacitive In the capacitive measurement principle, the pressure to be measured causes a small deflection of the diaphragm of the sensor. A change in capacitance proportional to the pressure is measured by electrodes on the sensor. Pressure transducers with a ceramic or silicon membranes can be used. Gauge or absolute pressure can be measured.
CONFIDENTIAL REPORT
ESA CONTRACT 15689/01/NL/ND TECHNICAL NOTE 71.7 EWC 15
1.2.3 Trade-off
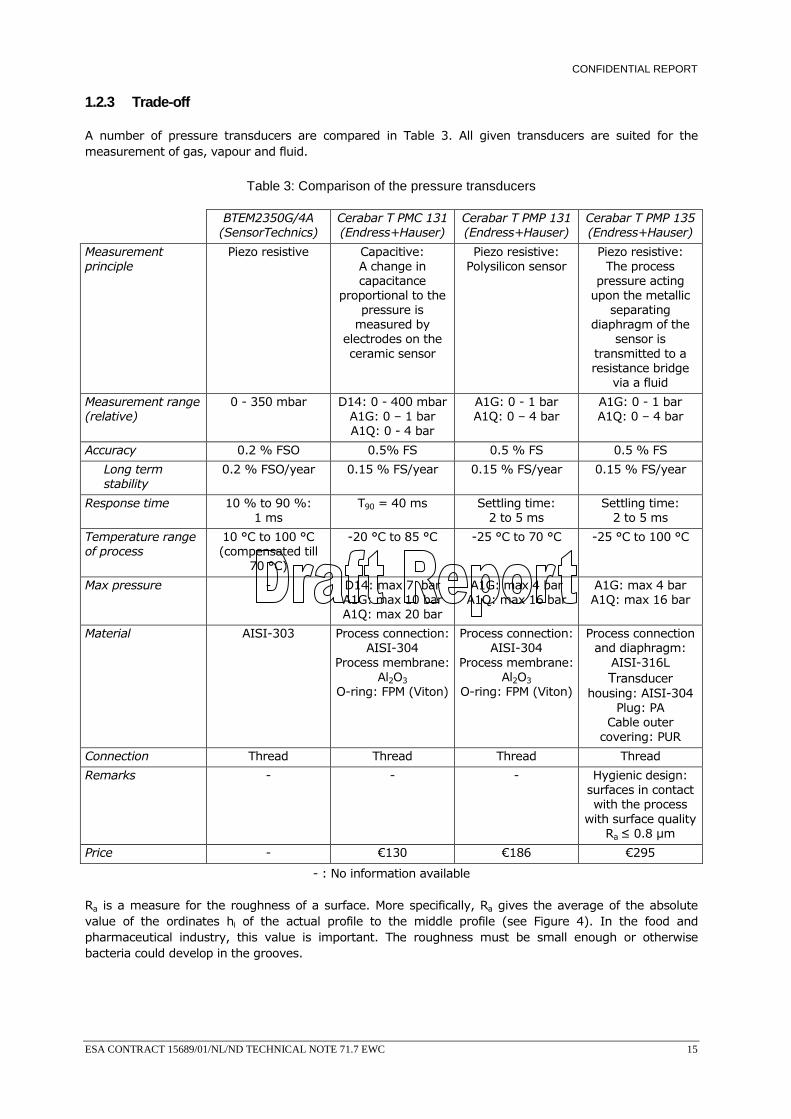
A number of pressure transducers are compared in Table 3. All given transducers are suited for the measurement of gas, vapour and fluid.
Table 3: Comparison of the pressure transducers
BTEM2350G/4A (SensorTechnics)
Cerabar T PMC 131 (Endress+Hauser)
Cerabar T PMP 131 (Endress+Hauser)
Cerabar T PMP 135(Endress+Hauser)
Measurement principle
Piezo resistive Capacitive: A change in capacitance
proportional to the pressure is
measured by electrodes on the ceramic sensor
Piezo resistive: Polysilicon sensor
Piezo resistive: The process
pressure acting upon the metallic
separating diaphragm of the
sensor is transmitted to a resistance bridge
via a fluid
Measurement range (relative)
0 - 350 mbar D14: 0 - 400 mbarA1G: 0 – 1 bar A1Q: 0 - 4 bar
A1G: 0 - 1 bar A1Q: 0 – 4 bar
A1G: 0 - 1 bar A1Q: 0 – 4 bar
Accuracy 0.2 % FSO 0.5% FS 0.5 % FS 0.5 % FS
Long term stability
0.2 % FSO/year 0.15 % FS/year 0.15 % FS/year 0.15 % FS/year
Response time 10 % to 90 %: 1 ms
T90 = 40 ms Settling time: 2 to 5 ms
Settling time: 2 to 5 ms
Temperature range of process
10 °C to 100 °C (compensated till
70 °C)
-20 °C to 85 °C -25 °C to 70 °C -25 °C to 100 °C
Max pressure - D14: max 7 bar A1G: max 10 bar A1Q: max 20 bar
A1G: max 4 bar A1Q: max 16 bar
A1G: max 4 bar A1Q: max 16 bar
Material AISI-303 Process connection: AISI-304
Process membrane: Al2O3
O-ring: FPM (Viton)
Process connection: AISI-304
Process membrane: Al2O3
O-ring: FPM (Viton)
Process connection and diaphragm:
AISI-316L Transducer
housing: AISI-304Plug: PA
Cable outer covering: PUR
Connection Thread Thread Thread Thread
Remarks - - - Hygienic design: surfaces in contact with the process
with surface quality Ra ≤ 0.8 µm
Price - €130 €186 €295
- : No information available
Ra is a measure for the roughness of a surface. More specifically, Ra gives the average of the absolute value of the ordinates hi of the actual profile to the middle profile (see Figure 4). In the food and pharmaceutical industry, this value is important. The roughness must be small enough or otherwise bacteria could develop in the grooves.
CONFIDENTIAL REPORT
ESA CONTRACT 15689/01/NL/ND TECHNICAL NOTE 71.7 EWC 16
Figure 4: Average roughness Ra
1.2.4 Selection
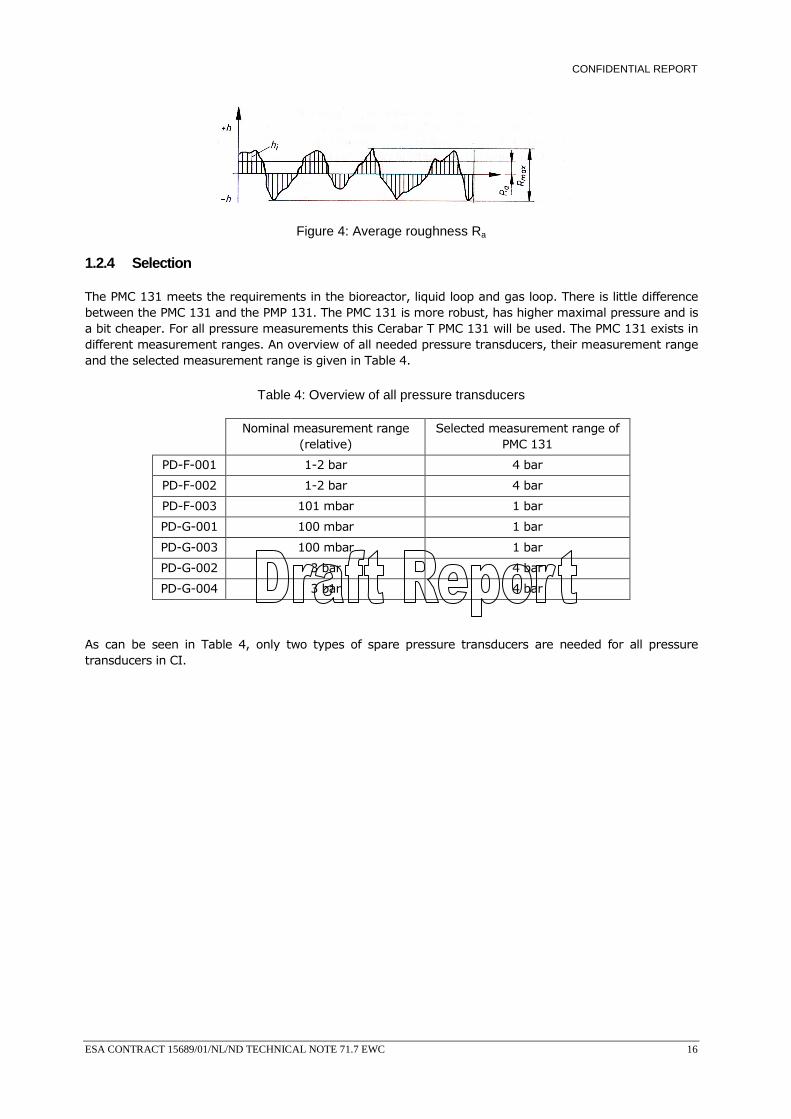
The PMC 131 meets the requirements in the bioreactor, liquid loop and gas loop. There is little difference between the PMC 131 and the PMP 131. The PMC 131 is more robust, has higher maximal pressure and is a bit cheaper. For all pressure measurements this Cerabar T PMC 131 will be used. The PMC 131 exists in different measurement ranges. An overview of all needed pressure transducers, their measurement range and the selected measurement range is given in Table 4.
Table 4: Overview of all pressure transducers
Nominal measurement range (relative)
Selected measurement range of PMC 131
PD-F-001 1-2 bar 4 bar
PD-F-002 1-2 bar 4 bar
PD-F-003 101 mbar 1 bar
PD-G-001 100 mbar 1 bar
PD-G-003 100 mbar 1 bar
PD-G-002 3 bar 4 bar
PD-G-004 3 bar 4 bar
As can be seen in Table 4, only two types of spare pressure transducers are needed for all pressure transducers in CI.
CONFIDENTIAL REPORT
ESA CONTRACT 15689/01/NL/ND TECHNICAL NOTE 71.7 EWC 17
2. Bioreactor
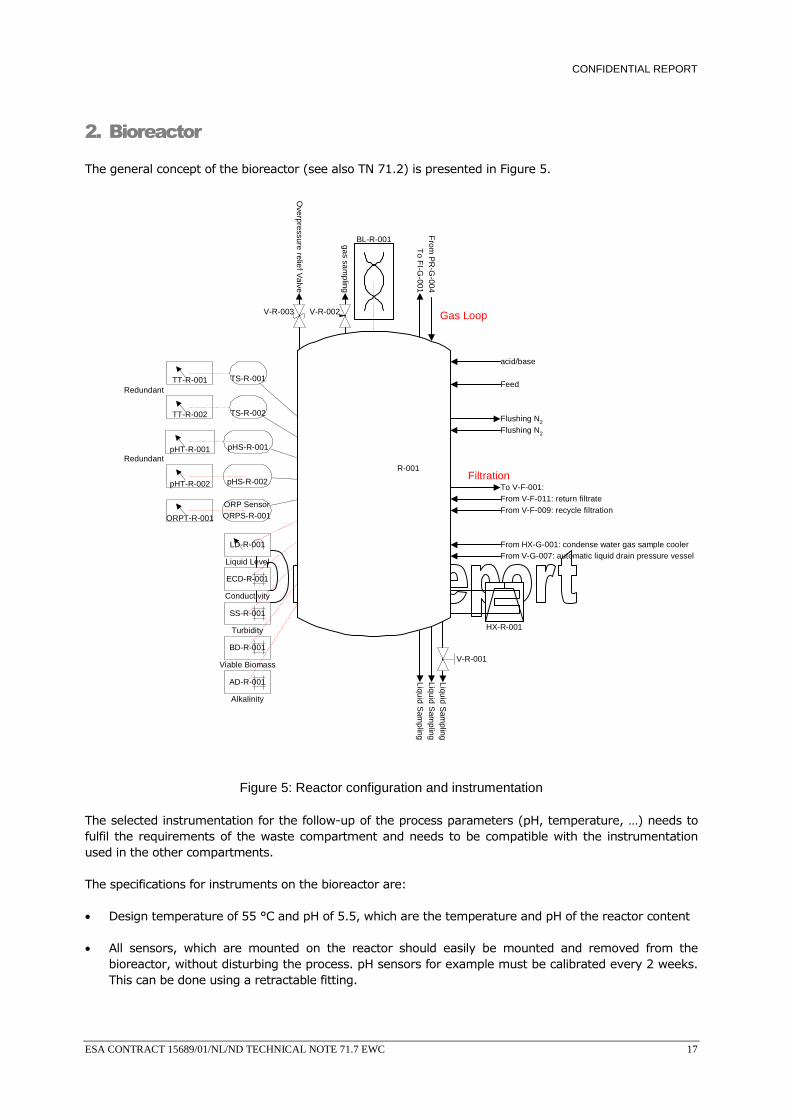
The general concept of the bioreactor (see also TN 71.2) is presented in Figure 5.
Liquid Sam
plingLiquid S
ampling
Liquid Sam
pling
Feed
Flushing N2
Overpressure relief V
alve
acid/base
gas sampling
Bioreactor
From
PR
-G-004
To F
I-G-001
To V-F-001:From V-F-011: return filtrate
Redundant
Redundant
TT-R-001
TT-R-002
TS-R-001
TS-R-002
pHS-R-001
pHS-R-002pHT-R-002
pHT-R-001
ORP SensorORPS-R-001ORPT-R-001
HX-R-001
Filtration
From HX-G-001: condense water gas sample cooler
From V-F-009: recycle filtration
BL-R-001
Gas Loop
From V-G-007: automatic liquid drain pressure vessel
Flushing N2
LD-R-001
Liquid Level
V-R-002
V-R-001
V-R-003
ECD-R-001
SS-R-001
BD-R-001
AD-R-001
R-001
Conductivity
Turbidity
Viable Biomass
Alkalinity
Figure 5: Reactor configuration and instrumentation
The selected instrumentation for the follow-up of the process parameters (pH, temperature, …) needs to fulfil the requirements of the waste compartment and needs to be compatible with the instrumentation used in the other compartments.
The specifications for instruments on the bioreactor are:
• Design temperature of 55 °C and pH of 5.5, which are the temperature and pH of the reactor content
• All sensors, which are mounted on the reactor should easily be mounted and removed from the bioreactor, without disturbing the process. pH sensors for example must be calibrated every 2 weeks. This can be done using a retractable fitting.
CONFIDENTIAL REPORT
ESA CONTRACT 15689/01/NL/ND TECHNICAL NOTE 71.7 EWC 18
The retractable fittings will be used for the pH sensors, ORP and conductivity measurement. They are discussed in paragraph 1.1.
The following sections discuss seperately each instrument on the bioreactor. Each discussion is structured in the same way. First a review is given, which shortly discusses its function and specifications (revision of TN 71.2, TN71.4 and TN 71.5). Then the possible measurement principles and a trade-off is given. To conclude a selection is made.
2.1 Level (LD-R-001)
2.1.1 Review
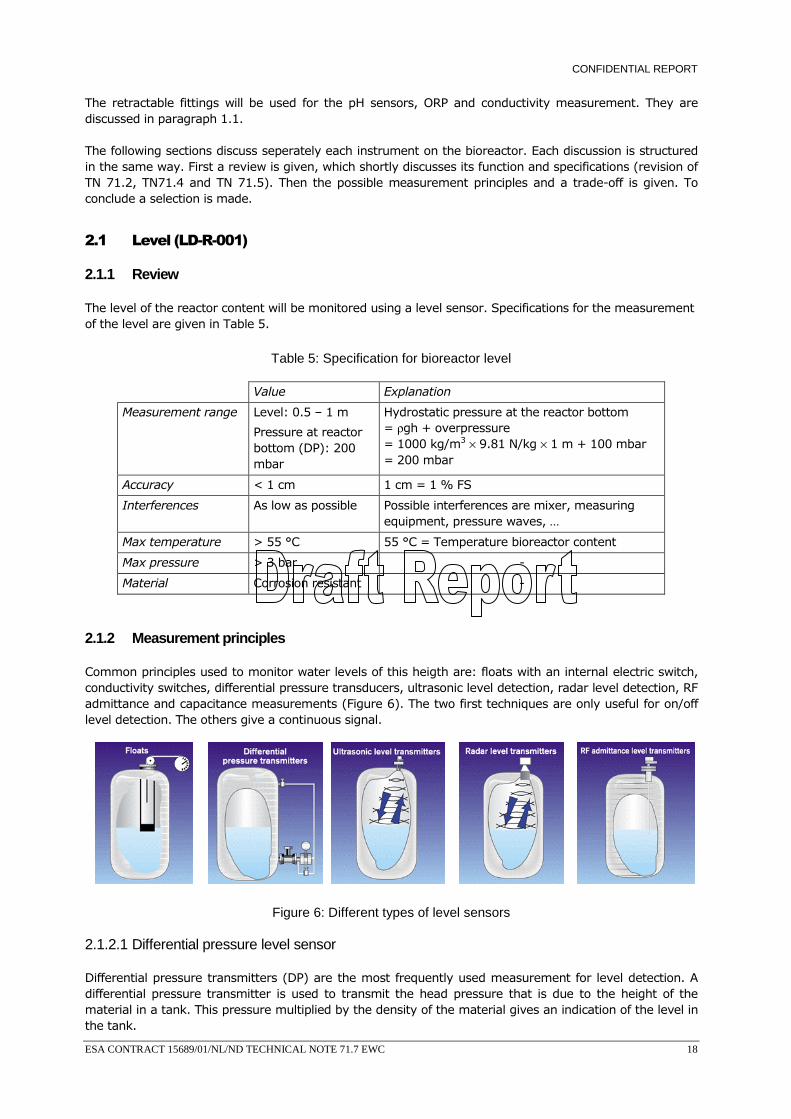
The level of the reactor content will be monitored using a level sensor. Specifications for the measurement of the level are given in Table 5.
Table 5: Specification for bioreactor level
Value Explanation
Measurement range Level: 0.5 – 1 m
Pressure at reactor bottom (DP): 200 mbar
Hydrostatic pressure at the reactor bottom = ρgh + overpressure = 1000 kg/m3 × 9.81 N/kg × 1 m + 100 mbar = 200 mbar
Accuracy < 1 cm 1 cm = 1 % FS
Interferences As low as possible Possible interferences are mixer, measuring equipment, pressure waves, …
Max temperature > 55 °C 55 °C = Temperature bioreactor content
Max pressure > 3 bar -
Material Corrosion resistant -
2.1.2 Measurement principles
Common principles used to monitor water levels of this heigth are: floats with an internal electric switch, conductivity switches, differential pressure transducers, ultrasonic level detection, radar level detection, RF admittance and capacitance measurements (Figure 6). The two first techniques are only useful for on/off level detection. The others give a continuous signal.
Figure 6: Different types of level sensors
2.1.2.1 Differential pressure level sensor
Differential pressure transmitters (DP) are the most frequently used measurement for level detection. A differential pressure transmitter is used to transmit the head pressure that is due to the height of the material in a tank. This pressure multiplied by the density of the material gives an indication of the level in the tank.
CONFIDENTIAL REPORT
ESA CONTRACT 15689/01/NL/ND TECHNICAL NOTE 71.7 EWC 19
Advantages:
• Adequate for small vessels
• Ease of installation
• Easy to maintain (can be installed externally)
• Good precision
Disadvantages:
• Interferences: changing liquid density, pressure waves in the fluid
• Initial calibration needed
• Vessel penetration close to the bottom
Testing with the lab scale reactors showed that a density increase is negligible when the dry matter content in the reactor increases with 20 g/L. This is the maximal dry matter increase that can be expected when periodical draining is performed.
Pressure waves are not to be expected in the reactor, since a relatively low mixing intensity is used. The little error caused by the pressure waves can further be reduced by averaging over time (ca 10 ms).
Endress + Hauser offers systems with electronics who can directly convert the differential pressure into a level signal. It is also possible to take two pressure transducers and let the level be calculated by the control software.
2.1.2.2 Ultrasonic level sensor
Ultrasonic transmitters use the principle of sending a sound wave from a piezo-electric transducer to the contents of the vessel. The device measures the length of time it takes for the reflected sound wave to return to the transducer. A successful measurement depends on reflection from the process material in a straight line to the transducer.
Advantages:
• No contact with process material
• No moving parts
• No calibration needed
• Single top of vessel entry
Disadvantages:
• Various interferences: foam, surface turbulence (e.g. caused by mixer), vapours, ambient noise
2.1.2.3 Radar level sensor
Two technologies are on the market: frequency modulated continuous wave (FMCW) or pulsed wave time of flight. Pulsed wave systems emit a microwave burst towards the process material, this burst is reflected by the surface of the material and detected by the same sensor. Level is inferred from the time of flight. FMCW systems (frequency modulated continuous wave), however, continuously emit a swept frequency signal and distance is inferred from the difference in frequency between the transmitted and received signals.
CONFIDENTIAL REPORT
ESA CONTRACT 15689/01/NL/ND TECHNICAL NOTE 71.7 EWC 20
Advantages:
• No contact with process material
• No moving parts
• No calibration needed
• Single top of vessel entry
• Highly accurate
Disadvantages:
• Expensive
• Objects in the fluid like a mixer give rise to wrong measurements
2.1.2.4 Capacitance
A capacitor is formed by a sensing probe and a ground plane (usually the tank wall). The instrument measures the amount of process material present by measuring how much energy will flow from the probe to "ground" (virtual or earth) due to the capacitance effect. More energy flows as the elevation of the material between the probe and ground increases. The energy flow is directly proportional to the material elevation, and is used to produce a mA dc output signal, or a precise switching action.
Advantages:
• Only one vessel penetration
• Works at extreme pressure and temperature
Disadvantages:
• Initial calibration needed
• More suitable for clean, water-like media
• Problems with media that coat the sensing element (fouling)
The last disadvantage (coating) can be solved by adding two circuit additions. The sensor is then called an RF admittance sensor. By measuring the resistance and capacitance of any coating to the sensing element, the error generated by a coating can be corrected for.
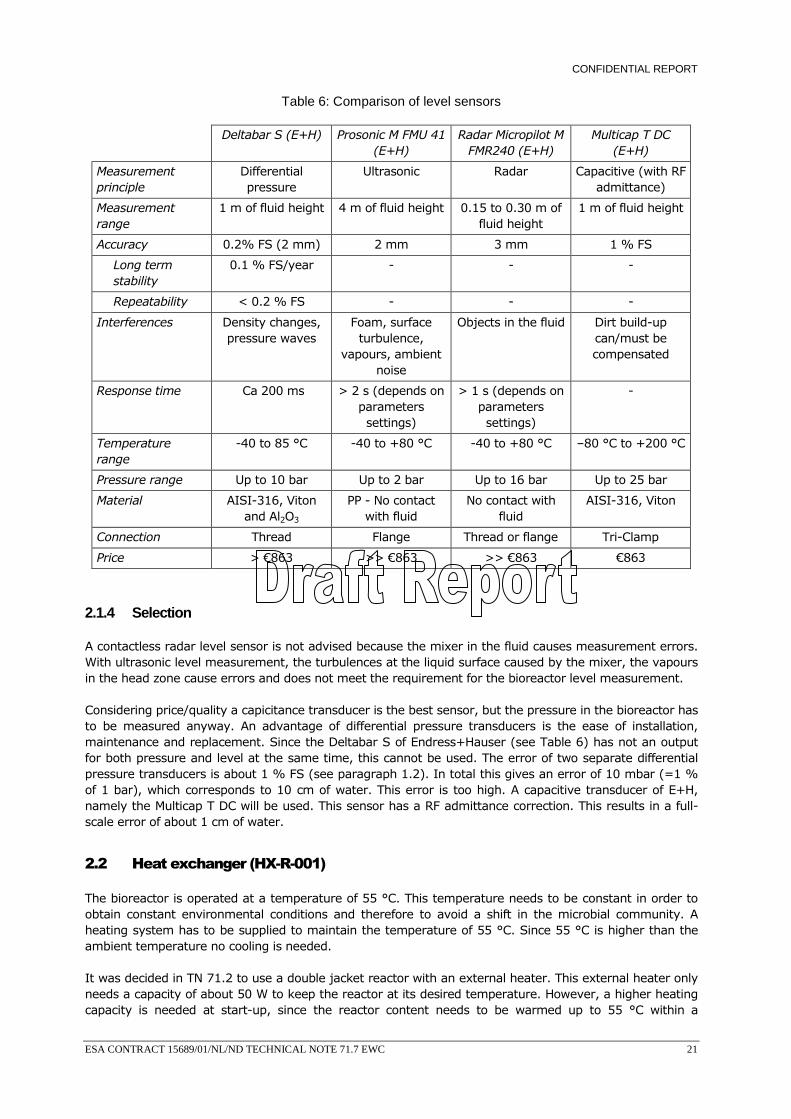
2.1.3 Trade-off
Endress+Hauser offers a wide variety of level measurement systems, based on the different measurement principles described above. To compare all systems described above, an overview of the different types of level measurements of Endress+Hauser, all based on different measurement principles and suited for our application are given in Table 6.
CONFIDENTIAL REPORT
ESA CONTRACT 15689/01/NL/ND TECHNICAL NOTE 71.7 EWC 21
Table 6: Comparison of level sensors
Deltabar S (E+H) Prosonic M FMU 41 (E+H)
Radar Micropilot M FMR240 (E+H)
Multicap T DC (E+H)
Measurement principle
Differential pressure
Ultrasonic Radar Capacitive (with RF admittance)
Measurement range
1 m of fluid height 4 m of fluid height 0.15 to 0.30 m of fluid height
1 m of fluid height
Accuracy 0.2% FS (2 mm) 2 mm 3 mm 1 % FS
Long term stability
0.1 % FS/year - - -
Repeatability < 0.2 % FS - - -
Interferences Density changes, pressure waves
Foam, surface turbulence,
vapours, ambient noise
Objects in the fluid Dirt build-up can/must be compensated
Response time Ca 200 ms > 2 s (depends on parameters settings)
> 1 s (depends on parameters settings)
-
Temperature range
-40 to 85 °C -40 to +80 °C -40 to +80 °C –80 °C to +200 °C
Pressure range Up to 10 bar Up to 2 bar Up to 16 bar Up to 25 bar
Material AISI-316, Viton and Al2O3
PP - No contact with fluid
No contact with fluid
AISI-316, Viton
Connection Thread Flange Thread or flange Tri-Clamp
Price > €863 >> €863 >> €863 €863
2.1.4 Selection
A contactless radar level sensor is not advised because the mixer in the fluid causes measurement errors. With ultrasonic level measurement, the turbulences at the liquid surface caused by the mixer, the vapours in the head zone cause errors and does not meet the requirement for the bioreactor level measurement.
Considering price/quality a capicitance transducer is the best sensor, but the pressure in the bioreactor has to be measured anyway. An advantage of differential pressure transducers is the ease of installation, maintenance and replacement. Since the Deltabar S of Endress+Hauser (see Table 6) has not an output for both pressure and level at the same time, this cannot be used. The error of two separate differential pressure transducers is about 1 % FS (see paragraph 1.2). In total this gives an error of 10 mbar (=1 % of 1 bar), which corresponds to 10 cm of water. This error is too high. A capacitive transducer of E+H, namely the Multicap T DC will be used. This sensor has a RF admittance correction. This results in a full-scale error of about 1 cm of water.
2.2 Heat exchanger (HX-R-001)
The bioreactor is operated at a temperature of 55 °C. This temperature needs to be constant in order to obtain constant environmental conditions and therefore to avoid a shift in the microbial community. A heating system has to be supplied to maintain the temperature of 55 °C. Since 55 °C is higher than the ambient temperature no cooling is needed.
It was decided in TN 71.2 to use a double jacket reactor with an external heater. This external heater only needs a capacity of about 50 W to keep the reactor at its desired temperature. However, a higher heating capacity is needed at start-up, since the reactor content needs to be warmed up to 55 °C within a
CONFIDENTIAL REPORT
ESA CONTRACT 15689/01/NL/ND TECHNICAL NOTE 71.7 EWC 22
reasonable time. For the heating of 100 litres from 20 °C to 55 °C within 2 hour, a capacity of about 2 kW is needed.
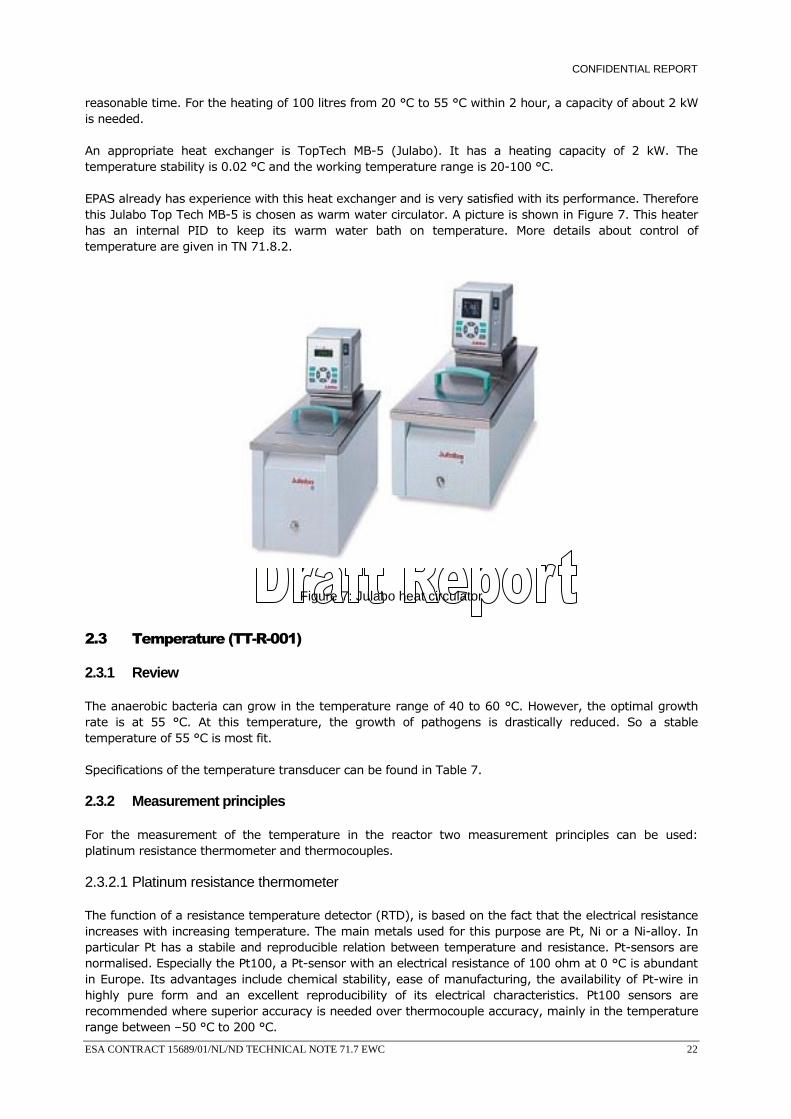
An appropriate heat exchanger is TopTech MB-5 (Julabo). It has a heating capacity of 2 kW. The temperature stability is 0.02 °C and the working temperature range is 20-100 °C.
EPAS already has experience with this heat exchanger and is very satisfied with its performance. Therefore this Julabo Top Tech MB-5 is chosen as warm water circulator. A picture is shown in Figure 7. This heater has an internal PID to keep its warm water bath on temperature. More details about control of temperature are given in TN 71.8.2.
Figure 7: Julabo heat circulator
2.3 Temperature (TT-R-001)
2.3.1 Review
The anaerobic bacteria can grow in the temperature range of 40 to 60 °C. However, the optimal growth rate is at 55 °C. At this temperature, the growth of pathogens is drastically reduced. So a stable temperature of 55 °C is most fit.
Specifications of the temperature transducer can be found in Table 7.
2.3.2 Measurement principles
For the measurement of the temperature in the reactor two measurement principles can be used: platinum resistance thermometer and thermocouples.
2.3.2.1 Platinum resistance thermometer
The function of a resistance temperature detector (RTD), is based on the fact that the electrical resistance increases with increasing temperature. The main metals used for this purpose are Pt, Ni or a Ni-alloy. In particular Pt has a stabile and reproducible relation between temperature and resistance. Pt-sensors are normalised. Especially the Pt100, a Pt-sensor with an electrical resistance of 100 ohm at 0 °C is abundant in Europe. Its advantages include chemical stability, ease of manufacturing, the availability of Pt-wire in highly pure form and an excellent reproducibility of its electrical characteristics. Pt100 sensors are recommended where superior accuracy is needed over thermocouple accuracy, mainly in the temperature range between –50 °C to 200 °C.
CONFIDENTIAL REPORT
ESA CONTRACT 15689/01/NL/ND TECHNICAL NOTE 71.7 EWC 23
2.3.2.2 Thermocouples
A thermocouple is a pair of conductors of dissimilar materials joined at one end and forming part of an arrangement using the thermoelectric effect for temperature measurement. This thermoelectric effect is the production of an electromotive force, due to the difference of temperature between two junction of different metals of alloys forming part of the same circuit. Different letters are used to indicate thermocouple wire combinations. Extension cables should only be used when supplied by the manufacturer with the same nominal composition as the thermocouple. The Type-T thermocouple (Copper/Copper-Nickel) is widely used to measure low temperatures and in applications where moisture is present.
2.3.3 Trade-off
Generally, thermocouples are more subject to measurement errors and have a lower accuracy compared to Pt100 sensors. Thermocouples are more appropriate for wider temperature ranges, the minimum recommended span is 25 °C. They are also harder to install correctly. Resistance temperature detectors are widely used in industrial thermometry. Resistance temperature detectors are characterized by a good stability, sensitivity, and high accuracy. For maintaining a constant measurement of 55 °C, Pt100 sensors are the best choice for temperature monitoring and control.
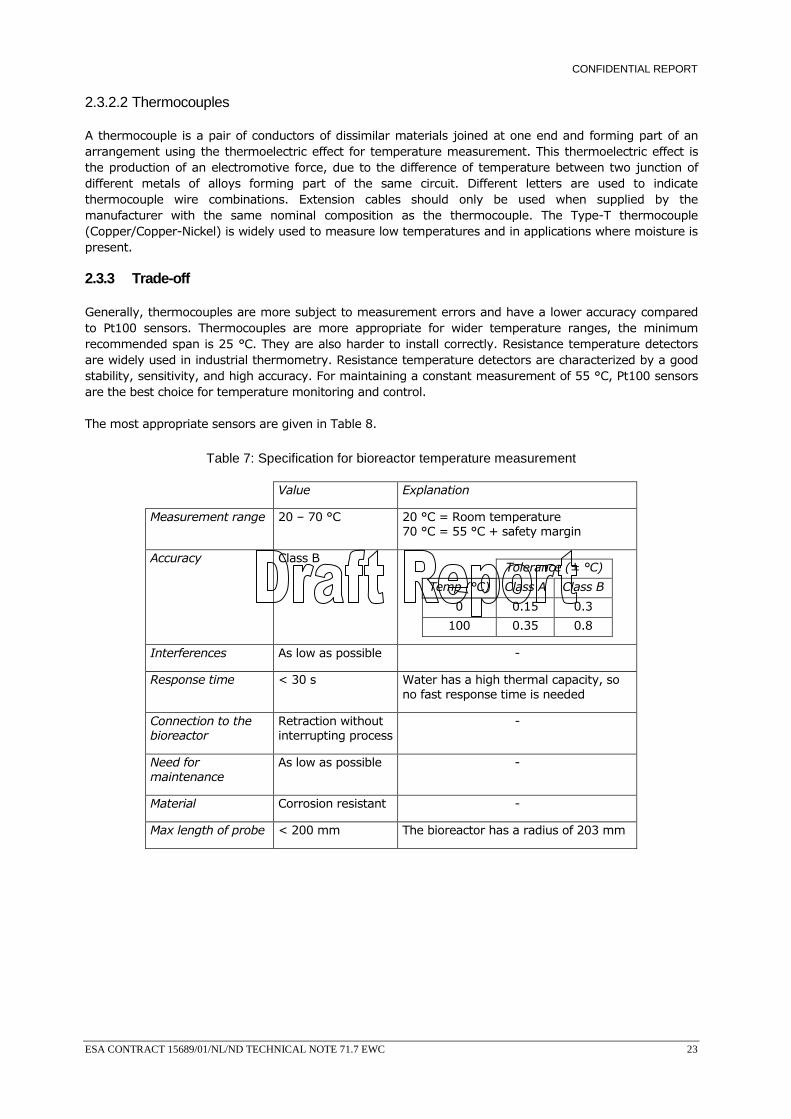
The most appropriate sensors are given in Table 8.
Table 7: Specification for bioreactor temperature measurement
Value Explanation
Measurement range 20 – 70 °C 20 °C = Room temperature 70 °C = 55 °C + safety margin
Accuracy Class B
Tolerance (± °C)
Temp (°C) Class A Class B
0 0.15 0.3
100 0.35 0.8
Interferences As low as possible -
Response time < 30 s Water has a high thermal capacity, so no fast response time is needed
Connection to the bioreactor
Retraction without interrupting process
-
Need for maintenance
As low as possible -
Material Corrosion resistant -
Max length of probe < 200 mm The bioreactor has a radius of 203 mm
CONFIDENTIAL REPORT
ESA CONTRACT 15689/01/NL/ND TECHNICAL NOTE 71.7 EWC 24
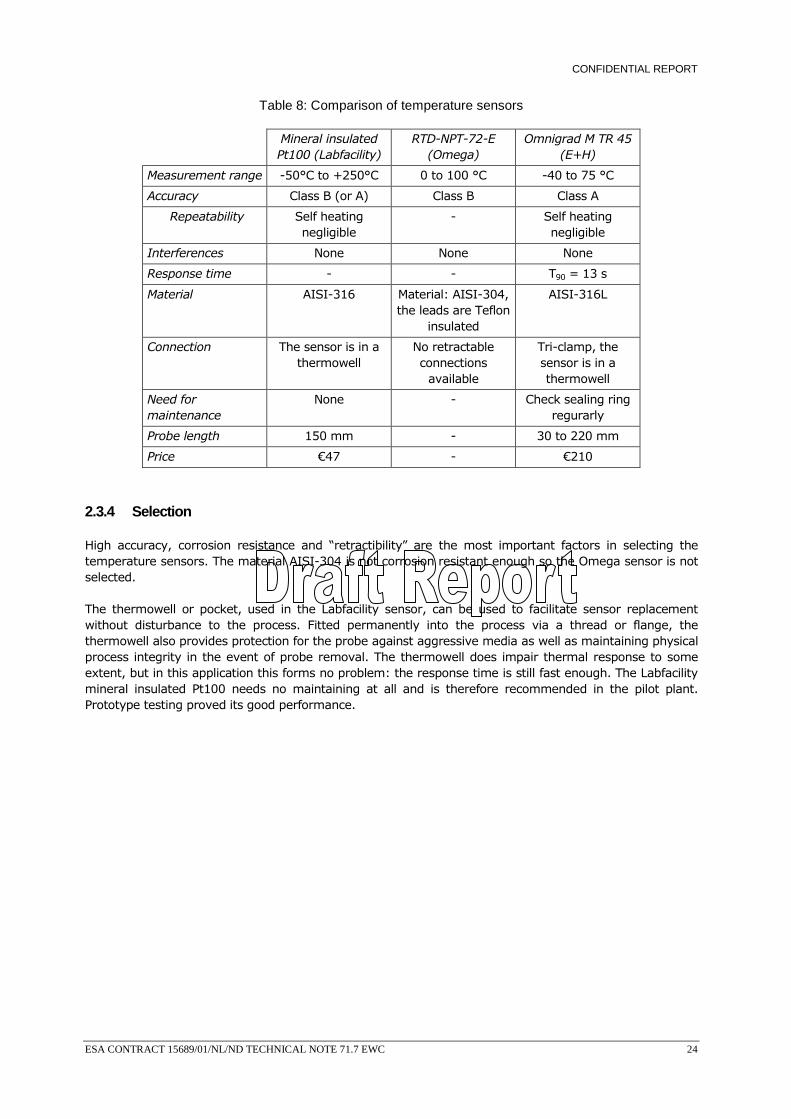
Table 8: Comparison of temperature sensors
Mineral insulated Pt100 (Labfacility)
RTD-NPT-72-E (Omega)
Omnigrad M TR 45 (E+H)
Measurement range -50°C to +250°C 0 to 100 °C -40 to 75 °C
Accuracy Class B (or A) Class B Class A
Repeatability Self heating negligible
- Self heating negligible
Interferences None None None
Response time - - T90 = 13 s
Material AISI-316 Material: AISI-304, the leads are Teflon
insulated
AISI-316L
Connection The sensor is in a thermowell
No retractable connections
available
Tri-clamp, the sensor is in a thermowell
Need for maintenance
None - Check sealing ring regurarly
Probe length 150 mm - 30 to 220 mm
Price €47 - €210
2.3.4 Selection
High accuracy, corrosion resistance and “retractibility” are the most important factors in selecting the temperature sensors. The material AISI-304 is not corrosion resistant enough so the Omega sensor is not selected.
The thermowell or pocket, used in the Labfacility sensor, can be used to facilitate sensor replacement without disturbance to the process. Fitted permanently into the process via a thread or flange, the thermowell also provides protection for the probe against aggressive media as well as maintaining physical process integrity in the event of probe removal. The thermowell does impair thermal response to some extent, but in this application this forms no problem: the response time is still fast enough. The Labfacility mineral insulated Pt100 needs no maintaining at all and is therefore recommended in the pilot plant. Prototype testing proved its good performance.
CONFIDENTIAL REPORT
ESA CONTRACT 15689/01/NL/ND TECHNICAL NOTE 71.7 EWC 25
2.4 pH (pHS-R-001)
2.4.1 Review
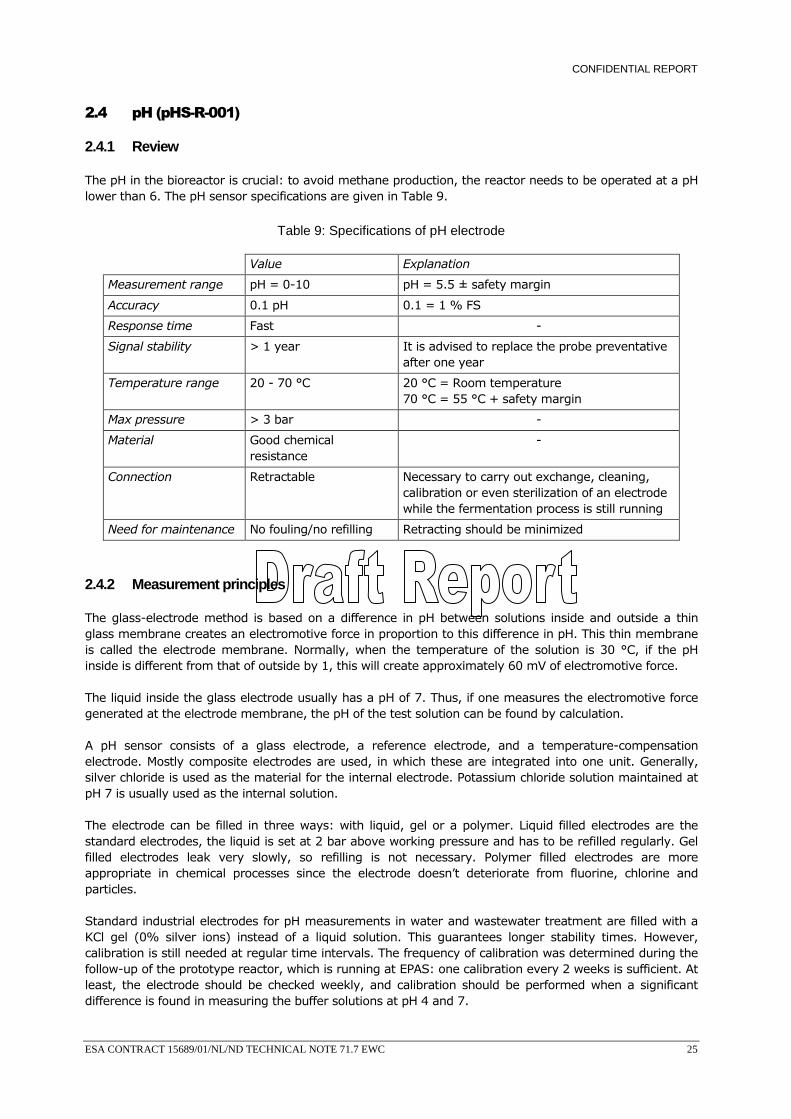
The pH in the bioreactor is crucial: to avoid methane production, the reactor needs to be operated at a pH lower than 6. The pH sensor specifications are given in Table 9.
Table 9: Specifications of pH electrode
Value Explanation
Measurement range pH = 0-10 pH = 5.5 ± safety margin
Accuracy 0.1 pH 0.1 = 1 % FS
Response time Fast -
Signal stability > 1 year It is advised to replace the probe preventative after one year
Temperature range 20 - 70 °C 20 °C = Room temperature 70 °C = 55 °C + safety margin
Max pressure > 3 bar -
Material Good chemical resistance
-
Connection Retractable Necessary to carry out exchange, cleaning, calibration or even sterilization of an electrode while the fermentation process is still running
Need for maintenance No fouling/no refilling Retracting should be minimized
2.4.2 Measurement principles
The glass-electrode method is based on a difference in pH between solutions inside and outside a thin glass membrane creates an electromotive force in proportion to this difference in pH. This thin membrane is called the electrode membrane. Normally, when the temperature of the solution is 30 °C, if the pH inside is different from that of outside by 1, this will create approximately 60 mV of electromotive force.
The liquid inside the glass electrode usually has a pH of 7. Thus, if one measures the electromotive force generated at the electrode membrane, the pH of the test solution can be found by calculation.
A pH sensor consists of a glass electrode, a reference electrode, and a temperature-compensation electrode. Mostly composite electrodes are used, in which these are integrated into one unit. Generally, silver chloride is used as the material for the internal electrode. Potassium chloride solution maintained at pH 7 is usually used as the internal solution.
The electrode can be filled in three ways: with liquid, gel or a polymer. Liquid filled electrodes are the standard electrodes, the liquid is set at 2 bar above working pressure and has to be refilled regularly. Gel filled electrodes leak very slowly, so refilling is not necessary. Polymer filled electrodes are more appropriate in chemical processes since the electrode doesn’t deteriorate from fluorine, chlorine and particles.
Standard industrial electrodes for pH measurements in water and wastewater treatment are filled with a KCl gel (0% silver ions) instead of a liquid solution. This guarantees longer stability times. However, calibration is still needed at regular time intervals. The frequency of calibration was determined during the follow-up of the prototype reactor, which is running at EPAS: one calibration every 2 weeks is sufficient. At least, the electrode should be checked weekly, and calibration should be performed when a significant difference is found in measuring the buffer solutions at pH 4 and 7.
CONFIDENTIAL REPORT
ESA CONTRACT 15689/01/NL/ND TECHNICAL NOTE 71.7 EWC 26
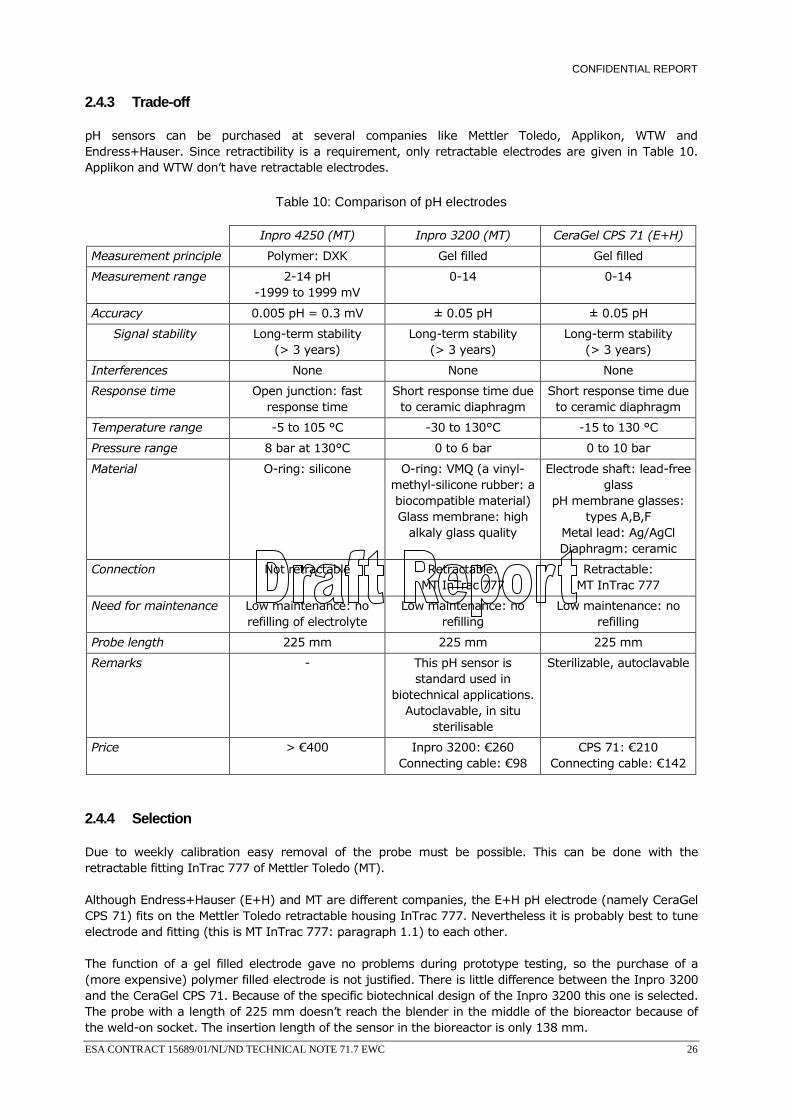
2.4.3 Trade-off
pH sensors can be purchased at several companies like Mettler Toledo, Applikon, WTW and Endress+Hauser. Since retractibility is a requirement, only retractable electrodes are given in Table 10. Applikon and WTW don’t have retractable electrodes.
Table 10: Comparison of pH electrodes
Inpro 4250 (MT) Inpro 3200 (MT) CeraGel CPS 71 (E+H)
Measurement principle Polymer: DXK Gel filled Gel filled
Measurement range 2-14 pH -1999 to 1999 mV
0-14 0-14
Accuracy 0.005 pH = 0.3 mV ± 0.05 pH ± 0.05 pH
Signal stability Long-term stability (> 3 years)
Long-term stability (> 3 years)
Long-term stability (> 3 years)
Interferences None None None
Response time Open junction: fast response time
Short response time due to ceramic diaphragm
Short response time due to ceramic diaphragm
Temperature range -5 to 105 °C -30 to 130°C -15 to 130 °C
Pressure range 8 bar at 130°C 0 to 6 bar 0 to 10 bar
Material O-ring: silicone O-ring: VMQ (a vinyl-methyl-silicone rubber: a biocompatible material)Glass membrane: high
alkaly glass quality
Electrode shaft: lead-free glass
pH membrane glasses: types A,B,F
Metal lead: Ag/AgCl Diaphragm: ceramic
Connection Not retractable Retractable: MT InTrac 777
Retractable: MT InTrac 777
Need for maintenance Low maintenance: no refilling of electrolyte
Low maintenance: no refilling
Low maintenance: no refilling
Probe length 225 mm 225 mm 225 mm
Remarks - This pH sensor is standard used in
biotechnical applications. Autoclavable, in situ
sterilisable
Sterilizable, autoclavable
Price > €400 Inpro 3200: €260 Connecting cable: €98
CPS 71: €210 Connecting cable: €142
2.4.4 Selection
Due to weekly calibration easy removal of the probe must be possible. This can be done with the retractable fitting InTrac 777 of Mettler Toledo (MT).
Although Endress+Hauser (E+H) and MT are different companies, the E+H pH electrode (namely CeraGel CPS 71) fits on the Mettler Toledo retractable housing InTrac 777. Nevertheless it is probably best to tune electrode and fitting (this is MT InTrac 777: paragraph 1.1) to each other.
The function of a gel filled electrode gave no problems during prototype testing, so the purchase of a (more expensive) polymer filled electrode is not justified. There is little difference between the Inpro 3200 and the CeraGel CPS 71. Because of the specific biotechnical design of the Inpro 3200 this one is selected. The probe with a length of 225 mm doesn’t reach the blender in the middle of the bioreactor because of the weld-on socket. The insertion length of the sensor in the bioreactor is only 138 mm.
CONFIDENTIAL REPORT
ESA CONTRACT 15689/01/NL/ND TECHNICAL NOTE 71.7 EWC 27
pH transmitters are discussed in paragraph 2.7.
2.5 Redox potential (ORPS-R-001)
The redox measurement verifies the anaerobic conditions of the reactor. This instrumentation isn’t necessary for proper functioning and is considered optional.
ORP is a potentiometric measurement in which the potential (or tendency) of the medium for electron transfer is sensed by an inert metal electrode and read relative to a reference electrode that is immersed in the same medium. This determination can also be referred to as a "redox" measurement (combination of REDuction and OXidation). For most multi-parameter monitoring systems, the inert metal electrode is a button or ring made of platinum and the reference electrode is the same one associated with the pH sensor, usually Ag/AgCl. The readout of the sensor is a voltage (relative to the reference electrode), with positive values (e.g., + 300 mV vs. Ag/AgCl) indicating an oxidizing environment (ability to accept electrons) and negative values (e.g. -300 mV) indicating a reducing environment (ability to furnish electrons). Calibration of an ORP electrode is needed at regular time intervals, that can be determined experimentally for each case of use.
ORP sensors can be purchased at several companies like Mettler Toledo, WTW and Endress+Hauser.
ORP and pH are similar measurements. By choosing a ORP sensor the same factors as with pH sensors (paragraph 2.4) must be taken into consideration. This leads us to the choice of MT type Pt4805-dpa-sc-s8/255 fitted in the retractable housing of Mettler Toledo (InTrac 777: paragraph 1.1). The cost price is €296.7 and for the cable: €40.71.
Generally, it is preferred for the exchange of sensors to use the same brands of electrodes and transmitters for pH, ORP and EC.
ORP transmitters are discussed in paragraph 2.7.
2.6 Electrical conductivity (EC) (ECD-R-001)
2.6.1 Review
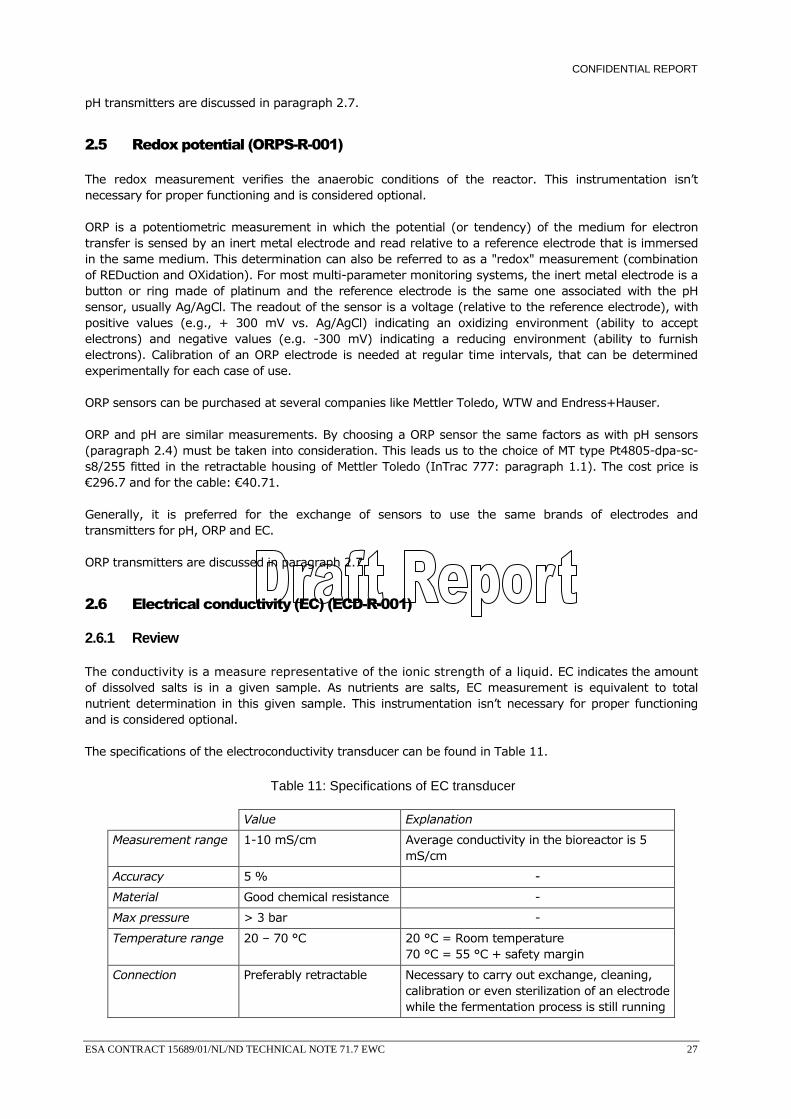
The conductivity is a measure representative of the ionic strength of a liquid. EC indicates the amount of dissolved salts is in a given sample. As nutrients are salts, EC measurement is equivalent to total nutrient determination in this given sample. This instrumentation isn’t necessary for proper functioning and is considered optional.
The specifications of the electroconductivity transducer can be found in Table 11.
Table 11: Specifications of EC transducer
Value Explanation
Measurement range 1-10 mS/cm Average conductivity in the bioreactor is 5 mS/cm
Accuracy 5 % -
Material Good chemical resistance -
Max pressure > 3 bar -
Temperature range 20 – 70 °C 20 °C = Room temperature 70 °C = 55 °C + safety margin
Connection Preferably retractable Necessary to carry out exchange, cleaning, calibration or even sterilization of an electrode while the fermentation process is still running
CONFIDENTIAL REPORT
ESA CONTRACT 15689/01/NL/ND TECHNICAL NOTE 71.7 EWC 28
2.6.2 Measurement principles
There are two measuring methods which are generally accepted. Dependent on the application, the inductive or conductive measurement principle can be chosen. 2.6.2.1 Conductive principle
Between two opposite electrode surfaces, a voltage is applied. The measuring transmitter converts the arising potential difference by means of compensation equations into conductivity, concentration or specific resistance. With high conductivity values (> 10 mS/cm) 4 electrodes are used. The two-electrode method can only be used till EC values of max 10 mS/cm. The value in the bioreactor is 5-10 mS/cm.
2.6.2.2 Inductive principle
Two coils potted in synthetic material (e.g. PEEK) are flown through by the liquid. Due to the ions in the liquid, the excitation coil induces a current in the receiver coil. The measuring transmitter can convert this current by means of compensation equations into conductivity, concentration or specific resistance.
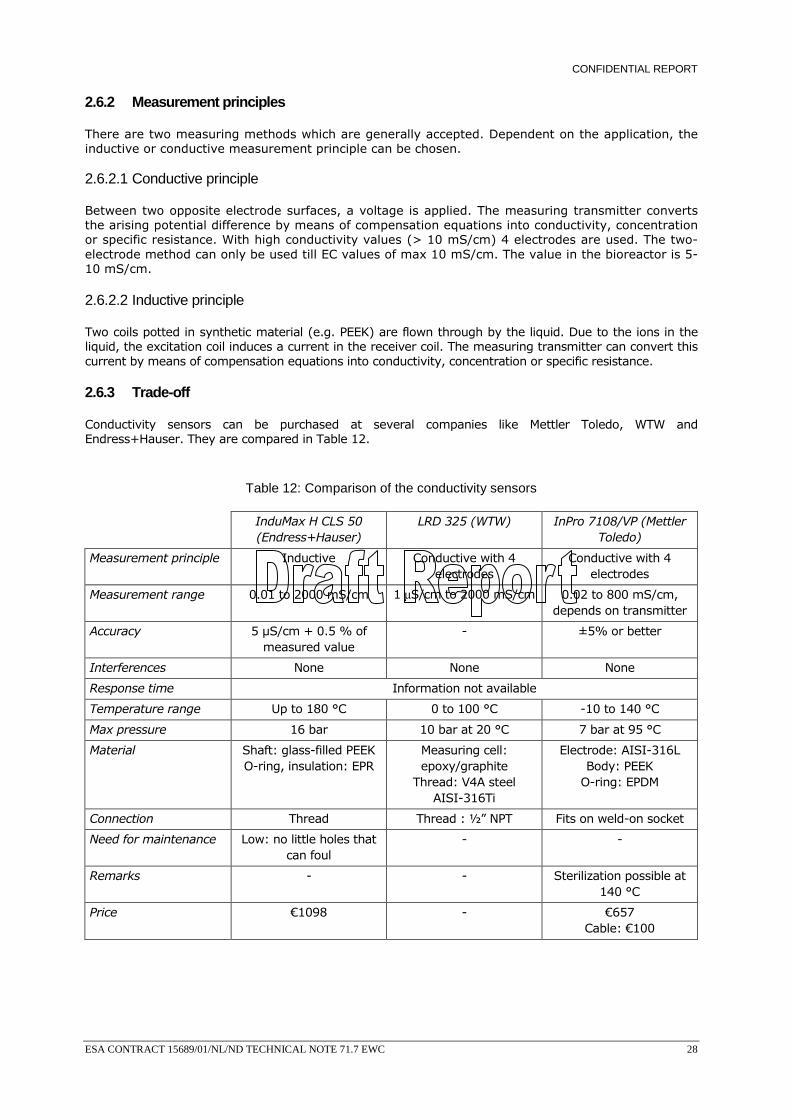
2.6.3 Trade-off
Conductivity sensors can be purchased at several companies like Mettler Toledo, WTW and Endress+Hauser. They are compared in Table 12.
Table 12: Comparison of the conductivity sensors
InduMax H CLS 50 (Endress+Hauser)
LRD 325 (WTW) InPro 7108/VP (Mettler Toledo)
Measurement principle Inductive Conductive with 4 electrodes
Conductive with 4 electrodes
Measurement range 0.01 to 2000 mS/cm 1 µS/cm to 2000 mS/cm 0.02 to 800 mS/cm, depends on transmitter
Accuracy 5 µS/cm + 0.5 % of measured value
- ±5% or better
Interferences None None None
Response time Information not available
Temperature range Up to 180 °C 0 to 100 °C -10 to 140 °C
Max pressure 16 bar 10 bar at 20 °C 7 bar at 95 °C
Material Shaft: glass-filled PEEKO-ring, insulation: EPR
Measuring cell: epoxy/graphite
Thread: V4A steel AISI-316Ti
Electrode: AISI-316L Body: PEEK
O-ring: EPDM
Connection Thread Thread : ½” NPT Fits on weld-on socket
Need for maintenance Low: no little holes that can foul
- -
Remarks - - Sterilization possible at 140 °C
Price €1098 - €657 Cable: €100
CONFIDENTIAL REPORT
ESA CONTRACT 15689/01/NL/ND TECHNICAL NOTE 71.7 EWC 29
2.6.4 Selection
Retractable fittings for EC sensors in the range of 5 mS/cm don’t exist. The MT Inpro 7108/25-VP cannot foul and doesn’t require calibration. This is the reason why the MT Inpro 7108/25-VP is selected.
EC transmitters are discussed in paragraph 2.7.
2.7 Transmitter (pHT-R-001, pHT-R002, ORPT-R-001, ECT-R-001)
Mettler Toledo also supplies pH-, ORP-, and EC-transmitters. These are actually Knick transmitters, and they are compatible with Mettler Toledo sensors, but also with sensors of other brands.
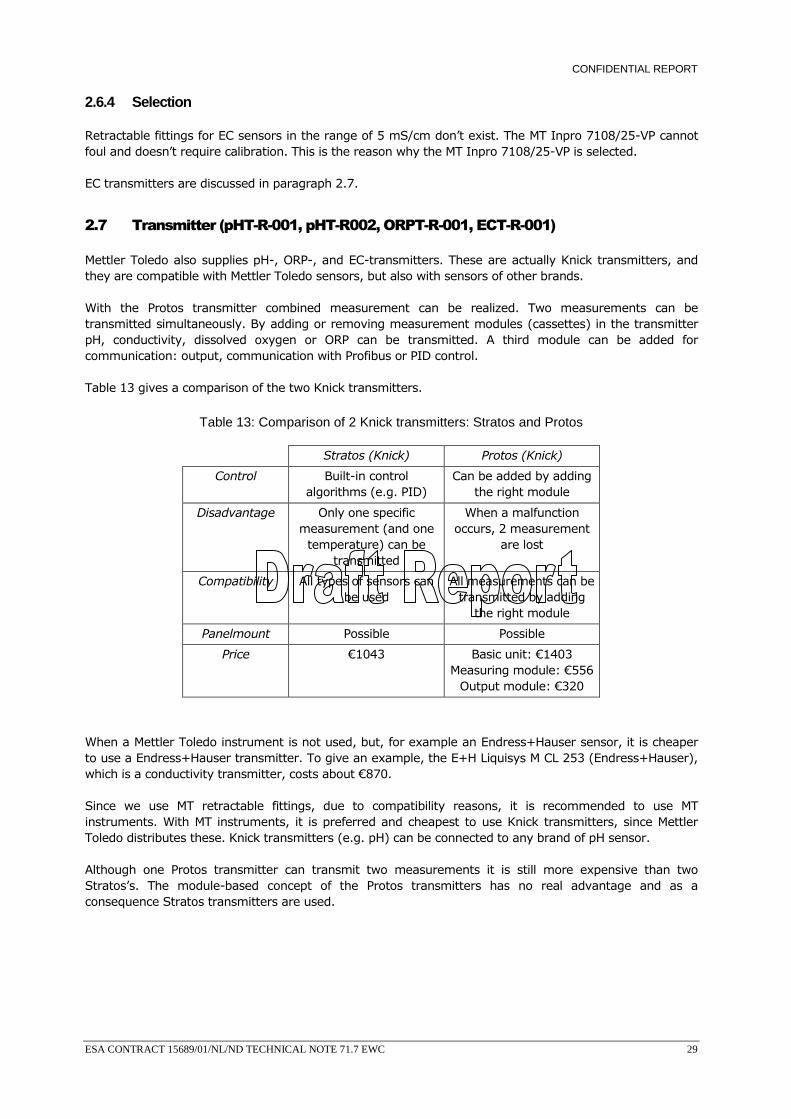
With the Protos transmitter combined measurement can be realized. Two measurements can be transmitted simultaneously. By adding or removing measurement modules (cassettes) in the transmitter pH, conductivity, dissolved oxygen or ORP can be transmitted. A third module can be added for communication: output, communication with Profibus or PID control.
Table 13 gives a comparison of the two Knick transmitters.
Table 13: Comparison of 2 Knick transmitters: Stratos and Protos
Stratos (Knick) Protos (Knick)
Control Built-in control algorithms (e.g. PID)
Can be added by adding the right module
Disadvantage Only one specific measurement (and one temperature) can be
transmitted
When a malfunction occurs, 2 measurement
are lost
Compatibility All types of sensors can be used
All measurements can be transmitted by adding
the right module
Panelmount Possible Possible
Price €1043 Basic unit: €1403 Measuring module: €556
Output module: €320
When a Mettler Toledo instrument is not used, but, for example an Endress+Hauser sensor, it is cheaper to use a Endress+Hauser transmitter. To give an example, the E+H Liquisys M CL 253 (Endress+Hauser), which is a conductivity transmitter, costs about €870.
Since we use MT retractable fittings, due to compatibility reasons, it is recommended to use MT instruments. With MT instruments, it is preferred and cheapest to use Knick transmitters, since Mettler Toledo distributes these. Knick transmitters (e.g. pH) can be connected to any brand of pH sensor.
Although one Protos transmitter can transmit two measurements it is still more expensive than two Stratos’s. The module-based concept of the Protos transmitters has no real advantage and as a consequence Stratos transmitters are used.
CONFIDENTIAL REPORT
ESA CONTRACT 15689/01/NL/ND TECHNICAL NOTE 71.7 EWC 30
2.8 On-line measurement of solids content in the reactor (SS-R-001)
2.8.1 Review
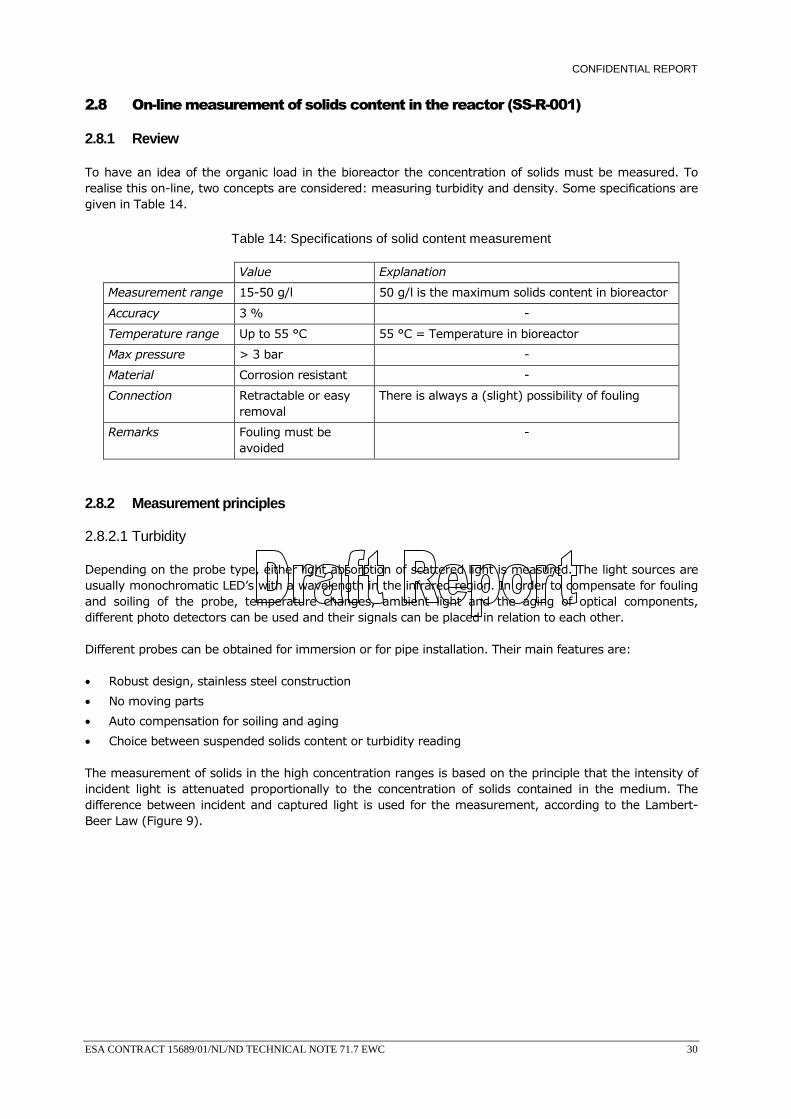
To have an idea of the organic load in the bioreactor the concentration of solids must be measured. To realise this on-line, two concepts are considered: measuring turbidity and density. Some specifications are given in Table 14.
Table 14: Specifications of solid content measurement
Value Explanation
Measurement range 15-50 g/l 50 g/l is the maximum solids content in bioreactor
Accuracy 3 % -
Temperature range Up to 55 °C 55 °C = Temperature in bioreactor
Max pressure > 3 bar -
Material Corrosion resistant -
Connection Retractable or easy removal
There is always a (slight) possibility of fouling
Remarks Fouling must be avoided
-
2.8.2 Measurement principles
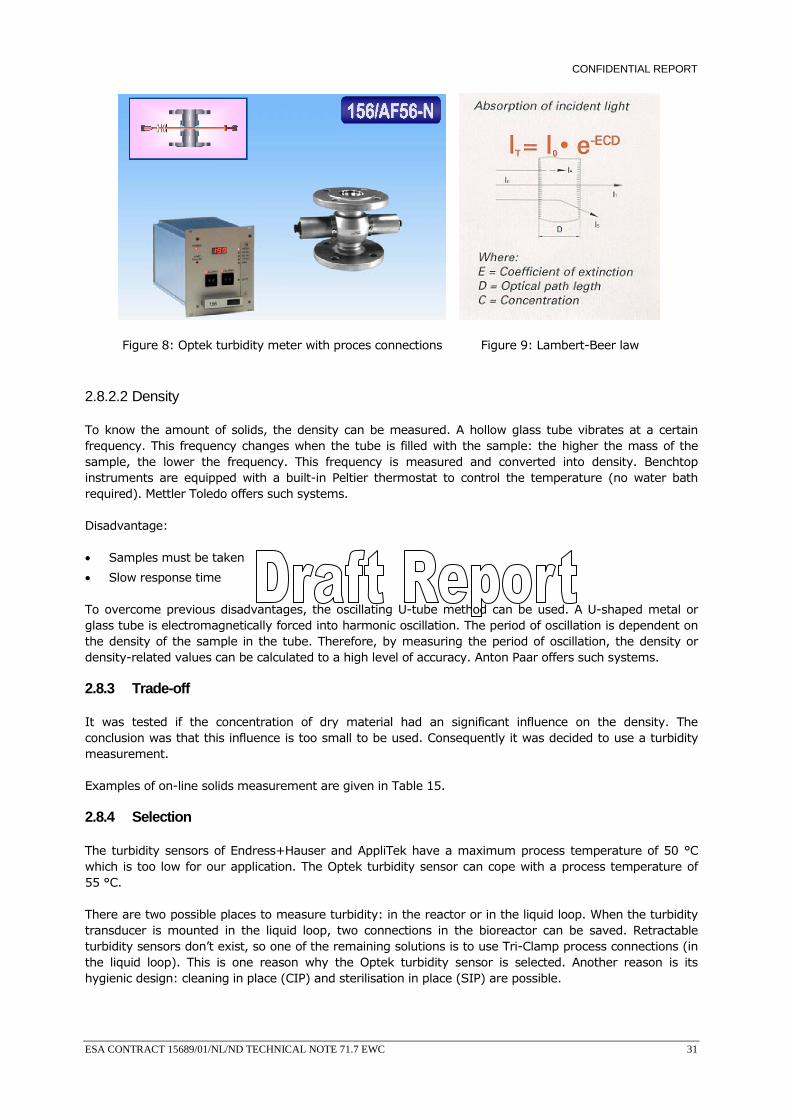
2.8.2.1 Turbidity
Depending on the probe type, either light absorption of scattered light is measured. The light sources are usually monochromatic LED’s with a wavelength in the infrared region. In order to compensate for fouling and soiling of the probe, temperature changes, ambient light and the aging of optical components, different photo detectors can be used and their signals can be placed in relation to each other.
Different probes can be obtained for immersion or for pipe installation. Their main features are:
• Robust design, stainless steel construction
• No moving parts
• Auto compensation for soiling and aging
• Choice between suspended solids content or turbidity reading
The measurement of solids in the high concentration ranges is based on the principle that the intensity of incident light is attenuated proportionally to the concentration of solids contained in the medium. The difference between incident and captured light is used for the measurement, according to the Lambert-Beer Law (Figure 9).
CONFIDENTIAL REPORT
ESA CONTRACT 15689/01/NL/ND TECHNICAL NOTE 71.7 EWC 31
Figure 8: Optek turbidity meter with proces connections Figure 9: Lambert-Beer law
2.8.2.2 Density
To know the amount of solids, the density can be measured. A hollow glass tube vibrates at a certain frequency. This frequency changes when the tube is filled with the sample: the higher the mass of the sample, the lower the frequency. This frequency is measured and converted into density. Benchtop instruments are equipped with a built-in Peltier thermostat to control the temperature (no water bath required). Mettler Toledo offers such systems.
Disadvantage:
• Samples must be taken
• Slow response time
To overcome previous disadvantages, the oscillating U-tube method can be used. A U-shaped metal or glass tube is electromagnetically forced into harmonic oscillation. The period of oscillation is dependent on the density of the sample in the tube. Therefore, by measuring the period of oscillation, the density or density-related values can be calculated to a high level of accuracy. Anton Paar offers such systems.
2.8.3 Trade-off
It was tested if the concentration of dry material had an significant influence on the density. The conclusion was that this influence is too small to be used. Consequently it was decided to use a turbidity measurement.
Examples of on-line solids measurement are given in Table 15.
2.8.4 Selection
The turbidity sensors of Endress+Hauser and AppliTek have a maximum process temperature of 50 °C which is too low for our application. The Optek turbidity sensor can cope with a process temperature of 55 °C.
There are two possible places to measure turbidity: in the reactor or in the liquid loop. When the turbidity transducer is mounted in the liquid loop, two connections in the bioreactor can be saved. Retractable turbidity sensors don’t exist, so one of the remaining solutions is to use Tri-Clamp process connections (in the liquid loop). This is one reason why the Optek turbidity sensor is selected. Another reason is its hygienic design: cleaning in place (CIP) and sterilisation in place (SIP) are possible.
CONFIDENTIAL REPORT
ESA CONTRACT 15689/01/NL/ND TECHNICAL NOTE 71.7 EWC 32
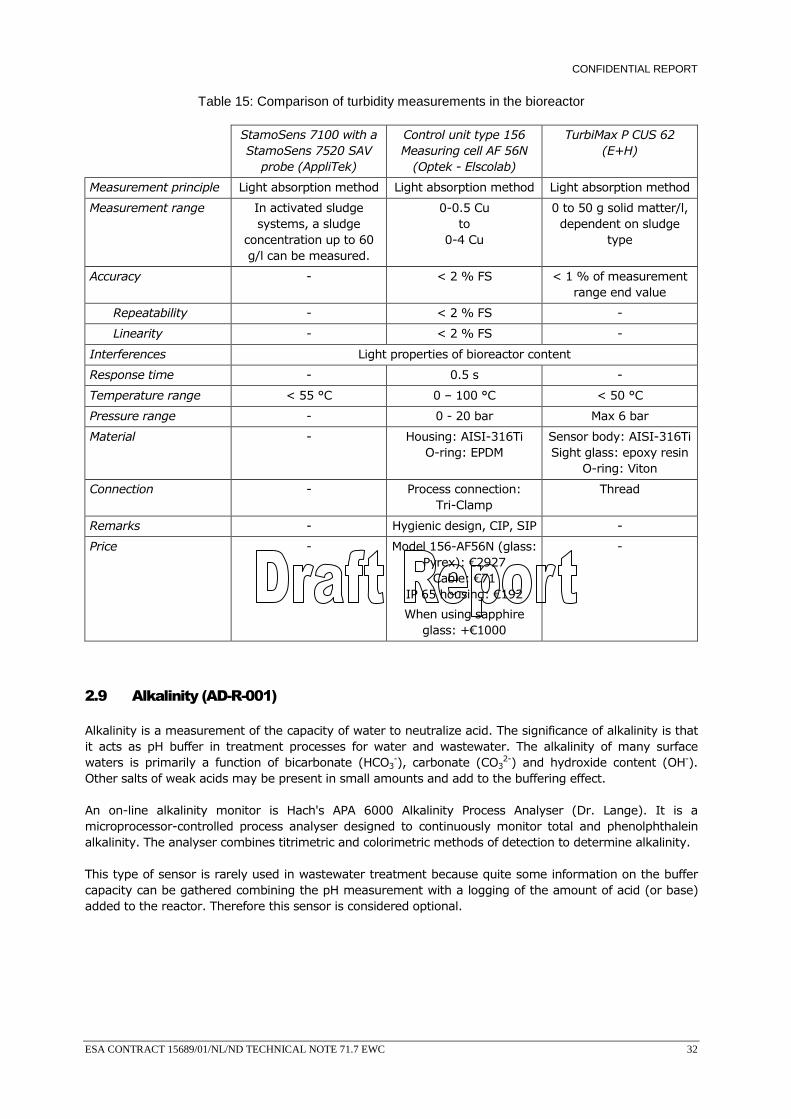
Table 15: Comparison of turbidity measurements in the bioreactor
StamoSens 7100 with a StamoSens 7520 SAV
probe (AppliTek)
Control unit type 156 Measuring cell AF 56N
(Optek - Elscolab)
TurbiMax P CUS 62 (E+H)
Measurement principle Light absorption method Light absorption method Light absorption method
Measurement range In activated sludge systems, a sludge
concentration up to 60 g/l can be measured.
0-0.5 Cu to
0-4 Cu
0 to 50 g solid matter/l, dependent on sludge
type
Accuracy - < 2 % FS < 1 % of measurement range end value
Repeatability - < 2 % FS -
Linearity - < 2 % FS -
Interferences Light properties of bioreactor content
Response time - 0.5 s -
Temperature range < 55 °C 0 – 100 °C < 50 °C
Pressure range - 0 - 20 bar Max 6 bar
Material - Housing: AISI-316Ti O-ring: EPDM
Sensor body: AISI-316TiSight glass: epoxy resin
O-ring: Viton
Connection - Process connection: Tri-Clamp
Thread
Remarks - Hygienic design, CIP, SIP -
Price - Model 156-AF56N (glass: Pyrex): €2927
Cable: €71 IP 65 housing: €192
When using sapphire glass: +€1000
-
2.9 Alkalinity (AD-R-001)
Alkalinity is a measurement of the capacity of water to neutralize acid. The significance of alkalinity is that it acts as pH buffer in treatment processes for water and wastewater. The alkalinity of many surface waters is primarily a function of bicarbonate (HCO3
-), carbonate (CO32-) and hydroxide content (OH-).
Other salts of weak acids may be present in small amounts and add to the buffering effect.
An on-line alkalinity monitor is Hach's APA 6000 Alkalinity Process Analyser (Dr. Lange). It is a microprocessor-controlled process analyser designed to continuously monitor total and phenolphthalein alkalinity. The analyser combines titrimetric and colorimetric methods of detection to determine alkalinity.
This type of sensor is rarely used in wastewater treatment because quite some information on the buffer capacity can be gathered combining the pH measurement with a logging of the amount of acid (or base) added to the reactor. Therefore this sensor is considered optional.
CONFIDENTIAL REPORT
ESA CONTRACT 15689/01/NL/ND TECHNICAL NOTE 71.7 EWC 33
2.10 Viable biomass monitoring (BD-R-001)
2.10.1 Review
The key process in CI is the biodegradation of organic matter into smaller components by the bacteria in the reactor. It is therefore useful to know the status of this bacterial culture. This can be done in a direct or an indirect way. In the direct method the impedance of the fluid is measured. The indirect method consists of looking at process parameters (e.g. gas production, VFA production).
2.10.2 Measurement principles
2.10.2.1 Direct
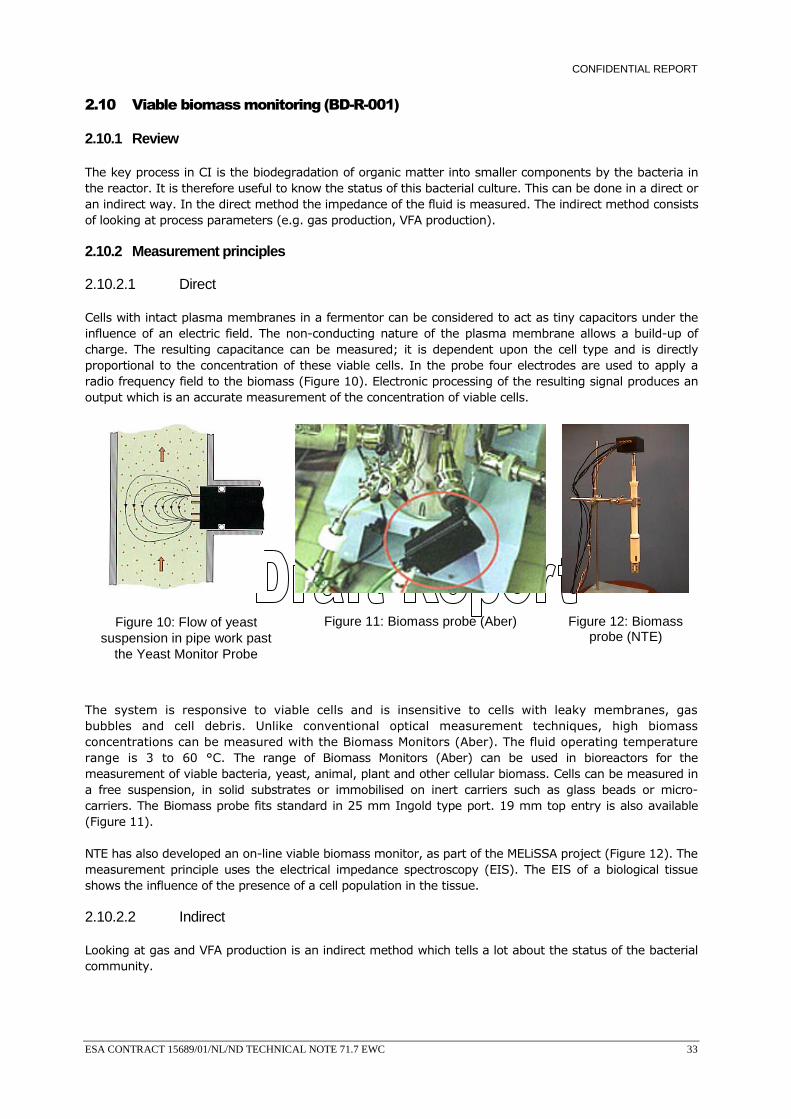
Cells with intact plasma membranes in a fermentor can be considered to act as tiny capacitors under the influence of an electric field. The non-conducting nature of the plasma membrane allows a build-up of charge. The resulting capacitance can be measured; it is dependent upon the cell type and is directly proportional to the concentration of these viable cells. In the probe four electrodes are used to apply a radio frequency field to the biomass (Figure 10). Electronic processing of the resulting signal produces an output which is an accurate measurement of the concentration of viable cells.
Figure 10: Flow of yeast suspension in pipe work past
the Yeast Monitor Probe
Figure 11: Biomass probe (Aber) Figure 12: Biomass probe (NTE)
The system is responsive to viable cells and is insensitive to cells with leaky membranes, gas bubbles and cell debris. Unlike conventional optical measurement techniques, high biomass concentrations can be measured with the Biomass Monitors (Aber). The fluid operating temperature range is 3 to 60 °C. The range of Biomass Monitors (Aber) can be used in bioreactors for the measurement of viable bacteria, yeast, animal, plant and other cellular biomass. Cells can be measured in a free suspension, in solid substrates or immobilised on inert carriers such as glass beads or micro-carriers. The Biomass probe fits standard in 25 mm Ingold type port. 19 mm top entry is also available (Figure 11).
NTE has also developed an on-line viable biomass monitor, as part of the MELiSSA project (Figure 12). The measurement principle uses the electrical impedance spectroscopy (EIS). The EIS of a biological tissue shows the influence of the presence of a cell population in the tissue.
2.10.2.2 Indirect
Looking at gas and VFA production is an indirect method which tells a lot about the status of the bacterial community.
CONFIDENTIAL REPORT
ESA CONTRACT 15689/01/NL/ND TECHNICAL NOTE 71.7 EWC 34
2.10.3 Trade-off and selection
A major problem with the direct monitoring of the viable biomass is calibration. This calibration is done by molecular techniques, for example microscopy. Monitoring the gas production is far more easy and reliable. Using a biomass monitor isn’t considered necessary but is optional.
2.11 Valves
Swagelok, which offers a wide variety of pressure relief valves, is used in UAB. For reasons of compatibility Swagelok is preferred for the valves on the bioreactor. EPAS has good experience with Swagelok. All valves must be made of stainless steel.
2.11.1 Liquid sampling (V-R-001)
It is necessary to have the possibility to drain some liquid from the bioreactor: e.g. for analyses. Therefore a tap under the liquid level must be foreseen. This valve is operated manually.
2.11.2 Gas sampling (V-R-002)
As with liquid, also gas in the bioreactor must be sampled. This valve has also a manual operation.
2.11.3 Pressure relief valve (V-R-003)
The pressure relief valve limits the pressure in the bioreactor and thus increases safety and protects the reactor against overpressure (caused by a failure). Failures that could occur is e.g. when filling the bioreactor with CO2 gas or a malfunction of pressure reducing regulator PR-G-004.
To increase compatibility with UAB Swagelok is preferred. Ideally, the opening of the relief valve occurs at 1 bar over pressure (that is 2 bar absolute). The smallest Swagelok relief valve is SS-RL3M4F4-RT: it releases gas at 3.4 bar. The set pressure (when the relief valve initially opens) is 0.68 to 1.3 bar. This value is important! No leakage may occur during normal operation and this is guaranteed under 680 mbar overpressure in the bioreactor. The minimum resealing pressure is 50 % of the set pressure. The material is AISI-316 and FPM.
CONFIDENTIAL REPORT
ESA CONTRACT 15689/01/NL/ND TECHNICAL NOTE 71.7 EWC 35
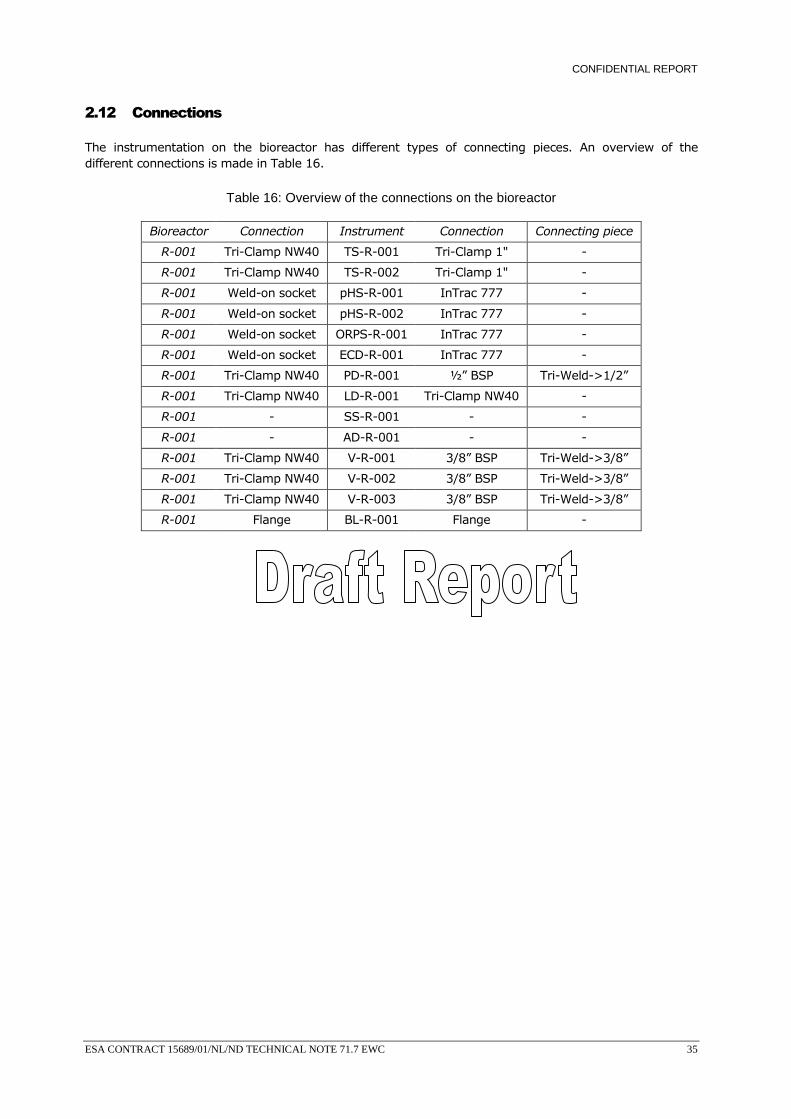
2.12 Connections
The instrumentation on the bioreactor has different types of connecting pieces. An overview of the different connections is made in Table 16.
Table 16: Overview of the connections on the bioreactor
Bioreactor Connection Instrument Connection Connecting piece
R-001 Tri-Clamp NW40 TS-R-001 Tri-Clamp 1" -
R-001 Tri-Clamp NW40 TS-R-002 Tri-Clamp 1" -
R-001 Weld-on socket pHS-R-001 InTrac 777 -
R-001 Weld-on socket pHS-R-002 InTrac 777 -
R-001 Weld-on socket ORPS-R-001 InTrac 777 -
R-001 Weld-on socket ECD-R-001 InTrac 777 -
R-001 Tri-Clamp NW40 PD-R-001 ½” BSP Tri-Weld->1/2”
R-001 Tri-Clamp NW40 LD-R-001 Tri-Clamp NW40 -
R-001 - SS-R-001 - -
R-001 - AD-R-001 - -
R-001 Tri-Clamp NW40 V-R-001 3/8” BSP Tri-Weld->3/8”
R-001 Tri-Clamp NW40 V-R-002 3/8” BSP Tri-Weld->3/8”
R-001 Tri-Clamp NW40 V-R-003 3/8” BSP Tri-Weld->3/8”
R-001 Flange BL-R-001 Flange -
CONFIDENTIAL REPORT
ESA CONTRACT 15689/01/NL/ND TECHNICAL NOTE 71.7 EWC 36
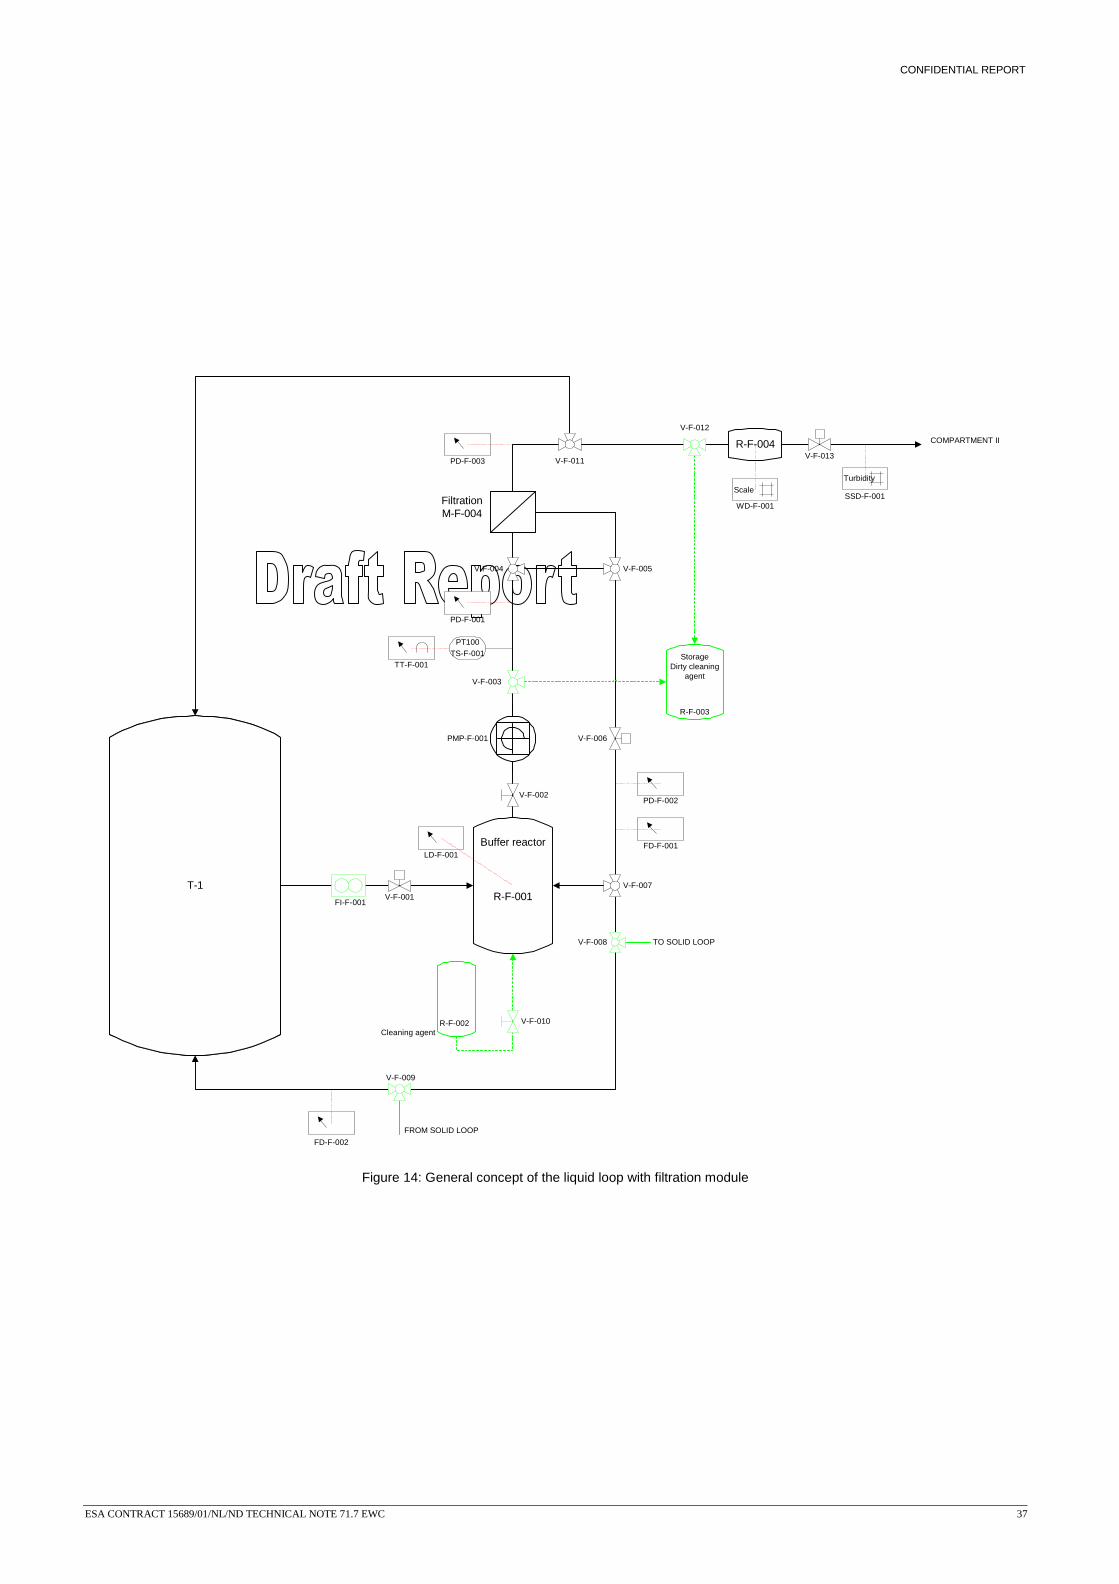
3. Liquid loop
The general concept of the liquid loop with filtration module is depicted in Figure 14. See also TN 71.4.
3.1 Buffer reactor (R-F-001)
3.1.1.1 Material
For the same reasons as with the bioreactor, the material of the buffer reactor is stainless steel: it is chemical resistant and fit for temperatures of 55 °C.
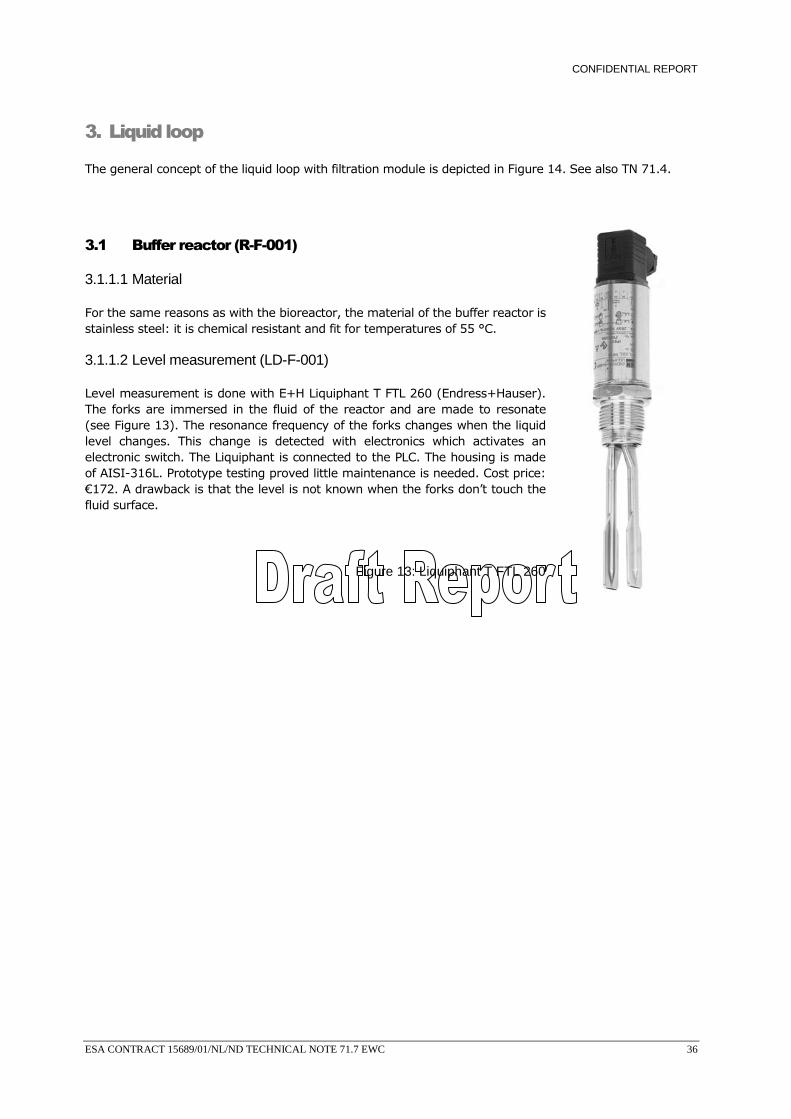
3.1.1.2 Level measurement (LD-F-001)
Level measurement is done with E+H Liquiphant T FTL 260 (Endress+Hauser). The forks are immersed in the fluid of the reactor and are made to resonate (see Figure 13). The resonance frequency of the forks changes when the liquid level changes. This change is detected with electronics which activates an electronic switch. The Liquiphant is connected to the PLC. The housing is made of AISI-316L. Prototype testing proved little maintenance is needed. Cost price: €172. A drawback is that the level is not known when the forks don’t touch the fluid surface.
Figure 13: Liquiphant T FTL 260
CONFIDENTIAL REPORT
ESA CONTRACT 15689/01/NL/ND TECHNICAL NOTE 71.7 EWC 37
COMPARTMENT II
R-001R-F-001
M-F-004
V-F-002
R-F-004
V-F-004 V-F-005
V-F-006
V-F-001
V-F-007
V-F-013
R-F-002
R-F-003
V-F-010
V-F-003
V-F-012
V-F-011
V-F-009
V-F-008
Buffer reactor
Cleaning agent
StorageDirty cleaning
agent
TO SOLID LOOP
FROM SOLID LOOP
Bioreactor
Filtration
FI-F-001
PD-F-001
PD-F-003
FD-F-001
TT-F-001
PT100TS-F-001
LD-F-001
WD-F-001
Scale
PMP-F-001
PD-F-002
SSD-F-001
Turbidity
T-1
FD-F-002
Figure 14: General concept of the liquid loop with filtration module
CONFIDENTIAL REPORT
ESA contract 15689/01/NL/ND TECHNICAL NOTE 71.4 EWC 38
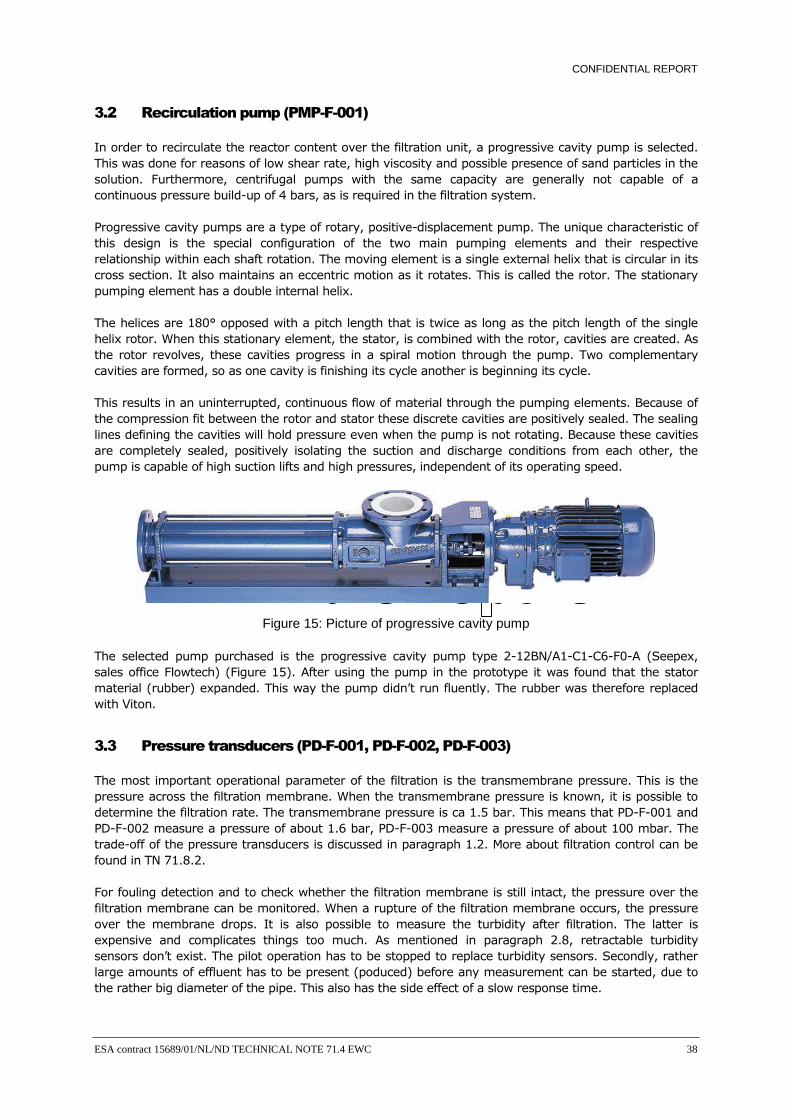
3.2 Recirculation pump (PMP-F-001)
In order to recirculate the reactor content over the filtration unit, a progressive cavity pump is selected. This was done for reasons of low shear rate, high viscosity and possible presence of sand particles in the solution. Furthermore, centrifugal pumps with the same capacity are generally not capable of a continuous pressure build-up of 4 bars, as is required in the filtration system.
Progressive cavity pumps are a type of rotary, positive-displacement pump. The unique characteristic of this design is the special configuration of the two main pumping elements and their respective relationship within each shaft rotation. The moving element is a single external helix that is circular in its cross section. It also maintains an eccentric motion as it rotates. This is called the rotor. The stationary pumping element has a double internal helix.
The helices are 180° opposed with a pitch length that is twice as long as the pitch length of the single helix rotor. When this stationary element, the stator, is combined with the rotor, cavities are created. As the rotor revolves, these cavities progress in a spiral motion through the pump. Two complementary cavities are formed, so as one cavity is finishing its cycle another is beginning its cycle.
This results in an uninterrupted, continuous flow of material through the pumping elements. Because of the compression fit between the rotor and stator these discrete cavities are positively sealed. The sealing lines defining the cavities will hold pressure even when the pump is not rotating. Because these cavities are completely sealed, positively isolating the suction and discharge conditions from each other, the pump is capable of high suction lifts and high pressures, independent of its operating speed.
Figure 15: Picture of progressive cavity pump
The selected pump purchased is the progressive cavity pump type 2-12BN/A1-C1-C6-F0-A (Seepex, sales office Flowtech) (Figure 15). After using the pump in the prototype it was found that the stator material (rubber) expanded. This way the pump didn’t run fluently. The rubber was therefore replaced with Viton.
3.3 Pressure transducers (PD-F-001, PD-F-002, PD-F-003)
The most important operational parameter of the filtration is the transmembrane pressure. This is the pressure across the filtration membrane. When the transmembrane pressure is known, it is possible to determine the filtration rate. The transmembrane pressure is ca 1.5 bar. This means that PD-F-001 and PD-F-002 measure a pressure of about 1.6 bar, PD-F-003 measure a pressure of about 100 mbar. The trade-off of the pressure transducers is discussed in paragraph 1.2. More about filtration control can be found in TN 71.8.2.
For fouling detection and to check whether the filtration membrane is still intact, the pressure over the filtration membrane can be monitored. When a rupture of the filtration membrane occurs, the pressure over the membrane drops. It is also possible to measure the turbidity after filtration. The latter is expensive and complicates things too much. As mentioned in paragraph 2.8, retractable turbidity sensors don’t exist. The pilot operation has to be stopped to replace turbidity sensors. Secondly, rather large amounts of effluent has to be present (poduced) before any measurement can be started, due to the rather big diameter of the pipe. This also has the side effect of a slow response time.
CONFIDENTIAL REPORT
ESA contract 15689/01/NL/ND TECHNICAL NOTE 71.4 EWC 39
3.4 Flow meter (FI-F-001, FD-F-001, FD-F-002)
3.4.1 Review
In order to measure and control the flow circulating through the filtration unit, a flow meter must be installed. The selection of the flow meter is done by means of Table 17.
Table 17: Specifications of flow meter
Measurement range 700 l/h 700 l/h = Pump rate of recirculation pump PMP-L-001
Flow velocity Depends on flow rate (Q) and nominal diameter (=2R)
vav ≈ 2R
Q
⋅π= 1.7 m/s
Pipe diameter ± 12 mm 12 mm = pipe size liquid loop (see paragraph 3.9)
Accuracy < 2 % -
Temperature range 20 – 55 °C -
Material Corrosion resistant -
Connection Preferably Tri-Clamp Replacing and cleaning is easy and fast
3.4.2 Measurement principles
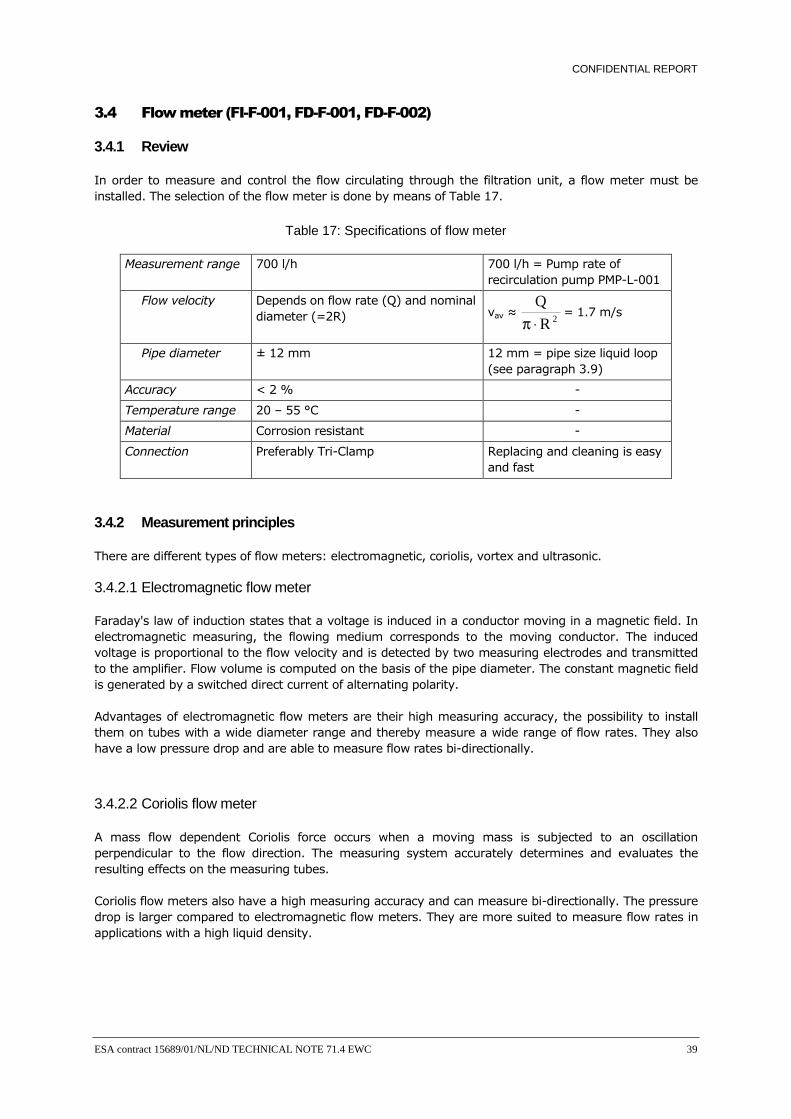
There are different types of flow meters: electromagnetic, coriolis, vortex and ultrasonic.
3.4.2.1 Electromagnetic flow meter
Faraday's law of induction states that a voltage is induced in a conductor moving in a magnetic field. In electromagnetic measuring, the flowing medium corresponds to the moving conductor. The induced voltage is proportional to the flow velocity and is detected by two measuring electrodes and transmitted to the amplifier. Flow volume is computed on the basis of the pipe diameter. The constant magnetic field is generated by a switched direct current of alternating polarity.
Advantages of electromagnetic flow meters are their high measuring accuracy, the possibility to install them on tubes with a wide diameter range and thereby measure a wide range of flow rates. They also have a low pressure drop and are able to measure flow rates bi-directionally.
3.4.2.2 Coriolis flow meter
A mass flow dependent Coriolis force occurs when a moving mass is subjected to an oscillation perpendicular to the flow direction. The measuring system accurately determines and evaluates the resulting effects on the measuring tubes.
Coriolis flow meters also have a high measuring accuracy and can measure bi-directionally. The pressure drop is larger compared to electromagnetic flow meters. They are more suited to measure flow rates in applications with a high liquid density.
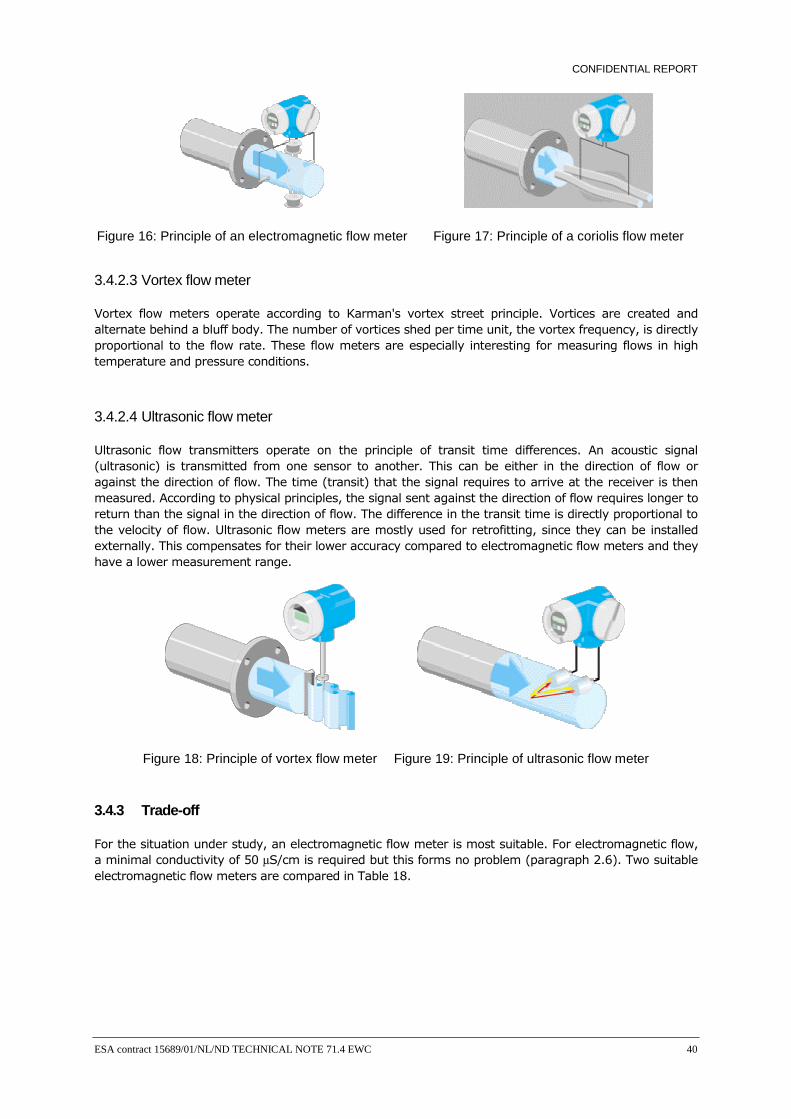
CONFIDENTIAL REPORT
ESA contract 15689/01/NL/ND TECHNICAL NOTE 71.4 EWC 40
Figure 16: Principle of an electromagnetic flow meter Figure 17: Principle of a coriolis flow meter
3.4.2.3 Vortex flow meter
Vortex flow meters operate according to Karman's vortex street principle. Vortices are created and alternate behind a bluff body. The number of vortices shed per time unit, the vortex frequency, is directly proportional to the flow rate. These flow meters are especially interesting for measuring flows in high temperature and pressure conditions.
3.4.2.4 Ultrasonic flow meter
Ultrasonic flow transmitters operate on the principle of transit time differences. An acoustic signal (ultrasonic) is transmitted from one sensor to another. This can be either in the direction of flow or against the direction of flow. The time (transit) that the signal requires to arrive at the receiver is then measured. According to physical principles, the signal sent against the direction of flow requires longer to return than the signal in the direction of flow. The difference in the transit time is directly proportional to the velocity of flow. Ultrasonic flow meters are mostly used for retrofitting, since they can be installed externally. This compensates for their lower accuracy compared to electromagnetic flow meters and they have a lower measurement range.
Figure 18: Principle of vortex flow meter Figure 19: Principle of ultrasonic flow meter
3.4.3 Trade-off
For the situation under study, an electromagnetic flow meter is most suitable. For electromagnetic flow, a minimal conductivity of 50 µS/cm is required but this forms no problem (paragraph 2.6). Two suitable electromagnetic flow meters are compared in Table 18.
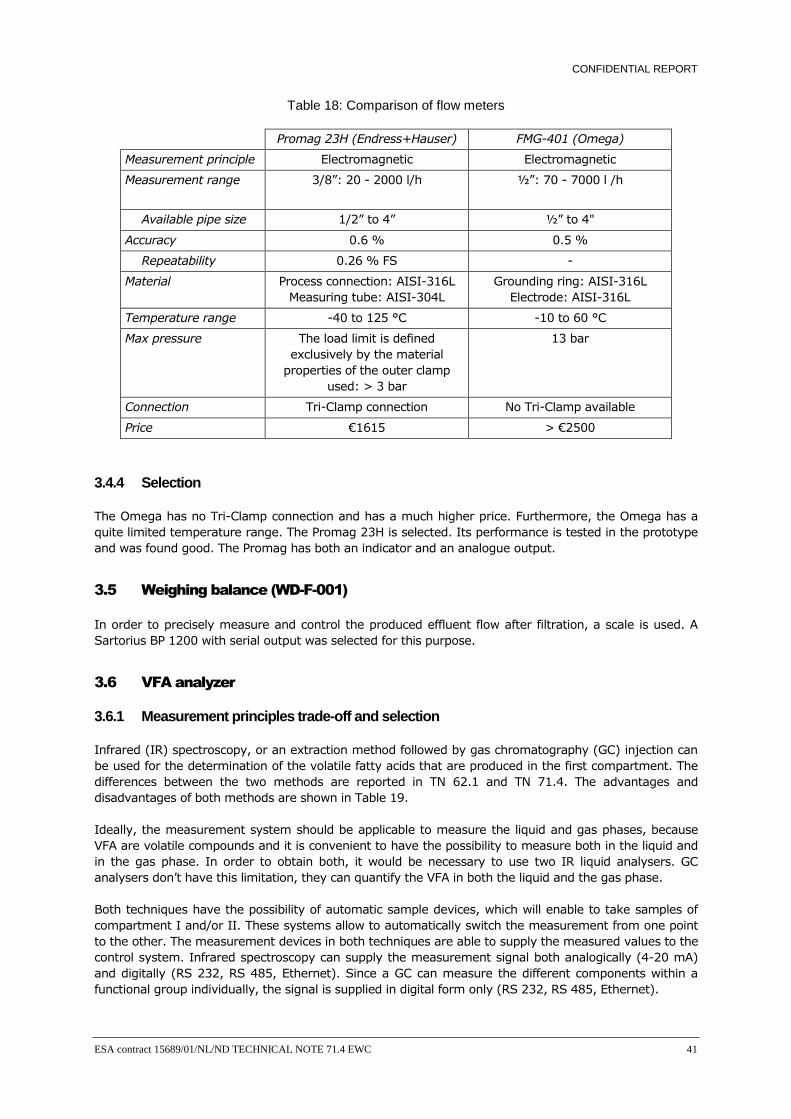
CONFIDENTIAL REPORT
ESA contract 15689/01/NL/ND TECHNICAL NOTE 71.4 EWC 41
Table 18: Comparison of flow meters
Promag 23H (Endress+Hauser) FMG-401 (Omega)
Measurement principle Electromagnetic Electromagnetic
Measurement range 3/8”: 20 - 2000 l/h ½”: 70 - 7000 l /h
Available pipe size 1/2” to 4” ½” to 4"
Accuracy 0.6 % 0.5 %
Repeatability 0.26 % FS -
Material Process connection: AISI-316L Measuring tube: AISI-304L
Grounding ring: AISI-316L Electrode: AISI-316L
Temperature range -40 to 125 °C -10 to 60 °C
Max pressure The load limit is defined exclusively by the material
properties of the outer clamp used: > 3 bar
13 bar
Connection Tri-Clamp connection No Tri-Clamp available
Price €1615 > €2500
3.4.4 Selection
The Omega has no Tri-Clamp connection and has a much higher price. Furthermore, the Omega has a quite limited temperature range. The Promag 23H is selected. Its performance is tested in the prototype and was found good. The Promag has both an indicator and an analogue output.
3.5 Weighing balance (WD-F-001)
In order to precisely measure and control the produced effluent flow after filtration, a scale is used. A Sartorius BP 1200 with serial output was selected for this purpose.
3.6 VFA analyzer
3.6.1 Measurement principles trade-off and selection
Infrared (IR) spectroscopy, or an extraction method followed by gas chromatography (GC) injection can be used for the determination of the volatile fatty acids that are produced in the first compartment. The differences between the two methods are reported in TN 62.1 and TN 71.4. The advantages and disadvantages of both methods are shown in Table 19.
Ideally, the measurement system should be applicable to measure the liquid and gas phases, because VFA are volatile compounds and it is convenient to have the possibility to measure both in the liquid and in the gas phase. In order to obtain both, it would be necessary to use two IR liquid analysers. GC analysers don’t have this limitation, they can quantify the VFA in both the liquid and the gas phase.
Both techniques have the possibility of automatic sample devices, which will enable to take samples of compartment I and/or II. These systems allow to automatically switch the measurement from one point to the other. The measurement devices in both techniques are able to supply the measured values to the control system. Infrared spectroscopy can supply the measurement signal both analogically (4-20 mA) and digitally (RS 232, RS 485, Ethernet). Since a GC can measure the different components within a functional group individually, the signal is supplied in digital form only (RS 232, RS 485, Ethernet).
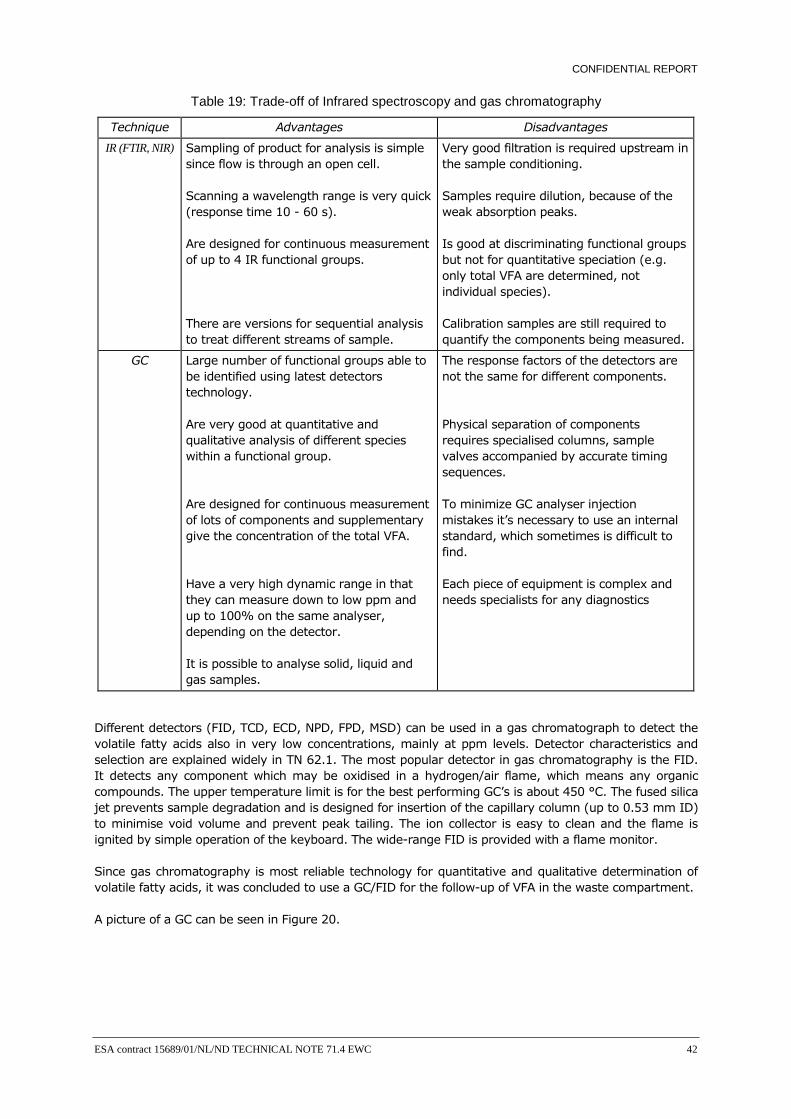
CONFIDENTIAL REPORT
ESA contract 15689/01/NL/ND TECHNICAL NOTE 71.4 EWC 42
Table 19: Trade-off of Infrared spectroscopy and gas chromatography
Technique Advantages Disadvantages
IR (FTIR, NIR) Sampling of product for analysis is simple since flow is through an open cell.
Scanning a wavelength range is very quick (response time 10 - 60 s).
Are designed for continuous measurement of up to 4 IR functional groups.
There are versions for sequential analysis to treat different streams of sample.
Very good filtration is required upstream in the sample conditioning.
Samples require dilution, because of the weak absorption peaks.
Is good at discriminating functional groups but not for quantitative speciation (e.g. only total VFA are determined, not individual species).
Calibration samples are still required to quantify the components being measured.
GC Large number of functional groups able to be identified using latest detectors technology.
Are very good at quantitative and qualitative analysis of different species within a functional group.
Are designed for continuous measurement of lots of components and supplementary give the concentration of the total VFA.
Have a very high dynamic range in that they can measure down to low ppm and up to 100% on the same analyser, depending on the detector.
It is possible to analyse solid, liquid and gas samples.
The response factors of the detectors are not the same for different components.
Physical separation of components requires specialised columns, sample valves accompanied by accurate timing sequences. To minimize GC analyser injection mistakes it’s necessary to use an internal standard, which sometimes is difficult to find.
Each piece of equipment is complex and needs specialists for any diagnostics
Different detectors (FID, TCD, ECD, NPD, FPD, MSD) can be used in a gas chromatograph to detect the volatile fatty acids also in very low concentrations, mainly at ppm levels. Detector characteristics and selection are explained widely in TN 62.1. The most popular detector in gas chromatography is the FID. It detects any component which may be oxidised in a hydrogen/air flame, which means any organic compounds. The upper temperature limit is for the best performing GC’s is about 450 °C. The fused silica jet prevents sample degradation and is designed for insertion of the capillary column (up to 0.53 mm ID) to minimise void volume and prevent peak tailing. The ion collector is easy to clean and the flame is ignited by simple operation of the keyboard. The wide-range FID is provided with a flame monitor.
Since gas chromatography is most reliable technology for quantitative and qualitative determination of volatile fatty acids, it was concluded to use a GC/FID for the follow-up of VFA in the waste compartment.
A picture of a GC can be seen in Figure 20.
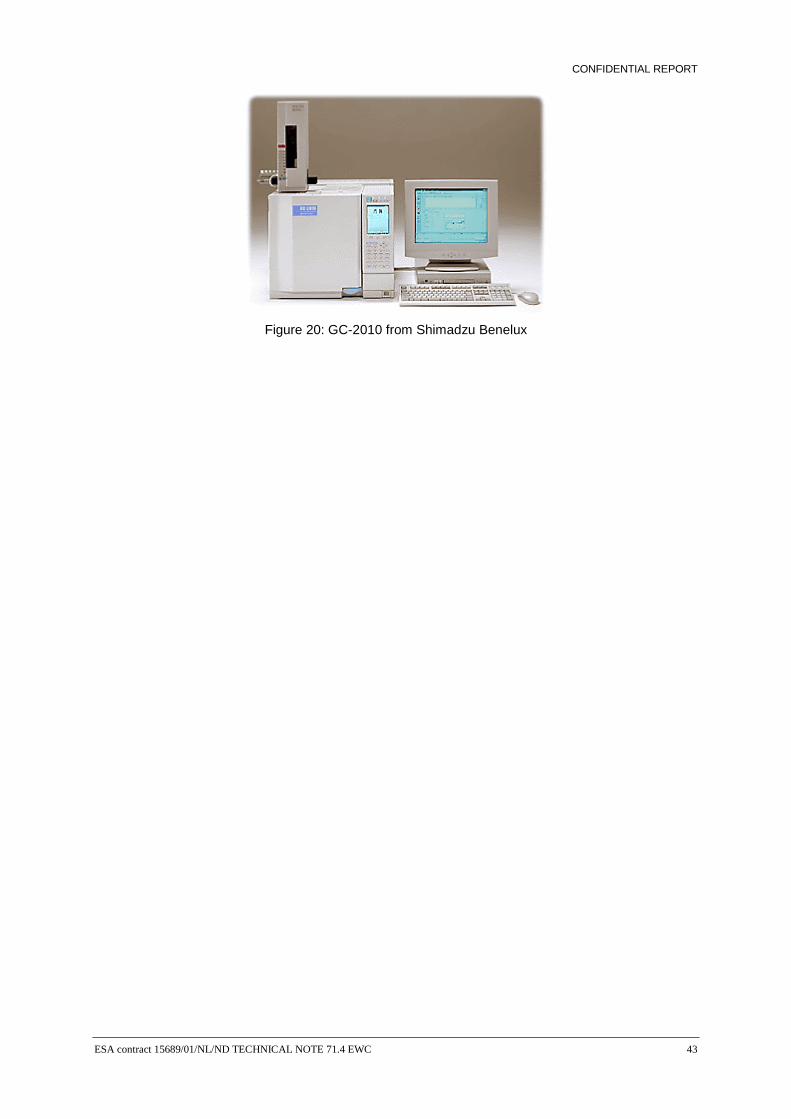
CONFIDENTIAL REPORT
ESA contract 15689/01/NL/ND TECHNICAL NOTE 71.4 EWC 43
Figure 20: GC-2010 from Shimadzu Benelux
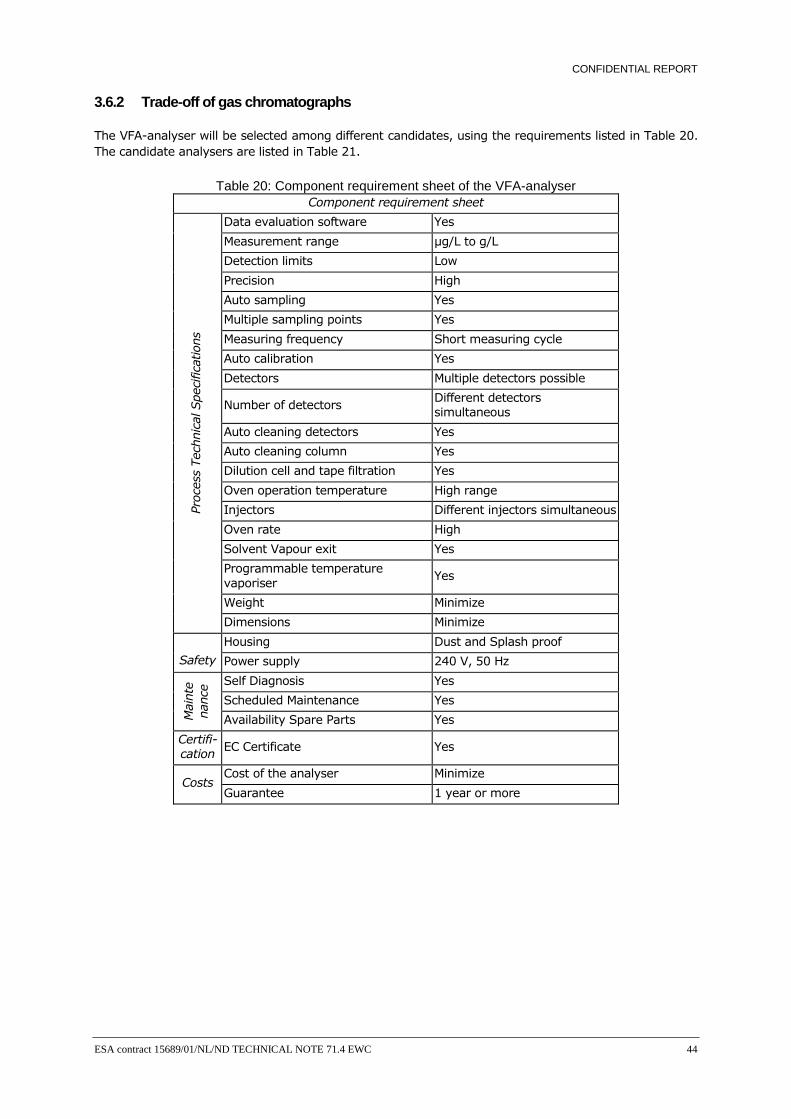
CONFIDENTIAL REPORT
ESA contract 15689/01/NL/ND TECHNICAL NOTE 71.4 EWC 44
3.6.2 Trade-off of gas chromatographs
The VFA-analyser will be selected among different candidates, using the requirements listed in Table 20. The candidate analysers are listed in Table 21.
Table 20: Component requirement sheet of the VFA-analyser Component requirement sheet
Data evaluation software Yes
Measurement range µg/L to g/L
Detection limits Low
Precision High
Auto sampling Yes
Multiple sampling points Yes
Measuring frequency Short measuring cycle
Auto calibration Yes
Detectors Multiple detectors possible
Number of detectors Different detectors simultaneous
Auto cleaning detectors Yes
Auto cleaning column Yes
Dilution cell and tape filtration Yes
Oven operation temperature High range
Injectors Different injectors simultaneous
Oven rate High
Solvent Vapour exit Yes
Programmable temperature vaporiser
Yes
Weight Minimize
Proc
ess
Tech
nica
l Spe
cific
atio
ns
Dimensions Minimize
Housing Dust and Splash proof
Safety Power supply 240 V, 50 Hz
Self Diagnosis Yes
Scheduled Maintenance Yes
Mai
nte
nanc
e
Availability Spare Parts Yes
Certifi-cation EC Certificate Yes
Cost of the analyser Minimize Costs
Guarantee 1 year or more
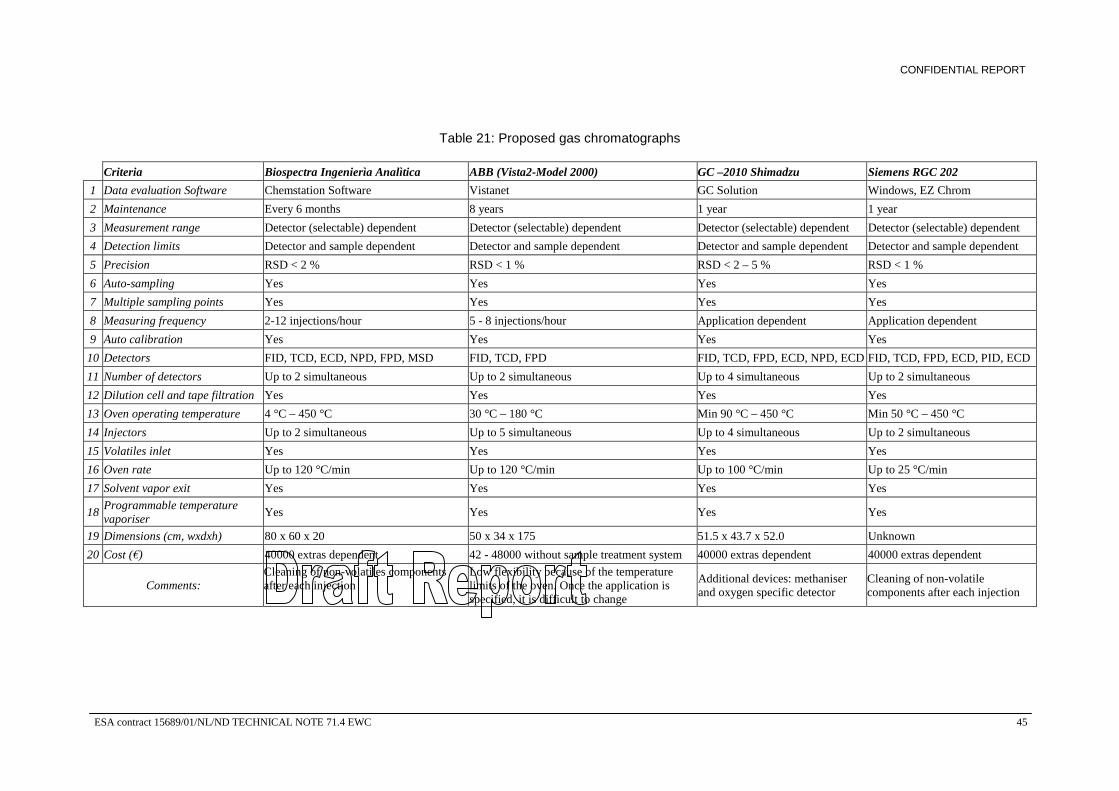
CONFIDENTIAL REPORT
ESA contract 15689/01/NL/ND TECHNICAL NOTE 71.4 EWC 45
Table 21: Proposed gas chromatographs
Criteria Biospectra Ingenierìa Analìtica ABB (Vista2-Model 2000) GC –2010 Shimadzu Siemens RGC 202
1 Data evaluation Software Chemstation Software Vistanet GC Solution Windows, EZ Chrom
2 Maintenance Every 6 months 8 years 1 year 1 year
3 Measurement range Detector (selectable) dependent Detector (selectable) dependent Detector (selectable) dependent Detector (selectable) dependent
4 Detection limits Detector and sample dependent Detector and sample dependent Detector and sample dependent Detector and sample dependent
5 Precision RSD < 2 % RSD < 1 % RSD < 2 – 5 % RSD < 1 %
6 Auto-sampling Yes Yes Yes Yes
7 Multiple sampling points Yes Yes Yes Yes
8 Measuring frequency 2-12 injections/hour 5 - 8 injections/hour Application dependent Application dependent
9 Auto calibration Yes Yes Yes Yes
10 Detectors FID, TCD, ECD, NPD, FPD, MSD FID, TCD, FPD FID, TCD, FPD, ECD, NPD, ECD FID, TCD, FPD, ECD, PID, ECD
11 Number of detectors Up to 2 simultaneous Up to 2 simultaneous Up to 4 simultaneous Up to 2 simultaneous
12 Dilution cell and tape filtration Yes Yes Yes Yes
13 Oven operating temperature 4 °C – 450 °C 30 °C – 180 °C Min 90 °C – 450 °C Min 50 °C – 450 °C
14 Injectors Up to 2 simultaneous Up to 5 simultaneous Up to 4 simultaneous Up to 2 simultaneous
15 Volatiles inlet Yes Yes Yes Yes
16 Oven rate Up to 120 °C/min Up to 120 °C/min Up to 100 °C/min Up to 25 °C/min
17 Solvent vapor exit Yes Yes Yes Yes
18 Programmable temperature vaporiser
Yes Yes Yes Yes
19 Dimensions (cm, wxdxh) 80 x 60 x 20 50 x 34 x 175 51.5 x 43.7 x 52.0 Unknown
20 Cost (€) 40000 extras dependent 42 - 48000 without sample treatment system 40000 extras dependent 40000 extras dependent
Comments: Cleaning of non-volatiles components after each injection
Low flexibility because of the temperature limits of the oven. Once the application is specified, it is difficult to change
Additional devices: methaniser and oxygen specific detector
Cleaning of non-volatile components after each injection
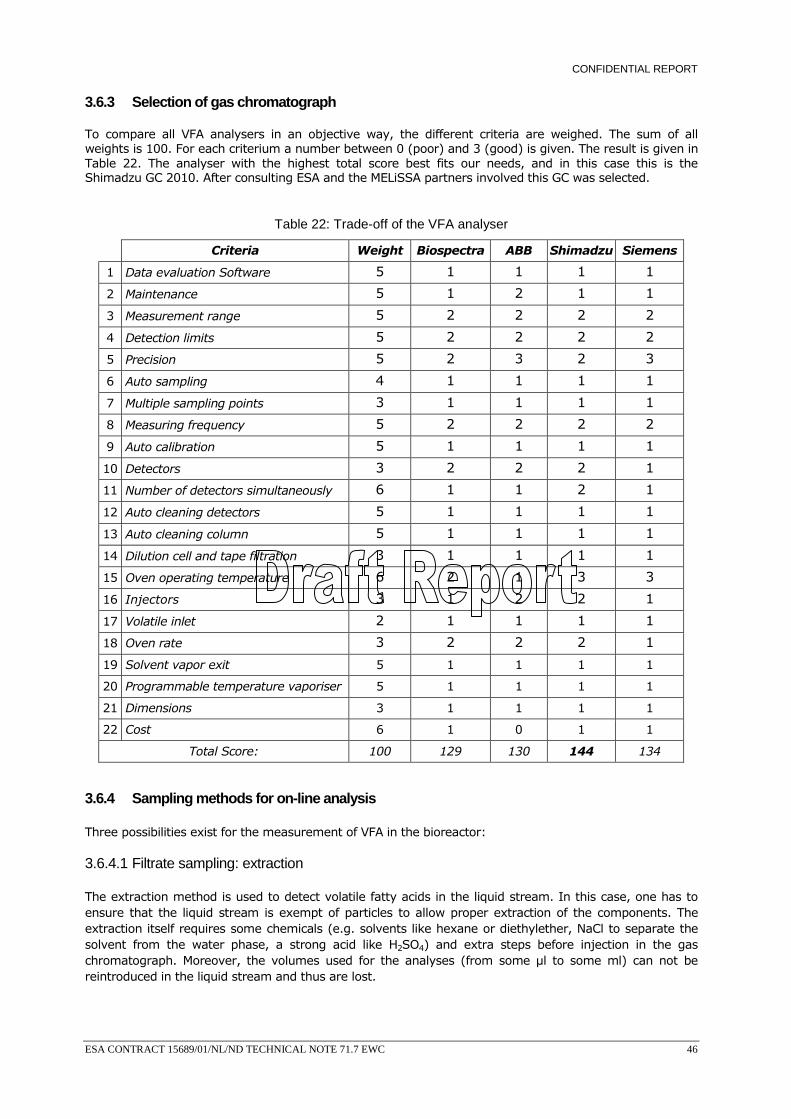
CONFIDENTIAL REPORT
ESA CONTRACT 15689/01/NL/ND TECHNICAL NOTE 71.7 EWC 46
3.6.3 Selection of gas chromatograph
To compare all VFA analysers in an objective way, the different criteria are weighed. The sum of all weights is 100. For each criterium a number between 0 (poor) and 3 (good) is given. The result is given in Table 22. The analyser with the highest total score best fits our needs, and in this case this is the Shimadzu GC 2010. After consulting ESA and the MELiSSA partners involved this GC was selected.
Table 22: Trade-off of the VFA analyser
Criteria Weight Biospectra ABB Shimadzu Siemens
1 Data evaluation Software 5 1 1 1 1
2 Maintenance 5 1 2 1 1
3 Measurement range 5 2 2 2 2
4 Detection limits 5 2 2 2 2
5 Precision 5 2 3 2 3
6 Auto sampling 4 1 1 1 1
7 Multiple sampling points 3 1 1 1 1
8 Measuring frequency 5 2 2 2 2
9 Auto calibration 5 1 1 1 1
10 Detectors 3 2 2 2 1
11 Number of detectors simultaneously 6 1 1 2 1
12 Auto cleaning detectors 5 1 1 1 1
13 Auto cleaning column 5 1 1 1 1
14 Dilution cell and tape filtration 3 1 1 1 1
15 Oven operating temperature 6 2 1 3 3
16 Injectors 3 1 2 2 1
17 Volatile inlet 2 1 1 1 1
18 Oven rate 3 2 2 2 1
19 Solvent vapor exit 5 1 1 1 1
20 Programmable temperature vaporiser 5 1 1 1 1
21 Dimensions 3 1 1 1 1
22 Cost 6 1 0 1 1
Total Score: 100 129 130 144 134
3.6.4 Sampling methods for on-line analysis
Three possibilities exist for the measurement of VFA in the bioreactor:
3.6.4.1 Filtrate sampling: extraction
The extraction method is used to detect volatile fatty acids in the liquid stream. In this case, one has to ensure that the liquid stream is exempt of particles to allow proper extraction of the components. The extraction itself requires some chemicals (e.g. solvents like hexane or diethylether, NaCl to separate the solvent from the water phase, a strong acid like H2SO4) and extra steps before injection in the gas chromatograph. Moreover, the volumes used for the analyses (from some µl to some ml) can not be reintroduced in the liquid stream and thus are lost.
CONFIDENTIAL REPORT
ESA CONTRACT 15689/01/NL/ND TECHNICAL NOTE 71.7 EWC 47
3.6.4.2 Headspace sampling
Headspace sampling is used to detect volatile compounds of solid or liquid samples, analysing the vapour phase that is in equilibrium with the sample in a closed recipient that is heated to a pre-set temperature. It is especially used to analyse volatile compounds in samples difficult to analyse for conventional GC. All VFAs of interest are volatile compounds.
This technique has the following advantages:
It is not necessary to perform a pre-treatment of the sample
The column is not damaged by non volatile compounds
The main disadvantage is the fact that an accurate calibration is required for quantitative analyses of the compounds. This is caused by the vapour-liquid equilibrium that is obtained within the closed recipient. Part of the VFA is still present in the liquid phase after the equilibrium is obtained. The calibration has to take this into account. Furthermore, it should be noted that some other volatile components apart from the VFA’s will be present in the injected sample, possibly contaminating the column.
In an on-line implementation, the sample is introduced in a glass flask by a robot arm (see paragraph 3.6.5). The flask is closed with a rubber septum and is heated in an oven. The applied temperature can range from 40 ºC up to 190 ºC depending on the thermal stability of the compounds to be measured. The head space is then sampled and introduced into the chromatographic system with a syringe.
There exist two injection methods for capillary columns using headspace sampling:
Split
This headspace sample is mixed with carrier gas flow. Then it is divided in two different parts, the greatest part is wasted and the smallest one pass through the column. Usual split ratios are from 1:20 to 1:200. It is a technique for major components, because the quantity of sample that is introduced on the column is small, and the use of highly volatile solvents should be avoided whenever possible.
For quantification, the standard addition of the internal standard method is preferred but the external standard method in which absolute peak areas are compared can be used. Reproducibility will be enhanced by not varying the injected volume.
Split-less
This is a pre-concentration technique for diluted samples such as traces analysis, and for samples containing labile compounds or compounds that are eluted very near to the solvent. The sample is completely introduced on the column.
For quantification, both standard addition and internal standard can be applied. Reproducibility will be enhanced by not varying the injected volume.
3.6.4.3 Direct gas sampling from the gas loop
Since the bioreactor operates at 55 °C, part of the VFA produced will be present in the gas phase. The presence of a gas loop (see TN 71.5) makes is possible to use a flow cell and to sample the gas from there for direct injection into the chromatographic system.
When this sampling would be performed, the measured concentrations would be lower compared to the headspace sampling technique, because of the lower temperature of the liquid. Furthermore, in the EWC set-up, an even bigger concentration difference between gas and liquid phase is expected because of VFA condensation in the pressure buffer vessel and/or dryer. Some preliminary simulations without condensation were done by UBP, even there a low VFA concentration in gas phase was found. With
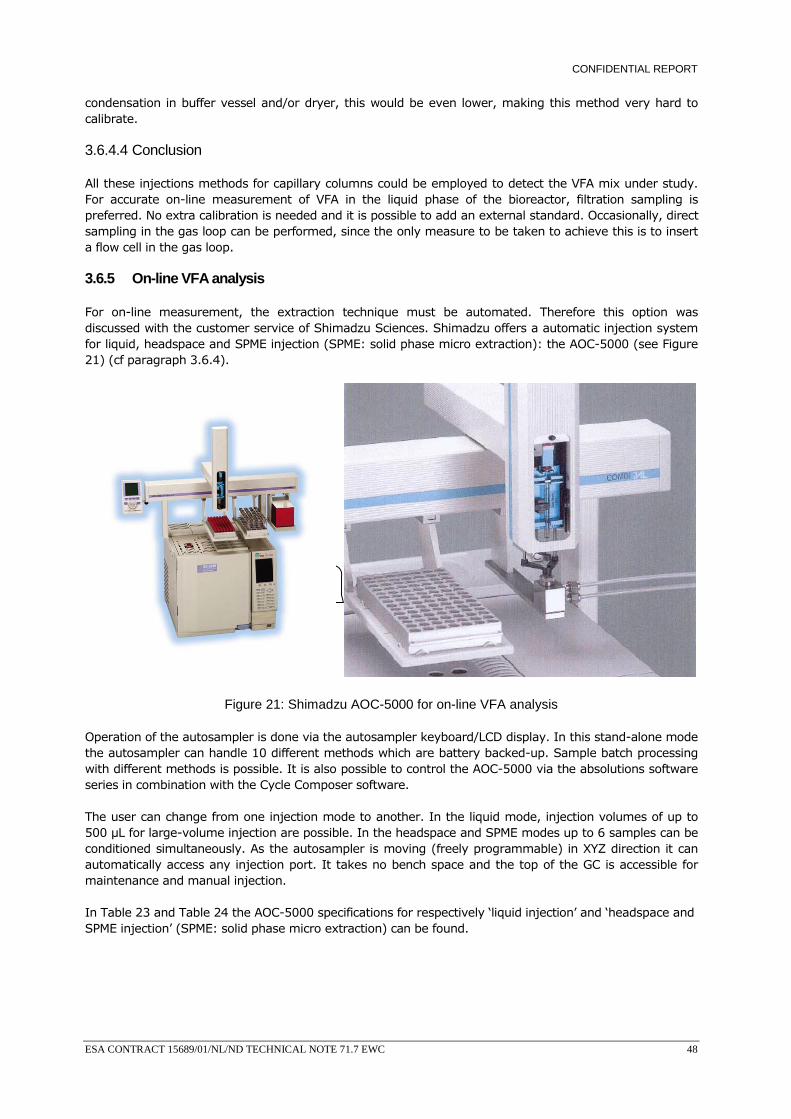
CONFIDENTIAL REPORT
ESA CONTRACT 15689/01/NL/ND TECHNICAL NOTE 71.7 EWC 48
condensation in buffer vessel and/or dryer, this would be even lower, making this method very hard to calibrate.
3.6.4.4 Conclusion
All these injections methods for capillary columns could be employed to detect the VFA mix under study. For accurate on-line measurement of VFA in the liquid phase of the bioreactor, filtration sampling is preferred. No extra calibration is needed and it is possible to add an external standard. Occasionally, direct sampling in the gas loop can be performed, since the only measure to be taken to achieve this is to insert a flow cell in the gas loop.
3.6.5 On-line VFA analysis
For on-line measurement, the extraction technique must be automated. Therefore this option was discussed with the customer service of Shimadzu Sciences. Shimadzu offers a automatic injection system for liquid, headspace and SPME injection (SPME: solid phase micro extraction): the AOC-5000 (see Figure 21) (cf paragraph 3.6.4).
Figure 21: Shimadzu AOC-5000 for on-line VFA analysis
Operation of the autosampler is done via the autosampler keyboard/LCD display. In this stand-alone mode the autosampler can handle 10 different methods which are battery backed-up. Sample batch processing with different methods is possible. It is also possible to control the AOC-5000 via the absolutions software series in combination with the Cycle Composer software.
The user can change from one injection mode to another. In the liquid mode, injection volumes of up to 500 µL for large-volume injection are possible. In the headspace and SPME modes up to 6 samples can be conditioned simultaneously. As the autosampler is moving (freely programmable) in XYZ direction it can automatically access any injection port. It takes no bench space and the top of the GC is accessible for maintenance and manual injection.
In Table 23 and Table 24 the AOC-5000 specifications for respectively ‘liquid injection’ and ‘headspace and SPME injection’ (SPME: solid phase micro extraction) can be found.
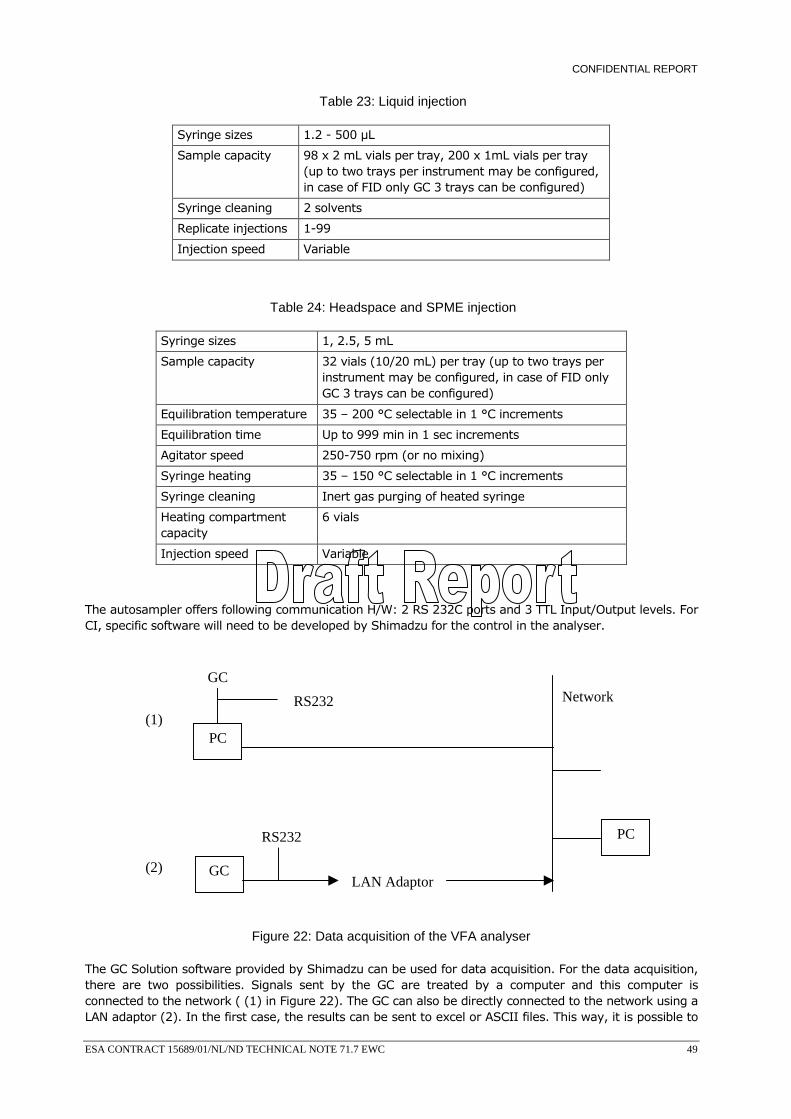
CONFIDENTIAL REPORT
ESA CONTRACT 15689/01/NL/ND TECHNICAL NOTE 71.7 EWC 49
Table 23: Liquid injection
Syringe sizes 1.2 - 500 µL
Sample capacity 98 x 2 mL vials per tray, 200 x 1mL vials per tray (up to two trays per instrument may be configured, in case of FID only GC 3 trays can be configured)
Syringe cleaning 2 solvents
Replicate injections 1-99
Injection speed Variable
Table 24: Headspace and SPME injection
Syringe sizes 1, 2.5, 5 mL
Sample capacity 32 vials (10/20 mL) per tray (up to two trays per instrument may be configured, in case of FID only GC 3 trays can be configured)
Equilibration temperature 35 – 200 °C selectable in 1 °C increments
Equilibration time Up to 999 min in 1 sec increments
Agitator speed 250-750 rpm (or no mixing)
Syringe heating 35 – 150 °C selectable in 1 °C increments
Syringe cleaning Inert gas purging of heated syringe
Heating compartment capacity
6 vials
Injection speed Variable
The autosampler offers following communication H/W: 2 RS 232C ports and 3 TTL Input/Output levels. For CI, specific software will need to be developed by Shimadzu for the control in the analyser.
Figure 22: Data acquisition of the VFA analyser
The GC Solution software provided by Shimadzu can be used for data acquisition. For the data acquisition, there are two possibilities. Signals sent by the GC are treated by a computer and this computer is connected to the network ( (1) in Figure 22). The GC can also be directly connected to the network using a LAN adaptor (2). In the first case, the results can be sent to excel or ASCII files. This way, it is possible to
GC
RS232
LAN Adaptor
PC
GC
RS232
PC
Network
(1)
(2)
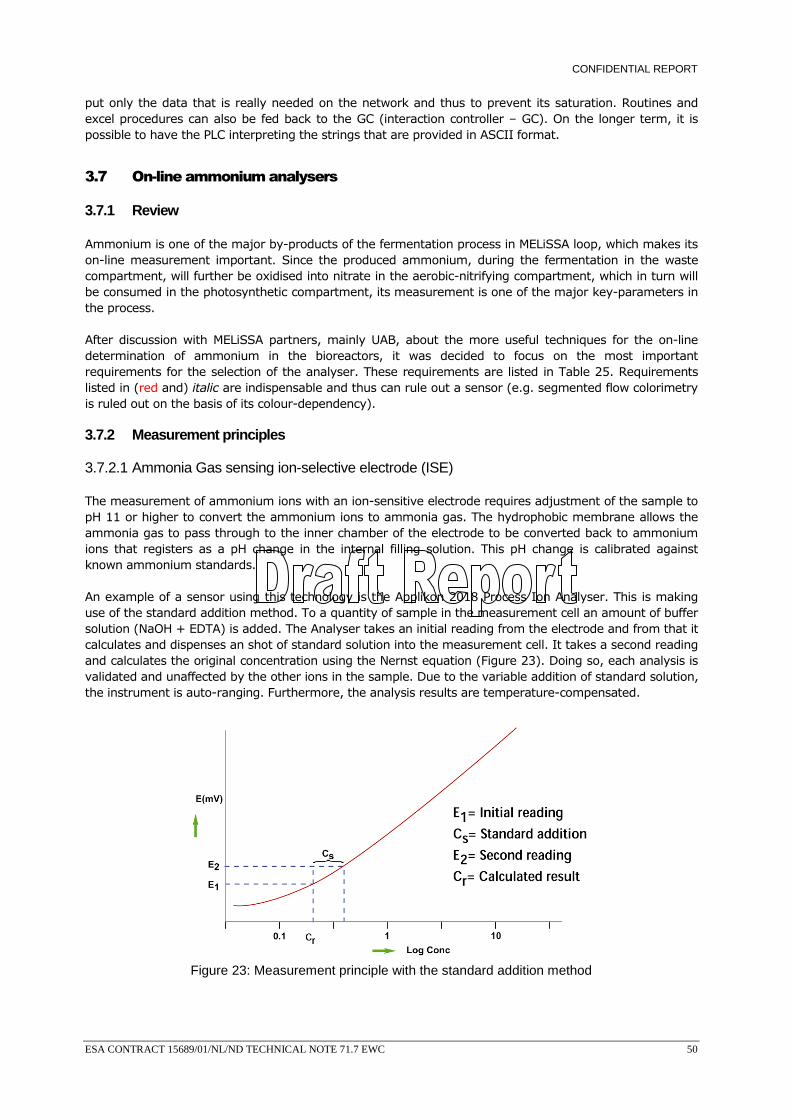
CONFIDENTIAL REPORT
ESA CONTRACT 15689/01/NL/ND TECHNICAL NOTE 71.7 EWC 50
put only the data that is really needed on the network and thus to prevent its saturation. Routines and excel procedures can also be fed back to the GC (interaction controller – GC). On the longer term, it is possible to have the PLC interpreting the strings that are provided in ASCII format.
3.7 On-line ammonium analysers
3.7.1 Review
Ammonium is one of the major by-products of the fermentation process in MELiSSA loop, which makes its on-line measurement important. Since the produced ammonium, during the fermentation in the waste compartment, will further be oxidised into nitrate in the aerobic-nitrifying compartment, which in turn will be consumed in the photosynthetic compartment, its measurement is one of the major key-parameters in the process.
After discussion with MELiSSA partners, mainly UAB, about the more useful techniques for the on-line determination of ammonium in the bioreactors, it was decided to focus on the most important requirements for the selection of the analyser. These requirements are listed in Table 25. Requirements listed in (red and) italic are indispensable and thus can rule out a sensor (e.g. segmented flow colorimetry is ruled out on the basis of its colour-dependency).
3.7.2 Measurement principles
3.7.2.1 Ammonia Gas sensing ion-selective electrode (ISE)
The measurement of ammonium ions with an ion-sensitive electrode requires adjustment of the sample to pH 11 or higher to convert the ammonium ions to ammonia gas. The hydrophobic membrane allows the ammonia gas to pass through to the inner chamber of the electrode to be converted back to ammonium ions that registers as a pH change in the internal filling solution. This pH change is calibrated against known ammonium standards.
An example of a sensor using this technology is the Applikon 2018 Process Ion Analyser. This is making use of the standard addition method. To a quantity of sample in the measurement cell an amount of buffer solution (NaOH + EDTA) is added. The Analyser takes an initial reading from the electrode and from that it calculates and dispenses an shot of standard solution into the measurement cell. It takes a second reading and calculates the original concentration using the Nernst equation (Figure 23). Doing so, each analysis is validated and unaffected by the other ions in the sample. Due to the variable addition of standard solution, the instrument is auto-ranging. Furthermore, the analysis results are temperature-compensated.
Figure 23: Measurement principle with the standard addition method
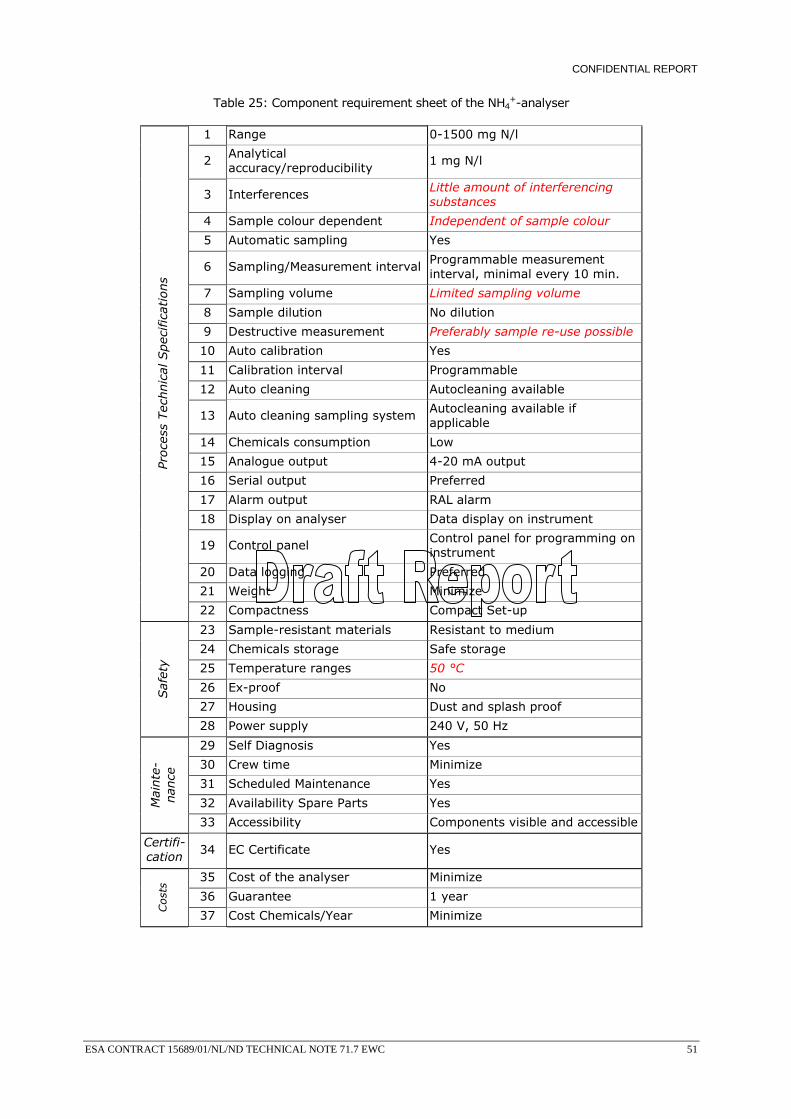
CONFIDENTIAL REPORT
ESA CONTRACT 15689/01/NL/ND TECHNICAL NOTE 71.7 EWC 51
Table 25: Component requirement sheet of the NH4+-analyser
1 Range 0-1500 mg N/l
2 Analytical accuracy/reproducibility
1 mg N/l
3 Interferences Little amount of interferencing substances
4 Sample colour dependent Independent of sample colour
5 Automatic sampling Yes
6 Sampling/Measurement interval Programmable measurement interval, minimal every 10 min.
7 Sampling volume Limited sampling volume
8 Sample dilution No dilution
9 Destructive measurement Preferably sample re-use possible
10 Auto calibration Yes
11 Calibration interval Programmable
12 Auto cleaning Autocleaning available
13 Auto cleaning sampling system Autocleaning available if applicable
14 Chemicals consumption Low
15 Analogue output 4-20 mA output
16 Serial output Preferred
17 Alarm output RAL alarm
18 Display on analyser Data display on instrument
19 Control panel Control panel for programming on instrument
20 Data logging Preferred
21 Weight Minimize
Proce
ss T
echnic
al S
pec
ific
atio
ns
22 Compactness Compact Set-up
23 Sample-resistant materials Resistant to medium
24 Chemicals storage Safe storage
25 Temperature ranges 50 °C
26 Ex-proof No
27 Housing Dust and splash proof
Saf
ety
28 Power supply 240 V, 50 Hz
29 Self Diagnosis Yes
30 Crew time Minimize
31 Scheduled Maintenance Yes
32 Availability Spare Parts Yes Mai
nte
-nan
ce
33 Accessibility Components visible and accessible
Certifi-cation 34 EC Certificate Yes
35 Cost of the analyser Minimize
36 Guarantee 1 year
Cost
s
37 Cost Chemicals/Year Minimize
CONFIDENTIAL REPORT
ESA CONTRACT 15689/01/NL/ND TECHNICAL NOTE 71.7 EWC 52
Advantages:
Relatively low volumes are required per analysis
Reasonable price compared to the other on-line ammonium analysers (e.g. certain colorimetric methods)
High accuracy and rapid response
Disadvantages:
Recalibration regularly needed
Use of chemicals (caustic + EDTA as buffer solution)
Destructive method, recuperation of sample is not possible
Interference of high protein concentrations
3.7.2.2 Colorimetric techniques
Two methods have been implemented in automated ammonia analysers using colorimetric techniques.
Sparging method with subsequent photometric pH indication
The ammonium is converted to the gas phase in the reaction cell by the addition of an alkaline medium, then transferred as ammonia to another vessel containing a solution of pH indicator. The colour change of the indicator is a measure of the ammonium concentration of the original sample.
Advantages:
Relatively low volumes are required per analysis
Reasonable price compared to the other on-line ammonium analysers
High accuracy
Non-destructive. Only the ammonia is sparged, the rest can be recuperated. It was verified with experiments of titration, that the necessary amount of base (NaOH) is neglectable.
Disadvantages:
Recalibration regularly needed
Use of chemicals (caustic) An example of a sensor using this technology is the Dr Lange AMTAX-compact.
Segmented flow colorimetry
In this method, a colouring compound like indophenol blue compound is produced. The intensity is proportional to the amount of NH4
+-N present in the sample. This colour intensity is measured directly with a photometer.
Advantages:
High accuracy
Disadvantages:
Destructive method, recuperation of sample is not possible
Relatively high volumes are required per analysis
High price
Recalibration regularly needed
Sample colour sensitive An example of a sensor using this technology is the SKALAR on-line process analyser.
3.7.3 Trade-off
Some on-line ammonium analysers were thus proposed by both EPAS and UAB as reported in Table 26.
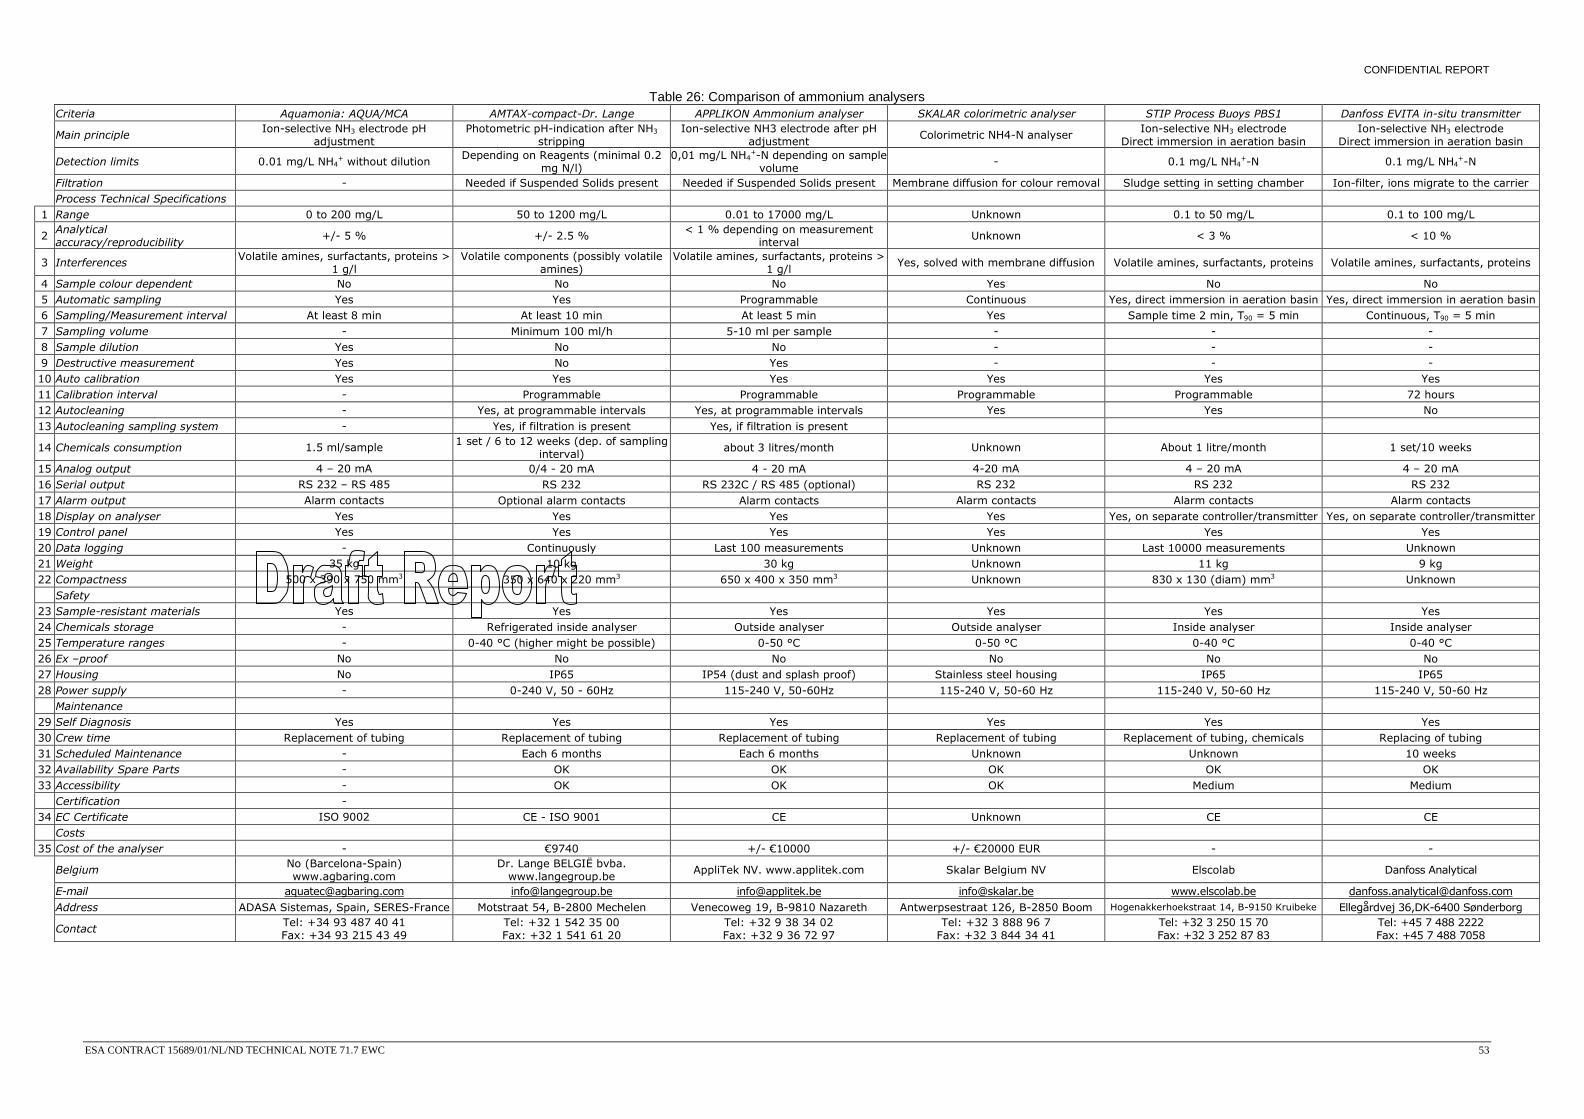
CONFIDENTIAL REPORT
ESA CONTRACT 15689/01/NL/ND TECHNICAL NOTE 71.7 EWC 53
Table 26: Comparison of ammonium analysers Criteria Aquamonia: AQUA/MCA AMTAX-compact-Dr. Lange APPLIKON Ammonium analyser SKALAR colorimetric analyser STIP Process Buoys PBS1 Danfoss EVITA in-situ transmitter
Main principle Ion-selective NH3 electrode pH adjustment
Photometric pH-indication after NH3 stripping
Ion-selective NH3 electrode after pH adjustment
Colorimetric NH4-N analyser Ion-selective NH3 electrode Direct immersion in aeration basin
Ion-selective NH3 electrode Direct immersion in aeration basin
Detection limits 0.01 mg/L NH4+ without dilution Depending on Reagents (minimal 0.2
mg N/l) 0,01 mg/L NH4
+-N depending on sample volume
- 0.1 mg/L NH4+-N 0.1 mg/L NH4
+-N
Filtration - Needed if Suspended Solids present Needed if Suspended Solids present Membrane diffusion for colour removal Sludge setting in setting chamber Ion-filter, ions migrate to the carrier Process Technical Specifications 1 Range 0 to 200 mg/L 50 to 1200 mg/L 0.01 to 17000 mg/L Unknown 0.1 to 50 mg/L 0.1 to 100 mg/L
2 Analytical accuracy/reproducibility
+/- 5 % +/- 2.5 % < 1 % depending on measurement interval
Unknown < 3 % < 10 %
3 Interferences Volatile amines, surfactants, proteins > 1 g/l
Volatile components (possibly volatile amines)
Volatile amines, surfactants, proteins > 1 g/l
Yes, solved with membrane diffusion Volatile amines, surfactants, proteins Volatile amines, surfactants, proteins
4 Sample colour dependent No No No Yes No No 5 Automatic sampling Yes Yes Programmable Continuous Yes, direct immersion in aeration basin Yes, direct immersion in aeration basin6 Sampling/Measurement interval At least 8 min At least 10 min At least 5 min Yes Sample time 2 min, T90 = 5 min Continuous, T90 = 5 min 7 Sampling volume - Minimum 100 ml/h 5-10 ml per sample - - - 8 Sample dilution Yes No No - - - 9 Destructive measurement Yes No Yes - - - 10 Auto calibration Yes Yes Yes Yes Yes Yes 11 Calibration interval - Programmable Programmable Programmable Programmable 72 hours 12 Autocleaning - Yes, at programmable intervals Yes, at programmable intervals Yes Yes No 13 Autocleaning sampling system - Yes, if filtration is present Yes, if filtration is present
14 Chemicals consumption 1.5 ml/sample 1 set / 6 to 12 weeks (dep. of sampling interval)
about 3 litres/month Unknown About 1 litre/month 1 set/10 weeks
15 Analog output 4 – 20 mA 0/4 - 20 mA 4 - 20 mA 4-20 mA 4 – 20 mA 4 – 20 mA 16 Serial output RS 232 – RS 485 RS 232 RS 232C / RS 485 (optional) RS 232 RS 232 RS 232 17 Alarm output Alarm contacts Optional alarm contacts Alarm contacts Alarm contacts Alarm contacts Alarm contacts 18 Display on analyser Yes Yes Yes Yes Yes, on separate controller/transmitter Yes, on separate controller/transmitter19 Control panel Yes Yes Yes Yes Yes Yes 20 Data logging - Continuously Last 100 measurements Unknown Last 10000 measurements Unknown 21 Weight 35 kg 10 kg 30 kg Unknown 11 kg 9 kg 22 Compactness 500 x 390 x 750 mm3 350 x 640 x 220 mm3 650 x 400 x 350 mm3 Unknown 830 x 130 (diam) mm3 Unknown Safety
23 Sample-resistant materials Yes Yes Yes Yes Yes Yes 24 Chemicals storage - Refrigerated inside analyser Outside analyser Outside analyser Inside analyser Inside analyser 25 Temperature ranges - 0-40 °C (higher might be possible) 0-50 °C 0-50 °C 0-40 °C 0-40 °C 26 Ex –proof No No No No No No 27 Housing No IP65 IP54 (dust and splash proof) Stainless steel housing IP65 IP65 28 Power supply - 0-240 V, 50 - 60Hz 115-240 V, 50-60Hz 115-240 V, 50-60 Hz 115-240 V, 50-60 Hz 115-240 V, 50-60 Hz Maintenance
29 Self Diagnosis Yes Yes Yes Yes Yes Yes 30 Crew time Replacement of tubing Replacement of tubing Replacement of tubing Replacement of tubing Replacement of tubing, chemicals Replacing of tubing 31 Scheduled Maintenance - Each 6 months Each 6 months Unknown Unknown 10 weeks 32 Availability Spare Parts - OK OK OK OK OK 33 Accessibility - OK OK OK Medium Medium Certification -
34 EC Certificate ISO 9002 CE - ISO 9001 CE Unknown CE CE Costs
35 Cost of the analyser - €9740 +/- €10000 +/- €20000 EUR - -
Belgium No (Barcelona-Spain) www.agbaring.com
Dr. Lange BELGIË bvba. www.langegroup.be
AppliTek NV. www.applitek.com Skalar Belgium NV Elscolab Danfoss Analytical
E-mail [email protected] [email protected] [email protected] [email protected] www.elscolab.be [email protected] Address ADASA Sistemas, Spain, SERES-France Motstraat 54, B-2800 Mechelen Venecoweg 19, B-9810 Nazareth Antwerpsestraat 126, B-2850 Boom Hogenakkerhoekstraat 14, B-9150 Kruibeke Ellegårdvej 36,DK-6400 Sønderborg
Contact Tel: +34 93 487 40 41 Fax: +34 93 215 43 49
Tel: +32 1 542 35 00 Fax: +32 1 541 61 20
Tel: +32 9 38 34 02 Fax: +32 9 36 72 97
Tel: +32 3 888 96 7 Fax: +32 3 844 34 41
Tel: +32 3 250 15 70 Fax: +32 3 252 87 83
Tel: +45 7 488 2222 Fax: +45 7 488 7058
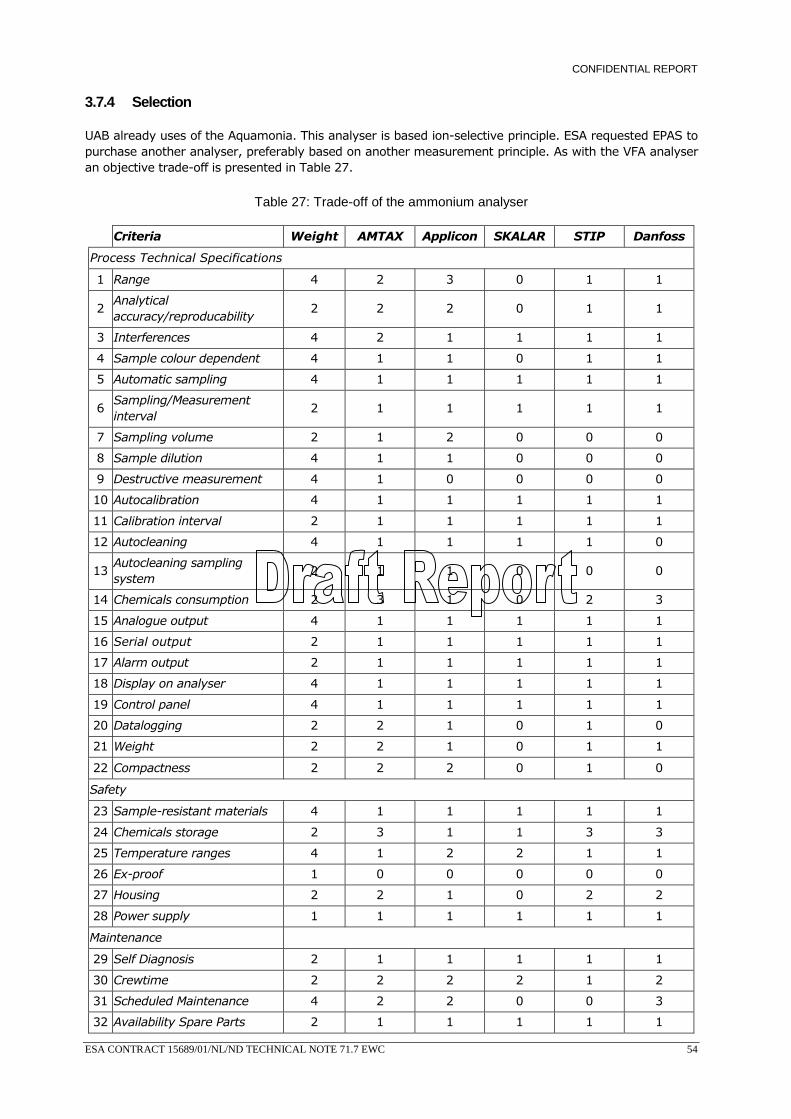
CONFIDENTIAL REPORT
ESA CONTRACT 15689/01/NL/ND TECHNICAL NOTE 71.7 EWC 54
3.7.4 Selection
UAB already uses of the Aquamonia. This analyser is based ion-selective principle. ESA requested EPAS to purchase another analyser, preferably based on another measurement principle. As with the VFA analyser an objective trade-off is presented in Table 27.
Table 27: Trade-off of the ammonium analyser
Criteria Weight AMTAX Applicon SKALAR STIP Danfoss
Process Technical Specifications
1 Range 4 2 3 0 1 1
2 Analytical accuracy/reproducability
2 2 2 0 1 1
3 Interferences 4 2 1 1 1 1
4 Sample colour dependent 4 1 1 0 1 1
5 Automatic sampling 4 1 1 1 1 1
6 Sampling/Measurement interval
2 1 1 1 1 1
7 Sampling volume 2 1 2 0 0 0
8 Sample dilution 4 1 1 0 0 0
9 Destructive measurement 4 1 0 0 0 0
10 Autocalibration 4 1 1 1 1 1
11 Calibration interval 2 1 1 1 1 1
12 Autocleaning 4 1 1 1 1 0
13 Autocleaning sampling system
2 1 1 0 0 0
14 Chemicals consumption 2 3 1 0 2 3
15 Analogue output 4 1 1 1 1 1
16 Serial output 2 1 1 1 1 1
17 Alarm output 2 1 1 1 1 1
18 Display on analyser 4 1 1 1 1 1
19 Control panel 4 1 1 1 1 1
20 Datalogging 2 2 1 0 1 0
21 Weight 2 2 1 0 1 1
22 Compactness 2 2 2 0 1 0
Safety
23 Sample-resistant materials 4 1 1 1 1 1
24 Chemicals storage 2 3 1 1 3 3
25 Temperature ranges 4 1 2 2 1 1
26 Ex-proof 1 0 0 0 0 0
27 Housing 2 2 1 0 2 2
28 Power supply 1 1 1 1 1 1
Maintenance
29 Self Diagnosis 2 1 1 1 1 1
30 Crewtime 2 2 2 2 1 2
31 Scheduled Maintenance 4 2 2 0 0 3
32 Availability Spare Parts 2 1 1 1 1 1
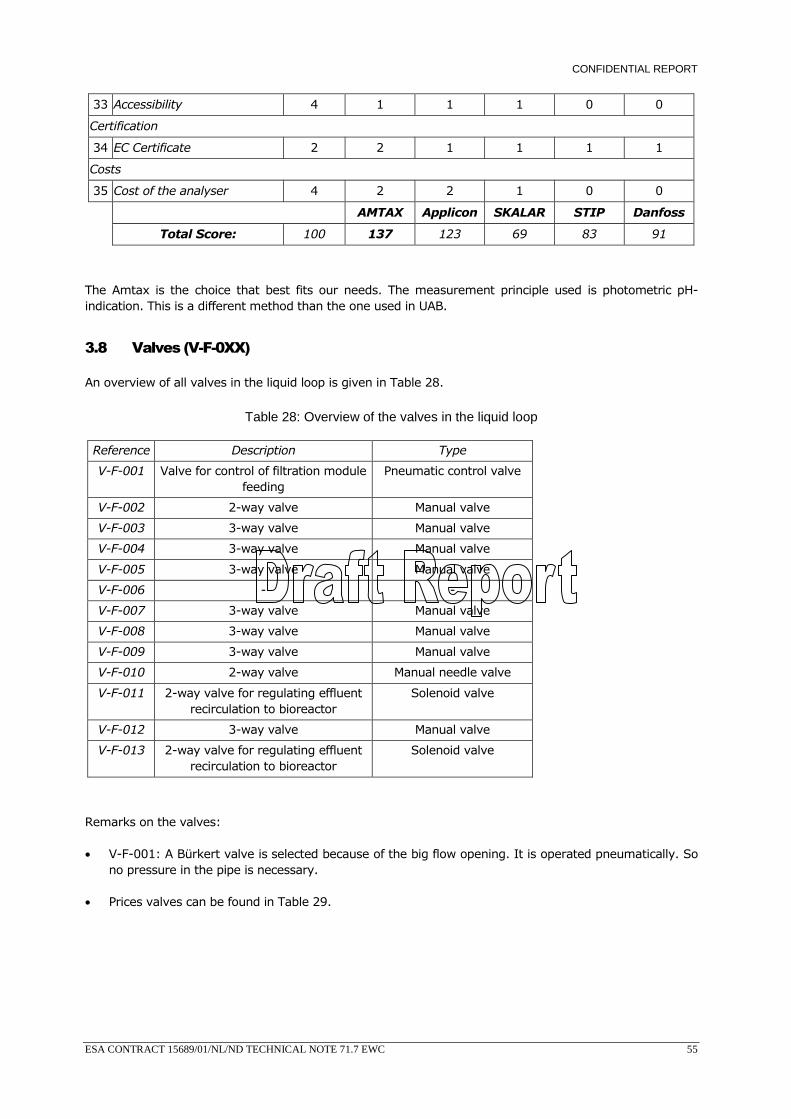
CONFIDENTIAL REPORT
ESA CONTRACT 15689/01/NL/ND TECHNICAL NOTE 71.7 EWC 55
33 Accessibility 4 1 1 1 0 0
Certification
34 EC Certificate 2 2 1 1 1 1
Costs
35 Cost of the analyser 4 2 2 1 0 0
AMTAX Applicon SKALAR STIP Danfoss
Total Score: 100 137 123 69 83 91
The Amtax is the choice that best fits our needs. The measurement principle used is photometric pH-indication. This is a different method than the one used in UAB.
3.8 Valves (V-F-0XX)
An overview of all valves in the liquid loop is given in Table 28.
Table 28: Overview of the valves in the liquid loop
Reference Description Type
V-F-001 Valve for control of filtration module feeding
Pneumatic control valve
V-F-002 2-way valve Manual valve
V-F-003 3-way valve Manual valve
V-F-004 3-way valve Manual valve
V-F-005 3-way valve Manual valve
V-F-006 - -
V-F-007 3-way valve Manual valve
V-F-008 3-way valve Manual valve
V-F-009 3-way valve Manual valve
V-F-010 2-way valve Manual needle valve
V-F-011 2-way valve for regulating effluent recirculation to bioreactor
Solenoid valve
V-F-012 3-way valve Manual valve
V-F-013 2-way valve for regulating effluent recirculation to bioreactor
Solenoid valve
Remarks on the valves:
• V-F-001: A Bürkert valve is selected because of the big flow opening. It is operated pneumatically. So no pressure in the pipe is necessary.
• Prices valves can be found in Table 29.
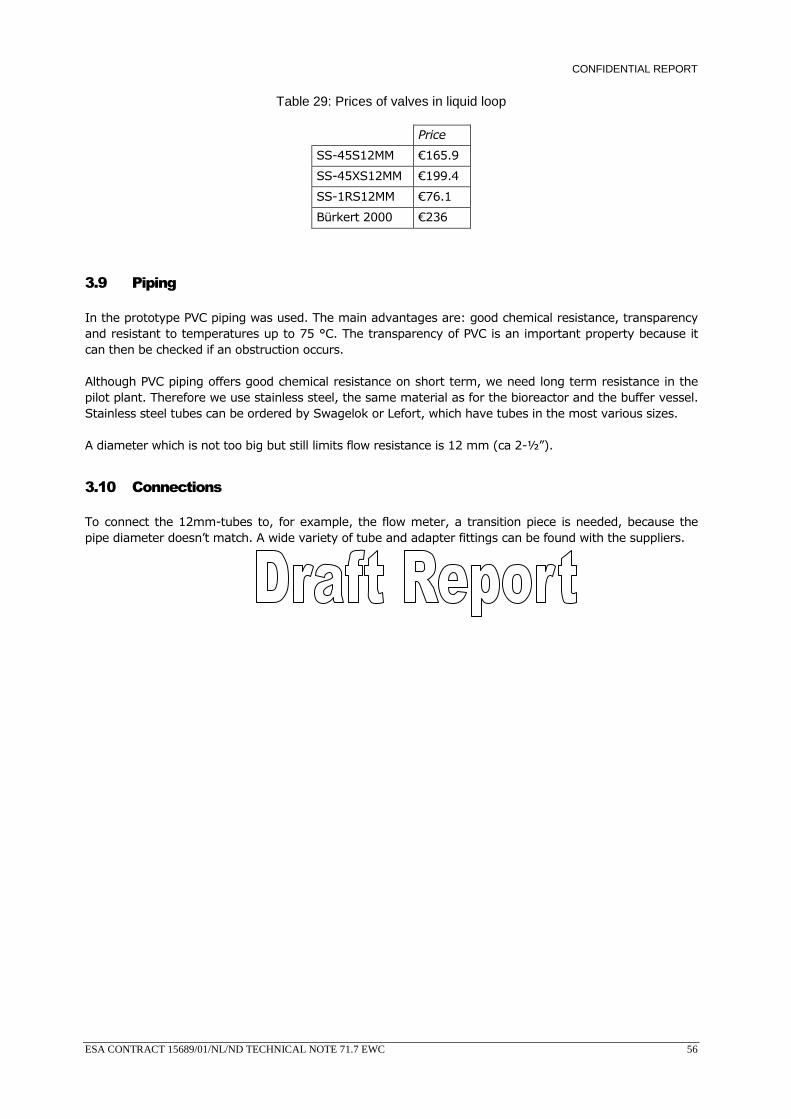
CONFIDENTIAL REPORT
ESA CONTRACT 15689/01/NL/ND TECHNICAL NOTE 71.7 EWC 56
Table 29: Prices of valves in liquid loop
Price
SS-45S12MM €165.9
SS-45XS12MM €199.4
SS-1RS12MM €76.1
Bürkert 2000 €236
3.9 Piping
In the prototype PVC piping was used. The main advantages are: good chemical resistance, transparency and resistant to temperatures up to 75 °C. The transparency of PVC is an important property because it can then be checked if an obstruction occurs.
Although PVC piping offers good chemical resistance on short term, we need long term resistance in the pilot plant. Therefore we use stainless steel, the same material as for the bioreactor and the buffer vessel. Stainless steel tubes can be ordered by Swagelok or Lefort, which have tubes in the most various sizes.
A diameter which is not too big but still limits flow resistance is 12 mm (ca 2-½”).
3.10 Connections
To connect the 12mm-tubes to, for example, the flow meter, a transition piece is needed, because the pipe diameter doesn’t match. A wide variety of tube and adapter fittings can be found with the suppliers.
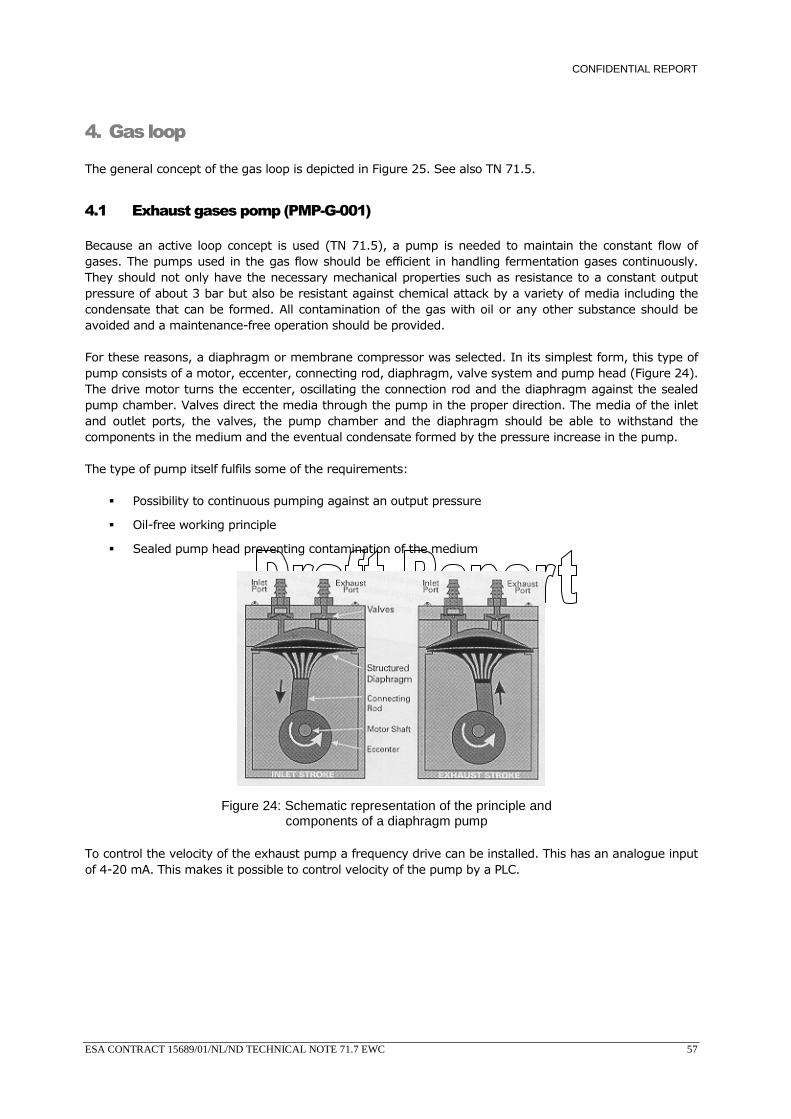
CONFIDENTIAL REPORT
ESA CONTRACT 15689/01/NL/ND TECHNICAL NOTE 71.7 EWC 57
4. Gas loop
The general concept of the gas loop is depicted in Figure 25. See also TN 71.5.
4.1 Exhaust gases pomp (PMP-G-001)
Because an active loop concept is used (TN 71.5), a pump is needed to maintain the constant flow of gases. The pumps used in the gas flow should be efficient in handling fermentation gases continuously. They should not only have the necessary mechanical properties such as resistance to a constant output pressure of about 3 bar but also be resistant against chemical attack by a variety of media including the condensate that can be formed. All contamination of the gas with oil or any other substance should be avoided and a maintenance-free operation should be provided.
For these reasons, a diaphragm or membrane compressor was selected. In its simplest form, this type of pump consists of a motor, eccenter, connecting rod, diaphragm, valve system and pump head (Figure 24). The drive motor turns the eccenter, oscillating the connection rod and the diaphragm against the sealed pump chamber. Valves direct the media through the pump in the proper direction. The media of the inlet and outlet ports, the valves, the pump chamber and the diaphragm should be able to withstand the components in the medium and the eventual condensate formed by the pressure increase in the pump.
The type of pump itself fulfils some of the requirements:
Possibility to continuous pumping against an output pressure
Oil-free working principle
Sealed pump head preventing contamination of the medium
Figure 24: Schematic representation of the principle and components of a diaphragm pump
To control the velocity of the exhaust pump a frequency drive can be installed. This has an analogue input of 4-20 mA. This makes it possible to control velocity of the pump by a PLC.
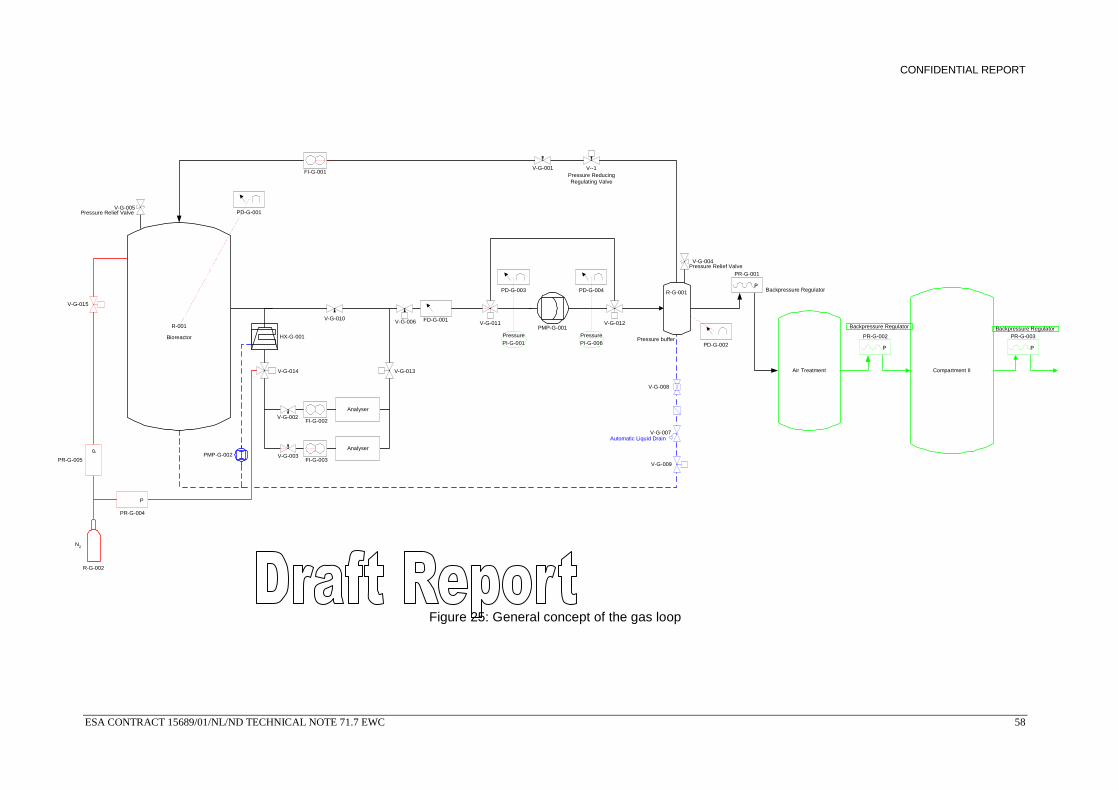
CONFIDENTIAL REPORT
ESA CONTRACT 15689/01/NL/ND TECHNICAL NOTE 71.7 EWC 58
P-27--
R-001
V-G-001
Air Treatment
HX-G-001 PressurePI-G-001
Compartment II
R-G-002
Pressure ReducingRegulating Valve
Backpressure Regulator Backpressure Regulator
Backpressure Regulator
Pressure buffer
PMP-G-001
N2
Bioreactor
FI-G-001
PD-G-001
PD-G-002
Pressure Relief Valve
Automatic Liquid Drain V-G-009
V-G-007
V-G-004
R-G-001P
PR-G-001
P
PR-G-002
P
PR-G-003
V-G-010 FD-G-001
PD-G-003
PressurePI-G-006
PD-G-004
AnalyserV-G-002
FI-G-002
AnalyserV-G-003
FI-G-003
V-G-013
V-G-006
V-G-011
V-G-012
V--1
PMP-G-002
V-G-005Pressure Relief Valve
P
PR-G-005
P
PR-G-004
V-G-015
V-G-008
V-G-014
Figure 25: General concept of the gas loop
CONFIDENTIAL REPORT
ESA CONTRACT 15689/01/NL/ND TECHNICAL NOTE 71.7 EWC 59
Through the selection of the materials, the resistance of the pump against gas components and condensate can be chosen.
Pump head and ports in stainless steal AISI-303
Valves in stainless steal AISI-303
Membrane in PTFE. Since PTFE itself is a rather rigid material, a thin membrane in PTFE is fixed to a EPDM carrier, making the diaphragm more flexible. The medium only has contact with the PTFE
The capacity of the pump should be high enough to work together with the selected pressure regulator. A relatively low air flow rate of around 10 l/min (=600 l/h) is preferred in order not to oversize the compressor and the pumped air flow.
Two types of pumps that meet all the above requirements are given in Table 30.
Table 30: Comparison of exhaust gases pumps
COMPTON D/296/416-3E Subtype : 2-12BN/A1-C1-C6-F0-A
(Heukelom)
N145.2 (KNF)
Nominal flow rate 724 l/h (equivalent to cross-flow velocity of 4 m/s) (at 3 bar)
1800 l/h (at 3 bar)
Temperature range 5 to 60 °C 5 to 40 °C
Material Stainless steel body with PTFE membrane and EPDM membrane
carrier
Pump head: PPS, diaphragm: PTFE-coated, valves: FFPM
Connections 1/2” NPT G ¼”
Robustness Fit for continuous use Fit for continuous use
Price €1944 -
It was decided to select the Compton pump, because KNF doesn’t offer the right flow rate. The Compton pump was tested in the prototype and no problems were encountered.
4.2 Condensate removal from buffer vessel
Due to an increase in pressure and cooling of the exhaust gases (which contain water vapour) condensation occurs in the buffer vessel. It must be removed and drained back to the bioreactor.
To remove the condensate from the buffer vessel a purely mechanical or an electrical solution can be installed. It should be noted that the condensate from the pressure buffer is drained back to the bioreactor.
The mechanical solution is an automatic condensate drain, designed to remove water from compressed gasses. The system is equipped with a ball float that actuates a valve to remove the condensate gathered in the device. The drain works via gravity. The outlet valve is controlled by a lever mechanism. The float closes the condensate outlet via the lever mechanism with the valve tip. Due to the rising condensate level, the buoyancy of the float releases the outlet (Figure 26).
The system can be obtained from different suppliers: M&C (Automatic liquid drain AD-SS) or Armstrong (Liquid drain 11-LD). Both are completely constructed out of corrosion resistant materials: AISI-316.
The electrical condensate drain works following the same principle (Figure 27). The condensate is gathered in a reservoir (1). A probe continuously measures the level of water in the reservoir (2) and generates a signal when the reservoir is completely filled. On this command, a diaphragm valves
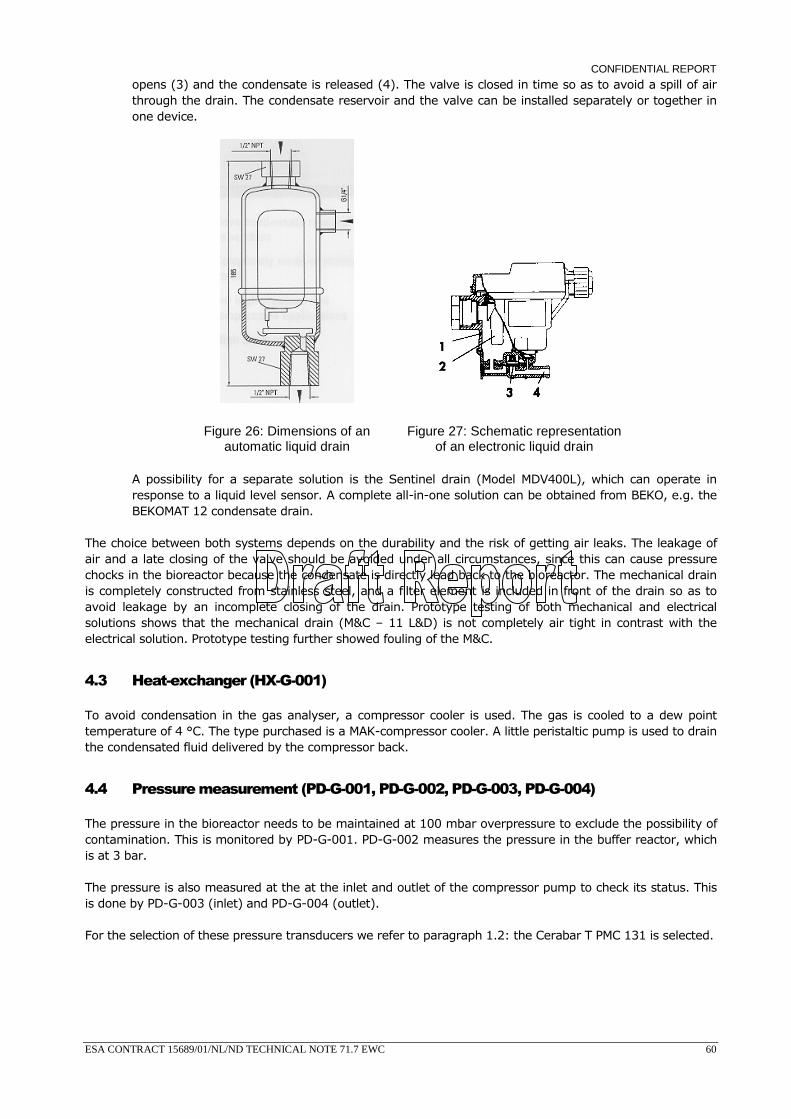
CONFIDENTIAL REPORT
ESA CONTRACT 15689/01/NL/ND TECHNICAL NOTE 71.7 EWC 60
opens (3) and the condensate is released (4). The valve is closed in time so as to avoid a spill of air through the drain. The condensate reservoir and the valve can be installed separately or together in one device.
Figure 26: Dimensions of an automatic liquid drain
Figure 27: Schematic representation of an electronic liquid drain
A possibility for a separate solution is the Sentinel drain (Model MDV400L), which can operate in response to a liquid level sensor. A complete all-in-one solution can be obtained from BEKO, e.g. the BEKOMAT 12 condensate drain.
The choice between both systems depends on the durability and the risk of getting air leaks. The leakage of air and a late closing of the valve should be avoided under all circumstances, since this can cause pressure chocks in the bioreactor because the condensate is directly lead back to the bioreactor. The mechanical drain is completely constructed from stainless steel, and a filter element is included in front of the drain so as to avoid leakage by an incomplete closing of the drain. Prototype testing of both mechanical and electrical solutions shows that the mechanical drain (M&C – 11 L&D) is not completely air tight in contrast with the electrical solution. Prototype testing further showed fouling of the M&C.
4.3 Heat-exchanger (HX-G-001)
To avoid condensation in the gas analyser, a compressor cooler is used. The gas is cooled to a dew point temperature of 4 °C. The type purchased is a MAK-compressor cooler. A little peristaltic pump is used to drain the condensated fluid delivered by the compressor back.
4.4 Pressure measurement (PD-G-001, PD-G-002, PD-G-003, PD-G-004)
The pressure in the bioreactor needs to be maintained at 100 mbar overpressure to exclude the possibility of contamination. This is monitored by PD-G-001. PD-G-002 measures the pressure in the buffer reactor, which is at 3 bar.
The pressure is also measured at the at the inlet and outlet of the compressor pump to check its status. This is done by PD-G-003 (inlet) and PD-G-004 (outlet).
For the selection of these pressure transducers we refer to paragraph 1.2: the Cerabar T PMC 131 is selected.
CONFIDENTIAL REPORT
ESA CONTRACT 15689/01/NL/ND TECHNICAL NOTE 71.7 EWC 61
4.5 Pressure indicator (PI-G-001, PI-G-002, PI-G-003)
The Cerabar T PMC 131 has no display. For indication purposes, an analogue pressure manometer suffices. The MAN-R Manometer (Kobold) and manometers of Bogerd Instrumentation are built of stainless steel AISI-316.
4.6 Pressure regulators
To maintain an overpressure of 100 mbar in the bioreactor and 3 bar in the buffer reactor, pressure regulators are needed. This topic is strongly related with control aspects, for more information about pressure regulation we refer to TN 71.8.2.
Pressure regulators are used in a broad range of applications. Yet, only two basic valve types are commonly employed, direct-acting and pilot-operated. Variations in these types consist mainly of methods of loading the seat, different seat and body materials, balanced versus unbalanced designs, and different kinds of pilots (for pilot-operated safety relief valves). The opening action of the regulator may be either direct, where the valve provides an initial rapid flow to relieve pressure, or modulating, where the valve has a variable relieving capacity, generally in proportion to demand.
A choice has to be made between local control and PLC control. With a local controlled regulator, all control electronics is in the regulator itself (paragraph 4.6.1), in contrast with PLC control, where the control electronics (e.g. PID control) is in the PLC itself (paragraph 4.6.2).
4.6.1 Local control (hardware based)
4.6.1.1 Pressure reducing regulator (PR-G-004)
For the pressure reducing regulator in the gas loop, the choice has to be made between a purely mechanical solution and an pilot-operated electronic regulator. The choice between these two solutions needs to be done based on the results of prototype testing. The mechanical solution will provide a good pressure control without any chance of failure of electronic components, while the electronic solution will yield a more precise and accurate pressure control.
The mechanical solution consists of a hand adjustable, spring-loaded pressure reducing regulator. For corrosion resistance, a version needs to be selected where the only materials in contact with the medium are for example Stainless Steel AISI-316 and/or Teflon.
Important in the selection of a proper pressure reducing regulator are the inlet and outlet pressures and the required flow rate for a given pressure drop.
Obviously, the inlet pressure needs to be within the range applied in the process. In the case of the gas loop, the inlet pressure is the pressure in the buffer vessel, which is maintained around 3 bar. The regulator should also be selected with an outlet pressure nearest (yet above) the maximum application pressure, in this case the pressure in the bioreactor of 100 mbar.
The relationship between the pressure drop and the flow through a valve or regulator is expressed as the Kv value. It is defined as the number of liters of water per minute that will flow through a wide-open valve with a pressure drop of 1 bar. This value is however also used for sizing gas valves and regulator. The formulas for valve-sizing are based on the following equation:
glgm FFfactors
desiredQKv
,:=
Fgm and Fgl can be calculated:
)2(13.1 1 pppFgl ∆−∆= (l/min)
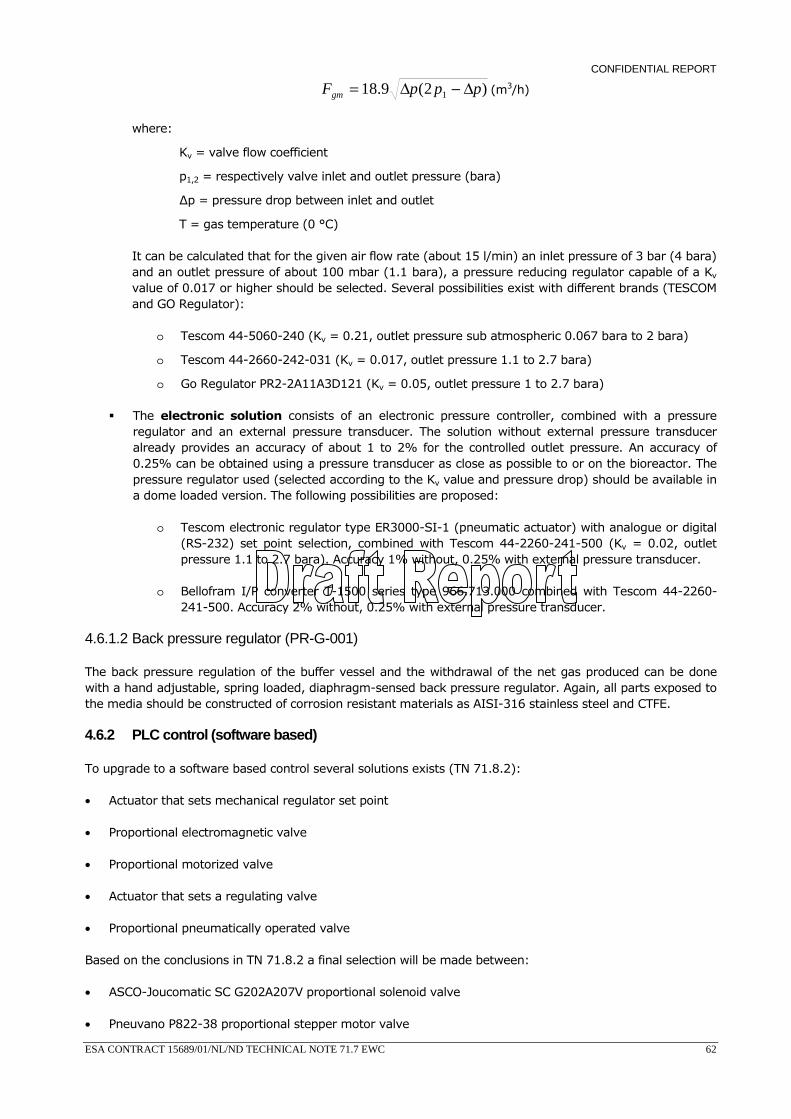
CONFIDENTIAL REPORT
ESA CONTRACT 15689/01/NL/ND TECHNICAL NOTE 71.7 EWC 62
)2(9.18 1 pppFgm ∆−∆= (m3/h)
where:
Kv = valve flow coefficient
p1,2 = respectively valve inlet and outlet pressure (bara)
∆p = pressure drop between inlet and outlet
T = gas temperature (0 °C)
It can be calculated that for the given air flow rate (about 15 l/min) an inlet pressure of 3 bar (4 bara) and an outlet pressure of about 100 mbar (1.1 bara), a pressure reducing regulator capable of a Kv value of 0.017 or higher should be selected. Several possibilities exist with different brands (TESCOM and GO Regulator):
o Tescom 44-5060-240 (Kv = 0.21, outlet pressure sub atmospheric 0.067 bara to 2 bara)
o Tescom 44-2660-242-031 (Kv = 0.017, outlet pressure 1.1 to 2.7 bara)
o Go Regulator PR2-2A11A3D121 (Kv = 0.05, outlet pressure 1 to 2.7 bara)
The electronic solution consists of an electronic pressure controller, combined with a pressure regulator and an external pressure transducer. The solution without external pressure transducer already provides an accuracy of about 1 to 2% for the controlled outlet pressure. An accuracy of 0.25% can be obtained using a pressure transducer as close as possible to or on the bioreactor. The pressure regulator used (selected according to the Kv value and pressure drop) should be available in a dome loaded version. The following possibilities are proposed:
o Tescom electronic regulator type ER3000-SI-1 (pneumatic actuator) with analogue or digital (RS-232) set point selection, combined with Tescom 44-2260-241-500 (Kv = 0.02, outlet pressure 1.1 to 2.7 bara). Accuracy 1% without, 0.25% with external pressure transducer.
o Bellofram I/P converter T-1500 series type 966.713.000 combined with Tescom 44-2260-241-500. Accuracy 2% without, 0.25% with external pressure transducer.
4.6.1.2 Back pressure regulator (PR-G-001)
The back pressure regulation of the buffer vessel and the withdrawal of the net gas produced can be done with a hand adjustable, spring loaded, diaphragm-sensed back pressure regulator. Again, all parts exposed to the media should be constructed of corrosion resistant materials as AISI-316 stainless steel and CTFE.
4.6.2 PLC control (software based)
To upgrade to a software based control several solutions exists (TN 71.8.2):
• Actuator that sets mechanical regulator set point
• Proportional electromagnetic valve
• Proportional motorized valve
• Actuator that sets a regulating valve
• Proportional pneumatically operated valve
Based on the conclusions in TN 71.8.2 a final selection will be made between:
• ASCO-Joucomatic SC G202A207V proportional solenoid valve
• Pneuvano P822-38 proportional stepper motor valve
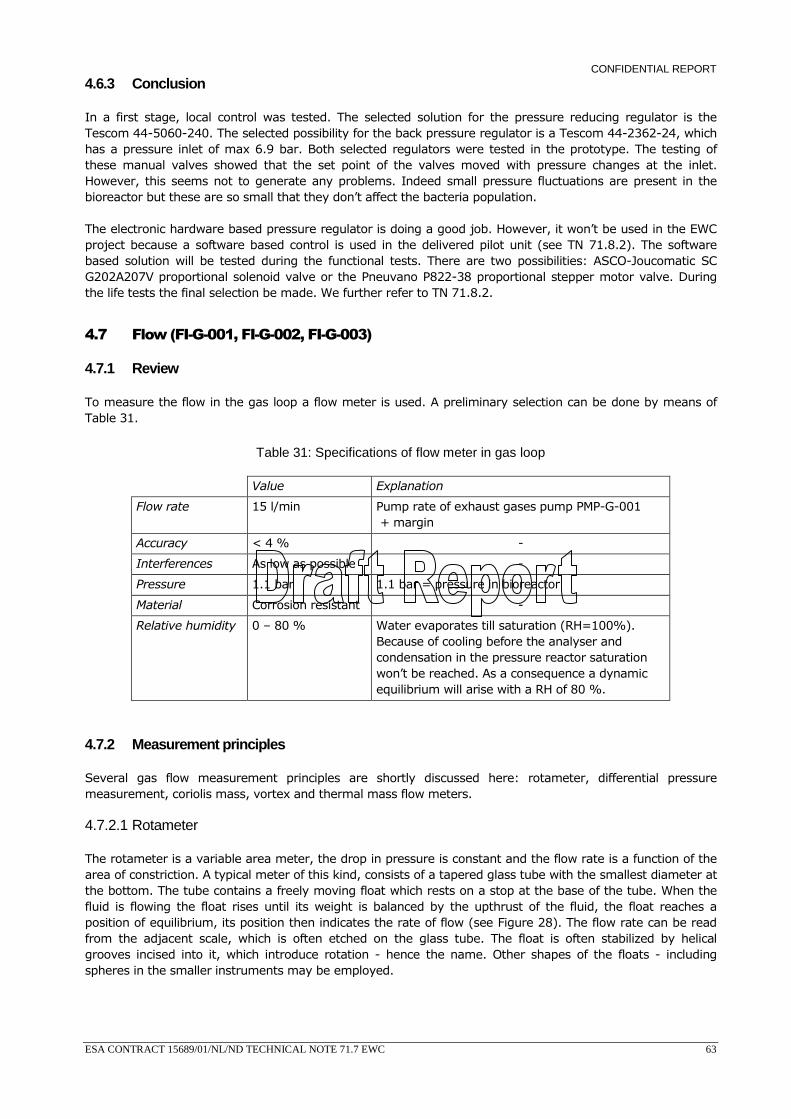
CONFIDENTIAL REPORT
ESA CONTRACT 15689/01/NL/ND TECHNICAL NOTE 71.7 EWC 63
4.6.3 Conclusion
In a first stage, local control was tested. The selected solution for the pressure reducing regulator is the Tescom 44-5060-240. The selected possibility for the back pressure regulator is a Tescom 44-2362-24, which has a pressure inlet of max 6.9 bar. Both selected regulators were tested in the prototype. The testing of these manual valves showed that the set point of the valves moved with pressure changes at the inlet. However, this seems not to generate any problems. Indeed small pressure fluctuations are present in the bioreactor but these are so small that they don’t affect the bacteria population.
The electronic hardware based pressure regulator is doing a good job. However, it won’t be used in the EWC project because a software based control is used in the delivered pilot unit (see TN 71.8.2). The software based solution will be tested during the functional tests. There are two possibilities: ASCO-Joucomatic SC G202A207V proportional solenoid valve or the Pneuvano P822-38 proportional stepper motor valve. During the life tests the final selection be made. We further refer to TN 71.8.2.
4.7 Flow (FI-G-001, FI-G-002, FI-G-003)
4.7.1 Review
To measure the flow in the gas loop a flow meter is used. A preliminary selection can be done by means of Table 31.
Table 31: Specifications of flow meter in gas loop
Value Explanation
Flow rate 15 l/min Pump rate of exhaust gases pump PMP-G-001 + margin
Accuracy < 4 % -
Interferences As low as possible -
Pressure 1.1 bar 1.1 bar = pressure in bioreactor
Material Corrosion resistant -
Relative humidity 0 – 80 % Water evaporates till saturation (RH=100%). Because of cooling before the analyser and condensation in the pressure reactor saturation won’t be reached. As a consequence a dynamic equilibrium will arise with a RH of 80 %.
4.7.2 Measurement principles
Several gas flow measurement principles are shortly discussed here: rotameter, differential pressure measurement, coriolis mass, vortex and thermal mass flow meters.
4.7.2.1 Rotameter
The rotameter is a variable area meter, the drop in pressure is constant and the flow rate is a function of the area of constriction. A typical meter of this kind, consists of a tapered glass tube with the smallest diameter at the bottom. The tube contains a freely moving float which rests on a stop at the base of the tube. When the fluid is flowing the float rises until its weight is balanced by the upthrust of the fluid, the float reaches a position of equilibrium, its position then indicates the rate of flow (see Figure 28). The flow rate can be read from the adjacent scale, which is often etched on the glass tube. The float is often stabilized by helical grooves incised into it, which introduce rotation - hence the name. Other shapes of the floats - including spheres in the smaller instruments may be employed.
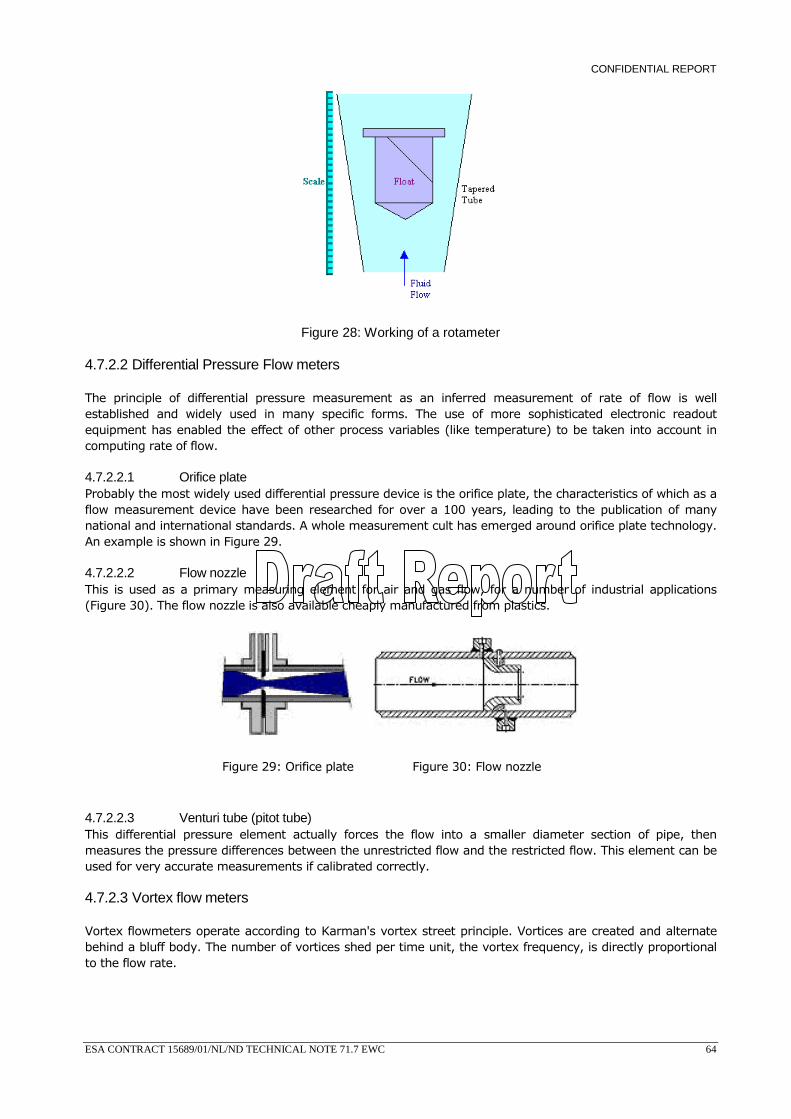
CONFIDENTIAL REPORT
ESA CONTRACT 15689/01/NL/ND TECHNICAL NOTE 71.7 EWC 64
Figure 28: Working of a rotameter
4.7.2.2 Differential Pressure Flow meters
The principle of differential pressure measurement as an inferred measurement of rate of flow is well established and widely used in many specific forms. The use of more sophisticated electronic readout equipment has enabled the effect of other process variables (like temperature) to be taken into account in computing rate of flow.
4.7.2.2.1 Orifice plate Probably the most widely used differential pressure device is the orifice plate, the characteristics of which as a flow measurement device have been researched for over a 100 years, leading to the publication of many national and international standards. A whole measurement cult has emerged around orifice plate technology. An example is shown in Figure 29.
4.7.2.2.2 Flow nozzle This is used as a primary measuring element for air and gas flow, for a number of industrial applications (Figure 30). The flow nozzle is also available cheaply manufactured from plastics.
Figure 29: Orifice plate Figure 30: Flow nozzle
4.7.2.2.3 Venturi tube (pitot tube) This differential pressure element actually forces the flow into a smaller diameter section of pipe, then measures the pressure differences between the unrestricted flow and the restricted flow. This element can be used for very accurate measurements if calibrated correctly.
4.7.2.3 Vortex flow meters
Vortex flowmeters operate according to Karman's vortex street principle. Vortices are created and alternate behind a bluff body. The number of vortices shed per time unit, the vortex frequency, is directly proportional to the flow rate.
CONFIDENTIAL REPORT
ESA CONTRACT 15689/01/NL/ND TECHNICAL NOTE 71.7 EWC 65
4.7.2.4 Heat transfer meters
A heating resistor on a thermally insulated membrane is kept above ambient temperature. In the presence of gas flow, the temperature distribution up- and downstream is disturbed. This asymmetry is then measured.
4.7.2.5 Thermal mass flow meters
The thermal principle is a well-established operating principle in the process industry used on a wide variety of applications. It operates by monitoring the cooling effect of a gas stream as it passes over a heated transducer. The gas flows over two Pt100 elements, one of which senses the actual medium temperature and provides a reference, whilst the other is heated to ensure a constant differential temperature above the medium temperature. The applied power needed to maintain this differential is proportional to the mass flow of the medium being measured.
4.7.2.6 Coriolis mass flow meters
The measurement principle is based on the controlled generation of Coriolis forces. These forces are always present when both translational and rotational movements are superimposed:
)(2 wvmFCrr ⋅∆⋅= with CF = Coriolis force
∆m = moved mass
ωr = angular velocity
vr = radial velocity in the rotating or oscillating system
The amplitude of the Coriolis force depends on the moving mass ∆m, its velocity in the system and thus on the mass flow. Instead of a constant angular velocity the Promass sensor uses oscillation. In the sensor, two parallel measuring tubes containing flowing fluid oscillate in antiphase, acting like a tuning fork. The Coriolis forces produced at the measuring tubes cause a phase shift in the tube oscillations (see Figure 31):
• At zero flow, in other words when the fluid is at a standstill, the two tubes oscillate in phase (1). Mass flow causes deceleration of the oscillation at the inlet of the tubes (2) and acceleration at the outlet (3).
• Mass flow causes deceleration of the oscillation at the inlet of the tubes (2) and acceleration at the outlet (3).
Figure 31: Measurement principle of Coriolis flow meter
The phase difference (A-B) increases with increasing mass flow. Electrodynamic sensors register the tube oscillations at the inlet and outlet. System balance is ensured by the antiphase oscillation of the two measuring tubes.
The measurement principle operates independently of temperature, pressure, viscosity, conductivity and flow profile.
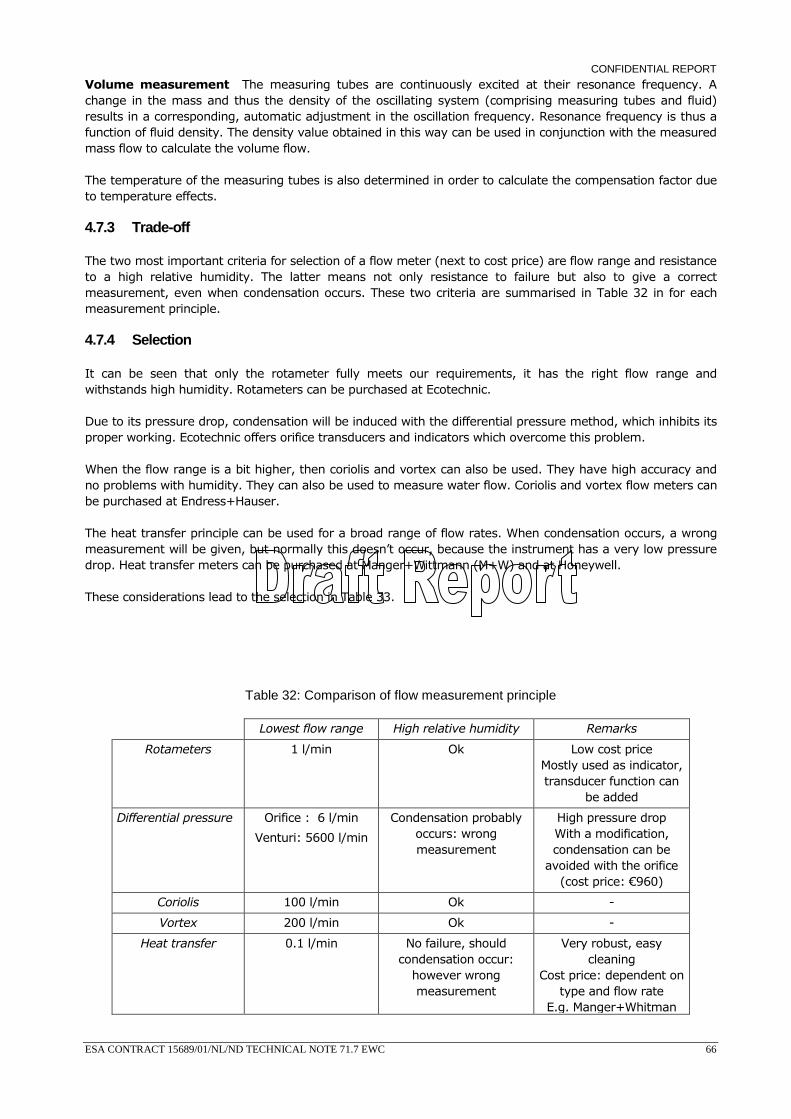
CONFIDENTIAL REPORT
ESA CONTRACT 15689/01/NL/ND TECHNICAL NOTE 71.7 EWC 66
Volume measurement The measuring tubes are continuously excited at their resonance frequency. A change in the mass and thus the density of the oscillating system (comprising measuring tubes and fluid) results in a corresponding, automatic adjustment in the oscillation frequency. Resonance frequency is thus a function of fluid density. The density value obtained in this way can be used in conjunction with the measured mass flow to calculate the volume flow.
The temperature of the measuring tubes is also determined in order to calculate the compensation factor due to temperature effects.
4.7.3 Trade-off
The two most important criteria for selection of a flow meter (next to cost price) are flow range and resistance to a high relative humidity. The latter means not only resistance to failure but also to give a correct measurement, even when condensation occurs. These two criteria are summarised in Table 32 in for each measurement principle.
4.7.4 Selection
It can be seen that only the rotameter fully meets our requirements, it has the right flow range and withstands high humidity. Rotameters can be purchased at Ecotechnic.
Due to its pressure drop, condensation will be induced with the differential pressure method, which inhibits its proper working. Ecotechnic offers orifice transducers and indicators which overcome this problem.
When the flow range is a bit higher, then coriolis and vortex can also be used. They have high accuracy and no problems with humidity. They can also be used to measure water flow. Coriolis and vortex flow meters can be purchased at Endress+Hauser.
The heat transfer principle can be used for a broad range of flow rates. When condensation occurs, a wrong measurement will be given, but normally this doesn’t occur, because the instrument has a very low pressure drop. Heat transfer meters can be purchased at Manger+Wittmann (M+W) and at Honeywell.
These considerations lead to the selection in Table 33.
Table 32: Comparison of flow measurement principle
Lowest flow range High relative humidity Remarks
Rotameters 1 l/min Ok Low cost price Mostly used as indicator, transducer function can
be added
Differential pressure
Orifice : 6 l/min
Venturi: 5600 l/min
Condensation probably occurs: wrong measurement
High pressure drop With a modification, condensation can be
avoided with the orifice (cost price: €960)
Coriolis 100 l/min Ok -
Vortex 200 l/min Ok -
Heat transfer 0.1 l/min No failure, should condensation occur:
however wrong measurement
Very robust, easy cleaning
Cost price: dependent on type and flow rate
E.g. Manger+Whitman
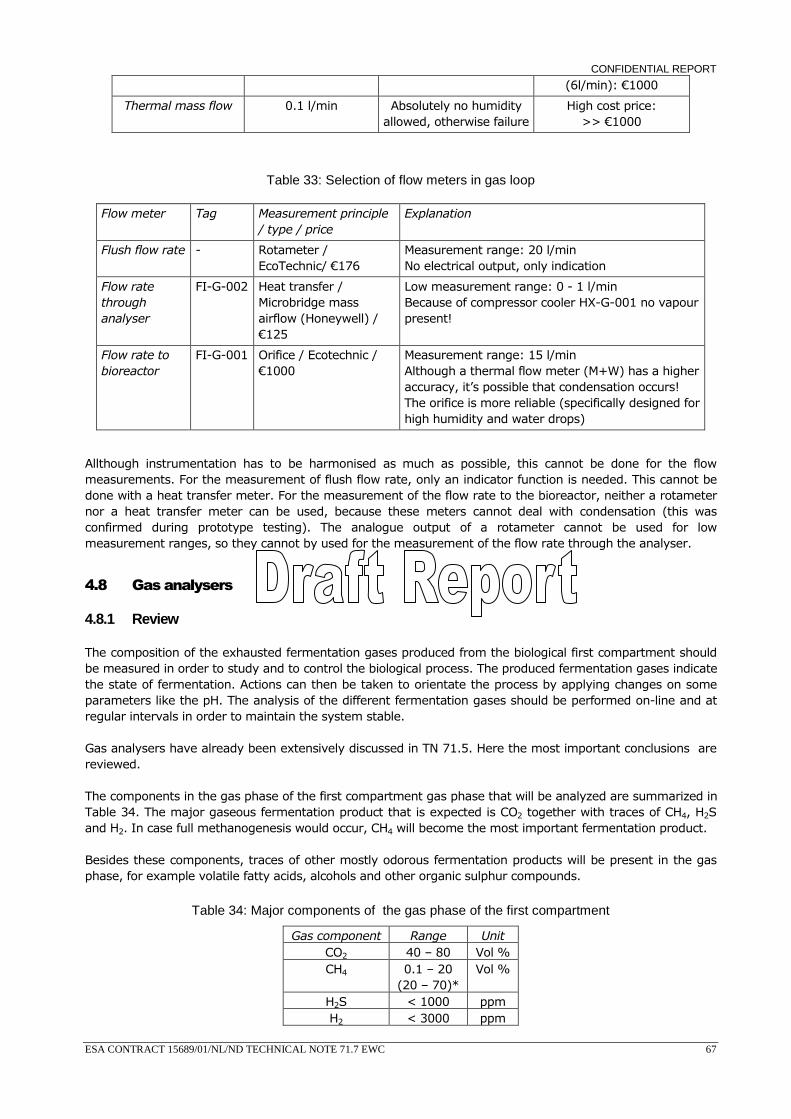
CONFIDENTIAL REPORT
ESA CONTRACT 15689/01/NL/ND TECHNICAL NOTE 71.7 EWC 67
(6l/min): €1000
Thermal mass flow 0.1 l/min Absolutely no humidity allowed, otherwise failure
High cost price: >> €1000
Table 33: Selection of flow meters in gas loop
Flow meter Tag Measurement principle / type / price
Explanation
Flush flow rate - Rotameter / EcoTechnic/ €176
Measurement range: 20 l/min No electrical output, only indication
Flow rate through analyser
FI-G-002 Heat transfer / Microbridge mass airflow (Honeywell) / €125
Low measurement range: 0 - 1 l/min Because of compressor cooler HX-G-001 no vapour present!
Flow rate to bioreactor
FI-G-001 Orifice / Ecotechnic / €1000
Measurement range: 15 l/min Although a thermal flow meter (M+W) has a higher accuracy, it’s possible that condensation occurs! The orifice is more reliable (specifically designed for high humidity and water drops)
Allthough instrumentation has to be harmonised as much as possible, this cannot be done for the flow measurements. For the measurement of flush flow rate, only an indicator function is needed. This cannot be done with a heat transfer meter. For the measurement of the flow rate to the bioreactor, neither a rotameter nor a heat transfer meter can be used, because these meters cannot deal with condensation (this was confirmed during prototype testing). The analogue output of a rotameter cannot be used for low measurement ranges, so they cannot by used for the measurement of the flow rate through the analyser.
4.8 Gas analysers
4.8.1 Review
The composition of the exhausted fermentation gases produced from the biological first compartment should be measured in order to study and to control the biological process. The produced fermentation gases indicate the state of fermentation. Actions can then be taken to orientate the process by applying changes on some parameters like the pH. The analysis of the different fermentation gases should be performed on-line and at regular intervals in order to maintain the system stable.
Gas analysers have already been extensively discussed in TN 71.5. Here the most important conclusions are reviewed.
The components in the gas phase of the first compartment gas phase that will be analyzed are summarized in Table 34. The major gaseous fermentation product that is expected is CO2 together with traces of CH4, H2S and H2. In case full methanogenesis would occur, CH4 will become the most important fermentation product.
Besides these components, traces of other mostly odorous fermentation products will be present in the gas phase, for example volatile fatty acids, alcohols and other organic sulphur compounds.
Table 34: Major components of the gas phase of the first compartment
Gas component Range Unit CO2 40 – 80 Vol % CH4 0.1 – 20
(20 – 70)* Vol %
H2S < 1000 ppm H2 < 3000 ppm
CONFIDENTIAL REPORT
ESA CONTRACT 15689/01/NL/ND TECHNICAL NOTE 71.7 EWC 68
(*: Full methanogenesis)
The measurement principle for measuring the different gasses is obviously dependent on the type of gas component and its characteristics. CO2 and CH4 can be measured with apparatus based on non dispersive infrared (NDIR) absorption (see TN 71.5 paragraph 3.4.3.1). For H2S and H2, electrochemical sensors are on the market (see TN 71.5 paragraph 3.4.3.2). A major problem is a good measurement of the combined presence of H2 and H2S because of cross-interference (15 ppm H2S -> 3 ppm H2). Moreover, in this set-up, the H2S concentration is close to the upper limit of the capacity of electrochemical equipment.
If desired, O2 is measured paramagnetically or electrochemically, depending on the choice of the other equipment (see TN5 paragraph 3.4.3.5). Many biogas analysers incorporate an electrochemical O2 sensor.
In order to measure trace gases accurately, only apparatus such as GC (see TN 71.5 paragraph 3.4.3.4) and MassSpec (MS) (see TN 71.5 paragraph 3.4.3.3) are suitable. GC and MS can measure most gaseous components but NH3. GC can measure H2S although also in this case the concentration is a bottleneck, this is no problem for MS. Both measurement techniques cost over €50 000.
It should be noted that only CO2 and CH4 will be used for control purposes. The difference in price between NDIR equipment and GC or MS is very hard to justify if their only advantage is the possibility to measure H2, H2S and other trace components on-line. Off-line measurements of these components are obviously always possible.
4.8.2 Trade-off and selection of CH4 and CO2 measurement apparatus
CH4 and CO2 content is measured with the spectroscopic method based on the absorption of non-dispersive IR radiation. The attenuation in the radiation of specific wavelengths is a measure of the respective concentration of the gas.
Two different brand of gas analysers were selected for further evaluation: SICK-Maihak and Environnement SA – COSMA. Table 35 lists the most important specifications of both gas analysers.
On basis of this information, ESA selected the Maihak analyser. The Maihak offers some interesting options like pressure compensation, calibration cuvette and has much more output ports then the Cosma Cristal.
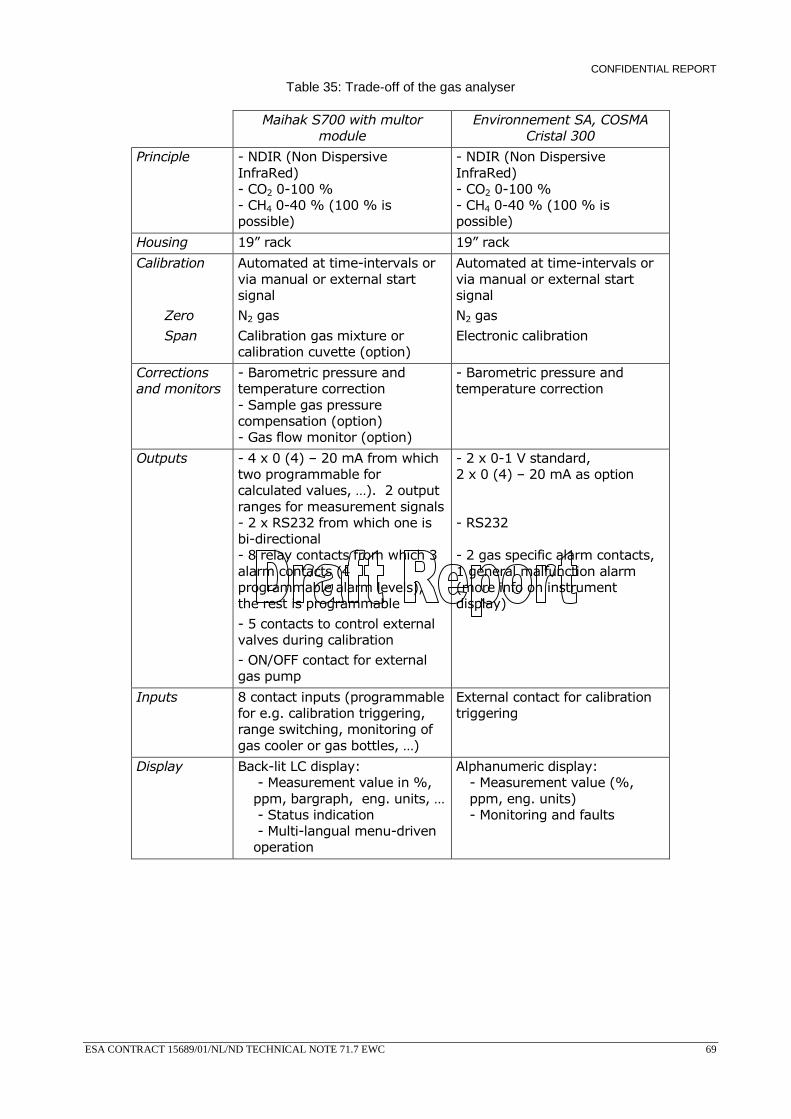
CONFIDENTIAL REPORT
ESA CONTRACT 15689/01/NL/ND TECHNICAL NOTE 71.7 EWC 69
Table 35: Trade-off of the gas analyser
Maihak S700 with multor module
Environnement SA, COSMA Cristal 300
Principle - NDIR (Non Dispersive InfraRed) - CO2 0-100 % - CH4 0-40 % (100 % is possible)
- NDIR (Non Dispersive InfraRed) - CO2 0-100 % - CH4 0-40 % (100 % is possible)
Housing 19” rack 19” rack
Calibration Automated at time-intervals or via manual or external start signal
Automated at time-intervals or via manual or external start signal
Zero N2 gas N2 gas
Span Calibration gas mixture or calibration cuvette (option)
Electronic calibration
Corrections and monitors
- Barometric pressure and temperature correction - Sample gas pressure compensation (option) - Gas flow monitor (option)
- Barometric pressure and temperature correction
Outputs - 4 x 0 (4) – 20 mA from which two programmable for calculated values, …). 2 output ranges for measurement signals- 2 x RS232 from which one is bi-directional - 8 relay contacts from which 3 alarm contacts (4 programmable alarm levels), the rest is programmable
- 5 contacts to control external valves during calibration
- ON/OFF contact for external gas pump
- 2 x 0-1 V standard, 2 x 0 (4) – 20 mA as option - RS232 - 2 gas specific alarm contacts, 1 general malfunction alarm (more info on instrument display)
Inputs 8 contact inputs (programmable for e.g. calibration triggering, range switching, monitoring of gas cooler or gas bottles, …)
External contact for calibration triggering
Display Back-lit LC display: - Measurement value in %, ppm, bargraph, eng. units, … - Status indication - Multi-langual menu-driven operation
Alphanumeric display: - Measurement value (%, ppm, eng. units) - Monitoring and faults
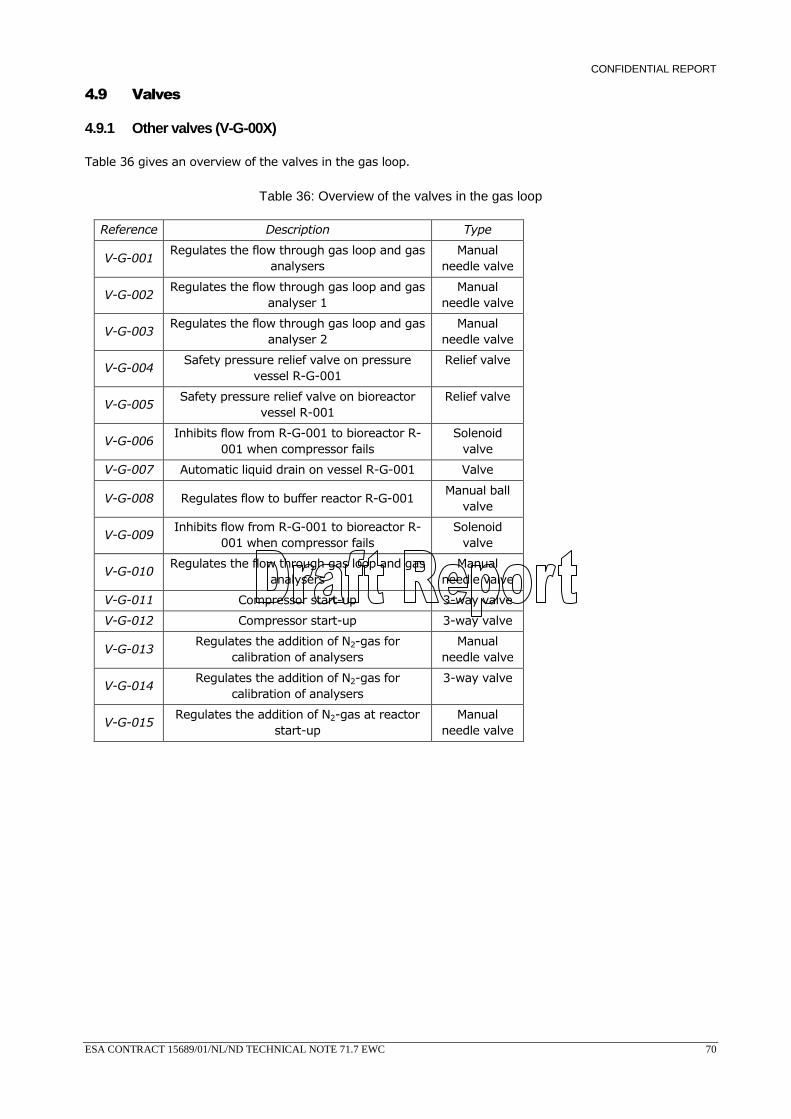
CONFIDENTIAL REPORT
ESA CONTRACT 15689/01/NL/ND TECHNICAL NOTE 71.7 EWC 70
4.9 Valves
4.9.1 Other valves (V-G-00X)
Table 36 gives an overview of the valves in the gas loop.
Table 36: Overview of the valves in the gas loop
Reference Description Type
V-G-001 Regulates the flow through gas loop and gas
analysers Manual
needle valve
V-G-002 Regulates the flow through gas loop and gas
analyser 1 Manual
needle valve
V-G-003 Regulates the flow through gas loop and gas
analyser 2 Manual
needle valve
V-G-004 Safety pressure relief valve on pressure
vessel R-G-001 Relief valve
V-G-005 Safety pressure relief valve on bioreactor
vessel R-001 Relief valve
V-G-006 Inhibits flow from R-G-001 to bioreactor R-
001 when compressor fails Solenoid
valve
V-G-007 Automatic liquid drain on vessel R-G-001 Valve
V-G-008 Regulates flow to buffer reactor R-G-001 Manual ball
valve
V-G-009 Inhibits flow from R-G-001 to bioreactor R-
001 when compressor fails Solenoid
valve
V-G-010 Regulates the flow through gas loop and gas
analysers Manual
needle valve
V-G-011 Compressor start-up 3-way valve
V-G-012 Compressor start-up 3-way valve
V-G-013 Regulates the addition of N2-gas for
calibration of analysers Manual
needle valve
V-G-014 Regulates the addition of N2-gas for
calibration of analysers 3-way valve
V-G-015 Regulates the addition of N2-gas at reactor
start-up Manual
needle valve
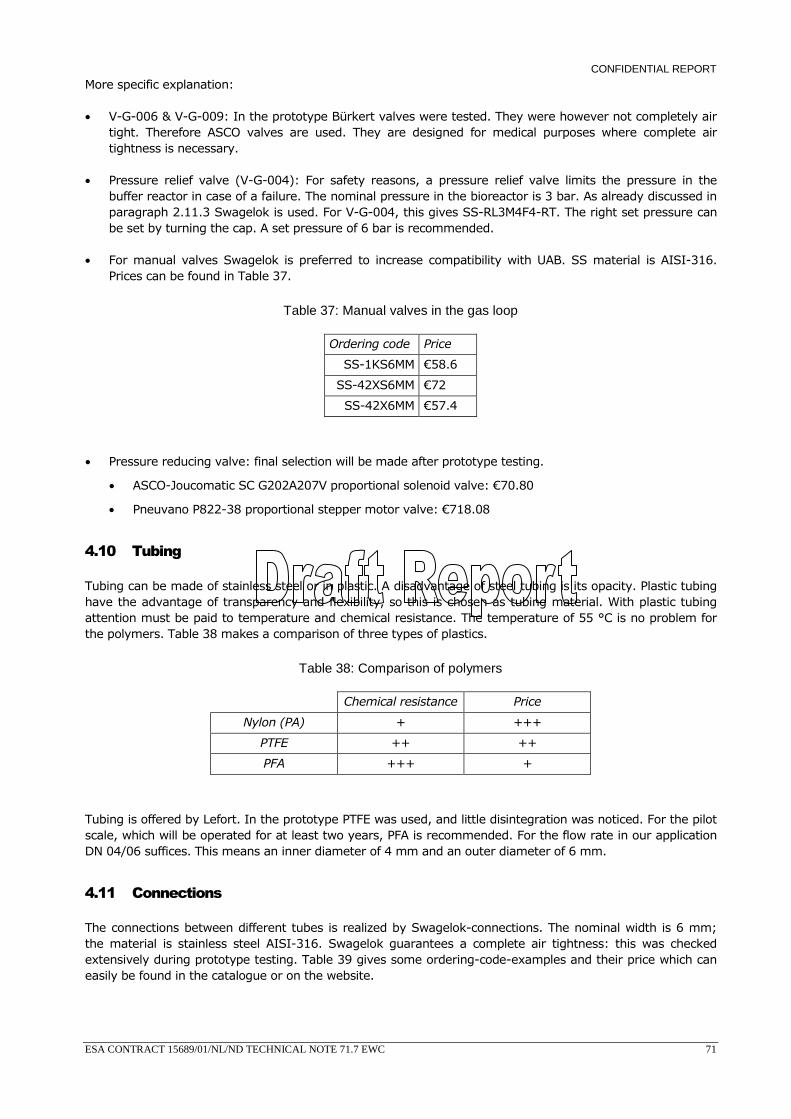
CONFIDENTIAL REPORT
ESA CONTRACT 15689/01/NL/ND TECHNICAL NOTE 71.7 EWC 71
More specific explanation:
• V-G-006 & V-G-009: In the prototype Bürkert valves were tested. They were however not completely air tight. Therefore ASCO valves are used. They are designed for medical purposes where complete air tightness is necessary.
• Pressure relief valve (V-G-004): For safety reasons, a pressure relief valve limits the pressure in the buffer reactor in case of a failure. The nominal pressure in the bioreactor is 3 bar. As already discussed in paragraph 2.11.3 Swagelok is used. For V-G-004, this gives SS-RL3M4F4-RT. The right set pressure can be set by turning the cap. A set pressure of 6 bar is recommended.
• For manual valves Swagelok is preferred to increase compatibility with UAB. SS material is AISI-316. Prices can be found in Table 37.
Table 37: Manual valves in the gas loop
Ordering code Price
SS-1KS6MM €58.6
SS-42XS6MM €72
SS-42X6MM €57.4
• Pressure reducing valve: final selection will be made after prototype testing.
• ASCO-Joucomatic SC G202A207V proportional solenoid valve: €70.80
• Pneuvano P822-38 proportional stepper motor valve: €718.08
4.10 Tubing
Tubing can be made of stainless steel or in plastic. A disadvantage of steel tubing is its opacity. Plastic tubing have the advantage of transparency and flexibility, so this is chosen as tubing material. With plastic tubing attention must be paid to temperature and chemical resistance. The temperature of 55 °C is no problem for the polymers. Table 38 makes a comparison of three types of plastics.
Table 38: Comparison of polymers
Chemical resistance Price
Nylon (PA) + +++
PTFE ++ ++
PFA +++ +
Tubing is offered by Lefort. In the prototype PTFE was used, and little disintegration was noticed. For the pilot scale, which will be operated for at least two years, PFA is recommended. For the flow rate in our application DN 04/06 suffices. This means an inner diameter of 4 mm and an outer diameter of 6 mm.
4.11 Connections
The connections between different tubes is realized by Swagelok-connections. The nominal width is 6 mm; the material is stainless steel AISI-316. Swagelok guarantees a complete air tightness: this was checked extensively during prototype testing. Table 39 gives some ordering-code-examples and their price which can easily be found in the catalogue or on the website.

CONFIDENTIAL REPORT
ESA CONTRACT 15689/01/NL/ND TECHNICAL NOTE 71.7 EWC 72
Table 39: Examples of connection and ordering code
Ordering code Price
Two way SS-6M0-6 €9.4
Three way SS-6M0-3 €19.3
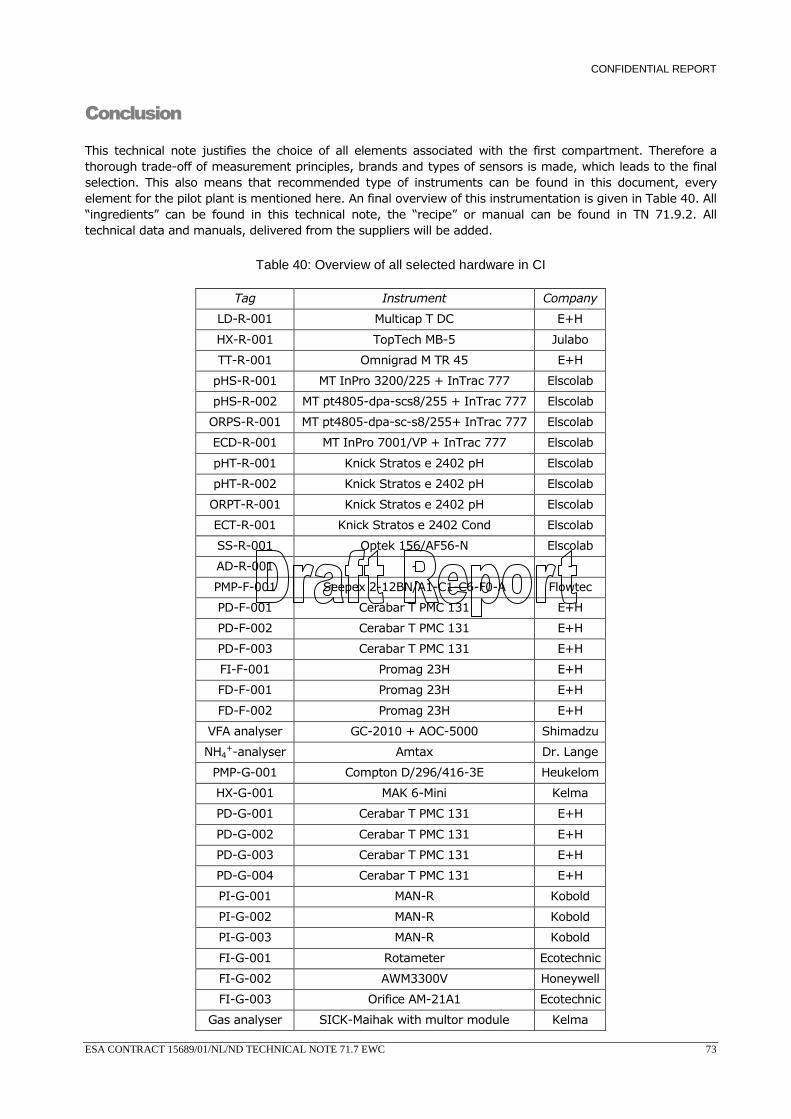
CONFIDENTIAL REPORT
ESA CONTRACT 15689/01/NL/ND TECHNICAL NOTE 71.7 EWC 73
Conclusion
This technical note justifies the choice of all elements associated with the first compartment. Therefore a thorough trade-off of measurement principles, brands and types of sensors is made, which leads to the final selection. This also means that recommended type of instruments can be found in this document, every element for the pilot plant is mentioned here. An final overview of this instrumentation is given in Table 40. All “ingredients” can be found in this technical note, the “recipe” or manual can be found in TN 71.9.2. All technical data and manuals, delivered from the suppliers will be added.
Table 40: Overview of all selected hardware in CI
Tag Instrument Company
LD-R-001 Multicap T DC E+H
HX-R-001 TopTech MB-5 Julabo
TT-R-001 Omnigrad M TR 45 E+H
pHS-R-001 MT InPro 3200/225 + InTrac 777 Elscolab
pHS-R-002 MT pt4805-dpa-scs8/255 + InTrac 777 Elscolab
ORPS-R-001 MT pt4805-dpa-sc-s8/255+ InTrac 777 Elscolab
ECD-R-001 MT InPro 7001/VP + InTrac 777 Elscolab
pHT-R-001 Knick Stratos e 2402 pH Elscolab
pHT-R-002 Knick Stratos e 2402 pH Elscolab
ORPT-R-001 Knick Stratos e 2402 pH Elscolab
ECT-R-001 Knick Stratos e 2402 Cond Elscolab
SS-R-001 Optek 156/AF56-N Elscolab
AD-R-001 - -
PMP-F-001 Seepex 2-12BN/A1-C1-C6-F0-A Flowtec
PD-F-001 Cerabar T PMC 131 E+H
PD-F-002 Cerabar T PMC 131 E+H
PD-F-003 Cerabar T PMC 131 E+H
FI-F-001 Promag 23H E+H
FD-F-001 Promag 23H E+H
FD-F-002 Promag 23H E+H
VFA analyser GC-2010 + AOC-5000 Shimadzu
NH4+-analyser Amtax Dr. Lange
PMP-G-001 Compton D/296/416-3E Heukelom
HX-G-001 MAK 6-Mini Kelma
PD-G-001 Cerabar T PMC 131 E+H
PD-G-002 Cerabar T PMC 131 E+H
PD-G-003 Cerabar T PMC 131 E+H
PD-G-004 Cerabar T PMC 131 E+H
PI-G-001 MAN-R Kobold
PI-G-002 MAN-R Kobold
PI-G-003 MAN-R Kobold
FI-G-001 Rotameter Ecotechnic
FI-G-002 AWM3300V Honeywell
FI-G-003 Orifice AM-21A1 Ecotechnic
Gas analyser SICK-Maihak with multor module Kelma

CONFIDENTIAL REPORT
ESA CONTRACT 15689/01/NL/ND TECHNICAL NOTE 71.7 EWC 74