Embed Size (px)
Citation preview

UNIVERSITY OF ALASKA ANCHORAGE
CSCE A470
CAPSTONE PROJECT
Engineering on Display
Indoor Navigation
Author:
Nailya Galimzyanova
Supervisor:
Prof. Adriano Cavalcanti, PhD
Anchorage AK, May 2015.
3
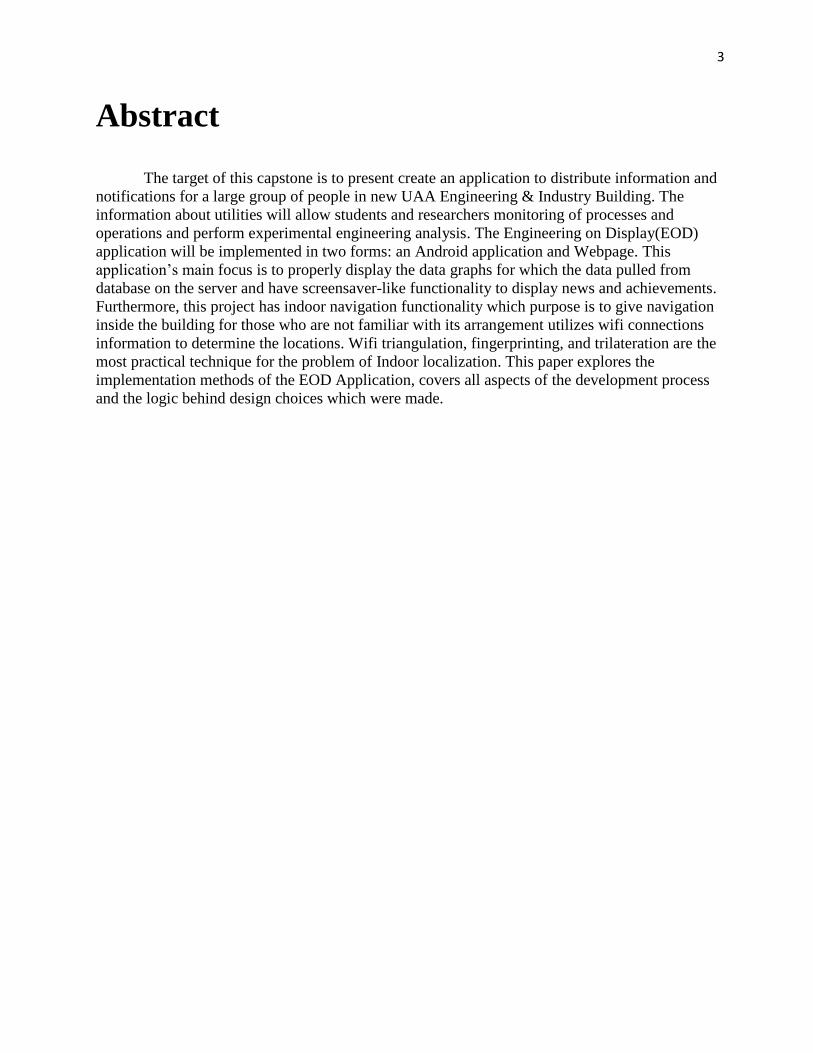
Abstract
The target of this capstone is to present create an application to distribute information and
notifications for a large group of people in new UAA Engineering & Industry Building. The
information about utilities will allow students and researchers monitoring of processes and
operations and perform experimental engineering analysis. The Engineering on Display(EOD)
application will be implemented in two forms: an Android application and Webpage. This
application’s main focus is to properly display the data graphs for which the data pulled from
database on the server and have screensaver-like functionality to display news and achievements.
Furthermore, this project has indoor navigation functionality which purpose is to give navigation
inside the building for those who are not familiar with its arrangement utilizes wifi connections
information to determine the locations. Wifi triangulation, fingerprinting, and trilateration are the
most practical technique for the problem of Indoor localization. This paper explores the
implementation methods of the EOD Application, covers all aspects of the development process
and the logic behind design choices which were made.

4
Acknowledgements
This project fulfilled all of the requirements and want to thank to our team members:
Brian Kapal,a Brent Gonzales, SookJin Yoon and professor for collaborating and making the
project go through it.
5
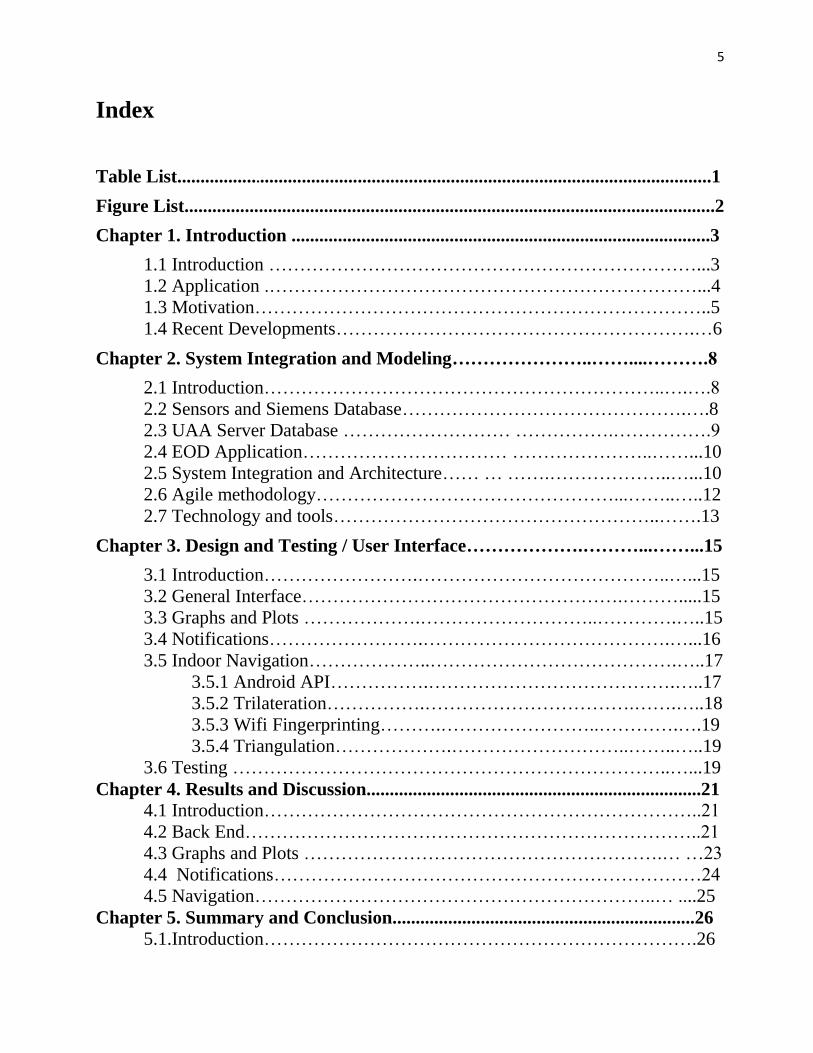
Index
Table List...................................................................................................................1
Figure List..................................................................................................................2
Chapter 1. Introduction ..........................................................................................3
1.1 Introduction ……………………………………………………………...3
1.2 Application .……………………………………………………………...4
1.3 Motivation………………………………………………………………..5
1.4 Recent Developments………………………………………………….…6
Chapter 2. System Integration and Modeling…………………..……....……….8
2.1 Introduction………………………………………………………..….….8
2.2 Sensors and Siemens Database……………………………………….….8
2.3 UAA Server Database ……………………… …………….…………….9
2.4 EOD Application…………………………… …………………..……...10
2.5 System Integration and Architecture…… … …….………………..…...10
2.6 Agile methodology…………………………………………...……..…..12
2.7 Technology and tools……………………………………………..…….13
Chapter 3. Design and Testing / User Interface……………….………...……...15
3.1 Introduction…………………….…………………………………..…...15
3.2 General Interface…………………………………………….……….....15
3.3 Graphs and Plots ……………….………………………..………….…..15
3.4 Notifications…………………….………………………………….…...16
3.5 Indoor Navigation………………..………………………………….…..17
3.5.1 Android API…………….………………………………….…..17
3.5.2 Trilateration…………….…………………………….…….…..18
3.5.3 Wifi Fingerprinting……….……………………..………….….19
3.5.4 Triangulation……………….………………………..……..…..19
3.6 Testing ……………………………………………………………..…...19
Chapter 4. Results and Discussion........................................................................21
4.1 Introduction……………………………………………………………..21
4.2 Back End………………………………………………………………..21 4.3 Graphs and Plots ………………………………………………….… …23
4.4 Notifications……………………………………………………………24
4.5 Navigation………………………………………………………..… ....25
Chapter 5. Summary and Conclusion.................................................................26
5.1.Introduction…………………………………………………………….26

6
5.2 Implications.……………………………………….……………………26
5.3 Recommendations for Future Development.……………………………27
5.4 Summary.………………………………………..…… ...………………27
References…………………………….…………………………………….….….28
Appendix A - UML………………………………………………….……..….….29
Appendix B – Source Code for Android Application……..……..………...…...31
Appendix C - Javadoc documentation……….…………….………………........25

1
Table List
Table 1.1 Open source licenses comparison……………………………………….……..……5 Table 2.1 Gant chart for the project tasks ………………………………………….……..11-12

2
Figure List
Figure 1.1 The model of the UAA’s Engineering & Industry Building……………………..…...4
Figure 1.2 Proposed view for navigation feature…………………………………….……….….6
Figure 1.3 3D Wayfinder application interface……………………………………….……….....7
Figure 2.1 Engeneering on Display sensors sample…………………………...…………….......9 Figure 2.2 System Layout…………………………………………………………….…….…...11 Figure 2.3 Burn-down chart for the project units…………………………...………….………..13
Figure 2.4 The touch screen monitor supplied by Siemens to be displayed in the UAA
Engineering & Industry Building……………………………………………………….….…….14 Figure 3.1 Proposed charts…………………………………………………………..………….16
Figure 3.2 Current UAA Main page notification………………………………………..………17
Figure 3.3 GPS trilateration…………………………………………………………….….........18
Figure 3.4 Triangulation scheme. …………………………………………………...….………19
Figure 3.5 Agile methodology iteration cycle. …………………………………..…….……….20
Figure 4.1 EOD database outline.……………………………….………………………………22
Figure 4.2 Bar charts which showed data variation by month.………………..………………...23
Figure 4.3 Area charts which showed bi-hourly data changes.………………….………….….24
Figure 4.4 Screenshot of the EOD notification element…………………………….……….….25
Figure 5.1 The EOD application running on multiple platforms……………………………….28

3
Chapter 1
Introduction
1.1 Introduction
The main purpose of the project is to create a webpage and an Android application to
display utility data for the building from its sensors. The idea of the Engineering on
Display(EOD) project was proposed by T. Bartlett Quimby, interim dean of UAA College of
Engineering. He suggested creating an application for displaying information about UAA
Engineering & Industry Building making it available to the public. According to
Ryan Buchholdt:
A new 81,500 sf facility will house engineering laboratory and teaching areas not
currently available on campus. The project includes: communication labs, electrical
engineering labs, fluid labs, heat and mass transfer labs, foundation engineering,
transportation and highway engineering, land surveying, machine shop, wood shop,
service yard, and conferencing/collaborative learning areas.
The figure 1 represent the model of the Engineering & Industry Building which will be opened
on July 2015; however, in the future it will be expanded to represent the data from all of the
buildings on the UAA main campus. There are several partners involved: Siemens Company,
which actually built the building and will be storing data from the sensors; UAA Engineering
team which are responsible for monitoring and maintenance of the building and providing us
with recent data; UAA IT department who will provide safe access to the data from the server;
student developers to implement the application; professor Adriano Cavalcanti, the direct
supervisor of the project; and the Dean of UAA College of Engineering. The members of the
student developers team are Brent Gonzales, Brian Kapala, Sukjin Yoon and Nailya
Galimzyanova (myself). The EOD application will be displayed on the large screens which will
be located in the UAA Engineering & Industry Building. It also will be available to the users on
mobile devices or personal computers. The application in the Engineering & Industry Building
will work as a display screen for data and information which will be continuously functioning.

4
Figure 1.1 The model of the UAA’s Engineering & Industry Building.
1.2 Application
The EOD application will display the information on the big size screens of the
Engineering & Industry Building at the UAA. The EOD application will be an interactive
application where users will utilize touch screen features to access needed information;
otherwise, while nobody is interacting with the application, it will display information about the
building, graphs for utilities, postings from School of Engineering, and etcetera. This information
will serve the purpose to distribute the information about the recent accomplishments and events,
building data and indoor building navigation. The EOD application will be presenting near real
time data which will allow ongoing monitoring of the systems. The EOD application maybe
expanded to be used for any other building on campus simply by adding necessary information
applied to desired building.
The EOD application will use the Berkely Software Distribution license (BSD), which
according to Bruce Montague “allows proprietary use and allows the software released under the
license to be incorporated into proprietary products. Works based on the material may be
released under a proprietary license as closed source software” (2012). Figure 3 below shows
open source licenses represent open source licenses which were considered for this project. The
advantage of the BSD license is that on the early stage of developing the application many
programmers all over the world can contribute to it. Eventually, one can combine the software
under BSD license with proprietary software and release it under a proprietary license, but have
to retain the BSD license text and notices.

5
Project-based File-based Permissive
Licenses: GPL 2 LGPL 2.1 MPL
1.1
CDDL
1.0
CPL
1.0
ECLIPSE
1.0
APACHE
2.0
NEW
BSD MIT
You may:
Use Yes Yes Yes Yes Yes Yes Yes Yes Yes
Modify Yes Yes Yes Yes Yes Yes Yes Yes Yes
Distribute Yes Yes Yes Yes Yes Yes Yes Yes Yes
Link to other programs under at
least some circumstances
without creating a derived work
Yes Yes Yes Yes Yes Yes Yes Yes
If you distribute you are
required to:
Make source code available Yes Yes Yes Yes
Display copyright notice Yes Yes Yes Yes Yes Yes Yes Yes Yes
Provide copy of license Yes Yes Yes Yes Yes Yes Yes Yes Yes
Mark changes Yes Yes Yes Yes Yes Yes Yes
Disclaim warranty Yes Yes Yes Yes Yes Yes Yes Yes Yes
Disclaim liability Yes Yes Yes Yes Yes Yes Yes Yes Yes
Indemnify earlier contributors
when you offer a warranty of
your own
Yes Yes Yes Yes Yes
Disclaimer: This chart is designed to provide information in regard to the subject matter covered. It is to be
understood that the author is not engaged in rendering legal or other professional service. If legal advice or other
expert assistance is required, the services of a professional person should be sought. This chart is in no way
intended to convey the official position of Sun Microsystems with regard to any software license.
Table 1.1. Open source licenses comparison.
1.3 Motivation
The purpose of the application is to distribute the information to the large auditory. This
information will give access to the building data, and will attract prospective students to choose
engineering path. Another useful feature of the EOD application is to give navigation inside the
building for those who are not familiar with its arrangement. The information about utilities will
allow students and researchers monitoring of processes and operations and perform experimental
engineering analysis. In addition, this information about resource usage of the building will
motivate users to save electricity, water, heat usage to improve the environment.
The indoor navigation feature will be designed for students and visitors unfamiliar with
building arrangement to help them find a right study room or place. The indoor wifi navigation is
a primary alternative to GPS, where GPS fails to give precise location, wifi navigation is
especially helpful to determine location in the multilevel buildings, such as Engineering &
Industry Building is going to be. Later on the indoor navigation feature will be expanded to
cover all campus and to give shortest path, distance and approximate time to reach the buildings,

6
which will help students to plan their class schedule. The indoor Navigation will be primary
feature which Nailya Galimzyanova (myself) will be implementing.
Figure 1.2 Proposed view for navigation feature.
1.4 Recent Developments
Indoor navigation may be used in any building with wifi access, such as hotel, store,
university, and etcetera. In addition, indoor navigation is applied in mobile robotics and ….
The reason why developers and engineers develop alternatives to the GPS is that GPS systems
aren’t accurate enough to determine precise location inside the building. The signals from the
satellites are weakened and scattered by roofs, walls and other objects, in some cases making an
errors bigger than the building or hallway in it. Moreover, the GPS maps generally not as precise
as building map, and it in most cases it is necessary to navigate in a small space to find particular
room. There are many different approaches to improve indoor navigation. The most usable are:
wifi and Bluetooth signals mounted into the device, light or magnetic field, passive radio
frequency identification tags (RFIDs), etcetera. We decided to apply the hybrid system of indoor
navigation using the GPS and wifi triangulation approaches. It will be most feasible approach for
UAA due to wifi availability on campus.
There are many indoor navigation applications which already exist in the market. The one
which is worth mentioning is 3D Wayfinder whch is used to help visitors to navigate in large
public buildings (shopping centers, airports, train stations, hospitals,universities etc.) 3D
Wayfinder uses a 3D floor plans of a building and renders it in real-time. 3D Wayfinder is
using JavaScript and WebGL based Frakengine developed by 3D Technologies R&D. The figure
below represents 3D Wayfinder application interface
here
Distance :50m
Time:3min

7
Figure 1.3 3D Wayfinder application interface.

8
Chapter 2
System Integration and Modeling /
Methodology
2.1 Introduction
This chapter describes system integration, system modeling and methodology behind
EOD project. It will describe all subsystems involved in a project and their interaction in parts
and as whole system. This chapter also covers abilities and limitation of subsystems and their
capabilities to act together. The EOD project consists of the following four main subsystems:
1. Physical elements – collect data from sensors about building utilities and
conditions
2. Siemens database – stores data from the sensors
3. UAA Server – stores received data from the Siemens database
4. EOD application - distributes information to the public
This chapter also describes system architecture and methodology which were used for this
project.
2.2 Sensors and Siemens Database
This project utilizes the data received from sensors installed within UAA Engineering &
Industry Building. There are several types of sensors installed, but our application will focus on
temperature, humidity, and air quality sensors. It will also use the data about energy and water
usage within the building. The Figure 2.1 on the following page represents the sensors structure
and what data is provided by each sensor.
The Siemens Apogee System has already an API that we can easily and directly connect
with an external system this solution is used at University of Alaska Fairbanks(UAF). At UAF
Siemens has provided an Apogee controller that communicates information to a Triduim Jace

9
BACnet provided by Lucid Software Company which implemented website for the UAF. The
Jace controller converts the BACnet data to another protocol and sends that data to the Lucid
website. While this system exist and looks like a good rea-time solution, it is not applicapable to
EOD project, since this software is not installed at UAA, the cost of software is exeeds EOD
project budget and Siemens data access restriction. Therefore, our team and Siemens Operations
Supervisor found alternative solution to send Comma Separated File (CSV) file with the most
recent data for the last reading updates about every 15 minutes; this will enable us to upload new
data every hour to the EOD database and application.
Figure 2.1 Engeneering on Display sensors sample.
2.3 UAA Server Database
UAA IT Services allocated virtual server space for the EOD project. We also have
second server for the testing purposes to test if the connection working on the back-end side and
simulate the data communication between Siemens server and UAA server. Brian Kapala is
responsible for the setting up the server and database. The main server will run MySQL and the
fron end of the system. We set up several users to distinguish access rights to the server: root
user (full access), data reviewer user (access to control mySQL database), and application user
(read only access).

10
2.4 EOD Application
The EOD application will be implemented in two forms: the webpage and the Android
application. The reasons for doing two implementations are to expand user range and to keep
appealing interfaces for displaying on the screen. Both of the implementations will have same
basic features and common style; except, the difference is that the Android application will have
a two state setup: user interaction and screen saver ability to display some data in animated
message form while nobody interacts with the application. The EOD application will summarize
and display data in the form of graph plots; the data will include electricity usage, water usage,
temperature, and etcetera. Moreover, the webpage side of the application will have building
navigation to display current location of the user.
2.5 System Integration and Architecture
This project uses Client-Server architecture because in our design client requests
information from the server; and the server responds to the request by authorizing client and
sending requested data and information, also server processing the CSV file and pushes it into
database. or providing requested data from the database. As for design patterns our project close
to Model-View-Controller (MVC) design pattern because we separated user interface from
computational elements. Where:
Model - Encapsulates system data and operations on the data – basically it is our
database (backend)
View - Displays data obtained from the model to the user – we have html files to
process view (GUI)
Controller - Handles events that affect the model or view php code to process the data
submission and retrieving
The bottom up approach to describe the system is a type of information processing based
on incoming data from the environment to form apperception. Data from Siemens sensors will
be transmitted to the Siemens database. Then Siemens will provide the data updates from their
database in a form of Comma-Separated Values (.csv) file by pushing it into UAA’s server.
Every pushed file will override the old data file. Then, the UAA server will retrieve these files
and push it to the MySQL database. Then, EOD application will pull new data to upload
information every hour. This project consists of several units; therefore, while each member of
student developers will be participating in the development process, we will split up the
responsibility for the units. Brent Gonzales and Sukjin Yoon will be responsible for the Android
application, Nailya Galimzyanova (myself) will be implementing the webpage features and
building navigation, and Brian Kapala will be responsible for the database site as well as front
and back end connection. The overview of the communication between systems is given on the
previous page in figure 2.2.
11
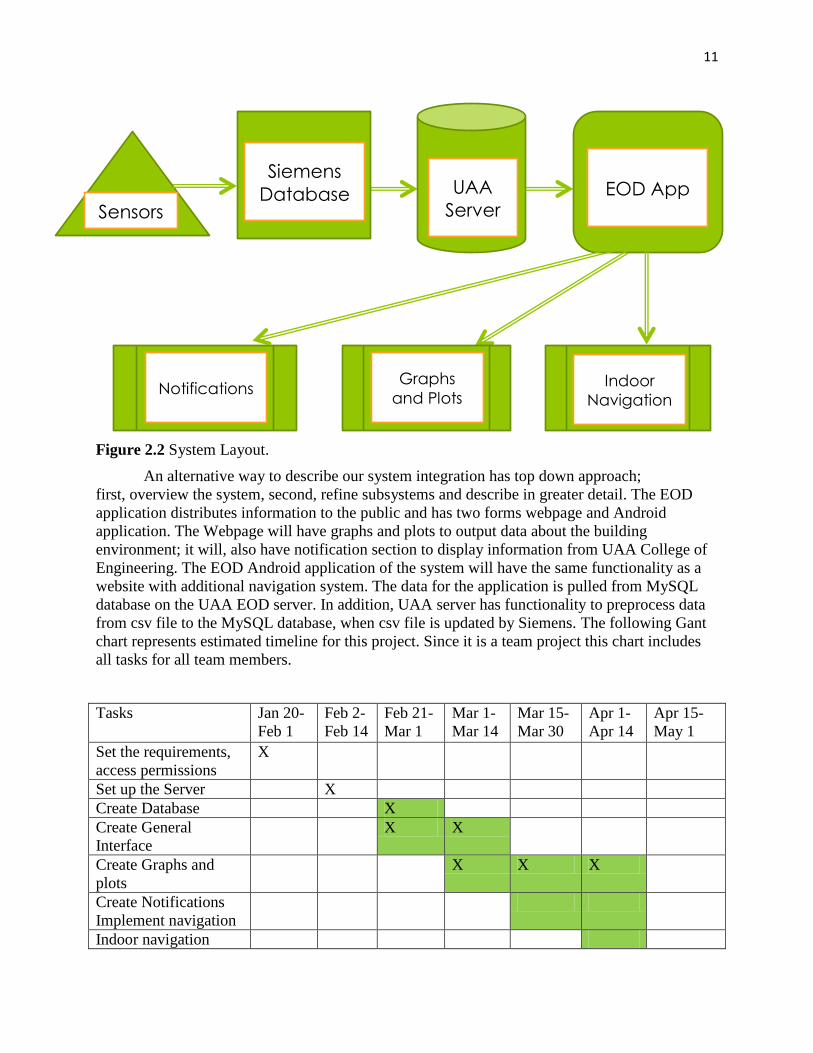
Figure 2.2 System Layout.
An alternative way to describe our system integration has top down approach;
first, overview the system, second, refine subsystems and describe in greater detail. The EOD
application distributes information to the public and has two forms webpage and Android
application. The Webpage will have graphs and plots to output data about the building
environment; it will, also have notification section to display information from UAA College of
Engineering. The EOD Android application of the system will have the same functionality as a
website with additional navigation system. The data for the application is pulled from MySQL
database on the UAA EOD server. In addition, UAA server has functionality to preprocess data
from csv file to the MySQL database, when csv file is updated by Siemens. The following Gant
chart represents estimated timeline for this project. Since it is a team project this chart includes
all tasks for all team members.
Tasks Jan 20-
Feb 1
Feb 2-
Feb 14
Feb 21-
Mar 1
Mar 1-
Mar 14
Mar 15-
Mar 30
Apr 1-
Apr 14
Apr 15-
May 1
Set the requirements,
access permissions
X
Set up the Server X
Create Database X
Create General
Interface
X X
Create Graphs and
plots
X X X
Create Notifications
Implement navigation
Indoor navigation
Siemens
Database UAA
Server EOD App
Sensors
Notifications Graphs
and Plots Indoor
Navigation
12
Design review
Testing
Publishing
Table 2.1 Gant chart for the project tasks (X-completed tasks, X-partially completed, -Not
completed).
2.6 Agile methodology
Agile Methodology is methodologies where requirements and solutions evolve through
collaboration teams and clients. According to Wikipedia “It promotes adaptive planning,
evolutionary development, early delivery, continuous improvement, and encourages rapid and
flexible response to change.” Most agile development methods break tasks into small increments
with minimal planning and do not directly involve long-term planning. Agile project timeline
broken into time units and after each unit testing is performed. Agile methodology is efficient
and requires face-to-face communication with the client and adapting under new feedback.
This is a short term project which will require covering wide variety of different features.
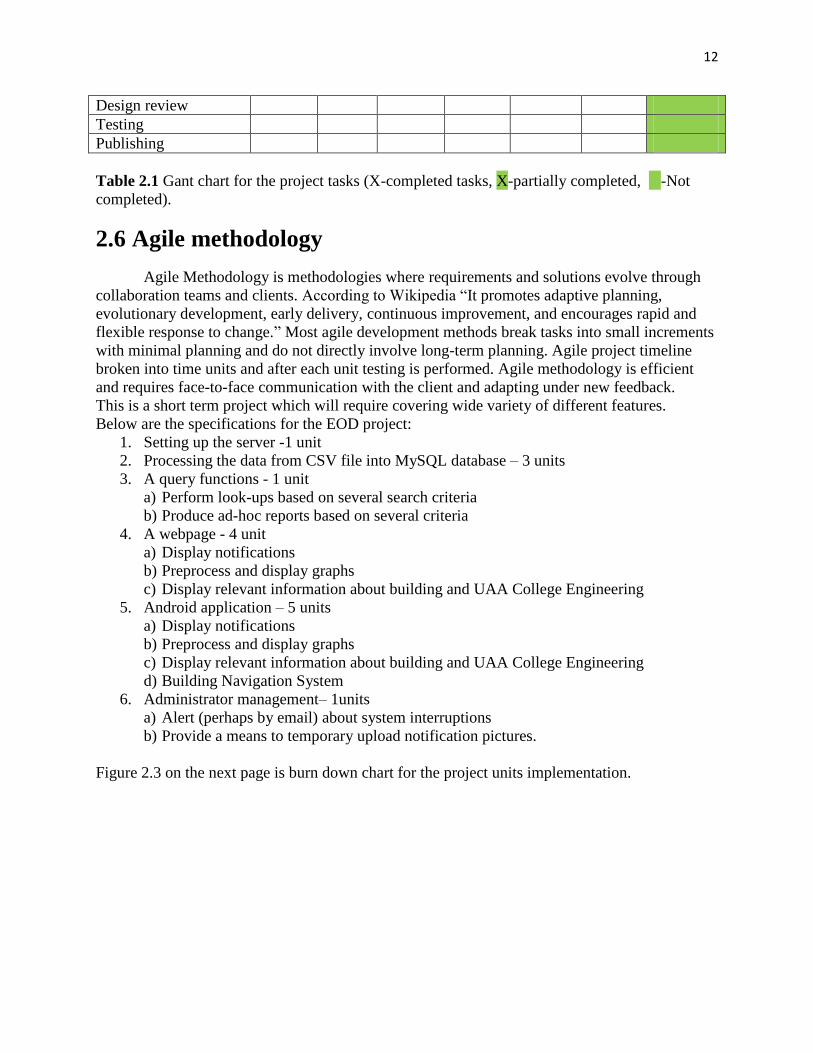
Below are the specifications for the EOD project:
1. Setting up the server -1 unit
2. Processing the data from CSV file into MySQL database – 3 units
3. A query functions - 1 unit
a) Perform look-ups based on several search criteria
b) Produce ad-hoc reports based on several criteria
4. A webpage - 4 unit
a) Display notifications
b) Preprocess and display graphs
c) Display relevant information about building and UAA College Engineering
5. Android application – 5 units
a) Display notifications
b) Preprocess and display graphs
c) Display relevant information about building and UAA College Engineering
d) Building Navigation System
6. Administrator management– 1units
a) Alert (perhaps by email) about system interruptions
b) Provide a means to temporary upload notification pictures.
Figure 2.3 on the next page is burn down chart for the project units implementation.
13
Figure 2.3 Burn-down chart for the project units.
2.7 Technology and tools
The project will be implemented on Android Platform due to rapid increase Android
devices on the market. The Webpage will be implemented in the following languages html,
JavaScript, Jquery and PHP using Netbeans IDE. PHP will be used when communication
between client and server needed and for preprocessing the data from MySQL database since
PHP language was designed to be compiled on the server. Jquery and JavaScrpt will be used to
process front-end interactions.
We will be using Github account to instantly upload the developing code. My Github Account is
https://github.com/triangulation The hardware for the EOD displays were donated by Siemens, these computers are
running Windows 8 with and i5 processor and 8GB of RAM and have 27” display on the first
floor and 22” screens on floors two through four. For the training purposes we used Nexus 7
Android tabled and Samsung Galaxy devices
05
10152025
Burn Down Chart
Burn Down
Chart

14
Figure 2.4 The touch screen monitor supplied by Siemens to be displayed in the UAA
Engineering & Industry Building.

15
Chapter 3
Design and Testing / User Interface
3.1 Introduction
This chapter describes the user interface and Indoor Navigation approach. It also outlines
front end and back end design of the application and describes methods which were used to test
the application. This chapter focuses on the front end design, describing interface of the EOD
application, opening up notification system and graphs and plots design choices.
3.2 General Interface
Obviously, the interface of webpage and Android application will be different to
accommodate user habits. Screens for user devices will vary in the dimensions and EOD
application should support all of them. Therefore, we will need to implement clear navigation
aids using clear and consistent icons, graphic identity schemes, page titles and headings, etcetera
to help users find needed information without wasting time. EOD application will have relatively
consistent layout between webpage and Android application: header, local navigation, and
content elements that together will be familiar to the user interactions in both
implementations. Header area will include major navigation points, such as home page, utilities
(water, electricity, gas, etc), history, indoor navigation, and help. Moreover, the EOD application
interface will use green and gold theme to mimic UAA theme. In addition this application will
require administrative interface for the publisher to post and update information and supporting
images.
3.3 Graphs and Plots
Graphs and plots one of the most important components of the EOD application. Due to
limited time frame for this project the EOD application will be concentration on the few data
measures, such as water usage, electricity usage and temperature. This data was selected because
it is the most useful data for regular user and it can be easily visualized. The best approach is to
combine the three data measurements in one graph since the chosen data depend one on each

16
other. Graphs are a visual representation of the relationship between variables, so users can
quickly derive and understand which would not come from lists of values. This will allow user to
see inner dependence, for example if temperature goes up electricity usage will increase too.
As implementation of the graphs our team decided to use column-bar charts for the
monthly data representation (see picture on the right in figure 6) and for the hourly data updates
we will be using point plot area charts (see picture on the left in figure 6). Bar chart are used to
represent categorical data is a grouping of data into discrete groups, in our case months of the
year. Area charts are used to represent cumulated totals using numbers or percentages (stacked
area charts in this case) over time. Use the area chart for showing trends over time among related
attributes. The area chart is like the plot chart except that the area below the plotted line is filled
in with color to indicate volume. To represent the graphs we used source free libraries, such as
Jqplot for the web implementation of the project and Google graphs libraries for Android
application.
Figure 3.1 Proposed charts.
3.4 Notifications
Screensaver functionality for displays located in Engineering & Industry Building is one
of the main requirements proposed by the dean of UAA School of Engineering. This implies not
only representing information from the graphs, but also displaying information about recent
events, achievements, UAA news, etc. Since the information in notifications will be changed
frequently, after deploying the EOD application dean or other responsible personnel need the
ability to change this information. The two proposed solutions are to store database of the
notification on the server or to create administrative interface which will give the dean an ability
to change arrangement of the visual elements and text. The administrative interface is better
approach in terms of the client requirements; however, it is more challenging to implement.

17
Figure 3.2 Current UAA Main page notification.
3.5 Indoor Navigation
Indoor navigation feature will be available for EOD Android application users. We
decided not to implement indoor navigation on the webpage due to limited access to the wifi
connections information. EOD indoor navigation is going to be hybrid of two systems which are
GPS and Wifi. GPS logic will be applied to see if the device in the range of building and to
locate the wifi sources; whereas wifi triangulation logic will be implemented to locate device
determine position of wifi transmitters inside the building. We also consider wifi fingerprinting
technique to determine position within one floor level.
3.5.1 Android API
API for Android developing provide WifiManager and BroadcastReceiver classes, it
provides the primary API to retrieve the results of access point scans, containing enough
information to determine location of the wifi sources and it defines the names of various Intent
actions that are broadcast upon any sort of change in Wi-Fi state. In particular, the EOD
application will be retrieving IP addresses and transmitted frequency. Below is the snipped of the
code to represent WifiManager and BroadcastReceiver initialization and basic usage: WifiManager wfManager BroadcastReceiver receiver; //prepare wifimanager wfManager = (WifiManager) getSystemService(Context.WIFI_SERVICE); wfManager.startScan(); //start if (receiver == null) receiver = new BroadcastReceiver() { public void onReceive(Context context, Intent intent) { results =wfManager.getScanResults(); System.out.println("here");

18
for (int i=0;i<results.size();i++) { seewifiinfo.append(results.get(i).toString());} } }; registerReceiver(receiver, new IntentFilter( WifiManager.SCAN_RESULTS_AVAILABLE_ACTION));
3.5.2 Trilateration
Trilateration is the process of determining absolute or relative locations of points by
measurement of distances, using the geometry of circles, spheres or triangles. GPS navigation
systems uses trilateration. To find the position of the device start with the equations for the three
spheres; therefore in order to locate the device our navigation system will require at least three
wifi source points, those point will be derived from IP addresses of available wifi connections.
Solving the system of equations for x and y and find the z-coordinate.
The solution to all three points x, y and z is found will determine the device location.
Figure 3.3. GPS trilateration.
19
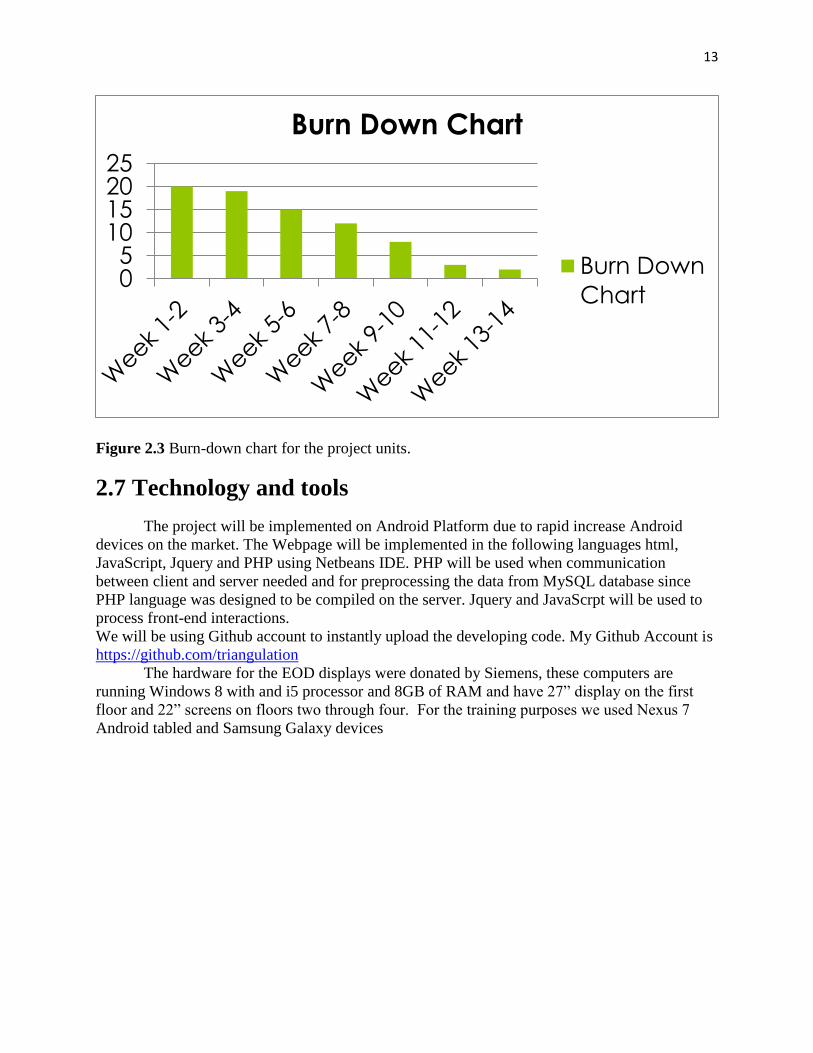
Wifi navigation system will use triangulation. Triangulation is the process of determining the
location of a point by measuring angles to it from known points at either end of a fixed baseline,
rather than measuring distances to the point directly (trilateration). 1.2.4 to be continued…
3.5.3 Wifi Fingerprinting
The localization, relative positioning, technique is based on measuring the intensity of the
received signal (RSS) and the method of "fingerprinting". WifiManager API provides required
information for wifi fingerprinting methods, such as SSID and the MAC address of the access
point. The accuracy of this method depends on the number of units in the database, which
contains IP location data and MAC addresses. General approach for implementation wifi
Fingerprinting algorithms is the following:
1. Prepare the Data
a. Split the location into greed points
b. Collect the signal strength from each greed related to all the access points
reachable from the greed.
c. Push the data into database.
2. Locate the position of a person each time do the follwoing:
a. Determine the received signal strength from different access points.
b. Find best match for signal strength in database and the current signal strength.
Solmon Chan and Gunhi Sohn, in their article “indoor localization using wi-fi based
fingerprinting and trilateration techiques for lbs applications” noted that distance between device
and access point requires computation of signal path loss (SPL):
SPL=path loss for 1m away+10log((distance between sender and receiver)^path loss
exponent in environment)+standard deviation of signal strength variability.
3.5.4 Triangulation
Similarly to trilateration, triangulation also
uses three reference points and uses triangle lengths to
determine the location of the unknown point. Those
point form a triangle, length of one side of a triangle
is equal to:
Using tan α = sin α / cos α and sin(α + β)
= sin α cos β + cos α sin β, derive the following:
Therefore, the distance is:
Figure 3.4 Triangulation scheme.

20
From this, determine the distance of the unknown point from observation point, its north/south
and east/west offsets from the observation point, and finally its full coordinates. Even though this
method will allow to determine floor level; however it is hard to apply it for wifi positioning
system since it is almost impossible derive the angles from wifi data; therefore, it will require
modification of software.
3.6 Testing
For testing we used mainly used black-box testing. We did this by pushing test values
into the MySQL database and making sure the data is uploaded into Webpage and Android
application. For database insertions information was inputted then pulled up with the SQL tools
from the Netbeans IDE to verify the integrity of the graphs. We did white-box testing to debug
our code; especially convenient in debugging the SQL queries that were being executed in our
code. A good amount of testing went to the validation of the graph data with the auto-formatting
according to required graphs. Null values are handled by the front-end as well, but the database
also has specified which values can and can’t be null. Finally, we did proofreading of the EOD
application and checked image resizing on different screens.
While developing this project we used agile methodology principles; meaning testing was
done concurrently with coding, and we perform testing on each stage. We frequently use
validated code pieces of software to validate the value of new code. We were continuously
reviewing our code and changing it.
Figure 3.5 Agile methodology iteration cycle.

21
Chapter 4
Results and Discussion
4.1 Introduction
The purpose of the Engineering on Display (EOD) project is to present relevant
information about the UAA Engineering and Industry building in an easy to understand graphical
representation. The EOD application will display the information on the big size screens of the
Engineering & Industry Building at the UAA. The EOD application presents near real time data
which will allow ongoing monitoring of the systems. The purpose of the application is to
distribute the information to the large auditory. The utility information will assist students and
researchers in monitoring processes, operations and performing experimental engineering
analysis. The EOD application is implemented in two forms: an Android application and
Webpage. The main focus of the application is to properly display data graphs about the building
power, heat, and water consumption. The application will also provide information to the
students about events that may be happening within the department or campus. The EOD
application maybe expanded to be used for any other building on campus simply by adding
necessary information applied to desired building. This chapter describes the results of the
project and discuss how are they accomplished and how the results may be improved. Even
though our team accomplished main tasks this project is work in progress and this chapter will
discuss what was done and what needs to be done.
4.2 Back End
On the back end EOD system has server which process incoming data and stores it into
database. However, our team faced hardship of getting access to the server and it significantly
slowed down development process. Therefore, to avoid delay in project and progress with
development on the front end I created simulation of the MySQL database on my local machine
and used it for the development and testing purposes. This database has one-to-many
relationships where a parent table is “Buildings”. This design was created in case the system will

22
be expanded to different UAA buildings, not just to the new Engineering Building. Currently, we
decided to concentrate on four types of data for the building: water usage, gas consumption,
electricity usage, and temperature. To pull the data from the database to EOD application, it uses
several PHP pages which contain MySQL queries according and are stored separately for each
data type. One recommended expansion for the database would be to create a table for the rooms
in each building. For each room, there could be an instructor, or class linked to a timeslot in that
room. From here the programmer could add in function for instructors to have office hours,
rooms, numbers, or anything else. The database is accessible in the webpage and android
application through the use of PHP. This allows the same information to be shared across many
different types of media. The figure 4.1 outlines the database structure which will be stored on
the server and from which EOD application will collect the data; meanwhile, this database was
simulated on my local host. The following is a sample of the PHP command to pull the data from
database: function show_records($dbc) {
$q = 'Select * from WaterUsage';
$r = mysqli_query($dbc, $q);
if ($r) {
while ($row = mysqli_fetch_array($r, MYSQLI_ASSOC)) {
echo $row['idBuildings'] . $row['Used'] . $row['Units'] . $row ['Date/Time'];
}
} else {
echo mysqli_error($dbc);
}
}
Figure 4.1 EOD database outline.
23
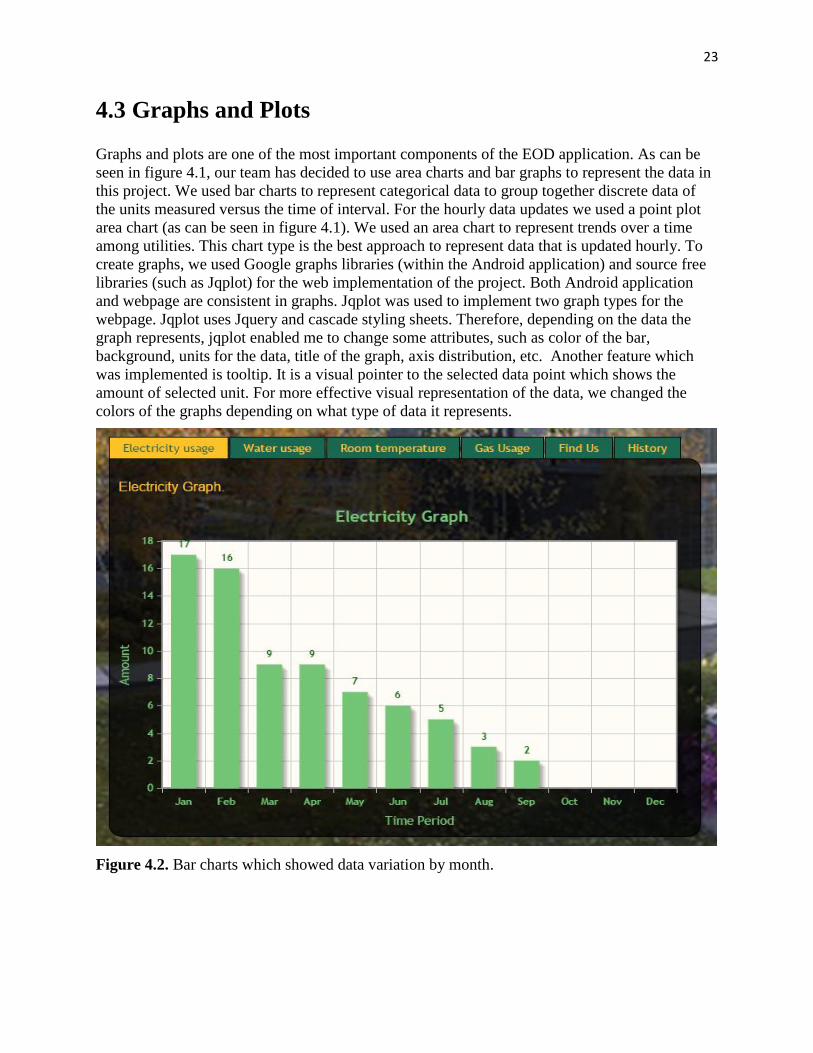
4.3 Graphs and Plots
Graphs and plots are one of the most important components of the EOD application. As can be
seen in figure 4.1, our team has decided to use area charts and bar graphs to represent the data in
this project. We used bar charts to represent categorical data to group together discrete data of
the units measured versus the time of interval. For the hourly data updates we used a point plot
area chart (as can be seen in figure 4.1). We used an area chart to represent trends over a time
among utilities. This chart type is the best approach to represent data that is updated hourly. To
create graphs, we used Google graphs libraries (within the Android application) and source free
libraries (such as Jqplot) for the web implementation of the project. Both Android application
and webpage are consistent in graphs. Jqplot was used to implement two graph types for the
webpage. Jqplot uses Jquery and cascade styling sheets. Therefore, depending on the data the
graph represents, jqplot enabled me to change some attributes, such as color of the bar,
background, units for the data, title of the graph, axis distribution, etc. Another feature which
was implemented is tooltip. It is a visual pointer to the selected data point which shows the
amount of selected unit. For more effective visual representation of the data, we changed the
colors of the graphs depending on what type of data it represents.
Figure 4.2. Bar charts which showed data variation by month.

24
Figure 4.3. Area charts which showed bi-hourly data changes.
4.4 Notifications
Screensaver functionality for displays located in Engineering & Industry Building is one of the
main requirements proposed by the dean of UAA School of Engineering. This implies not only
representing information from the graphs, but also displaying information about recent events,
achievements, UAA news, etc. For the simplicity of the project our team decided to implement
notifications and advertisements in a form of image file. This implies that College of
Engineering personnel will be able to create it themselves, all they would need to do is to store
the message in image format and upload it to the server. Both Android application and webpage
perform automatic switch of the images after every minute and have navigation features to let the
user switch between the notifications in the manner he wants. For the development this system
on the webpage I used Bootstrap library which was design specifically for the purpose of
creating image slideshow on the webpages. To be specific I used carousel model which enabled
the application look professional without slowing down running time. The figure 4.4 is a
sscreenshot of the EOD notification sample with navigation elements.

25
Figure 4.4. Screenshot of the EOD notification element.
4.5 Navigation
Indoor navigation feature is not well implemented and it is under development stage.
Currently it pulls the data from the surrounding wifi signals but has no functions to process it.
Therefore, it will not be presented at the current stage. Instead, the webpage has an indoor
navigation feature; it uses Google Maps API to display the location of the building. The map
shows the route from the user’s current location to the engineering building. This feature was
implemented using Google maps API for JavaScript. This feature will enable the clients to find
the building from anywhere on Earth. This will make it much easier for anyone to find the
building.
Figure 4.4. Screenshot of the EOD notification element.

26
Chapter 5
Summary and Conclusion
5.1 Introduction
The EOD application displays the information on the big size screens of the Engineering
& Industry Building at the UAA. This chapter describes the results of the project and discuss
how are they accomplished and how the results may be improved. Even though our team
accomplished main tasks, this project is work in progress and this chapter will discuss what was
done and what needs to be done.
5.2 Implications
All of the main features were successfully implemented and deployed. On the back end
EOD system has server which process incoming data and stores it into database. The database on
the back end was implemented using MySQL, and data was retrieved and processed using PHP.
Front end of the EOD application was successful implemented in two forms Android application
and webpage. Front end implementation contains graphs and charts with utility data for the
building which is pulled from the database on the back end. The graphs on the webpage load data
asynchronously, which prevent page from “freezing” ifn a case of interruptions with database
communication.
One of the main requirements proposed by the dean of UAA School of Engineering is the
screensaver functionality for the displays located in Engineering & Industry Building. This
doesn’t just display the graph information but also displays information about recent events,
achievements, UAA news, etc. Notifications and Achievements section of the application in
Android was implemented in a form of a screensaver where images contain important
information and it is evoked when application is not active; on the webpage part it is
implemented in a form of a slideshow updating an image every other minute. For the simplicity
of the project, our team decided to implement notifications and advertisements as an image file.
All they would need to do is store the message as an image file and upload it to the server. The
Android application and webpage perform an automatic switch of the images after every minute.
This makes it easier for staff in the College of Engineering to be able to create it themselves.
Navigation section of the application uses Google APIs and shows the path between
current location of the user and Engineering & Industry Building. The EOD project was
successfully implemented using various tools and this project involves different aspects of the
27
development process; which enabled our team for the professional growth and provided perfect
learning environment.
5.3 Recommendations for Future Development
Even though all features of the EOD application was successfully implemented most of
them need an improvement. Due to the short timeline of the project we concentrated on
implementing required features in simple form. We are planning on improving graphical design
and layouts of the application to make it more aesthetically pleasing. Since we haven’t been
provided with information and images for the application, currently, we are using mock pictures
and text; and this may be easily changed once we receive required information. Also currently,
the navigation section of the application shows navigation to the building, but not within it, and
this is the next step which we are going to implement.
Currently this application is limited to the Engineering & Industry Building; however, on
a large scale it may be expanded by applying it to all of the buildings on UAA main campus, or
maybe even to the all of the buildings in UA system.
5.4 Summary
The EOD application presents near real time data which will allow ongoing monitoring
of the systems. The purpose of the application is to distribute the information to the large
auditory. The information about utilities will allow students and researchers monitoring of
processes and operations and perform experimental engineering analysis. In addition, this
information about resource usage of the building will motivate users to save electricity, water,
heat usage to improve the environment. Each piece of this project works together. The front end
displays all the information that is kept within the backend. The display of the engineering
building statistics is a fun and interactive way for anyone to learn. The EOD application maybe
expanded to be used for any other building on campus simply by adding necessary information
applied to desired building. This application was successfully implemented and timely submitted
to the client. What may seem like a simple concept turned out to be a team effort. It is within this
team effort we were able to complete this project. Many different tools, systems, and codes also
had to come together to make this work. Our team and our supervisor fulfilled all of the
requirements for EOD project and the resulting application is serving its purpose.

28
Figure 5.1. The EOD application running on multiple platforms.

29
References
Arbnor I., Bjerke, B., (2007). Methodology for Creating Business Knowledge. Sage Publications
Inc
Beck, K. (1999). "Embracing Change with Extreme Programming". Computer 32 (10): 70–
77. doi:10.1109/2.796139
Buchholdt, R., 2013. University of ALlaska Anchorage. UAA Engineering & Industry Building.
Retrieved from: http://www.uaa.alaska.edu/fpc/projects/engineering.cfm
Chan S., Sohn G., (2012) “Indoor Localization Using Wi-Fi Based Fingerprinting And
Trilateration Techiques for Lbs Applications” International Archives of the
Photogrammetry, Remote Sensing and Spatial Information Sciences, Volume XXXVIII-
4/C26 Retrieved from:
http://www.int-arch-photogramm-remote-sens-spatial-inf-sci.net/XXXVIII-4-
C26/1/2012/isprsarchives-XXXVIII-4-C26-1-2012.pdf
Cohen, D., Lindvall, M., & Costa, P. (2004). An introduction to agile methods. In Advances in
Computers, New York: Elsevier Science, pp. 1–66
Doherty, L., K.S.J. Pister and L. El Ghaoui, 2001. Convex position estimation in wireless sensor
networks. Proceeding of the 21th Annual Joint Conference on IEEE Computer
Communications, Apr. 22-26, IEEE Xplore Press, Anchorage, AK., USA., pp: 1655-
1663. DOI: 10.1109/INFCOM.2001.916662
Dufresne, T., Martin, J. (2003). "Process Modeling for E-Business". INFS 770 Methods for
Information Systems Engineering: Knowledge Management and E-Business.
Gold-Bernstein, Beth; Ruh, William A (2005), Enterprise integration: the essential guide to
integration solutions, Addison Wesley
Kolodziej, K.W. and J. Hjelm, 2006. Local Positioning Systems LBS Applications and Services.
1st Edn., CRC Press, USA., ISBN: 10: 0849333490, pp: 488.
Kupper, A., 2005. Location-Based Services Fundamentals and Operation. 1st Edn., Wiley, USA.,
ISBN: 13: 978-0470092316, pp: 286.
Mehmood, H. and N.K. Tripathi, 2009. Real Time Self Mapping Hybrid Positioning System. In:
Geospatial Crossroads @ GI_Forum’09, Car, A., G. Griesebner and J. Strobl (Eds.).
Wichmann, Salzburg, Austria, ISBN: 13: 978-3879074815, pp: 130-139.
Montague, B., 2012. "Why you Should Use a BSD style License for your Open Source Project".
Retrieved from:
http://en.wikipedia.org/wiki/BSD_licenses#Proprietary_software_licenses_compatibility
Rasmusson, J. (2013). The Agile Samurai: How Agile Masters Deliver Great Software
(Pragmatic Programmers). Pragmatic Bookshelf 1e
Grossmann, U., Schauch, M., Hakobyan, S. (2010). RSSI based WLAN Indoor Positioning with
Personal Digital Assistants, IEEE International Workshop on Intelligent Data Acquisition
and Advanced Computing Systems: Technology and Applications
http://digitalcommons.calpoly.edu/cgi/viewcontent.cgi?article=1007&context=cpesp
Vasiliauskas, V. (2014). "Developing agile project task and team management practices".
Eylean.

30
Appendix A – UML and Database Outline

31
Appendix B – Source Code For Android Application
Repository: https://github.com/ravvytheprogrammer/EOD
MainActivity.java
/*
Copyright 1994-2004. EOD Project. All rights reserved.
Redistribution and use in source and binary forms, with or without modification, are permitted
provided that the following conditions are met:
1. Redistributions of source code must retain the above copyright notice, this list of conditions
and the following disclaimer.
2. Redistributions in binary form must reproduce the above copyright notice, this list of
conditions and the following disclaimer in the documentation and/or other materials provided
with the distribution.
THIS SOFTWARE IS PROVIDED BY THE EOD PROJECT "AS IS" AND ANY EXPRESS
OR IMPLIED WARRANTIES, INCLUDING, BUT NOT LIMITED TO, THE IMPLIED
WARRANTIES OF MERCHANTABILITY AND FITNESS FOR A PARTICULAR PURPOSE
ARE DISCLAIMED. IN NO EVENT SHALL THE EOD PROJECT OR CONTRIBUTORS BE
LIABLE FOR ANY DIRECT, INDIRECT, INCIDENTAL, SPECIAL, EXEMPLARY, OR
CONSEQUENTIAL DAMAGES (INCLUDING, BUT NOT LIMITED TO, PROCUREMENT
OF SUBSTITUTE GOODS OR SERVICES; LOSS OF USE, DATA, OR PROFITS; OR
BUSINESS INTERRUPTION) HOWEVER CAUSED AND ON ANY THEORY OF
LIABILITY, WHETHER IN CONTRACT, STRICT LIABILITY, OR TORT (INCLUDING
NEGLIGENCE OR OTHERWISE) ARISING IN ANY WAY OUT OF THE USE OF THIS
SOFTWARE, EVEN IF ADVISED OF THE POSSIBILITY OF SUCH DAMAGE.
The views and conclusions contained in the software and documentation are those of the
authors and should not be interpreted as representing official policies, either expressed or
implied, of the EOD Project.
*/
package eod.uaa.eod;
import android.app.Activity;
import android.os.Bundle;

32
/*
* MainActivity class that loads MainFragment
*/
public class MainActivity extends Activity {
/**
* Called when the activity is first created.
*/
@Override
public void onCreate(Bundle savedInstanceState) {
super.onCreate(savedInstanceState);
setContentView(R.layout.activity_main);
}}
Index.aspx
<!DOCTYPE html>
<!--/*
Copyright 1994-2004. EOD Project. All rights reserved.
Redistribution and use in source and binary forms, with or without modification, are permitted
provided that the following conditions are met:
1. Redistributions of source code must retain the above copyright notice, this list of conditions
and the following disclaimer.
2. Redistributions in binary form must reproduce the above copyright notice, this list of
conditions and the following disclaimer in the documentation and/or other materials provided
with the distribution.
THIS SOFTWARE IS PROVIDED BY THE EOD PROJECT "AS IS" AND ANY EXPRESS
OR IMPLIED WARRANTIES, INCLUDING, BUT NOT LIMITED TO, THE IMPLIED
WARRANTIES OF MERCHANTABILITY AND FITNESS FOR A PARTICULAR PURPOSE
ARE DISCLAIMED. IN NO EVENT SHALL THE EOD PROJECT OR CONTRIBUTORS BE
LIABLE FOR ANY DIRECT, INDIRECT, INCIDENTAL, SPECIAL, EXEMPLARY, OR
CONSEQUENTIAL DAMAGES (INCLUDING, BUT NOT LIMITED TO, PROCUREMENT
OF SUBSTITUTE GOODS OR SERVICES; LOSS OF USE, DATA, OR PROFITS; OR
BUSINESS INTERRUPTION) HOWEVER CAUSED AND ON ANY THEORY OF
LIABILITY, WHETHER IN CONTRACT, STRICT LIABILITY, OR TORT (INCLUDING

33
NEGLIGENCE OR OTHERWISE) ARISING IN ANY WAY OUT OF THE USE OF THIS
SOFTWARE, EVEN IF ADVISED OF THE POSSIBILITY OF SUCH DAMAGE.
The views and conclusions contained in the software and documentation are those of the
authors and should not be interpreted as representing official policies, either expressed or
implied, of the EOD Project.
*/
-->
<html lang="en" >
<head runat="server">
<meta charset="UTF-8" />
<title>Engineering on Display</title>
<!-- Latest compiled and minified CSS
<meta name="viewport" content="width=device-width, initial-scale=1">
<meta name="viewport" content="initial-scale=1.0, user-scalable=no">-->
<link rel="stylesheet" type="text/css" href="dist/graph.css" />
<link rel="stylesheet" href="App_Theme/styling.css" />
<script type="text/javascript" src="dist/jquery.js"></script>
<script type="text/javascript" src="dist/jquery.jqplot.js"></script>
<script type="text/javascript" src="dist/plugins/jqplot.pieRenderer.js"></script>
<script type="text/javascript" src="dist/plugins/jqplot.categoryAxisRenderer.js"></script>
<script type="text/javascript" src="dist/plugins/jqplot.pointLabels.js"></script>
<script type="text/javascript" src="dist/plugins/jqplot.highlighter.min.js"></script>
<script type="text/javascript"
src="dist/plugins/jqplot.canvasTextRenderer.min.js"></script>
<script type="text/javascript"
src="dist/plugins/jqplot.canvasAxisTickRenderer.min.js"></script>
<script type="text/javascript"
src="dist/plugins/jqplot.canvasAxisLabelRenderer.min.js"></script>
<script type="text/javascript" src="dist/plugins/jqplot.barRenderer.js"></script>
<script src="https://maps.googleapis.com/maps/api/js?v=3.exp&signed_in=false"></script>
<script src="eod.js"></script>
<link rel="icon" href="../../favicon.ico"/>
</head>
<body>
<header>
<p id='tittle'>University of Alaska Anchorage: Engineering on Display</p>
</header>

34
<div id="content">
<div id="cont">
<div id="container1">
<div class="slider">
<div class="slide-viewer">
<div class="slide-group">
<div class="slide slide-1">
<img src="images/6.png" class="sliddd" alt="" />
</div>
<div class="slide slide-2">
<img src="images/2.png" class="sliddd" alt="" />
</div>
<div class="slide slide-3">
<img src="images/3.png" class="sliddd" alt="" />
</div>
<div class="slide slide-4">
<img src="images/4.png" class="sliddd" alt="" />
</div>
<div class="slide slide-5">
<img src="images/5.png" class="sliddd" alt="" />
</div>
<div class="slide slide-6">
<img src="images/1.png" class="sliddd" alt="" />
</div>
</div>
</div>
<div class="slide-buttons"></div>
</div>
<script src="slider.js"></script>
<!--<div id="myCarousel" class="carousel slide" data-ride="carousel">
Indicators
<a class="left carousel-control" href="#myCarousel" role="button" data-
slide="prev">
<span class="glyphicon glyphicon-chevron-left" aria-hidden="true"></span>
<span class="sr-only">Previous</span>
</a>

35
<a class="right carousel-control" href="#myCarousel" role="button" data-
slide="next">
<span class="glyphicon glyphicon-chevron-right" aria-hidden="true"></span>
<span class="sr-only">Next</span>
</a>
</div>-->
<br/>
</div>
<!-- begin html container for tabs and content -->
<div id="container2">
<div class="tabs">
<ul class="digiTabs">
<li id="1" class="selected t">Electricity usage</li>
<li id="2" class="t">Water usage</li>
<li id="3" class="t">Outside temperature</li>
<li id="4" class="t">Gas Usage</li>
<li id="5" class="t">Find Us</li>
<li id="6" class="t">History</li>
</ul>
<!-- TAB 1 -->
<div id="tabs-1" class="tabContent" >
<p>Electricity Graph.</p>
<div class="charts" id="chart1" title="Electricity Graph"
style="height:90%;width:99%"></div>
</div>
<!-- end tab 1 content -->
<!-- TAB 2 -->
<div id="tabs-2" class="tabContent">
<p>Water usage graph.</p>
<div class="charts" id="chart2" title="Water Graph"
style="height:90%;width:99%"></div>
</div>
<!-- end tab 2 content -->
<!-- TAB 3 -->
<div id="tabs-3" class="tabContent">
<p>Temperature Graph.</p>
36
<div class="charts" id="chart3" title="Temperature Graph"
style="height:90%;width:99%"></div>
</div>
<!-- end tab 3 content -->
<div id="tabs-4" class="tabContent">
<p>Gas Graph.</p>
<div class="charts" id="chart4" title="Gas Graph"
style="height:90%;width:99%"></div>
</div>
<div id="tabs-5" class="tabContent">
<p>Address</p>
<div id="map-canvas" title="Map" style="height:90%;"> </div>
<div class="charts" id="chart5" style="display:none"></div>
</div>
<div id="tabs-6" class="tabContent">
<div class="charts" id="chart6" style="height:90%;width:99%;">
<h2>UAA Engineering & Industry Building</h2>
<p id="hist">A new 81,500 sf facility will house engineering laboratory and
teaching areas not currently available on campus. The project includes: communication labs,
electrical engineering labs, fluid labs, heat and mass transfer labs, foundation engineering,
transportation and highway engineering, land surveying, machine shop, wood shop, service yard,
and conferencing/collaborative learning areas.
<br />
A/E: Livingston Slone, Inc.
<br />
CMAR: Neeser Construction, Inc.
<br />
</p> <img src="images\img1.jpg" />
</div>
</div>
</div>
<br />
</div>
</div>
<!-- end div class tabContainer -->
</div>
<footer>
<small><i>Copyright © UAA<br />
<a href="mailto:[email protected]">[email protected]</a>

37
</i></small>
</footer>
</body>
</html>
Styling.css html{ height: 100%; min-width:780px; } body { font-family: Arial, Helvetica, sans-serif; margin:0 ; padding: 0px; position: relative; min-height: 100%; } body header{ background-color: #196950; color:#fec425; position: absolute; width:100%; height:80px; } body header #tittle{ padding:0px; padding-top:0px; margin: 0px; font-family:cursive; text-align: center; font-size: 30px; } body footer{ position: absolute; width:100%; height:50px; bottom:0; margin:0px; background-color: #196950; color:#fec425; } body #content{ padding:0px; margin: 0px; position: absolute;

38
top:80px; bottom:50px; width:100%; background-image: url("../images/backimg.png"); background-size: 100% 100%; background-repeat: no-repeat; overflow:auto; height:auto; display:inline-block; float:none; margin:auto; } iframe{ position: absolute; width:inherit !important; height:inherit !important; } #cont{ text-align: center; alignment-adjust: central; margin:auto; } #container1,#container2{ padding:20px; display: inline-block; alignment-adjust:central; text-align: center; margin:auto; } #container1{ border-radius: 15px; width:550px; margin-top:40px; height:570px; } #container2{ color:#fec425; width: 680px; margin-top:-100px !important; height:520px; } h1 { color: blue; border: 2px dotted green; text-align: center; margin-top: 0px; border-radius: 15px; } label { float: left; width: 11em; text-align: right; } .tabs

39
{ position:relative; top:-80px; left:10px; height:inherit; width:inherit; } .selectedTab { background-color:white; border-bottom:solid 1px white; border-radius:15px; } /*tabs*/ .tabs { width:inherit; } .tabs .digiTabs { list-style: none; display: block; overflow: hidden; margin: 0; padding: 0px; position: relative; top: 1px; } .tabs .digiTabs li { float: left; padding: 5px 15px!important; cursor: pointer; border-bottom:none; margin-right: 1px; font-family: "Trebuchet MS", Arial, Helvetica, sans-serif; font-size: 14px; border:solid 1px black; background-color:#196950; color:#fec425; padding:5px 10px; } .tabs .digiTabs .selected { background-color:#fec425; color:#196950; font-family: "Trebuchet MS", Arial, Helvetica, sans-serif; border-left: 1px solid #000; border-top: 1px solid #000; border-right: 1px solid #000; } .tabContent { border:solid 1px black; padding:10px; background-color:rgba(0,0,0,0.7) ; border-radius:15px; border-top-left-radius: 0px; color:#fec425; width:100%; width:inherit; height:100%;

40
} #tabs-1{ display:block;} #tabs-2,#tabs-3,#tabs-4,#tabs-5,#tabs-6{ display:none; } img{ height:300px; width:auto; float: right; } #hist{ } #map-canvas{ border-radius: 15px; } /********** SLIDER ********* max-width: 940px; */ .slider { margin: 0 auto 30px auto; height:inherit; width:inherit; } .slide-viewer { position: relative; /* needed for IE7 */ overflow: hidden; //height: 500px; //width:500px; height:inherit; } .slide-group { width: 100%; height: 100%; position: relative; } .slide { width: 100%; height: 100%; display: none; position: absolute; } .slide:first-child { display: block; } .slider img{ height:100%; width: 100%; min-height:100%; min-width: 100%; } /********** BUTTONS **********/
41
.slide-buttons { text-align: center; position:fixed ; position: relative; margin-top:-60px; } .slide-btn { border: none; background: none; color: #196950; font-size: 300%; top: 0; } .slide-btn.active, .slide-btn:hover { color: #fec425; cursor: pointer; } .sliddd { float: none; position: relative; width: 500px; height: 350px; } Eod.js /* * To change this license header, choose License Headers in Project Properties. * To change this template file, choose Tools | Templates * and open the template in the editor. */ var plot1; var ch1; //resize chart when window resizes $(window).resize(function () { plot1.replot({ resetAxes: true }); }); //activated on active tab changed function tabsAction() { var mydata = []; var myClasses = document.getElementsByClassName("selected t"); //pull array of data from database // s1 = getGraphData(); // s1 = myWaterArr; //clean tabb content: remove old charts and div data for (var i = 0; i < myClasses.length; i++) { var id = myClasses[i].getAttribute("id"); myClasses[i].className = "t"; var idtab = "tabs-" + id; document.getElementById(idtab).style.display = "none"; var chid = 'chart' + id.toString();

42
document.getElementById(chid).style.display = "none"; } //assign active tab this.className = "selected t"; var id = this.getAttribute("id"); var idtab = "tabs-" + id; //prepare content of the tabs according to activated tab //initialize and display chart, replot to anjust resizing if (idtab !== "tabs-5" && idtab !== "tabs-6") { document.getElementById("tabs-6").style.display = "none"; document.getElementById("tabs-5").style.display = "none"; // document.getElementById("map-canvas").style.display = "none"; document.getElementById(idtab).style.display = "block"; var chid = 'chart' + id.toString(); var title = document.getElementById(chid).title; var filename = ''; if (id == 1) { filename = 'queries/ElectricityUsage.php'; mydata = [7596, 7887.8, 7744.7, 7318.8, 7263.3, 7779.1, 7921.4, 7747.8, 7650.9, 7684.2, 7439.7, 7257.9, 7713.6, 5948.1, 0, 7393.0, 7082.6, 7178.9, 7581.4, 7599.8, 7501.1, 7476.0, 7536.5, 7159.4, 7141.3, 7141.3]; } else if (id == 2) { mydata = [4773, 4695, 5647, 2865, 2729, 4858, 4208, 4048, 4311, 4098, 2611, 2251, 4165, 1262, 0, 0, 896, 2263, 2749, 3991, 4064, 3834, 3875, 4006, 2624, 2423]; filename = 'queries/WaterUsage.php'; } else if (id == 3) { filename = 'queries/OutsideTemperature.php'; mydata = [38, 40, 40.5, 34.5, 36.5, 41.0, 42.5, 37.0, 38.0, 42.0, 37.5, 37.5, 34.5, 32.0, 41.0, 40.5, 42.0, 44.5, 45.5, 37.0, 40.0, 39.5, 38.5, 40.5, 43.0, 47.0]; } else if (id == 4) { filename = 'queries/GasConsumption.php'; mydata = [63786, 72134, 73667, 71013, 81663, 65626, 38419, 41251, 34825, 34911, 47882, 47259, 43357, 22972, 0, 0, 9097, 31011, 22479, 32676, 43711, 41873, 37342, 28893, 30372, 28488]; } else { filename = 'queries/eod.php'; } /* $.get(filename, function (result) { //parse the results result = result.substring(1, result.length - 1); result = result.split('"').join(''); result = result.split(","); //convert to integer for (var i = 0; i < result.length; i++) { mydata[i] = Number(result[i]); } ch1 = new myGraph(mydata, chid, title, idtab); }); document.getElementById(chid).style.display = "block"; plot1.replot({resetAxes: true});*/
43
ch1 = new myGraph(mydata, chid, title, idtab); document.getElementById(chid).style.display = "block"; plot1.replot({ resetAxes: true }); } // displays map else if (idtab === "tabs-6") { document.getElementById('tabs-6').style.display = "block"; document.getElementById("chart6").style.display = "block"; } else if (idtab === "tabs-5") { document.getElementById('tabs-5').style.display = "block"; var lat; var lng; if (navigator.geolocation) { window.navigator.geolocation.getCurrentPosition( function (position) { //succes handling lat = position.coords.latitude; lng = position.coords.longitude; mapManipulation(lat, lng, idtab); }, function errorCallback(error) { //error handling lat = 61.188753; lng = -149.826814; showbuilding(lat, lng, idtab); }, { maximumAge: Infinity, timeout: 5000 } ); } } } ; //if user location is not enabled function showbuilding(lat, lng, idtabin) { document.getElementById("map-canvas").style.display = "block"; document.getElementById(idtabin).style.display = "block"; //get current position // var location = new google.maps.LatLng(61.1895867, -149.8310051); var location = new google.maps.LatLng(lat, lng); //declare map parametrs var mapOptions = { center: location, mapTypeId: google.maps.MapTypeId.ROADMAP, mapTypeControl: true, streetViewControl: true, zoomControl: true, overviewMapControl: true, panControl: true, panControlOptions: {

44
position: google.maps.ControlPosition.TOP_LEFT }, zoom: 13 }; var venueMap = new google.maps.Map(document.getElementById('map-canvas'), mapOptions); //for pin var startPosition = new google.maps.Marker({ position: location, map: venueMap, icon: "images/go.png" }); google.maps.event.trigger(rootMap, 'resize'); } ; //shows direction function mapManipulation(lat, lng, idtabin) { // document.getElementById("map-canvas").style.visibility="visible"; document.getElementById("map-canvas").style.display = "block"; // document.getElementById(idtabin).style.display = "block"; //get current position var location = new google.maps.LatLng(lat, lng); var dest = new google.maps.LatLng(61.188753, -149.826814); var directionsService = new google.maps.DirectionsService(); var directionsDisplay = new google.maps.DirectionsRenderer(); var request = { origin: location, destination: dest, travelMode: google.maps.TravelMode.DRIVING }; var mapOptions = { zoom: 13, center: location, mapTypeId: google.maps.MapTypeId.ROADMAP, mapTypeControl: true, streetViewControl: true, zoomControl: true, overviewMapControl: true, panControl: true }; directionsService.route(request, function (response, status) { if (status === google.maps.DirectionsStatus.OK) { directionsDisplay.setDirections(response); } ; }); var map = new google.maps.Map(document.getElementById('map-canvas'), mapOptions); directionsDisplay.setMap(map); google.maps.event.trigger(map, 'resize'); //google.maps.event.addDomListener(window, 'load', initialize);

45
} ; //bar chart initialization function myGraph2(s1, name, tittle, idtab) { var ticks = ['Jan', 'Feb', 'Mar', 'Apr', 'May', 'Jun', 'Jul', 'Aug', 'Sep', 'Oct', 'Nov', 'Dec']; var col = ''; var Xaxis = ''; var Yaxis = ''; if (tittle === 'Electricity Graph') { col = '#73C774'; Xaxis = 'Time Period'; Yaxis = 'Amount'; } else if (tittle === 'Water Graph') { col = '#2C75FF';//#2C75FF'; Xaxis = 'Time Period'; Yaxis = 'Amount'; } else if (tittle === 'Gas Graph') { col = '#FF00FF'; Xaxis = 'Time Period'; Yaxis = 'Amount'; } else if (tittle === 'Temperature Graph') { col = '#FF3300'; Xaxis = 'Time Period'; Yaxis = 'Amount'; } else { col = "#C7754C"; Xaxis = 'Time Period'; Yaxis = 'Amount'; } $.jqplot.config.enablePlugins = true; plot1 = $.jqplot(name, [s1], {//, s3], { // The "seriesDefaults" option is an options object that will // be applied to all series in the chart. title: { text: tittle, textColor: col }, seriesColors: [col], // '#00749F', '#73C774', '#C7754C', '#17BDB8'], seriesDefaults: { renderer: $.jqplot.BarRenderer, rendererOptions: { fillToZero: true, textColor: col } }, // Custom labels for the series are specified with the "label" // option on the series option. Here a series option object // is specified for each series. /* series: [ {label: 'Amount'} ],*/

46
// Show the legend and put it outside the grid, but inside the // plot container, shrinking the grid to accomodate the legend. // A value of "outside" would not shrink the grid and allow // the legend to overflow the container. //legend: { // show: true, //placement: 'outsideGrid' //}, axes: { // Use a category axis on the x axis and use our custom ticks. xaxis: { renderer: $.jqplot.CategoryAxisRenderer, ticks: ticks, label: Xaxis, labelRenderer: $.jqplot.CanvasAxisLabelRenderer, tickOptions: { textColor: col }, labelOptions: { textColor: col } }, // Pad the y axis just a little so bars can get close to, but // not touch, the grid boundaries. 1.2 is the default padding. yaxis: { labelRenderer: $.jqplot.CanvasAxisLabelRenderer, label: Yaxis, pad: 1.05, tickOptions: { formatString: '%d', textColor: col }, labelOptions: { textColor: col } } } }); //chart resize on changes $(idtab).bind('resizestop', function (event, ui) { $('#chart1').height($(idtab).height() * 0.96); $('#chart1').width($(idtab).width() * 0.96); plot1.replot({ resetAxes: true }); }); return plot1; } ; var miny = 0; //area chart initialization function myGraph(s1, name, tittle, idtab) { var col = ''; var Xaxis = ''; var Yaxis = ''; if (tittle === 'Electricity Graph') { col = '#73C774'; Xaxis = 'Time Period'; Yaxis = 'Amount(kW)'; miny = 6000; } else if (tittle === 'Water Graph') { col = '#2C75FF';//#2C75FF'; Xaxis = 'Time Period'; Yaxis = 'Amount(Gallon)'; miny = 0;

47
} else if (tittle === 'Gas Graph') { col = '#FF00FF'; Xaxis = 'Time Period'; Yaxis = 'Amount (kBtu)'; miny = 550; } else if (tittle === 'Temperature Graph') { col = '#FF3300'; Xaxis = 'Time Period'; Yaxis = 'Amount (Fahrenheit)'; miny = 0; } else { col = "#C7754C"; Xaxis = 'Time Period'; Yaxis = 'Amount'; miny = 0; } // $('#chart1').empty().jqplot(charts[0]); //alert("here"); //$('#chart1').destroy().jqplot(charts[0]); //var ticks = [[1, '12am'], [2, '2am'], [3, '4am'], [4, '6am'], [5, '8am'], [6, '10am'], [7, '12pm'], [8, '2pm'], [9, '4pm'], [10, '6pm'], [11, '8pm'], [12, '10pm']]; var ticks = [[1, '1-Apr'], [2, '2-Apr'], [3, '3-Apr'], [4, '4-Apr'], [5, '5-Apr'], [6, '6-Apr'], [7, '7-Apr'], [8, '8-Apr'], [9, '9-Apr'], [10, '10-Apr'], [11, '11-Apr'], [12, '12-Apr'], [13, '13-Apr'], [14, '14-Apr'], [15, '15-Apr'], [16, '16-Apr'], [17, '17-Apr'], [18, '18-Apr'], [19, '19-Apr'], [20, '20-Apr'], [21, '21-Apr'], [22, '22-Apr'], [23, '23-Apr'], [24, '24-Apr'], [25, '25-Apr'], [26, '26-Apr']]; plot1 = $.jqplot(name, [s1], { // stackSeries: true, title: { text: tittle, textColor: col }, //custom color for the graphs seriesColors: [col], // '#00749F', '#73C774', '#C7754C', '#17BDB8'], seriesColors: [col], showMarker: true, seriesDefaults: { fill: true }, dataPoints: { color: col }, /*series: [ {label: 'B'} ], legend: { show: true, placement: 'outsideGrid' }, grid: { drawBorder: false, shadow: false },*/ highlighter: { show: true, showTooltip: true, sizeAdjust: 7.5, lineWidthAdjust: 2.5 }, cursor: {

48
show: true }, axes: { xaxis: { labelRenderer: $.jqplot.CanvasAxisLabelRenderer, label: Xaxis, ticks: ticks, tickRenderer: $.jqplot.CanvasAxisTickRenderer, tickOptions: { textColor: col, angle: -40, fontSize: '10pt', formatString: '%d' }, labelOptions: { textColor: col }, drawMajorGridlines: true, pad: 0 }, yaxis: { labelRenderer: $.jqplot.CanvasAxisLabelRenderer, label: Yaxis, pad: 0, min: miny, tickOptions: { formatString: '%d', textColor: col }, labelOptions: { textColor: col } } } }); //chart resize on changes $(idtab).bind('resizestop', function (event, ui) { $('#chart1').height($(idtab).height() * 0.96); $('#chart1').width($(idtab).width() * 0.96); plot1.replot({ resetAxes: true }); }); return plot1; } ; //retreive data from database /*$.get('eod.php', function (result) { //parse the results result = result.substring(1, result.length - 1); result = result.split('"').join(''); result = result.split(","); //convert to integer for (var i = 0; i < result.length; i++) { mydata[i] = Number(result[i]); } //initialize the chart var tittle = document.getElementById('chart1').title; ch1 = new myGraph(mydata, 'chart1', tittle, "tab-1"); }); //returns array of data for the graph function getGraphData() { return mydata;

49
} ; var myWaterArr = $.get('eod.php', function (result) { //parse the results result = result.substring(1, result.length - 1); result = result.split('"').join(''); result = result.split(","); //convert to integer for (var i = 0; i < result.length; i++) { mydata[i] = Number(result[i]); } //initialize the chart var tittle = document.getElementById('chart1').title; ch1 = new myGraph(mydata, 'chart1', tittle, "tab-1"); return mydata; });*/ //window onload for index page window.onload = function () { //initialize event listeners for the tabs var myTabs = document.getElementsByClassName("t"); for (var i = 0; i < myTabs.length; i++) { myTabs[i].addEventListener("click", tabsAction); } mydata = [7596, 7887.8, 7744.7, 7318.8, 7263.3, 7779.1, 7921.4, 7747.8, 7650.9, 7684.2, 7439.7, 7257.9, 7713.6, 5948.1, 0, 7393.0, 7082.6, 7178.9, 7581.4, 7599.8, 7501.1, 7476.0, 7536.5, 7159.4, 7141.3, 7141.3]; // s1 = [12, 34, 56, 23, 10, 24, 56, 76, 33, 24, 56, 23]; var tittle = document.getElementById('chart1').title; ch1 = new myGraph(mydata, 'chart1', tittle, "tab-1"); };
The code above is core code for the webpage, there are a lot of supplemental
files which are not described here, please see attachments for the full code.
50
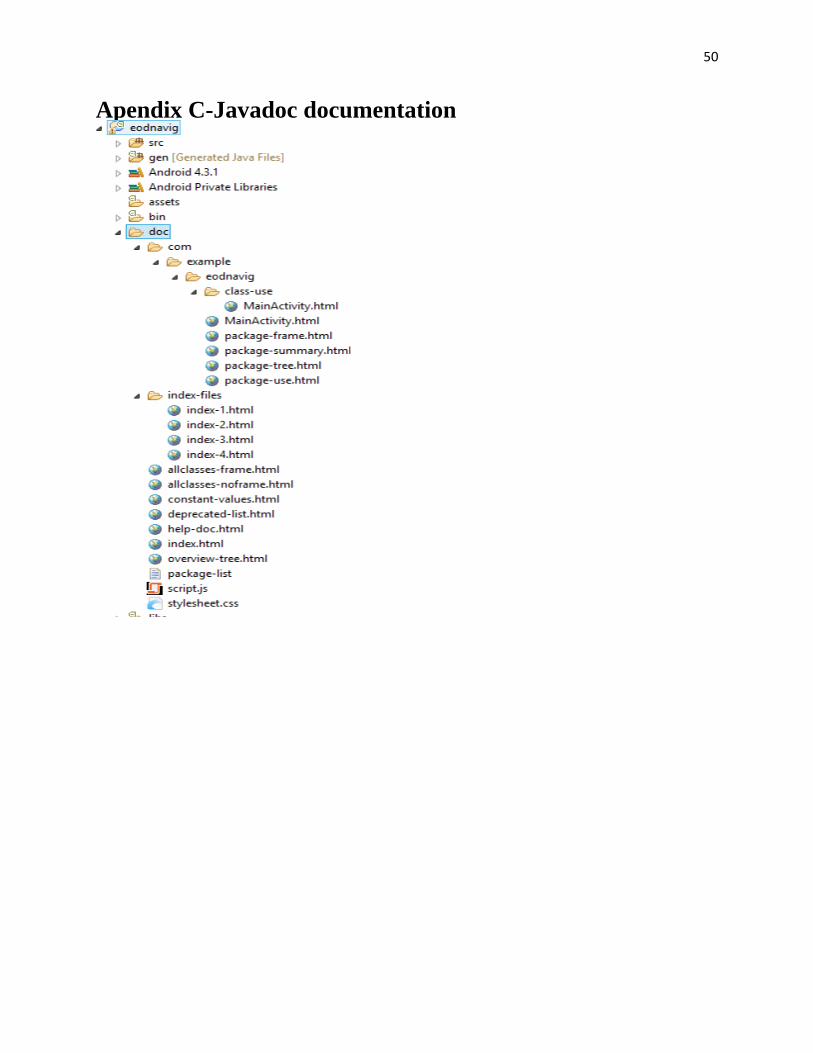
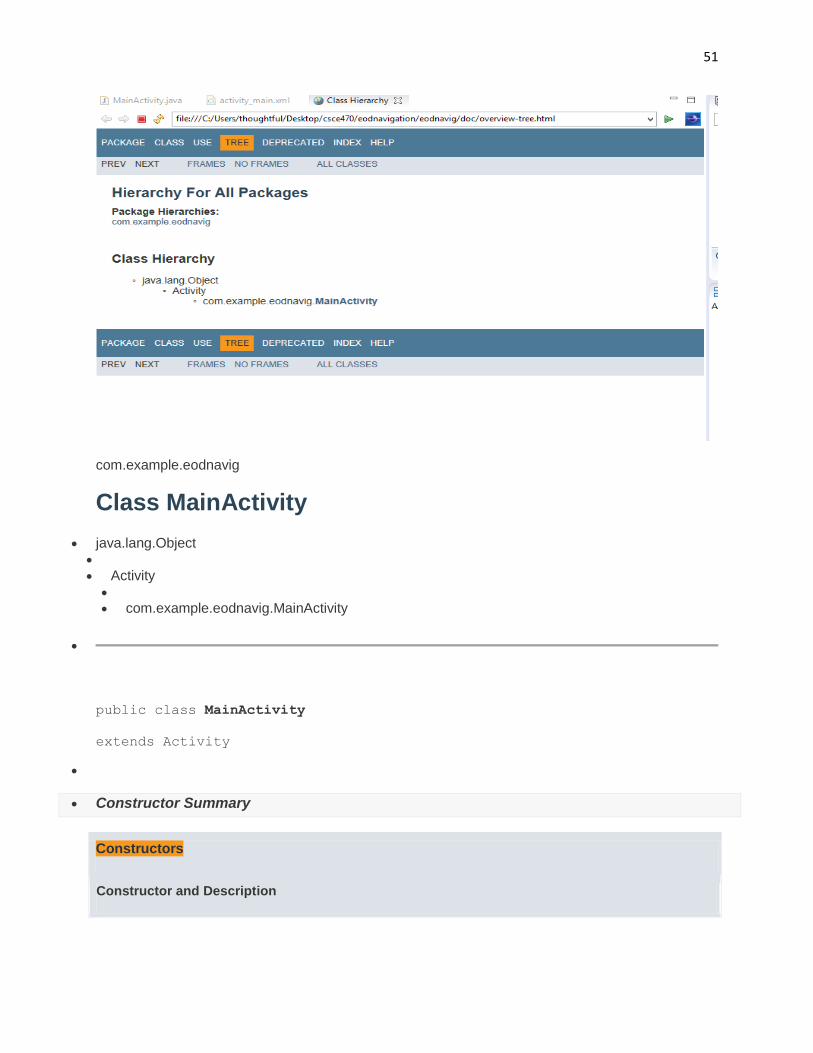
Apendix C-Javadoc documentation
51
com.example.eodnavig
Class MainActivity
java.lang.Object Activity
com.example.eodnavig.MainActivity
public class MainActivity
extends Activity
Constructor Summary
Constructors
Constructor and Description

52
MainActivity()
Method Summary
All MethodsInstance MethodsConcrete Methods
Modifier and Type Method and Description
void displayWifiNetworks(WifiManager wifi,
ListView listView)
boolean onCreateOptionsMenu(Menu menu)
boolean onOptionsItemSelected(MenuItem item)
void onStop()
Methods inherited from class java.lang.Object
equals, getClass, hashCode, notify, notifyAll, toString, wait, wait, wait
Constructor Detail
MainActivity
public MainActivity()
Method Detail
onStop
public void onStop()
onCreateOptionsMenu
public boolean onCreateOptionsMenu(Menu menu)
onOptionsItemSelected
public boolean onOptionsItemSelected(MenuItem item)
displayWifiNetworks
public void displayWifiNetworks(WifiManager wifi,
ListView listView)