Embed Size (px)
Citation preview
Network Science 1 (2): 125–153, 2013. c© Cambridge University Press 2013
doi:10.1017/nws.2013.6
125
Engineering social contagions: Optimalnetwork seeding in the presence of homophily
S INAN ARAL
MIT Sloan School of Management, 100 Main Street, Cambridge, MA 02139, USA
(e-mail: [email protected])
LEV MUCHNIK
Hebrew University of Jerusalem School of Business Administration, 5102b, Jerusalem, Israel 91905
(e-mail: [email protected])
ARUN SUNDARARAJAN
NYU Stern School of Business, 44 West 4th Street Room 8-93, New York, NY 10012, USA
(e-mail: [email protected])
Abstract
We use data on a real, large-scale social network of 27 million individuals interacting daily,
together with the day-by-day adoption of a new mobile service product, to inform, build, and
analyze data-driven simulations of the effectiveness of seeding (network targeting) strategies
under different social conditions. Three main results emerge from our simulations. First,
failure to consider homophily creates significant overestimation of the effectiveness of seeding
strategies, casting doubt on conclusions drawn by simulation studies that do not model
homophily. Second, seeding is constrained by the small fraction of potential influencers that
exist in the network. We find that seeding more than 0.2% of the population is wasteful
because the gain from their adoption is lower than the gain from their natural adoption
(without seeding). Third, seeding is more effective in the presence of greater social influence.
Stronger peer influence creates a greater than additive effect when combined with seeding.
Our findings call into question some conventional wisdom about these strategies and suggest
that their overall effectiveness may be overestimated.
Keywords: peer influence, social contagion, social networks, viral marketing, information systems,
simulation
1 Introduction
Firms and policymakers are increasingly recruiting customers to take part in word-
of-mouth (WOM) marketing campaigns. Seeding or network targeting has emerged
as the primary marketing strategy designed to leverage the WOM effect (Domingos
& Richardson, 2001; Lazarsfeld et al., 1948; Valente & Davis, 1999) (for an
excellent review of Network Interventions, see Valente, 2012). Seeding seeks to
convert influential individuals who are expected to use their social network position,
personal influence, and broad peer contacts to trigger cascades of product adoption.
A variety of different seeding strategies have been proposed, such as those that
target hubs or dense regions of the network, and many programs are beginning to
https://www.cambridge.org/core/terms. https://doi.org/10.1017/nws.2013.6Downloaded from https://www.cambridge.org/core. IP address: 65.21.228.167, on 25 Jan 2022 at 10:48:31, subject to the Cambridge Core terms of use, available at
126 S. Aral et al.
harness the power of these strategies.1 However, little is known about their relative
effectiveness. In particular, we know little about how different seeding strategies
perform under different social conditions. For example, different levels of peer
influence or homophily in a diffusion process may affect the relative performance of
different network seeding policies.
Today’s state-of-the-art viral marketing simulations typically consider social
network structures derived from random or small world graphs rather than real
networks, and do not incorporate empirically observed distributions of adoption
propensities, correlations between individuals’ personal and network characteristics,
or similarities among connected network neighbors (homophily) (Abrahamson &
Rosenkopf, 1997; Centola & Macy, 2007; Goldenberg et al., 2001; Kempe et al., 2003;
Kitsak et al., 2010; Liben-Nowell & Kleinberg, 2008; Van den Bulte & Joshi, 2007).
All of these factors are known to have profound impacts on diffusion dynamics
and the causal mechanisms driving adoption (Aral et al., 2009). Unconstrained
by data, different modeling assumptions generate differing conclusions, creating
disagreement about the efficacy of different seeding strategies (e.g. Watts and Dodds,
2007; Gladwell, 2000).
Empirical work on the other hand, which estimates WOM using observational
data or randomized experiments, is more realistic but rarely analyzes global diffusion
outcomes or multiple competing intervention strategies (Aral et al., 2009; Aral &
Van Alstyne, 2011; Aral & Walker, 2011; Bakshy et al., 2012a; Bakshy et al.,
2012b; Centola, 2010, Centola, 2011; Eagle et al., 2010; Leider et al., 2009; Leskovec
et al., 2007; Sun et al., 2009; Taylor et al., 2013). Single marketing actions are
assessed in isolation to maintain precision and experimental control and typically
only immediate neighbor effects are estimated. As a result, most empirical studies
can only make bounded generalizations about the global effects of seeding.
In this paper, we complement and extend current work on seeding strategies by
combining the flexible but abstract simulation-based approach with the more realistic
but limited empirical approach. We use data on a real, large-scale social network
of 27 million individuals interacting daily, together with detailed observations of
the same individuals’ demographic and personal characteristics and online browsing
behaviors, and their day-by-day adoption of a new mobile service product, to
inform, build, and analyze data-driven simulations of the effectiveness of WOM
marketing strategies under different social conditions. We employ this framework to
explore “what if” scenarios representing a series of seeding strategies under different
assumptions about the level of influence and homophily in the system. Data-driven
simulations are a useful way to gauge the likely effects of firm policy. However, few
data-driven simulations of networked interventions exist and none examine seeding
under varying levels of homophily and influence.
Three main results emerge from our simulations. First, failure to consider ho-
mophily creates significant overestimation of the effectiveness of different seeding
strategies. We find that systems with empirically observed amounts of homophily
experience 30% less adoption from WOM than identical systems without homophily,
1 One mainstream example is SponsoredTweets, which connects firms to influential users of Twitter.comso they can be paid to tweet about products (see http://sponsoredtweets.com/). Another example isthe Klout Perks program, which gives free products to people assessed as “influential.”
https://www.cambridge.org/core/terms. https://doi.org/10.1017/nws.2013.6Downloaded from https://www.cambridge.org/core. IP address: 65.21.228.167, on 25 Jan 2022 at 10:48:31, subject to the Cambridge Core terms of use, available at
Engineering social contagions 127
casting doubt on conclusions drawn by simulation studies that do not model
homophily.
Second, seeding is constrained by the small fraction of potential influencers that
exist in the network. We find that even when the most influential individuals are
targeted, seeding more than 0.2% of the population is wasteful because the gain
from their adoption, in adoptions triggered by their conversion, is lower than the
gain from their natural adoption (without seeding).
Third, seeding is more effective in the presence of greater social influence. Stronger
influence creates a greater than additive effect when combined with seeding. Though
the complementary effect is relatively small, the interaction between influence and
seeding is complex. High degree individuals are more likely to be early adopters
in systems with significant peer influence because their degree exposes them to
natural influence early on in the diffusion process. This effect creates diminishing
marginal complementarities between seeding and influence as influence increases. We
investigate these effects and discuss their implications for marketing and networked
interventions.
Our findings call into question some of the conventional wisdom about the most
popular viral marketing strategies and suggest that their overall effectiveness may
be overestimated. Given the increasing availability of relevant data (Lazer et al.,
2009) empirically motivated simulations such as ours could contribute greatly to
our understanding of network marketing in the near future.2
2 Model design
2.1 Data
We began our investigation by collecting a longitudinal dataset that combines (i)
the global network of daily instant messaging (IM) traffic between 27.4 million
users of Yahoo.com with (ii) data on the day-by-day adoption of a mobile service
application launched in July 2007 (Yahoo Go),3 and (iii) robust and precise attribute
and dynamic behavioral data on users’ demographics, geographic location, mobile
device type and usage, and per-day page views of different types of content (e.g.
sports, weather, news, finance, and photo sharing) from desktop, mobile, and Go
platforms. Much of these data, such as mobile device usage and page views of
different types of content, provide fine-grained proxies for individuals’ tastes and
preferences. The complete set of covariates includes 40 time-varying and 6 time-
invariant individual and network characteristics. Taken together, the sampled users
of the IM network registered over 14 billion page views and sent 3.9 billion messages
over 89.3 million distinct relationships (for details about the service, the data, and
descriptive statistics, see the SOM and (Aral et al., 2009).
2 We have made the data publicly available directly through Yahoo!’s Webscope Programto encourage validation of our results and new empirical research on network intervention(http://webscope.sandbox.yahoo.com/). We intend to make the code for our simulations publiclyavailable as well. Note we are legally prohibited from releasing the data to anyone ourselves. All datainquiries should be addressed directly to Yahoo! through their Webscope Program.
3 The Yahoo Go mobile service application we studied is described in more detail in the SupplementaryOnline Material (SOM).
https://www.cambridge.org/core/terms. https://doi.org/10.1017/nws.2013.6Downloaded from https://www.cambridge.org/core. IP address: 65.21.228.167, on 25 Jan 2022 at 10:48:31, subject to the Cambridge Core terms of use, available at

128 S. Aral et al.
The data represent an anonymized sample of the Yahoo! IM network, where
each node is an IM user for whom we collected detailed demographic, geographic
and behavioral information as well as daily IM message traffic. We first sampled
all Yahoo! IM users who adopted Yahoo! Go between June 1, 2007 and October
29, 2007. This “seed experimental sample” consists of 532,365 users that we labeled
“service adopters.” We then created a “seed control sample” by taking a random
sample of 2% of the entire IM network. This “seed control sample” consists of
2,974,288 nodes that we labeled “random control seeds.” We executed a two-step
snowball sampling procedure which traversed network links, defined by the existence
of IM message traffic, two steps out from every control and experimental seed node,
collecting the complete local network neighborhoods of all seed nodes. The first
step of the snowball sampling procedure yielded 9.1 million new nodes that were
IM contacts of the seed node populations (“first-step nodes”). We then collected the
local networks of all first-step nodes by sampling all users who received at least one
message from them. The second step of the snowball sampling procedure yielded an
additional 14.9 million users two steps away from a seed node.
2.2 Modeling product adoption
Recent analytical models of peer influence that consider network structure (Galeotti
& Goyal, 2009; Goyal et al., 2010; Sundararajan, 2008) are better able to explain
observed behavioral diffusion patterns than early models that do not consider
interpersonal interaction (Chatfield & Goodhardt, 1973; Uncles et al., 1995) or the
network structure of those interactions (Bass, 1969). However, more sophisticated
models that account for realistic, empirically observed network structures, and
distributions of individual characteristics over nodes have not yet been developed.
We used the data described in the prior section to develop and train such a
model of product adoption. We define a time-varying, individual-specific adoption
propensity measure for each consumer. This is akin to an adoption probability
or perceived value; the higher this measure, the more likely a consumer is to
adopt the product. This propensity is a function of two concurrent factors that
drive adoption: characteristic-based preferences and peer influence. This partition
is broadly motivated by the widely used Bass diffusion model (Bass, 1969), which
describes the process of new product adoption as a population-level interaction
between users and potential users that is governed by an innovation rate driving
product adoption by the population independent of installed base, and an imitation
rate that drives an increase in product adoption as a linear function of the installed
base. Correspondingly, in our formulation, characteristic-based adoption describes
a consumer’s propensity to adopt the product as a function of their individual
characteristics. Peer influence then incorporates the influence of an individual’s
peers on their adoption propensity. The overall propensity of a user to adopt the
product is the sum of their propensity to adopt as determined by their characteristics,
and their propensity to adopt as determined by their peers:
PAit = PCH
it + P Iit , (1)
where PAit is the overall propensity that user i will adopt the product at time t, PCH
it
is the propensity that user i will adopt the product at time t due to their individual
https://www.cambridge.org/core/terms. https://doi.org/10.1017/nws.2013.6Downloaded from https://www.cambridge.org/core. IP address: 65.21.228.167, on 25 Jan 2022 at 10:48:31, subject to the Cambridge Core terms of use, available at
Engineering social contagions 129
characteristics, and P Iit , the propensity that user i will adopt the product at time t
owing to the aggregated peer influence of i’s immediate neighbors at time t. The
linear composition of the probabilities does not necessary imply independence of
PCHit and P I
it since, as we consider later, susceptibility to peer influence may depend
on the propensity to adopt spontaneously due to individual characteristics (Schmitt
et al., 2011).
We use logistic regression to estimate the characteristic-based propensity of an
individual to adopt the product at time t as a function of their own characteristics:
PCHit =
exp(z)
1 + exp(z), z = β0 +
∑k
βkxikt + εit, (2)
where xit is a vector of 40 time-varying and 6 time-invariant user characteristics
that contains personal demographics characteristics, behavioral attributes such as
browsing behavior (a proxy for personal preferences for web-based content that
varies by subject and theme), local network measures, averages of users’ neighbors
characteristics, and distance from a seed node (see SOM for a full description of the
estimation strategy and results).
We then model peer influence as diffusing through the structure of observed IM
communication. Given the similarity between the product facilitating IM commu-
nication and the product being adopted (Yahoo Go) (both require authentication
with the same firm and complement each other), we assume that the IM network
closely resembles the underlying social network conveying WOM about the product.
This assumption is supported by the strong correlations in product adoption and
observable characteristics among connected peers and that IM communication and
individual characteristics are good predictors of product adoption (Aral et al., 2009).
Specifically, i’s propensity to adopt due to peer influence is given by:
P Iit =
∑j∈Ni
wijtyjt−1Ijit, (3)
where Ni is the set of network neighbors j of node i, wijt is the tie strength of i and
j at time t, measured by the number of instant messages exchanged between them,
yjt−1 is the adoption status of j at time t-1 (where yjt−1 = 1 if j has adopted the
product in the previous period t-1 and is 0 otherwise), and Ijit is an influence factor
that describes the magnitude of j’s influence on i’s adoption decision at time t. One
might think of the product of wijt and Ijit as being a time-varying, dyad-specific
version of the static, population-level imitation rate of the Bass diffusion model.
We assume that a potential adopter may only be influenced by prior adopters
(when yjt−1 = 0, the influence term goes to zero for that peer). While this assumption
is not conceptually necessary and can be relaxed without loss of generality, it is quite
reasonable. We make product adoption a prerequisite for peer influence because
observational learning is unlikely unless a peer has adopted the product. Prior
experience with the product is likely correlated with an adopter’s desire to discuss the
product with friends as well as their friends’ likelihood of finding such discussions
persuasive. This restriction is common in social contagion research (Aral, 2011;
Iyengar et al., 2011) and most studies find that local social environments encourage
a behavior only after that behavior becomes prevalent in the environment (Whyte,
1954). In addition, behavioral correlations in networks are typically short-ranged
https://www.cambridge.org/core/terms. https://doi.org/10.1017/nws.2013.6Downloaded from https://www.cambridge.org/core. IP address: 65.21.228.167, on 25 Jan 2022 at 10:48:31, subject to the Cambridge Core terms of use, available at
130 S. Aral et al.
and do not exceed two hops (Christakis & Fowler, 2007), meaning the likelihood
of the friend of a friend of an adopter being influenced by the original adopter’s
decision (without the friend adopting) is low. The precise functional form of peer
influence Ijit, the contribution of adopter friend j to i’s propensity to adopt at time t,
is the subject of different modeling assumptions throughout the paper, as described
in detail in the rest of this section.
We convert the adoption propensity into a single composite probability of adoption
per user per time period. It is important to note that in our simulations we use
this as a “single trial” probability of adoption. An alternative, which follows the
approach used in epidemiological models (Barthelemy et al., 2004; Pastor-Satorras
& Vespignani, 2001), might instead assume that each peer generates an independent
adoption trial with probability wijtyjt−1Iijt, and if consumer i has k adopting peers
at time t, their adoption outcome is thus determined by k+1 independent trials. This
alternative represents an interesting direction for future research.
Our different functional forms for peer influence are motivated by a common belief
that firms can affect the peer influence mechanisms at work in a population (Buttle,
1998) and that peer influence may naturally vary depending on the characteristics
of the product and the social environment in which adoption is occurring (Aral &
Walker, 2011). Specifically, a firm may encourage current adopters to exert more
influence on their peers (Godes & Mayzlin, 2009) or alternatively may increase
the susceptibility of potential customers to the influence of their peers (Aral &
Taylor, 2011); some firms may choose to do both. We therefore isolate and test
two families of plausible peer influence mechanisms in realistic product diffusion
scenarios—one which assumes that influence is driven by the persuasion of adopters’
and another which assumes that influence is instead driven by the susceptibility to
influence of adopters’ peers (Aral & Walker, 2012). These two influence mechanisms
capture the ongoing debate about whether influentials or masses of susceptible con-
sumers drive contagion (Gladwell, 2000; Katz & Lazarsfeld, 1955; Watts & Dodds,
2007).
As a baseline, we assume a persuasion-driven peer influence mechanism (Buttle,
1998) frequently used by researchers to model the diffusion of product adoption
(Biyalogorsky et al., 2008; Buttle, 1998). The persuasion model assumes that a user’s
excitement about the product is proportional to their intrinsic likelihood of adoption
as a function of their own characteristics and preferences PCHit . The tendency to
adopt the product due to one’s own characteristics and preferences is correlated
with user satisfaction, which is in turn correlated with the likelihood of engaging in
positive WOM and thus persuasion. In other words, those who prefer the product
more are more likely to talk about it.
We also incorporate a second influence mechanism which assumes that the
susceptibility to influence is proportional to one’s intrinsic likelihood of product
adoption as a function of one’s own characteristics and preferences. This approach
assumes that those who are likely to be interested in the product are more likely
to listen to and be persuaded by positive WOM. Thus, the influence term is a
weighted sum of one’s friends’ and one’s own likelihood of adopting the product
due to personal characteristics and preferences, scaled by γ. As γ increases, the
persuasion of an adopter (which is proportional to their adoption likelihood)
increases. As γ decreases, the susceptibility to peer influence of adopters’ friends
https://www.cambridge.org/core/terms. https://doi.org/10.1017/nws.2013.6Downloaded from https://www.cambridge.org/core. IP address: 65.21.228.167, on 25 Jan 2022 at 10:48:31, subject to the Cambridge Core terms of use, available at
Engineering social contagions 131
(which is proportional to their adoption likelihood) increases:
Ijit = κ[(1 − γ) · (
PCHjt
)+ γ · (
PCHit
)]. (4)
The overall amount of influence in the system is then scaled by κ, the magnitude of
the effect of peer influence on the likelihood of adoption. Thus, the influence of j on
i at time t is given by:
P Iit = κ
∑j∈Ni
wijtyjt−1
[(1 − γ) · (
PCHjt
)+ γ · (
PCHit
)]. (5)
In order to establish the effect of seeding under different social conditions, we
must first empirically estimate the amount of observed peer influence in the
system. In general, a firm can estimate natural peer influence through a series of
controlled randomized experiments designed to separate influence from homophily
and characteristics-based adoption (Aral & Walker, 2011; Aral & Walker, 2012;
Centola, 2010, Centola, 2011). Alternatively, methods such as dynamic propensity
score matching can estimate the amount of natural peer influence in the system
(Aral et al., 2009). To separate influence from homophily and other confounds,
we created a dynamic matched sample of “treated” and “untreated” nodes over
time, where receiving varying degrees of the “treatment” is defined as having 1, 2,
3, 4, or more friends who adopted the product. We matched treated nodes with
untreated nodes that were as likely to have the same number of adopter friends,
conditional on a vector of observable characteristics and behaviors, but who did
not have as many adopter friends. Conditioning matches on a vector of observable
characteristics, behaviors, and attributes yields influence estimates that account for
the homophily that may make product adoption decisions cluster in the network
even if no influence exists (for complete details of the procedure, see SOM and Aral
et al. (2009)).
Combining estimates of characteristics-based adoption, estimated using propensity
score matching, with peer influence yields the following general expression for the
propensity of user i to adopt the product at time t:
PAit (x, w, y, κ, γ) =
(exp
(β0 +
∑k βkxikt
)1 + exp
(β0 +
∑k βkxikt
))
+ κ∑j∈Ni
wijtyjt−1
[(1 − γ) · (
PCHjt
)+ γ · (
PCHit
)]. (6)
The probability of i’s adoption at time t can then be generated by an appropriate
rescaling of the adoption propensity PAit (x, w, y, κ, γ). Given the manner in which we
estimate PCHjt to begin with using Equation (2), as an actual estimated probability
of adoption from our data, we rescale the propensity measure by asserting a cutoff:
the probability of adoption is max{1, P Ait (x, w, y, κ, γ)}. This places an upper bound
on the extent to which one’s peers might increase one’s propensity to adopt. Relative
to the natural alternative of proportional normalization, this approach preserves
the information inferred from our network data more effectively. It also combines
aspects of a threshold model with those of a probabilistic model—we are asserting
that if an individual’s propensity to adopt is greater than a threshold, they will
https://www.cambridge.org/core/terms. https://doi.org/10.1017/nws.2013.6Downloaded from https://www.cambridge.org/core. IP address: 65.21.228.167, on 25 Jan 2022 at 10:48:31, subject to the Cambridge Core terms of use, available at
132 S. Aral et al.
adopt with certainty, and if it is lower than this threshold, they will adopt with some
probability less than one.
In the next several sections, we describe our models of seeding. By varying γ from
0 to 1, we examine the effects of seeding under varying assumptions about the degree
to which influence or susceptibility to influence drives product adoption. We vary the
degree to which adopters promoting the product to peers (γ = 0) or alternatively the
susceptibility of potential adopters to peer influence (γ = 1) drive product adoption.
Modeling persuasion and susceptibility in this way allows us to test their relative
effects on seeding but does not necessarily imply that the two processes tradeoff.
We model simultaneous increases in susceptibility and persuasion by increasing the
overall level of influence (κ). We conclude with an investigation of the effectiveness
of seeding under varying assumptions about the level of influence in the system and
whether that influence operates primarily through the persuasion of adopting peers
(γ = 0) or the susceptibility of friends of adopters to peer influence (γ = 1).
2.3 Modeling network seeding strategies
Katz and Lazarsfeld (1955) suggested that the opinions of the majority may be
shaped by a small subset of influential individuals who filter and reinterpret the
mass media. Since then, research has actively investigated seeding strategies that
attempt to identify and convert these influential individuals (Galeotti & Goyal,
2009; Goldenberg et al., 2009; Iyengar et al., 2011; Marsden, 2006; Rosen, 2009;
Valente & Davis, 1999; Van den Bulte & Joshi, 2007; Watts & Dodds, 2007). Some
argue that opinion leaders typically have high degree and occupy central positions in
social networks (Becker, 1970). In recent years, as large-scale network data became
available and typical network structures were explored (Barabasi, 2002; Newman,
2003), the view that central hubs with high degree were the most influential in
generating information cascades received substantial support from several domains
(Cohen et al., 2001; Dezso & Barabasi, 2002; Pastor-Satorras & Vespignani, 2001). A
frequent approach in simulation models of WOM marketing ties individuals’ degree
to the amount of influence they are likely to generate (Libai et al., 2009).
We test a number of such seeding strategies and assess their effect on contagion in
a realistic population. In devising seeding strategies, firms rank users according to a
set of assumptions linking personal or network attributes to the ability to generate
WOM influence and then designate how many individuals to target. The firm would
then target the selected users to receive the product, for example in an email with
a download link, in effect seeding their adoption. We explore each seeding strategy
by varying assumptions about influence along dimensions proposed in the literature
and by manipulating the fraction of the population that is targeted. We compare
the simulated results of each strategy to the baseline simulation of no seeding which
relies on the observed natural product diffusion dynamics of Yahoo Go.
Random seeding. We start with a naıve approach that targets random individuals.
Firms occasionally launch marketing campaigns that, to a first approximation,
are equally likely to reach every person in the population. This approach is easy
to implement and does not require any knowledge of the underlying network. By
seeding randomly, the firm expects to occasionally hit an influential individual whose
WOM contribution will justify the advertising investment by triggering a substantial
https://www.cambridge.org/core/terms. https://doi.org/10.1017/nws.2013.6Downloaded from https://www.cambridge.org/core. IP address: 65.21.228.167, on 25 Jan 2022 at 10:48:31, subject to the Cambridge Core terms of use, available at
Engineering social contagions 133
adoption cascade. While we do not expect this approach to yield impressive results,
we recognize its value as a baseline case. Other researchers have also used the
performance of random seeding as a baseline against which to evaluate more
efficient strategies (Libai et al., 2009). To model this strategy, we simply rank nodes
randomly and choose a fraction of the population to target.
Highest degree. The second approach assumes that the number of adoptions
induced by an individual is correlated with their network degree. More people are
likely to be exposed to peer influence from high-degree adopters. Some research
supports the claim that high network degree is a reliable indicator of ability to
influence (Libai et al., 2009). Given that typical social networks are characterized
by highly skewed degree distributions (Barabasi, 2002; Newman, 2003), it is not
surprising that a significant portion of the population are in contact with one of the
hubs and can be exposed to influence by their conversion. Individuals with many
friends are thought to be particularly gregarious, active, and persuasive (Marsden,
2006; Rosen, 2009). Those with the personality to be opinion leaders also tend to
assume central network positions (Freeman, 1979; Valente & Davis, 1999).
The role of highly connected individuals has been tested in a large number of
networks ranging from sexual contact networks used to model the spread of diseases
(Barthelemy et al., 2004; Pastor-Satorras & Vespignani, 2001), to the Internet (Cohen
et al., 2001), to terrorist networks (Krebs, 2002). A number of models also test the
role of hubs in the diffusion of new products (Goldenberg et al., 2009). The increasing
interest in hubs as ideal targets in network marketing is justified by their potential
to influence a significant fraction of the population and because finding them is
cheap. As hubs can be found using local network measures such as degree, firms
do not need to collect complete network data or detailed personal characteristics. A
sample of user degrees is relatively easy to obtain. For example, even random walk
sampling is biased toward highly connected nodes and can be used to effectively
collect information about hubs (Borgatti, 2005; Rosvall & Bergstrom, 2008). To
model this strategy, we simply rank nodes by their degree and choose a fraction of
the population to target.
Dense regions. An arguably more efficient way to reach more people is to target
those who can reach the maximum number of users in two steps. This approach
avoids seeding high degree nodes in unconnected components or sparsely populated
areas of the graph and ensures that targets are located in the core of the network
rather than on its periphery. Kitsak et al. (2010) find that users connected to a
large number of well-connected individuals may have a particularly significant role
in information diffusion. They simulate the diffusion of a contagious disease in a
number of social networks and find that the most efficient spreaders are the users
in the innermost k-core, rather than simply those connected to a large number of
peers. To test this strategy, we rank nodes by the maximum number of unique nodes
they can reach in two hops and choose a fraction of the population to target.
Hubs unlikely to adopt. Another strategy targets hubs that are unlikely to adopt
on their own (i.e. nodes exhibiting relatively high degree and lowPCH ). Evidence
suggests that highly connected influentials are themselves more likely to be exposed
to outside influence and to adopt naturally (Becker, 1970). Hubs may also adopt
earlier simply because they are more likely to be exposed to the product due to their
high degree (Dover et al., 2009; Goldenberg et al., 2009). However, a large fraction
https://www.cambridge.org/core/terms. https://doi.org/10.1017/nws.2013.6Downloaded from https://www.cambridge.org/core. IP address: 65.21.228.167, on 25 Jan 2022 at 10:48:31, subject to the Cambridge Core terms of use, available at
134 S. Aral et al.
of product adoption in our data is driven by spontaneous characteristics-based
adoption and not by peer influence. Furthermore, hubs that are unlikely to adopt
as a function of their own characteristics tend to be surrounded by users that are
also unlikely to adopt because networks are homophilous. This further reduces the
likelihood that this type of hub will adopt through contagion. On the other hand,
seeding such individuals may affect a larger number of users that would otherwise
not be exposed to the product because these hubs are located in areas of the network
that are less likely to adopt. Whether this strategy works in practice is therefore an
interesting question which we attempt to answer through simulation.
Formally, we compute this rank by assigning a score Si to each node which
represents their fitness to the criteria described:
Si = log(Rdi
)+ log
(RPCH
i
). (7)
Here, Rdi is the rank of the individual in descending degree order (e.g. Rd
i = 1
is the individual with the highest degree) and RpCH
i is the rank of the individual
ordered by their estimated propensity to adopt spontaneously due to their individual
characteristics (RPCH
i = 1 represents the individual with the lowest PCHi in the
network). Once the score is computed, the nodes are ranked in ascending order. The
ranks are log transformed because degree and PCHi distributions are highly skewed
and roughly power law.
2.4 Modeling variation in influence
To model the effects of variation in influence (Ijit), we allow the parameters κ and
γ to vary and evaluate the effects of such variation on product diffusion and the
effectiveness of seeding. The influence of WOM generated by customers can vary
as a function of the characteristics of the product (e.g. the product’s popularity
or the degree to which the product exhibits network externalities). In addition, the
introduction of referral programs may stimulate adopters to convince their friends
to adopt (Libai et al., 2003). Referral programs provide monetary incentives to
adopters who encourage their friends to adopt and to potential adopters who are
referred by a friend. For example, the firm could offer a discount to consumers for
every friend they refer (Biyalogorsky et al., 2008; Buttle, 1998; Libai et al., 2003;
Reingen & Kernan, 1986; Schmitt et al., 2011). Alternatively, the firm could offer
an incentive to every new adopter who was referred by a friend (Aral & Taylor,
2011). Rather than encouraging persuasion by prior adopters, the program amplifies
the susceptibility of potential adopters to peer influence. As a result of variation
in product characteristics or firm incentive policies, influence can be driven by the
propensity for adopters to engage in WOM (γ = 0) or the propensity for friends of
adopters to be susceptible to peer influence generated by WOM (γ = 1). Persuasion
and susceptibility can also grow simultaneously: κ is assumed to grow with a natural
increase in peer influence or additional investments in marketing initiatives aimed at
generating positive WOM and peers’ susceptibility to positive WOM (Biyalogorsky
et al., 2008).
https://www.cambridge.org/core/terms. https://doi.org/10.1017/nws.2013.6Downloaded from https://www.cambridge.org/core. IP address: 65.21.228.167, on 25 Jan 2022 at 10:48:31, subject to the Cambridge Core terms of use, available at
Engineering social contagions 135
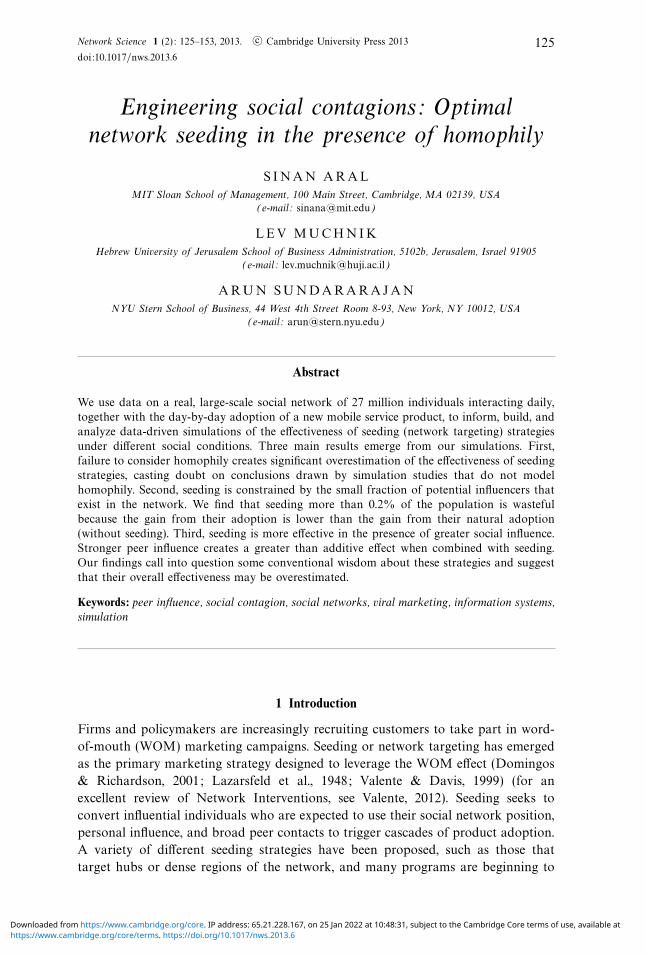
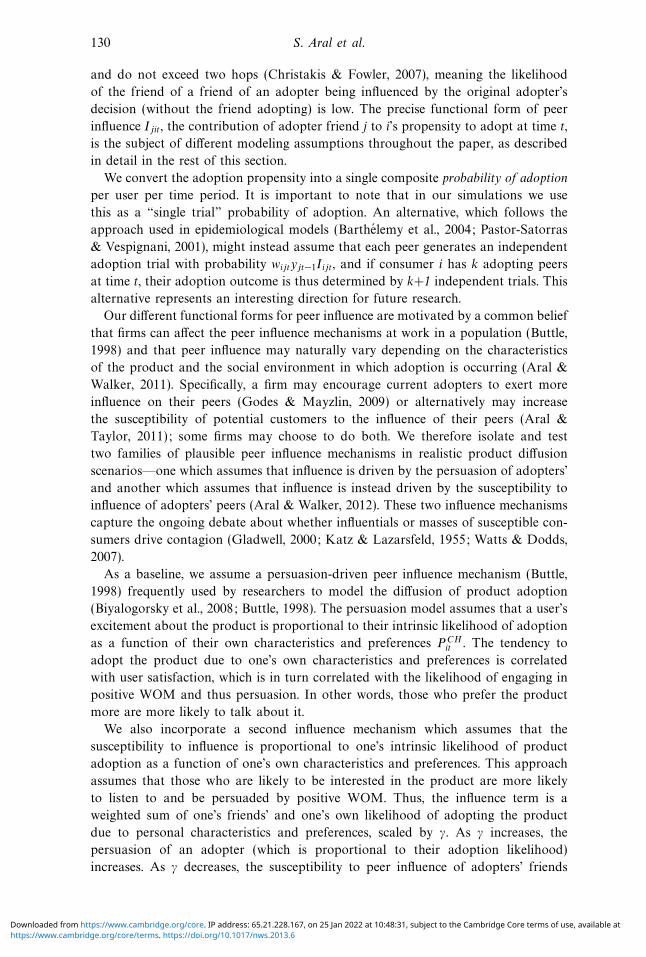
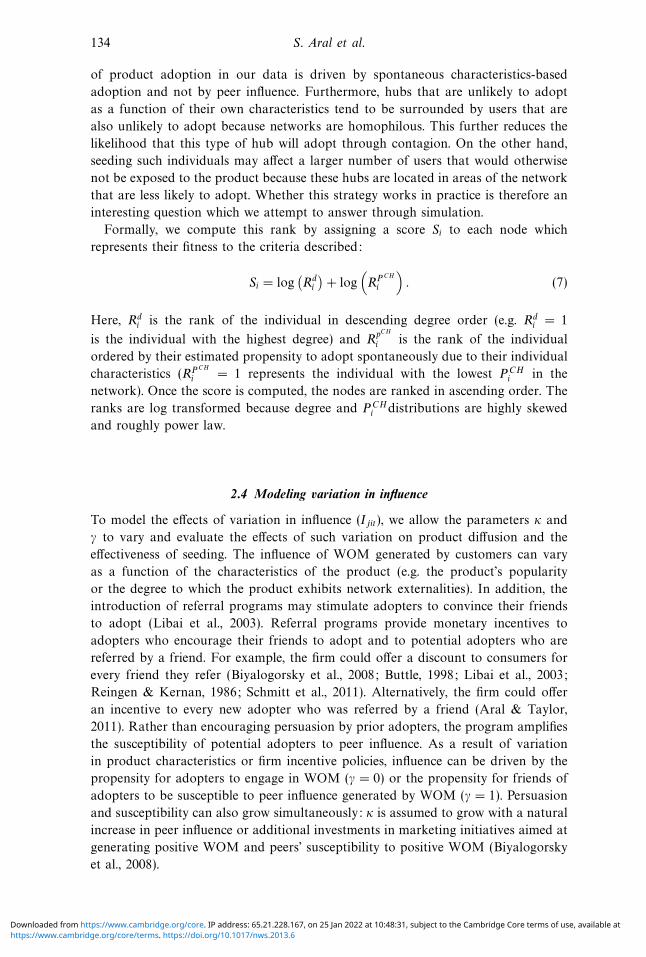
Fig. 1. Graphs of the adoption curve in the first five months since product launch. The
observed (a) and the reconstructed (b) fractions of the daily adopters in the entire population
are shown.
3 Results
3.1 Baseline results
When the dynamic matched sampling technique is applied to our data, we find that
at least 50% of Yahoo Go adoption can be explained by spontaneous characteristics-
based adoption (Aral et al., 2009). This estimate corresponds to κ ∼ 0.50 for the
interval in question. In other words, the amount of peer influence generated with the
excitement model (γ = 0) that approximates influence present in the observed data
is obtained when half of adopter peers’ own estimated propensity to adopt due to
individual characteristics (PCHjt ) is transferred as influence on each of her neighbors.
Using the baseline model described in Equation (6), data on the adoption of
Yahoo GO in the IM network and individuals’ personal characteristics and browsing
behaviors, we empirically estimated the propensity of product adoption of each user
in the Yahoo IM network over time (PAit ) as well as the likelihood of characteristic-
based adoption (PCHit ) and influence-based adoption (P I
it ). Figure 1 demonstrates
that our baseline model produces an accurate and precise reconstruction of the daily
adoption curve observed in the empirical data, giving us confidence in our modeling
approach.
The first simulation provides a baseline model against which all seeding simula-
tions are compared. The baseline simulations produce a distribution of spontaneous
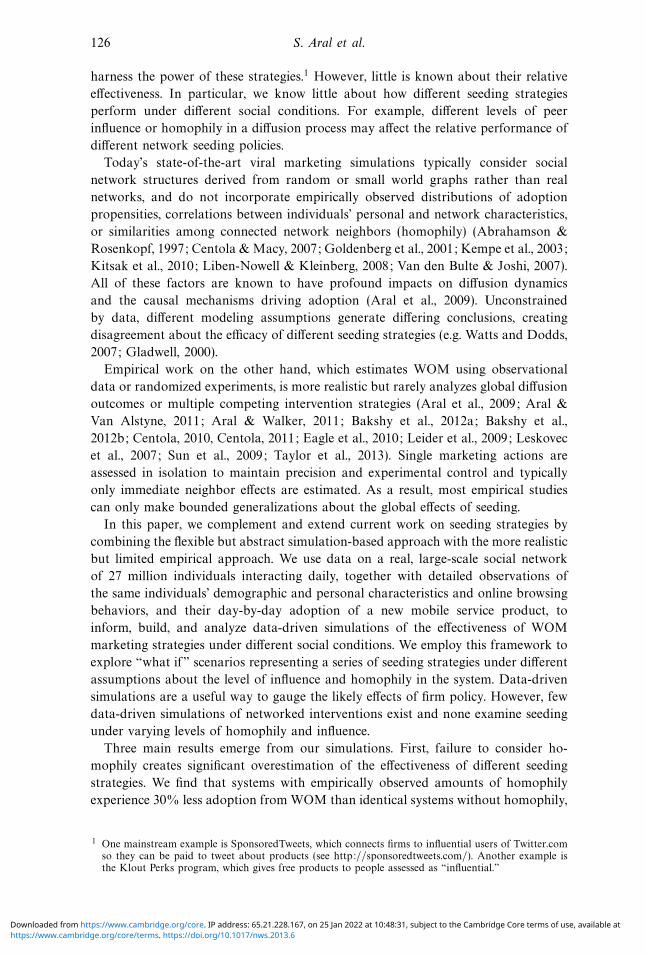
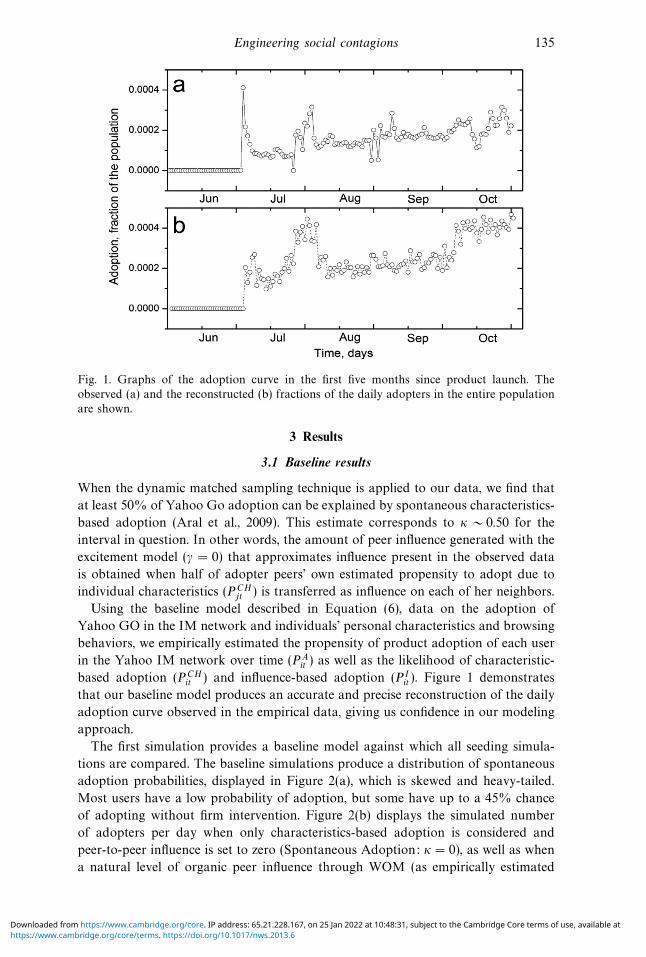
adoption probabilities, displayed in Figure 2(a), which is skewed and heavy-tailed.
Most users have a low probability of adoption, but some have up to a 45% chance
of adopting without firm intervention. Figure 2(b) displays the simulated number
of adopters per day when only characteristics-based adoption is considered and
peer-to-peer influence is set to zero (Spontaneous Adoption: κ = 0), as well as when
a natural level of organic peer influence through WOM (as empirically estimated
https://www.cambridge.org/core/terms. https://doi.org/10.1017/nws.2013.6Downloaded from https://www.cambridge.org/core. IP address: 65.21.228.167, on 25 Jan 2022 at 10:48:31, subject to the Cambridge Core terms of use, available at
136 S. Aral et al.
Fig. 2. (a) The distribution of spontaneous product adoption probabilities and (b) the
simulated number of adopters per day under natural adoption and natural adoption + organic
peer influence, κ = 0.5. The plot represents persuasion-driven peer influence mechanism
defined by γ = 0. (color online)
in the data) is included in the simulation by setting κ ∼ 0.5 (natural adoption +
estimated organic peer influence).
Without peer influence, the number of adopters per day declines steadily over time
(see Figure 2(b)). Users with the greatest propensity to adopt do so early on. Over
time the number of likely adopters in the population is exhausted, creating declining
numbers of adopters per day. When organic influence is considered, initial adopters
influence their friends and thus increase their probability of adoption, increasing the
number of adopters per day for approximately the first 100 days of the simulation,
after which saturation again sets in and those who are going to adopt do so until
available adopters are exhausted in the network. Two important insights emerge
from the baseline simulation: (1) peer influence increases the likelihood that peers
of adopters will adopt the product, boosting total adoption in the network, and
(2) adoption decreases over time as the consumer population becomes saturated.
In what follows, we alter this baseline model to simulate various firm interventions
and compare outcomes to evaluate the relative effectiveness of different seeding
strategies.
3.2 Evaluating network seeding strategies
To assess the effects of seeding, we first tested which of the four seeding strategies,
described in Section 2.3, were most effective in generating new adopters over the
baseline model of no seeding described in the previous section. We simulated
the Random, Highest Degree, Dense Regions, and Hubs Unlikely to adopt seeding
strategies over the Yahoo network and varied the fraction of the population targeted
to see which produced the greatest increase in product adoption over the baseline.
The results are shown in Figure 3, which plots the fraction of the population that
adopts the product under each seeding strategy (the y-axis) against the fraction of
the population that is seeded by a given strategy (the x-axis). Several interesting
insights emerge.
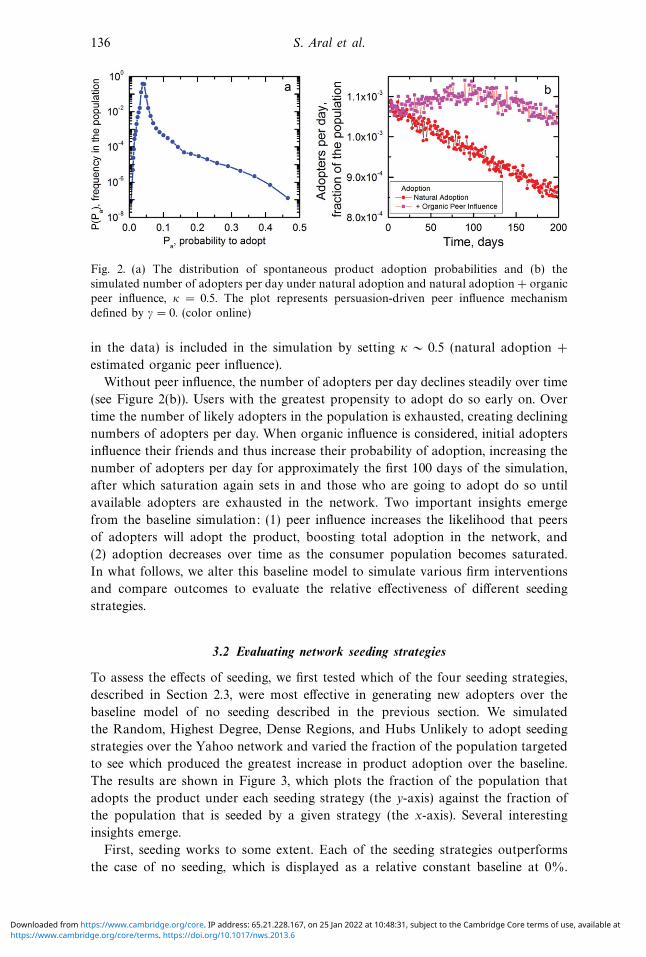
First, seeding works to some extent. Each of the seeding strategies outperforms
the case of no seeding, which is displayed as a relative constant baseline at 0%.
https://www.cambridge.org/core/terms. https://doi.org/10.1017/nws.2013.6Downloaded from https://www.cambridge.org/core. IP address: 65.21.228.167, on 25 Jan 2022 at 10:48:31, subject to the Cambridge Core terms of use, available at
Engineering social contagions 137
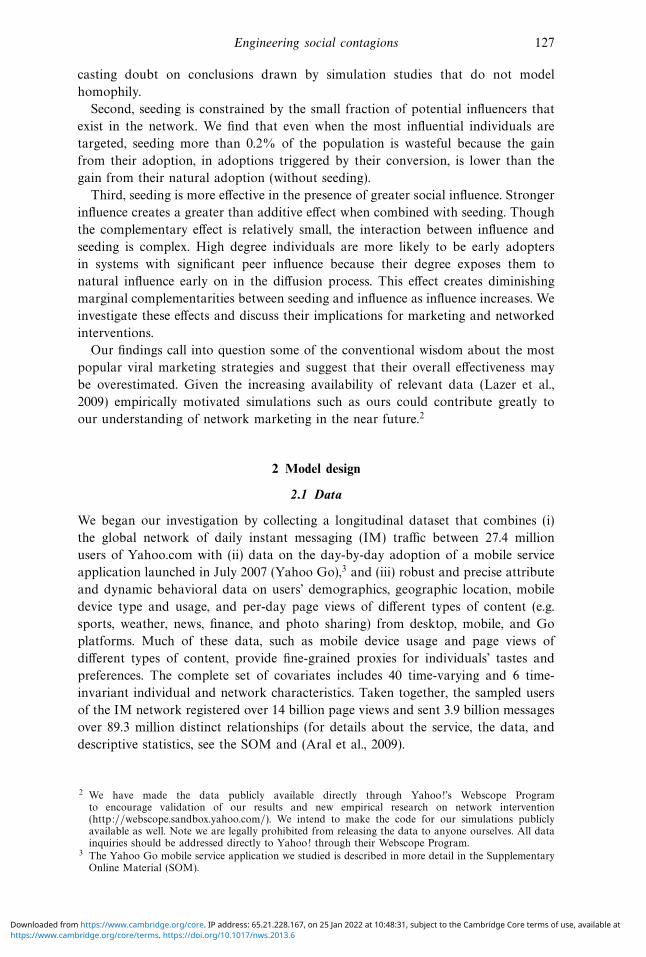
Fig. 3. The relative performance of the tested seeding strategies relative to “no intervention.”
The figure shows the fraction of the population that adopts the product due to application
of various degrees of seeding (x-axis). Lines represent different strategies as defined in the
text: random (cyan), highest degree (red), dense regions (green), and resisting hubs (blue).
The baseline represents adoption without intentional seeding. (color online)
However, the effect of seeding is small. The most effective seeding strategy achieves
at most a 0.4% increase in product adoption in the population even when the
optimal number of targets is selected. When compared to approximately 20% of the
entire population that adopts the product due to individual characteristics and an
organic level of peer influence during the same time period, the effect of seeding is
underwhelming. As we discuss below, there are several reasons why seeding has an
underwhelming effect. Most importantly, only a small fraction of the population is
influential enough to be worth seeding.
Second, the three more sophisticated strategies (Highest Degree, Dense Regions,
and Hubs Unlikely to Adopt), all outperform random seeding and produce relatively
similar results, with Highest Degree and Dense Regions performing the best. This
result corroborates previous work on the importance of degree in choosing targets
and reiterates the lack of benefit from more complex seeding strategies.
Third, there are diminishing and then negative returns to seeding more than the
optimal number of people. In other words, after a certain point, seeding more people
in the network reduces the fraction of the paying population that adopts the product.
All tested strategies exhibit clear performance maxima when approximately 0.2%
of the highly ranked individuals are targeted. We conducted additional analysis
to explore this result and better understand why there are such scope limits to
effective seeding. We first tested whether different assumptions about the influence
mechanisms at work in the population affect the results. Perhaps if persuasion is
https://www.cambridge.org/core/terms. https://doi.org/10.1017/nws.2013.6Downloaded from https://www.cambridge.org/core. IP address: 65.21.228.167, on 25 Jan 2022 at 10:48:31, subject to the Cambridge Core terms of use, available at
138 S. Aral et al.
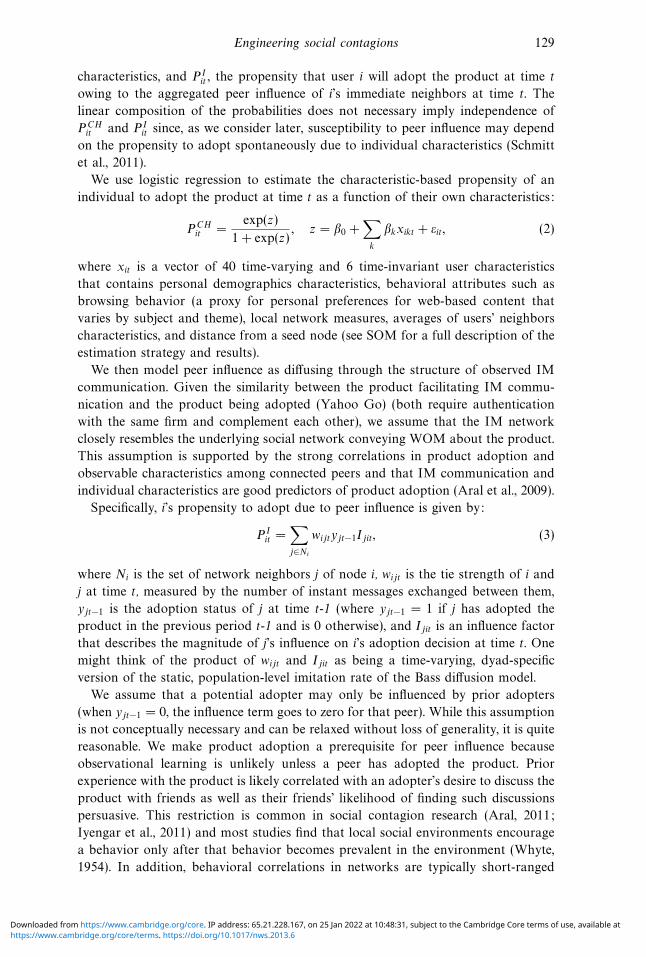
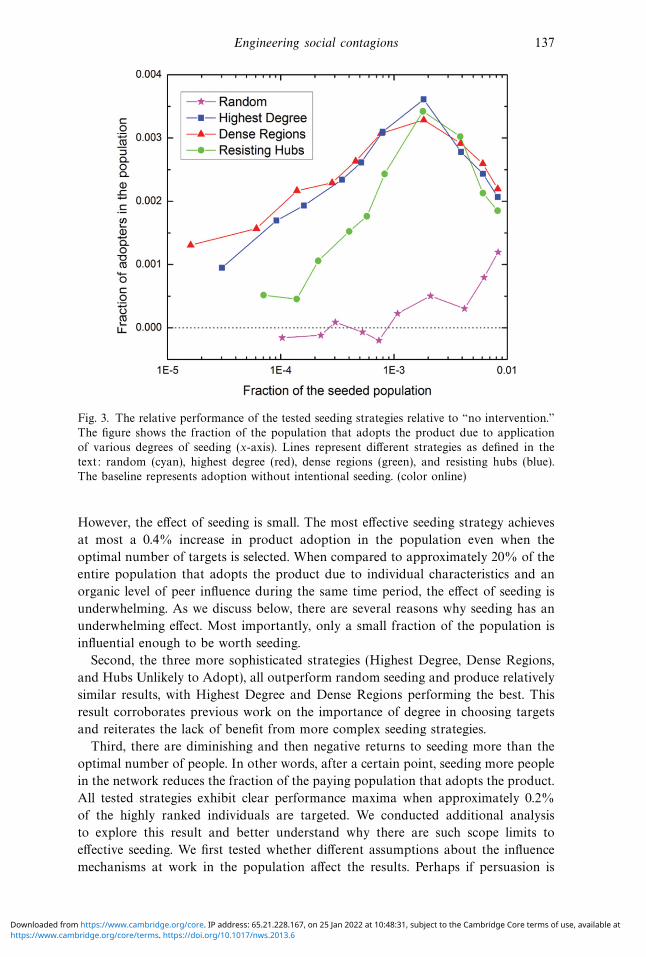
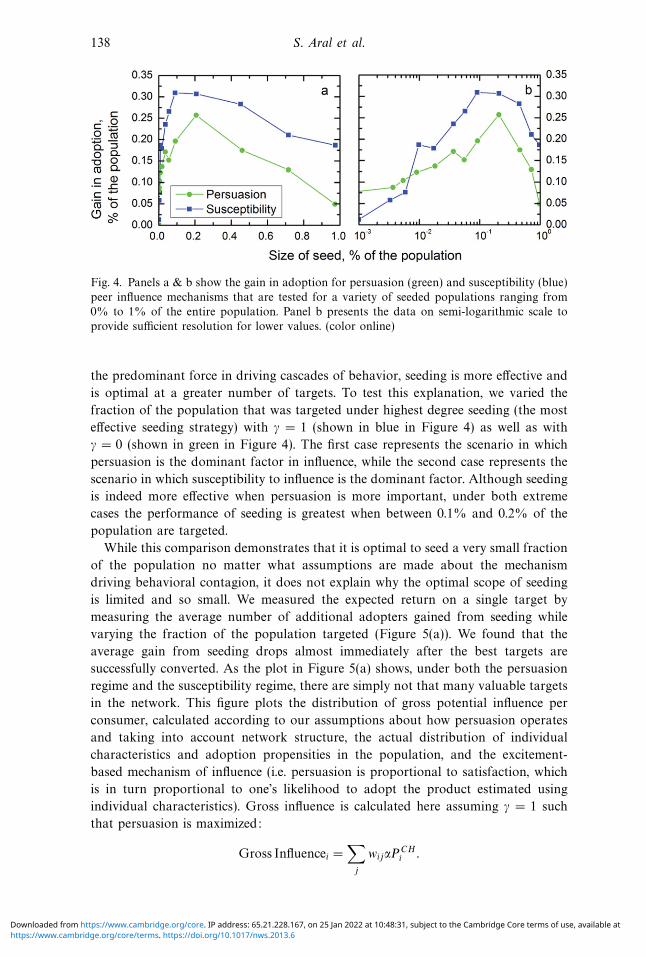
Fig. 4. Panels a & b show the gain in adoption for persuasion (green) and susceptibility (blue)
peer influence mechanisms that are tested for a variety of seeded populations ranging from
0% to 1% of the entire population. Panel b presents the data on semi-logarithmic scale to
provide sufficient resolution for lower values. (color online)
the predominant force in driving cascades of behavior, seeding is more effective and
is optimal at a greater number of targets. To test this explanation, we varied the
fraction of the population that was targeted under highest degree seeding (the most
effective seeding strategy) with γ = 1 (shown in blue in Figure 4) as well as with
γ = 0 (shown in green in Figure 4). The first case represents the scenario in which
persuasion is the dominant factor in influence, while the second case represents the
scenario in which susceptibility to influence is the dominant factor. Although seeding
is indeed more effective when persuasion is more important, under both extreme
cases the performance of seeding is greatest when between 0.1% and 0.2% of the
population are targeted.
While this comparison demonstrates that it is optimal to seed a very small fraction
of the population no matter what assumptions are made about the mechanism
driving behavioral contagion, it does not explain why the optimal scope of seeding
is limited and so small. We measured the expected return on a single target by
measuring the average number of additional adopters gained from seeding while
varying the fraction of the population targeted (Figure 5(a)). We found that the
average gain from seeding drops almost immediately after the best targets are
successfully converted. As the plot in Figure 5(a) shows, under both the persuasion
regime and the susceptibility regime, there are simply not that many valuable targets
in the network. This figure plots the distribution of gross potential influence per
consumer, calculated according to our assumptions about how persuasion operates
and taking into account network structure, the actual distribution of individual
characteristics and adoption propensities in the population, and the excitement-
based mechanism of influence (i.e. persuasion is proportional to satisfaction, which
is in turn proportional to one’s likelihood to adopt the product estimated using
individual characteristics). Gross influence is calculated here assuming γ = 1 such
that persuasion is maximized:
Gross Influencei =∑j
wijαPCHi .
https://www.cambridge.org/core/terms. https://doi.org/10.1017/nws.2013.6Downloaded from https://www.cambridge.org/core. IP address: 65.21.228.167, on 25 Jan 2022 at 10:48:31, subject to the Cambridge Core terms of use, available at
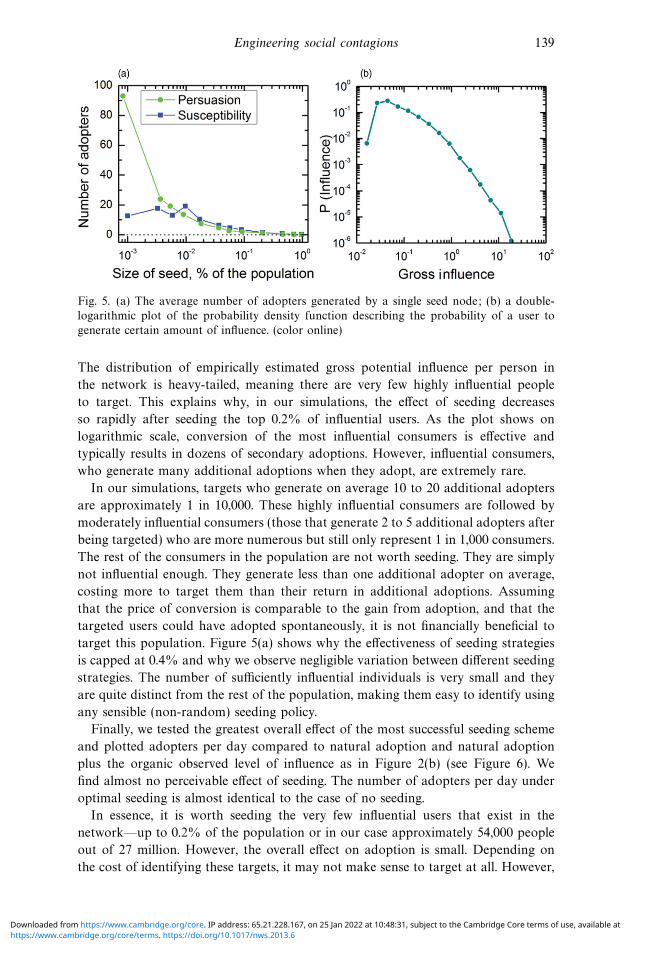
Engineering social contagions 139
Fig. 5. (a) The average number of adopters generated by a single seed node; (b) a double-
logarithmic plot of the probability density function describing the probability of a user to
generate certain amount of influence. (color online)
The distribution of empirically estimated gross potential influence per person in
the network is heavy-tailed, meaning there are very few highly influential people
to target. This explains why, in our simulations, the effect of seeding decreases
so rapidly after seeding the top 0.2% of influential users. As the plot shows on
logarithmic scale, conversion of the most influential consumers is effective and
typically results in dozens of secondary adoptions. However, influential consumers,
who generate many additional adoptions when they adopt, are extremely rare.
In our simulations, targets who generate on average 10 to 20 additional adopters
are approximately 1 in 10,000. These highly influential consumers are followed by
moderately influential consumers (those that generate 2 to 5 additional adopters after
being targeted) who are more numerous but still only represent 1 in 1,000 consumers.
The rest of the consumers in the population are not worth seeding. They are simply
not influential enough. They generate less than one additional adopter on average,
costing more to target them than their return in additional adoptions. Assuming
that the price of conversion is comparable to the gain from adoption, and that the
targeted users could have adopted spontaneously, it is not financially beneficial to
target this population. Figure 5(a) shows why the effectiveness of seeding strategies
is capped at 0.4% and why we observe negligible variation between different seeding
strategies. The number of sufficiently influential individuals is very small and they
are quite distinct from the rest of the population, making them easy to identify using
any sensible (non-random) seeding policy.
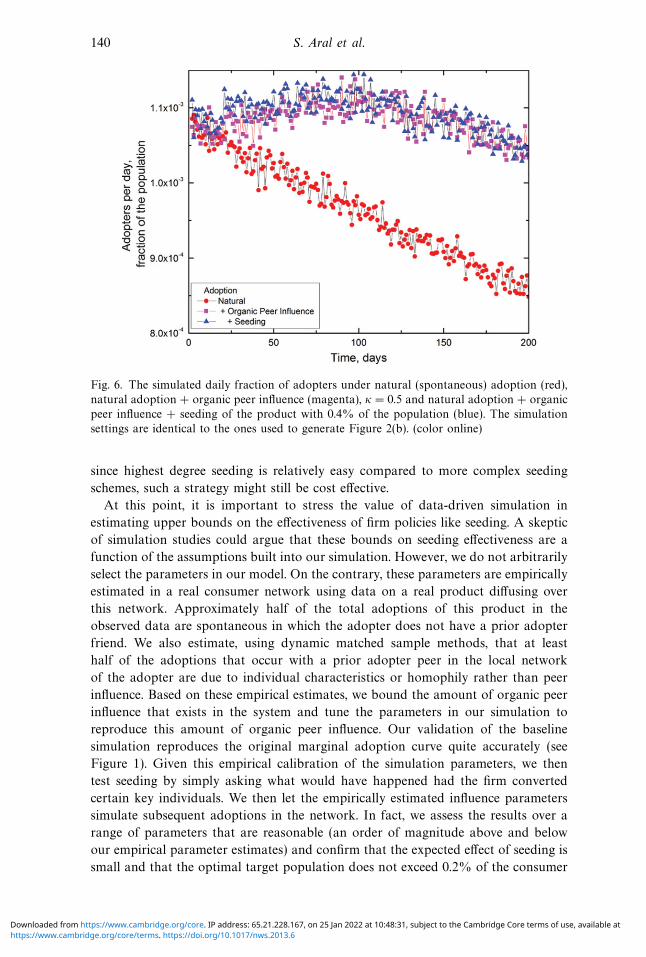
Finally, we tested the greatest overall effect of the most successful seeding scheme
and plotted adopters per day compared to natural adoption and natural adoption
plus the organic observed level of influence as in Figure 2(b) (see Figure 6). We
find almost no perceivable effect of seeding. The number of adopters per day under
optimal seeding is almost identical to the case of no seeding.
In essence, it is worth seeding the very few influential users that exist in the
network—up to 0.2% of the population or in our case approximately 54,000 people
out of 27 million. However, the overall effect on adoption is small. Depending on
the cost of identifying these targets, it may not make sense to target at all. However,
https://www.cambridge.org/core/terms. https://doi.org/10.1017/nws.2013.6Downloaded from https://www.cambridge.org/core. IP address: 65.21.228.167, on 25 Jan 2022 at 10:48:31, subject to the Cambridge Core terms of use, available at
140 S. Aral et al.
Fig. 6. The simulated daily fraction of adopters under natural (spontaneous) adoption (red),
natural adoption + organic peer influence (magenta), κ = 0.5 and natural adoption + organic
peer influence + seeding of the product with 0.4% of the population (blue). The simulation
settings are identical to the ones used to generate Figure 2(b). (color online)
since highest degree seeding is relatively easy compared to more complex seeding
schemes, such a strategy might still be cost effective.
At this point, it is important to stress the value of data-driven simulation in
estimating upper bounds on the effectiveness of firm policies like seeding. A skeptic
of simulation studies could argue that these bounds on seeding effectiveness are a
function of the assumptions built into our simulation. However, we do not arbitrarily
select the parameters in our model. On the contrary, these parameters are empirically
estimated in a real consumer network using data on a real product diffusing over
this network. Approximately half of the total adoptions of this product in the
observed data are spontaneous in which the adopter does not have a prior adopter
friend. We also estimate, using dynamic matched sample methods, that at least
half of the adoptions that occur with a prior adopter peer in the local network
of the adopter are due to individual characteristics or homophily rather than peer
influence. Based on these empirical estimates, we bound the amount of organic peer
influence that exists in the system and tune the parameters in our simulation to
reproduce this amount of organic peer influence. Our validation of the baseline
simulation reproduces the original marginal adoption curve quite accurately (see
Figure 1). Given this empirical calibration of the simulation parameters, we then
test seeding by simply asking what would have happened had the firm converted
certain key individuals. We then let the empirically estimated influence parameters
simulate subsequent adoptions in the network. In fact, we assess the results over a
range of parameters that are reasonable (an order of magnitude above and below
our empirical parameter estimates) and confirm that the expected effect of seeding is
small and that the optimal target population does not exceed 0.2% of the consumer
https://www.cambridge.org/core/terms. https://doi.org/10.1017/nws.2013.6Downloaded from https://www.cambridge.org/core. IP address: 65.21.228.167, on 25 Jan 2022 at 10:48:31, subject to the Cambridge Core terms of use, available at
Engineering social contagions 141
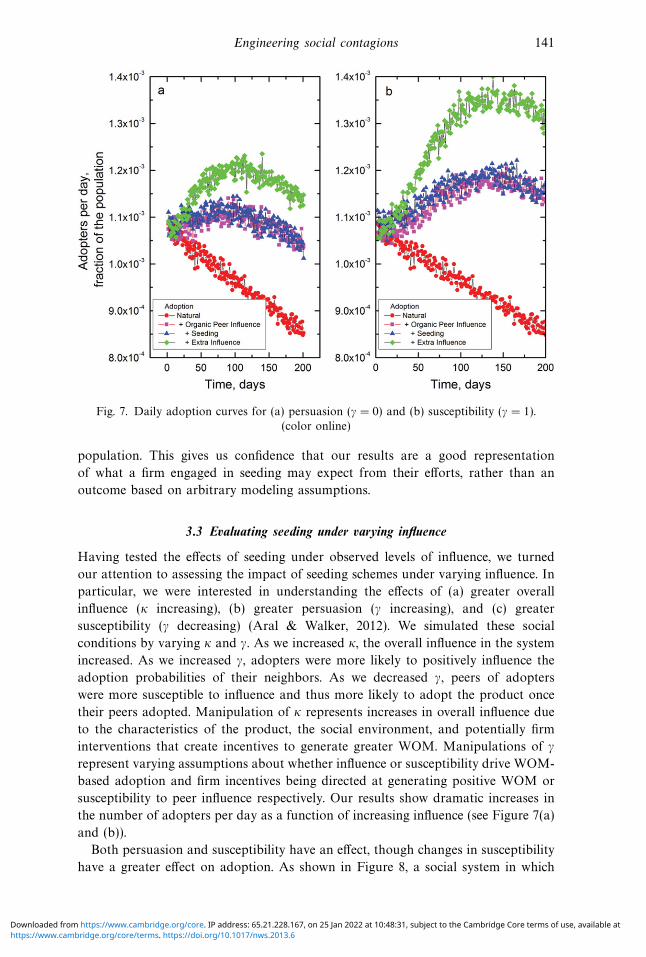
Fig. 7. Daily adoption curves for (a) persuasion (γ = 0) and (b) susceptibility (γ = 1).
(color online)
population. This gives us confidence that our results are a good representation
of what a firm engaged in seeding may expect from their efforts, rather than an
outcome based on arbitrary modeling assumptions.
3.3 Evaluating seeding under varying influence
Having tested the effects of seeding under observed levels of influence, we turned
our attention to assessing the impact of seeding schemes under varying influence. In
particular, we were interested in understanding the effects of (a) greater overall
influence (κ increasing), (b) greater persuasion (γ increasing), and (c) greater
susceptibility (γ decreasing) (Aral & Walker, 2012). We simulated these social
conditions by varying κ and γ. As we increased κ, the overall influence in the system
increased. As we increased γ, adopters were more likely to positively influence the
adoption probabilities of their neighbors. As we decreased γ, peers of adopters
were more susceptible to influence and thus more likely to adopt the product once
their peers adopted. Manipulation of κ represents increases in overall influence due
to the characteristics of the product, the social environment, and potentially firm
interventions that create incentives to generate greater WOM. Manipulations of γ
represent varying assumptions about whether influence or susceptibility drive WOM-
based adoption and firm incentives being directed at generating positive WOM or
susceptibility to peer influence respectively. Our results show dramatic increases in
the number of adopters per day as a function of increasing influence (see Figure 7(a)
and (b)).
Both persuasion and susceptibility have an effect, though changes in susceptibility
have a greater effect on adoption. As shown in Figure 8, a social system in which
https://www.cambridge.org/core/terms. https://doi.org/10.1017/nws.2013.6Downloaded from https://www.cambridge.org/core. IP address: 65.21.228.167, on 25 Jan 2022 at 10:48:31, subject to the Cambridge Core terms of use, available at
142 S. Aral et al.
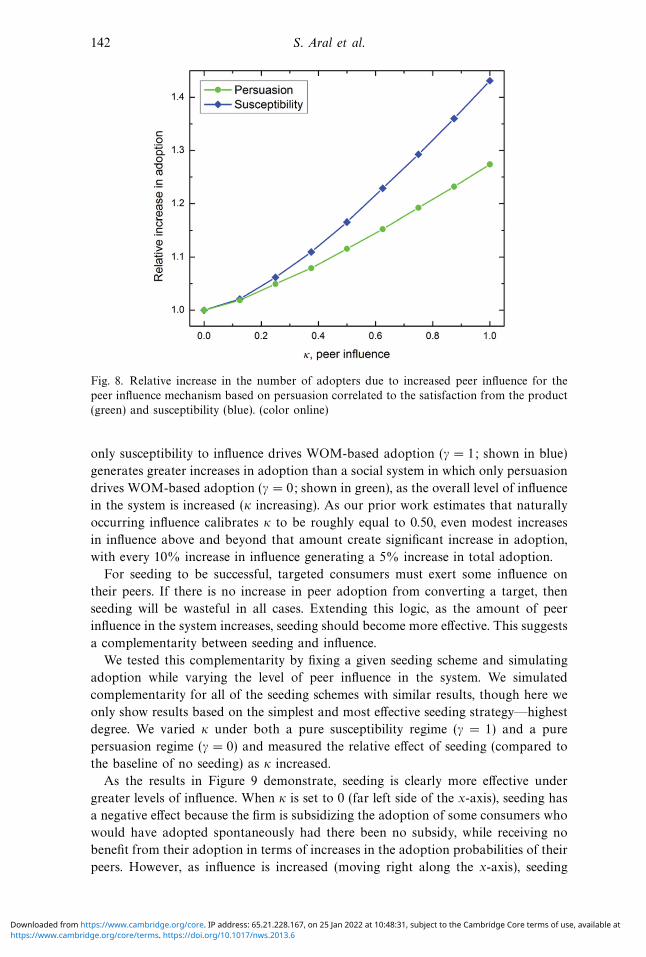
Fig. 8. Relative increase in the number of adopters due to increased peer influence for the
peer influence mechanism based on persuasion correlated to the satisfaction from the product
(green) and susceptibility (blue). (color online)
only susceptibility to influence drives WOM-based adoption (γ = 1; shown in blue)
generates greater increases in adoption than a social system in which only persuasion
drives WOM-based adoption (γ = 0; shown in green), as the overall level of influence
in the system is increased (κ increasing). As our prior work estimates that naturally
occurring influence calibrates κ to be roughly equal to 0.50, even modest increases
in influence above and beyond that amount create significant increase in adoption,
with every 10% increase in influence generating a 5% increase in total adoption.
For seeding to be successful, targeted consumers must exert some influence on
their peers. If there is no increase in peer adoption from converting a target, then
seeding will be wasteful in all cases. Extending this logic, as the amount of peer
influence in the system increases, seeding should become more effective. This suggests
a complementarity between seeding and influence.
We tested this complementarity by fixing a given seeding scheme and simulating
adoption while varying the level of peer influence in the system. We simulated
complementarity for all of the seeding schemes with similar results, though here we
only show results based on the simplest and most effective seeding strategy—highest
degree. We varied κ under both a pure susceptibility regime (γ = 1) and a pure
persuasion regime (γ = 0) and measured the relative effect of seeding (compared to
the baseline of no seeding) as κ increased.
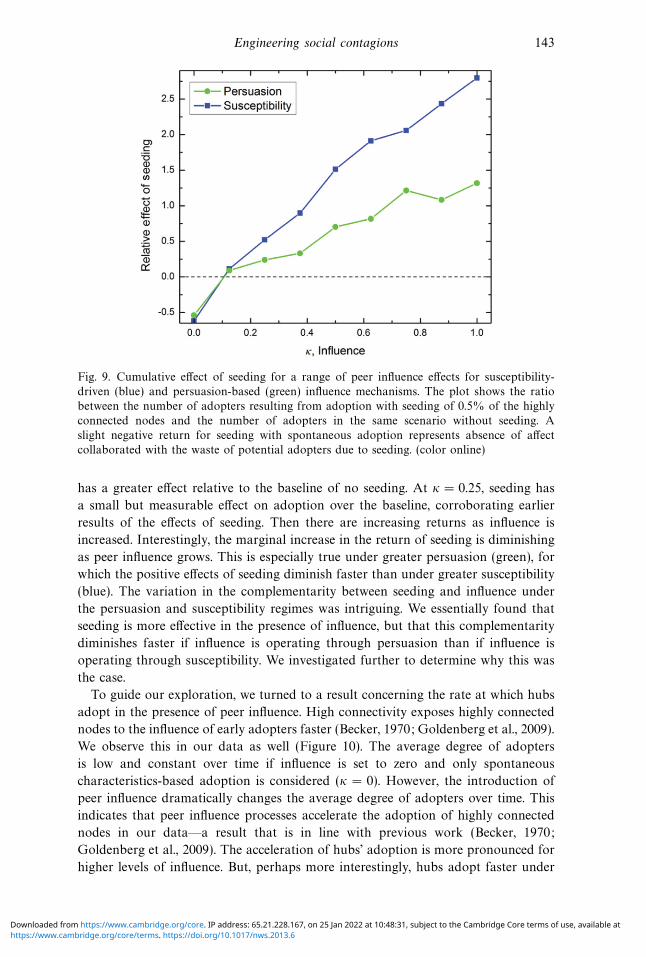
As the results in Figure 9 demonstrate, seeding is clearly more effective under
greater levels of influence. When κ is set to 0 (far left side of the x-axis), seeding has
a negative effect because the firm is subsidizing the adoption of some consumers who
would have adopted spontaneously had there been no subsidy, while receiving no
benefit from their adoption in terms of increases in the adoption probabilities of their
peers. However, as influence is increased (moving right along the x-axis), seeding
https://www.cambridge.org/core/terms. https://doi.org/10.1017/nws.2013.6Downloaded from https://www.cambridge.org/core. IP address: 65.21.228.167, on 25 Jan 2022 at 10:48:31, subject to the Cambridge Core terms of use, available at
Engineering social contagions 143
Fig. 9. Cumulative effect of seeding for a range of peer influence effects for susceptibility-
driven (blue) and persuasion-based (green) influence mechanisms. The plot shows the ratio
between the number of adopters resulting from adoption with seeding of 0.5% of the highly
connected nodes and the number of adopters in the same scenario without seeding. A
slight negative return for seeding with spontaneous adoption represents absence of affect
collaborated with the waste of potential adopters due to seeding. (color online)
has a greater effect relative to the baseline of no seeding. At κ = 0.25, seeding has
a small but measurable effect on adoption over the baseline, corroborating earlier
results of the effects of seeding. Then there are increasing returns as influence is
increased. Interestingly, the marginal increase in the return of seeding is diminishing
as peer influence grows. This is especially true under greater persuasion (green), for
which the positive effects of seeding diminish faster than under greater susceptibility
(blue). The variation in the complementarity between seeding and influence under
the persuasion and susceptibility regimes was intriguing. We essentially found that
seeding is more effective in the presence of influence, but that this complementarity
diminishes faster if influence is operating through persuasion than if influence is
operating through susceptibility. We investigated further to determine why this was
the case.
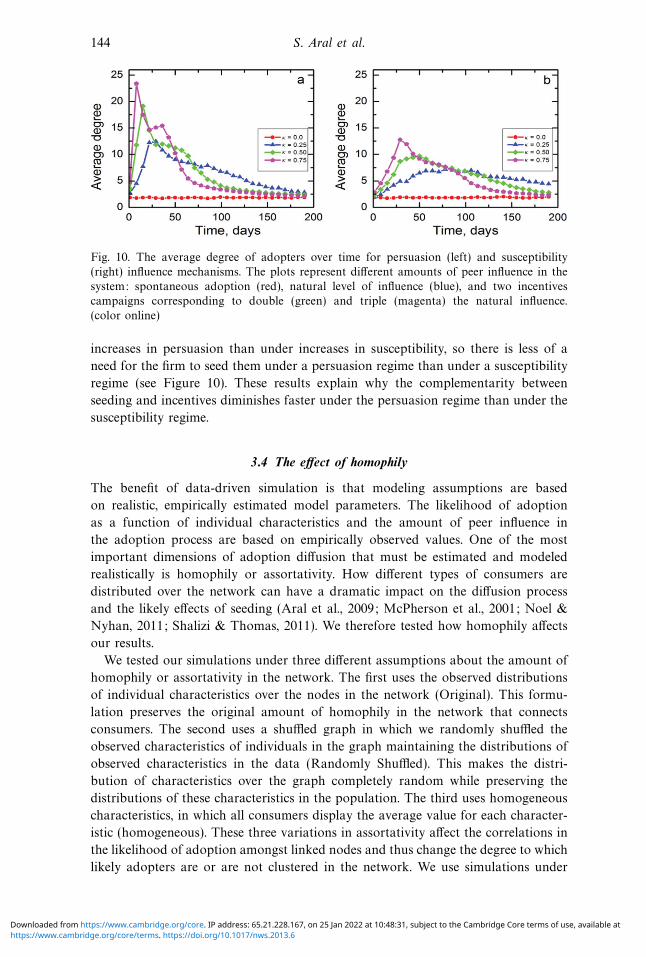
To guide our exploration, we turned to a result concerning the rate at which hubs
adopt in the presence of peer influence. High connectivity exposes highly connected
nodes to the influence of early adopters faster (Becker, 1970; Goldenberg et al., 2009).
We observe this in our data as well (Figure 10). The average degree of adopters
is low and constant over time if influence is set to zero and only spontaneous
characteristics-based adoption is considered (κ = 0). However, the introduction of
peer influence dramatically changes the average degree of adopters over time. This
indicates that peer influence processes accelerate the adoption of highly connected
nodes in our data—a result that is in line with previous work (Becker, 1970;
Goldenberg et al., 2009). The acceleration of hubs’ adoption is more pronounced for
higher levels of influence. But, perhaps more interestingly, hubs adopt faster under
https://www.cambridge.org/core/terms. https://doi.org/10.1017/nws.2013.6Downloaded from https://www.cambridge.org/core. IP address: 65.21.228.167, on 25 Jan 2022 at 10:48:31, subject to the Cambridge Core terms of use, available at
144 S. Aral et al.
Fig. 10. The average degree of adopters over time for persuasion (left) and susceptibility
(right) influence mechanisms. The plots represent different amounts of peer influence in the
system: spontaneous adoption (red), natural level of influence (blue), and two incentives
campaigns corresponding to double (green) and triple (magenta) the natural influence.
(color online)
increases in persuasion than under increases in susceptibility, so there is less of a
need for the firm to seed them under a persuasion regime than under a susceptibility
regime (see Figure 10). These results explain why the complementarity between
seeding and incentives diminishes faster under the persuasion regime than under the
susceptibility regime.
3.4 The effect of homophily
The benefit of data-driven simulation is that modeling assumptions are based
on realistic, empirically estimated model parameters. The likelihood of adoption
as a function of individual characteristics and the amount of peer influence in
the adoption process are based on empirically observed values. One of the most
important dimensions of adoption diffusion that must be estimated and modeled
realistically is homophily or assortativity. How different types of consumers are
distributed over the network can have a dramatic impact on the diffusion process
and the likely effects of seeding (Aral et al., 2009; McPherson et al., 2001; Noel &
Nyhan, 2011; Shalizi & Thomas, 2011). We therefore tested how homophily affects
our results.
We tested our simulations under three different assumptions about the amount of
homophily or assortativity in the network. The first uses the observed distributions
of individual characteristics over the nodes in the network (Original). This formu-
lation preserves the original amount of homophily in the network that connects
consumers. The second uses a shuffled graph in which we randomly shuffled the
observed characteristics of individuals in the graph maintaining the distributions of
observed characteristics in the data (Randomly Shuffled). This makes the distri-
bution of characteristics over the graph completely random while preserving the
distributions of these characteristics in the population. The third uses homogeneous
characteristics, in which all consumers display the average value for each character-
istic (homogeneous). These three variations in assortativity affect the correlations in
the likelihood of adoption amongst linked nodes and thus change the degree to which
likely adopters are or are not clustered in the network. We use simulations under
https://www.cambridge.org/core/terms. https://doi.org/10.1017/nws.2013.6Downloaded from https://www.cambridge.org/core. IP address: 65.21.228.167, on 25 Jan 2022 at 10:48:31, subject to the Cambridge Core terms of use, available at
Engineering social contagions 145
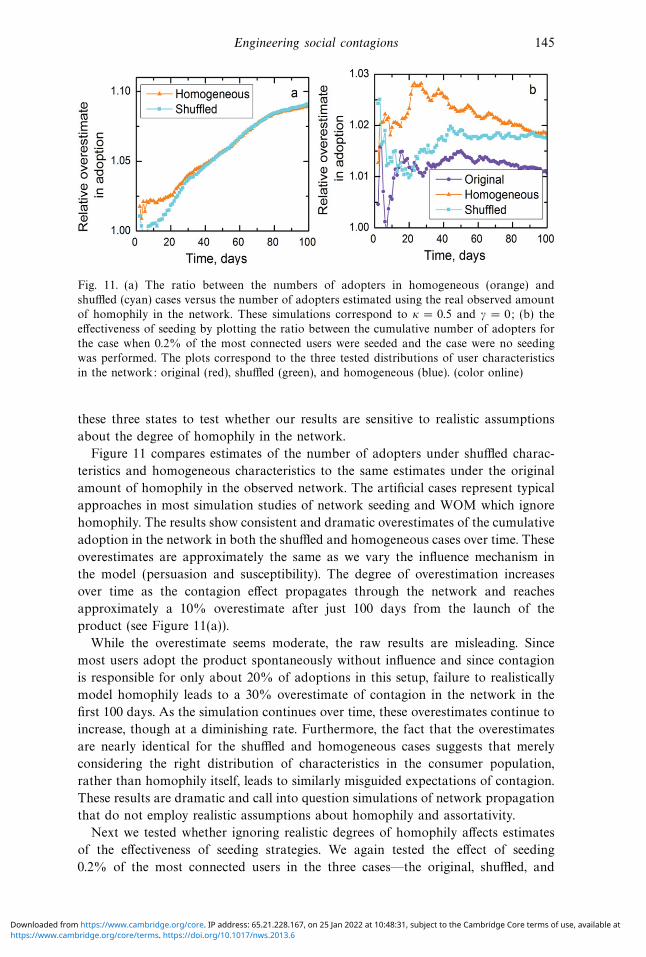
Fig. 11. (a) The ratio between the numbers of adopters in homogeneous (orange) and
shuffled (cyan) cases versus the number of adopters estimated using the real observed amount
of homophily in the network. These simulations correspond to κ = 0.5 and γ = 0; (b) the
effectiveness of seeding by plotting the ratio between the cumulative number of adopters for
the case when 0.2% of the most connected users were seeded and the case were no seeding
was performed. The plots correspond to the three tested distributions of user characteristics
in the network: original (red), shuffled (green), and homogeneous (blue). (color online)
these three states to test whether our results are sensitive to realistic assumptions
about the degree of homophily in the network.
Figure 11 compares estimates of the number of adopters under shuffled charac-
teristics and homogeneous characteristics to the same estimates under the original
amount of homophily in the observed network. The artificial cases represent typical
approaches in most simulation studies of network seeding and WOM which ignore
homophily. The results show consistent and dramatic overestimates of the cumulative
adoption in the network in both the shuffled and homogeneous cases over time. These
overestimates are approximately the same as we vary the influence mechanism in
the model (persuasion and susceptibility). The degree of overestimation increases
over time as the contagion effect propagates through the network and reaches
approximately a 10% overestimate after just 100 days from the launch of the
product (see Figure 11(a)).
While the overestimate seems moderate, the raw results are misleading. Since
most users adopt the product spontaneously without influence and since contagion
is responsible for only about 20% of adoptions in this setup, failure to realistically
model homophily leads to a 30% overestimate of contagion in the network in the
first 100 days. As the simulation continues over time, these overestimates continue to
increase, though at a diminishing rate. Furthermore, the fact that the overestimates
are nearly identical for the shuffled and homogeneous cases suggests that merely
considering the right distribution of characteristics in the consumer population,
rather than homophily itself, leads to similarly misguided expectations of contagion.
These results are dramatic and call into question simulations of network propagation
that do not employ realistic assumptions about homophily and assortativity.
Next we tested whether ignoring realistic degrees of homophily affects estimates
of the effectiveness of seeding strategies. We again tested the effect of seeding
0.2% of the most connected users in the three cases—the original, shuffled, and
https://www.cambridge.org/core/terms. https://doi.org/10.1017/nws.2013.6Downloaded from https://www.cambridge.org/core. IP address: 65.21.228.167, on 25 Jan 2022 at 10:48:31, subject to the Cambridge Core terms of use, available at
146 S. Aral et al.
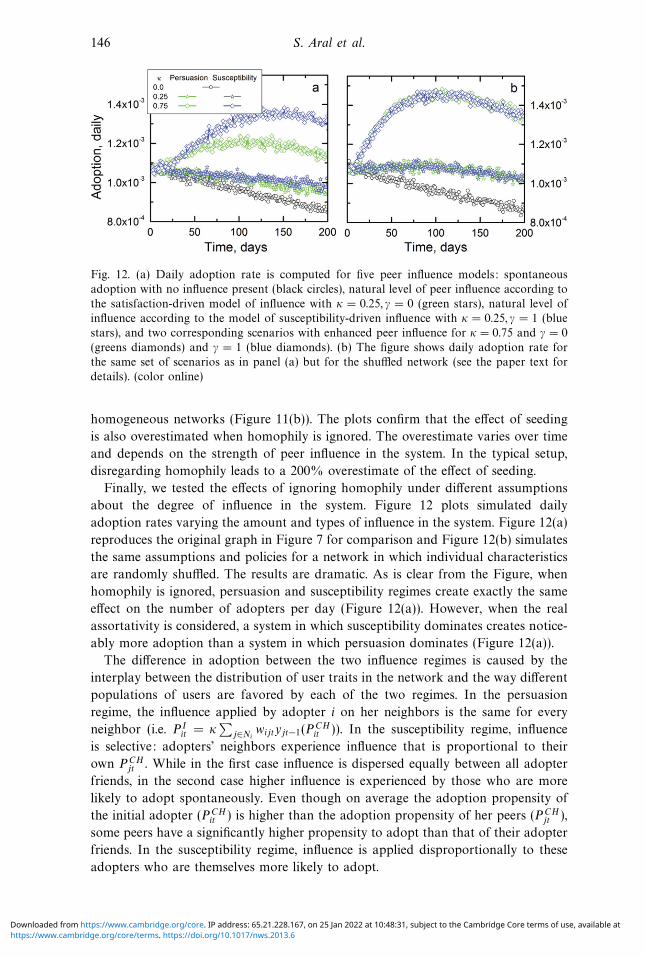
Fig. 12. (a) Daily adoption rate is computed for five peer influence models: spontaneous
adoption with no influence present (black circles), natural level of peer influence according to
the satisfaction-driven model of influence with κ = 0.25, γ = 0 (green stars), natural level of
influence according to the model of susceptibility-driven influence with κ = 0.25, γ = 1 (blue
stars), and two corresponding scenarios with enhanced peer influence for κ = 0.75 and γ = 0
(greens diamonds) and γ = 1 (blue diamonds). (b) The figure shows daily adoption rate for
the same set of scenarios as in panel (a) but for the shuffled network (see the paper text for
details). (color online)
homogeneous networks (Figure 11(b)). The plots confirm that the effect of seeding
is also overestimated when homophily is ignored. The overestimate varies over time
and depends on the strength of peer influence in the system. In the typical setup,
disregarding homophily leads to a 200% overestimate of the effect of seeding.
Finally, we tested the effects of ignoring homophily under different assumptions
about the degree of influence in the system. Figure 12 plots simulated daily
adoption rates varying the amount and types of influence in the system. Figure 12(a)
reproduces the original graph in Figure 7 for comparison and Figure 12(b) simulates
the same assumptions and policies for a network in which individual characteristics
are randomly shuffled. The results are dramatic. As is clear from the Figure, when
homophily is ignored, persuasion and susceptibility regimes create exactly the same
effect on the number of adopters per day (Figure 12(a)). However, when the real
assortativity is considered, a system in which susceptibility dominates creates notice-
ably more adoption than a system in which persuasion dominates (Figure 12(a)).
The difference in adoption between the two influence regimes is caused by the
interplay between the distribution of user traits in the network and the way different
populations of users are favored by each of the two regimes. In the persuasion
regime, the influence applied by adopter i on her neighbors is the same for every
neighbor (i.e. P Iit = κ
∑j∈Ni
wijtyjt−1(PCHit )). In the susceptibility regime, influence
is selective: adopters’ neighbors experience influence that is proportional to their
own PCHjt . While in the first case influence is dispersed equally between all adopter
friends, in the second case higher influence is experienced by those who are more
likely to adopt spontaneously. Even though on average the adoption propensity of
the initial adopter (PCHit ) is higher than the adoption propensity of her peers (PCH
jt ),
some peers have a significantly higher propensity to adopt than that of their adopter
friends. In the susceptibility regime, influence is applied disproportionally to these
adopters who are themselves more likely to adopt.
https://www.cambridge.org/core/terms. https://doi.org/10.1017/nws.2013.6Downloaded from https://www.cambridge.org/core. IP address: 65.21.228.167, on 25 Jan 2022 at 10:48:31, subject to the Cambridge Core terms of use, available at
Engineering social contagions 147
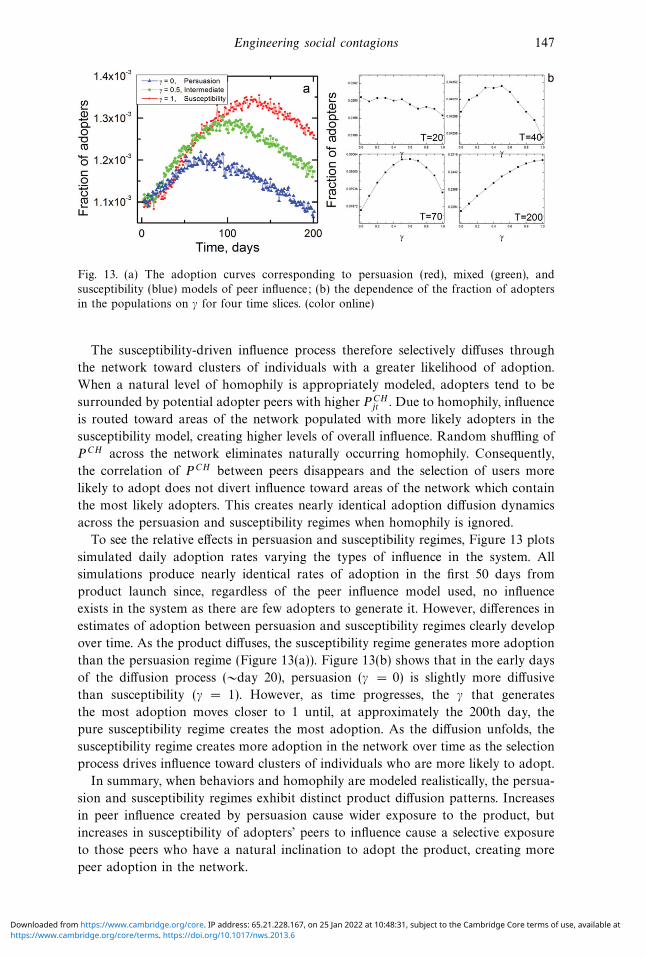
Fig. 13. (a) The adoption curves corresponding to persuasion (red), mixed (green), and
susceptibility (blue) models of peer influence; (b) the dependence of the fraction of adopters
in the populations on γ for four time slices. (color online)
The susceptibility-driven influence process therefore selectively diffuses through
the network toward clusters of individuals with a greater likelihood of adoption.
When a natural level of homophily is appropriately modeled, adopters tend to be
surrounded by potential adopter peers with higher PCHjt . Due to homophily, influence
is routed toward areas of the network populated with more likely adopters in the
susceptibility model, creating higher levels of overall influence. Random shuffling of
PCH across the network eliminates naturally occurring homophily. Consequently,
the correlation of PCH between peers disappears and the selection of users more
likely to adopt does not divert influence toward areas of the network which contain
the most likely adopters. This creates nearly identical adoption diffusion dynamics
across the persuasion and susceptibility regimes when homophily is ignored.
To see the relative effects in persuasion and susceptibility regimes, Figure 13 plots
simulated daily adoption rates varying the types of influence in the system. All
simulations produce nearly identical rates of adoption in the first 50 days from
product launch since, regardless of the peer influence model used, no influence
exists in the system as there are few adopters to generate it. However, differences in
estimates of adoption between persuasion and susceptibility regimes clearly develop
over time. As the product diffuses, the susceptibility regime generates more adoption
than the persuasion regime (Figure 13(a)). Figure 13(b) shows that in the early days
of the diffusion process (∼day 20), persuasion (γ = 0) is slightly more diffusive
than susceptibility (γ = 1). However, as time progresses, the γ that generates
the most adoption moves closer to 1 until, at approximately the 200th day, the
pure susceptibility regime creates the most adoption. As the diffusion unfolds, the
susceptibility regime creates more adoption in the network over time as the selection
process drives influence toward clusters of individuals who are more likely to adopt.
In summary, when behaviors and homophily are modeled realistically, the persua-
sion and susceptibility regimes exhibit distinct product diffusion patterns. Increases
in peer influence created by persuasion cause wider exposure to the product, but
increases in susceptibility of adopters’ peers to influence cause a selective exposure
to those peers who have a natural inclination to adopt the product, creating more
peer adoption in the network.
https://www.cambridge.org/core/terms. https://doi.org/10.1017/nws.2013.6Downloaded from https://www.cambridge.org/core. IP address: 65.21.228.167, on 25 Jan 2022 at 10:48:31, subject to the Cambridge Core terms of use, available at
148 S. Aral et al.
4 Discussion: Policy implications, limitations, and future work
We conducted realistic data-driven simulations of social contagion in product
adoption and tested different network seeding strategies under different social
conditions. Our results highlight the importance of using real-world data to guide
modeling assumptions and challenge conventional wisdom about the likely effects
of seeding in several ways.
First, most seeding strategies exhibit relatively similar performance. Although we
tested several different seeding strategies discussed in the literature, our results
show that they are approximately indistinguishable in their effect on product
adoption. Seeding the highest degree nodes performs as well if not better than
more sophisticated seeding strategies. As identifying influentials based on their
degree is relatively easy and less costly for the firm because only degree distributions
are needed (rather than more complex network variables), these results indicate
that firms need not invest in more sophisticated strategies that rely on identifying
influentials with more complex network data.
Second, seeding a small fraction of the most influential consumers in the popu-
lation pays off as there are returns to seeding the most influential nodes. However,
the scope of optimal seeding policies is limited. Seeding greater than 0.2% of the
population is wasteful because the gains in adoptions influenced by seeding more
consumers are smaller than the gains from their organic adoption after 0.2% of the
most influential consumers have been seeded. These results suggest that firms need
not invest in large seeding programs, but rather in seeding policies of limited scope
that focus only on the most influential individuals (in our case identified by the
highest degree). These results hold for all the seeding strategies we tested including
highest degree and the more sophisticated strategies.
Third, seeding is more effective in the presence of greater influence. Interestingly,
there are diminishing marginal complementarities between seeding and influence as
influence is increased. The marginal increase in the return of seeding is diminishing
as peer influence grows and is diminishing faster when persuasion drives influence
than when susceptibility drives influence. This is because hubs adopt faster under
increases in persuasion than increases in susceptibility, so there is less of a need for
the firm to seed them under a persuasion regime than under a susceptibility regime.
Finally, ignoring homophily creates significant overestimates of seeding
strategies— up to 30%. Ignoring homophily also changes the interpretation of which
regime, persuasion or susceptibility, creates more adoption. In the susceptibility
regime, influence is applied disproportionally to adopters who are themselves more
likely to adopt. When homophily is appropriately accounted for in the model,
the susceptibility-driven influence process selectively diffuses through the network
toward clusters of individuals with a greater likelihood of adoption, creating higher
levels of overall influence.
There are some limitations to our work, caveats about how the results should be
interpreted and obvious directions for future research. First, although we use a large
dynamic networked dataset and a real product diffusing over the same network to
estimate our model parameters, we (like all simulation studies) assume seeding is
“successful” at some baseline level. In other words, we assume that seeded nodes
adopt the product. We do not make any claims about the local effects of each
https://www.cambridge.org/core/terms. https://doi.org/10.1017/nws.2013.6Downloaded from https://www.cambridge.org/core. IP address: 65.21.228.167, on 25 Jan 2022 at 10:48:31, subject to the Cambridge Core terms of use, available at
Engineering social contagions 149
of these strategies (e.g. how successful seeding strategies are at converting targeted
consumers). Our goal is instead to assume these efforts are successful and then to
model the likely global diffusion effects of such strategies. There is some evidence that
seeding is successful at converting targeted users (e.g. Iyengar et al., 2011). As cost
considerations are not essential to our models, we think these baseline assumptions
are reasonable. However, future work should explore how investment is related to
success and for example whether investment increases marketing effectiveness at
diminishing rates.
Second, future work should consider more complex and comprehensive models
of peer influence. For example, we did not consider the effects of making peer
influence a function of the similarity between peers or local network properties
such as triadic closure or the number of mutual friends two consumers have in
common. In addition, although our model fit our data well, little is known in
general about the most appropriate functional form of influence models or whether
they generalize across different contexts. The generalizability of the findings needs
to be further explored given that the empirical evidence comes from a single setting.
We adopted a parsimonious approach to simplify the model while preserving its
essential characteristics and model fit. We see potential in future work that tests
the robustness of the model further. For example, collecting data from several
examples of the diffusion of products over networks could help test our specification
in multiple other settings. We are however also acutely aware of the difficulty of
obtaining data like those we have presented.
Third, our model of adoption is calibrated with parameters that are fixed in
time. The model is trained on the adoption data from the first 40 days of the
adoption process and simulations use these estimated model parameters over the
longer time horizons. In reality, propensities to adopt the product due to individual
characteristics and peer influence may change over time and over the product’s life
cycle. Future work should consider how dynamic estimation of model parameters
changes the results.
Finally, we only considered varying amounts of positive WOM. In all likeli-
hood, negative WOM and churn also affect adoption and diffusion dynamics. As
relatively few studies examine negative WOM with some notable exceptions (e.g.
Singh, 1990), we encourage more work on its effect on contagion and product
diffusion.
5 Conclusion
We used data on a real, large-scale social network of 27 million individuals
interacting daily together with the day-by-day adoption of a new mobile service
product, to inform, build, and analyze a data-driven simulation of the effectiveness
of seeding strategies under different social conditions. Three main results emerge
from our simulations. First, failure to consider homophily, as the bulk of current
literature does, creates significant overestimation of the effectiveness of seeding
strategies, casting doubt on conclusions drawn by simulation studies that do not
model homophily. Second, in addition to generating relatively fewer total adoptions,
seeding is constrained by the relatively small fraction of potential influencers that
exist in the network. We find that seeding more than 0.2% of the population
https://www.cambridge.org/core/terms. https://doi.org/10.1017/nws.2013.6Downloaded from https://www.cambridge.org/core. IP address: 65.21.228.167, on 25 Jan 2022 at 10:48:31, subject to the Cambridge Core terms of use, available at
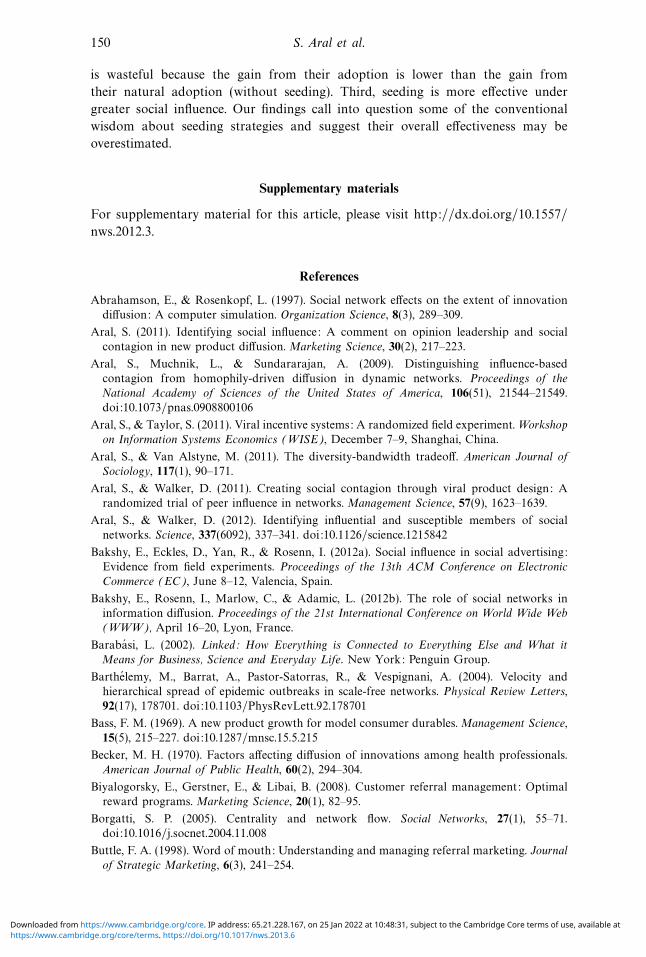
150 S. Aral et al.
is wasteful because the gain from their adoption is lower than the gain from
their natural adoption (without seeding). Third, seeding is more effective under
greater social influence. Our findings call into question some of the conventional
wisdom about seeding strategies and suggest their overall effectiveness may be
overestimated.
Supplementary materials
For supplementary material for this article, please visit http://dx.doi.org/10.1557/
nws.2012.3.
References
Abrahamson, E., & Rosenkopf, L. (1997). Social network effects on the extent of innovation
diffusion: A computer simulation. Organization Science, 8(3), 289–309.
Aral, S. (2011). Identifying social influence: A comment on opinion leadership and social
contagion in new product diffusion. Marketing Science, 30(2), 217–223.
Aral, S., Muchnik, L., & Sundararajan, A. (2009). Distinguishing influence-based
contagion from homophily-driven diffusion in dynamic networks. Proceedings of the
National Academy of Sciences of the United States of America, 106(51), 21544–21549.
doi:10.1073/pnas.0908800106
Aral, S., & Taylor, S. (2011). Viral incentive systems: A randomized field experiment. Workshop
on Information Systems Economics (WISE), December 7–9, Shanghai, China.
Aral, S., & Van Alstyne, M. (2011). The diversity-bandwidth tradeoff. American Journal of
Sociology, 117(1), 90–171.
Aral, S., & Walker, D. (2011). Creating social contagion through viral product design: A
randomized trial of peer influence in networks. Management Science, 57(9), 1623–1639.
Aral, S., & Walker, D. (2012). Identifying influential and susceptible members of social
networks. Science, 337(6092), 337–341. doi:10.1126/science.1215842
Bakshy, E., Eckles, D., Yan, R., & Rosenn, I. (2012a). Social influence in social advertising:
Evidence from field experiments. Proceedings of the 13th ACM Conference on Electronic
Commerce (EC), June 8–12, Valencia, Spain.
Bakshy, E., Rosenn, I., Marlow, C., & Adamic, L. (2012b). The role of social networks in
information diffusion. Proceedings of the 21st International Conference on World Wide Web
(WWW), April 16–20, Lyon, France.
Barabasi, L. (2002). Linked: How Everything is Connected to Everything Else and What it
Means for Business, Science and Everyday Life. New York: Penguin Group.
Barthelemy, M., Barrat, A., Pastor-Satorras, R., & Vespignani, A. (2004). Velocity and
hierarchical spread of epidemic outbreaks in scale-free networks. Physical Review Letters,
92(17), 178701. doi:10.1103/PhysRevLett.92.178701
Bass, F. M. (1969). A new product growth for model consumer durables. Management Science,
15(5), 215–227. doi:10.1287/mnsc.15.5.215
Becker, M. H. (1970). Factors affecting diffusion of innovations among health professionals.
American Journal of Public Health, 60(2), 294–304.
Biyalogorsky, E., Gerstner, E., & Libai, B. (2008). Customer referral management: Optimal
reward programs. Marketing Science, 20(1), 82–95.
Borgatti, S. P. (2005). Centrality and network flow. Social Networks, 27(1), 55–71.
doi:10.1016/j.socnet.2004.11.008
Buttle, F. A. (1998). Word of mouth: Understanding and managing referral marketing. Journal
of Strategic Marketing, 6(3), 241–254.
https://www.cambridge.org/core/terms. https://doi.org/10.1017/nws.2013.6Downloaded from https://www.cambridge.org/core. IP address: 65.21.228.167, on 25 Jan 2022 at 10:48:31, subject to the Cambridge Core terms of use, available at
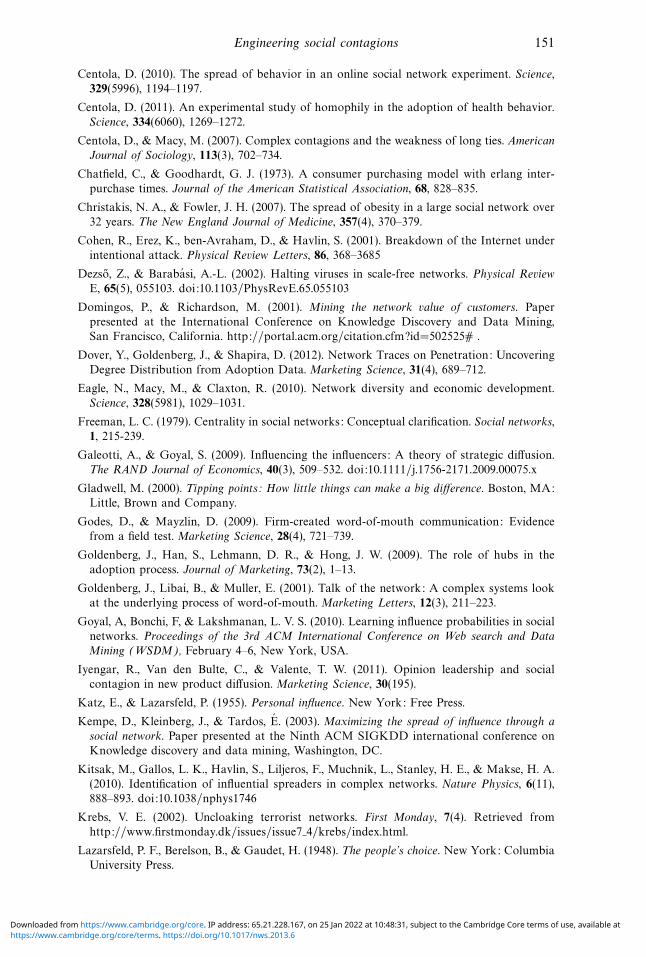
Engineering social contagions 151
Centola, D. (2010). The spread of behavior in an online social network experiment. Science,
329(5996), 1194–1197.
Centola, D. (2011). An experimental study of homophily in the adoption of health behavior.
Science, 334(6060), 1269–1272.
Centola, D., & Macy, M. (2007). Complex contagions and the weakness of long ties. American
Journal of Sociology, 113(3), 702–734.
Chatfield, C., & Goodhardt, G. J. (1973). A consumer purchasing model with erlang inter-
purchase times. Journal of the American Statistical Association, 68, 828–835.
Christakis, N. A., & Fowler, J. H. (2007). The spread of obesity in a large social network over
32 years. The New England Journal of Medicine, 357(4), 370–379.
Cohen, R., Erez, K., ben-Avraham, D., & Havlin, S. (2001). Breakdown of the Internet under
intentional attack. Physical Review Letters, 86, 368–3685
Dezso, Z., & Barabasi, A.-L. (2002). Halting viruses in scale-free networks. Physical Review
E, 65(5), 055103. doi:10.1103/PhysRevE.65.055103
Domingos, P., & Richardson, M. (2001). Mining the network value of customers. Paper
presented at the International Conference on Knowledge Discovery and Data Mining,
San Francisco, California. http://portal.acm.org/citation.cfm?id=502525# .
Dover, Y., Goldenberg, J., & Shapira, D. (2012). Network Traces on Penetration: Uncovering
Degree Distribution from Adoption Data. Marketing Science, 31(4), 689–712.
Eagle, N., Macy, M., & Claxton, R. (2010). Network diversity and economic development.
Science, 328(5981), 1029–1031.
Freeman, L. C. (1979). Centrality in social networks: Conceptual clarification. Social networks,
1, 215-239.
Galeotti, A., & Goyal, S. (2009). Influencing the influencers: A theory of strategic diffusion.
The RAND Journal of Economics, 40(3), 509–532. doi:10.1111/j.1756-2171.2009.00075.x
Gladwell, M. (2000). Tipping points: How little things can make a big difference. Boston, MA:
Little, Brown and Company.
Godes, D., & Mayzlin, D. (2009). Firm-created word-of-mouth communication: Evidence
from a field test. Marketing Science, 28(4), 721–739.
Goldenberg, J., Han, S., Lehmann, D. R., & Hong, J. W. (2009). The role of hubs in the
adoption process. Journal of Marketing, 73(2), 1–13.
Goldenberg, J., Libai, B., & Muller, E. (2001). Talk of the network: A complex systems look
at the underlying process of word-of-mouth. Marketing Letters, 12(3), 211–223.
Goyal, A, Bonchi, F, & Lakshmanan, L. V. S. (2010). Learning influence probabilities in social
networks. Proceedings of the 3rd ACM International Conference on Web search and Data
Mining (WSDM), February 4–6, New York, USA.
Iyengar, R., Van den Bulte, C., & Valente, T. W. (2011). Opinion leadership and social
contagion in new product diffusion. Marketing Science, 30(195).
Katz, E., & Lazarsfeld, P. (1955). Personal influence. New York: Free Press.
Kempe, D., Kleinberg, J., & Tardos, E. (2003). Maximizing the spread of influence through a
social network. Paper presented at the Ninth ACM SIGKDD international conference on
Knowledge discovery and data mining, Washington, DC.
Kitsak, M., Gallos, L. K., Havlin, S., Liljeros, F., Muchnik, L., Stanley, H. E., & Makse, H. A.
(2010). Identification of influential spreaders in complex networks. Nature Physics, 6(11),
888–893. doi:10.1038/nphys1746
Krebs, V. E. (2002). Uncloaking terrorist networks. First Monday, 7(4). Retrieved from
http://www.firstmonday.dk/issues/issue7 4/krebs/index.html.
Lazarsfeld, P. F., Berelson, B., & Gaudet, H. (1948). The people’s choice. New York: Columbia
University Press.
https://www.cambridge.org/core/terms. https://doi.org/10.1017/nws.2013.6Downloaded from https://www.cambridge.org/core. IP address: 65.21.228.167, on 25 Jan 2022 at 10:48:31, subject to the Cambridge Core terms of use, available at
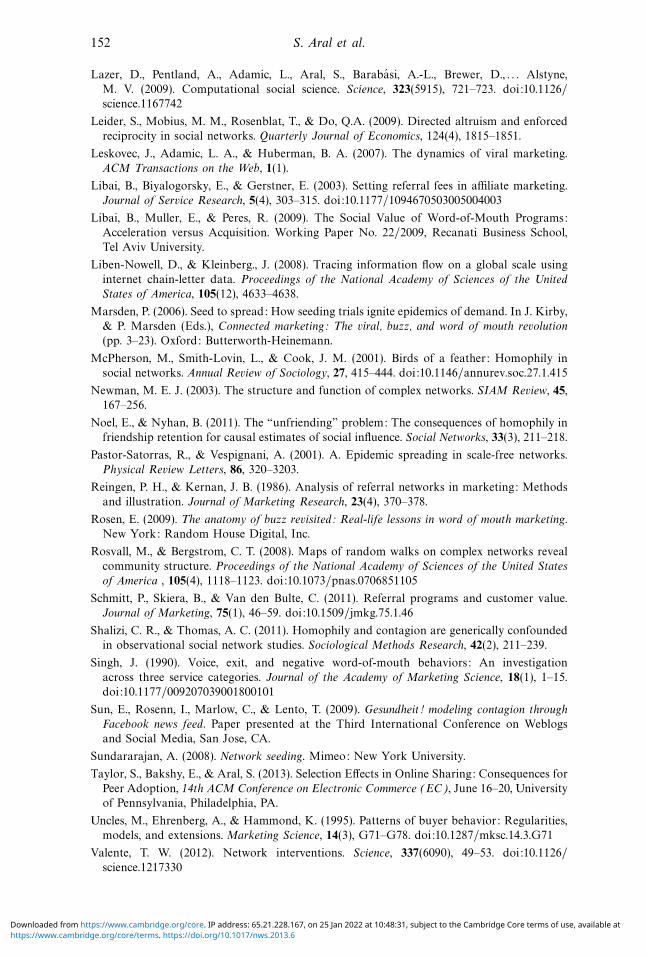
152 S. Aral et al.
Lazer, D., Pentland, A., Adamic, L., Aral, S., Barabasi, A.-L., Brewer, D., . . . Alstyne,
M. V. (2009). Computational social science. Science, 323(5915), 721–723. doi:10.1126/
science.1167742
Leider, S., Mobius, M. M., Rosenblat, T., & Do, Q.A. (2009). Directed altruism and enforced
reciprocity in social networks. Quarterly Journal of Economics, 124(4), 1815–1851.
Leskovec, J., Adamic, L. A., & Huberman, B. A. (2007). The dynamics of viral marketing.
ACM Transactions on the Web, 1(1).
Libai, B., Biyalogorsky, E., & Gerstner, E. (2003). Setting referral fees in affiliate marketing.
Journal of Service Research, 5(4), 303–315. doi:10.1177/1094670503005004003
Libai, B., Muller, E., & Peres, R. (2009). The Social Value of Word-of-Mouth Programs:
Acceleration versus Acquisition. Working Paper No. 22/2009, Recanati Business School,
Tel Aviv University.
Liben-Nowell, D., & Kleinberg., J. (2008). Tracing information flow on a global scale using
internet chain-letter data. Proceedings of the National Academy of Sciences of the United
States of America, 105(12), 4633–4638.
Marsden, P. (2006). Seed to spread: How seeding trials ignite epidemics of demand. In J. Kirby,
& P. Marsden (Eds.), Connected marketing: The viral, buzz, and word of mouth revolution
(pp. 3–23). Oxford: Butterworth-Heinemann.
McPherson, M., Smith-Lovin, L., & Cook, J. M. (2001). Birds of a feather: Homophily in
social networks. Annual Review of Sociology, 27, 415–444. doi:10.1146/annurev.soc.27.1.415
Newman, M. E. J. (2003). The structure and function of complex networks. SIAM Review, 45,
167–256.
Noel, E., & Nyhan, B. (2011). The “unfriending” problem: The consequences of homophily in
friendship retention for causal estimates of social influence. Social Networks, 33(3), 211–218.
Pastor-Satorras, R., & Vespignani, A. (2001). A. Epidemic spreading in scale-free networks.
Physical Review Letters, 86, 320–3203.
Reingen, P. H., & Kernan, J. B. (1986). Analysis of referral networks in marketing: Methods
and illustration. Journal of Marketing Research, 23(4), 370–378.
Rosen, E. (2009). The anatomy of buzz revisited: Real-life lessons in word of mouth marketing.
New York: Random House Digital, Inc.
Rosvall, M., & Bergstrom, C. T. (2008). Maps of random walks on complex networks reveal
community structure. Proceedings of the National Academy of Sciences of the United States
of America , 105(4), 1118–1123. doi:10.1073/pnas.0706851105
Schmitt, P., Skiera, B., & Van den Bulte, C. (2011). Referral programs and customer value.
Journal of Marketing, 75(1), 46–59. doi:10.1509/jmkg.75.1.46
Shalizi, C. R., & Thomas, A. C. (2011). Homophily and contagion are generically confounded
in observational social network studies. Sociological Methods Research, 42(2), 211–239.
Singh, J. (1990). Voice, exit, and negative word-of-mouth behaviors: An investigation
across three service categories. Journal of the Academy of Marketing Science, 18(1), 1–15.
doi:10.1177/009207039001800101
Sun, E., Rosenn, I., Marlow, C., & Lento, T. (2009). Gesundheit! modeling contagion through
Facebook news feed. Paper presented at the Third International Conference on Weblogs
and Social Media, San Jose, CA.
Sundararajan, A. (2008). Network seeding. Mimeo: New York University.
Taylor, S., Bakshy, E., & Aral, S. (2013). Selection Effects in Online Sharing: Consequences for
Peer Adoption, 14th ACM Conference on Electronic Commerce (EC), June 16–20, University
of Pennsylvania, Philadelphia, PA.
Uncles, M., Ehrenberg, A., & Hammond, K. (1995). Patterns of buyer behavior: Regularities,
models, and extensions. Marketing Science, 14(3), G71–G78. doi:10.1287/mksc.14.3.G71
Valente, T. W. (2012). Network interventions. Science, 337(6090), 49–53. doi:10.1126/
science.1217330
https://www.cambridge.org/core/terms. https://doi.org/10.1017/nws.2013.6Downloaded from https://www.cambridge.org/core. IP address: 65.21.228.167, on 25 Jan 2022 at 10:48:31, subject to the Cambridge Core terms of use, available at

Engineering social contagions 153
Valente, T. W., & Davis, R. L. (1999). Accelerating the diffusion of innovations using opinion
leaders. The ANNALS of the American Academy of Political and Social Science, 556(1),
55–67. doi:10.1177/000271629956600105
Van den Bulte, C., & Joshi, Y. V. (2007). New product diffusion with influentials and imitators.
Marketing Science, 26(3), 400–421. doi:10.1287/mksc.1060.0224
Watts, D. J., & Dodds, P. S. (2007). Influentials, networks, and public opinion formation.
Journal of Consumer Research, 34, 441–458.
Whyte, W. H. (1954). The web of word of mouth. Fortune, 5, 140–212.
https://www.cambridge.org/core/terms. https://doi.org/10.1017/nws.2013.6Downloaded from https://www.cambridge.org/core. IP address: 65.21.228.167, on 25 Jan 2022 at 10:48:31, subject to the Cambridge Core terms of use, available at


![Complex Contagions on Configuration Model Graphs with a ...fayu/slides/Contagions_Powerlaw.pdf · k-complex contagions spread Network Science Lattice[98] Random regular[07] Tree[79,06]](https://img.pdfslide.net/doc/110x75/606ed86faa2ee92e175f7dd4/complex-contagions-on-configuration-model-graphs-with-a-fayuslidescontagionspowerlawpdf.jpg)