Embed Size (px)
Citation preview
PDHonline Course G253 (4 PDH)
Engineering Symbology, Prints and Drawings
2012
Instructor: A. Bhatia, B.E.
PDH Online | PDH Center5272 Meadow Estates Drive
Fairfax, VA 22030-6658Phone & Fax: 703-988-0088
www.PDHonline.orgwww.PDHcenter.com
An Approved Continuing Education Provider
DOE-HDBK-1016/1-93JANUARY 1993
DOE FUNDAMENTALS HANDBOOKENGINEERING SYMBOLOGY,PRINTS, AND DRAWINGSVolume 1 of 2
U.S. Department of Energy FSC-6910Washington, D.C. 20585
DISTRIBUTION STATEMENT A. Approved for public release; distribution is unlimited.
Department of EnergyFundamentals Handbook
ENGINEERING SYMBOLOGY, PRINTS,AND DRAWINGS
Module 1Introduction to Print Reading
Introduction To Print Reading DOE-HDBK-1016/1-93 TABLE OF CONTENTS
TABLE OF CONTENTS
LIST OF FIGURES . . . . . . . . . . . . . . . . . . . . . . . . . . . . . . . . . . . . . . . . . . . . . . . . . . ii
LIST OF TABLES . . . . . . . . . . . . . . . . . . . . . . . . . . . . . . . . . . . . . . . . . . . . . . . . . . . iii
REFERENCES . . . . . . . . . . . . . . . . . . . . . . . . . . . . . . . . . . . . . . . . . . . . . . . . . . . . iv
OBJECTIVES . . . . . . . . . . . . . . . . . . . . . . . . . . . . . . . . . . . . . . . . . . . . . . . . . . . . . v
INTRODUCTION TO PRINT READING . . . . . . . . . . . . . . . . . . . . . . . . . . . . . . . . . 1
Introduction . . . . . . . . . . . . . . . . . . . . . . . . . . . . . . . . . . . . . . . . . . . . . . . . . 1Anatomy of a Drawing. . . . . . . . . . . . . . . . . . . . . . . . . . . . . . . . . . . . . . . . . . 2The Title Block . . . . . . . . . . . . . . . . . . . . . . . . . . . . . . . . . . . . . . . . . . . . . . . 2Grid System . . . . . . . . . . . . . . . . . . . . . . . . . . . . . . . . . . . . . . . . . . . . . . . . . 5Revision Block . . . . . . . . . . . . . . . . . . . . . . . . . . . . . . . . . . . . . . . . . . . . . . . 6Changes. . . . . . . . . . . . . . . . . . . . . . . . . . . . . . . . . . . . . . . . . . . . . . . . . . . . 7Notes and Legend. . . . . . . . . . . . . . . . . . . . . . . . . . . . . . . . . . . . . . . . . . . . . 8Summary . . . . . . . . . . . . . . . . . . . . . . . . . . . . . . . . . . . . . . . . . . . . . . . . . . . 9
INTRODUCTION TO THE TYPES OF DRAWINGS,VIEWS, AND PERSPECTIVES. . . . . . . . . . . . . . . . . . . . . . . . . . . . . . . . . . . . . . . . 10
Categories of Drawings. . . . . . . . . . . . . . . . . . . . . . . . . . . . . . . . . . . . . . . . . 10Piping and Instrument Drawings (P&IDs). . . . . . . . . . . . . . . . . . . . . . . . . . . . . 10Electrical Single Lines and Schematics. . . . . . . . . . . . . . . . . . . . . . . . . . . . . . . 11Electronic Diagrams and Schematics. . . . . . . . . . . . . . . . . . . . . . . . . . . . . . . . 13Logic Diagrams and Prints. . . . . . . . . . . . . . . . . . . . . . . . . . . . . . . . . . . . . . . 14Fabrication, Construction, and Architectural Drawings. . . . . . . . . . . . . . . . . . . . 14Drawing Format . . . . . . . . . . . . . . . . . . . . . . . . . . . . . . . . . . . . . . . . . . . . . . 16Views and Perspectives. . . . . . . . . . . . . . . . . . . . . . . . . . . . . . . . . . . . . . . . . 19Summary . . . . . . . . . . . . . . . . . . . . . . . . . . . . . . . . . . . . . . . . . . . . . . . . . . . 22
Rev. 0 Page i PR-01
LIST OF FIGURES DOE-HDBK-1016/1-93 Introduction To Print Reading
LIST OF FIGURES
Figure 1 Title Block . . . . . . . . . . . . . . . . . . . . . . . . . . . . . . . . . . . . . . . . . . . . . . . . . 3
Figure 2 Example of a Grid. . . . . . . . . . . . . . . . . . . . . . . . . . . . . . . . . . . . . . . . . . . . 5
Figure 3 Revision Block. . . . . . . . . . . . . . . . . . . . . . . . . . . . . . . . . . . . . . . . . . . . . . 6
Figure 4 Methods of Denoting Changes. . . . . . . . . . . . . . . . . . . . . . . . . . . . . . . . . . . . 7
Figure 5 Notes and Legends. . . . . . . . . . . . . . . . . . . . . . . . . . . . . . . . . . . . . . . . . . . 8
Figure 6 Example P&ID . . . . . . . . . . . . . . . . . . . . . . . . . . . . . . . . . . . . . . . . . . . . . 10
Figure 7 Example of a Single Line. . . . . . . . . . . . . . . . . . . . . . . . . . . . . . . . . . . . . . 11
Figure 8 Example of a Schematic. . . . . . . . . . . . . . . . . . . . . . . . . . . . . . . . . . . . . . . 12
Figure 9 Example of an Electronic Diagram. . . . . . . . . . . . . . . . . . . . . . . . . . . . . . . 13
Figure 10 Example of a Logic Print. . . . . . . . . . . . . . . . . . . . . . . . . . . . . . . . . . . . . 14
Figure 11 Example of a Fabrication Drawing. . . . . . . . . . . . . . . . . . . . . . . . . . . . . . . 15
Figure 12 Example of a Single Line P&ID. . . . . . . . . . . . . . . . . . . . . . . . . . . . . . . . 16
Figure 13 Example Pictorial. . . . . . . . . . . . . . . . . . . . . . . . . . . . . . . . . . . . . . . . . . . 17
Figure 14 Example of an Assembly Drawing. . . . . . . . . . . . . . . . . . . . . . . . . . . . . . . 17
Figure 15 Example of a Cutaway. . . . . . . . . . . . . . . . . . . . . . . . . . . . . . . . . . . . . . . 18
Figure 16 Example Orthographic Projection. . . . . . . . . . . . . . . . . . . . . . . . . . . . . . . . 19
Figure 17 Orthographic Projections. . . . . . . . . . . . . . . . . . . . . . . . . . . . . . . . . . . . . . 20
Figure 18 Example of an Isometric. . . . . . . . . . . . . . . . . . . . . . . . . . . . . . . . . . . . . . 21
PR-01 Page ii Rev. 0
Introduction To Print Reading DOE-HDBK-1016/1-93 INTRODUCTION TO PRINT READING
INTRODUCTION TO PRINT READING
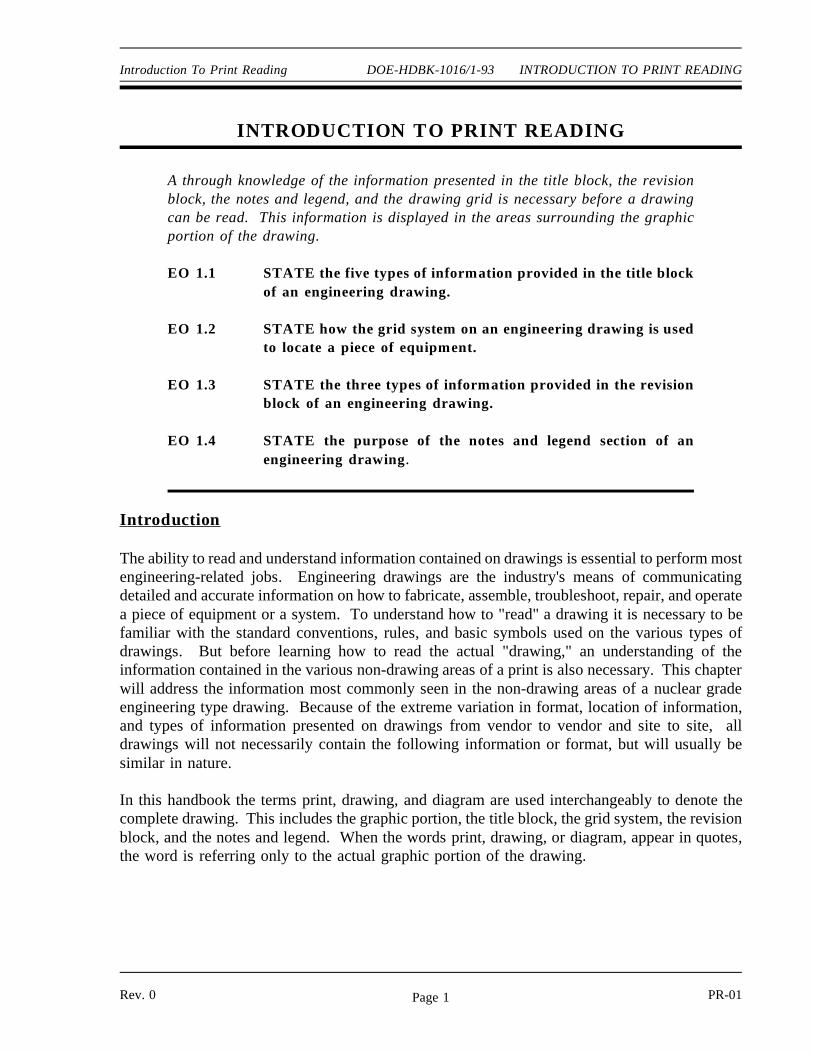
A through knowledge of the information presented in the title block, the revisionblock, the notes and legend, and the drawing grid is necessary before a drawingcan be read. This information is displayed in the areas surrounding the graphicportion of the drawing.
EO 1.1 STATE the five types of information provided in the title blockof an engineering drawing.
EO 1.2 STATE how the grid system on an engineering drawing is usedto locate a piece of equipment.
EO 1.3 STATE the three types of information provided in the revisionblock of an engineering drawing.
EO 1.4 STATE the purpose of the notes and legend section of anengineering drawing.
I ntr oduction
The ability to read and understand information contained on drawings is essential to perform mostengineering-related jobs. Engineering drawings are the industry's means of communicatingdetailed and accurate information on how to fabricate, assemble, troubleshoot, repair, and operatea piece of equipment or a system. To understand how to "read" a drawing it is necessary to befamiliar with the standard conventions, rules, and basic symbols used on the various types ofdrawings. But before learning how to read the actual "drawing," an understanding of theinformation contained in the various non-drawing areas of a print is also necessary. This chapterwill address the information most commonly seen in the non-drawing areas of a nuclear gradeengineering type drawing. Because of the extreme variation in format, location of information,and types of information presented on drawings from vendor to vendor and site to site, alldrawings will not necessarily contain the following information or format, but will usually besimilar in nature.
In this handbook the terms print, drawing, and diagram are used interchangeably to denote thecomplete drawing. This includes the graphic portion, the title block, the grid system, the revisionblock, and the notes and legend. When the words print, drawing, or diagram, appear in quotes,the word is referring only to the actual graphic portion of the drawing.
Rev. 0 PR-01Page 1
INTRODUCTION TO PRINT READING DOE-HDBK-1016/1-93 Introduction To Print Reading
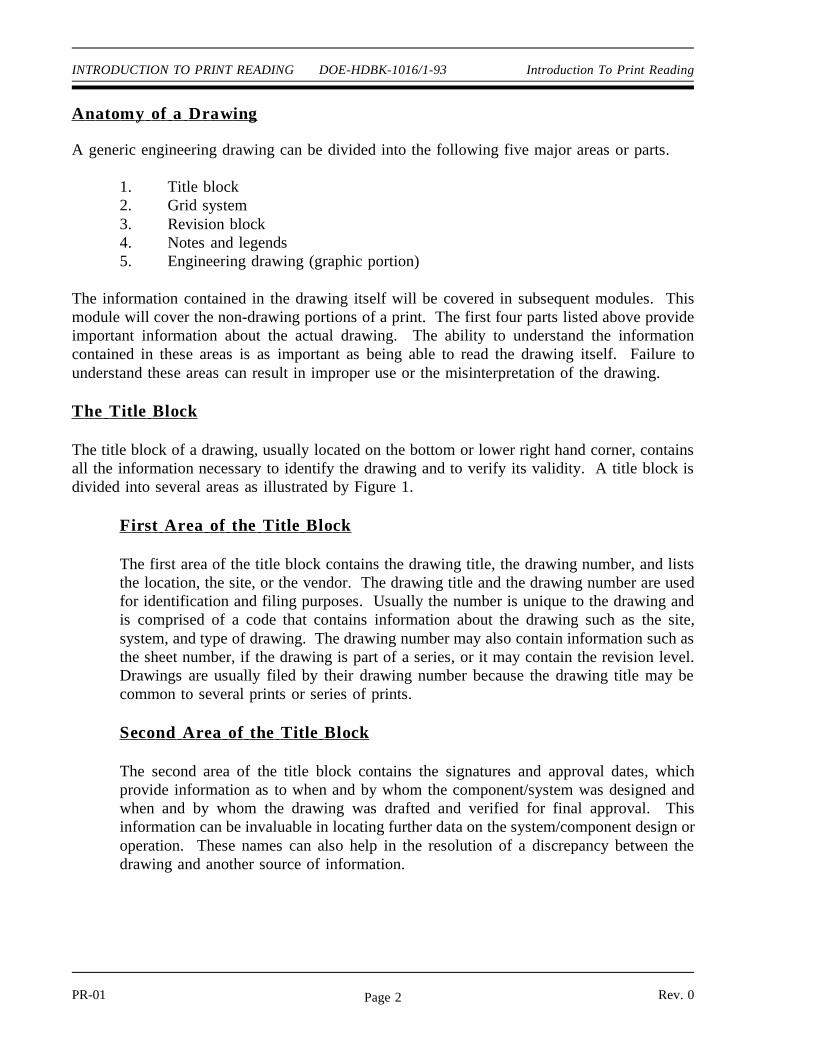
Anatomy of a Dr awing
A generic engineering drawing can be divided into the following five major areas or parts.
1. Title block2. Grid system3. Revision block4. Notes and legends5. Engineering drawing (graphic portion)
The information contained in the drawing itself will be covered in subsequent modules. Thismodule will cover the non-drawing portions of a print. The first four parts listed above provideimportant information about the actual drawing. The ability to understand the informationcontained in these areas is as important as being able to read the drawing itself. Failure tounderstand these areas can result in improper use or the misinterpretation of the drawing.
The T itle Block
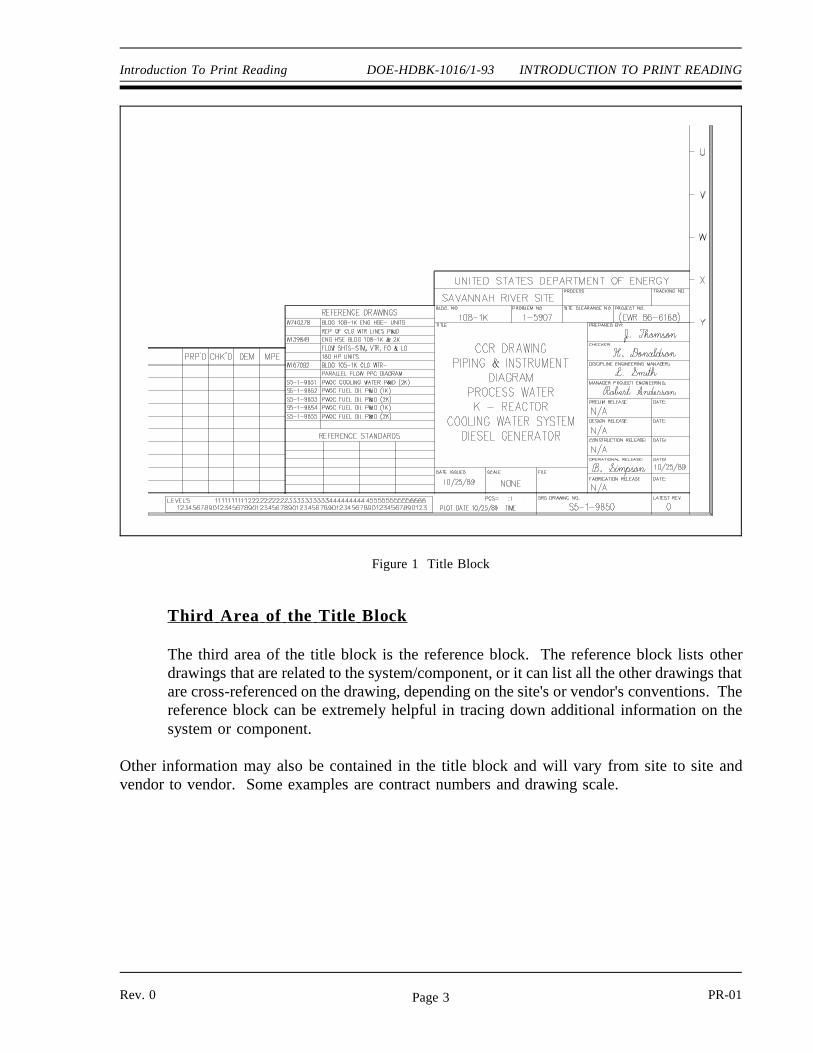
The title block of a drawing, usually located on the bottom or lower right hand corner, containsall the information necessary to identify the drawing and to verify its validity. A title block isdivided into several areas as illustrated by Figure 1.
Fir st A r ea of the T itle Block
The first area of the title block contains the drawing title, the drawing number, and liststhe location, the site, or the vendor. The drawing title and the drawing number are usedfor identification and filing purposes. Usually the number is unique to the drawing andis comprised of a code that contains information about the drawing such as the site,system, and type of drawing. The drawing number may also contain information such asthe sheet number, if the drawing is part of a series, or it may contain the revision level.Drawings are usually filed by their drawing number because the drawing title may becommon to several prints or series of prints.
Second Ar ea of the T itle Block
The second area of the title block contains the signatures and approval dates, whichprovide information as to when and by whom the component/system was designed andwhen and by whom the drawing was drafted and verified for final approval. Thisinformation can be invaluable in locating further data on the system/component design oroperation. These names can also help in the resolution of a discrepancy between thedrawing and another source of information.
PR-01 Rev. 0Page 2
Introduction To Print Reading DOE-HDBK-1016/1-93 INTRODUCTION TO PRINT READING
Thir d A r ea of the T itle Block
Figure 1 Title Block
The third area of the title block is the reference block. The reference block lists otherdrawings that are related to the system/component, or it can list all the other drawings thatare cross-referenced on the drawing, depending on the site's or vendor's conventions. Thereference block can be extremely helpful in tracing down additional information on thesystem or component.
Other information may also be contained in the title block and will vary from site to site andvendor to vendor. Some examples are contract numbers and drawing scale.
Rev. 0 PR-01Page 3
INTRODUCTION TO PRINT READING DOE-HDBK-1016/1-93 Introduction To Print Reading
Dr awing Scale
All drawings can be classified as either drawings with scale or those not drawn to scale.Drawings without a scale usually are intended to present only functional information aboutthe component or system. Prints drawn to scale allow the figures to be renderedaccurately and precisely. Scale drawings also allow components and systems that are toolarge to be drawn full size to be drawn in a more convenient and easy to read size. Theopposite is also true. A very small component can be scaled up, or enlarged, so that itsdetails can be seen when drawn on paper.
Scale drawings usually present the information used to fabricate or construct a componentor system. If a drawing is drawn to scale, it can be used to obtain information such asphysical dimensions, tolerances, and materials that allows the fabrication or constructionof the component or system. Every dimension of a component or system does not haveto be stated in writing on the drawing because the user can actually measure the distance(e.g., the length of a part) from the drawing and divide or multiply by the stated scale toobtain the correct measurements.
The scale of a drawing is usually presented as a ratio and is read as illustrated in thefollowing examples.
1" = 1" Read as 1 inch (on the drawing) equals 1 inch (on the actualcomponent or system). This can also be stated as FULL SIZE inthe scale block of the drawing. The measured distance on thedrawing is the actual distance or size of the component.
3/8" = 1' Read as 3/8 inch (on the drawing) equals 1 foot (on the actualcomponent or system). This is called 3/8 scale. For example, if acomponent part measures 6/8 inch on the drawing, the actualcomponent measures 2 feet.
1/2" = 1' Read as 1/2 inch (on the drawing) equals 1 foot (on the actualcomponent or system). This is called 1/2 scale. For example, if acomponent part measures 1-1/2 inches on the drawing the actualcomponent measures 3 feet.
PR-01 Rev. 0Page 4
Introduction To Print Reading DOE-HDBK-1016/1-93 INTRODUCTION TO PRINT READING
Gr id System
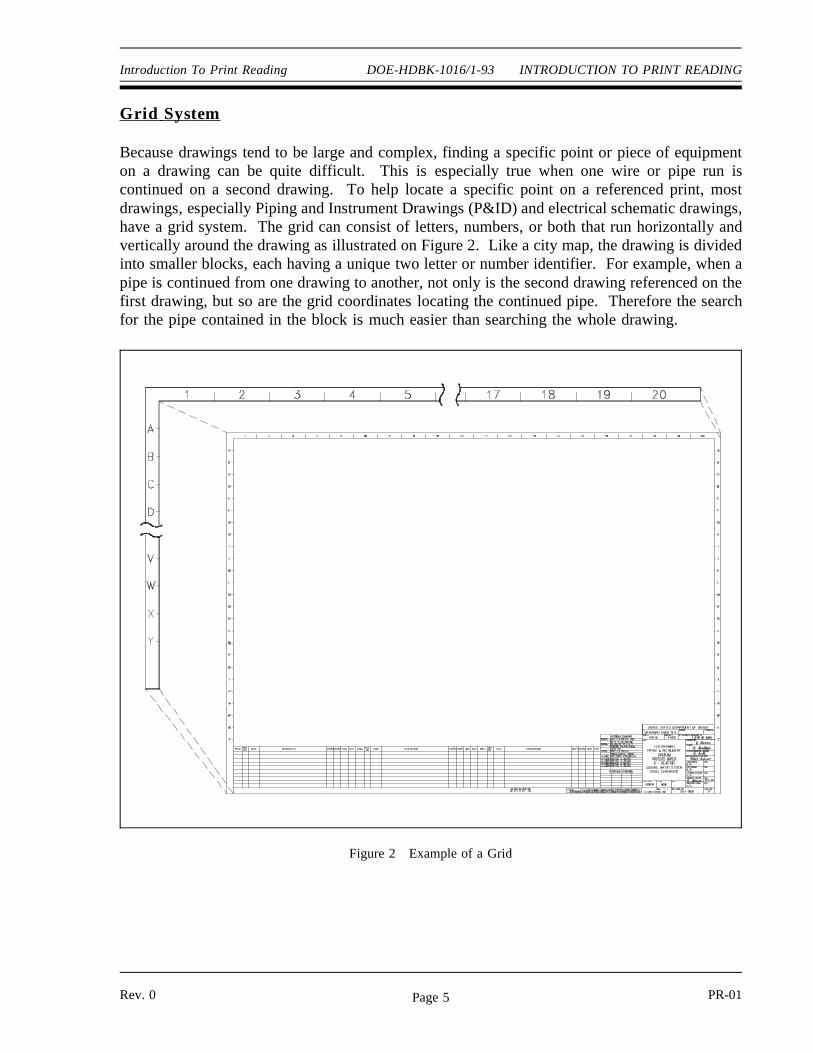
Because drawings tend to be large and complex, finding a specific point or piece of equipmenton a drawing can be quite difficult. This is especially true when one wire or pipe run iscontinued on a second drawing. To help locate a specific point on a referenced print, mostdrawings, especially Piping and Instrument Drawings (P&ID) and electrical schematic drawings,have a grid system. The grid can consist of letters, numbers, or both that run horizontally andvertically around the drawing as illustrated on Figure 2. Like a city map, the drawing is dividedinto smaller blocks, each having a unique two letter or number identifier. For example, when apipe is continued from one drawing to another, not only is the second drawing referenced on thefirst drawing, but so are the grid coordinates locating the continued pipe. Therefore the searchfor the pipe contained in the block is much easier than searching the whole drawing.
Figure 2 Example of a Grid
Rev. 0 PR-01Page 5
INTRODUCTION TO PRINT READING DOE-HDBK-1016/1-93 Introduction To Print Reading
Revision Block
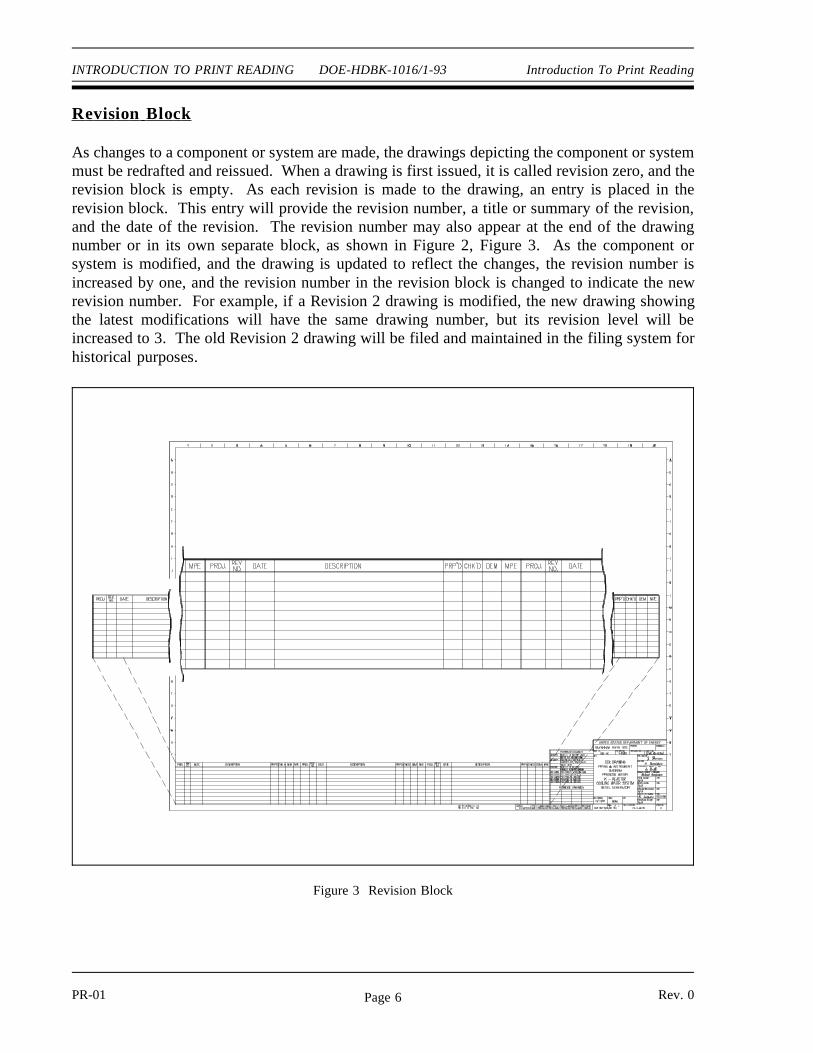
As changes to a component or system are made, the drawings depicting the component or systemmust be redrafted and reissued. When a drawing is first issued, it is called revision zero, and therevision block is empty. As each revision is made to the drawing, an entry is placed in therevision block. This entry will provide the revision number, a title or summary of the revision,and the date of the revision. The revision number may also appear at the end of the drawingnumber or in its own separate block, as shown in Figure 2, Figure 3. As the component orsystem is modified, and the drawing is updated to reflect the changes, the revision number isincreased by one, and the revision number in the revision block is changed to indicate the newrevision number. For example, if a Revision 2 drawing is modified, the new drawing showingthe latest modifications will have the same drawing number, but its revision level will beincreased to 3. The old Revision 2 drawing will be filed and maintained in the filing system forhistorical purposes.
Figure 3 Revision Block
PR-01 Rev. 0Page 6
Introduction To Print Reading DOE-HDBK-1016/1-93 INTRODUCTION TO PRINT READING
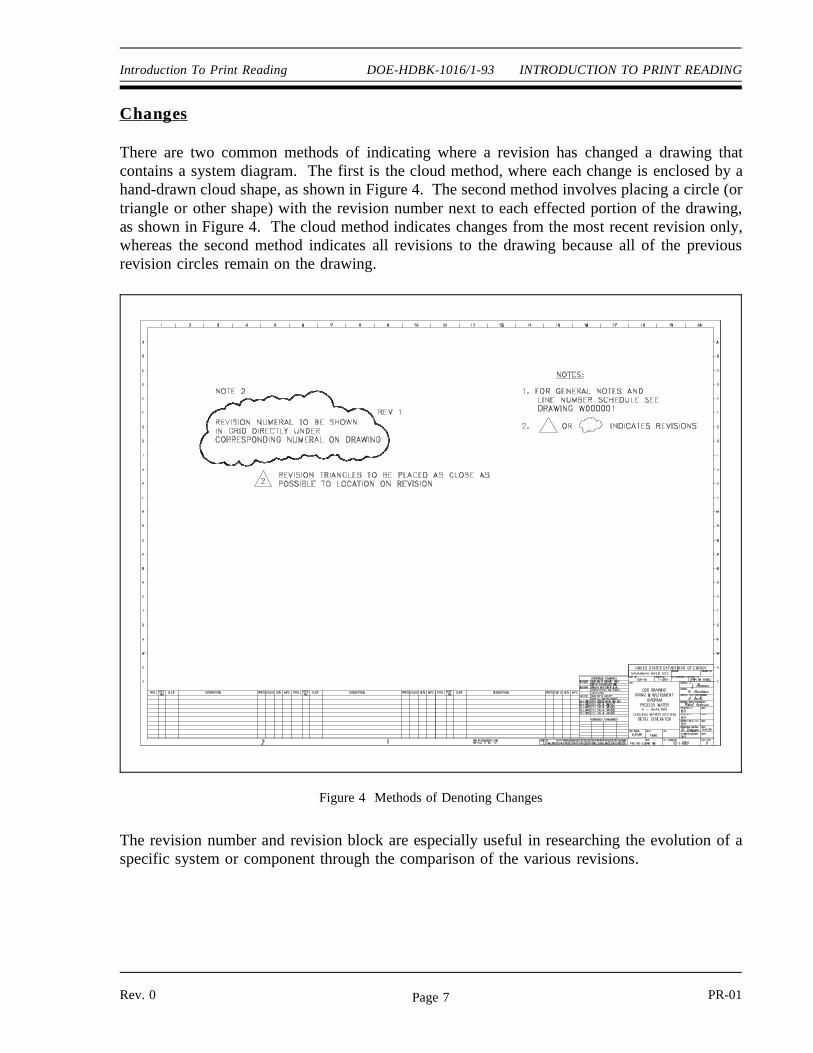
Changes
There are two common methods of indicating where a revision has changed a drawing thatcontains a system diagram. The first is the cloud method, where each change is enclosed by ahand-drawn cloud shape, as shown in Figure 4. The second method involves placing a circle (ortriangle or other shape) with the revision number next to each effected portion of the drawing,as shown in Figure 4. The cloud method indicates changes from the most recent revision only,whereas the second method indicates all revisions to the drawing because all of the previousrevision circles remain on the drawing.
The revision number and revision block are especially useful in researching the evolution of a
Figure 4 Methods of Denoting Changes
specific system or component through the comparison of the various revisions.
Rev. 0 PR-01Page 7
INTRODUCTION TO PRINT READING DOE-HDBK-1016/1-93 Introduction To Print Reading
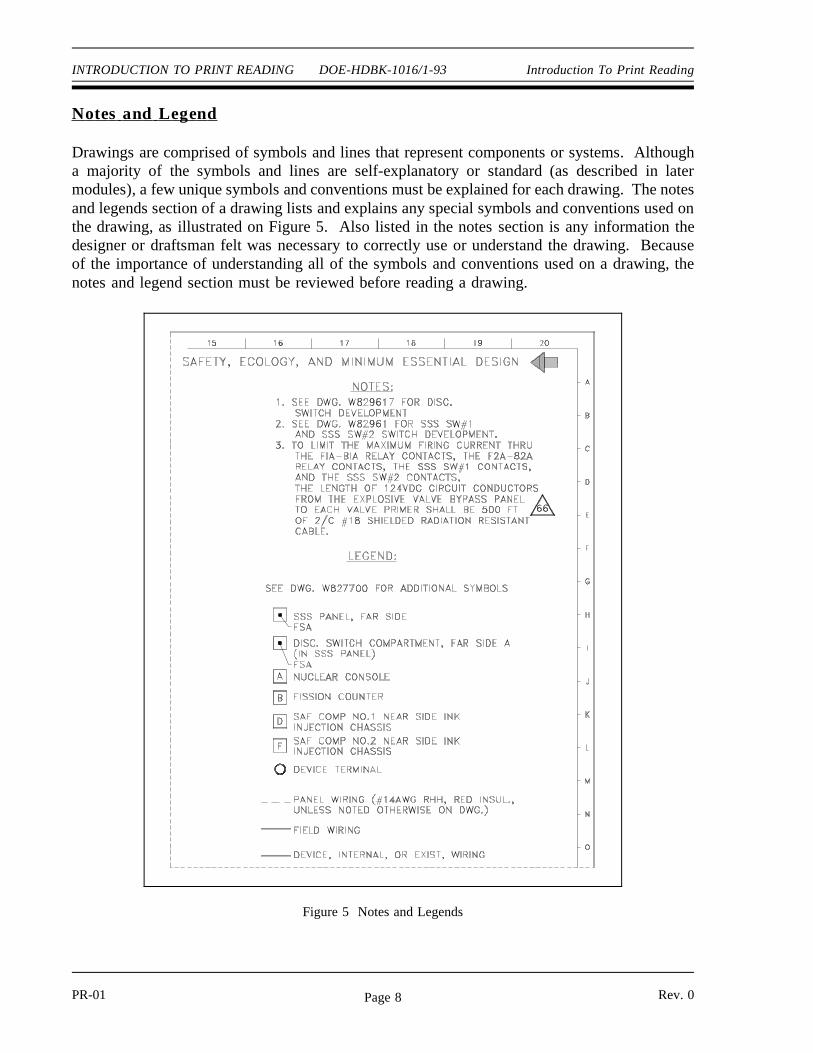
Notes and L egend
Drawings are comprised of symbols and lines that represent components or systems. Althougha majority of the symbols and lines are self-explanatory or standard (as described in latermodules), a few unique symbols and conventions must be explained for each drawing. The notesand legends section of a drawing lists and explains any special symbols and conventions used onthe drawing, as illustrated on Figure 5. Also listed in the notes section is any information thedesigner or draftsman felt was necessary to correctly use or understand the drawing. Becauseof the importance of understanding all of the symbols and conventions used on a drawing, thenotes and legend section must be reviewed before reading a drawing.
Figure 5 Notes and Legends
PR-01 Rev. 0Page 8
Introduction To Print Reading DOE-HDBK-1016/1-93 INTRODUCTION TO PRINT READING
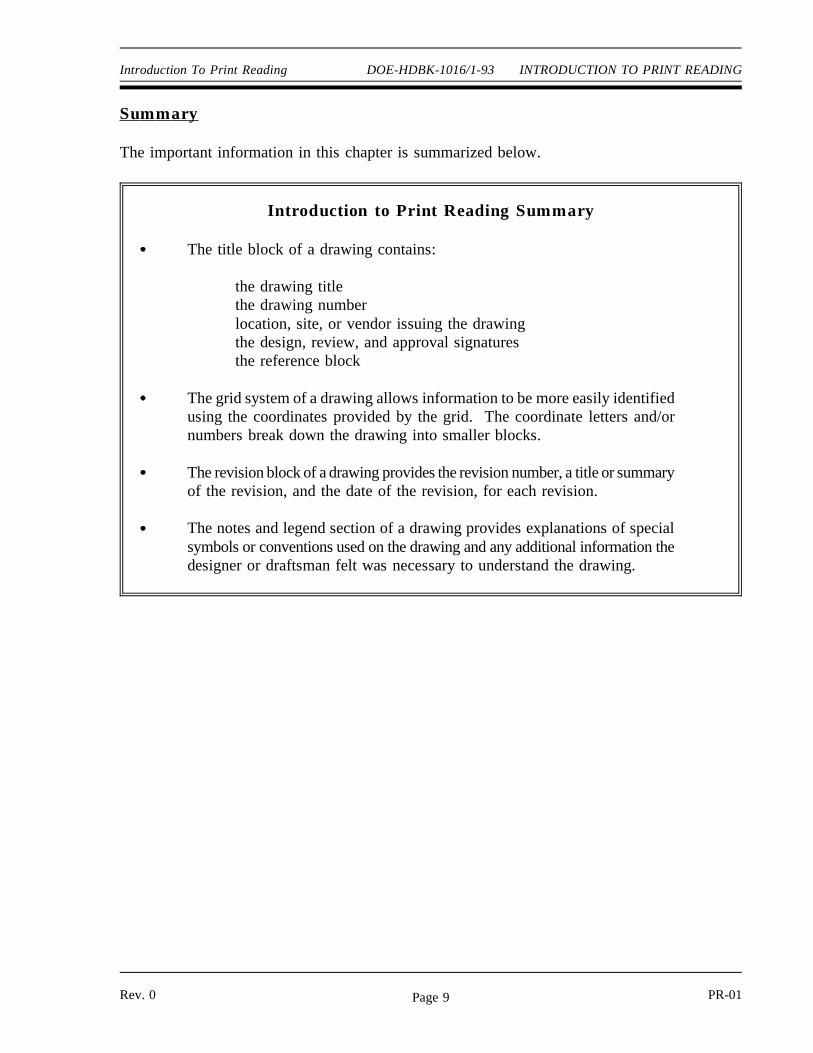
Summary
The important information in this chapter is summarized below.
Introduction to Print Reading Summary
The title block of a drawing contains:
the drawing titlethe drawing numberlocation, site, or vendor issuing the drawingthe design, review, and approval signaturesthe reference block
The grid system of a drawing allows information to be more easily identifiedusing the coordinates provided by the grid. The coordinate letters and/ornumbers break down the drawing into smaller blocks.
The revision block of a drawing provides the revision number, a title or summaryof the revision, and the date of the revision, for each revision.
The notes and legend section of a drawing provides explanations of specialsymbols or conventions used on the drawing and any additional information thedesigner or draftsman felt was necessary to understand the drawing.
Rev. 0 PR-01Page 9
INTRODUCTION TO THE TYPES DOE-HDBK-1016/1-93 Introduction To Print ReadingOF DRAWINGS, VIEWS, AND PERSPECTIVES
Figure 6 Example P&ID
INTRODUCTION TO THE TYPES OF DRAWINGS, VIEWS, AND PERSPECTIVES
To read a drawing correctly, the user must have a basic understanding of thevarious categories of drawings and the views and perspectives in which eachdrawing can be presented.
EO 1.5 LIST the five drawing categories used on engineering drawings.
Categor ies of Dr awings
The previous chapter reviewed the non-drawing portions of a print. This chapter will introducethe five common categories of drawings. They are 1) piping and instrument drawings (P&IDs),2) electrical single lines and schematics, 3) electronic diagrams and schematics, 4) logic diagramsand prints, and 5) fabrication, construction, and architectural drawings.
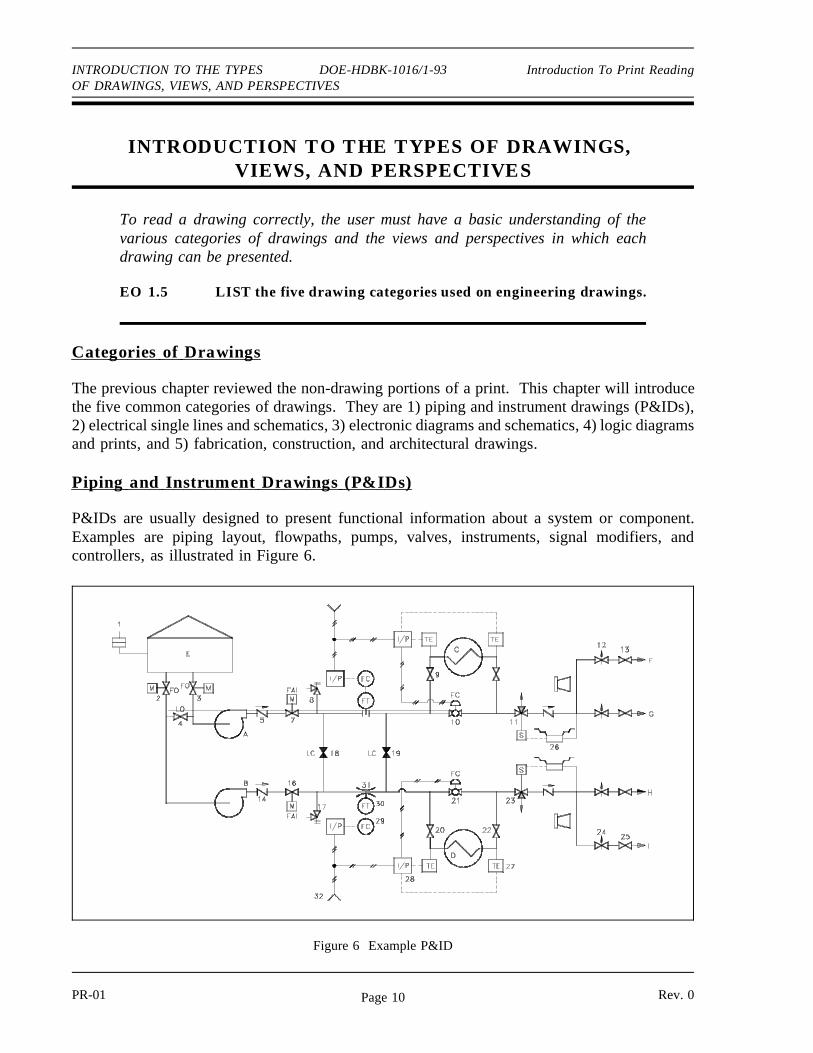
Piping and I nstr ument Dr awings (P& I Ds)
P&IDs are usually designed to present functional information about a system or component.Examples are piping layout, flowpaths, pumps, valves, instruments, signal modifiers, andcontrollers, as illustrated in Figure 6.
PR-01 Rev. 0Page 10
Introduction To Print Reading DOE-HDBK-1016/1-93 INTRODUCTION TO THE TYPESOF DRAWINGS, VIEWS, AND PERSPECTIVES
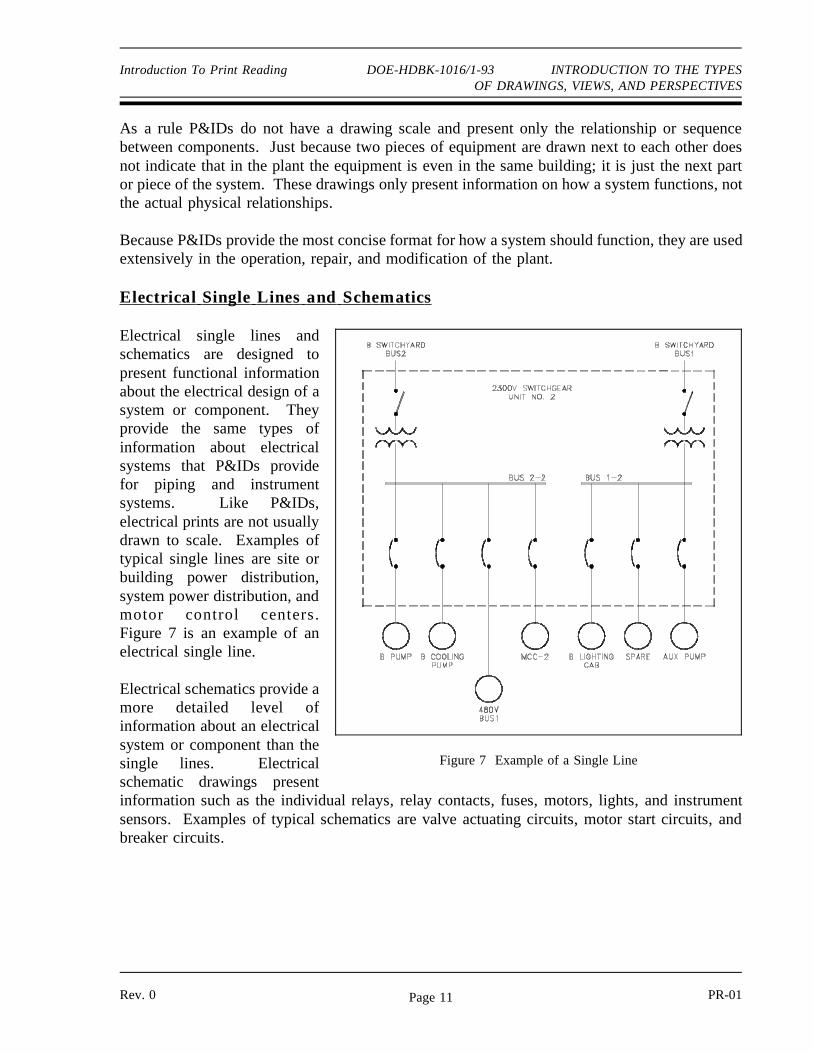
As a rule P&IDs do not have a drawing scale and present only the relationship or sequencebetween components. Just because two pieces of equipment are drawn next to each other doesnot indicate that in the plant the equipment is even in the same building; it is just the next partor piece of the system. These drawings only present information on how a system functions, notthe actual physical relationships.
Because P&IDs provide the most concise format for how a system should function, they are usedextensively in the operation, repair, and modification of the plant.
Electr ical Single L ines and Schematics
Electrical single lines and
Figure 7 Example of a Single Line
schematics are designed topresent functional informationabout the electrical design of asystem or component. Theyprovide the same types ofinformation about electricalsystems that P&IDs providefor piping and instrumentsystems. Like P&IDs,electrical prints are not usuallydrawn to scale. Examples oftypical single lines are site orbuilding power distribution,system power distribution, andmotor control centers.Figure 7 is an example of anelectrical single line.
Electrical schematics provide amore detailed level ofinformation about an electricalsystem or component than thesingle lines. Electricalschematic drawings presentinformation such as the individual relays, relay contacts, fuses, motors, lights, and instrumentsensors. Examples of typical schematics are valve actuating circuits, motor start circuits, andbreaker circuits.
Rev. 0 PR-01Page 11
INTRODUCTION TO THE TYPES DOE-HDBK-1016/1-93 Introduction to Print ReadingOF DRAWINGS, VIEWS, AND PERSPECTIVES
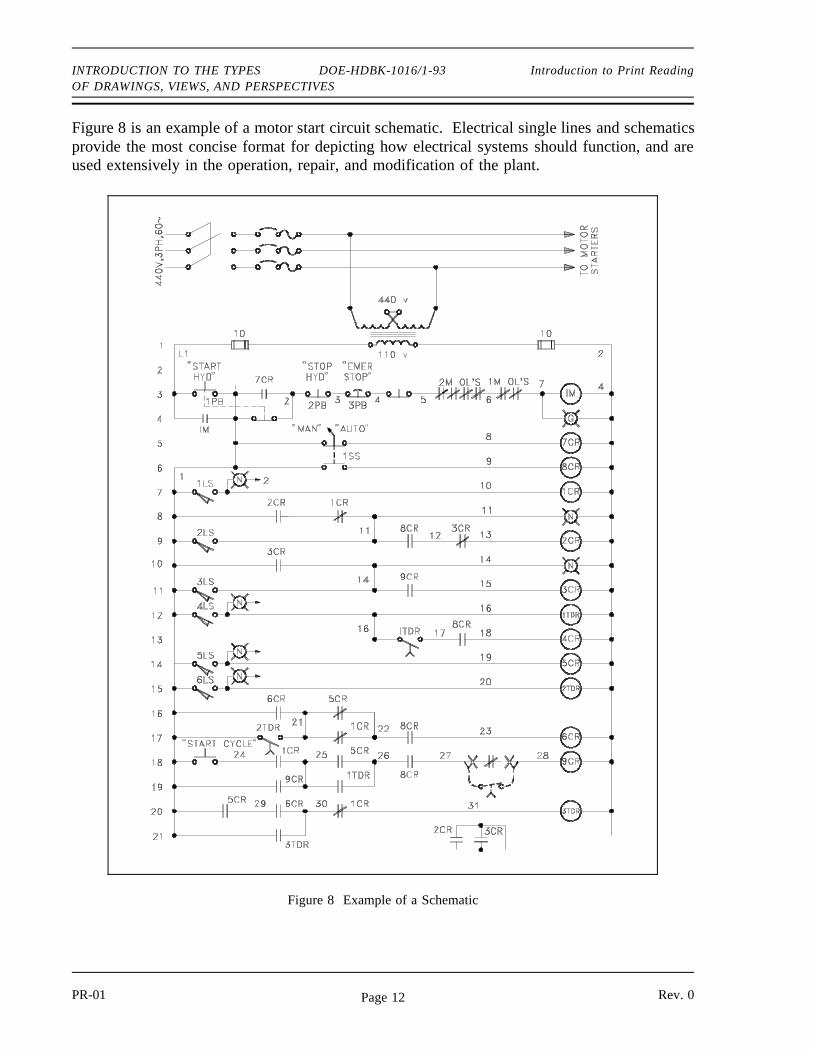
Figure 8 is an example of a motor start circuit schematic. Electrical single lines and schematicsprovide the most concise format for depicting how electrical systems should function, and areused extensively in the operation, repair, and modification of the plant.
Figure 8 Example of a Schematic
PR-01 Rev. 0Page 12
Introduction to Print Reading DOE-HDBK-1016/1-93 INTRODUCTION TO THE TYPESOF DRAWINGS, VIEWS, AND PERSPECTIVES
Electr onic Diagrams and Schematics
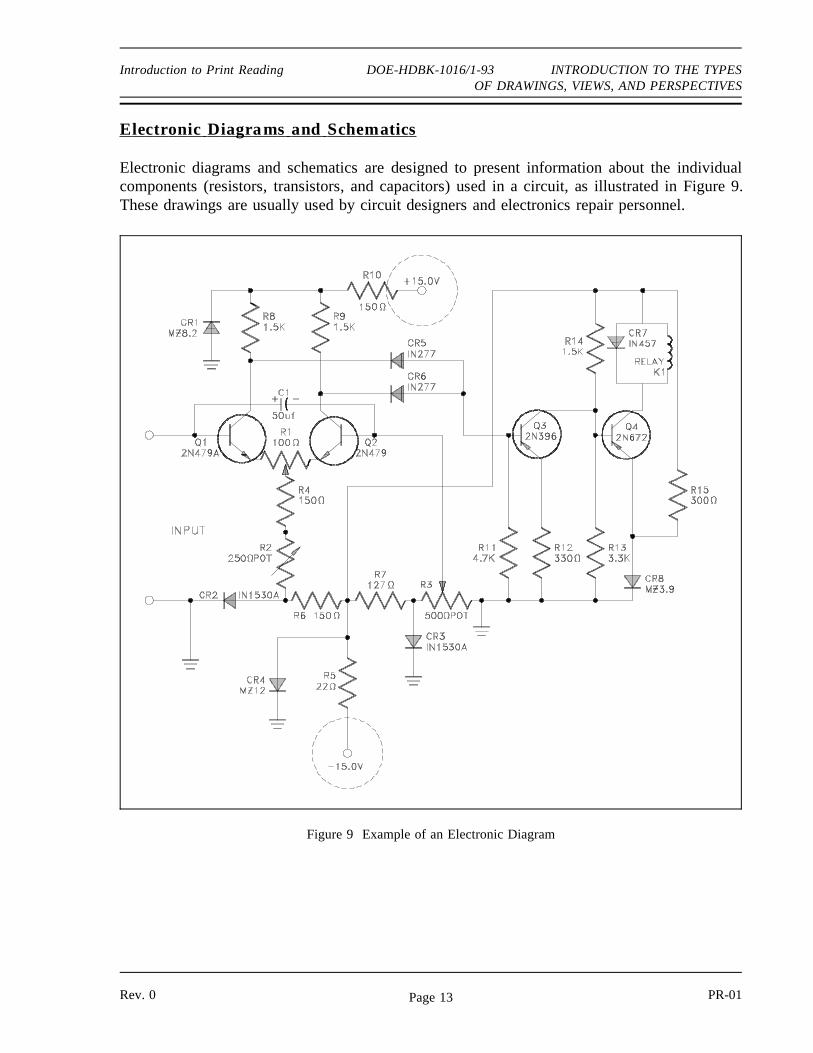
Electronic diagrams and schematics are designed to present information about the individualcomponents (resistors, transistors, and capacitors) used in a circuit, as illustrated in Figure 9.These drawings are usually used by circuit designers and electronics repair personnel.
Figure 9 Example of an Electronic Diagram
Rev. 0 PR-01Page 13
INTRODUCTION TO THE TYPES DOE-HDBK-1016/1-93 Introduction to Print ReadingOF DRAWINGS, VIEWS, AND PERSPECTIVES
L ogic Diagrams and Pr ints
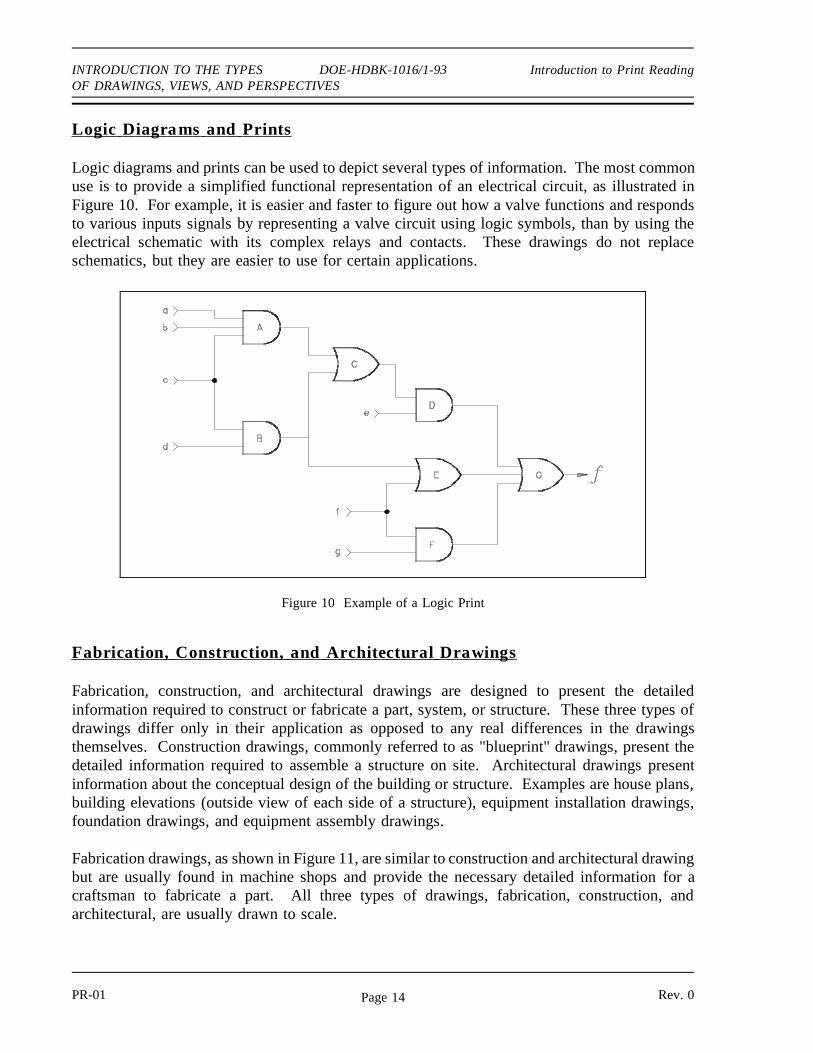
Logic diagrams and prints can be used to depict several types of information. The most commonuse is to provide a simplified functional representation of an electrical circuit, as illustrated inFigure 10. For example, it is easier and faster to figure out how a valve functions and respondsto various inputs signals by representing a valve circuit using logic symbols, than by using theelectrical schematic with its complex relays and contacts. These drawings do not replaceschematics, but they are easier to use for certain applications.
Figure 10 Example of a Logic Print
Fabrication, Constr uction, and A r chitectur al Dr awings
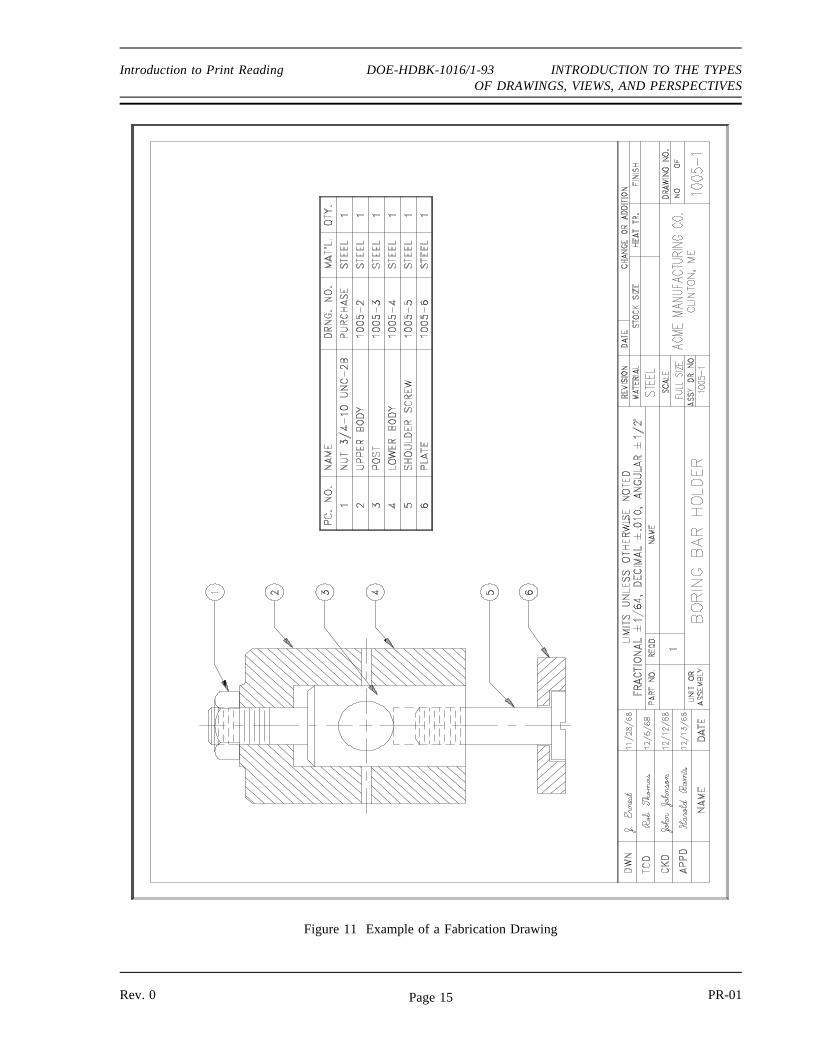
Fabrication, construction, and architectural drawings are designed to present the detailedinformation required to construct or fabricate a part, system, or structure. These three types ofdrawings differ only in their application as opposed to any real differences in the drawingsthemselves. Construction drawings, commonly referred to as "blueprint" drawings, present thedetailed information required to assemble a structure on site. Architectural drawings presentinformation about the conceptual design of the building or structure. Examples are house plans,building elevations (outside view of each side of a structure), equipment installation drawings,foundation drawings, and equipment assembly drawings.
Fabrication drawings, as shown in Figure 11, are similar to construction and architectural drawingbut are usually found in machine shops and provide the necessary detailed information for acraftsman to fabricate a part. All three types of drawings, fabrication, construction, andarchitectural, are usually drawn to scale.
PR-01 Rev. 0Page 14
Introduction to Print Reading DOE-HDBK-1016/1-93 INTRODUCTION TO THE TYPESOF DRAWINGS, VIEWS, AND PERSPECTIVES
Figure 11 Example of a Fabrication Drawing
Rev. 0 PR-01Page 15
INTRODUCTION TO THE TYPES DOE-HDBK-1016/1-93 Introduction to Print ReadingOF DRAWINGS, VIEWS, AND PERSPECTIVES
Dr awing For mat
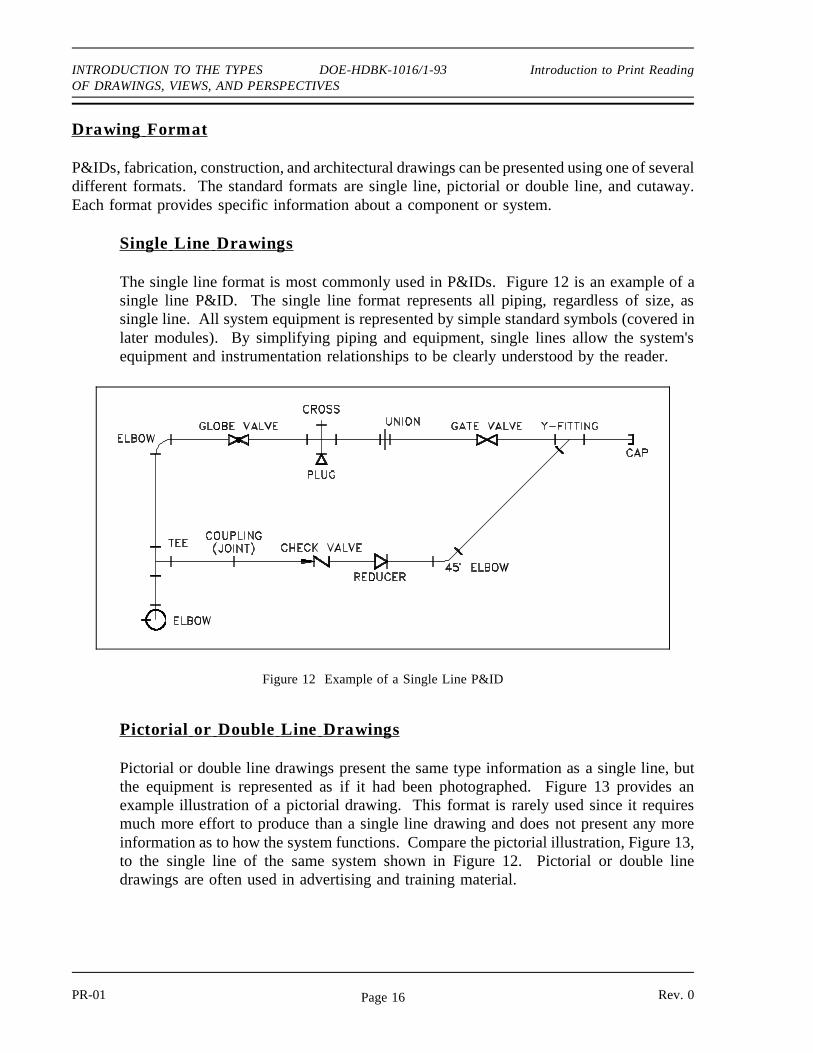
P&IDs, fabrication, construction, and architectural drawings can be presented using one of severaldifferent formats. The standard formats are single line, pictorial or double line, and cutaway.Each format provides specific information about a component or system.
Single L ine Dr awings
The single line format is most commonly used in P&IDs. Figure 12 is an example of asingle line P&ID. The single line format represents all piping, regardless of size, assingle line. All system equipment is represented by simple standard symbols (covered inlater modules). By simplifying piping and equipment, single lines allow the system'sequipment and instrumentation relationships to be clearly understood by the reader.
Pictor ial or Double L ine Dr awings
Figure 12 Example of a Single Line P&ID
Pictorial or double line drawings present the same type information as a single line, butthe equipment is represented as if it had been photographed. Figure 13 provides anexample illustration of a pictorial drawing. This format is rarely used since it requiresmuch more effort to produce than a single line drawing and does not present any moreinformation as to how the system functions. Compare the pictorial illustration, Figure 13,to the single line of the same system shown in Figure 12. Pictorial or double linedrawings are often used in advertising and training material.
PR-01 Rev. 0Page 16
Introduction To Print Reading DOE-HDBK-1O16/1-93 INTRODUCTION TO THE TYPESOF DRAWINGS, VIEWS, AND PERSPECTIVES
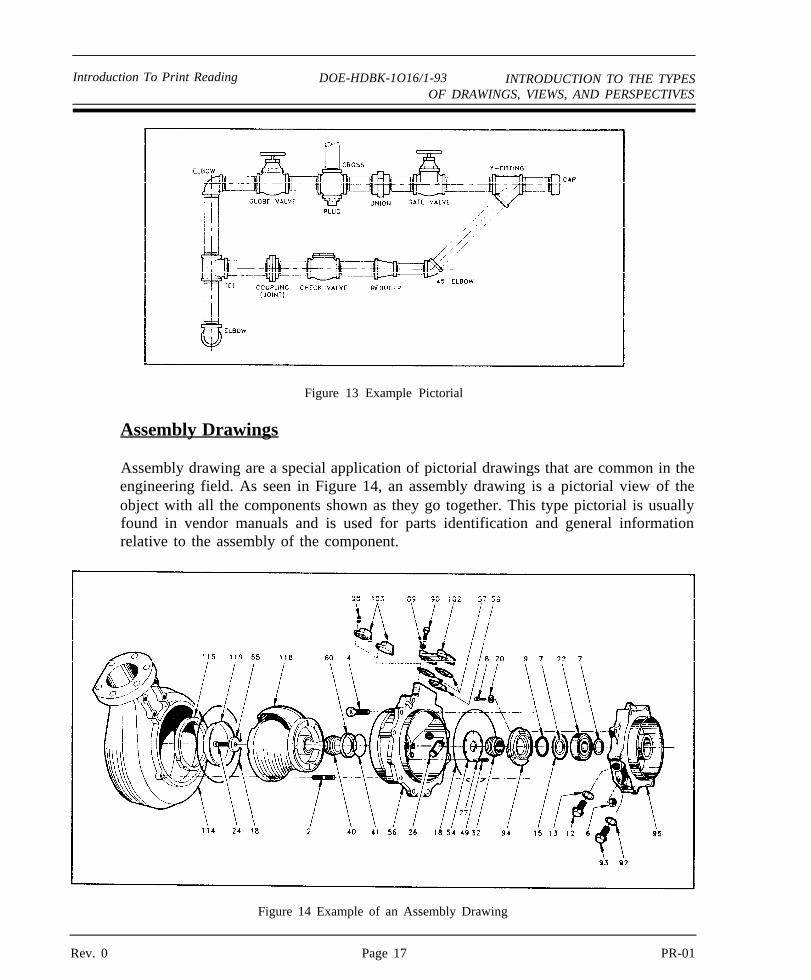
Figure 13 Example Pictorial
Assembly Drawings
Assembly drawing are a special application of pictorial drawings that are common in theengineering field. As seen in Figure 14, an assembly drawing is a pictorial view of theobject with all the components shown as they go together. This type pictorial is usuallyfound in vendor manuals and is used for parts identification and general informationrelative to the assembly of the component.
Figure 14 Example of an Assembly Drawing
Rev. 0 Page 17 PR-01
INTRODUCTION TO THE TYPES DOE-HDBK1016/1-93 Introduction To Print ReadingOF DRAWINGS, VIEWS, AND PERSPECTIVES
PR-01 Page 18 Rev. 0
Figure 15 Example of a Cutaway
Cutaway Drawings
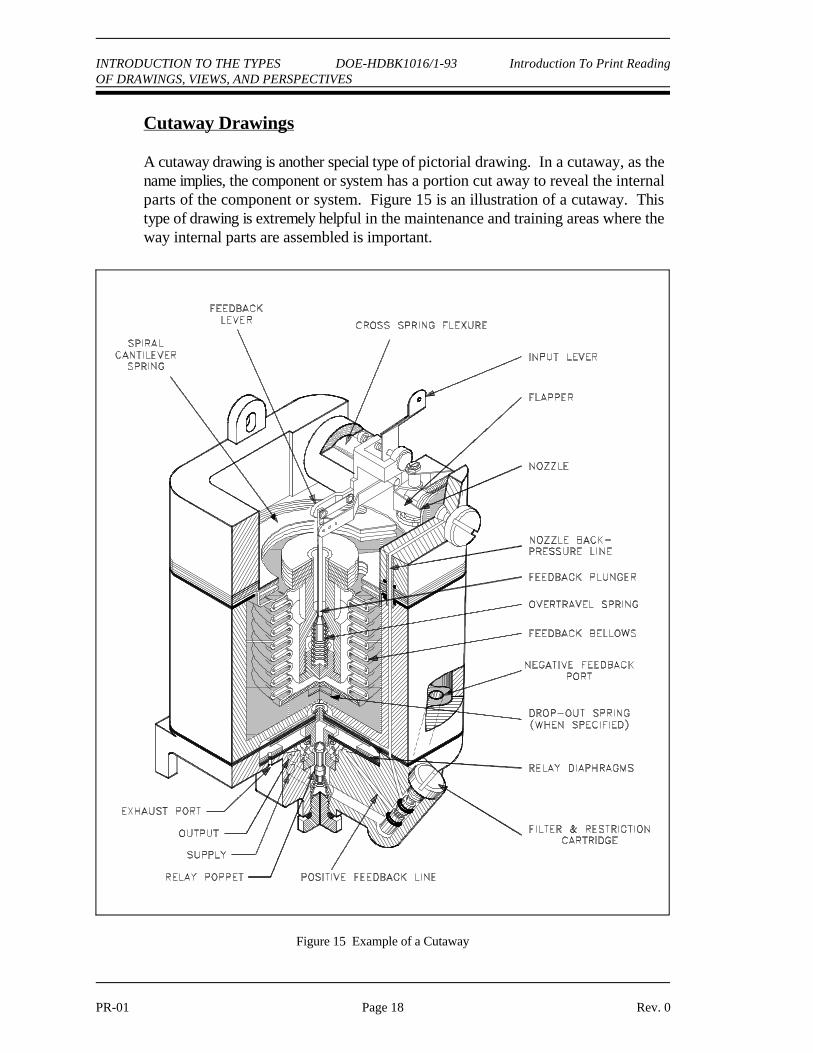
A cutaway drawing is another special type of pictorial drawing. In a cutaway, as thename implies, the component or system has a portion cut away to reveal the internalparts of the component or system. Figure 15 is an illustration of a cutaway. Thistype of drawing is extremely helpful in the maintenance and training areas where theway internal parts are assembled is important.
Introduction To Print Reading DOE-HDBK-1016/1-93 INTRODUCTION TO THE TYPESOF DRAWINGS, VIEWS, AND PERSPECTIVES
Views and Perspectives
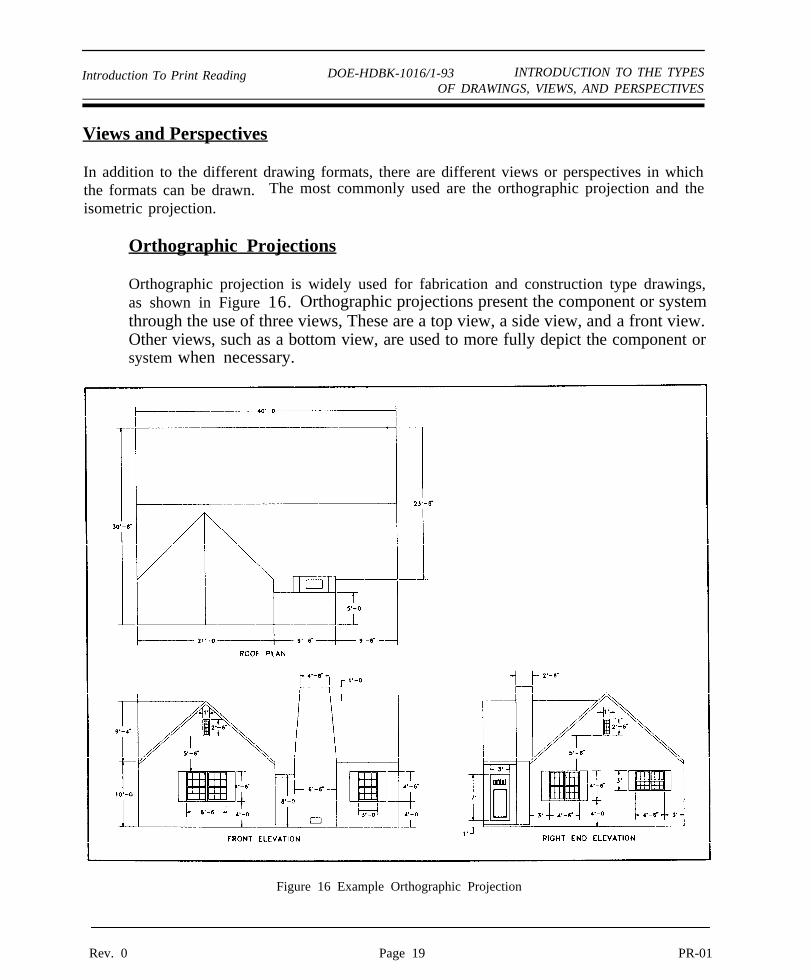
In addition to the different drawing formats, there are different views or perspectives in whichthe formats can be drawn. The most commonly used are the orthographic projection and theisometric projection.
Orthographic Projections
Orthographic projection is widely used for fabrication and construction type drawings,as shown in Figure 16. Orthographic projections present the component or systemthrough the use of three views, These are a top view, a side view, and a front view.Other views, such as a bottom view, are used to more fully depict the component orsystem when necessary.
Figure 16 Example Orthographic Projection
PR-01 Page 19 PR-01Rev. 0 Page 19 PR-01
INTRODUCTION TO THE TYPES DOE-HDBK-1016/1-93 Introduction To Print ReadingOF DRAWINGS, VIEWS, AND PERSPECTIVES
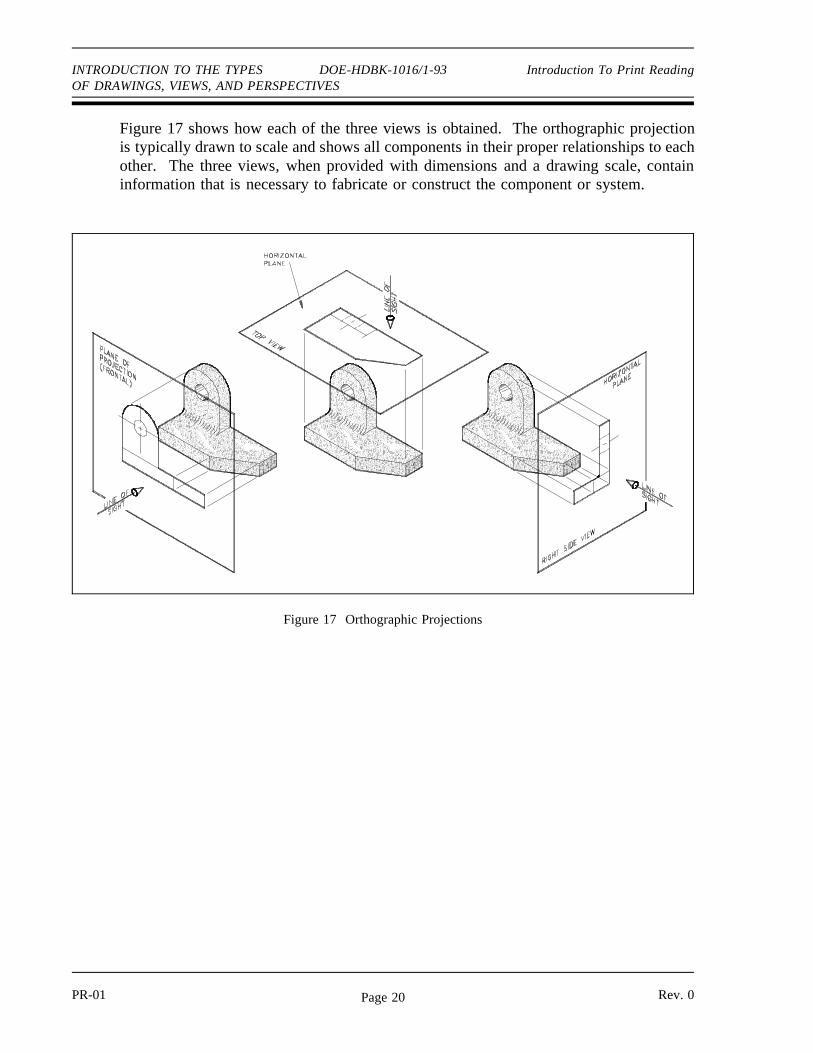
Figure 17 shows how each of the three views is obtained. The orthographic projectionis typically drawn to scale and shows all components in their proper relationships to eachother. The three views, when provided with dimensions and a drawing scale, containinformation that is necessary to fabricate or construct the component or system.
Figure 17 Orthographic Projections
PR-01 Rev. 0Page 20
Introduction To Print Reading DOE-HDBK-1016/1-93 INTRODUCTION TO THE TYPES OF DRAWINGS, VIEWS, AND PERSPECTIVES
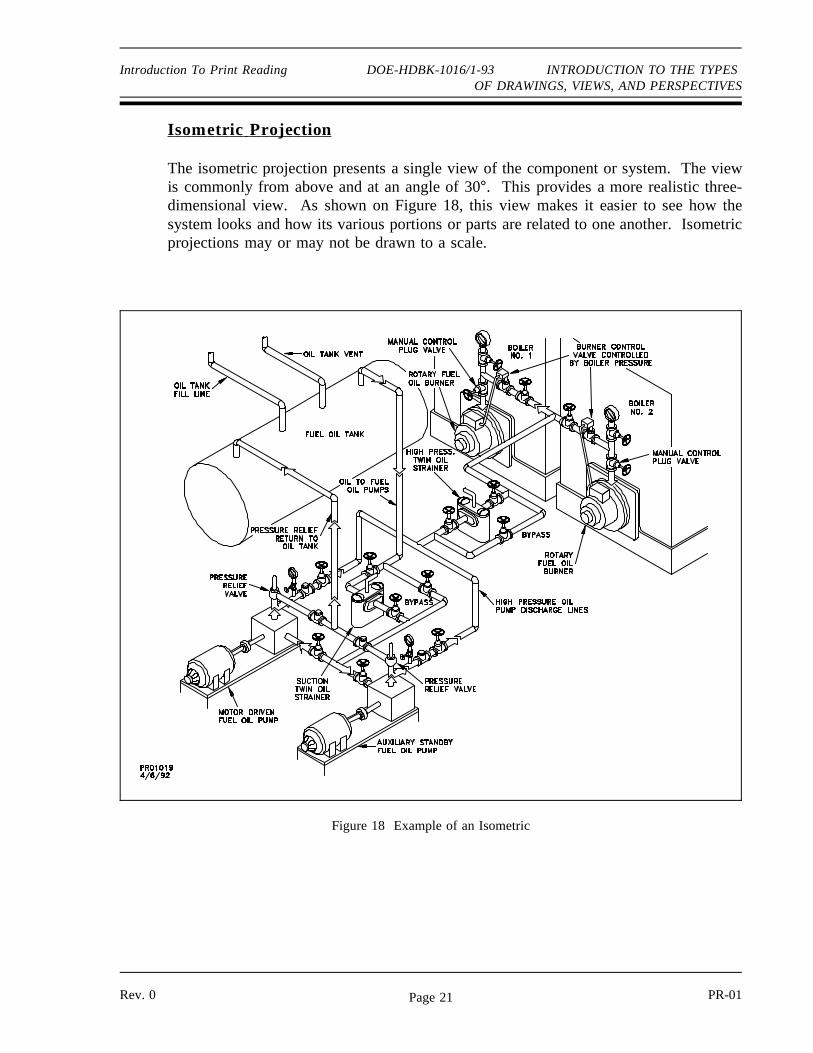
I sometr ic Pr ojection
The isometric projection presents a single view of the component or system. The viewis commonly from above and at an angle of 30°. This provides a more realistic three-dimensional view. As shown on Figure 18, this view makes it easier to see how thesystem looks and how its various portions or parts are related to one another. Isometricprojections may or may not be drawn to a scale.
Figure 18 Example of an Isometric
Rev. 0 PR-01Page 21
INTRODUCTION TO THE TYPES DOE-HDBK-1016/1-93 Introduction To Print ReadingOF DRAWINGS, VIEWS, AND PERSPECTIVES
Summary
The important information in this chapter is summarized below.
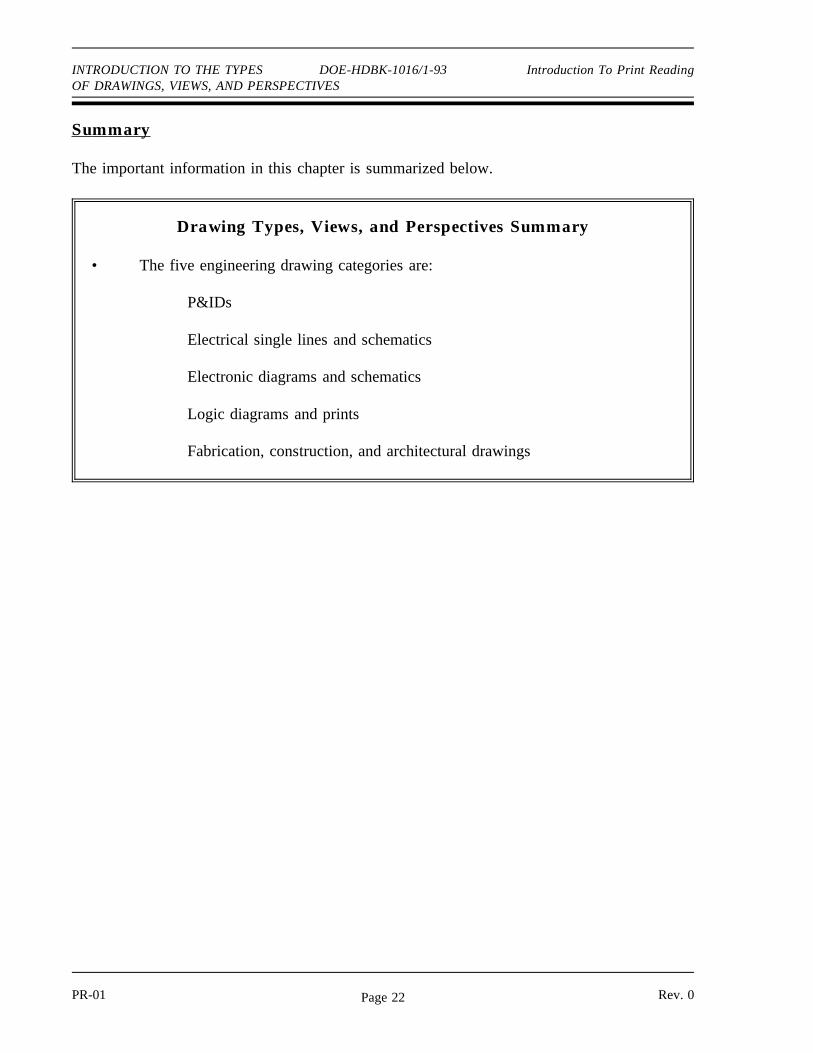
Drawing Types, Views, and Perspectives Summary
• The five engineering drawing categories are:
P&IDs
Electrical single lines and schematics
Electronic diagrams and schematics
Logic diagrams and prints
Fabrication, construction, and architectural drawings
PR-01 Rev. 0Page 22
ENGINEERING SYMBOLOGY, PRINTS,AND DRAWINGS
Module 2Engineering Fluid
Diagrams and Prints
Engineering Fluid Diagrams and Prints DOE-HDBK-1016/1-93 TABLE OF CONTENTS
TABLE OF CONTENTS
LIST OF FIGURES . . . . . . . . . . . . . . . . . . . . . . . . . . . . . . . . . . . . . . . . . . . . . . . . iii
LIST OF TABLES . . . . . . . . . . . . . . . . . . . . . . . . . . . . . . . . . . . . . . . . . . . . . . . . . v
REFERENCES . . . . . . . . . . . . . . . . . . . . . . . . . . . . . . . . . . . . . . . . . . . . . . . . . . . vi
OBJECTIVES . . . . . . . . . . . . . . . . . . . . . . . . . . . . . . . . . . . . . . . . . . . . . . . . . . . . vii
ENGINEERING FLUIDS DIAGRAMS AND PRINTS . . . . . . . . . . . . . . . . . . . . . . . . 1
Symbology . . . . . . . . . . . . . . . . . . . . . . . . . . . . . . . . . . . . . . . . . . . . . . . . . 2Valve Symbols. . . . . . . . . . . . . . . . . . . . . . . . . . . . . . . . . . . . . . . . . . . . . . . 3Valve Actuators . . . . . . . . . . . . . . . . . . . . . . . . . . . . . . . . . . . . . . . . . . . . . . 4Control Valve Designations. . . . . . . . . . . . . . . . . . . . . . . . . . . . . . . . . . . . . . 6Piping Systems . . . . . . . . . . . . . . . . . . . . . . . . . . . . . . . . . . . . . . . . . . . . . . 7Instrumentation . . . . . . . . . . . . . . . . . . . . . . . . . . . . . . . . . . . . . . . . . . . . . . 8Sensing Devices and Detectors. . . . . . . . . . . . . . . . . . . . . . . . . . . . . . . . . . . 10Modifiers and Transmitters. . . . . . . . . . . . . . . . . . . . . . . . . . . . . . . . . . . . . 11Indicators and Recorders. . . . . . . . . . . . . . . . . . . . . . . . . . . . . . . . . . . . . . . 12Controllers . . . . . . . . . . . . . . . . . . . . . . . . . . . . . . . . . . . . . . . . . . . . . . . . 12Examples of Simple Instrument Loops. . . . . . . . . . . . . . . . . . . . . . . . . . . . . 13Components. . . . . . . . . . . . . . . . . . . . . . . . . . . . . . . . . . . . . . . . . . . . . . . . 13Miscellaneous P&ID Symbols. . . . . . . . . . . . . . . . . . . . . . . . . . . . . . . . . . . 15Summary . . . . . . . . . . . . . . . . . . . . . . . . . . . . . . . . . . . . . . . . . . . . . . . . . 15
READING ENGINEERING P&IDs . . . . . . . . . . . . . . . . . . . . . . . . . . . . . . . . . . . . 16
Standards and Conventions for Valve Status. . . . . . . . . . . . . . . . . . . . . . . . . . 16Summary . . . . . . . . . . . . . . . . . . . . . . . . . . . . . . . . . . . . . . . . . . . . . . . . . 17
P&ID PRINT READING EXAMPLE . . . . . . . . . . . . . . . . . . . . . . . . . . . . . . . . . . . 18
Example . . . . . . . . . . . . . . . . . . . . . . . . . . . . . . . . . . . . . . . . . . . . . . . . . . 18Summary . . . . . . . . . . . . . . . . . . . . . . . . . . . . . . . . . . . . . . . . . . . . . . . . . 22
Rev. 0 Page i PR-02
TABLE OF CONTENTS DOE-HDBK-1016/1-93 Engineering Fluid Diagrams and Prints
TABLE OF CONTENTS
FLUID POWER P&IDs . . . . . . . . . . . . . . . . . . . . . . . . . . . . . . . . . . . . . . . . . . . . 23
Fluid Power Diagrams and Schematics. . . . . . . . . . . . . . . . . . . . . . . . . . . . . 23Pumps . . . . . . . . . . . . . . . . . . . . . . . . . . . . . . . . . . . . . . . . . . . . . . . . . . . 23Reservoirs. . . . . . . . . . . . . . . . . . . . . . . . . . . . . . . . . . . . . . . . . . . . . . . . . 24Actuator . . . . . . . . . . . . . . . . . . . . . . . . . . . . . . . . . . . . . . . . . . . . . . . . . . 24Piping . . . . . . . . . . . . . . . . . . . . . . . . . . . . . . . . . . . . . . . . . . . . . . . . . . . . 26Valves . . . . . . . . . . . . . . . . . . . . . . . . . . . . . . . . . . . . . . . . . . . . . . . . . . . 27Reading Fluid Power Diagrams. . . . . . . . . . . . . . . . . . . . . . . . . . . . . . . . . . 30Types of Fluid Power Diagrams. . . . . . . . . . . . . . . . . . . . . . . . . . . . . . . . . . 33Summary . . . . . . . . . . . . . . . . . . . . . . . . . . . . . . . . . . . . . . . . . . . . . . . . . 35
PR-02 Page ii Rev. 0
Engineering Fluid Diagrams and Prints DOE-HDBK-1016/1-93 LIST OF FIGURES
LIST OF FIG URES
Figure 1 Valve Symbols. . . . . . . . . . . . . . . . . . . . . . . . . . . . . . . . . . . . . . . . . . . . . . 3
Figure 2 Valve Actuator Symbols. . . . . . . . . . . . . . . . . . . . . . . . . . . . . . . . . . . . . . . 4
Figure 3 Remotely Controlled Valve. . . . . . . . . . . . . . . . . . . . . . . . . . . . . . . . . . . . . 4
Figure 4 Level Control Valve. . . . . . . . . . . . . . . . . . . . . . . . . . . . . . . . . . . . . . . . . . 5
Figure 5 Control Valves with Valve Positioners. . . . . . . . . . . . . . . . . . . . . . . . . . . . . . 6
Figure 6 Control Valve Designations. . . . . . . . . . . . . . . . . . . . . . . . . . . . . . . . . . . . . 6
Figure 7 Piping Symbols. . . . . . . . . . . . . . . . . . . . . . . . . . . . . . . . . . . . . . . . . . . . . 7
Figure 8 More Piping Symbols. . . . . . . . . . . . . . . . . . . . . . . . . . . . . . . . . . . . . . . . . 8
Figure 9 Detector and Sensing Device Symbols. . . . . . . . . . . . . . . . . . . . . . . . . . . . . 10
Figure 10 Transmitters and Instruments. . . . . . . . . . . . . . . . . . . . . . . . . . . . . . . . . . 11
Figure 11 Indicators and Recorders. . . . . . . . . . . . . . . . . . . . . . . . . . . . . . . . . . . . . 12
Figure 12 Controllers. . . . . . . . . . . . . . . . . . . . . . . . . . . . . . . . . . . . . . . . . . . . . . . 12
Figure 13 Signal Conditioners. . . . . . . . . . . . . . . . . . . . . . . . . . . . . . . . . . . . . . . . . 12
Figure 14 Instrumentation System Examples. . . . . . . . . . . . . . . . . . . . . . . . . . . . . . . 13
Figure 15 Symbols for Major Components. . . . . . . . . . . . . . . . . . . . . . . . . . . . . . . . 14
Figure 16 Miscellaneous Symbols. . . . . . . . . . . . . . . . . . . . . . . . . . . . . . . . . . . . . . 15
Figure 17 Valve Status Symbols. . . . . . . . . . . . . . . . . . . . . . . . . . . . . . . . . . . . . . . 16
Figure 18 Exercise P&ID. . . . . . . . . . . . . . . . . . . . . . . . . . . . . . . . . . . . . . . . . . . . 19
Figure 19 Fluid Power Pump and Compressor Symbols. . . . . . . . . . . . . . . . . . . . . . . 23
Figure 20 Fluid Power Reservoir Symbols. . . . . . . . . . . . . . . . . . . . . . . . . . . . . . . . 24
Figure 21 Symbols for Linear Actuators. . . . . . . . . . . . . . . . . . . . . . . . . . . . . . . . . . 25
Rev. 0 Page iii PR-02
LIST OF FIGURES DOE-HDBK-1016/1-93 Engineering Fluid Diagrams and Prints
LIST OF FIGURES (Cont.)
Figure 22 Symbols for Rotary Actuators. . . . . . . . . . . . . . . . . . . . . . . . . . . . . . . . . . 26
Figure 23 Fluid Power Line Symbols. . . . . . . . . . . . . . . . . . . . . . . . . . . . . . . . . . . . 26
Figure 24 Valve Operation. . . . . . . . . . . . . . . . . . . . . . . . . . . . . . . . . . . . . . . . . . . 27
Figure 25 Valve Symbol Development. . . . . . . . . . . . . . . . . . . . . . . . . . . . . . . . . . . 28
Figure 26 Fluid Power Valve Symbols. . . . . . . . . . . . . . . . . . . . . . . . . . . . . . . . . . . 29
Figure 27 Simple Hydraulic Power System. . . . . . . . . . . . . . . . . . . . . . . . . . . . . . . . 30
Figure 28 Line Diagram of Figure 27. . . . . . . . . . . . . . . . . . . . . . . . . . . . . . . . . . . . 30
Figure 29 Typical Fluid Power Diagram. . . . . . . . . . . . . . . . . . . . . . . . . . . . . . . . . . 31
Figure 30 Pictorial Fluid Power Diagram. . . . . . . . . . . . . . . . . . . . . . . . . . . . . . . . . 33
Figure 31 Cutaway Fluid Power Diagram . . . . . . . . . . . . . . . . . . . . . . . . . . . . . . . . 34
Figure 32 Schematic Fluid Power Diagram. . . . . . . . . . . . . . . . . . . . . . . . . . . . . . . . 34
PR-02 Page iv Rev. 0
Engineering Fluid Diagrams and Prints DOE-HDBK-1016/1-93 OBJECTIVES
TERMINAL OBJECTIVE
1.0 Given an engineering print, READ and INTERPRET facility engineering Piping andInstrument Drawings.
ENABLING OBJECTIVES
1.1 IDENTIFY the symbols used on engineering P&IDs for the following types of valves:
a. Globe valve g. Relief valveb. Gate valve h. Rupture diskc. Ball valve i. Three-way valved. Check valve j. Four-way valvee. Stop check valve k. Throttle (needle) valvef. Butterfly valve l. Pressure regulator
1.2 IDENTIFY the symbols used on engineering P&IDs for the following types of valveoperators:
a. Diaphragm valve operatorb. Motor valve operatorc. Solenoid valve operatord. Piston (hydraulic) valve operatore. Hand (manual) valve operatorf. Reach-rod valve operator
1.3 IDENTIFY the symbols used on engineering P&IDs for educators and ejectors.
1.4 IDENTIFY the symbols used on engineering P&IDs for the following lines:
a. Process b. Pneumaticc. Hydraulicd. Inert gase. Instrument signal (electrical)f. Instrument capillaryg. Electrical
Rev. 0 Page vii PR-02
OBJECTIVES DOE-HDBK-1016/1-93 Engineering Fluid Diagrams and Prints
ENABLING OBJECTIVES (c ont.)
1.5 IDENTIFY the symbols used on engineering P&IDs for the following basic types ofinstrumentation:
a. Differential pressure cellb. Temperature elementc. Venturid. Orificee. Rotometerf. Conductivity or salinity cellg. Radiation detector
1.6 IDENTIFY the symbols used on engineering P&IDs to denote the location, either localor board mounted, of instruments, indicators, and controllers.
1.7 IDENTIFY the symbols used on engineering P&IDs for the following types of instrumentsignal controllers and modifiers:
a. Proportional b. Proportional-integral c. Proportional-integral-differentiald. Square root extractors
1.8 IDENTIFY the symbols used on engineering P&IDs for the following types of systemcomponents:
a. Centrifugal pumpsb. Positive displacement pumpsc. Heat exchangersd. Compressorse. Fansf. Tanksg. Filters/strainers
PR-02 Page viii Rev. 0
Engineering Fluid Diagrams and Prints DOE-HDBK-1016/1-93 OBJECTIVES
ENABLING OBJECTIVES (c ont.)
1.9 STATE how the following valve conditions are depicted on an engineering P&ID:
a. Open valveb. Closed valvec. Throttled valved. Combination valves (3- or 4-way valve)e. Locked-closed valvef. Locked-open valveg. Fail-open valveh. Fail-closed valvei. Fail-as-is valve
1.10 Given an engineering P&ID, IDENTIFY components and DETERMINE the flowpath(s)for a given valve lineup.
1.11 IDENTIFY the symbols used on engineering fluid power drawings for the followingcomponents:
a. Pumpb. Compressorc. Reservoird. Actuatorse. Piping and piping junctionsf. Valves
1.12 Given a fluid power type drawing, DETERMINE the operation or resultant action of thestated component when hydraulic pressure is applied/removed.
Rev. 0 Page ix PR-02
DOE-HDBK-1016/1-93Engineering Fluid Diagrams and Prints ENGINEERING FLUIDS DIAGRAMS AND PRINTS
ENGINEERING FLUIDS DIAGRAMS AND PRINTS
To read and understand engineering fluid diagrams and prints, usually referredto as P&IDs, an individual must be familiar with the basic symbols.
EO 1.1 IDENTIFY the symbols used on engineering P&IDs for thefollowing types of valves:
a. Globe valve g. Relief valveb. Gate valve h. Rupture diskc. Ball valve i. Three-way valved. Check valve j. Four-way valvee. Stop check valve k. Throttle (needle) valvef. Butterfly valve l. Pressure regulator
EO 1.2 IDENTIFY the symbols used on engineering P&IDs for thefollowing types of valve operators:
a. Diaphragm valve operatorb. Motor valve operatorc. Solenoid valve operatord. Piston (hydraulic) valve operatore. Hand (manual) valve operatorf. Reach rod valve operator
EO 1.3 IDENTIFY the symbols used on engineering P&IDs foreducators and ejectors.
EO 1.4 IDENTIFY the symbols used on engineering P&IDs for thefollowing lines:
a. Process b. Pneumaticc. Hydraulicd. Inert gas
e. Instrument signal (electrical)f. Instrument capillaryg. Electrical
Rev. 0 PR-02Page 1
DOE-HDBK-1016/1-93ENGINEERING FLUIDS DIAGRAMS AND PRINTS Engineering Fluid Diagrams and Prints
EO 1.5 IDENTIFY the symbols used on engineering P&IDs for thefollowing basic types of instrumentation:
a. Differential pressure cellb. Temperature elementc. Venturid. Orifice
e. Rotometerf. Conductivity or
salinity cellg. Radiation detector
EO 1.6 IDENTIFY the symbols used on engineering P&IDs to denotethe location, either local or board mounted, of instruments,indicators, and controllers.
EO 1.7 IDENTIFY the symbols used on engineering P&IDs for thefollowing types of instrument signal modifiers:
a. Proportional b. Proportional-integral c. Proportional-integral-differentiald. Square root extractors
EO 1.8 IDENTIFY the symbols used on engineering P&IDs for thefollowing types of system components:
a. Centrifugal pumpsb. Positive displacement pumpsc. Heat exchangersd. Compressors
e. Fansf. Tanksg. Filters/strainers
Symbology
To read and interpret piping and instrument drawings (P&IDs), the reader must learn the meaningof the symbols. This chapter discusses the common symbols that are used to depict fluid systemcomponents. When the symbology is mastered, the reader will be able to interpret most P&IDs.
The reader should note that this chapter is only representative of fluid system symbology, ratherthan being all-inclusive. The symbols presented herein are those most commonly used inengineering P&IDs. The reader may expand his or her knowledge by obtaining and studying theappropriate drafting standards used at his or her facility.
PR-02 Rev. 0Page 2
DOE-HDBK-1016/1-93Engineering Fluid Diagrams and Prints ENGINEERING FLUIDS DIAGRAMS AND PRINTS
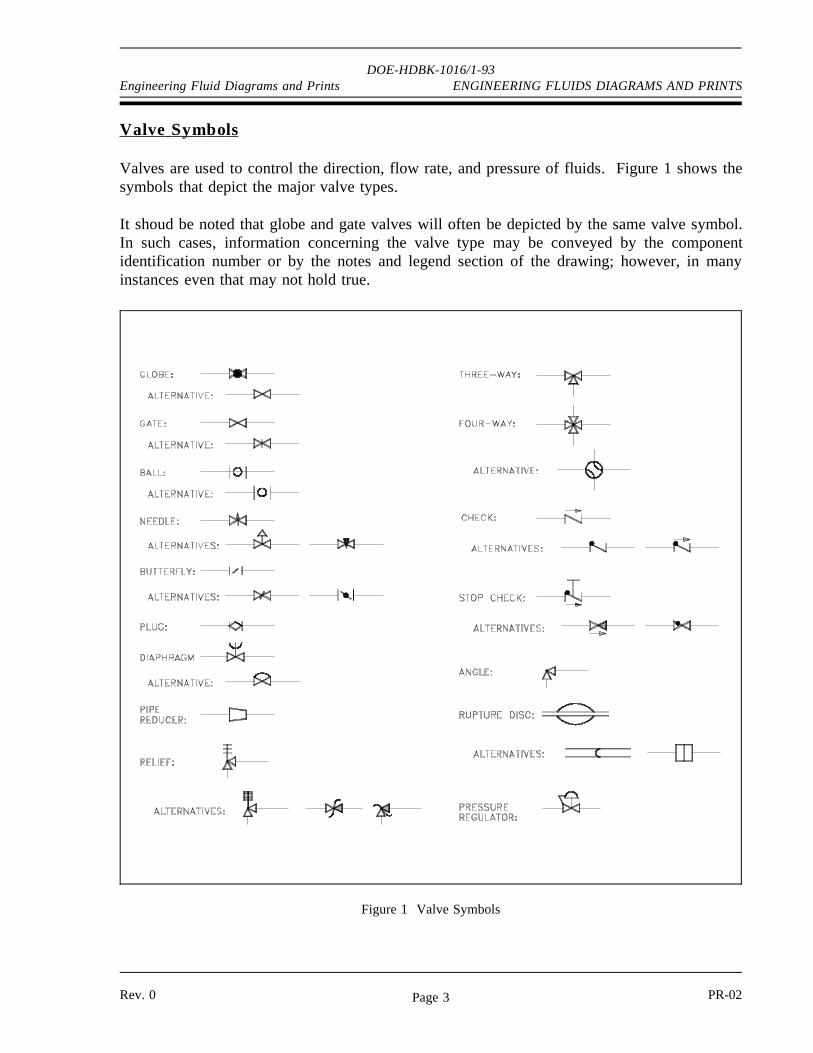
Valve Symbols
Valves are used to control the direction, flow rate, and pressure of fluids. Figure 1 shows thesymbols that depict the major valve types.
It shoud be noted that globe and gate valves will often be depicted by the same valve symbol.In such cases, information concerning the valve type may be conveyed by the componentidentification number or by the notes and legend section of the drawing; however, in manyinstances even that may not hold true.
Figure 1 Valve Symbols
Rev. 0 PR-02Page 3
DOE-HDBK-1016/1-93ENGINEERING FLUIDS DIAGRAMS AND PRINTS Engineering Fluid Diagrams and Prints
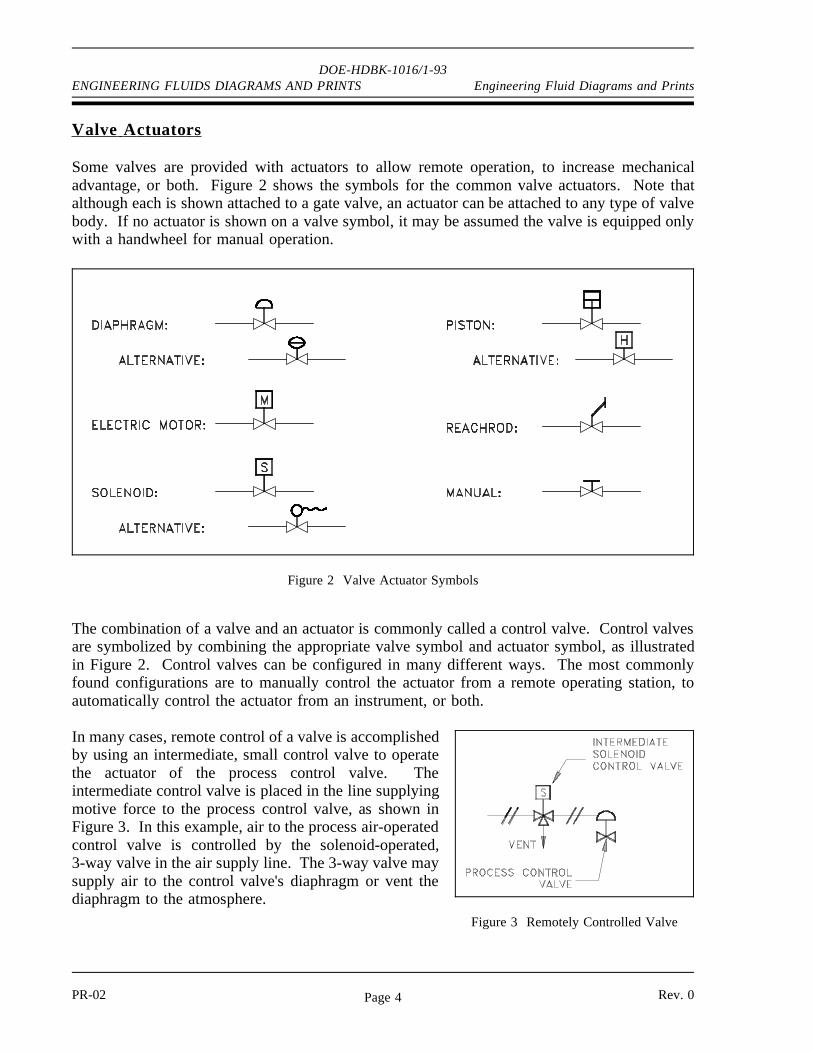
Valve Actuator s
Some valves are provided with actuators to allow remote operation, to increase mechanicaladvantage, or both. Figure 2 shows the symbols for the common valve actuators. Note thatalthough each is shown attached to a gate valve, an actuator can be attached to any type of valvebody. If no actuator is shown on a valve symbol, it may be assumed the valve is equipped onlywith a handwheel for manual operation.
The combination of a valve and an actuator is commonly called a control valve. Control valves
Figure 2 Valve Actuator Symbols
are symbolized by combining the appropriate valve symbol and actuator symbol, as illustratedin Figure 2. Control valves can be configured in many different ways. The most commonlyfound configurations are to manually control the actuator from a remote operating station, toautomatically control the actuator from an instrument, or both.
In many cases, remote control of a valve is accomplished
Figure 3 Remotely Controlled Valve
by using an intermediate, small control valve to operatethe actuator of the process control valve. Theintermediate control valve is placed in the line supplyingmotive force to the process control valve, as shown inFigure 3. In this example, air to the process air-operatedcontrol valve is controlled by the solenoid-operated,3-way valve in the air supply line. The 3-way valve maysupply air to the control valve's diaphragm or vent thediaphragm to the atmosphere.
PR-02 Rev. 0Page 4
DOE-HDBK-1016/1-93Engineering Fluid Diagrams and Prints ENGINEERING FLUIDS DIAGRAMS AND PRINTS
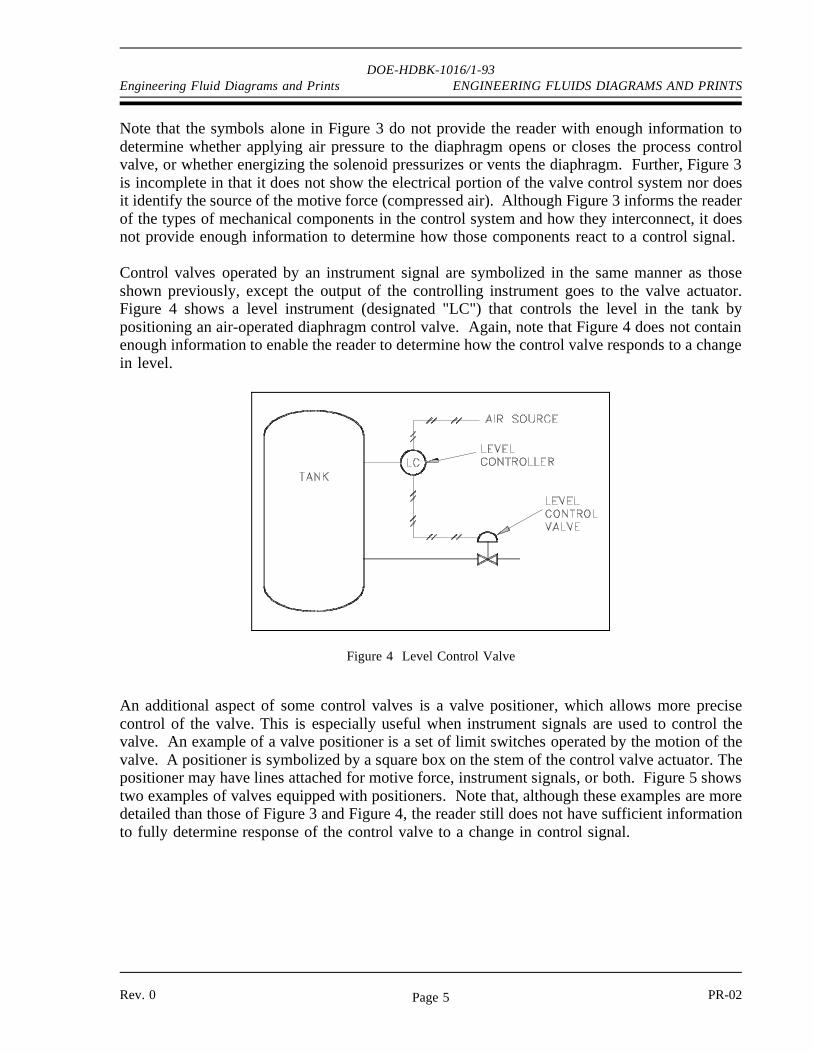
Note that the symbols alone in Figure 3 do not provide the reader with enough information todetermine whether applying air pressure to the diaphragm opens or closes the process controlvalve, or whether energizing the solenoid pressurizes or vents the diaphragm. Further, Figure 3is incomplete in that it does not show the electrical portion of the valve control system nor doesit identify the source of the motive force (compressed air). Although Figure 3 informs the readerof the types of mechanical components in the control system and how they interconnect, it doesnot provide enough information to determine how those components react to a control signal.
Control valves operated by an instrument signal are symbolized in the same manner as thoseshown previously, except the output of the controlling instrument goes to the valve actuator.Figure 4 shows a level instrument (designated "LC") that controls the level in the tank bypositioning an air-operated diaphragm control valve. Again, note that Figure 4 does not containenough information to enable the reader to determine how the control valve responds to a changein level.
Figure 4 Level Control Valve
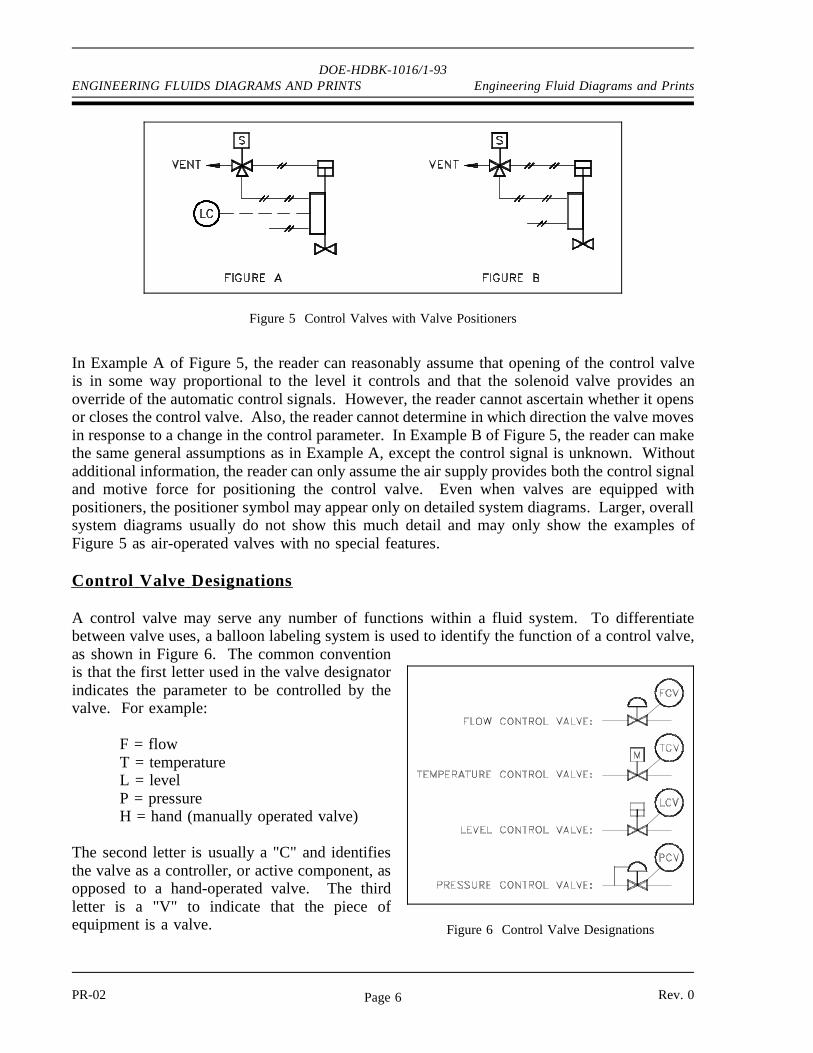
An additional aspect of some control valves is a valve positioner, which allows more precisecontrol of the valve. This is especially useful when instrument signals are used to control thevalve. An example of a valve positioner is a set of limit switches operated by the motion of thevalve. A positioner is symbolized by a square box on the stem of the control valve actuator. Thepositioner may have lines attached for motive force, instrument signals, or both. Figure 5 showstwo examples of valves equipped with positioners. Note that, although these examples are moredetailed than those of Figure 3 and Figure 4, the reader still does not have sufficient informationto fully determine response of the control valve to a change in control signal.
Rev. 0 PR-02Page 5
DOE-HDBK-1016/1-93ENGINEERING FLUIDS DIAGRAMS AND PRINTS Engineering Fluid Diagrams and Prints
Figure 5 Control Valves with Valve Positioners
In Example A of Figure 5, the reader can reasonably assume that opening of the control valveis in some way proportional to the level it controls and that the solenoid valve provides anoverride of the automatic control signals. However, the reader cannot ascertain whether it opensor closes the control valve. Also, the reader cannot determine in which direction the valve movesin response to a change in the control parameter. In Example B of Figure 5, the reader can makethe same general assumptions as in Example A, except the control signal is unknown. Withoutadditional information, the reader can only assume the air supply provides both the control signaland motive force for positioning the control valve. Even when valves are equipped withpositioners, the positioner symbol may appear only on detailed system diagrams. Larger, overallsystem diagrams usually do not show this much detail and may only show the examples ofFigure 5 as air-operated valves with no special features.
Contr ol Valve Designations
Figure 6 Control Valve Designations
A control valve may serve any number of functions within a fluid system. To differentiatebetween valve uses, a balloon labeling system is used to identify the function of a control valve,as shown in Figure 6. The common conventionis that the first letter used in the valve designatorindicates the parameter to be controlled by thevalve. For example:
F = flowT = temperatureL = levelP = pressureH = hand (manually operated valve)
The second letter is usually a "C" and identifiesthe valve as a controller, or active component, asopposed to a hand-operated valve. The thirdletter is a "V" to indicate that the piece ofequipment is a valve.
PR-02 Rev. 0Page 6
DOE-HDBK-1016/1-93Engineering Fluid Diagrams and Prints ENGINEERING FLUIDS DIAGRAMS AND PRINTS
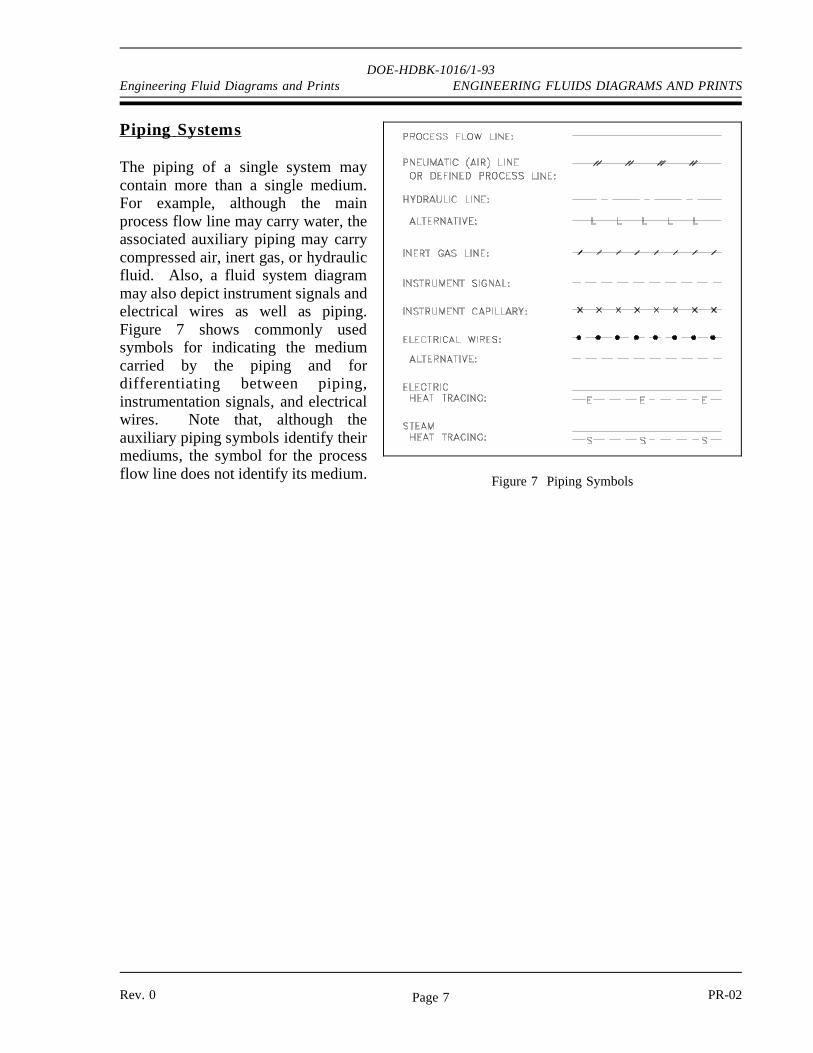
Piping Systems
Figure 7 Piping Symbols
The piping of a single system maycontain more than a single medium.For example, although the mainprocess flow line may carry water, theassociated auxiliary piping may carrycompressed air, inert gas, or hydraulicfluid. Also, a fluid system diagrammay also depict instrument signals andelectrical wires as well as piping.Figure 7 shows commonly usedsymbols for indicating the mediumcarried by the piping and fordifferentiating between piping,instrumentation signals, and electricalwires. Note that, although theauxiliary piping symbols identify theirmediums, the symbol for the processflow line does not identify its medium.
Rev. 0 PR-02Page 7
DOE-HDBK-1016/1-93ENGINEERING FLUIDS DIAGRAMS AND PRINTS Engineering Fluid Diagrams and Prints
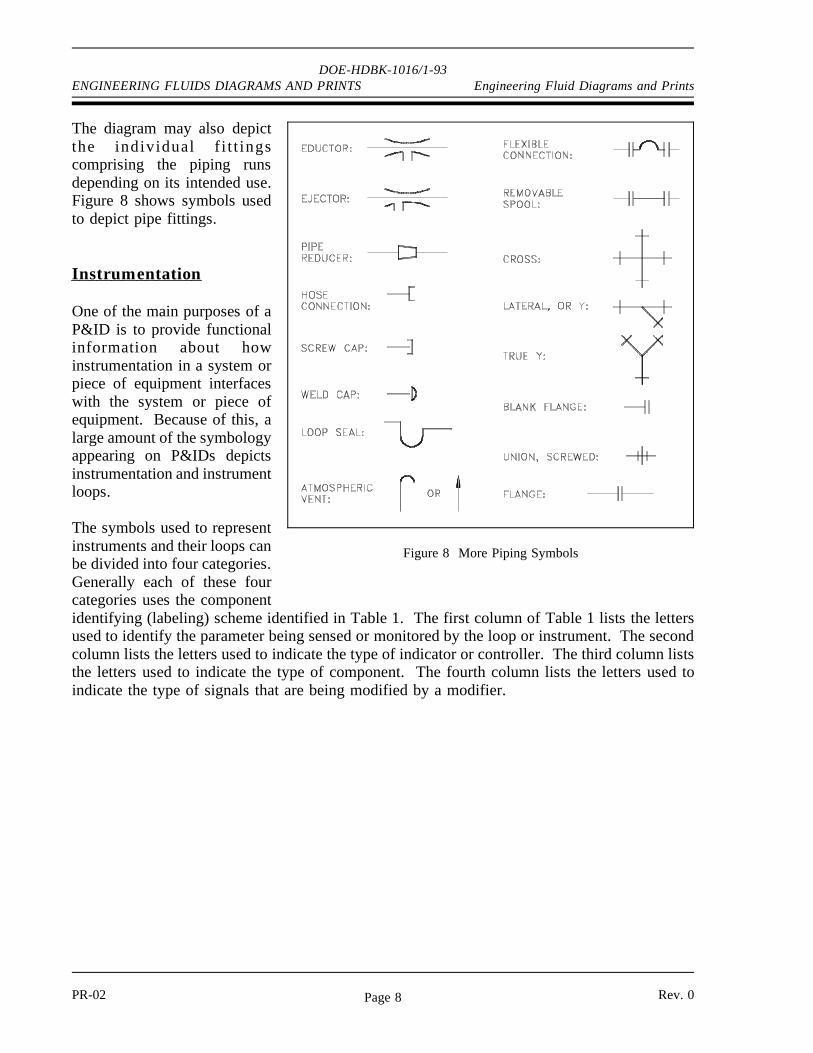
The diagram may also depict
Figure 8 More Piping Symbols
the indiv idual f i t t ingscomprising the piping runsdepending on its intended use.Figure 8 shows symbols usedto depict pipe fittings.
I nstr umentation
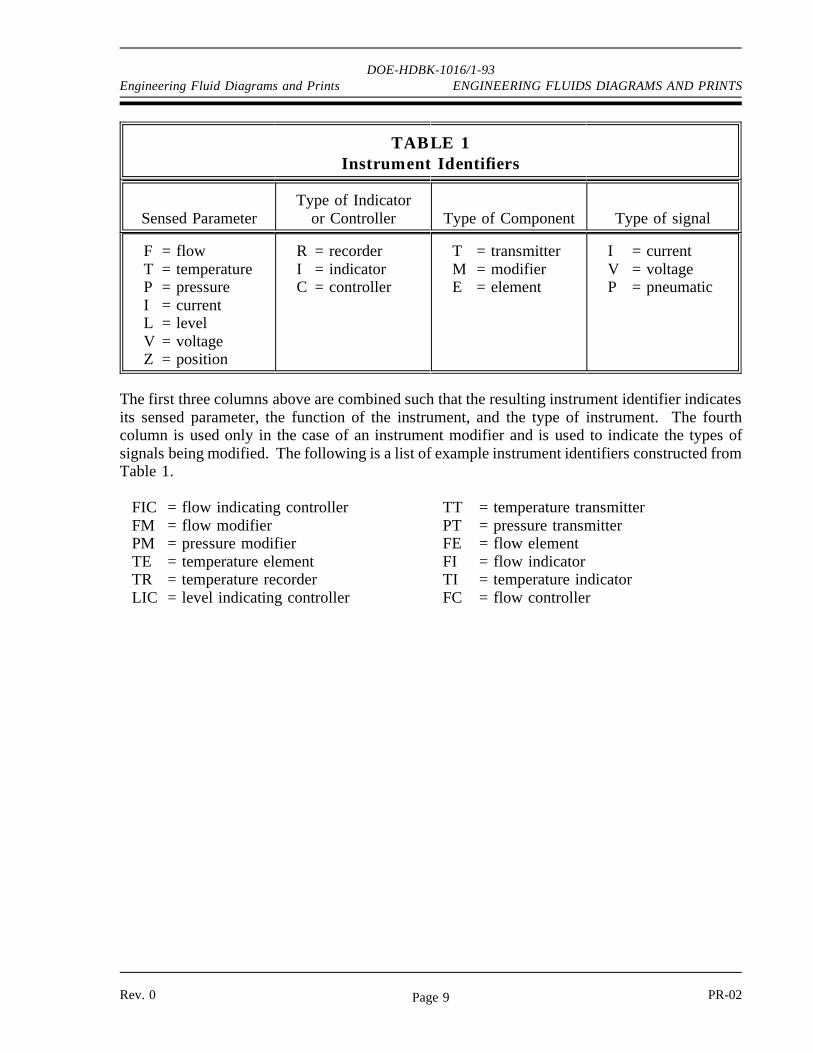
One of the main purposes of aP&ID is to provide functionalinformation about howinstrumentation in a system orpiece of equipment interfaceswith the system or piece ofequipment. Because of this, alarge amount of the symbologyappearing on P&IDs depictsinstrumentation and instrumentloops.
The symbols used to representinstruments and their loops canbe divided into four categories.Generally each of these fourcategories uses the componentidentifying (labeling) scheme identified in Table 1. The first column of Table 1 lists the lettersused to identify the parameter being sensed or monitored by the loop or instrument. The secondcolumn lists the letters used to indicate the type of indicator or controller. The third column liststhe letters used to indicate the type of component. The fourth column lists the letters used toindicate the type of signals that are being modified by a modifier.
PR-02 Rev. 0Page 8
DOE-HDBK-1016/1-93Engineering Fluid Diagrams and Prints ENGINEERING FLUIDS DIAGRAMS AND PRINTS
TABLE 1Instrument Identifiers
Sensed ParameterType of Indicator
or Controller Type of Component Type of signal
F = flowT = temperatureP = pressureI = currentL = levelV = voltageZ = position
R = recorderI = indicatorC = controller
T = transmitterM = modifierE = element
I = currentV = voltageP = pneumatic
The first three columns above are combined such that the resulting instrument identifier indicatesits sensed parameter, the function of the instrument, and the type of instrument. The fourthcolumn is used only in the case of an instrument modifier and is used to indicate the types ofsignals being modified. The following is a list of example instrument identifiers constructed fromTable 1.
FIC = flow indicating controllerFM = flow modifierPM = pressure modifierTE = temperature elementTR = temperature recorderLIC = level indicating controller
TT = temperature transmitterPT = pressure transmitterFE = flow elementFI = flow indicatorTI = temperature indicatorFC = flow controller
Rev. 0 PR-02Page 9
DOE-HDBK-1016/1-93ENGINEERING FLUIDS DIAGRAMS AND PRINTS Engineering Fluid Diagrams and Prints
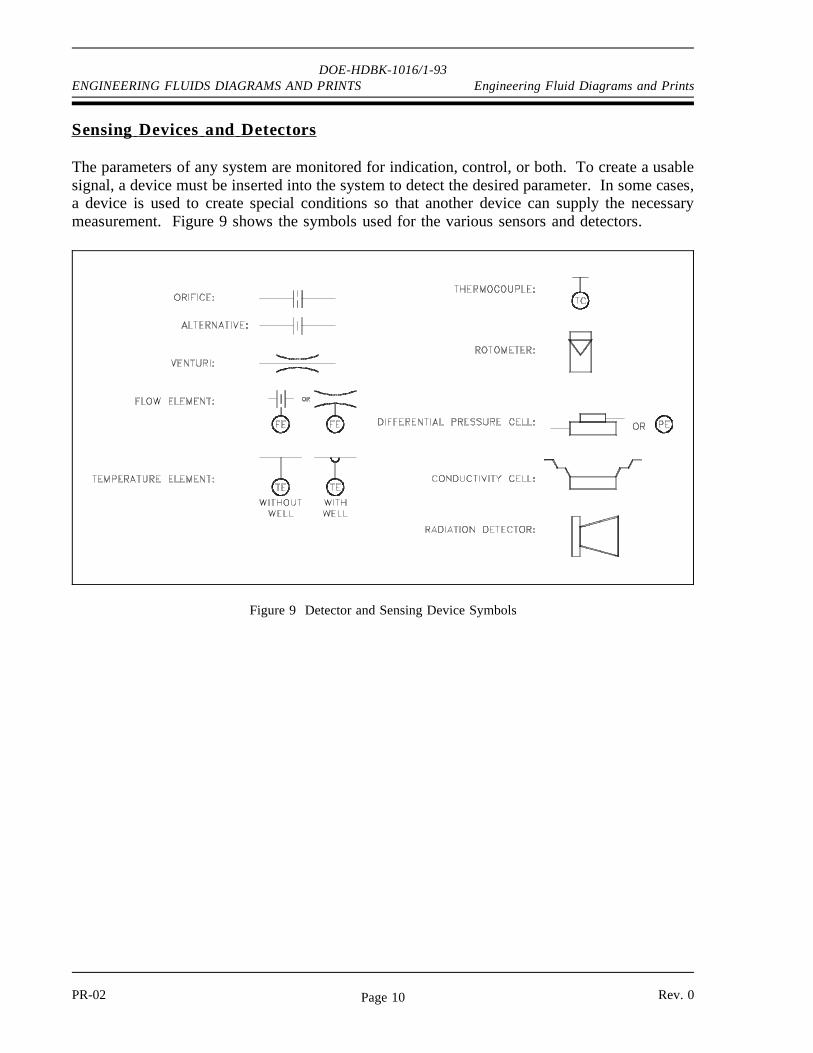
Sensing Devices and Detector s
The parameters of any system are monitored for indication, control, or both. To create a usablesignal, a device must be inserted into the system to detect the desired parameter. In some cases,a device is used to create special conditions so that another device can supply the necessarymeasurement. Figure 9 shows the symbols used for the various sensors and detectors.
Figure 9 Detector and Sensing Device Symbols
PR-02 Rev. 0Page 10
DOE-HDBK-1016/1-93Engineering Fluid Diagrams and Prints ENGINEERING FLUIDS DIAGRAMS AND PRINTS
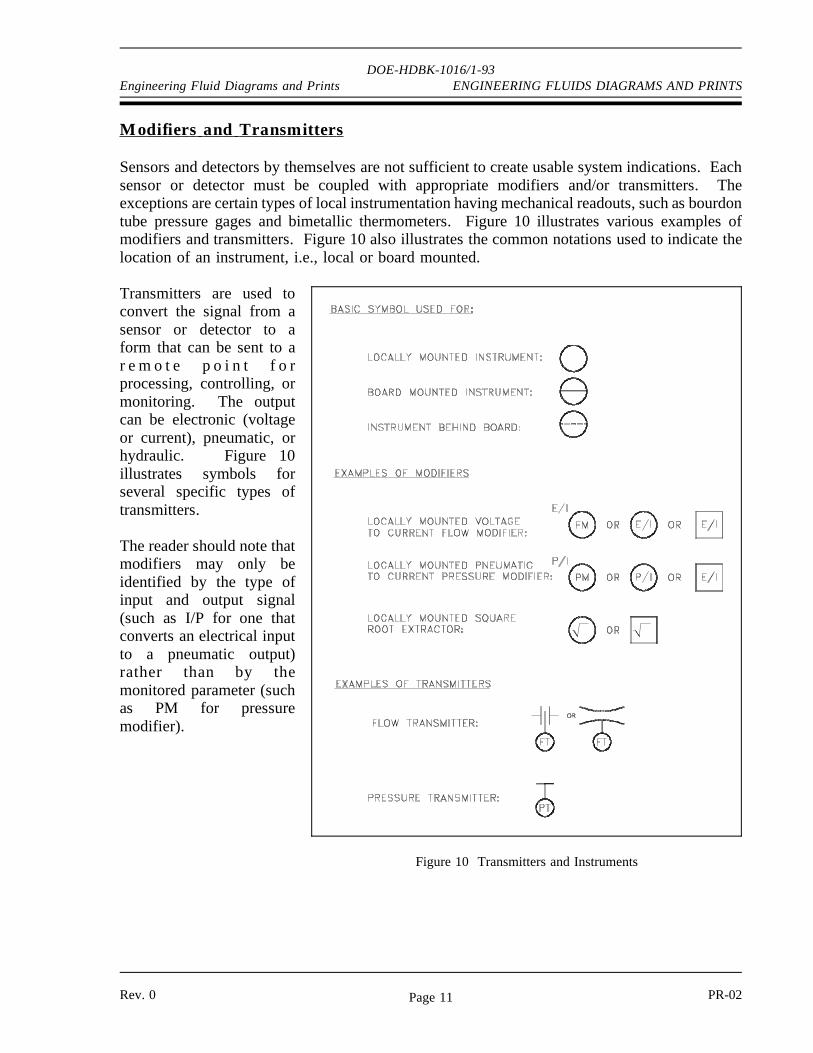
Modif ier s and T r ansmitter s
Sensors and detectors by themselves are not sufficient to create usable system indications. Eachsensor or detector must be coupled with appropriate modifiers and/or transmitters. Theexceptions are certain types of local instrumentation having mechanical readouts, such as bourdontube pressure gages and bimetallic thermometers. Figure 10 illustrates various examples ofmodifiers and transmitters. Figure 10 also illustrates the common notations used to indicate thelocation of an instrument, i.e., local or board mounted.
Transmitters are used to
Figure 10 Transmitters and Instruments
convert the signal from asensor or detector to aform that can be sent to ar e m o t e p o i n t f o rprocessing, controlling, ormonitoring. The outputcan be electronic (voltageor current), pneumatic, orhydraulic. Figure 10illustrates symbols forseveral specific types oftransmitters.
The reader should note thatmodifiers may only beidentified by the type ofinput and output signal(such as I/P for one thatconverts an electrical inputto a pneumatic output)rather than by themonitored parameter (suchas PM for pressuremodifier).
Rev. 0 PR-02Page 11
DOE-HDBK-1016/1-93ENGINEERING FLUIDS DIAGRAMS AND PRINTS Engineering Fluid Diagrams and Prints
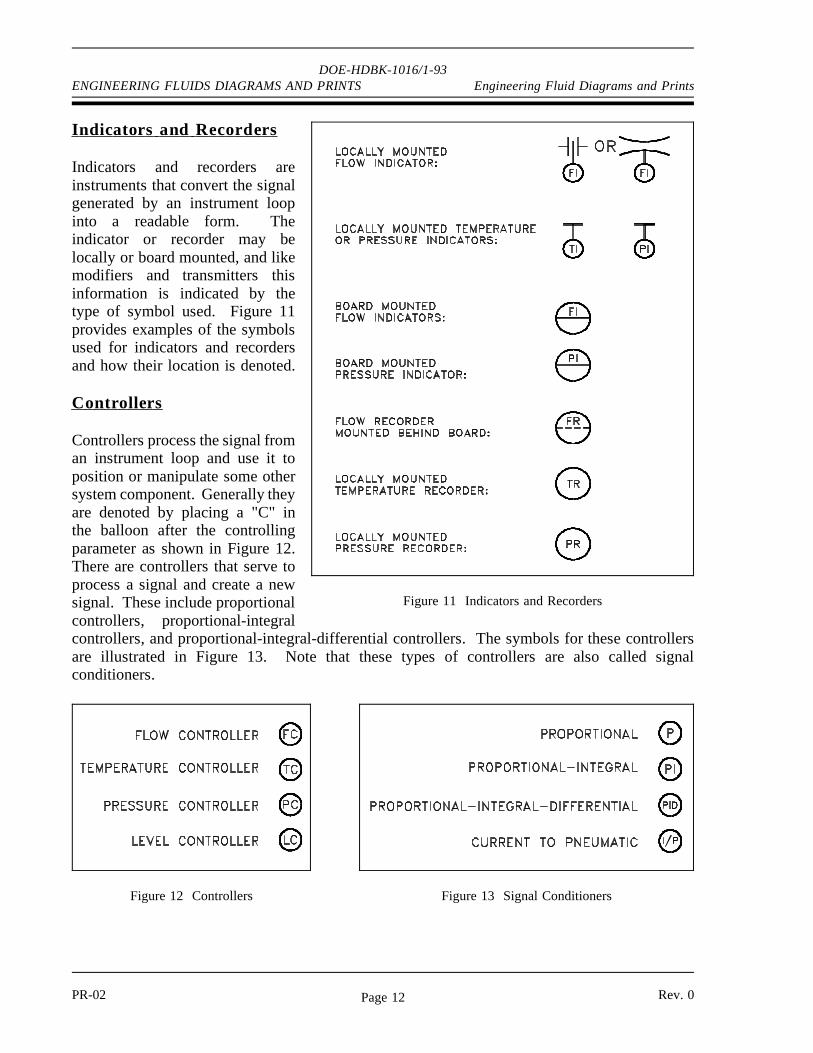
I ndicator s and Recor der s
Figure 11 Indicators and Recorders
Indicators and recorders areinstruments that convert the signalgenerated by an instrument loopinto a readable form. Theindicator or recorder may belocally or board mounted, and likemodifiers and transmitters thisinformation is indicated by thetype of symbol used. Figure 11provides examples of the symbolsused for indicators and recordersand how their location is denoted.
Contr oller s
Controllers process the signal froman instrument loop and use it toposition or manipulate some othersystem component. Generally theyare denoted by placing a "C" inthe balloon after the controllingparameter as shown in Figure 12.There are controllers that serve toprocess a signal and create a newsignal. These include proportionalcontrollers, proportional-integralcontrollers, and proportional-integral-differential controllers. The symbols for these controllersare illustrated in Figure 13. Note that these types of controllers are also called signalconditioners.
Figure 12 Controllers Figure 13 Signal Conditioners
PR-02 Rev. 0Page 12
DOE-HDBK-1016/1-93Engineering Fluid Diagrams and Prints ENGINEERING FLUIDS DIAGRAMS AND PRINTS
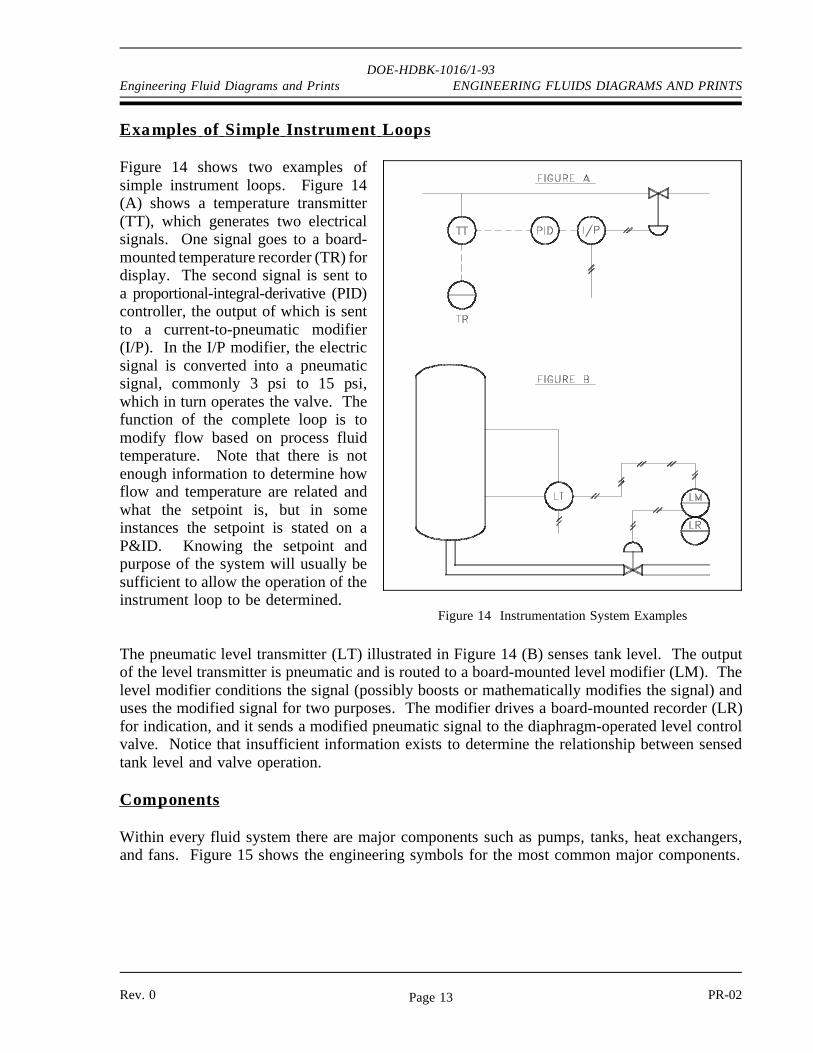
Examples of Simple I nstr ument L oops
Figure 14 shows two examples of
Figure 14 Instrumentation System Examples
simple instrument loops. Figure 14(A) shows a temperature transmitter(TT), which generates two electricalsignals. One signal goes to a board-mounted temperature recorder (TR) fordisplay. The second signal is sent toa proportional-integral-derivative (PID)controller, the output of which is sentto a current-to-pneumatic modifier(I/P). In the I/P modifier, the electricsignal is converted into a pneumaticsignal, commonly 3 psi to 15 psi,which in turn operates the valve. Thefunction of the complete loop is tomodify flow based on process fluidtemperature. Note that there is notenough information to determine howflow and temperature are related andwhat the setpoint is, but in someinstances the setpoint is stated on aP&ID. Knowing the setpoint andpurpose of the system will usually besufficient to allow the operation of theinstrument loop to be determined.
The pneumatic level transmitter (LT) illustrated in Figure 14 (B) senses tank level. The outputof the level transmitter is pneumatic and is routed to a board-mounted level modifier (LM). Thelevel modifier conditions the signal (possibly boosts or mathematically modifies the signal) anduses the modified signal for two purposes. The modifier drives a board-mounted recorder (LR)for indication, and it sends a modified pneumatic signal to the diaphragm-operated level controlvalve. Notice that insufficient information exists to determine the relationship between sensedtank level and valve operation.
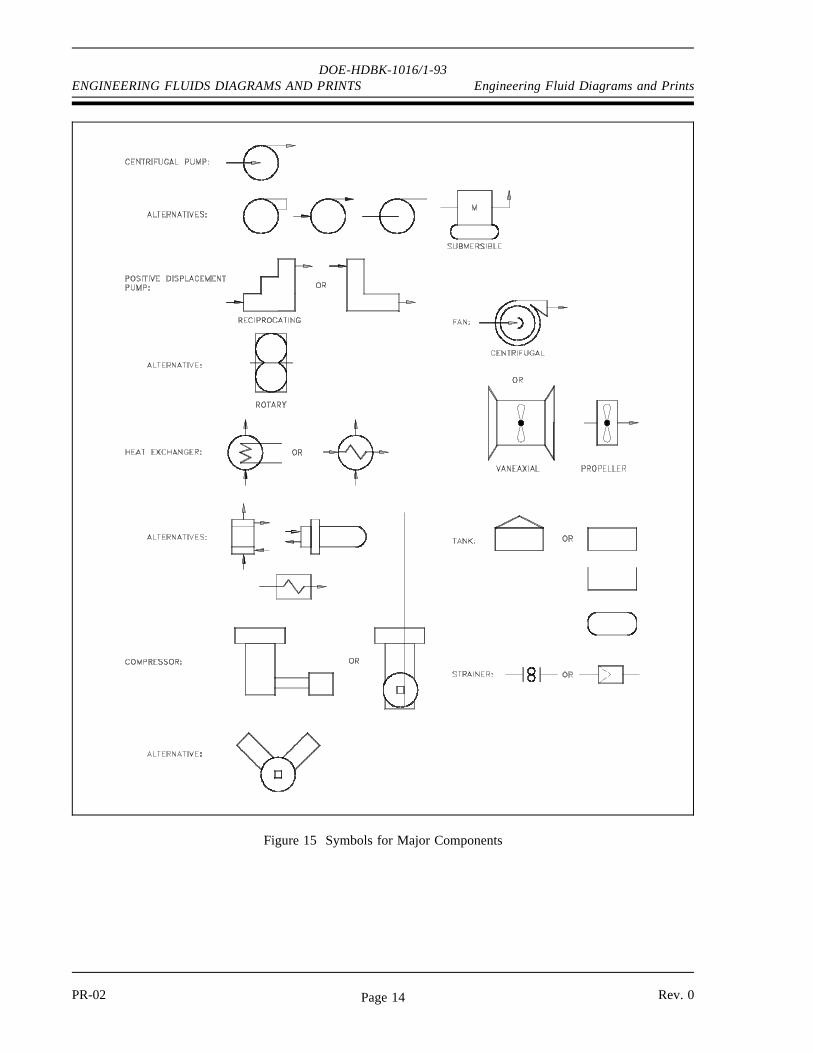
Components
Within every fluid system there are major components such as pumps, tanks, heat exchangers,and fans. Figure 15 shows the engineering symbols for the most common major components.
Rev. 0 PR-02Page 13
DOE-HDBK-1016/1-93ENGINEERING FLUIDS DIAGRAMS AND PRINTS Engineering Fluid Diagrams and Prints
Figure 15 Symbols for Major Components
PR-02 Rev. 0Page 14
DOE-HDBK-1016/1-93Engineering Fluid Diagrams and Prints ENGINEERING FLUIDS DIAGRAMS AND PRINTS
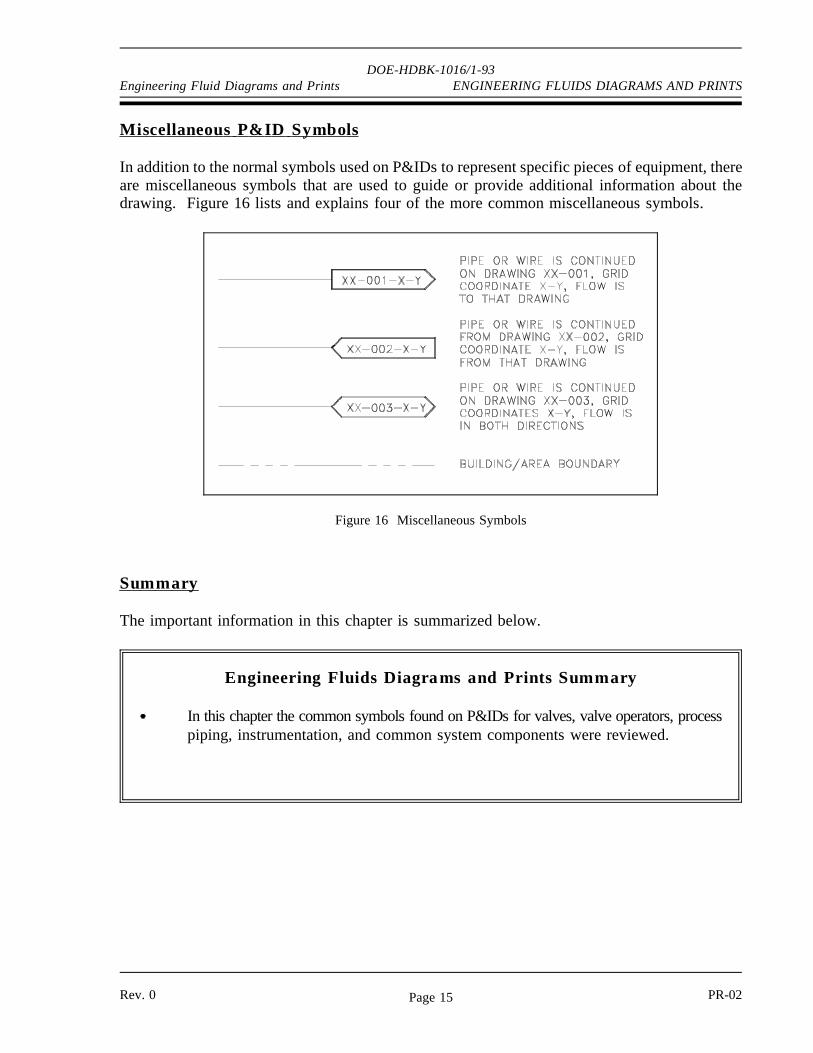
Miscellaneous P& I D Symbols
In addition to the normal symbols used on P&IDs to represent specific pieces of equipment, thereare miscellaneous symbols that are used to guide or provide additional information about thedrawing. Figure 16 lists and explains four of the more common miscellaneous symbols.
Figure 16 Miscellaneous Symbols
Summary
The important information in this chapter is summarized below.
Engineering Fluids Diagrams and Prints Summary
In this chapter the common symbols found on P&IDs for valves, valve operators, processpiping, instrumentation, and common system components were reviewed.
Rev. 0 PR-02Page 15
READING ENGINEERING P&IDs DOE-HDBK-1016/1-93 Engineering Fluid Diagrams and Prints
READING ENGINEERING P&IDs
Standards and conventions have been developed to provide consistency fromdrawing to drawing. To accurately interpret a drawing, these standards andconventions must be understood.
EO 1.9 STATE how the following valve conditions are depicted on anengineering P&ID drawing:
a. Open valveb. Closed valvec. Throttled valved. Combination valves
(3- or 4- way valve)
e. Locked-closed valvef. Locked-open valveg. Fail-open valvesh. Fail-closed valvei. Fail-as-is valve
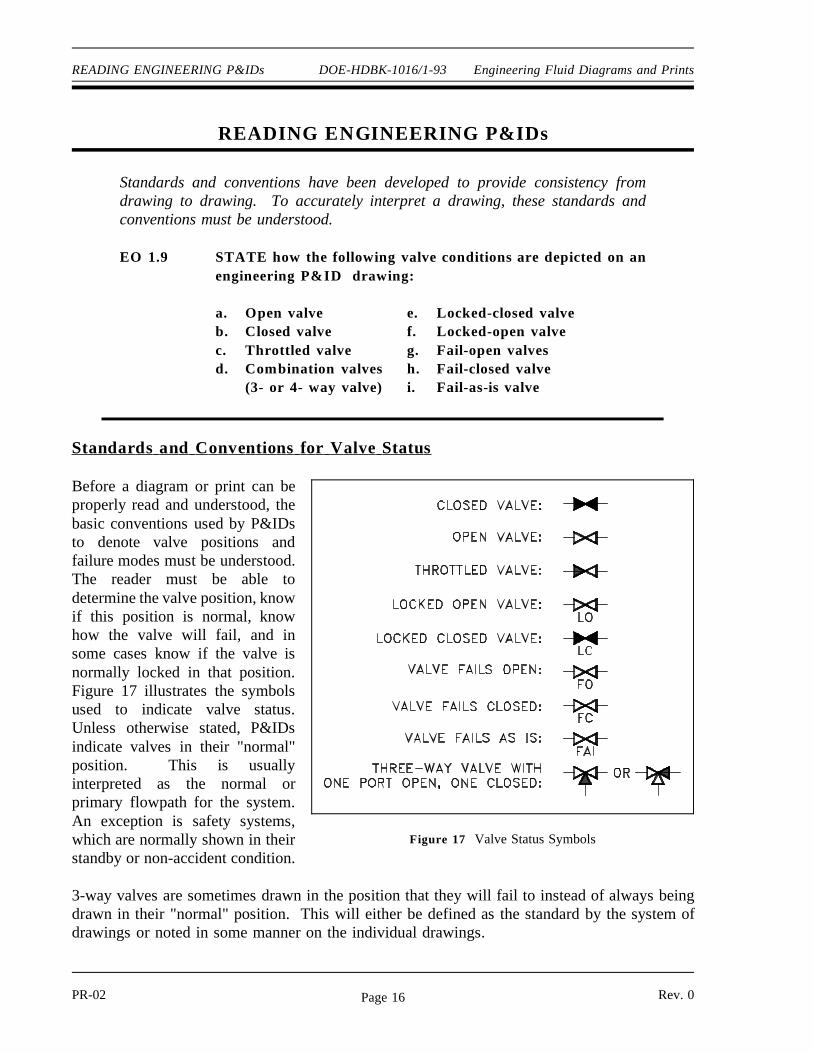
Standards and Conventions for Valve Status
Before a diagram or print can be
Figure 17 Valve Status Symbols
properly read and understood, thebasic conventions used by P&IDsto denote valve positions andfailure modes must be understood.The reader must be able todetermine the valve position, knowif this position is normal, knowhow the valve will fail, and insome cases know if the valve isnormally locked in that position.Figure 17 illustrates the symbolsused to indicate valve status.Unless otherwise stated, P&IDsindicate valves in their "normal"position. This is usuallyinterpreted as the normal orprimary flowpath for the system.An exception is safety systems,which are normally shown in theirstandby or non-accident condition.
3-way valves are sometimes drawn in the position that they will fail to instead of always beingdrawn in their "normal" position. This will either be defined as the standard by the system ofdrawings or noted in some manner on the individual drawings.
PR-02 Rev. 0Page 16
Engineering Fluid Diagrams and Prints DOE-HDBK-1016/1-93 READING ENGINEERING P&IDs
Summary
The important information in this chapter is summarized below.
Reading Engineering P&IDs Summary
This chapter reviewed the basic symbology, common standards, and conventions used onP&IDs, such as valve conditions and modes of failure. This information, with thesymbology learned in the preceding chapter, provides the information necessary to readand interpret most P&IDs.
Rev. 0 PR-02Page 17
P&ID PRINT READING EXAMPLE DOE-HDBK-1016/1-93 Engineering Fluid Diagrams and Prints
P&ID PRINT READING EX AMPLE
The ability to read and understand prints is achieved through the repetitivereading of prints.
EO 1.10 Given an engineering P&ID, IDENTIFY components andDETERMINE the flowpath(s) for a given valve lineup.
Example
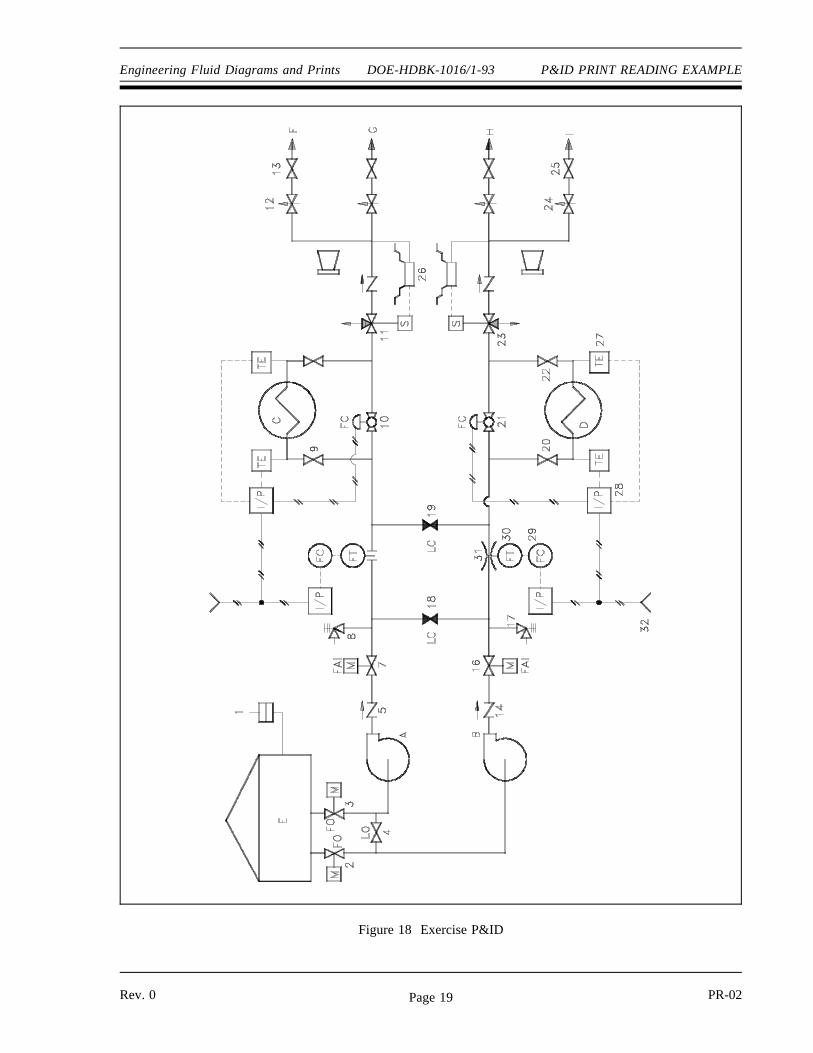
At this point, all the symbols for valves and major components have been presented, as have theconventions for identifying the condition of a system. Refer to Figure 18 as necessary to answerthe following questions. The answers are provided in the back of this section so that you mayjudge your own knowledge level.
PR-02 Rev.0Page 18
Engineering Fluid Diagrams and Prints DOE-HDBK-1016/1-93 P&ID PRINT READING EXAMPLE
Figure 18 Exercise P&ID
Rev. 0 PR-02Page 19

P&ID PRINT READING EXAMPLE DOE-HDBK-1016/1-93 Engineering Fluid Diagrams and Prints
1. Identify the following components by letter or number.
a. Centrifugal pump b. Heat exchanger c. Tank d. Venturi e. Rupture disc f. Relief valve g. Motor-operated valve h. Air-operated valve i. Throttle valve j. Conductivity cell k. Air line l. Current-to-pneumatic converter m. Check valve n. A locked-closed valve o. A closed valve p. A locked-open valve q. A solenoid valve
2. What is the controlling parameter for Valves 10 and 21?
3. Which valves would need to change position in order for Pump B to supply flow to onlypoints G and H?
4. Which valves will fail open? Fail closed? Fail as is?
PR-02 Rev.0Page 20
Engineering Fluid Diagrams and Prints DOE-HDBK-1016/1-93 P&ID PRINT READING EXAMPLE
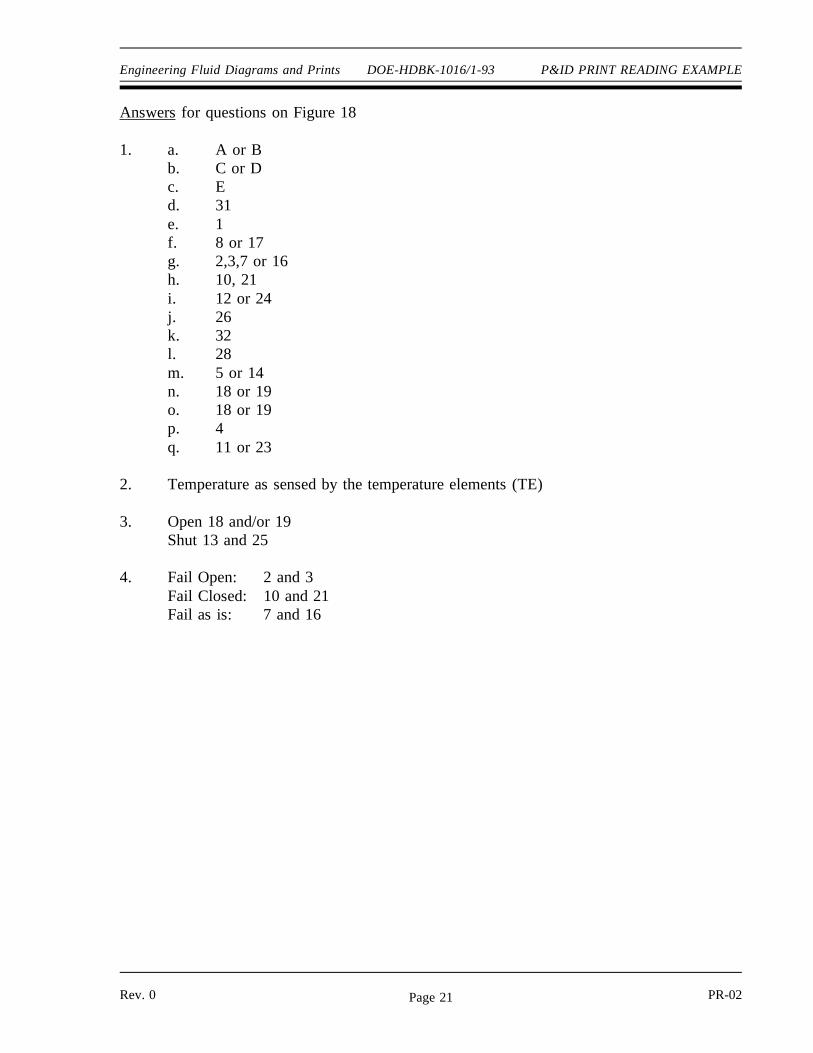
Answers for questions on Figure 18
1. a. A or Bb. C or Dc. Ed. 31e. 1f. 8 or 17g. 2,3,7 or 16h. 10, 21i. 12 or 24j. 26k. 32l. 28m. 5 or 14n. 18 or 19o. 18 or 19p. 4q. 11 or 23
2. Temperature as sensed by the temperature elements (TE)
3. Open 18 and/or 19Shut 13 and 25
4. Fail Open: 2 and 3Fail Closed: 10 and 21Fail as is: 7 and 16
Rev. 0 PR-02Page 21
P&ID PRINT READING EXAMPLE DOE-HDBK-1016/1-93 Engineering Fluid Diagrams and Prints
Summary
The important information in this chapter is summarized below.
P&ID Print Reading Example Summary
This chapter provided the student with examples in applying the materiallearned in Chapters 1 and 2.
PR-02 Rev.0Page 22
Engineering Fluid Diagrams and Prints DOE-HDBK-1016/1-93 FLUID POWER P&IDs
FLUID PO WER P&IDs
Fluid power diagrams and schematics require an independent review because theyuse a unique set of symbols and conventions.
EO 1.11 IDENTIFY the symbols used on engineering fluid powerdrawings for the following components:
a. Pump d. Actuatorsb. Compressor e. Piping and piping junctionsc. Reservoir f. Valves
EO 1.12 Given a fluid power type drawing, DETERMINE the operationor resultant action of the stated component when hydraulicpressure is applied/removed.
Fluid Power Diagrams and Schematics
Different symbology is used when dealing with systems that operate with fluid power. Fluidpower includes either gas (such as air) or hydraulic (such as water or oil) motive media. Someof the symbols used in fluid power systems are the same or similar to those already discussed,but many are entirely different.
Figure 19 Fluid Power Pump and Compressor Symbols
Fluid power systems are divided into five basic parts:pumps, reservoirs, actuators, valves, and lines.
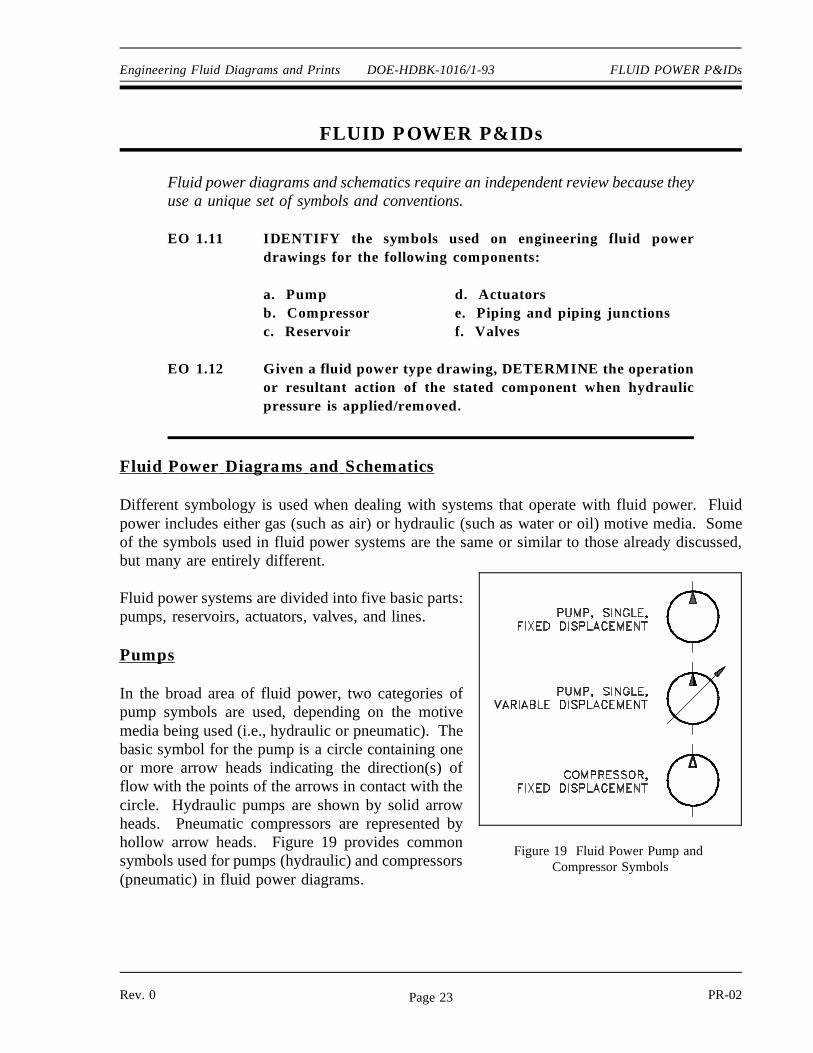
Pumps
In the broad area of fluid power, two categories ofpump symbols are used, depending on the motivemedia being used (i.e., hydraulic or pneumatic). Thebasic symbol for the pump is a circle containing oneor more arrow heads indicating the direction(s) offlow with the points of the arrows in contact with thecircle. Hydraulic pumps are shown by solid arrowheads. Pneumatic compressors are represented byhollow arrow heads. Figure 19 provides commonsymbols used for pumps (hydraulic) and compressors(pneumatic) in fluid power diagrams.
Rev. 0 PR-02Page 23
FLUID POWER P&IDs DOE-HDBK-1016/1-93 Engineering Fluid Diagrams and Prints
Reser voir s
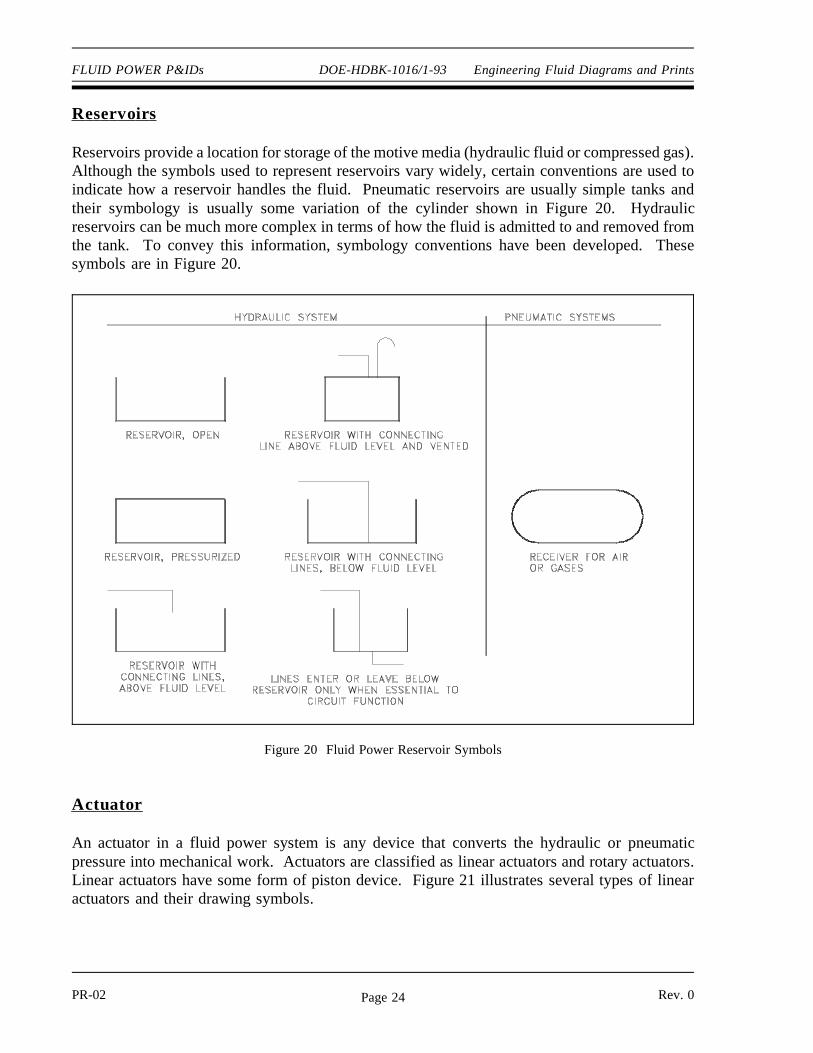
Reservoirs provide a location for storage of the motive media (hydraulic fluid or compressed gas).Although the symbols used to represent reservoirs vary widely, certain conventions are used toindicate how a reservoir handles the fluid. Pneumatic reservoirs are usually simple tanks andtheir symbology is usually some variation of the cylinder shown in Figure 20. Hydraulicreservoirs can be much more complex in terms of how the fluid is admitted to and removed fromthe tank. To convey this information, symbology conventions have been developed. Thesesymbols are in Figure 20.
Figure 20 Fluid Power Reservoir Symbols
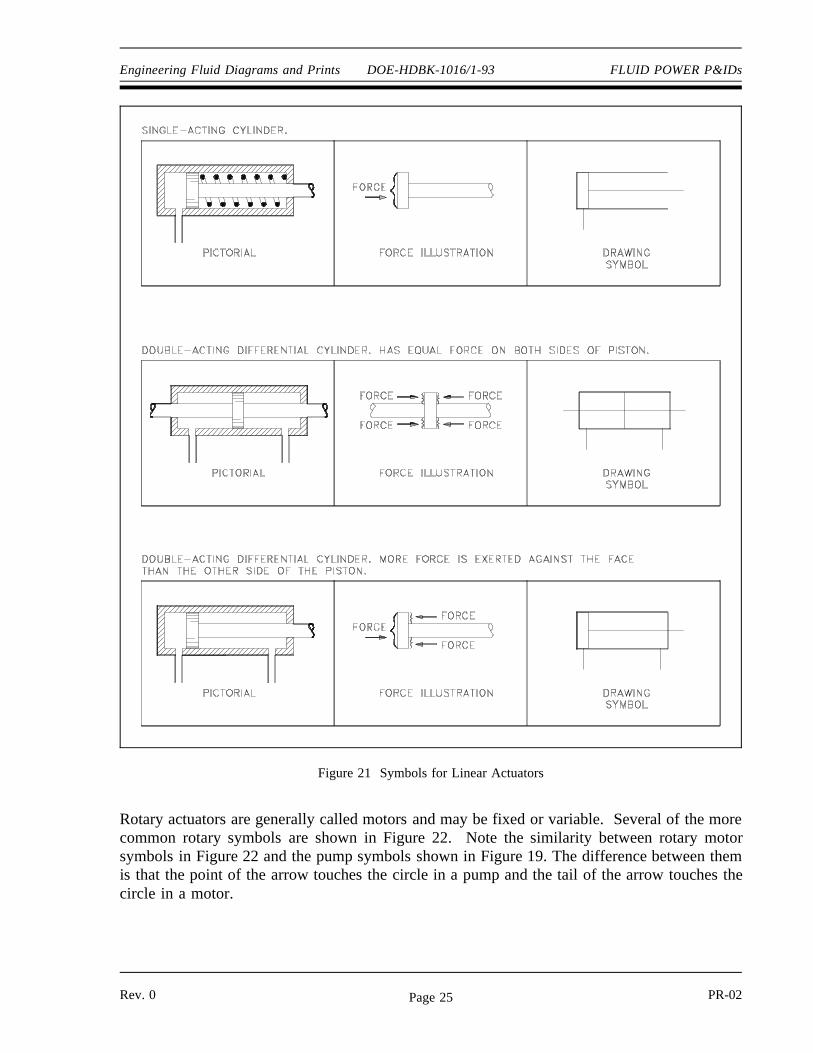
Actuator
An actuator in a fluid power system is any device that converts the hydraulic or pneumaticpressure into mechanical work. Actuators are classified as linear actuators and rotary actuators.Linear actuators have some form of piston device. Figure 21 illustrates several types of linearactuators and their drawing symbols.
PR-02 Rev. 0Page 24
Engineering Fluid Diagrams and Prints DOE-HDBK-1016/1-93 FLUID POWER P&IDs
Rotary actuators are generally called motors and may be fixed or variable. Several of the more
Figure 21 Symbols for Linear Actuators
common rotary symbols are shown in Figure 22. Note the similarity between rotary motorsymbols in Figure 22 and the pump symbols shown in Figure 19. The difference between themis that the point of the arrow touches the circle in a pump and the tail of the arrow touches thecircle in a motor.
Rev. 0 PR-02Page 25
FLUID POWER P&IDs DOE-HDBK-1016/1-93 Engineering Fluid Diagrams and Prints
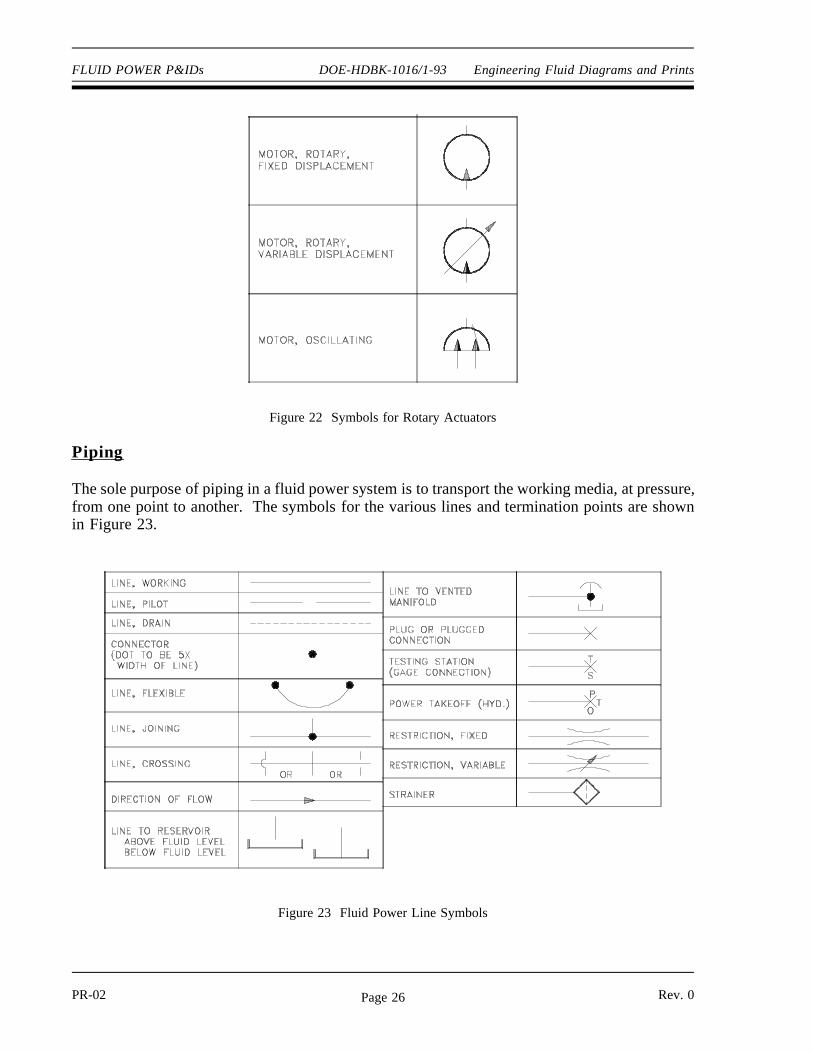
Figure 22 Symbols for Rotary Actuators
Piping
The sole purpose of piping in a fluid power system is to transport the working media, at pressure,from one point to another. The symbols for the various lines and termination points are shownin Figure 23.
Figure 23 Fluid Power Line Symbols
PR-02 Rev. 0Page 26
Engineering Fluid Diagrams and Prints DOE-HDBK-1016/1-93 FLUID POWER P&IDs
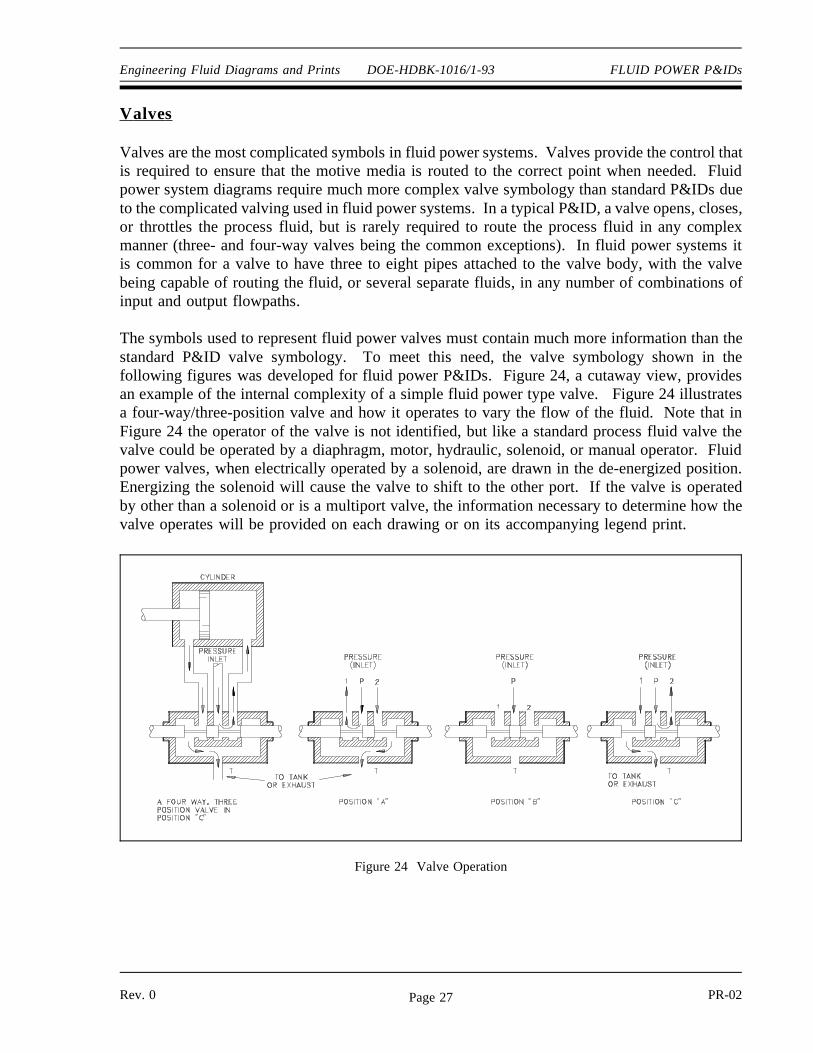
Valves
Valves are the most complicated symbols in fluid power systems. Valves provide the control thatis required to ensure that the motive media is routed to the correct point when needed. Fluidpower system diagrams require much more complex valve symbology than standard P&IDs dueto the complicated valving used in fluid power systems. In a typical P&ID, a valve opens, closes,or throttles the process fluid, but is rarely required to route the process fluid in any complexmanner (three- and four-way valves being the common exceptions). In fluid power systems itis common for a valve to have three to eight pipes attached to the valve body, with the valvebeing capable of routing the fluid, or several separate fluids, in any number of combinations ofinput and output flowpaths.
The symbols used to represent fluid power valves must contain much more information than thestandard P&ID valve symbology. To meet this need, the valve symbology shown in thefollowing figures was developed for fluid power P&IDs. Figure 24, a cutaway view, providesan example of the internal complexity of a simple fluid power type valve. Figure 24 illustratesa four-way/three-position valve and how it operates to vary the flow of the fluid. Note that inFigure 24 the operator of the valve is not identified, but like a standard process fluid valve thevalve could be operated by a diaphragm, motor, hydraulic, solenoid, or manual operator. Fluidpower valves, when electrically operated by a solenoid, are drawn in the de-energized position.Energizing the solenoid will cause the valve to shift to the other port. If the valve is operatedby other than a solenoid or is a multiport valve, the information necessary to determine how thevalve operates will be provided on each drawing or on its accompanying legend print.
Figure 24 Valve Operation
Rev. 0 PR-02Page 27
FLUID POWER P&IDs DOE-HDBK-1016/1-93 Engineering Fluid Diagrams and Prints
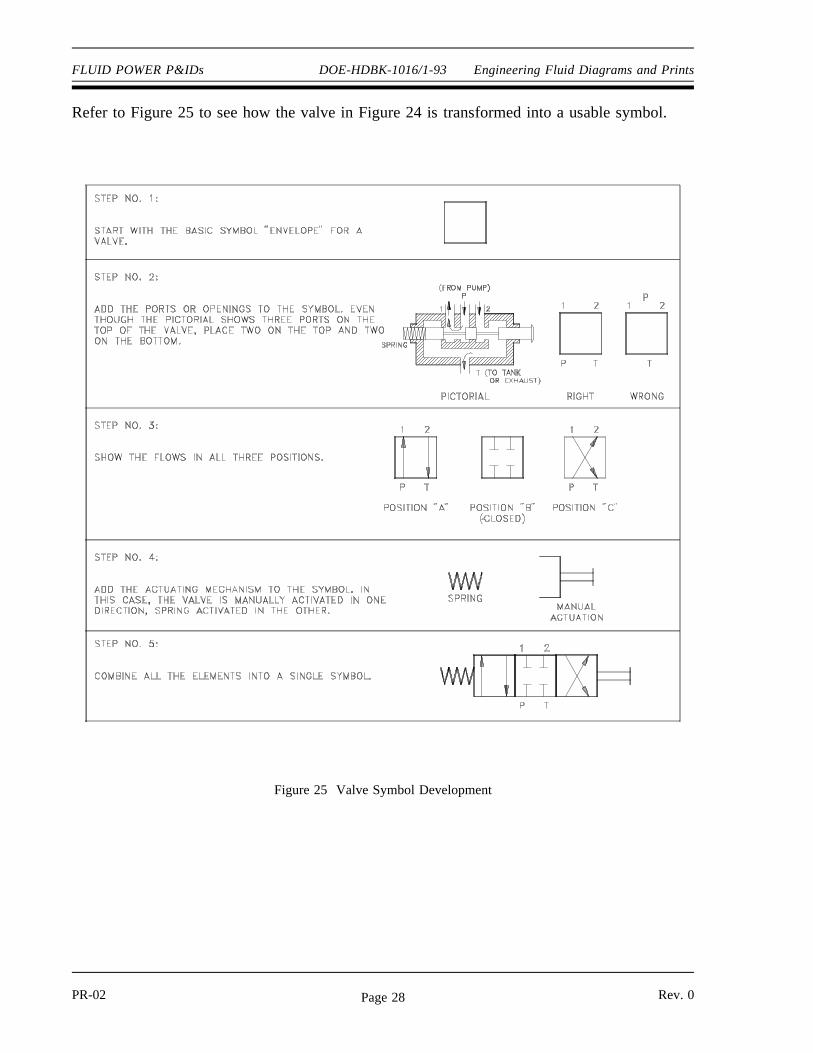
Refer to Figure 25 to see how the valve in Figure 24 is transformed into a usable symbol.
Figure 25 Valve Symbol Development
PR-02 Rev. 0Page 28
Engineering Fluid Diagrams and Prints DOE-HDBK-1016/1-93 FLUID POWER P&IDs
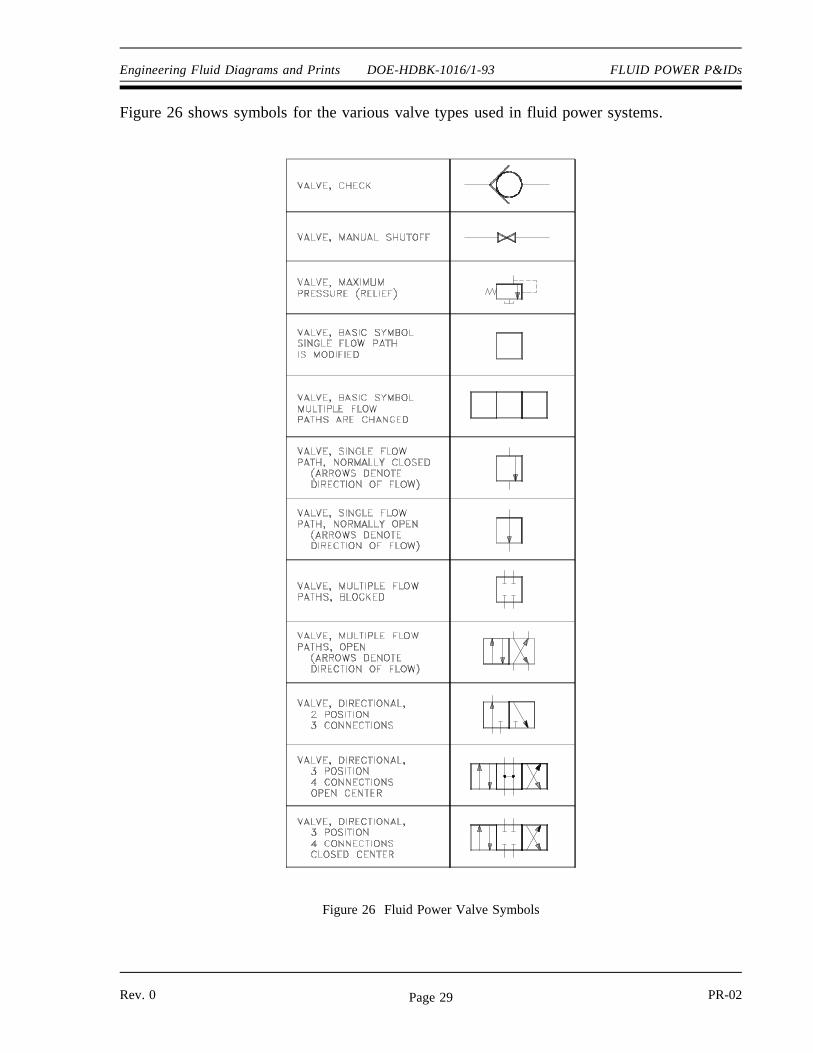
Figure 26 shows symbols for the various valve types used in fluid power systems.
Figure 26 Fluid Power Valve Symbols
Rev. 0 PR-02Page 29
FLUID POWER P&IDs DOE-HDBK-1016/1-93 Engineering Fluid Diagrams and Prints
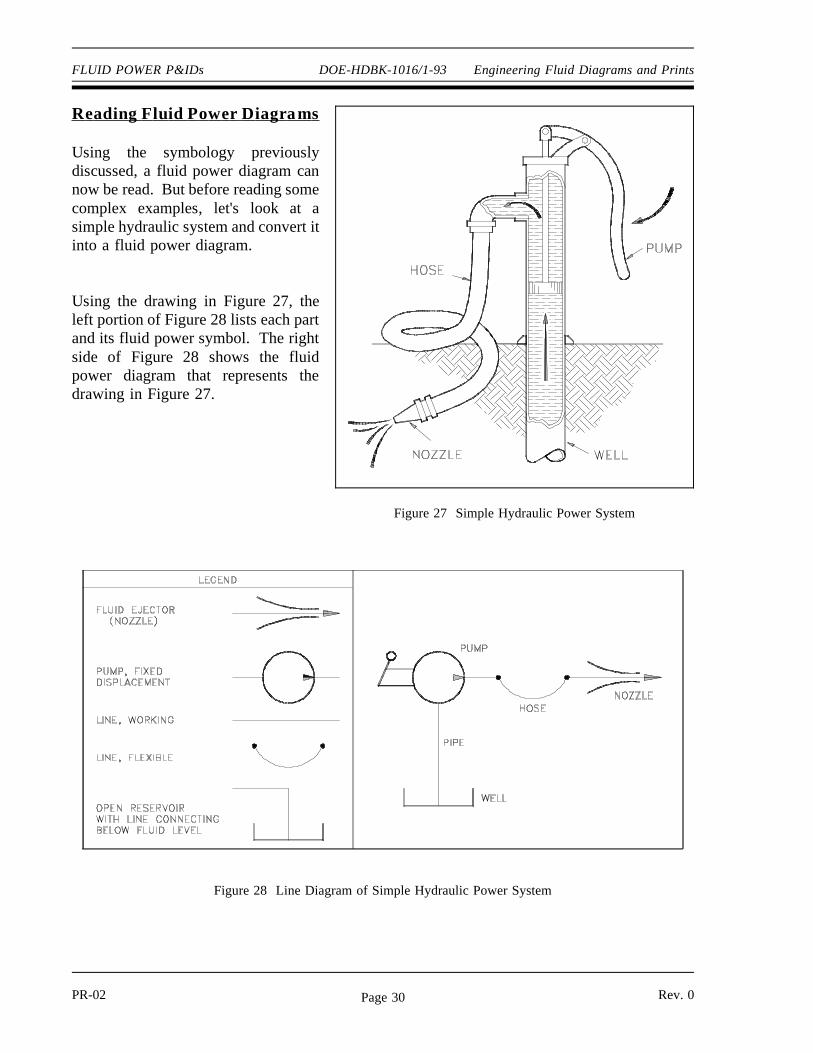
Reading Fluid Power Diagrams
Figure 27 Simple Hydraulic Power System
Using the symbology previouslydiscussed, a fluid power diagram cannow be read. But before reading somecomplex examples, let's look at asimple hydraulic system and convert itinto a fluid power diagram.
Using the drawing in Figure 27, theleft portion of Figure 28 lists each partand its fluid power symbol. The rightside of Figure 28 shows the fluidpower diagram that represents thedrawing in Figure 27.
Figure 28 Line Diagram of Simple Hydraulic Power System
PR-02 Rev. 0Page 30
Engineering Fluid Diagrams and Prints DOE-HDBK-1016/1-93 FLUID POWER P&IDs
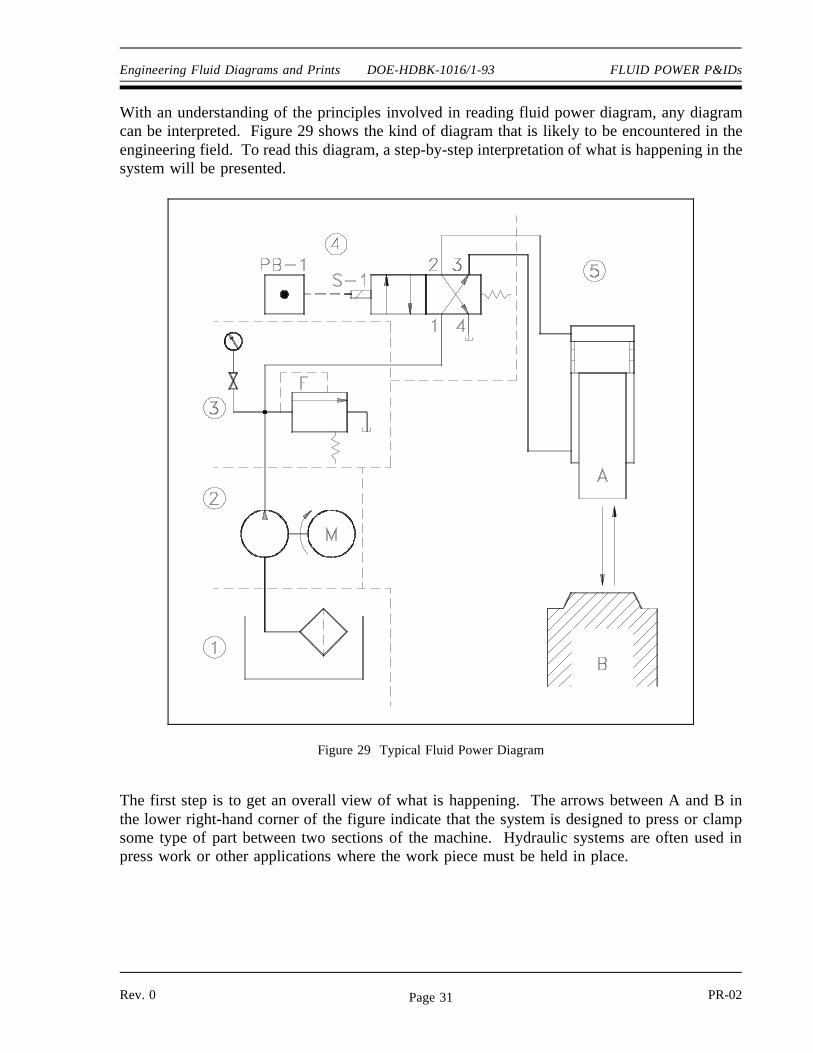
With an understanding of the principles involved in reading fluid power diagram, any diagramcan be interpreted. Figure 29 shows the kind of diagram that is likely to be encountered in theengineering field. To read this diagram, a step-by-step interpretation of what is happening in thesystem will be presented.
Figure 29 Typical Fluid Power Diagram
The first step is to get an overall view of what is happening. The arrows between A and B inthe lower right-hand corner of the figure indicate that the system is designed to press or clampsome type of part between two sections of the machine. Hydraulic systems are often used inpress work or other applications where the work piece must be held in place.
Rev. 0 PR-02Page 31
FLUID POWER P&IDs DOE-HDBK-1016/1-93 Engineering Fluid Diagrams and Prints
With the basic function understood, a detailed study of the diagram can be accomplished usinga step-by-step analysis of each numbered local area in the diagram.
LOCAL AREA NUMBER 1 Symbol for an open reservoir with a strainer. The strainer is used to clean the oil beforeit enters the system.
LOCAL AREA NUMBER 2 Fixed displacement pump, electrically operated. This pump provides hydraulic pressureto the system.
LOCAL AREA NUMBER 3Symbol for a relief valve with separate pressure gage. The relief valve is spring operatedand protects the system from over pressurization. It also acts as an unloader valve torelieve pressure when the cylinder is not in operation. When system pressure exceeds itssetpoint, the valve opens and returns the hydraulic fluid back to the reservoir. The gageprovides a reading of how much pressure is in the system.
LOCAL AREA NUMBER 4Composite symbol for a 4-way, 2-position valve. Pushbutton PB-1 is used to activate thevalve by energizing the S-1 solenoid (note the valve is shown in the de-energizedposition). As shown, the high pressure hydraulic fluid is being routed from Port 1 to Port3 and then to the bottom chamber of the piston. This drives and holds the piston in localarea #5 in the retracted position. When the piston is fully retracted and hydraulic pressurebuilds, the unloader (relief) valve will lift and maintain the system's pressure at setpoint.
When PB-1 is pushed and S-1 energized, the 1-2 ports are aligned and 3-4 ports arealigned. This allows hydraulic fluid to enter the top chamber of the piston and drive itdown. The fluid in the bottom chamber drains though the 3-4 ports back into thereservoir. The piston will continue to travel down until either PB-1 is released or fulltravel is reached, at which point the unloader (relief) valve will lift.
LOCAL AREA NUMBER 5Actuating cylinder and piston. The cylinder is designed to receive fluid in either theupper or lower chambers. The system is designed so that when pressure is applied to thetop chamber, the bottom chamber is aligned to drain back to the reservoir. When pressureis applied to the bottom chamber, the top chamber is aligned so that it drains back to thereservoir.
PR-02 Rev. 0Page 32
Engineering Fluid Diagrams and Prints DOE-HDBK-1016/1-93 FLUID POWER P&IDs
Types of Fluid Power Diagrams
Several kinds of diagrams can be used to show how systems work. With an understanding ofhow to interpret Figure 29, a reader will be able to interpret all of the diagrams that follow.
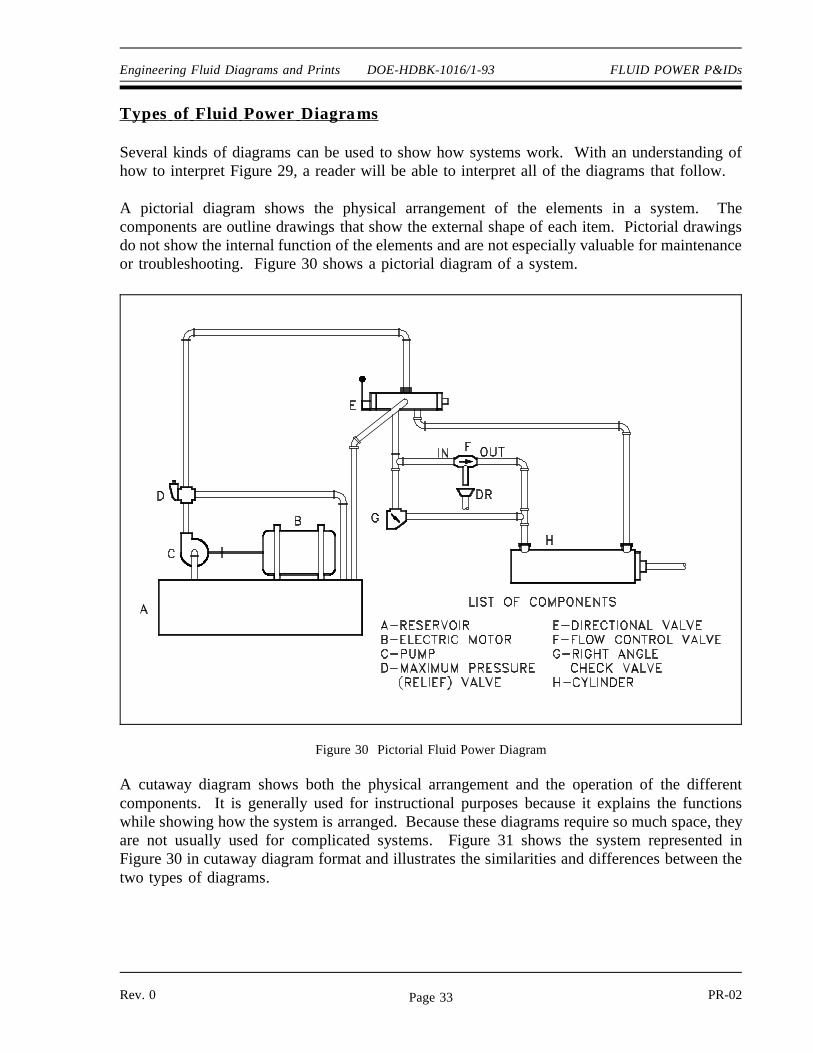
A pictorial diagram shows the physical arrangement of the elements in a system. Thecomponents are outline drawings that show the external shape of each item. Pictorial drawingsdo not show the internal function of the elements and are not especially valuable for maintenanceor troubleshooting. Figure 30 shows a pictorial diagram of a system.
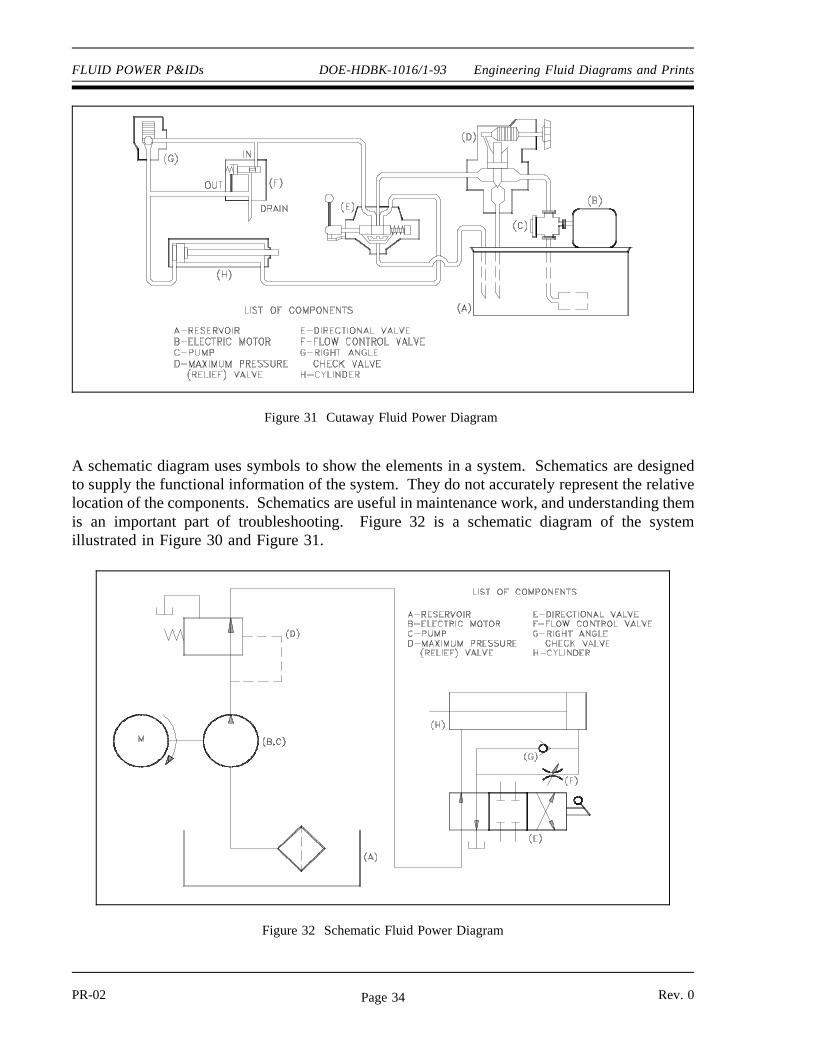
A cutaway diagram shows both the physical arrangement and the operation of the different
Figure 30 Pictorial Fluid Power Diagram
components. It is generally used for instructional purposes because it explains the functionswhile showing how the system is arranged. Because these diagrams require so much space, theyare not usually used for complicated systems. Figure 31 shows the system represented inFigure 30 in cutaway diagram format and illustrates the similarities and differences between thetwo types of diagrams.
Rev. 0 PR-02Page 33
FLUID POWER P&IDs DOE-HDBK-1016/1-93 Engineering Fluid Diagrams and Prints
Figure 31 Cutaway Fluid Power Diagram
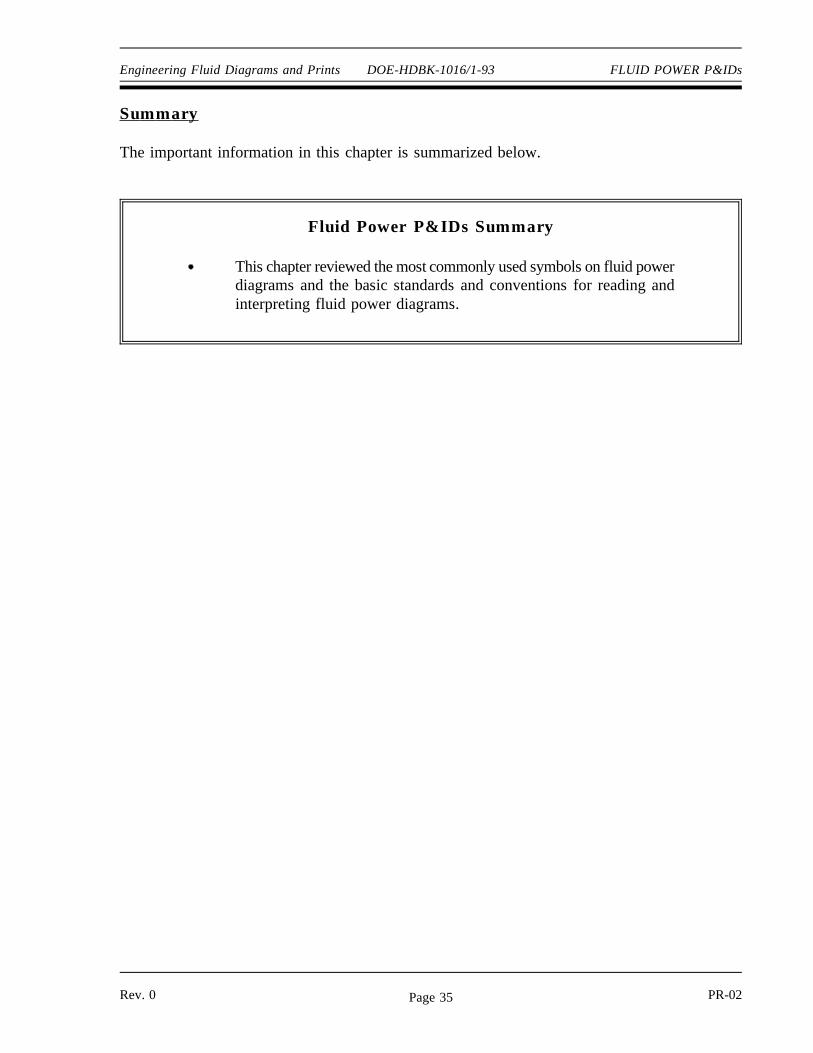
A schematic diagram uses symbols to show the elements in a system. Schematics are designedto supply the functional information of the system. They do not accurately represent the relativelocation of the components. Schematics are useful in maintenance work, and understanding themis an important part of troubleshooting. Figure 32 is a schematic diagram of the systemillustrated in Figure 30 and Figure 31.
Figure 32 Schematic Fluid Power Diagram
PR-02 Rev. 0Page 34
Engineering Fluid Diagrams and Prints DOE-HDBK-1016/1-93 FLUID POWER P&IDs
Summary
The important information in this chapter is summarized below.
Fluid Power P&IDs Summary
This chapter reviewed the most commonly used symbols on fluid powerdiagrams and the basic standards and conventions for reading andinterpreting fluid power diagrams.
Rev. 0 PR-02Page 35