Embed Size (px)
Citation preview
Engineering, Technology & Applied Science Research Vol. 10, No. 4, 2020, 6142-6146 6142
www.etasr.com Alshammari & Chughtai: IoT Gas Leakage Detector and Warning Generator
IoT Gas Leakage Detector and Warning Generator
Bader Farhan Alshammari
Electrical Engineering Department University of Hail Hail, Saudi Arabia
Muhammad Tajammal Chughtai
Electrical Engineering Department University of Hail Hail, Saudi Arabia
Abstract−This paper presents an industrial monitoring system
design using the Internet of Things (IoT). The gas sensor (MQ-5)
captured information is posted into a data cloud. The sensor
detects the leakage of gas under most atmospheric conditions. All
the components are controlled by an Arduino (UNO-1) that acts
as a central processor unit in the setup t. As soon as a gas leakage is detected by the sensor, the alarm is raised in the form of a
buzzer. This alarm is supported by an LCD to display the
location of leakage, alert the observer, and activate the exhaust
fan in the particular section to extract leaked gas. The
requirement of a gas detection system is not only to monitor
continuously the surroundings but also to help prevent the gas
leakage hence minimizing the chances of fire and damage.
Keywords-Internet of Things; gas leakage detection; Arduino;
WiFi ; LPG ; natural gases , oil and gas industry
I. INTRODUCTION
Safety at workplace and industry is always a priority. In this regard, the less costly options for accident and mishap prevention in oil and gas industries are commonly adopted, yet these measures ought to be effective. Security is the level of protection against danger and loss [1]. The help of technology is needed to provide early warning alerts in order to ensure that enough time is available to prevent potential dangers. In this study, gas leakage detection systems have been highlighted along with troubleshooting directives [2, 3]. Even though building a system with a gas sensor is not as easy as it may seem [4, 5], a warning system has been developed based on ESP (WiFi) network. The system detects the presence of natural gases such as Methane and LPG. Whenever a gas leakage occurs, the sensors used in the circuit will detect it, the ESP modem will be activated and a notification alert to the user will be transmitted by a customized dashboard. The system provides a real-time notification, allowing immediate implementation of health and safety measures and increasing the available time span to overcome the situation [6, 7]. The same system can be utilized in several other places such as kitchens, oil and gas pipelines, gas storage facilities, etc. [4].
There is always a risk of leakage whenever gas is used, threatening human lives and property [8, 9]. Therefore, designing a low cost gas leakage detector can help in minimizing this risk over a span of several years. There have been several accidents caused by gas (LPG or methane) leakages in homes and industries (mainly oil and gas
industries). These leakages have led to the loss of several lives and properties through fire outbreaks and explosions [8, 10].
II. PROBLEM DESCRIPTION
In pipelines gas transfer, gas leakage is inevitable as there is a necessity of joints and other transmission components. The gas leakage up to a certain mass level can be ignored, however it is very important to raise an alarm if it surpasses certain threshold values. During the training in oil and gas industry the problem was mainly identified at the connections of gas valves. IoT can be utilized for efficient and easy monitoring of gas leakages in a continuous basis and from any distance. IoT is basically a network of interconnected devices that are embedded with sensors, programing, and network connectivity to collect and exchange data [11, 12].
III. DISCUSSION
The aim of this paper is to design a system that can detect the presence of natural gases and send alert signals to the users and nearest engineers of the leakage occurrence, and by showing a dashboard to the operator. The difference between the proposed system and the proposed one in [2] is that it shows a full screen dashboard in a 24 hour basis, connected to Wi-Fi allowing the faster information sending to the dashboard. In [2] the GSM is not efficient to be read all the time. It takes time and the reading is done by a mobile and not an industry application. Our system allows the user to be able to take immediate actions against the gas leakage. In addition, it makes the gas leakage information available, accessible, and monitored from the DCS room. This system can be used in oil and gas industries and even in our kitchen.
IV. METHODOLOGY AND TECHINCAL BACKGROUND
A. System Methodology
In this phase, the research focuses more on the study case and the project development based on gas and sensor. The microcontroller will continuously receive the concentration and temperature data from two sensors in analog data packets. It will process the data and convert them to ppm and Celsius degrees respectively. The converted data will be displayed in the LCD. Whenever the reading of the sensors exceeds the set limit, it will automatically send a reading alert to the dashboard by using ESP 8266 Network to the numbers which are already set on the source code. The project methodology shows the step by step development of the project. The methodology includes
Corresponding author: Bader Farhan Alshammari
Engineering, Technology & Applied Science Research Vol. 10, No. 4, 2020, 6142-6146 6143
www.etasr.com Alshammari & Chughtai: IoT Gas Leakage Detector and Warning Generator
the planning, the development of the design, and the management of the project.
B. Hardware and Software Development
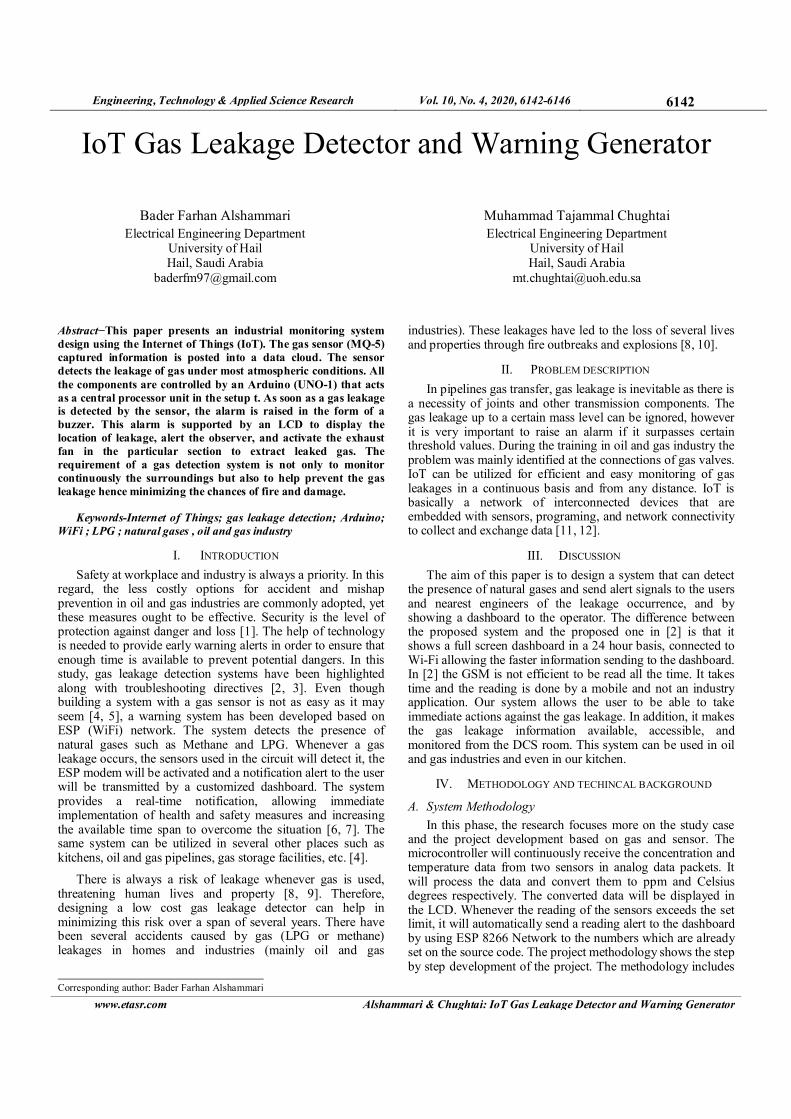
Arduino Uno board plays an important role in this project as it plays the role of the project’s Central Process Unit (CPU). It needs to be programmed to execute the required function. The program should clarify the digital and analog pins (input and output pins), transmit, receiver pins, input voltage, and output voltage (5V DC). The Arduino Uno is a microcontroller board with extraordinary functions. It contains fourteen digital (input and output pins), six analog pins, with data transferring speed up to 16MHz, a universal USB terminal, power connection, and a reset switch. The project basic diagram is presented in Figure 1 and the software flowchart is given in Figure 2 [6].
Fig. 1. Main diagram of the project.
Fig. 2. System’s flowchart.
The hardware components of the module are:
1. Transformer (230 – 12 V Ac) 2. Voltage Regulator (LM 7805) 3. Rectifier & Filter 4. Microcontroller (Atmega328) 5. Push Buttons & LCD 6. In4007 & Led 7. Resistors & Capacitors
V. MODULE DESGIN
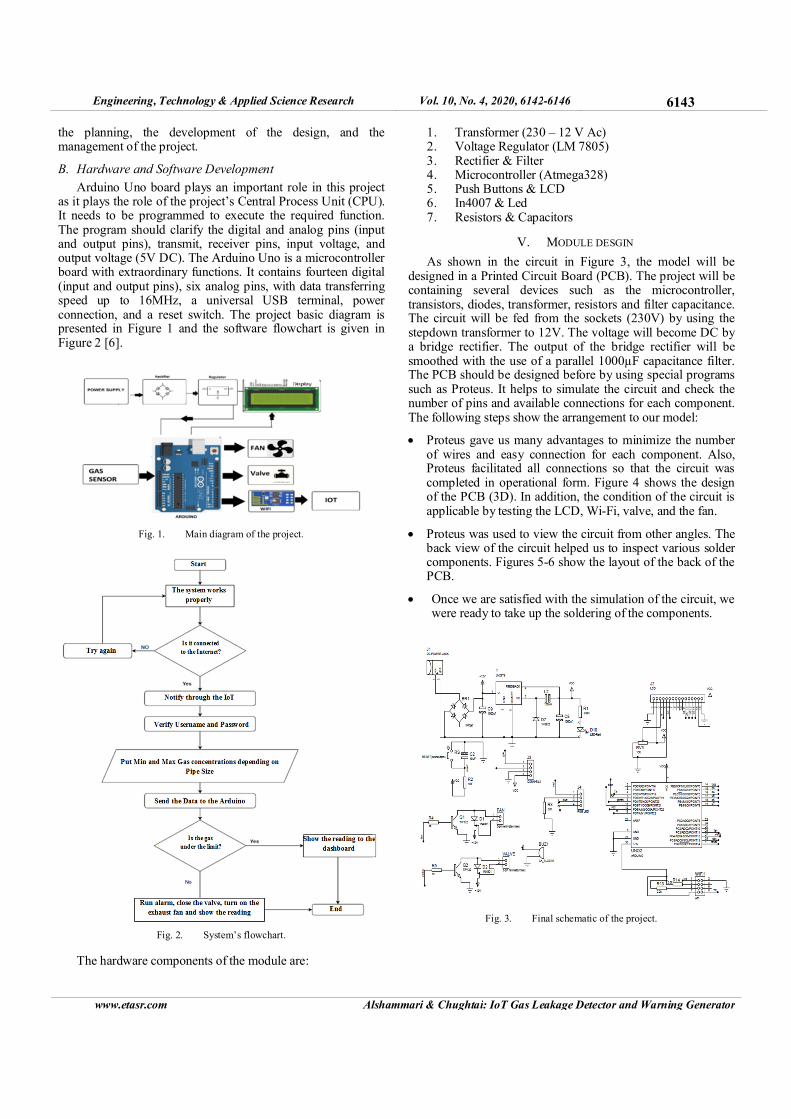
As shown in the circuit in Figure 3, the model will be designed in a Printed Circuit Board (PCB). The project will be containing several devices such as the microcontroller, transistors, diodes, transformer, resistors and filter capacitance. The circuit will be fed from the sockets (230V) by using the stepdown transformer to 12V. The voltage will become DC by a bridge rectifier. The output of the bridge rectifier will be smoothed with the use of a parallel 1000µF capacitance filter. The PCB should be designed before by using special programs such as Proteus. It helps to simulate the circuit and check the number of pins and available connections for each component. The following steps show the arrangement to our model:
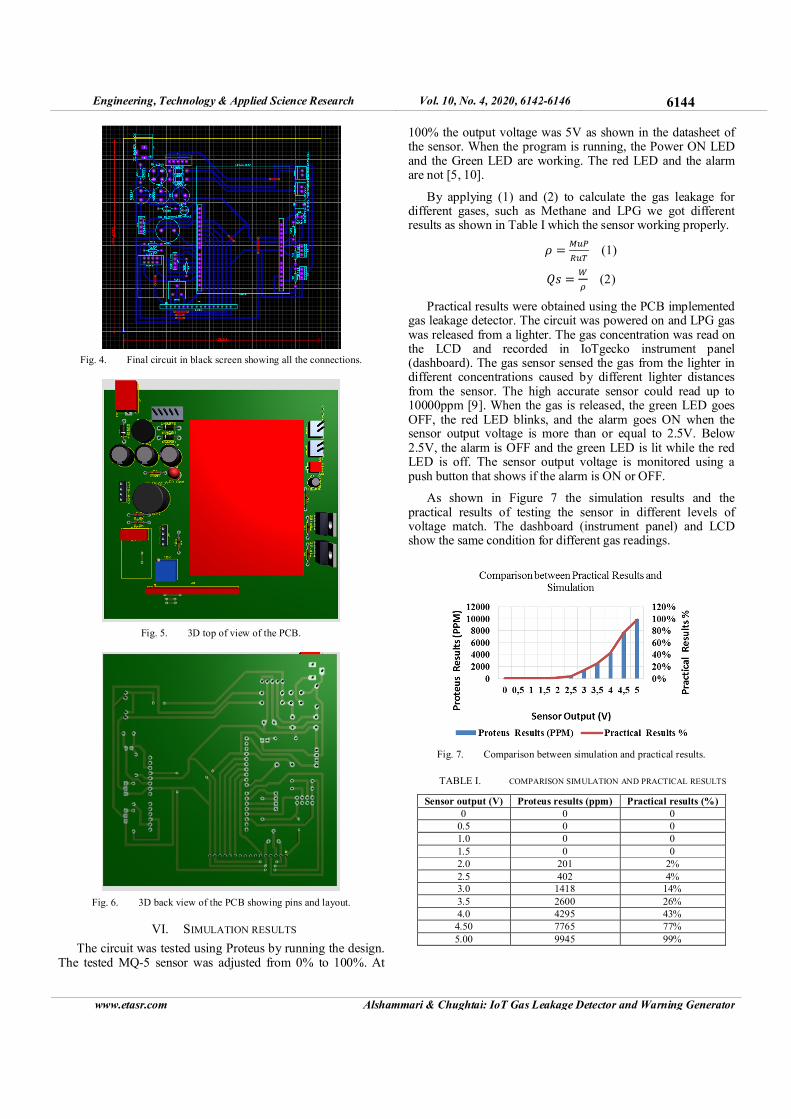
• Proteus gave us many advantages to minimize the number of wires and easy connection for each component. Also, Proteus facilitated all connections so that the circuit was completed in operational form. Figure 4 shows the design of the PCB (3D). In addition, the condition of the circuit is applicable by testing the LCD, Wi-Fi, valve, and the fan.
• Proteus was used to view the circuit from other angles. The back view of the circuit helped us to inspect various solder components. Figures 5-6 show the layout of the back of the PCB.
• Once we are satisfied with the simulation of the circuit, we were ready to take up the soldering of the components.
Fig. 3. Final schematic of the project.
Engineering, Technology & Applied Science Research Vol. 10, No. 4, 2020, 6142-6146 6144
www.etasr.com Alshammari & Chughtai: IoT Gas Leakage Detector and Warning Generator
Fig. 4. Final circuit in black screen showing all the connections.
Fig. 5. 3D top of view of the PCB.
Fig. 6. 3D back view of the PCB showing pins and layout.
VI. SIMULATION RESULTS
The circuit was tested using Proteus by running the design. The tested MQ-5 sensor was adjusted from 0% to 100%. At
100% the output voltage was 5V as shown in the datasheet of the sensor. When the program is running, the Power ON LED and the Green LED are working. The red LED and the alarm are not [5, 10].
By applying (1) and (2) to calculate the gas leakage for different gases, such as Methane and LPG we got different results as shown in Table I which the sensor working properly.
� ����
��� (1)
� �
� (2)
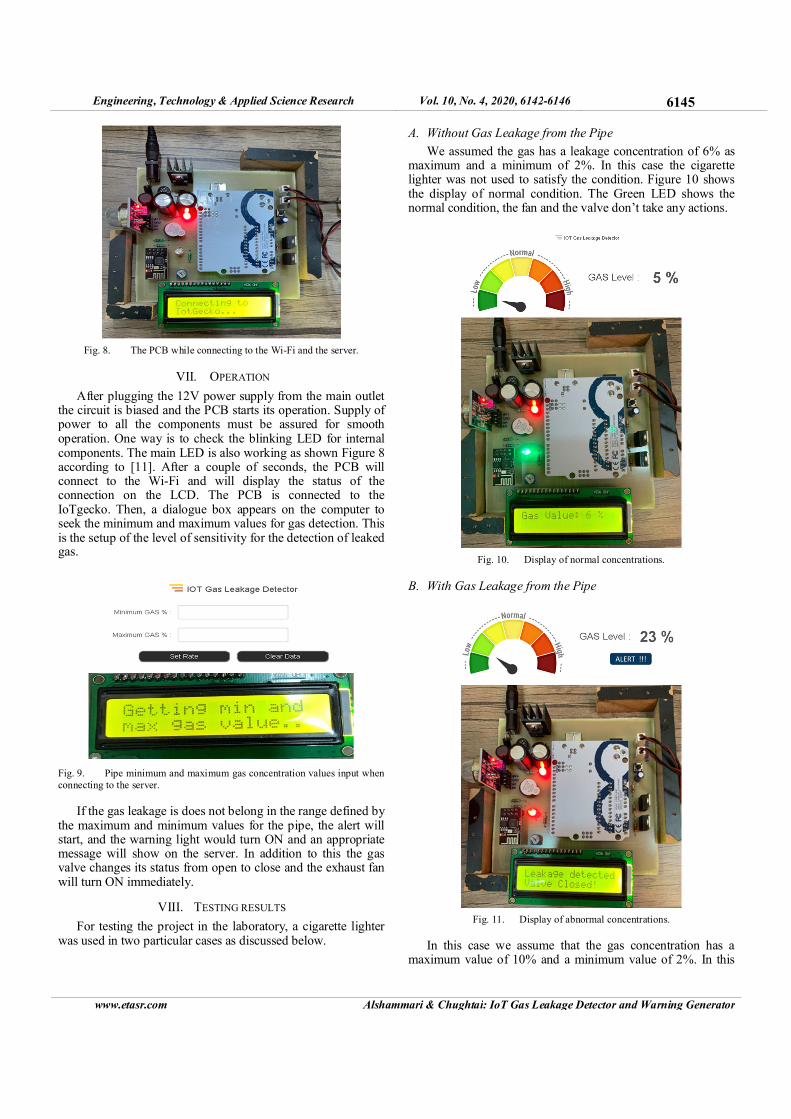
Practical results were obtained using the PCB implemented gas leakage detector. The circuit was powered on and LPG gas was released from a lighter. The gas concentration was read on the LCD and recorded in IoTgecko instrument panel (dashboard). The gas sensor sensed the gas from the lighter in different concentrations caused by different lighter distances from the sensor. The high accurate sensor could read up to 10000ppm [9]. When the gas is released, the green LED goes OFF, the red LED blinks, and the alarm goes ON when the sensor output voltage is more than or equal to 2.5V. Below 2.5V, the alarm is OFF and the green LED is lit while the red LED is off. The sensor output voltage is monitored using a push button that shows if the alarm is ON or OFF.
As shown in Figure 7 the simulation results and the practical results of testing the sensor in different levels of voltage match. The dashboard (instrument panel) and LCD show the same condition for different gas readings.
Fig. 7. Comparison between simulation and practical results.
TABLE I. COMPARISON SIMULATION AND PRACTICAL RESULTS
Sensor output (V) Proteus results (ppm) Practical results (%)
0 0 0
0.5 0 0
1.0 0 0
1.5 0 0
2.0 201 2%
2.5 402 4%
3.0 1418 14%
3.5 2600 26%
4.0 4295 43%
4.50 7765 77%
5.00 9945 99%
Engineering, Technology & Applied Science Research Vol. 10, No. 4, 2020, 6142-6146 6145
www.etasr.com Alshammari & Chughtai: IoT Gas Leakage Detector and Warning Generator
Fig. 8. The PCB while connecting to the Wi-Fi and the server.
VII. OPERATION
After plugging the 12V power supply from the main outlet the circuit is biased and the PCB starts its operation. Supply of power to all the components must be assured for smooth operation. One way is to check the blinking LED for internal components. The main LED is also working as shown Figure 8 according to [11]. After a couple of seconds, the PCB will connect to the Wi-Fi and will display the status of the connection on the LCD. The PCB is connected to the IoTgecko. Then, a dialogue box appears on the computer to seek the minimum and maximum values for gas detection. This is the setup of the level of sensitivity for the detection of leaked gas.
Fig. 9. Pipe minimum and maximum gas concentration values input when
connecting to the server.
If the gas leakage is does not belong in the range defined by the maximum and minimum values for the pipe, the alert will start, and the warning light would turn ON and an appropriate message will show on the server. In addition to this the gas valve changes its status from open to close and the exhaust fan will turn ON immediately.
VIII. TESTING RESULTS
For testing the project in the laboratory, a cigarette lighter was used in two particular cases as discussed below.
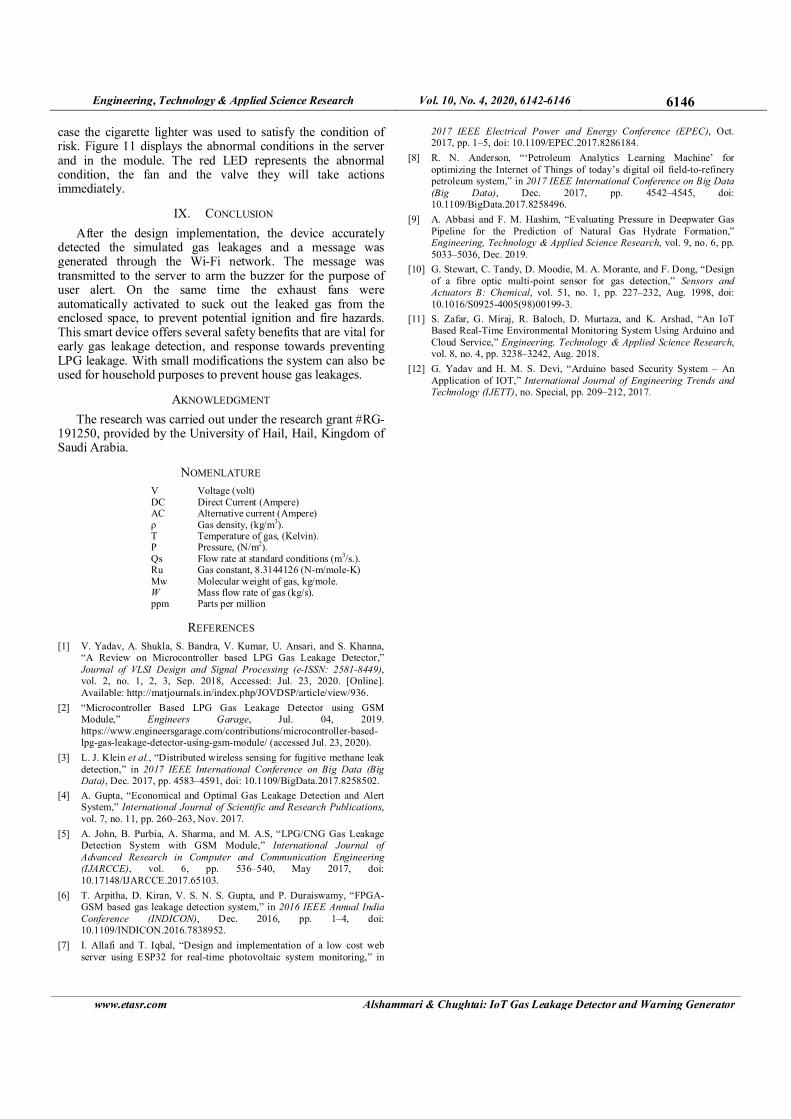
A. Without Gas Leakage from the Pipe
We assumed the gas has a leakage concentration of 6% as maximum and a minimum of 2%. In this case the cigarette lighter was not used to satisfy the condition. Figure 10 shows the display of normal condition. The Green LED shows the normal condition, the fan and the valve don’t take any actions.
Fig. 10. Display of normal concentrations.
B. With Gas Leakage from the Pipe
Fig. 11. Display of abnormal concentrations.
In this case we assume that the gas concentration has a maximum value of 10% and a minimum value of 2%. In this
Engineering, Technology & Applied Science Research Vol. 10, No. 4, 2020, 6142-6146 6146
www.etasr.com Alshammari & Chughtai: IoT Gas Leakage Detector and Warning Generator
case the cigarette lighter was used to satisfy the condition of risk. Figure 11 displays the abnormal conditions in the server and in the module. The red LED represents the abnormal condition, the fan and the valve they will take actions immediately.
IX. CONCLUSION
After the design implementation, the device accurately detected the simulated gas leakages and a message was generated through the Wi-Fi network. The message was transmitted to the server to arm the buzzer for the purpose of user alert. On the same time the exhaust fans were automatically activated to suck out the leaked gas from the enclosed space, to prevent potential ignition and fire hazards. This smart device offers several safety benefits that are vital for early gas leakage detection, and response towards preventing LPG leakage. With small modifications the system can also be used for household purposes to prevent house gas leakages.
AKNOWLEDGMENT
The research was carried out under the research grant #RG-191250, provided by the University of Hail, Hail, Kingdom of Saudi Arabia.
NOMENLATURE
V Voltage (volt) DC Direct Current (Ampere) AC Alternative current (Ampere) ρ Gas density, (kg/m
3).
T Temperature of gas, (Kelvin). P Pressure, (N/m
2).
Qs Flow rate at standard conditions (m3/s.).
Ru Gas constant, 8.3144126 (N-m/mole-K) Mw Molecular weight of gas, kg/mole. W Mass flow rate of gas (kg/s). ppm Parts per million
REFERENCES
[1] V. Yadav, A. Shukla, S. Bandra, V. Kumar, U. Ansari, and S. Khanna, “A Review on Microcontroller based LPG Gas Leakage Detector,”
Journal of VLSI Design and Signal Processing (e-ISSN: 2581-8449), vol. 2, no. 1, 2, 3, Sep. 2018, Accessed: Jul. 23, 2020. [Online].
Available: http://matjournals.in/index.php/JOVDSP/article/view/936.
[2] “Microcontroller Based LPG Gas Leakage Detector using GSM Module,” Engineers Garage, Jul. 04, 2019.
https://www.engineersgarage.com/contributions/microcontroller-based-lpg-gas-leakage-detector-using-gsm-module/ (accessed Jul. 23, 2020).
[3] L. J. Klein et al., “Distributed wireless sensing for fugitive methane leak
detection,” in 2017 IEEE International Conference on Big Data (Big Data), Dec. 2017, pp. 4583–4591, doi: 10.1109/BigData.2017.8258502.
[4] A. Gupta, “Economical and Optimal Gas Leakage Detection and Alert System,” International Journal of Scientific and Research Publications,
vol. 7, no. 11, pp. 260–263, Nov. 2017.
[5] A. John, B. Purbia, A. Sharma, and M. A.S, “LPG/CNG Gas Leakage Detection System with GSM Module,” International Journal of
Advanced Research in Computer and Communication Engineering (IJARCCE), vol. 6, pp. 536–540, May 2017, doi:
10.17148/IJARCCE.2017.65103.
[6] T. Arpitha, D. Kiran, V. S. N. S. Gupta, and P. Duraiswamy, “FPGA-GSM based gas leakage detection system,” in 2016 IEEE Annual India
Conference (INDICON), Dec. 2016, pp. 1–4, doi: 10.1109/INDICON.2016.7838952.
[7] I. Allafi and T. Iqbal, “Design and implementation of a low cost web
server using ESP32 for real-time photovoltaic system monitoring,” in
2017 IEEE Electrical Power and Energy Conference (EPEC), Oct. 2017, pp. 1–5, doi: 10.1109/EPEC.2017.8286184.
[8] R. N. Anderson, “‘Petroleum Analytics Learning Machine’ for
optimizing the Internet of Things of today’s digital oil field-to-refinery petroleum system,” in 2017 IEEE International Conference on Big Data
(Big Data), Dec. 2017, pp. 4542–4545, doi: 10.1109/BigData.2017.8258496.
[9] A. Abbasi and F. M. Hashim, “Evaluating Pressure in Deepwater Gas
Pipeline for the Prediction of Natural Gas Hydrate Formation,” Engineering, Technology & Applied Science Research, vol. 9, no. 6, pp.
5033–5036, Dec. 2019.
[10] G. Stewart, C. Tandy, D. Moodie, M. A. Morante, and F. Dong, “Design
of a fibre optic multi-point sensor for gas detection,” Sensors and Actuators B: Chemical, vol. 51, no. 1, pp. 227–232, Aug. 1998, doi:
10.1016/S0925-4005(98)00199-3.
[11] S. Zafar, G. Miraj, R. Baloch, D. Murtaza, and K. Arshad, “An IoT Based Real-Time Environmental Monitoring System Using Arduino and
Cloud Service,” Engineering, Technology & Applied Science Research, vol. 8, no. 4, pp. 3238–3242, Aug. 2018.
[12] G. Yadav and H. M. S. Devi, “Arduino based Security System – An
Application of IOT,” International Journal of Engineering Trends and Technology (IJETT), no. Special, pp. 209–212, 2017.