Embed Size (px)
DESCRIPTION
Issues of Pricing Urban Water Dr. Vibhooti Shukla Unit in Urban Economics & Regional Development WORKING PAPER NO. 13 Rajan Padwal * Rajan Padwal is Senior Lecturer of Economics, Department of Economics, M. D. College, Abstract Mumbai. Issues of Pricing Urban Water Rajan Padwal Introduction (2) Underpricing has resulted in poor and unreliable water services. 1 2
Citation preview

Issues of Pricing Urban Water
Rajan Padwal
DEPARTMENT OF ECONOMICS UNIVERSITY OF MUMBAI
Dr. Vibhooti Shukla Unit in Urban Economics & Regional Development
WORKING PAPER NO. 13

Issues of Pricing Urban Water
Rajan Padwal*
Abstract
With urban expansion and the growth of population, Indian cities are not able to supply water services that are adequate both quantitatively and qualitatively. Most urban water supply authorities prefer to respond to this demand deficit problem by augmenting existing supply via tapping new distant and often costlier water resources. However, there are obvious limits to this approach. It cannot be a permanent solution because it cannot be sustainable in the long run. The soft policy of supply augmentation ignores the role of pricing in water demand management. Water pricing is a complex problem because water is merit good. The pricing policy, therefore, intends to achieve number of objectives, which are often inconsistent of to each other. The objective of this to paper is to focus on the issues that are crucial for determining appropriate price policy and the need to initiate reforms therein.
* Rajan Padwal is Senior Lecturer of Economics, Department of Economics, M. D. College, Mumbai.

Issues of Pricing Urban Water Rajan Padwal
Introduction
With urban expansion, population and lifestyle changes, urban water supply
needs often exceeds supply availability. Most urban water supply authorities prefer to
respond to this demand deficit problem by augmenting existing supply via tapping new
distant and often costlier water resources. But there are obvious limits to this approach.
It cannot be a permanent solution because it cannot be sustainable in the long run.
In this situation the policy of supply augmentation conceals the current wastage
evident in the urban water supply system. A mere supply side solution does not create
appropriate economic environment for the emergence of innovative practices.
Furthermore, it undermines the search for more durable demand solution. As a result,
the hidden water potential available within the existing levels of urban water supply
remains unexploited. The policy of supply augmentation overlooks the role of pricing in
regulating demand for water.
Water pricing is a complex issue because water is merit good. Water pricing
policy is intended to serve many objectives such as equity, efficiency financial
sustainability, and full cost recovery often inconsistent to each other. The resulting price
policy is irrational. The need to fix an appropriate charge of price for urban water has
been strongly advocated in recent years. Several reasons have been put forward in
support of appropriate price policy.
(1) Urban water is underpriced in relation to the cost incurred on the provision of water
resulted in serious concerns about the financial viability and sustainability of urban
water utilities.
(2) Underpricing has resulted in poor and unreliable water services.
1
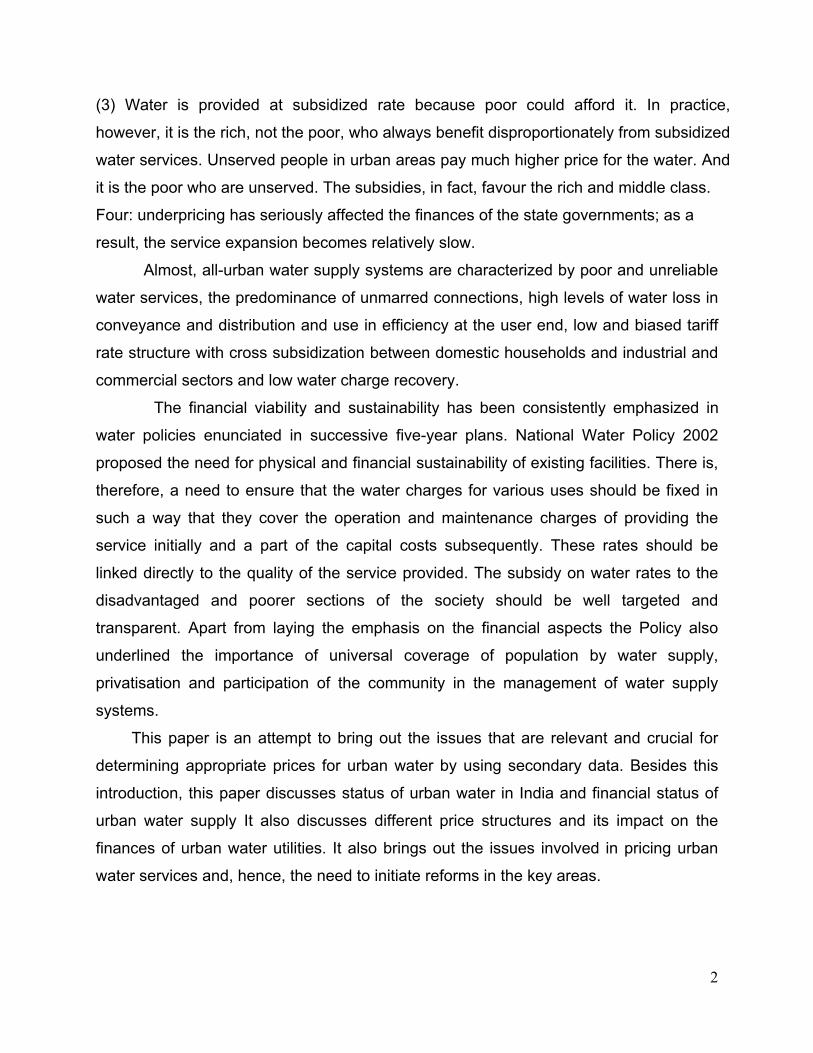
(3) Water is provided at subsidized rate because poor could afford it. In practice,
however, it is the rich, not the poor, who always benefit disproportionately from subsidized
water services. Unserved people in urban areas pay much higher price for the water. And
it is the poor who are unserved. The subsidies, in fact, favour the rich and middle class.
Four: underpricing has seriously affected the finances of the state governments; as a
result, the service expansion becomes relatively slow.
Almost, all-urban water supply systems are characterized by poor and unreliable
water services, the predominance of unmarred connections, high levels of water loss in
conveyance and distribution and use in efficiency at the user end, low and biased tariff
rate structure with cross subsidization between domestic households and industrial and
commercial sectors and low water charge recovery.
The financial viability and sustainability has been consistently emphasized in
water policies enunciated in successive five-year plans. National Water Policy 2002
proposed the need for physical and financial sustainability of existing facilities. There is,
therefore, a need to ensure that the water charges for various uses should be fixed in
such a way that they cover the operation and maintenance charges of providing the
service initially and a part of the capital costs subsequently. These rates should be
linked directly to the quality of the service provided. The subsidy on water rates to the
disadvantaged and poorer sections of the society should be well targeted and
transparent. Apart from laying the emphasis on the financial aspects the Policy also
underlined the importance of universal coverage of population by water supply,
privatisation and participation of the community in the management of water supply
systems.
This paper is an attempt to bring out the issues that are relevant and crucial for
determining appropriate prices for urban water by using secondary data. Besides this
introduction, this paper discusses status of urban water in India and financial status of
urban water supply It also discusses different price structures and its impact on the
finances of urban water utilities. It also brings out the issues involved in pricing urban
water services and, hence, the need to initiate reforms in the key areas.
2

Status of Urban Water
Rapid growth of urban population has been the characteristic of Indian
urbanisation. The Indian urban population has increased more than 10 times since the
beginning of the century and more than 5 times since the independence. The decadal
urban growth rate of population has remained steady at 40 per cent. The reasons for
the urban growth rate have been attributed to natural increase in population and rural-
urban migration. Urban population has increased at the rate that has twice the rural
population while the urban population accounts 5 to 6 per cent of total water
consumption, which is inadequate in relation to its demand. Although 90% of the urban
population has access to safe drinking water as compared to 75% in 1981(GOI, 1999),
however, the coverage has not been uniform across the States.
Table I
Access to Water Supply in Urban Areas (Status as on 1997)
Population provided with Water supply(in %age)
States
High: more than 85%
Andhra Pradesh, Arunachal Pradesh, Delhi, Gujarat, Haryana, Himachal Pradesh, Jammu & Kashmir, Karnataka, Madhya Pradesh, Maharashtra, Meghalaya, Nagaland, Rajashthan, Uttar Pradesh, West Bengal.
Medium: Between 75% and 85%
Bihar, Goa, Manipur, Punjab, Tamil Nadu, Tripura.
Low: Less than 75% Assam, Kerala, Mizoram, Orrisa, Sikkim
Source: GoI1999 In terms of per capita availability in class I cities (Table 2) water shortages are found to
be acute in eastern region while the large states were able to meet 125 litres per capita
per day.
3

Table 2 Water availability in Class I Cities (1988)
Per Capita water availability
States
High: Over 160 lpcd
Delhi, Jammu & Kashmir, Maharashtra, Orissa, Uttar Pradesh, Chandigarh, Pondicherry.
Medium: Between 120-160 lpcd
Andhra Pradesh, Bihar, Gujarat, West Bengal
Low: Less than 120 lpcd
Haryana, Karnataka, Punjab, Rajashthan, Tamil Nadu, Kerala, Madhya Pradesh, Manipur, Tripura.
Source: Compiled from TARU (1999:7) and MIDS (1995:7)
The water supply status in Class I cities indicates that 37 per cent Class I cities
receive less than 100 litres of per capita water supply and 31 per cent between 100-145
lpcd. which is less than national than water consumption norms.
The per capita availability of water across the metros, varies from 76 lpcd in
Chennai to 307lpcd in Kanpur. The average population coverage is said on an average
to be 93 per cent with per capita supply pf 190 litres per capita per day. (Table 3)
4

Table 3
Status of Public Water Supply in Metropolitan Cities (1988) Name of the Metropolitan city
Population (in million)
Per capita water supply (lpcd)
Population coverage (in percentage0
Mumbai 10.33 207.8 99
Delhi 7.46 258.0 96
Calcutta 4.53 226.7 95
Chennai 3.88 75.8 85
Bangalore 3.82 113.9 100
Hyderabad 2.70 241.6 100
Ahmedabad 2.61 200.1 90
Kanpur 1.77 307.0 75
Nagpur 1.54 206.5 75
Pune 1.52 169.8 78
Jaipur 1.35. 155.5 80
Lukhnow 1.05 262.3 100
Total 42.63 189.4 93
Source: Central Pollution Control Board 1990
5

Public Expenditure on Urban Water Urban water supply is state subject; therefore, the financial responsibility for
maintaining capital assets and fixing and collecting water charges is the responsibility of
the local bodies. In most of the cases local bodies are found to be weak. Urban local
bodies receive revenue internally and externally. Internal sources include water tax,
drainage tax etc. and non-tax sources include water charges drainage charges etc. The
external sources include loans and grants from the state government and international
financial institutions.
There has been a significant increase in planned allocation in the country’s five-
year Plans over the years from Rs.0.43 billion in the First five-year Plan to Rs.117 billion
in the Ninth five-year Plan. However, the plan outlay for rural water supply has been
more than urban after the Fifth Five Plans. Public expenditure on urban water supply
and sanitation accounts for 1.2-1.8 per cent while the urban population has risen from
62.4 billion to 306.9 billion in 2001. It is proposed that the end of Ninth five-year Plan will
provide the entire urban population with a planned expenditure of 263billion with States
contributing 56 per cent and the Centre and Municipalities contributing 34 and 10 per
cent respectively.
6

Table 4
Plan Outlays on Water Supply and Sanitation in India (current prices)
Plan Period Plan Outlays (Rs in millions)
RWSS Percentage public sector outlay
UWSS Percentage public sector
outlay
Total Amount
1951-56 (1st plan) 60 0.18 430 1.28 490
1956-61 (2nd plan) 280 0.42 440 0.65 720
1961-66 (3rd plan) 163.3 0.19 893.7 1.04 1057
Three Annual Plans (1966-69)
NA NA NA NA 1064.2
1969-74 (4th plan) 1550 0.98 2820 1.77 4370
1974-79 (5th plan) 4812.4 1.22 5494.4 1.40 10,306.8
Annual 2322.2 1.85 1979.3 1.58 4302.2
1980-85 (6th plan) 22803.2 2.34 17,666.8 1.81 40,470
1985-90 (7th plan) 35556.7 1.98 29,657.5 1.65 65,224.7
2 Annual Plans(1990-92)
27059.2 1.97 17,213.7 1.26 4,42,72.9
1992-97 (8th plan) 107287.9 2.47 59,822.8 1.38 16,71110.3
1997-2001 (9th plan)
209140.00 2.43 186240.00 2.16 39,5380.00
Source: GOI, 1999:67 and for the Ninth Plan (World Bank, 1999)
7

Water pricing structures
Water pricing is important for water demand management to achieve efficient
and sustainable use of water. The basic rule of efficient pricing states that the price
should be equal to marginal cost. If price is set below the marginal cost, society would
consume more of water than otherwise it would be. Marginal value reflects the
economic value of water but it is difficult to implement it. Difficulties in implementing
arise because it is difficult to define and estimate marginal cost in quantitative terms
needed to determine appropriate user charges.
Marginal cost is also disadvantageous because it tends to neglect equity issue.
In periods of shortage or scarcity, if prices increase to the necessary level, lower income
groups may be negatively affected. At a more practical level, marginal cost is difficult to
implement because it requires volumetric monitoring which is very costly and difficult to
administer. Also marginal cost pricing concept is frequently poorly understood by those
involved in policymaking and administration (United Nations1980).
Water pricing by itself is a complex issue because water cannot be treated as
economic good. Moreover, the urban water supply is state subject. The provision and its
management and systems of pricing including price structures vary across the States.
At one level, price structure distinguishes between metered systems from non-metered
supplies as also from bulk provision from non-bulk provision. Price discrimination has
been the common feature of water pricing structure to tailor the objectives of efficiency
and equity. Cross subsidy is the feature of price discrimination. For instance, domestic
users are charged less than non-domestic users.
Several types of water tariffs are used in water sector:
(a) Increasing block tariffs: An alternative to marginal cost is increasing block tariffs
(IBTs). An IBT is based on volumetric component. In this price structure, water use per
billing is divided into a number of discrete blocks for which separate prices can be set. A
water user in particular category , such as domestic water consumption, is charged a
relatively low pre unit price for consumption up to a specified amount. This amount
8

defines the end of the initial or first block. A user who consumes more water faces a
higher per unit price for this additional consumption until reaching the end of the second
block, and then a still higher price until reaching the end of the top block structure.(
Boland and Whittington,2000)
Increasing block tariffs are popular tariff structure in many developing countries.
In a survey of urban water utilities in Asia, the Asian Development Bank (1993) found
that the majority of utilities in their sample (20 out of 32) used an IBT price structure.
Many experts have shown their preference to IBTs because it contributes to equity,
easy to recover the cost and it conserves the water resource. However, an incorrect
structure of the IBTs leads to several shortcomings as by argued by Boland and
Whittington, such as difficulties to set the initial block, mismatch between prices and
marginal costs, conflict between revenue sufficiency and economic efficiency, absence
of simplicity, transparency and implementation etc. Strictly speaking, there are no
efficiency arguments for increasing block tariff structure and the evidences in favour of
the pricing structure has psychological effect helping water demand management is
ambiguous: OECD (1987) reports evidence in favour of this argument in Japan, Italy
and Denmark and Switzerland while other studies (e.g. the metering trials in the
Thames and Yorkshire water authorities in the U.K.) prove inconclusive.
Water utilities in Bangalore, Delhi and Hyderabad use block tariff for
domestic and non - domestic supplies in combination with other price structures.
Bangalore uses five water blocks, with each block of 25 kls; the price per unit in the fifth
block is set 9.4 times the price in the first block. In Delhi, there are four blocks of 10 kls
each, with the unit price in the terminal block being 8.6 times that in the initial block.
Hyderabad uses four blocks of unequal sizes, and the price per unit of water in the
fourth block is set 3.7 times higher than the price in the first block. (Table 5)
9
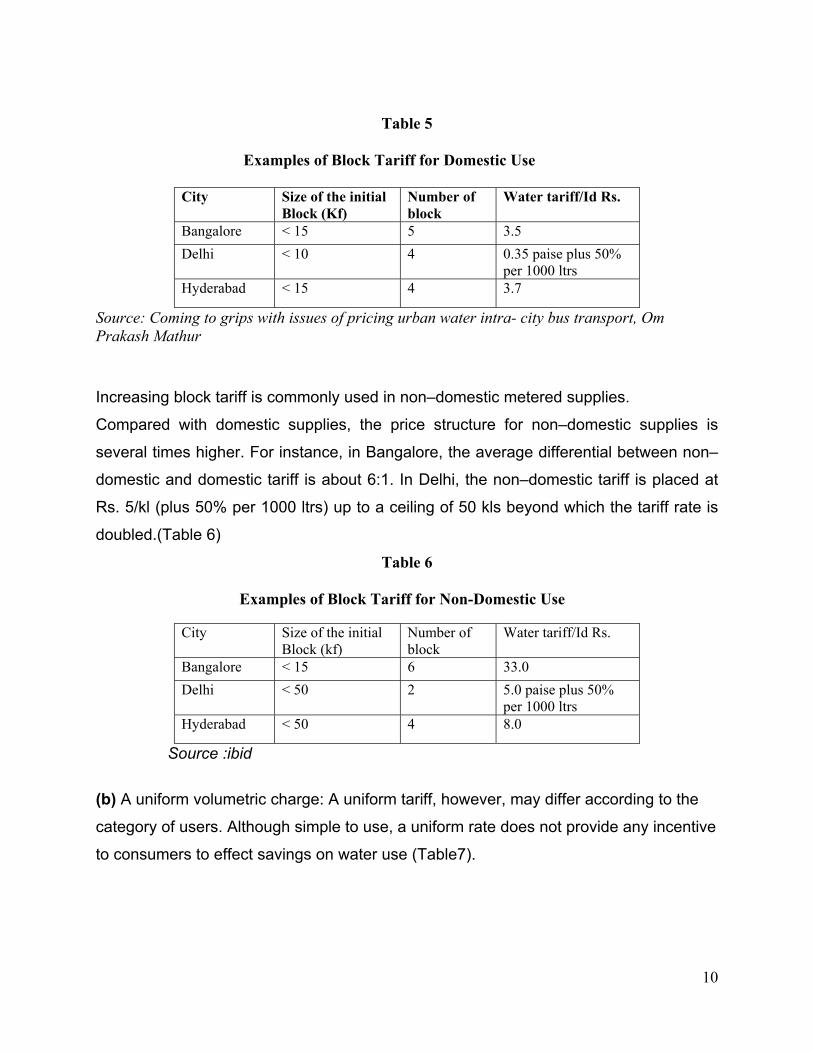
Table 5
Examples of Block Tariff for Domestic Use
City Size of the initial Block (Kf)
Number of block
Water tariff/Id Rs.
Bangalore < 15 5 3.5 Delhi < 10 4 0.35 paise plus 50%
per 1000 ltrs Hyderabad < 15 4 3.7
Source: Coming to grips with issues of pricing urban water intra- city bus transport, Om Prakash Mathur
Increasing block tariff is commonly used in non–domestic metered supplies.
Compared with domestic supplies, the price structure for non–domestic supplies is
several times higher. For instance, in Bangalore, the average differential between non–
domestic and domestic tariff is about 6:1. In Delhi, the non–domestic tariff is placed at
Rs. 5/kl (plus 50% per 1000 ltrs) up to a ceiling of 50 kls beyond which the tariff rate is
doubled.(Table 6)
Table 6 Examples of Block Tariff for Non-Domestic Use
City Size of the initial Block (kf)
Number of block
Water tariff/Id Rs.
Bangalore < 15 6 33.0 Delhi < 50 2 5.0 paise plus 50%
per 1000 ltrs Hyderabad < 50 4 8.0
Source :ibid
(b) A uniform volumetric charge: A uniform tariff, however, may differ according to the
category of users. Although simple to use, a uniform rate does not provide any incentive
to consumers to effect savings on water use (Table7).
10

Table 7 Examples of Single Tariff Rate
Uniform Tariff (Rs / kl) City
Domestic Industry Kanpur 2.0 10.0 Indore 2.0 22.0
Surat 2.0 8.0
Madurai 5.0 20.0
Source :ibid
(c) A linear water charge,: A linear water charge rises with consumption. It prevails in
Kerala where a monthly water charge is specified for discrete quantities of water. Thus,
a consumer in Kerala is required to pay a monthly charge of Rs. 22 for a consumption
not exceeding 10 kls; the charge increases to Rs. 25 for a consumption level of 11 kls,
and rises to Rs. 550 for a consumption of 100 kls/month.(Table 8)
Table 8
Examples of Increasing water charge, Kerala
Kl Consumption / Month Charge including meter inspection charge (Rs)
10 22 11 25
12 28
13 31
25 57
50 182
100 5
Source :ibid
11

These examples demonstrate the complex nature of water price structures that exists in
India. It has been found that where the water charges are levied by the Municipal
Corporation, little change having been made in their format and structure. On the other
hand, where the statutory board has been set up for the provision of water, attempts
have been made by the 1991–2000; The Bangalore Water Supply and Sewerage Board
is endowed boards to simplify the pricing structures and periodically adjust them in line
with costs. For instance, in Bangalore, tariffs have been revised six times between with
powers to adjust the tariff if it is warranted on account of an increase in power tariff
rates; increase in establish costs, maintenance costs, however, the approval of the
government is essential. The Chennai Metropolitan Water Supply and Sewerage Board
has also taken steps to simplify the tariff system. Municipal corporations like the
Mumbai Corporation has also adjusted the tariff structure in order to meet the rising cost
of water provision, although it has retained the irrational complex pricing structure. In
fact, water is good source of revenue, next to octrio, hence, all proposals to create a
water board have been rejected by the Mumbai Municipal Corporation.
The Status of Revenue Receipts and Revenue Expenditure
It is found that prices charged for urban water utilities do not cover the costs incurred on
its provision. A recent country–wide study conducted by the National Institute of Urban
Affairs on Urban Water Supply and Sanitation showed that
(a) the costs of water provision were in excess of recoveries in nearly 76% of cities and
towns, and
(b) in the aggregate, the operation and maintenance costs of water supply systems,
were approximately 22% higher than the receipts from water charges and water tax
levied in lieu of water charges. The deficits i.e., costs in excess of revenue receipts, are
estimated at Rs. 524/Mld;. The same study showed that the annual deficits on account
of water (average annual per capita expenditure minus average annual per capita
revenue) were Rs. 20 per capita in metropolitan cities, Rs. 40 per capita in cities in the
12

population range of 100,000 and one million, and Rs. 30 per capita in towns which have
a population of over 50,000 but less than 100,000 persons. The survey has shown that
the annual losses on operation and maintenance of the urban water supply systems
would be anywhere between Rs. 9,000–Rs. 10,000 million. Inadequate cost recovery
and losses on revenue account are a common feature with urban water utilities.
The Banglore Board could cover 95% of the total revenue expenditure resulting
the deficit of 5% in 1998-99. Since the setting up of Water Supply and Sewerage Board,
the deficit on revenue account has sharply declined.
The water rates in Delhi are among cheapest in the country. As a consequence,
the losses of Delhi Jal Board are enormous. In the year 1999-00, the deficit was 46.8%
of the total revenue receipts. No increase in tariff was sanctioned from 1989-90 till
1996-97. The Delhi Water Board was constituted on 2nd April 1998. The Board did
increase most user charges except for those whose consumption remains below 10
cu m per month. The tariff structure in Delhi has negative consequence for non-metered
households that are mostly located in low-income groups. The rate is fixed on monthly
basis at Rs.20 per month whether the consumption is low or high. The same household
if it had the meter would be paying 3.5 for consumption of 10 cu m. Similarly the
Hyderabad Water Supply and Sewerage Board has been incurring losses, which, in
1997/98, amounted to about 28.5% of the receipts.
The Chennai Metropolitan Water and Sewerage Board (CMWSSB), levies water
tax and a sewerage tax, could cover its operational expenses with a surplus of 25.5
crores in 1999-00, In 1999-00, the Mumbai Municipal Corporation generated a surplus
of 40% over revenue expenditure.
13

Table 9
Revenue Receipts and Revenue Expenditure of Urban Water Utilities
City Year RR RE deficit % surplus %
Banglore
1998-99 1936.3 2035.9 5.1 -
Chennai
1999-00@ 2070.1 1818.1
- 12.2
Delhi
1999-00 2162.7 3175.8 46.8 -
Hyderabad
1997-98 1062.3 1365.5 28.5 -
Mumbai
1999-2000#
9712.1 5820.8 - 40
Note: RR- Revenue Receipts RE- Revenue Expenditure @ Inclusive of debt service # Inclusive of capital expenditure
In Mumbai, consumers have to pay water and sewerage charges when meter is
connected, water and sewerage tax when metered is not connected and water and
sewerage benefit tax. Water tax is unrelated to water consumption. Water and
sewerage tax is calculated as a percentage of the rateable value of the building for
unmetered consumers. The water and sewerage benefit tax is also based on the
rateable value of the building and has to be paid by all consumers. Both these taxes
have been regularly increased since 1987.
Table10
Water Tariff in Mumbai Connection Nature of Use Tariff (Rs per thousand
litres) Metered: Domestic Slums/Chawls 2.25
High rise buildings 3.50
Commercial/Industrial 10.50 - 38
Unmetered: Domestic 65% of the ratable value Commercial/Indust
rial 130% of the value ratable
value Source: Municipal Corporation of Greater Mumbai 2002
14

The Mumbai Municipal Corporation has been able to generate surplus partly on
water account periodic tariff adjustments. Since 1987, the tariff rates for the domestic
(non–slum) sector have been raised more than times from 0.30 paise per cubic meter to
Rs. 3.50 per cubic meter in 2002, and for non-domestic sector from Rs. 4.50 to Rs.
10.50 to Rs.38 per cubic meter in the year 2002.
In Calcutta, there are no water charges (neither volumetric charges as
connections are unmetered and neither charges related to an estimated consumption).
Calcutta Municipal Corporation (CMC) is mostly collecting revenue from allocation from
the property tax rather than direct charges for service. It is due to allocate 30% of the
property tax to water as well as sewerage and drainage. This is in practice subject to
realisation of property tax. In recent years the CMC could allocate 9 to 15% for water
and 7 to 10% for sewerage and drainage. The remaining amount is given by the State
government for reaching the 30% figure. The problem related to the property tax is that
it generates low rate of collection (50% in Calcutta) and the non-reassessment on
regular basis of the property value. Therefore, in Calcutta the charges for water are, at
least for domestic consumers, far from recovering the costs. Water and sewerage tax is
calculated as a percentage of the rateable value of the building for unmetered
consumer. The water and sewerage benefit tax is also based on the rateable value of
the building and has to be paid by all consumers. Both these taxes have been regularly
increased since 1987.
An important aspect of the finances of water utilities relates to their cost
structure. Cost structures of water utilities are often difficult to determine on account of
the problems of allocating costs to specific services. In Delhi power charges, which are
used for pumping water, account for nearly 50% of the total cost incurred in water
production and delivery. Wages and salary, which are known as the establishment
costs, constitute 35.5% of the costs. In Bangalore, power costs constitute 60% of the
operating cost.
A rational water tariff structure calls for graded water rates, which means
charging higher rates for higher consumption. This necessitates that all consumers
15
should be supplied water through meter only. It has been the common feature of most
of the cities that meters are non-functioning where the water is supplied through meter
connection. For instance, in Mumbai there are 220744-metered connection of which
178350,about 81%, were reported to be non–functional. Besides because of intermittent
supply of water, complaints are often received that meter show erratic reading.
Issues in urban water pricing
Since water is essential to human life, water pricing becomes the sensitive issue
in a developing country like India. The common perception of people is that any thing
that is essential to human life has to be to be supplied by the government at a
subsidised rate. As result, the political parties generally oppose any small increase in
water price by a local body. The political aspect plays detrimental role in water pricing.
The prices, therefore, are charged less than the long run marginal cost of the water. The
institutions responsible for providing these services do not receive adequate revenue to
improve and expand the facilities. Second: subsidised pricing also leads to over
consumption of water. The existing pricing structure is, therefore, unsustainable and
lacks incentives. It calls for reforms that are essential and urgent. While bringing about
water pricing reforms, following factors need attention:
Cost Calculation
Tariff is designed to recover costs incurred on supplying water, In an exercise of
price fixation, the first step would be the estimation of cost. According to the procedure
laid down for the calculation of cost of water, only the expenditure that are actually
incurred are taken into the consideration and then according to the inflation rate prices
are adjusted. This historical or backward looking basis for the costing service is at
variance with the average incremental cost approach I.e. one with forward looking
approach. This approach of backward looking basis for the costing of service is not
conductive for promoting financial discipline in a public service organisation.
Moreover, where water charges are based on property tax, the non- revaluation
of properties and the effects on rent control act have caused problems in generating
16

sufficient revenue to the authority. The reforms, therefore, are needed to bring about
changes in property tax and rent control act.
Cost Controls
The areas where the reforms are needed include staffing norms, water leakages
and execution completion of capital works. Overstaffing increases operational and
maintenance cost. For instance, in the case of Mumbai, for every 1000 water supply
connections,35 persons are employed while for the same number of connections the
number of employees is one for Singapore. (Asian Development Bank, 2nd Water
Utilities Book)
It is commonly observed that execution of capital works in the water supply
sector often get delayed resulting huge cost escalation. As regards the water leakages,
its share is generally reported to be about 25% to 30% of the total water supply. Since
the water saved is revenue earned, emphasis needs to be given for setting up of leak
detection cells.
Revenue Raising
Most of the water supply agencies in the country classify water demands into
domestic and non-domestic category. Municipal Corporation is required to meet the
former as obligatory responsibility while latter as discretionary function. Beyond this
classification, the legislations do not provide further guidance as to which uses come
under domestic category and which come under non-domestic category. Such details
are necessary for fixation of tariff rates and differentiation therein. The differentiation in
the rates would, in turn, be needed to achieve revenue targets while promoting at same
time the efficiency and equity objectives of the service provision.
Cross subsidies
The revenue base of water utilities is grossly unbalanced in that the non-
domestic sector, which uses hardly 25% of the water, contributes 60% to 70% of the
total revenue. Industrial establishments pay five and ten times more In Channai and
Mumbai than domestic consumers, In Chennai, the commercial sector uses only 16% of
17

the water but contributes 40% of the total revenue. On the other hand, domestic sector
uses 69% of the water but contributes 40% of the income. Similarly, in Mumbai non-
domestic sector uses only 20% of the water but contributes 80% of the total revenue.
Cross-subsidisation is generally justified on the grounds of equity and financial
sufficiency. However, it involves certain adverse consequences such as non-domestic
uses pass on this higher tariff burden to the domestic consumers by raising the prices
and lower tariff to the domestic users gives rise to the wastage of water. Hence water
utilities must rationalise price structure, that is, higher price for the domestic sector and
lower price to the non-domestic sector.
Narrow tariff base
Water paying households constitute very small proportion of the total urban
households. Using proxies such as the number of connections and adjusting them to
account for the multiple use of single connections would place the proportion of tariff
paying households at anywhere between 30–40% of the total number of urban
households. The balance would account for those households who are supplied free
water through standposts and those who have acquired illegal water connections. The
narrow tariff base is perhaps the most disconcerting aspect of the urban water supply
systems.
Conclusion
The 74 Constitutional Amendment Act has specified a clear functional role of the
third tier system in the provision of water supply and sanitation. The State governments
are likely to entrust the responsibility of operations and maintenance of urban water
supply and sanitation to local bodies. Looking at finances of various Municipal
Corporations, plan outlay for the urban water supply and sanitation sector and their
pricing structure, local bodies could financially survive only by initiating reforms in water
sector. There are a number of gray areas that need attention and reforms in water
sector that could bring down the cost of water supply. However, one could start with
initiating reforms in water pricing, though politically a difficult proposition, to generate
revenue for augmentation of water supply and for effective demand management policy.
18

References:
ADB (1997): Second Water Utilities data book Asian and Pacific region, edited by
McIntosh A.C. Yniguez C.E, ADB.
Boland J. and Whittington D. (2000): “ The political economy of water tariff in
developing countries: Increasing block tariffs versus uniform price with rebate. In
Political Economy of Water Pricing Reforms” Ed. Ariel Dinar, Oxford University
Press. Oxford.
Central Pollution Control Board (1990): “Status of Water Supply and Waste
Water Collection, Treatment and Disposal in Class Cities-1988”, CPCB, New
Delhi.
Government of India (1999): “National Commission for Integrated Water
Resources Development Plan”, Report of the Working Group on Water
Management for Domestic, Industrial and other Uses. Ministry of Water
Resources, New Delhi. September.
MIDS (1995): “Water allocation and management in the Chennai metropolitan
area”, by Paul Appasamy et al,63p, Chennai Institute of Development Studies.
Ministry of Urban Affairs and Employment, (1996): “Report of the Working Group
on Urban Water Supply and Sanitation sector for the Ninth Five year Plan (1997–
2002. New Delhi)”. New Delhi.
Municipal Corporation Greater Mumbai (2001): Water charges rules, MCGM.
19
Reut Joel, V.S.Saravanan, Marie-Helene Zerah (2002): “The water sanitation
scenario in Indian metropolitan cities: Resources and Management In Delhi,
Calcutta, Chennai and Mumbai”, Occasional Papers, CSH.
20

Dr. Vibhooti Shukla Unit in Urban Economics & Regional Development
WORKING PAPER SERIES
NO. TITLE AUTHOR(S) 1 From Governments To Markets: Funding Urban
Infrastructure Dr. Abhay Pethe Ms. Manju Ghodke
2 Towards Bank Financing of Urban Infrastructure Dr. Abhay Pethe Ms. Manju Ghodke
3 Developing A Quantitative Framework For Determining Devolution Of Funds From The State Government To Local Bodies
Dr. Ajit Karnik Dr. Abhay Pethe
Mr. Dilip Karmarkar
4 On Developing Macro-Diagnostics For Evaluating The Fiscal Health Of The Indian States: The Case Of Madhya Pradesh
Dr. Abhay Pethe Dr. Mala Lalvani
5 Assessment of Revenue And Expenditure Patterns In Urban Local Bodies Of Maharashtra
Dr. Ajit Karnik Dr. Abhay Pethe Mr. Dilip Karmarkar
6 Capital Account Convertibility, The Unfinished Agenda: MARK I
Dr. Abhay Pethe Dr. Balwant Singh Mr. Shripad Wagale
7 On Urban Infrastructure Development Dr. Abhay Pethe
8 A FAIR PLAN Approach For Devolution Under The Twelfth Central Finance Commission: Some Suggestions
Dr. Abhay Pethe Dr. Mala Lalvani
21

NO. TITLE AUTHOR(S)
9
Designing A Best Response With A Human Face In The Context Of Paradigm Shift In Macroeconomic Management: A Case For Civil Society Intervention
Dr. Abhay Pethe
10 Infrastructure Finance In The Time Of Revenue Crunch: Exploring New Avenues for Urban Local Bodies
Dr. Abhay Pethe Dr. Ajit Karnik
11 Review of The Electricity Act 2003 Mr. Anay S. Vete
12 Is Maharashtra lagging behind in Total Factor Productivity? An Analysis for 1981-1998
Mr. Anay Vete Mr. Bassam Abu Karaki Dr. Neeraj Hatekar
22