Embed Size (px)
Citation preview

HAL Id: tel-02003628https://tel.archives-ouvertes.fr/tel-02003628
Submitted on 1 Feb 2019
HAL is a multi-disciplinary open accessarchive for the deposit and dissemination of sci-entific research documents, whether they are pub-lished or not. The documents may come fromteaching and research institutions in France orabroad, or from public or private research centers.
L’archive ouverte pluridisciplinaire HAL, estdestinée au dépôt et à la diffusion de documentsscientifiques de niveau recherche, publiés ou non,émanant des établissements d’enseignement et derecherche français ou étrangers, des laboratoirespublics ou privés.
Enhanced adhesives for the encapsulation of flexibleorganic photovoltaic modules
Patrick Mark Boldrighini
To cite this version:Patrick Mark Boldrighini. Enhanced adhesives for the encapsulation of flexible organic photo-voltaic modules. Other. Université Blaise Pascal - Clermont-Ferrand II, 2015. English. �NNT :2015CLF22586�. �tel-02003628�
UNIVERSITE BLAISE PASCAL
U.F.R. Sciences et Technologies
ÉCOLE DOCTORALE DES SCIENCES FONDAMENTALES
THESE
présentée pour obtenir le grade de
DOCTEUR D’UNIVERSITE
Spécialité : Chimie-Physique
Par :
BOLDRIGHINI, Patrick Mark
Enhanced adhesives for the encapsulation
of flexible organic photovoltaic modules
Soutenue le 30 Juin, 2015 devant la commission d’examen :
Rapporteurs :
Lionel FLANDIN Professeur des Universités Université Savoie Mont Blanc
Bernard RATIER Professeur des Universités Université de Limoges, XLIM
Membres du jury :
Philipe BOUTINAUD Professeur des Universités ENSCCF
Stéphane CROS Ingénieur-Chercheur CEA-LITEN
Jean-Luc GARDETTE Professeur des Universités Université Blaise Pascal
Manuel HIDALGO Ingénieur-Chercheur Arkema Group
Sandrine THERIAS Directrice de Recherche CNRS, ICCF
DOCUMENT CONFIDENTIEL

1

2
Thesis of Patrick Boldrighini
Enhanced adhesives for
encapsulation of flexible organic
photovoltaic modules
DOCUMENT CONFIDENTIEL

3

4
Remerciements
It has truly been a unique experience, unlike anything I had ever done, to come to France
and work towards my PhD. I have had such an amazing experience both in and out of the lab
while getting to immerse myself in the wonderful French culture. I was also fortunate enough
to work in two excellent labs with two excellent groups of people. It is thanks to all of the
incredible people I met here that I was able to complete this thesis and create so many great
memories.
I first need to thank Stéphane Cros for being my advisor and guiding me through all of
the trials and tribulations I faced in and out of the lab. Likewise, Manuel Hidalgo was
instrumental with his wealth of expertise and great discussions of the NFL. My great advisors
in Clermont-Ferrand, Jean-Luc Gardette and Sandrine Thérias, were invaluable with their
encouraging advice and taught me so much about photo-chemistry.
I owe a special thanks to one of my best friends, Dr. Balthazar LeZinzin for telling me
about a new project they were working on at INES and helping me to acclimate to a new culture.
Go Caps!
Though I spent far less time there than I could have, all the amazing people in Clermont-
Ferrand made it my home-away-from-home. I was taken aback by how willing Agnes, Pierre-
Olivier and Claire were to help me with great discussions. Above all, the amazing welcome my
colleagues gave to a random guy from another lab who spoke weird French was beyond all
expectation and really made me feel like a part of the group. Thank you so much Isa, Jenia,
Anthony (both of you!), Gigi, Alexis, Camille, Ahmedou, Claire and Romain.
Another special thanks to the interns who worked so well despite having the misfortune
of dealing with my confusing guidance and protocols written in shorthand English. Diane,
Charlotte and Léo: you were great!
At INES, I have so many people to thank who have made such a big impact on me both
in and out of the lab. I was lucky to work under great supervisors like Solenn, Rémi and
Stéphane G. who supported my work and gave me freedom to pursue my project. Thank you
Matthieu for putting up with me as a neighbor in the office and at home! Muriel, thanks for
listening to all my crazy ideas and helping so much with so many different things! Thank you
also to Noella and Nathalie for all your help. From making me cells to helping fix my broken

5
equipment and so much more, I owe a huge thank you to Florance, Pascal, Caroline, Nathalie
and Marion!
L’équipe barrière was the best team to be a part of. Arnaud thanks for being a great
friend and Allez Metz! Fab, bravo for keep the lab lively with your songs, and along with
Clément S., providing plenty of laughter. Aurélie, thanks for being an awesome friend and
colleague throughout all your different labs.
My fellow doctoral students were always there to share in both the good times and the
pain of writing a thesis. Mélodie, Guillaume, Bruno and Clément, thanks for all the awesome
fun times keeping the lab lively with your smiles and pranks! The new guys too, Sacha and
Lukas, you were always there to hang out and keep me sane.
All of the great people who have come through the LMPO over the years all helped me
immensely both with my work and after work. Mathieu S. you were a great roommate when I
arrived and always kept things chill. Boris and Gaëlle were some of the coolest people I’ve ever
worked with. It was an absolute pleasure to work with wonderful people like Celine and
Mathilde. My buddies from Disa, Gabriel and Julien, it was awesome to have cool colleagues
to share the lab with! And even those students who didn’t get to spend too long at INES, you
were all really cool and kept work fun! Thanks Mikel, Lucille, Anaïs, Maéva and Sophie.
Last but not least, I had so much help from other labs. I want to thank everyone in LMPV
for being such awesome neighbors and labmates! In particular I want to thank Marion and Julien
for not only always being open for discussions and letting me use your equipment, but also for
being my friends. Dominique thanks for putting up with me always speaking English when I
was meeting with you and Manuel. I also want to thank my CEA colleagues from DTNM, and
in particular Julia, for constantly bailing me out when my equipment was broken. Thank you
so much! A big thank you also to Arkema and Sartomer for helping me out so much with
materials and advice. Thank you Pierre G. and Catherine L. for taking time out of your
schedules to help a student like myself.
Thank you again to all of you and to anyone I may have missed. You made this difficult
task of earning a PhD not only possible, but fun! You were all so welcoming to me even in the
beginning when I didn’t speak French very well. I could not have done this without you. Thank
you for making this the best experience of my life!

6

7

1
Table of Contents
Introduction .............................................................................................................................. 5
Chapter 1: Background ........................................................................................................... 9
Introduction ............................................................................................................................ 9
Organic Photovoltaic Technologies ........................................................................................ 9
How OPV Devices Function ..................................................................................... 9
Degradation Mechanisms ........................................................................................ 13
Similar Technologies ............................................................................................... 17
Permeation Mechanisms and Encapsulation Materials ........................................................ 21
Permeation Mechanisms in Materials .................................................................... 21
Encapsulation Processes .......................................................................................... 32
Adhesives ................................................................................................................... 38
Permeation Measurement ..................................................................................................... 48
Chapter 2: Experimental Procedures and Testing .............................................................. 57
Raw Materials ....................................................................................................................... 57
Barrier Films ............................................................................................................. 57
Adhesives ................................................................................................................... 58
Nanoparticles ............................................................................................................. 61
Materials Preparation ............................................................................................................ 63
MAM Pressure Sensitive Adhesives ...................................................................... 63
UV Curing Acrylates ................................................................................................ 64
Corona Treatment ..................................................................................................... 66
Coating ....................................................................................................................... 67
Lamination and Encapsulation Methods ............................................................... 68
Aging Conditions .................................................................................................................. 70
Accelerated Moisture ............................................................................................... 71
Accelerated Photo-Aging ........................................................................................ 71
Experimental Techniques ..................................................................................................... 72
Spectroscopic Techniques ....................................................................................... 72
Thermo-mechanical Testing .................................................................................... 73
Microscopy ................................................................................................................ 75
Other Testing ............................................................................................................. 76

2
Chapter 3: Development and Optimization of the Optical Calcium Test ......................... 81
Introduction .......................................................................................................................... 81
Sample Geometry ................................................................................................................. 82
Advantages of Modified Sample Geometry .......................................................... 82
Limitations of Modified Sample Geometry .......................................................... 83
Modeling and Analysis ......................................................................................................... 84
Image Analysis .......................................................................................................... 85
Orthogonal Permeation ............................................................................................ 86
Lateral Permeation Measurement ........................................................................... 91
Interfacial Permeation .............................................................................................. 93
Identification of Permeation Pathways Using Reference Materials ..................................... 94
Design of Experiment .............................................................................................. 94
Orthogonal vs. Lateral Permeation ......................................................................... 95
Influence of Adhesive Thickness ........................................................................... 96
Influence of Surface Treatment .............................................................................. 97
Conclusions ............................................................................................................. 100
Chapter 4: Adhesive Characterization ............................................................................... 103
Introduction ........................................................................................................................ 103
MAM PSAs ........................................................................................................................ 104
Structure of MAM Block Co-Polymers ............................................................... 104
Thermo-Mechanical and Optical Properties ....................................................... 106
Permeation ............................................................................................................... 111
UV Cure Acrylates ............................................................................................................. 113
Formulation of the Adhesives ............................................................................... 113
Comparison of Thermo-Mechanical and Optical Properties ............................ 119
Permeation ............................................................................................................... 122
Comparison of Adhesive Chemistries ................................................................................ 124
Conclusions ........................................................................................................................ 129
Chapter 5: Nanocomposites ................................................................................................. 131
Introduction ........................................................................................................................ 131
Overview of Particles ......................................................................................................... 131
Phyllosilicates ......................................................................................................... 131
Zeolites ..................................................................................................................... 132
Comparison of Properties: Neat vs. Phyllosilicate vs. Zeolite ........................................... 136
Thermo-mechanical and Optical Properties ........................................................ 137
3
Permeation ............................................................................................................... 140
Conclusions ........................................................................................................................ 145
Chapter 6: Encapsulation of Organic Photovoltaic Cells ................................................. 147
Introduction ........................................................................................................................ 147
Encapsulation Processes ..................................................................................................... 148
Accelerated Humidity Testing ............................................................................................ 149
Reference PSA ........................................................................................................ 149
Comparison of Different Adhesives..................................................................... 151
UV Curing Nanocomposites ................................................................................. 154
Conclusions ........................................................................................................................ 157
Chapter 7: Photostability ..................................................................................................... 159
Introduction ........................................................................................................................ 159
MAM PSAs ........................................................................................................................ 159
Degradation Kinetics: Photo-oxidation and Photolysis ..................................... 159
Effect of Nanoparticles .......................................................................................... 164
Changes to Properties ............................................................................................. 167
UV Curing Acrylates .......................................................................................................... 170
Degradation Kinetics: Photo-oxidation and Photolysis ..................................... 170
Changes to Properties ............................................................................................. 172
Conclusions ........................................................................................................................ 174
Conclusions and Perspectives .............................................................................................. 177
References ............................................................................................................................. 184

4

5
Introduction
Renewable energy sources have become one of the most important initiatives facing
mankind today. Greenhouse gas emissions and geopolitical concerns have created a strong need
for the replacement of fossil fuels in energy production, with renewable sources being
particularly promising. The abundant energy produced by the sun is an especially interesting
solution to this problem since capturing only a small portion of the sunlight which reaches Earth
could easily meet global energy demand as illustrated in Figure I.1.1 Accordingly, the amount
of solar photovoltaic capacity has risen rapidly in recent years from 3.7 GW globally in 2004
to 100 GW globally in 2012.2 This has corresponded well to the development of less expensive
photovoltaic panels which convert sunlight directly into electricity.2 However, the energy and
time intensive processes for the production of silicon based photovoltaics limit how inexpensive
these devices can become. To drastically decrease the cost of photovoltaic devices, new
technologies are needed.
Figure I.1 The total possible energy reserves for various sources are shown compared to the total global yearly energy
use from 2009 (orange circle). For non-renewable sources, the total recoverable reserves are shown. For renewable
sources, the maxium possible energy which could potentially be captured is shown.1

6
While many different photovoltaic technologies have been developed as competitors to
silicon-based systems, organic photovoltaic (OPV) devices represent a particularly interesting
alternative. These devices use organic molecules and polymers as the semi-conducting light
absorber material in place of silicon. These devices tend to operate best when the active layer
materials are on the order of hundreds of nanometers in thickness. This, combined with the
ability of organic materials to be solubilized in solvents, allows for devices to be printed at
relatively low temperatures using evaporative deposition techniques or solvent-based inks.3 The
thin, non-brittle nature of these active layer materials also allows for devices to be flexible. This
flexibility enables the use of low-cost production techniques, such as roll-to-roll processing.3–5
Thin active layers also cause less material to be used. This combination of low-cost, low-
temperature processing and low material usage creates the potential for OPV devices to be much
less expensive and with much shorter energy payback times than their silicon-based
counterparts.
OPV devices also have several other advantages which increase their utility. By printing
devices on flexible foils, the final devices are much thinner and light-weight than silicon
modules. Their flexible nature also allows for more creative deployment of the modules onto
both curved surfaces and other flexible materials. The ability to print devices also create the
possibility for unique custom shapes, further opening the new options for the deployment of the
modules. These attributes also combine to make OPV modules ideal for many smaller niche
applications such as chargers for devices or for incorporation into other devices such as smart
textiles. OPV technologies also often exhibit less loss of power conversion efficiency at sharp
angles of incidence and in low light conditions compared to silicon based modules.6 This
eliminates the need for expensive solar tracking mounts and makes OPV modules potentially
interesting for indoor applications where the illumination is not as intense.
OPV devices do have several drawbacks however. Traditionally, the largest obstacles
to large-scale implementation of OPV devices have been their relatively low power conversion
efficiencies (PCE)7 and short device lifetimes.8–10 The problem of low PCE has been the focus
of much research and lab scale cells have now surpassed 12% PCE.11 This has been achieved
primarily through development of better active layer materials and device architectures such as
tandem cells. While this PCE is still low compared to other solar technologies, it has become
sufficiently high for OPV devices to become commercially viable. Devices fabricated using
industrial scale methods are often not as efficient as those at the lab scale,3–5,12,13 but the large

7
number of companies currently in or preparing to shortly enter industrial scale production
indicates that this loss of PCE is not drastic enough to prevent their commercialization.11,14–23
The problem of short device lifetimes remains however. This problem stems from the
sensitivity of many OPV materials to light, oxygen, water, and combinations thereof. 8–10,24 As
a result, much research has been performed to develop more stable OPV materials and high
gas-barrier encapsulation materials. This has increased the achievable device lifetimes for OPV
devices, but much work remains to reach the level of long-term device stability seen for other
solar technologies.10 While flexible multi-layer barrier films can now often meet the oxygen
and water vapor transmission rate requirements needed to extend device lifetimes to several
years,25 less progress has been made in preventing gas permeation in the adhesives used to seal
devices between these films.26 This allows for lateral gas permeation, also known as side
ingress, to occur and degrade devices from the edges inward.
The goal of the work presented in this thesis is to better characterize and develop
materials to limit the problem of lateral permeation into OPV devices, thus prolonging their
device lifetimes. A new testing procedure is presented which aids in the characterization of
permeation in OPV devices. This test, a modified form of the optical calcium test, allows for
the comparison of multiple permeation pathways in encapsulation schemes, while also
providing a tool for the comparison of different encapsulation materials. This modified optical
calcium test, along with other established characterization techniques, is then used to develop
and evaluate enhanced adhesives with decreased later permeation rates. These enhancements
include modification of the adhesives’ formulation and the addition of nanoparticles. Relatively
impermeable passive nanoparticles are used to make adhesive nanocomposites as a method to
lengthen the permeation pathway by creation of a tortuous pathway. A novel approach using
active nanoparticles which bind permeating species is also investigated to create adhesive
nanocomposites. The enhanced adhesives are then used to encapsulate OPV cells and subjected
to accelerated aging to determine their relative impact on the device lifetimes of OPV devices.
Finally, the photostability of the enhanced adhesives is analyzed to ensure the adhesives will
continue to function as desired after exposure to light, which is of particular importance for
OPV encapsulation materials which can spend years exposed to intense sunlight.

8
9
Chapter 1: Background
Introduction
In this chapter a bibliographic study of the literature is presented in order to establish a
basis for further discussion and to provide an overview of the state of the art in the fields of
encapsulation of organic photovoltaic devices, adhesive composites and permeation
measurement. With these goals in mind, the principles of how organic photovoltaic devices
work are presented along with their primary degradation mechanisms. Next, an overview of
common encapsulation materials and how they are used to encapsulate devices is provided.
Included in this overview is a discussion of the gas permeation mechanisms associated with
each type of encapsulation material. Finally, testing techniques for measuring the low
permeability rates found in encapsulation materials is discussed.
Organic Photovoltaic Technologies
Organic photovoltaic devices (OPV), as previously discussed, are a very promising
technology to provide low cost electricity. Their use of organic semiconductors gives OPV
devices unique characteristics in comparison to other solar technologies. This section aims to
illuminate the principles of how these devices produce electricity from light along with how
this process can become hindered by the various degradation mechanisms present in the
devices. As one of the stated goals of this doctoral research is to improve the lifetime of OPV
devices, a current understanding of what limits the device lifetime is crucial.
How OPV Devices Function
Just as with other photovoltaic technologies, OPV devices absorb light which produces
an electron-hole pair that is then used to generate a current. Unlike other photovoltaic
technologies however, the absorber material in OPV devices is an organic molecule instead of
an inorganic semi-conductor. These molecules have a highly conjugated system of molecular
orbitals which allows for the creation of a band gap that corresponds well to the energy of
visible light.27 The energy levels of the highest occupied molecular orbital (HOMO) and lowest

10
unoccupied molecular orbital (LUMO), and thus the band gap, are determined by the chemistry
of the organic molecules. A large variety of absorber materials exist for OPV devices with
different band gaps, absorption spectra, π-π stacking, solubility and intrinsic stability.10,27,28
These materials also range in molecular weight from smaller non-repeating molecules to longer
chain polymers with examples shown in Figure 1.1. Since the ability of the absorber material
to generate electron-hole pairs is of fundamental importance to a device’s ability to generate a
photocurrent, much research continues into the development of new absorbers.27
Figure 1.1 The chemcial structures of (a) the small molecule absorber pentecene, (b) the polymeric absorber poly(3-
hexylthiopene), and (c) the acceptor phenyl C61 butyric acid methyl ester are shown as examples of commonly used OPV
active layer materials.
Along with the absorber material, the rest of the so called active layer of the OPV is
comprised of an electron acceptor material. This material aids in separating the charges of the
electron hole pair as its LUMO energy level is carefully selected to create a favorable condition
for the transfer of electrons from the absorber to the acceptor. While many different materials
are possible for use as an acceptor, the most common materials are based on fullerenes such as
the molecule seen in Figure 1.1c.10
Commonly, the absorber material is mixed with the acceptor material to form what is
known as a bulk heterojunction structure. Because the two materials are generally immiscible,
they phase separate to form micro-domains within the active layer. This greatly reduces the
distance between the absorber and acceptor at any given point in the active layer, which is
particularly advantageous for OPV as the length scales for geminate recombination are
relatively short (~10nm). The morphology of this layer is therefore critical to the overall
performance of the device as the domain sizes and distribution can greatly change the amount
of recombination which occurs within the active layer. 8,9

11
With the planar nature of most OPV architectures, the active layer is sandwiched
between a cathode and an anode to create a functioning photovoltaic cell. However, due to the
HOMO and LUMO levels of the active layer materials and the work functions (energy barrier
for transfer of electrons at a metallic surface) of the conductive electrode materials, it is often
advantageous to include intermediate layers as electron or hole transporters. These layers
facilitate the transport of charges from the active layer to the electrodes by providing an energy
level which is between that of the active layer and the electrode. These materials can also
improve the interfaces allowing for better transport of charges between layers.27 Electron
transport layers (ETL) usually consist of a metal oxide such as zinc oxide (ZnO) or titanium
oxide (TiO2, TiOx). Hole transport layers (HTL) are commonly made of poly{3,4-
ethylenedioxythiophene} blended with poly{styrene sulfonate} (PEDOT:PSS), though
inorganic materials such as molybdenum VI oxide (MoO3), tungsten VI oxide (WO3) and
vanadium V oxide (V2O5) can also be used.10,29,30
OPV electrodes consist of a transparent front electrode and a metallic back electrode.
As there are very few known quality transparent conductors, the majority of OPV devices to
date use indium tin oxide (ITO) for the transparent electrode. However, much research has been
done to develop alternatives to ITO because of its cost and processing difficulties. Metallic
grids and silver nanowires in conductive polymer matrices are two common ITO replacements
for the transparent electrode. The transparent electrode is typically coated onto a transparent
substrate such as glass or a polymer film.4,10,31,32 This electrode can be either the cathode or the
anode depending on the desired architecture of the cell. In a classical structure, the HTL is
coated on top of the transparent electrode followed by the active layer, ETL and back electrode.
In this architecture, the electronic properties of the cell necessitate the use of a low work
function electrode such as calcium or aluminum. In an inverted architecture the cathode and
anode are switched (and thus also the ETL and HTL).9,10,25 This results in the ability to use a
higher work function material with silver being by far the most common choice. A diagram
showing the differences in these two architectures can be seen in Figure 1.2.
12
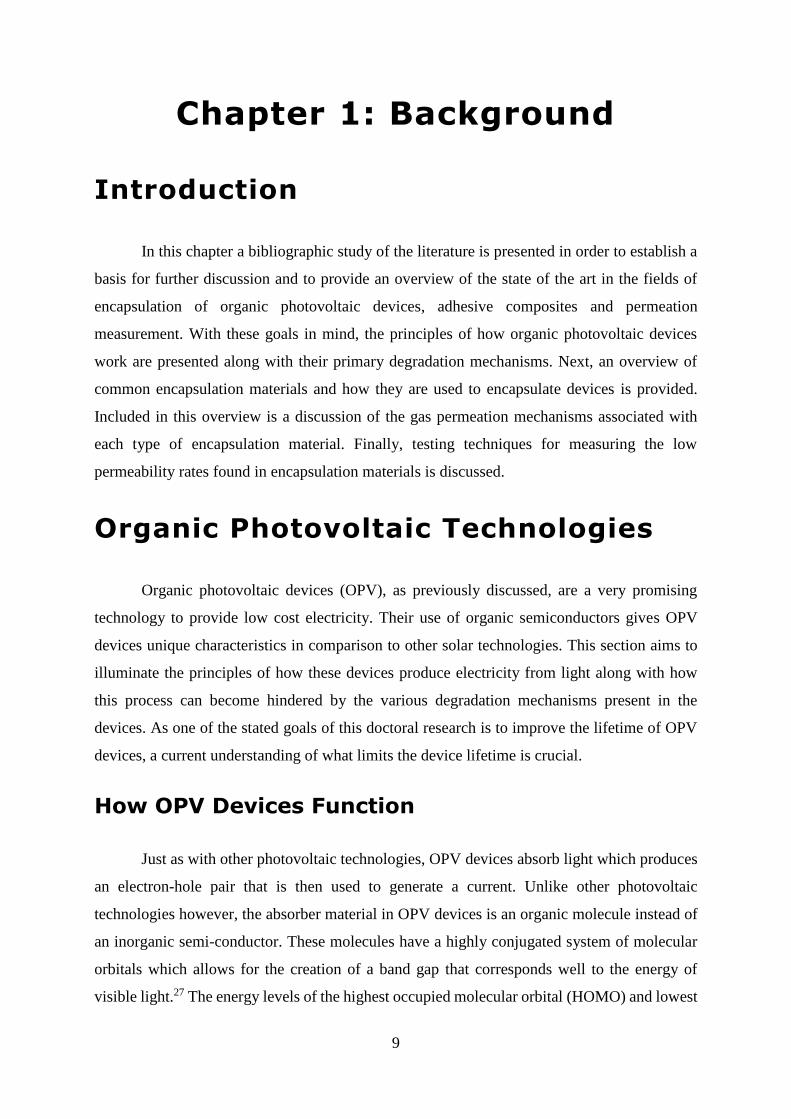
Figure 1.2 Diagrams of the structure of the (a) classical, or normal, and (b) inverted architectures for OPV are shown.9
One major drawback which has inhibited the widespread adoption of OPV
technologies are their relatively low power conversion efficiencies in comparison to other
solar technologies. In recent years the efficiencies of OPV devices have greatly improved
however, as can be seen in Figure 1.3.33 This increase in power conversion efficiencies to
over 10% has greatly improved the prospects for the commercialization of OPV technologies
as evidenced by a number of companies which are nearing industrial scale production of OPV
devices. 11,14–23

13
Figure 1.3 The record certified power conversion efficienies for lab-scale solr cells is shown with OPV techonoloies
represented by orange circles and triangles. This plot, reprodced here in modified form, is courtesy of the National
Renewable Energy Laboratory, Golen, CO, USA.33
Degradation Mechanisms
One of the major problems limiting the wide scale production and deployment of OPV
is their instability. The performance of OPV tends to degrade over time and does so quite
rapidly in comparison to most other solar technologies. This degradation comes from a
combination of different mechanisms at different levels within the device. In fact, there are
degradation mechanisms present at almost every material and interface within an OPV device,
as can be seen in Figure 1.4.8–10,24,28 Limiting degradation and therefore extending device
lifetimes is critical to the adoption of OPV on an industrial scale. In order to develop methods
to prevent the loss of performance in OPV, it is necessary to understand its root causes.
14
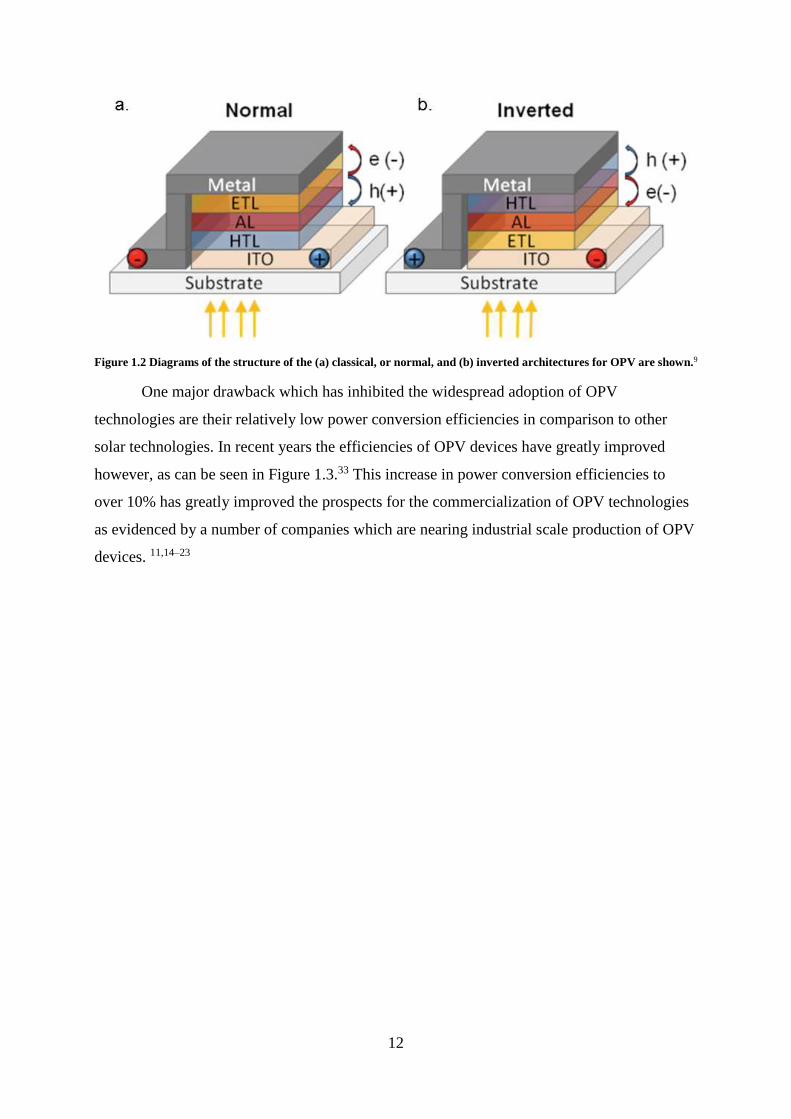
Figure 1.4 Several different possible degradation pathways for OPV are shown in these cross-sectional diagrams of a
typical bulk-heterojunction OPV with (a) a classical structure and (b) an inverted structure. In these images “Polymer”
refers to a polymeric active layer absorber material, “PCBM” is a fullerene based electron acceptor material and P3HT
is the active layer absorber material poly(3-hexylthiophene).8,10
Starting at the active layer, several different degradation pathways exist.8–10,28,34 The
light absorbed by the electron donor material not only produces electron-hole pairs for
electricity generation, but can also cause intrinsic degradation. The photostability of active layer

15
materials varies greatly as many different types of molecules with different chemistries can be
used, however most will undergo some form of photo-degradation. This degradation can take
the form of oxidation of the macromolecular chains, chain scission or cross-linking, but in any
case the photo-degradation results in a modification of the electronic structure of the molecules
thereby affecting the absorption, charge generation and charge transport of the active layer.
While photolysis reactions will occur without the presence of oxygen, they tend to be at a
relatively slow rate compared to the faster kinetics of the photo-oxidative reactions. An example
of this is found in the common OPV absorber material poly(3-hexylthiopene) (P3HT) which
shows very good photostability in photolysis conditions where no oxygen is present while
showing pronounced degradation in photo-oxidative conditions in air. 10,28,34,35 Therefore,
limiting the presence of oxygen in the active layer can improve its stability. However, this result
does not hold true for every active layer material with some materials, such as (MDMO-PPV),
showing relatively poor photostability even when oxygen is not present.10,28,34 Also, the overall
level of photo-degradation can be limited by the use of UV screening encapsulation as the
higher energy UV light generally degrades the materials at a faster rate than visible light, though
the materials will also degrade from visible wavelengths.10,26
Non-photo-induced degradation can also occur in the active layer. Oxygen and water
can react with the active layer via other reaction routes even under dark conditions, making
their exclusion even more important.10 The active layer can also be responsible for changes in
performance over time due to the nature of the bulk heterojunction structure. Since the active
layer is a mix of two immiscible materials, phase domains form. These domains are critical to
the proper functioning of the device in terms of charge separation and conduction of charges
towards the electrodes. However, the morphology of these domains is not thermodynamically
stable in most cases and can therefore change over time. Changes to the active layer morphology
are generally thermally activated processes and can cause changes in device performance by
increasing the distance charges must travel to reach the acceptor material. This leads to an
increase in recombination as fewer electron hole pairs are effectively separated. Changes in the
morphology can also lead to changes in the concentration of each phase at the interfaces with
the adjacent layers which can affect the charge transfer to these layers.10 Additionally,
fullerenes, which are commonly used as the acceptor material in the active layer of bulk
heterojunction devices, tend to have very low surface energies making adhesion to adjacent
layers difficult. This weak adhesion makes delamination more likely when mechanically
stressed.10,36,37

16
The intermediate charge transport layers can also contribute to the loss of performance
in OPV.8–10,29 Many of the metal oxide materials used as electron transport layers can act as
photo-catalysts by aiding in the formation of oxygen radicals when molecular oxygen is present.
These radicals are then able to attack the adjacent organic active layer.8–10,34 These metal oxides
can also react with oxygen to form superoxides which create electron trap states.10 Hole
transport layers, in particular PEDOT:PSS, can contribute to the degradation of OPV.
PEDOT:PSS is a very hygroscopic material and can speed the permeation of water throughout
the device and act as source of water for other degradation processes in adjacent layers.10
PEDOT:PSS is also acidic in nature and can etch ITO over time in devices using the classical
structure where the two materials are in contact, especially when water is also present.8,10
Additives and surfactants in commercial formulations of PEDOT:PSS can also diffuse to the
surfaces of the layer and affect the interfaces with adjacent layers. 8,10
The transparent electrode can also cause a loss of device performance. Traditionally, the
vast majority of OPV have used ITO for this layer. ITO is a brittle material however and is
prone to cracking when flexed.10 Indium from the electrode can also diffuse throughout the rest
of the device.8,10 As ITO also has several other processing concerns, replacements for ITO have
been an active area of research. While other metal oxides have been considered for use in place
of ITO, metal grids and silver nanowires are currently the most prevalent alternatives to TCOs,
but both are usually embedded in a conductive polymer to form the electrode.4,10,31,32 The most
common polymers for this task are high conductivity PEDOT:PSS formulations and therefore
these electrodes tend to exacerbate the previously discussed degradation mechanisms
associated with PEDOT:PSS.38
The stability of the metal back electrode depends greatly on the architecture of the
device.9,10,25,39 For classical structures, this can be one of the most sensitive materials in the
device. For optimal electrical performance, metals such as aluminum and calcium are used.
However, both of these materials are unstable in air. Aluminum can oxidize to form an
electrically insulating layer at the interface where it is in contact with the device. Additionally,
aluminum can react with and diffuse into fullerene layers when no intermediate layer is
present.8,10 Calcium meanwhile is highly reactive with water to form the non-conductive
calcium hydroxide.8,10 Using an inverted structure, these highly reactive metals can be replaced
with the much more noble silver. This change in electrode material is credited as the reason
why the inverted structure is several orders of magnitude less sensitive to water ingress as seen
in Figure 1.5. 9,10,25,40
17
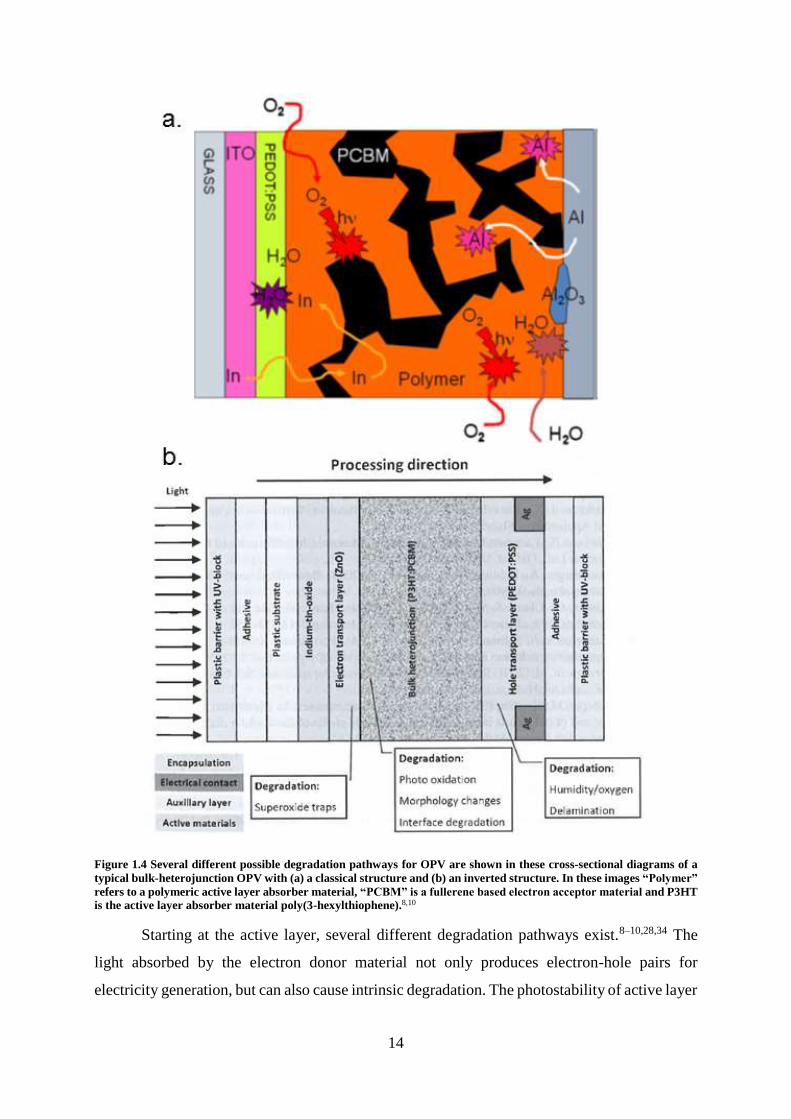
Figure 1.5 Plots of aging of OPV cells at 38°C and 100% relative humidity under illumination are shown as a function
of the mass of water which had permeated across the encapsulation for both (a) classical and (b) inverted architectures.
The inverted cells maintained 50% power conversion efficiency with 2 orders of magnitude more water present inside
the encapsulation.25
While many different materials are used throughout each layer of OPV devices, it can
be seen that light, temperature, oxygen and water play significant roles in the loss of device
performance. Photo and thermal degradation processes are more difficult to avoid and generally
must be addressed by improvements to the materials and device architectures. Oxygen and
water on the other hand, can be limited through the use of high gas barrier encapsulation. The
elimination of these contaminants from the device can greatly improve the device lifetime
without the need to modify the device itself.10,26
Similar Technologies
While the main focus of this thesis is on the application of OPV, the same types of
permeation testing, barrier materials and encapsulation techniques are also applicable to other
technologies. The most similar analogous technologies are other organic electronic devices, but
other types of inorganic solar technologies can also benefit from improved high-barrier
encapsulation.
Organic electronics are a large class of devices, which include OPV, that use organic
semiconductors to create electronic devices. All organic electronics are susceptible to the
inherent instability of organic semiconductors compared to highly stable inorganic
semiconductors. Some types of devices are more stable than others however. For example,
organic thin film transistors are generally more stable due to their lack of illumination and an

18
architecture which usually incorporates an inorganic insulating material which provides some
barrier protection.41–43 On the other hand, some organic electronics are as, or more, vulnerable
than OPV. Organic photodetectors are one such device which use the photovoltaic effect of
organic semiconductors to sense the presence and/or intensity of light. These devices are
constructed using device architectures very similar to those of OPV but are optimized
differently in order to achieve more sensitive measures and clearer on/off signals. Although the
operational conditions are different from OPV (indoor vs. outdoor, different spectra of
illumination), they are nonetheless subject to the same degradation mechanisms as OPV.13
Another analogous organic electronic technology is the organic light emitting diode (OLED).
Organic light emitting diodes operate in a manner similar to inorganic light emitting diodes in
that they luminesce at certain wavelengths when subjected to an electric potential. While some
of the materials used are slightly different than in OPV, they generally have device architectures
which are nearly identical to those of OPV. This makes them vulnerable to all of the same
degradation mechanisms as OPV. In addition, OLEDs usually have much poorer performance
with inverted architectures, therefore most OLED devices use a classical architecture with
easily degraded, low work function electrodes. This makes them even more sensitive than OPV
and the generally recognized maximum water vapor transmission rate (WVTR) for OLED
encapsulation is 10-6 g/m2/day compared to 10-3 g/m2/day for OPV.25,44–51 It should also be
noted that OLEDs have different requirements for what constitutes a failed device as point
defects such as dark spots are often considered unacceptable for OLED displays but are not a
major concern for OPV which is concerned mainly with the total amount of energy harvested.
Other photovoltaic devices are also vulnerable to degradation from permeating gases
and require barrier encapsulation. The prominent degradation mechanisms of several types of
solar technologies are shown in Figure 1.6.10 Crystalline silicon modules are intrinsically very
stable devices, however they still require encapsulation to avoid mechanical fracturing of the
silicon and corrosion of the metal electrical connections. Preventing corrosion of the electrical
connections requires only minimal barrier protection though and crystalline silicon modules are
able to achieve very long device lifetimes using encapsulation materials with relatively high
permeation rates such as poly(ethylene-co-vinyl acetate) (EVA).10,52,53 Thin film photovoltaics
are much more susceptible to degradation than crystalline silicon modules, however they are
still less sensitive than OPV. Amorphous silicon modules can suffer from photo-degradation of
the active layer, however this has been mostly controlled through better control of the nano and
micro crystallinity of the silicon.10 Cadmium telluride based modules can suffer from
degradation due to the back electrode which can diffuse into the active layer or corrode in the

19
presence of humidity. This has largely been solved through the use of more stable electrode
materials such as antimony-molybdenum alloys and encapsulation with relatively high
permeation rate materials such as (EVA).10 The most sensitive inorganic photovoltaic modules
are those which use a copper indium gallium diselenide (CIGS) active layer. This sensitivity
comes primarily from the degradation of the Al:ZnO front electrode in the presence of humidity.
While the traditional encapsulation techniques used for crystalline silicon modules can work
for CIGS modules, they are not always sufficient water barriers for long device lifetimes. CIGS
encapsulation is further complicated by their ability to produce flexible modules which cannot
use impermeable glass sheets. This creates an encapsulation problem very similar to that of
flexible OPV, though CIGS barrier requirements are less strict.54–60 Nonetheless, encapsulation
technologies developed for flexible OPV are directly applicable to flexible CIGS modules as
well. Recently, rapid advances have been made in organic-inorganic hybrid photovoltaic cells
based on a perovskite structure with laboratory-scale cells showing power conversion
efficiencies of up to 22%. While the materials and device physics are quite different for these
materials as compared to OPV devices, they provide many of the same benefits as OPV devices
including low-temperature processing, the use of printable inks, and the mechanical flexibility
of the devices.61–65 The stability and degradation mechanisms in these perovskite cells are still
being investigated. It does appear that some type of flexible encapsulation will also be needed
for this technology although it may still be too early to tell what level of gas barrier protection
will be needed.

20
Figure 1.6 Cross-sectional diagrams along with the most prominent degradation mechanisms are show for solar cells
with active layers based on (a) crystalline silicon, (b) amorphous silicon, (c) cadmium telluride and (d) CIGS. Images
modified from Krebs et al. 10

21
Permeation Mechanisms and
Encapsulation Materials
Permeation Mechanisms in Materials
Fickian Diffusion
Fick’s Laws of diffusion were first published by Adolf Fick and provide a mathematical
model of diffusion. Fick’s First Law describes the flux of permeating species through a matrix
as a function of the spatial concentration gradient as is seen in Equation 1.1 for the case of one
dimensional diffusion.66
Equation 1.1 𝐽 = −𝐷 𝜕𝐶
𝜕𝑥
In this equation J is the flux, D is a permeant and material dependent constant known as the
diffusion coefficient, C is the concentration of the permeating species and x is the distance in
the direction of diffusion. The diffusion coefficient, D, is a function of temperature with an
Arrhenius type relation as seen in Equation1.2.66
Equation 1.2 𝐷 = 𝐷𝑜 𝑒−𝐸 𝑅𝑇⁄
In this equation E is an activation energy which is constant for a given material, R is the
universal gas constant and T is the absolute temperature. Fick’s First Law is particularly useful
for modeling diffusion in the steady state. Steady state diffusion can be defined as a case where
the spatial concentration gradient is constant resulting in a constant flux. Before achieving a
steady state condition, the permeation is in the transient state. In this state, the concentration
gradient within the material changes as a function of time.66 This can be seen in Figure 1.7
which shows the stabilization time needed for the permeation of water vapor for a typical barrier
material.25

22
Figure 1.7 Plots for the water permeation of a flexible tri-layer laminate of polyethylene (46μm) – ethylene : vinyl alcohol
copolymer (6μm) – polyethylene (46μm) are shown as measured by a mass spectrometry based permeation cell using
heavy water. (a) The WVTR of the material increases throughout the transient state until stabilizing to a constant value
after approximately 1.5 days signifying that the steady state has been achieved. (b) When plotted as a cumulative mass
of permeated water, Q, the time lag, TL, can be calculated by extending a linear fit of the steady state region back to
Q=0.25
The amount of time needed for the significant amounts of gas to permeate across a
barrier can be estimated as the time lag (TL). The time lag is found by extending the linear, or
steady state, portion of a plot of mass permeated versus time until it crosses the time axis. The
value of time at the point along this linear curve where the mass permeated is 0 is defined as
the time lag as illustrated in Figure 1.7b. This value, h2/6D where h is the thickness of the film,
can be obtained from the linear part of the curve Q=f(t), which is obtained by the resolution of
the second Fick’s law in the steady state regime. For barrier films, the barrier properties against
a certain gas must therefore be reported with both a steady state permeation rate and the time
lag in order to accurately predict the total permeation. Also, due to the temperature sensitivity
of D, these two values are only valid for a given temperature.25,66–68 Figure 1.8 shows an
example of how these two values can be used to predict whether a material can meet the barrier
requirements for a certain application.25

23
Figure 1.8 (a) Isochrones are plotted which correspond to the time required for a mass of 1 g/m2 to permeate across a
film. It should be noted that for short time lags, the permeation is dominated by the WVTR. However, as the time lag
approaches the desired lifetime, the time lag becomes the dominant parameter. A homopolymer film, polymer laminate
film and a polymer laminate with an inorganic barrier layer are also plotted as points. (b) If the quantity of permeant
required to cause failure in a device is known, isochrones can be plotted for device lifetimes. Isochrones for classical
and inverted OPV cells are shown in conjunction with the three example barrier films. If the point representing the
barrier film is below/right of the isochrones, it will provide sufficient barrier protection to achieve the desired device
lifetime.25
For Fickian diffusion, the transient state can be modeled using Fick’s Second Law which
relates the change in the spatial concentration gradient with the temporal change in
concentration as seen in Equation 1.3.66
Equation 1.3 𝜕𝐶
𝜕𝑡= 𝐷
𝜕2𝐶
𝜕𝑥2
One important solution to this differential equation is for the case of one dimensional diffusion
into a semi-infinite material. For this case, the steady state is never achieved as the leading edge
of the diffusion front never reaches the opposite side of the material. Solving using these
boundary conditions yields Equation 1.4 where erf is the error function, Co is the concentration
at the exposed edge of the material and A is a constant.52,66,69
Equation 1.4 𝐶 − 𝐶𝑜 = 𝐴 𝑒𝑟𝑓 (𝑥
2(𝐷𝑡)1/2)
By selecting a particular concentration, the difference C – Co becomes a constant meaning the
operand of the erf must also be constant. This allows for the characterization of the advancement
of the diffusion front, which is seen in Equation 1.5, where K is a material constant valid for a
particular temperature and concentration.52,66,69
Equation 1.5 𝑥 = 𝐾 𝑡1/2
Polymeric Barrier Materials

24
Polymers are an excellent example of materials which follow Fick’s Laws. The chain-
like nature of polymers creates a large amount of free volume when compared to other dense
solids. This free volume allows gases to permeate relatively easily through most polymers.70
Reduction of the free volume through crystallinity and crosslinking can help to limit the
permeability to an extent. 70 Polymers are commonly used as barrier materials for applications
such as food packaging and a list of the oxygen transmission rate (OTR) and water vapor
transmission rate (WVTR) for various polymers used for barrier applications can be found in
Figure 1.9.26,71 As can be seen in this figure, even the best polymeric barriers remain several
orders of magnitude higher than the OPV requirements of 10-3cm3/m2/day/bar and 10-3g/m2/day
for OTR and WVTR respectively.
Figure 1.9 The permeation rates for oxygen and water vapor of various polymeric barrier materials are plotted. The
colored regions of the plot correspond to the barrier requirements for various applications. It should be noted that this
plot was published before the popularization of the inverted structure for OPV, therefore the OPV region on the plot
could be extended to 10-3 g/m2/day on the water vapor transmission rate axis based on more current estimations.71
Inorganic Barrier Materials
Dense inorganic materials also display Fickian diffusion behavior in defect free regions.
However, unlike polymers, the more tightly packed chemical structure of these materials
greatly reduces their permeation rates. In fact, for many inorganic materials Fickian diffusion
is so slow that they are effectively impermeable to oxygen and water at room temperature. This
makes these materials prime candidates for barrier applications. Thin metallic coatings are

25
frequently used to improve the barrier properties of polymer films, however their opacity makes
them ill-suited for use in the optical path where transparency is required. The best example of
a transparent inorganic material displaying Fickian permeation is silica glass. The large
thickness of glass sheets prevents the presence of defects which could traverse the sheet. This
makes sheets of glass effectively impermeable to oxygen and water in the temperature range
seen for outdoor applications.72 Glass has indeed been widely used to encapsulate OPV and
other even more sensitive devices. However the thickness of glass required to provide
effectively impermeable encapsulation generally results in rigid devices.10,26 While somewhat
thin films of flexible glass can be used, they often remain relatively brittle and thus easily form
large defects which gases can penetrate.73,74 For silica and other metal oxide materials to be
highly pliable for use in flexible encapsulation, the thickness must be reduced to such a level
that defects become unavoidable. This makes their permeation no longer Fickian and instead
completely dependent on the density and size of the defects.75,76
Defect-Dominated Permeation and Tortuous Paths
For the relatively thin layers of no more than several hundred nanometers required to
make rigid inorganic materials flexible enough for use in flexible encapsulation, it becomes
unavoidable to incorporate defects with almost all current technologies.75 These defects traverse
the thickness of the material and provide a much easier permeation pathway for gases. These
defects can include cracks from mechanical stresses, deposition inhomogeneities, grain
boundaries and nanoporosity. The presence of these defects across the thickness of an otherwise
impermeable layer greatly changes its effectiveness as a gas barrier. This means that the overall
permeation can no longer be described by Fick’s Laws but is instead dominated by the relatively
rapid permeation across the inorganic layer via defects. It has been shown that the permeation
rates for thin layers are strongly dependent on the size and density of defects.68,76
Commonly used inorganic materials for these thin, flexible barrier layers include SiO2,
Al2O3, TiO2, Zr2O3, Zn2SnO4 and SiN as they are generally able to produce the best quality
films in terms of defects. Many different deposition techniques can be used to create these films
but there is always a balance of film quality, processing time and cost which has thus far
prevented any one technology from gaining a large advantage over the others. Current
deposition techniques include reactive sputtering, plasma enhanced chemical vapor deposition,
atomic layer deposition and photo-conversion of liquid ceramic precursors.43,71,75,77–85 In order
to minimize the probability that a defect will traverse the thickness of the material, thicker layers

26
are preferred. However, the brittle nature of these materials causes thicker films to be prone to
cracking from mechanical and thermal stresses. Therefore a minimum permeation rate is
usually obtained with a thickness in the range of 50-150nm as can be seen in Figure 1.10.75,77
However the permeation rates achieved at these thicknesses are still too high to achieve the
requirements of OPV. Only atomic layer deposition has been shown to be capable of creating
acceptable gas barrier protection for OPV devices with thicknesses below this range.45–47,71,81,86–
89 However, there are currently other drawbacks to this process which will be discussed later in
this chapter in the “Encapsulation Techniques” section.
Figure 1.10 The OTR of SiOx layers of various thicknesses deposited on PET are shown for various deposition
techniques. Thicker layers limit the number of defects which completely traverse the SiOx layer, however very thick
layers become less mechanically stable and prone to cracking. This results in a minimum OTR at an SiOx thickness in
the range of 50-150nm.75
In order to further improve the barrier properties of inorganic materials with defect-
dominated permeation, multilayer systems have been employed. The goal of a multilayer
system is to create stacks of inorganic barrier layers and therefore improve the barrier
performance without cracking from stresses. This has been achieved by using softer
intermediate layers in between the inorganic layers. Beyond providing more mechanical
stability to the inorganic layers, this structure also creates discontinuities between the defects
in each inorganic layer. The result is a so called tortuous path for the permeation of gases. After
traversing a defect in an inorganic layer, the gas must then permeate along the next inorganic

27
layer until another defect allows for the gas to traverse the layer as shown in Figure 1.11. The
increased path length for permeation caused by this tortuous path greatly enhances the barrier
properties of the stack. A combination of one barrier layer and one intermediate layer is known
as a dyad and reductions of the OTR and WVTR by multiple orders of magnitude have been
reported for stacks with as few as two dyads.10,26,50,68,71,85,90–94
Figure 1.11 The black arrows represent possible permeation pathways through a three dyad multi-layer barrier film.
These pathways are tortuous as the permeating molecules cannot traverse the laminate in a straight line. Instead, the
gas must permeate through each intermediate polymer layer along the impermeable inorganic barrier layers until it
reaches another defect. This greatly increases the path length for permeation and therefore results in a low permeation
rate.92
Passive Composite Barrier Materials
The intermediate layers in a dyad structure are designed primarily to provide a planar
layer for the next inorganic barrier deposition while breaking the transfer of defects from one
barrier layer to the next. This is most commonly achieved through the use of an organic polymer
which can be coated to a thickness on the order of microns.26,68 The relatively soft nature of
polymers provide some stress relief to the brittle barrier layers, especially from the thermal
stresses as many deposition techniques require elevated temperatures. They are generally not
intended to serve as barrier layers themselves. However, an intermediate layer with some
inherent barrier properties could slow the permeation rate of the multilayer stack even further
as any permeating gas must pass through this material. With this goal in mind, several
alternative intermediate layers have been proposed in the literature including heavily cross-
linked organic polymers, composites of organic polymers and inorganic particles, and inorganic
polymers.71,85,90,91,95–97 In addition to intermediate layers, it is often necessary to use an adhesive
of some kind to secure a barrier stack or other encapsulation material to the device being
encapsulated. Improving the barrier properties of these adhesives is also critically important as
they are often present in much thicker layers than the intermediate dyad layer and can be a weak
link in some encapsulation processes, which will be discussed in detail later in this chapter.
These adhesives therefore have quite similar requirements to the intermediate layers of a multi-
layer barrier and often use the same strategies to reduce their permeation rates.94–102

28
The concept of the tortuous path can also be applied to polymeric systems through the
incorporation of inorganic particles. By dispersing particles made of a relatively impermeable
material throughout the polymer, any permeating gas must go around the particle. The resulting
increase in the permeation path length is a tortuous path just as in the case of the previously
discussed stacks of thin inorganic layers. Since the particles simply block the path of permeating
gases and do not strongly interact with them either through sorption or chemical processes, this
type of composite material is said to be passive in nature. The barrier effect caused by the
introduction of passive particles is well known and has been heavily exploited for many years
using a wide variety of particles. Commonly used particles include but are not limited to SiO2,
Al2O3 and TiO2. These particles are often on a length scale of several microns or greater and
are incorporated at high concentrations to achieve low permeation rates. However, high
concentrations of these materials limit or eliminate the transparency of the composite and can
often cause the composite to be quite rigid which causes any encapsulated device to lose its
flexibility. Decreasing the concentration of particles shortens the tortuous path however and
thus leads to high permeation rates. The large size of these particles also limits the minimum
thickness of a layer of the material and can lead to a less planar surface.70,90,97,103–106
To solve the problem of reducing the mass or volume fraction of particles while
maintaining a tortuous permeation path, it quickly becomes apparent that a high aspect ratio
particle is needed. A plate-like structure with a large diameter and small thickness should be
able to provide a tortuous path even at low loadings. This has led to the widespread use of
phyllosilicate particles in passive composite barrier materials. Phyllosilicates are silicate
materials which also incorporate other cations into their tetrahedral bonding structure. The
tetrahedrons are organized in manner that forms strong covalent bonds in two dimensions but
relatively weak bonds in the third dimension resulting in a plate-like structure. A diagram of
the structure of the phyllosilicate material montmorillonite is shown in Figure 1.12 as an
example of this type of structure.107 When properly dispersed in a solution or polymer, the plates
become exfoliated and the thickness of each individual particle becomes the thickness of a
single plate. This results in a particle with a diameter on the order of several microns and a
thickness of only a few nanometers. To more effectively exfoliate phyllosilicates dispersed in
polymers, they are often organically modified using salts with short organic chains covalently
attached. These very high aspect ratio nanoparticles are able to provide a tortuous permeation
path at loadings of just a few weight percent thus preserving the transparency of the
composite.90,91,103–106,108–114

29
Figure 1.12 A diagram of the structure of montmorillonite is shown. Like other phyllosilicates, montmorillonite consists
of sheets of tetrahedrally and octahedrally coordinated silicates. Between each sheet are cations and absorbed water. If
the particles have been organically modified the organic salts would also occupy this space between sheets. When
exfoliated, the sheets separate creating particles with a very high aspect ratio.107
Getters
An alternative approach to the passive composite and tortuous path is the use of an active
material which strongly interacts with a permeating gas. These active materials are commonly
known as getters and can be broken into two major classes: those who consume a permeating
gas through a chemical reaction; and those who trap permeating gas via sorption processes.
Depending on the exact type of getter used, they can either be incorporated into polymer as a
composite or placed inside a cavity with the device to be protected. By definition, a getter must
interact with the permeating gas, therefore many getters are developed to interact with one
particular gas. Getters which are designed specifically for water are often referred to as
desiccants.
Reactive
Reactive getters consume permeating gas via a chemical reaction, thus eliminating the
gas. These getters have traditionally been used in vacuum tubes in order to eliminate any
contaminates which might degas over time in the tube. Though many different materials have
been used as reactive getters, they are usually based on highly reactive metals such as barium,
zirconium alloys and calcium or sometimes their intermediate reaction products (i.e. CaO which
is an intermediate product in the reaction of Ca and water to ultimately form Ca(OH)2). Some
types of reactive getters, such as CaO, can also be prepared as particles and incorporated into
composite materials.26,47,48,115

30
Sorption
Rather than consume any permeating gas, some getters instead adsorb the gas molecules
on their surface. As these materials need a high surface area to adsorb large quantities of gas,
they are usually highly porous often with pore diameters on the order of only a few nanometers.
Several common types of getters which use adsorption are silica gels, activated carbon,
templated mesoporous materials and molecular sieves such as zeolites and aluminophosphates.
Silica gels (aerogels, xerogels) have the highest water sorption of these materials due to the
high porosity produced by their sol-gel processes. These materials take advantage of the ample
silanol groups on their surfaces to bind polar water molecules. Templated mesoporous materials
are also usually silicates or aluminosilicates which have been assembled into a mesoporous
structure with the aid of organic surfactants which phase separate on nanometer length scales.
Despite their high water sorption capabilities, these materials are often relatively expensive to
fabricate and can have problems with long term stability. Zeolites are aluminosilicates which
have an ordered highly porous structure that allows for a high water sorption capacity, though
slightly lower than silica gels. Aluminophosphates are very similar to zeolites except that they
are based on phosphate chemistry instead of silicates. These materials can have higher water
sorption than zeolites but are generally less stable and more expensive. A comparison of some
of the properties of these materials can be found in Table 1.1. Most of these materials are
typically fabricated into particles on the micro-scale or larger, which severely limits their ability
to maintain transparence when dispersed into a composite, especially activated carbon which
strongly absorbs visible light.105,106,116–118
Table 1.1 Comparison of different materials for water sorption
Material Water sorption
capacity (g/g)
Water sorption
rate
Price Long term
stability
Silica Gels 0.40 – 1.45 Medium Medium High
Templated Mesoporous
Materials
0.45 – 0.84 Medium High Low
Zeolites 0.20 – 0.45 High Medium High
Aluminophosphates 0.15 – 0.54 Medium High Low
Of particular interest are zeolites as they have the ability to be manufactured as
nanoparticles. There are a wide variety of zeolite structures, but they are generally based on
cage-like structures created by silicate and aluminosilicate tetrahedra. These cages form a series

31
of ordered pores with the smallest pore diameters in the range of 6-14nm. Water can adsorb on
the structure via several different processes. Cations, such as aluminum, can create both
Brønsted and Lewis acid sites which are capable of binding multiple water molecules. In
addition, clusters of silanol groups within the pores create nests which can bind water molecules
and other silanol groups present on the outer surface of the particles also provide sites to bind
water. A diagram of these different binding sites can be seen in Figure 1.13.116–118 Nanoparticles
of zeolites have been well researched, however their use in barrier composites has received only
very limited attention.49,118
Figure 1.13 The different types of water binding sites are shown in the pore structure of a zeolite with an H-MFI
structure. B refers to a Brønsted acid site. L refers to a Lewis acid site. N refers to a nest of SiOH groups. And S refers
to a surface SiOH group. In this image, the B, L, and N sites are located within the pores of the zeolite.116
Interfaces
When two different materials meet to form an interface, a new permeation pathway can
be created which does not follow Fick’s Laws.119–122 Permeation along interfaces is often
controlled by the surface energies of the materials and can occur both along the interface itself
and/or in within one or both of the materials in the region immediately adjacent to the interface
known as the interlayer.
Delamination
When permeation occurs along the interface itself, the result is often a delamination of
the interface. Depending on the types of materials meeting at the interface and the type of
permeant, this process can occur in different ways. In some cases, the sum of surface energies

32
of material A-to-permeant and material B-to-permeant is lower than the surface energy of
material A-to-material B. When this occurs, the system’s preferred state is delaminated and the
change in surface energies becomes a driving force for delamination.103,104,123–125 When at least
one surface is metal and the permeant is water, galvanic corrosion can occur using the water as
an electrolyte which greatly changes the surface chemistry at the interface leading to
delamination.103,104 Another mechanism which can cause delamination when water is the
permeant is osmotic pressure. As water molecules fill the region between the two materials, the
osmotic pressure created pushes the two materials apart and promotes the spread of the
delamination along the interface. As the interface delaminates, more water enters the crevice
and continues to apply osmotic pressure thus further propagating the delamination. This type
of delamination can often be modelled as a mechanical crack growth in a solid material.126–129
Regardless of the type of delamination, access to the interface due to a lamination defect or
mechanical stresses can greatly accelerate the start of delamination.
Interlayer Permeation
Even without complete delamination an interface can still provide a rapid permeation
pathway. This can occur due to the effects of the interlayers. The region within each material
which is immediately adjacent to the interface often has a structure which is different than the
bulk material due to the presence of the interface. This modification of the structure can
sometimes lead to a faster permeation rate in this region compared to the bulk material and thus
increase the overall permeation rate.119,122,124,130 A different but common scenario which occurs
in interlayer permeation is a surface energy effect. It is common for a saturated material to have
a different surface energy than the same material with no concentration of permeant. If the
surface energies favor an interface with the saturated material, this can create a driving force
for more permeation in the interlayer.121,123 Conversely, if the interlayer is already saturated due
to permeation in the bulk material, the interface can often times become much weaker due to
the change in surface energy between the saturated and unsaturated material. This can increase
the risk of delamination which would in turn cause more permeation along the interface.127–129
Encapsulation Processes
As previously discussed, the sensitivity of OPV devices to light, oxygen, water and
combinations thereof requires that the devices be encapsulated in order to achieve economically
viable device lifetimes. Many different encapsulation processes and schemes have been

33
proposed for this purpose and this section aims to provide an overview of the most prominent
among these. Regardless of the encapsulation scheme, there are two main permeation pathways
which will heretofore be referred to as orthogonal and lateral permeation respectively.
Orthogonal permeation is defined as permeation which occurs orthogonally to the plane of the
device. Lateral permeation on the other hand, refers to permeation in the plane of the device.
Lateral permeation is also commonly referred to as side ingress. A diagram showing these two
main permeation pathways can be seen in Figure 1.14. Due to the inherent aspect ratio of OPV
devices (large area, small thickness), most encapsulation schemes employ some form of a stack
with the device in the center.10,26 This creates interfaces which can provide permeation
pathways in the lateral direction. Therefore, the lateral permeation can often be further broken
down into bulk permeation through a material and permeation along the interface.
Figure 1.14 The different permeation pathways for water and oxygen are shown on a cross-sectional diagram of a typical
encapsulation scheme for OPV. The lighter green arrows show orthogonal permeation while the darker green arrows
indicate lateral permeation which can occur in either the bulk adhesive or along the interfaces.
Rigid Encapsulation
As previously discussed, silica glass is an ideal encapsulation material for solar
applications as it is both highly transparent and impermeable to oxygen and water under outdoor
conditions. As such, this material has been widely used to encapsulate OPV. Glass-to-glass
encapsulation is a process which has been carried over from the industrial scale encapsulation
of crystalline silicon solar modules. This technique seals the device between two plates of glass
using an encapsulant adhesive. The device may be fabricated on its own substrate or directly

34
onto one of the glass plates.10,26 The weak-link in the barrier using this type of encapsulation is
the encapsulant adhesive, which is much more permeable than the glass. This creates a scenario
where the orthogonal permeation is negligible and the lateral permeation is the only major
pathway. This lateral permeation includes both bulk permeation in the encapsulant adhesive
and permeation along the adhesive-to-glass interfaces.10,26,53,57,131 To limit this permeation, edge
seals around the perimeter of the glass are often employed. These are high-barrier adhesives,
usually with high loadings of inorganic particles and often, though not always, quite rigid. Their
high particle loading makes them almost universally opaque, hence why they are present only
along the perimeter outside of the optical path.10,26,55,56,60,105,106,132 This encapsulation scheme is
capable of providing an excellent encapsulation and long device lifetimes. However, glass-to-
glass encapsulation is extremely rigid, thus negating many of the benefits of flexible OPV
devices. Also, this rigidity eliminates the possibility of roll-to-roll processing.10,26
Flexible Films
To make the scheme used in glass-to-glass encapsulation flexible, the glass must be
replaced with a flexible material. This is achieved by the use of flexible barrier films. Though
alternatives such as flexible glass films exist, most flexible films used for OPV encapsulation
use a transparent multilayer dyad structure as previously described. These films have a
relatively thick polymer substrate upon which inorganic barrier layers and intermediate layers
are stacked. The exact design of these films varies greatly, but generally all are used in the same
manner for encapsulation.10,26
In this scheme, the device is laminated between two films using an adhesive in the
manner shown in Figure 1.14: barrier film – adhesive – device – adhesive – barrier film.
Recently, it has also become possible to build devices directly on flexible barrier films thus
eliminating the need for one of the adhesive layers. Encapsulation using flexible films results
in a slow orthogonal permeation rate since even though the films are not impermeable, they are
often capable of meeting the requirements needed for OPV devices with device lifetimes on the
order of several years.10,26
Lateral permeation remains a major concern though as the adhesive presents the same
weak-link in the barrier as seen in glass-to-glass encapsulation. However, the flexible nature of
these films does provide much more versatility in the selection of the adhesive as bubble-free
lamination without the use of vacuum is much simpler with flexible films. This is conducive to
the use of liquid adhesives as well as allowing for the use of pressure sensitive adhesives.10,26,99

35
This is of particular importance as it eases the development of flexible barrier adhesives. The
flexibility of these films also allows for the use of roll-to-roll processing for encapsulation,
which is particularly advantageous for OPV as the modules themselves are often fabricated
using this process.3,5,10,12 However, processing via roll-to-roll makes the use of edge seals much
more difficult as only two edges are exposed while on the web. Additionally, the flexibility of
the films makes many edge seal materials less practical as many are quite rigid. Flexible edge
seal materials can still be incorporated into this encapsulation scheme if sheet-to-sheet
processing is used instead.132
Direct Encapsulation
Rather than relying upon lamination, it is also possible to build barriers directly on top
of devices. This method provides orthogonal protection similar to the flexible film method but
can further limit lateral permeation depending on the exact scheme used.
Multilayer Systems
Multilayer dyad structures can also be fabricated directly on a device. This direct
encapsulation method can be used for either rigid or flexible encapsulation. In this method, a
planarizing layer is applied on top of the device in order to create a smooth, flat surface for the
deposition of an inorganic barrier layer. Alternating intermediate and barrier layers are then
deposited to form a stack of dyads. The first planarizing layer is often thicker than the
subsequent intermediate layers in order to completely encapsulate and smooth the surface of
the device. The first planarizing layer is still often times thinner than the adhesive layer in
flexible film encapsulation, which can help to limit lateral permeation by reducing the exposed
surface area of non-barrier material. The most well-known example of this scheme is the Barix®
developed by Vitex Systems (now known as Vitriflex), an example of which can be seen in
Figure 1.15. Other systems using this scheme are also being developed such as the YIELDjet™
system from Kateeva.10,26,47,85,133,134

36
Figure 1.15 A scanning electron microscope image of the cross-section of a Barix® encapsulation comprising four dyads
is shown. (Source: Vitex Systems/Vitriflex)
Atomic Layer Deposition (ALD)
ALD is a technique which can be used to create thin inorganic barrier layers as
previously discussed. However ALD also provides the unique ability to create these layers
conformally. This allows ALD to create barrier layers directly on devices without first applying
a planarizing layer or adhesive, thus eliminating lateral permeation in the bulk material as the
barrier layers are thick enough in the lateral direction to be effectively impermeable. This ability
comes from the mechanism by which ALD deposits oxide materials. Two different chemical
species are deposited sequentially and then react to form a conformal monolayer on all of the
exposed surfaces. The deposition chamber is purged between each deposition and the process
is repeated to grow the oxide layer one monolayer at a time. A diagram of this cyclic deposition
and the resulting conformal coating are shown in Figure 1.16.86 Perhaps most importantly, the
monolayer by monolayer deposition creates an inorganic layer with remarkably few defects,
and thus a very low permeability.45–47,71,81,86–89
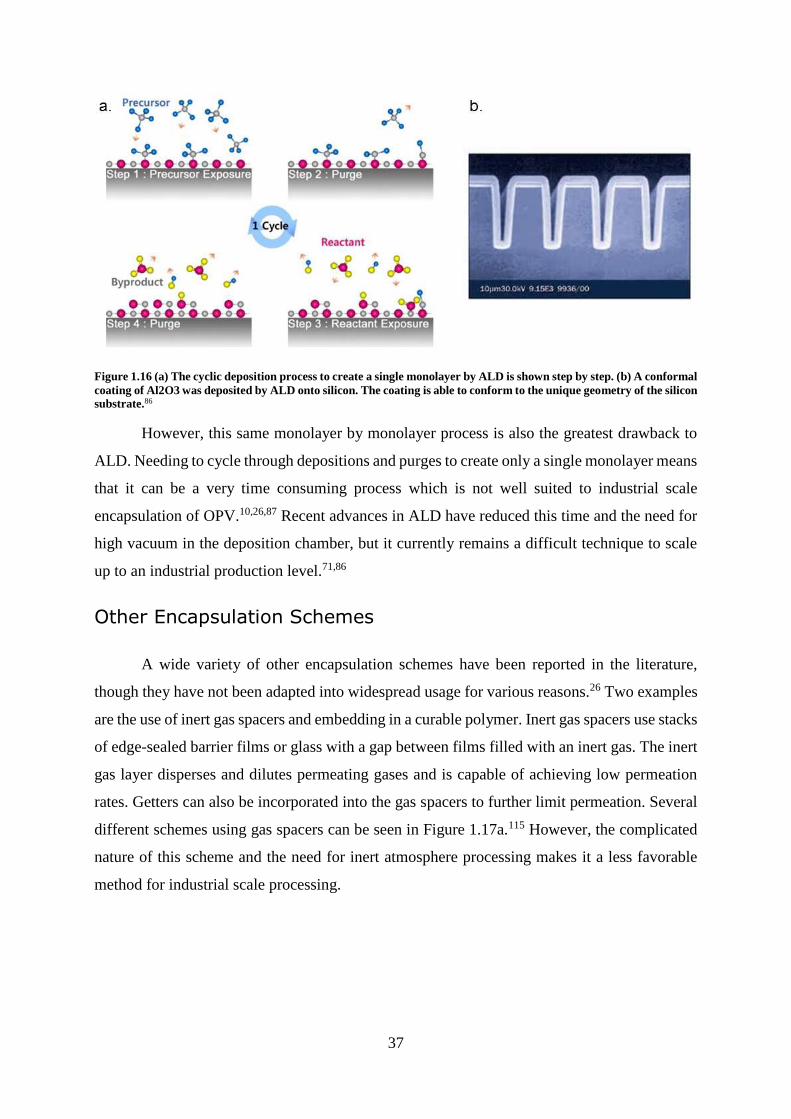
37
Figure 1.16 (a) The cyclic deposition process to create a single monolayer by ALD is shown step by step. (b) A conformal
coating of Al2O3 was deposited by ALD onto silicon. The coating is able to conform to the unique geometry of the silicon
substrate.86
However, this same monolayer by monolayer process is also the greatest drawback to
ALD. Needing to cycle through depositions and purges to create only a single monolayer means
that it can be a very time consuming process which is not well suited to industrial scale
encapsulation of OPV.10,26,87 Recent advances in ALD have reduced this time and the need for
high vacuum in the deposition chamber, but it currently remains a difficult technique to scale
up to an industrial production level.71,86
Other Encapsulation Schemes
A wide variety of other encapsulation schemes have been reported in the literature,
though they have not been adapted into widespread usage for various reasons.26 Two examples
are the use of inert gas spacers and embedding in a curable polymer. Inert gas spacers use stacks
of edge-sealed barrier films or glass with a gap between films filled with an inert gas. The inert
gas layer disperses and dilutes permeating gases and is capable of achieving low permeation
rates. Getters can also be incorporated into the gas spacers to further limit permeation. Several
different schemes using gas spacers can be seen in Figure 1.17a.115 However, the complicated
nature of this scheme and the need for inert atmosphere processing makes it a less favorable
method for industrial scale processing.
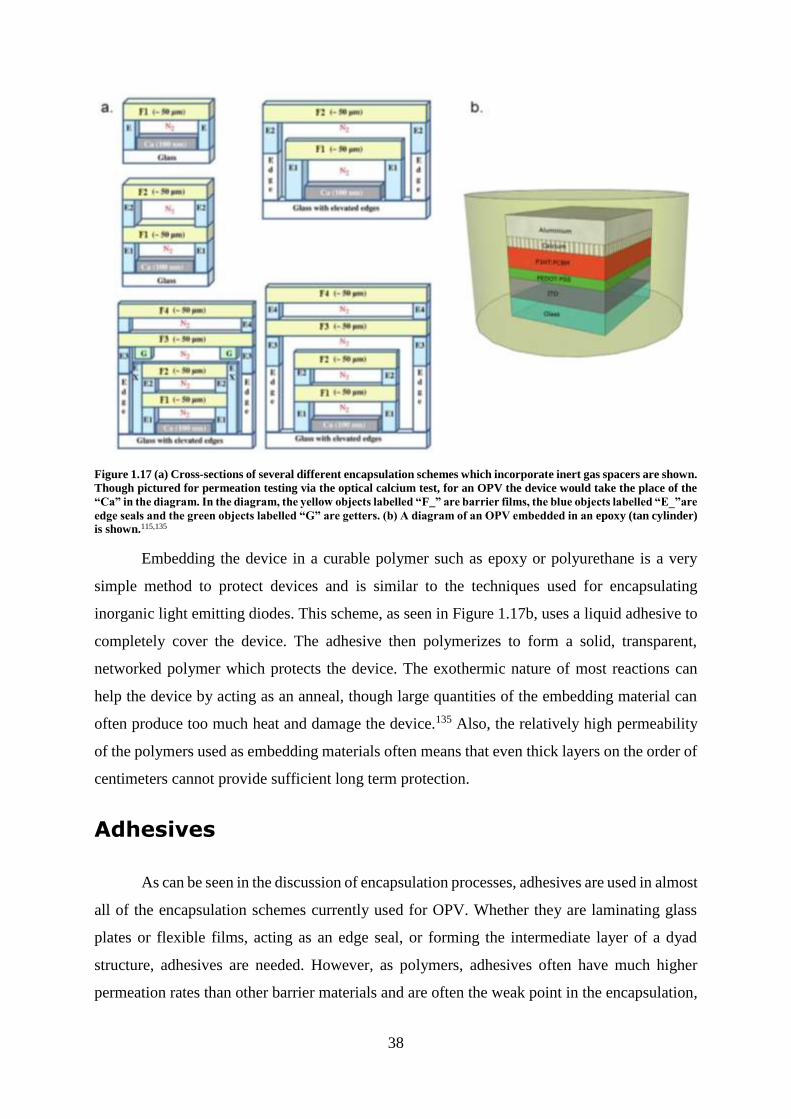
38
Figure 1.17 (a) Cross-sections of several different encapsulation schemes which incorporate inert gas spacers are shown.
Though pictured for permeation testing via the optical calcium test, for an OPV the device would take the place of the
“Ca” in the diagram. In the diagram, the yellow objects labelled “F_” are barrier films, the blue objects labelled “E_”are
edge seals and the green objects labelled “G” are getters. (b) A diagram of an OPV embedded in an epoxy (tan cylinder)
is shown.115,135
Embedding the device in a curable polymer such as epoxy or polyurethane is a very
simple method to protect devices and is similar to the techniques used for encapsulating
inorganic light emitting diodes. This scheme, as seen in Figure 1.17b, uses a liquid adhesive to
completely cover the device. The adhesive then polymerizes to form a solid, transparent,
networked polymer which protects the device. The exothermic nature of most reactions can
help the device by acting as an anneal, though large quantities of the embedding material can
often produce too much heat and damage the device.135 Also, the relatively high permeability
of the polymers used as embedding materials often means that even thick layers on the order of
centimeters cannot provide sufficient long term protection.
Adhesives
As can be seen in the discussion of encapsulation processes, adhesives are used in almost
all of the encapsulation schemes currently used for OPV. Whether they are laminating glass
plates or flexible films, acting as an edge seal, or forming the intermediate layer of a dyad
structure, adhesives are needed. However, as polymers, adhesives often have much higher
permeation rates than other barrier materials and are often the weak point in the encapsulation,

39
allowing for lateral permeation. This section discusses the different types of adhesives used to
encapsulate OPV and their processes.
Theories of Adhesion
There are several different factors which can create adhesion between two surfaces, and
different types of adhesives can exploit different factors in order to form a strong bond. One
requirement for adhesion is good wetting of the surface by the adhesive. This is often considered
in terms of surface energies. For wetting to occur, the surface energy of the adhesive-to-
substrate interface (γadh-s) must be more favorable than the sum of the substrate-to-air (γs-air) and
adhesive-to-air (γadh-air) surface energies as can be seen in the inequality shown in Equation
1.6.103,104,125
Equation 1.6 𝛾𝑎𝑑ℎ−𝑠 ≤ 𝛾𝑠−𝑎𝑖𝑟 + 𝛾𝑎𝑑ℎ−𝑎𝑖𝑟
These surface energies can also be used to determine the theoretical amount of energy needed
to rupture the interface. This value is defined as the work of adhesion, Wadhesion, and is the
difference of the surface energies in the bonded and unbonded states as seen in Equation
1.7.103,104,125
Equation 1.7 𝑊𝑎𝑑ℎ𝑒𝑠𝑖𝑜𝑛 = 𝛾𝑎𝑑ℎ−𝑠 − 𝛾𝑠−𝑎𝑖𝑟 − 𝛾𝑎𝑑ℎ−𝑎𝑖𝑟
For negative values of the work of adhesion, there is no adhesion and the two surfaces will
remain unbonded. Surface energies can be broken into different types of interactions such as
dispersive and polar. When present, hydrogen bonding can also increase the work of adhesion.
The work of adhesion often grossly underestimates the measured adhesion strength of an
interface however. This is due to several other factors which can contribute to the strength of a
bonded interface.103,104,125
For rough surfaces and porous materials, mechanical interlocking can increase the
adhesion. Some types of adhesives will form covalent bonds with the surface of the substrate
which can also increase the adhesion strength. One of the strongest ways to increase the
adhesion is through diffusion and entanglement. In this case the interface begins to blur as the
two materials blend together at the interface. In polymers, this leads to chain entanglement
while metals can form alloys, both of which create very strong bonding as the materials begin
to act as one continuous material. However, this is often rare for polymer adhesives as polymers
tend to be immiscible with other solids. One of the largest causes for the discrepancy between
the theoretical work of adhesion and the measured adhesion comes from the dissipation of
stresses within the materials. When a stress is applied to a bonded interface, some of the energy
40
is often dissipated by deformations in the adhesive and/or substrate, especially for softer
materials which deform easily. This is partially why soft adhesives can still maintain very strong
bonds. In some cases, these deformations can be large enough that the bonded assembly can
rupture within the adhesive or substrate. This type of rupture is referred to as a cohesive failure.
If not enough energy is dissipated by the materials, the assembly can instead rupture at the
interface which is referred to as an adhesive failure.103,104,125
Thermoplastic Encapsulants
Thermoplastic encapsulants encompass a wide variety of chemistries such as
poly(ethylene-co-vinyl acetate), polyolefins, poly(vinyl alcohol), poly(vinyl butyral), and
others, but all work in a similar manner. These materials are often applied as solid films and
then heated, often under pressure or vacuum to avoid bubbles. The hot polymer becomes very
soft and/or melts, thus allowing for wetting of the surface. Upon cooling, the polymer re-
hardens and locks in the surface morphology to provide adhesion. Though called thermoplastic
in this section due to the softening/melting process, many of these materials include thermal
activators which crosslink the polymer once heated in order to create stronger adhesion and a
more robust polymer. These materials are very commonly used for the encapsulation of
crystalline silicon photovoltaic modules and are especially well suited for glass-to-glass
encapsulation. However, these materials are generally poor barriers against oxygen and/or
water vapor and often require high thicknesses on the order of hundreds of microns. While the
process for using these materials is well known from other industries, it usually requires several
minutes of heating and batch processing making them more difficult for use with the in-line
roll-to-roll processing commonly used for OPV. 26,52,53,55,57,90,95,99,102–104,131,136,137
When this type of adhesive is heated and liquefied before application, they are often
referred to as hot-melt adhesives. It is possible to incorporate hot-melt adhesives into a roll-to-
roll system by heating the adhesive; applying it as a liquid; and immediately laminating the
assembly. However, this requires the use of highly specialized and expensive coating
equipment.26,103,104
Thermal Epoxies
Epoxies are a class of polymers based on the polymerization of epoxide groups. They
are generally liquid resins comprised of a blend of oligomers and monomers containing active
epoxide groups. The resin is then mixed with a curing agent, typically an amine or peroxide,

41
which reacts with the epoxide groups causing a ring opening polymerization. Since molecules
in the resin have multiple epoxide groups, the polymerization results in a networked polymer.
This reaction sometimes requires thermal activation and the time needed for curing can be
drastically reduced by heating. However, rapid polymerization at high temperatures often
causes the material to contract as it cures which can create residual thermal stresses in the
bonded assembly. These materials often have quite low permeation rates compared with other
adhesives, though the wide variety of formulations of epoxies can produce a wide range of
properties. The lowest permeation rate epoxies tend to be highly cross-linked, have high
concentrations of inorganic fillers, and be quite rigid. This makes them ideal for edge seals but
less practical for encapsulating in the optical path. Also the curing times often require minutes
to hours for transparent thermally activated epoxies.103–106,135,138
Thermal Polyurethanes
Thermal polyurethanes are quite similar to thermal epoxies and can produce adhesives
with a wide range of properties. Though the final properties of the adhesive are often similar to
epoxies, epoxies tend to be able to achieve lower gas permeation rates than polyurethanes but
polyurethanes tend to be lower cost. Polyurethanes have been used to encapsulate less sensitive
devices and devices which do not require a long lifetime. The main difference between epoxies
and polyurethanes is their chemistry. Polyurethanes are generally liquid resins consisting of
polyols which are then mixed with an isocyanate. The isocyanate reacts with the alcohol groups
of the polyol to form a solid, networked polymer. As with epoxies, heat is often needed to start
the reaction or accelerate its rate.98,103,104,139–146
UV Curing Adhesives
As an alternative to heating liquid adhesives to cure them, many systems can instead
use ultraviolet (UV) light to initiate curing. These systems do not use a traditional curing agent
but instead have photo-initiators which form reactive species when they absorb light. Therefore,
the adhesive will not polymerize until exposed to wavelengths of light which correspond to the
absorption spectra of the photo-initiators. Most photo-initiators are designed to absorb in the
UVA or UVB range so that they do not require dangerous high energy radiation nor do they
polymerize rapidly under ambient light. Some photo-initiators also absorb in the violet and blue
regions of the spectrum in order to facilitate curing through substrates which may block some

42
UV light. There are two main classes of UV curing adhesives which differ in the type of
polymerization reaction used for curing.103,104
Cationic
Cationic photo-initiators produce ions when then absorb specific wavelengths of light.
These ions then start a living cationic polymerization of the adhesive. This type of curing system
is commonly used with epoxy resins and produces cured epoxies with properties very similar
to those of thermally cured epoxies. Thus all of the benefits provided by epoxies can be realized
without the need for long curing times or high temperatures. Cationic curing epoxies typically
need 1-5min of UV exposure at the correct wavelength and will continue to cure for up to 24
hours after exposure as the polymerization will continue even after removed from the light
source. Gentle heating or post-cure annealing can often speed up the polymerization and lead
to a higher total degree of polymerization.97,99,103,104,113
Radical
The other major class of UV photo-initiators are those which produce radicals when
they absorb light. These radicals then produce a radical polymerization within the adhesive.
This type of photo-initiator is most commonly used with liquid resins containing acrylate
groups. Because acrylate groups can be grafted onto other functional groups relatively easily,
this class of adhesive is extremely versatile. It is common for the resin to contain oligomers of
acrylics, epoxies and urethanes with one or more acrylate groups grafted onto the oligomer for
functionality. The fast kinetics of radical curing requires much shorter UV exposures than
cationic epoxies and often need only a few seconds of illumination to reach the maximum level
of polymerization. Because of the short lifetimes of the radical species involved in the curing,
recombination of the radicals occurs once removed from illumination and the polymerization
stops almost immediately. The radicals produced also readily react with molecular oxygen in
the atmosphere to form peroxy radicals which are more stable and have much slower reaction
kinetics. This creates an effect known as oxygen inhibition which prevents the adhesive from
polymerizing when large amounts of oxygen are present. This can be avoided by laminating the
adhesive between two substrates before curing or by curing in an inert atmosphere. It is also
possible, but often difficult, to minimize this problem using careful formulation and additives.
It should also be noted that in general, radical curing acrylates tend to have lower adhesion than
cationic epoxies, though this strongly depends on the formulation and the substrates being
bonded.103,104,110,111,147–154

43
Pressure Sensitive Adhesives
Pressure sensitive adhesives (PSA) are viscoelastic solids which are above their glass
transition temperature, making them soft and capable of a limited amount of flow. Wetting the
surface is of critical importance for PSAs, therefore applying pressure to create better contact
between the adhesive and substrate creates better adhesion and is the source of their name. The
viscoelastic nature of these adhesives means that the adhesive will continue to further wet the
surface for some time after application as viscous flow occurs to relieve internal stresses. For
this reason most PSAs require a period of 24-72 hours after application to achieve their
maximum adhesion strength, though this can often be greatly shortened by annealing at an
elevated temperature. Whether or not a material could possibly be used as a PSA can be
approximated by the Dahlquist Criterion which states that the elastic potion of the shear
modulus, G’, should be less than about 10-5 Pa. For viscoelastic materials, it is important to
apply this criterion to the mechanical frequencies that will be seen not only when applying the
adhesive, but also during the lifetime of the bonded assembly. PSAs can be made from a variety
of different chemistries and can be either thermoplastic or cross-linked. Some common
materials for PSAs are acrylates such as poly(n-butyl acrylate), rubbers and rubber co-polymers
such as styrene-block-butadiene-block-styrene, silicones such as poly(dimethyl siloxane), and
many other soft polymers. As they are not liquids, the application methods for PSAs are usually
limited to lamination using rollers or presses. However these methods, combined with their
immediate adhesion known as tack, make PSAs extremely compatible with roll-to-roll
processing which is commonly used for the production of OPV.99,103,104,125,155–158
Composites
It is very common for adhesives to be combined with particles of other materials to form
adhesive composites. The creation of composites is a relatively simple method to modify the
properties of an adhesive and has been widely exploited for many years. While many different
types of particles have been used in adhesive composites, passive inorganic particles are the
most common choice for improvement of barrier properties. Low WVTR adhesives are very
commonly made by adding high concentrations of micro-scale particles of relatively
impermeable materials such as silica, alumina, titania and unmodified clays. The high
concentration of impermeable particles creates a more tortuous permeation pathway and also
greatly reduces the cross-sectional area of adhesive through which permeation can occur as the

44
particles take up a large volume fraction of the composite. While these composites can greatly
reduce the permeation rates of adhesives, the high concentrations of particles often also cause
them to become significantly more rigid and opaque. This makes them unsuited for use both in
the optical path and with flexible substrates. These composites are therefore popular edge seal
materials, especially in conjunction with rigid encapsulation schemes.70,90,97,103–106
Nanoparticles have also been used to improve the barrier properties of adhesives. Silica,
alumina and titania nanoparticles are common nano-fillers used in adhesive composites
although they can also suffer from the same opacity and rigidity problems as seen with micro-
scale fillers, but usually to a lesser extent.100,105,106,138,148,157 Carbon nanotubes can also provide
decreased permeation rates when used as fillers but very strongly absorb visible light leading
to a loss of transparency at relatively low loadings. The electrical conductivity of carbon
nanotubes can also sometimes cause problems when used in electronic devices if the
concentration is high enough.39 The most popular and well-studied nano-filler used in adhesive
composites are organically modified phyllosilicates. The organic modification of these particles
causes them to disperse much more easily in a polymer matrix leading to an exfoliation of the
platelet structure. This exfoliation creates a large number of very high aspect ratio particles at
relatively low loadings. This combination of factors creates a highly tortuous permeation
pathway, and thus a lower permeation rate, without much change in transparency or rigidity.
Organically modified phyllosilicates are now widely used with many types of adhesive
chemistries but the achievable permeation rates are still much higher than those of adhesives
highly loaded with micro-scale particles.90,91,103,104,109–111,113,139,145,146
A different approach to composite adhesives is to use active getter particles. In this
scenario, the permeating gas becomes trapped in the particle, thus limiting permeation further
into the adhesive until the particle is saturated. This is most often applied to the case of water
vapor as the permeating gas and a variety of desiccants have been used for this purpose
including nanoporous carbon, calcium oxide, zeolites and others.105,106 Because the method of
limiting permeation is different, active particles are more able to be loaded into highly flexible
adhesives therefore alleviating any increased rigidity. However, these micro-scale particles still
require high loadings and therefore greatly reduce the transparency of the composite. For this
reason, desiccant loaded adhesive composites are used as edge seals but rarely in the optical
path. Nanoparticles of active getters, especially zeolites, have been well studied at the lab scale
for various applications but there are very few examples in the literature of their use in adhesive
composites.49,118 These nanoparticles could potentially allow for lower loadings of particles to

45
achieve the low permeation rates with a more limited effect on the transparency of the
composite. This possibility is explored in depth in later chapters of this thesis.
Photostability of Adhesives
Since by definition a photovoltaic device is exposed to light, it is important that any
material used to encapsulate the device must possess enough photostability to properly function
throughout the lifetime of the device. Any adhesive used to encapsulate OPV must therefore
maintain its transparency, barrier properties, flexibility and adhesion for several years in
outdoor conditions where they will be exposed to sunlight, oxygen and water. Photo-
degradation can occur without the presence of air or other oxidative species through a process
known as photolysis, but often times the dominant reaction route changes when oxygen is
present. When ambient oxygen plays a role in the photo-degradation, the process is known as
photo-oxidation and often has faster reaction kinetics than photolysis reactions. Since adhesives
used for encapsulating OPV are designed to be barrier materials, the inner portions of the
adhesive are frequently in a low oxygen environment where photolysis is more likely while the
regions closer to the edges of the encapsulation may be exposed to higher levels of oxygen and
thus can experience photo-oxidation. Also, the quantity of oxygen will gradually increase
throughout the device over time as the barrier materials are not perfect. For these reasons, both
photolysis and photo-oxidation must be considered when discussing the photostability of
materials for OPV encapsulation. As many materials with different chemistries are used as
adhesives, their photostability can vary widely.159 This section will discuss the prominent
photo-degradation mechanisms for several adhesive chemistries with special attention paid to
those studied in this thesis.
Acrylic Pressure Sensitive Adhesives
Acrylic and methacrylic chemistries are well known for their good photostability. For
adhesive applications, acrylic polymers with low glass transition temperatures are commonly
used as pressure sensitive adhesives. To achieve low glass transition temperatures longer side
chains are often employed. However, acrylate and methacrylate polymers tend to be more
photo-stable with shorter side chains. One common material for pressure sensitive adhesives is
poly(n-butyl acrylate). The photostability of this material has been studied at various
atmospheric conditions and temperatures and is a relatively photo-stable polymer under outdoor
conditions. Both photolytic and photo-oxidative reactions have been shown to occur in this

46
polymer however. While poly(n-butyl acrylate) is quite stable when compared to some other
adhesive chemistries (see section on UV Curing Acrylates), it is not as photo-stable as shorter
side chain acrylic/methacrylic polymers such as the highly stable poly(methyl methacrylate).
Shorter side chains also cause the polymer to have a higher Tg often causing these polymers to
be too rigid for use as PSAs.155,160–163
UV Curing Adhesives
As previously discussed, UV curing acrylates can contain several different types of
oligomers each with their own unique chemistry. Because of the variety of chemistries used, it
is necessary to consider the photostability of all the different constituent chemistries present in
a formulation when discussing the overall photostability of the adhesive. This means that not
only acrylics, but also epoxies and polyurethanes must be evaluated as they can make up the
backbones of oligomers used in UV curing acrylate adhesives. In addition, photo-initiators can
act as impurities that can accelerate the rate of photo-degradation.159
Oligomers with an acrylic backbone and acrylic monomers are both generally quite
photo-stable in the UVA, UVB and visible ranges as previously discussed for pressure sensitive
adhesives. This photo-stability holds true for cross-linked acrylates as well. However, it is
common for a UV cured acrylate adhesive to not achieve 100% conversion of the acrylate
groups during curing. This leads to an initial reaction of the remaining double bonds of the un-
cured acrylate groups during irradiation. The photo-initiators in the formulation can also cause
photo-degradation to occur as they can act as chromophoric impurities in the polymer network.
For this reason, the selection of the photo-initiators must take into account their potential for
accelerating the photo-degradation of the adhesive. Careful formulation of the adhesive can
often limit this degradation pathway.159,164,165
While many different variations exist, including aliphatic chemistries, epoxies
commonly have an aromatic backbone. These aromatic epoxy resins, for example those based
on the digylcidyl ether of bisphenol-A, are generally susceptible to yellowing under exposure
to UV radiation regardless of the presence of oxygen. An example of this yellowing
phenomenon can be seen in Table 1.2.145 It has been proposed that the major cause of this
discoloration comes from quinone methide groups which are formed via a photolytic reaction
of the aromatic rings. Photo-oxidation introduces other degradation pathways which can speed
the overall degradation of the epoxy.141–146

47
Table 1.2 The yellowing of an aromatic epoxy based on the digylcidyl ether of bisphenol-A is shown after exposure to
UV centered at 340nm at 42°C and 30% relative humidity.145
Polyurethanes are also commonly used as oligomer backbones in UV curing acrylate
formulations. While the polyurethane portion of these materials is more susceptible to photo-
oxidation than the acrylic crosslinks, they are generally more photo-stable than epoxies. The
main photo-oxidation pathway for polyurethanes involves a chain scission at the α-carbon to
the nitrogen atom which leads to the formation of crosslinks and acids among other volatile
photo-products. These materials are also very effectively stabilized through the inclusion of
additives such as a hindered amine light stabilizer (HALS).151–153
Composites
The addition of particles to adhesives can often affect the photo-stability of the adhesive.
While inorganic particles rarely experience significant photo-degradation under outdoor
conditions, they can change the mechanisms of photo-degradation within the polymer matrix
and must therefore always be accounted for when determining the stability of the composite.
Many metal oxides can have a photo-catalytic effect. This comes from their ability to sensitize
molecular oxygen leading to the formation of radicals which can then attack the polymer. The
inclusion of transitional metal ions can also produce a photo-catalytic effect in the presence of
oxygen. An example of this can be seen in Figure 1.19 where the valence state of the metal ion
can reversibly change to produce radicals from hydroperoxy groups.145 These types of ions are
common in minerals and particles which contain ions as part of their structure such as

48
phyllosilicate clays. These same materials can also often retard photo-oxidation by increasing
the barrier properties of the adhesive. By limiting the rate of oxygen permeation, these particles
can decrease the amount of oxygen available for photo-oxidative reactions. This often results
in a balance between the two competing processes which is highly dependent on the chemistry
and purity of both the particles and the polymer.90,91,145,146
Figure 1.19 An example of accelerated hydroperoxy degradation in the presence of iron ions is shown where R is an
organic molecule. The formation of hydroperoxy groups is common during photo-oxidation of polymers, thus the
degradation rate is increased by the presence of ions.145
Permeation Measurement
The strict requirements of encapsulation materials for OPV necessitate the use of
materials with very low permeation rates. However, it can often be quite difficult to measure
these rates. A variety of techniques exist for measuring low permeation rates each with its own
advantages and disadvantages. A list of some of the techniques which can be used is presented
in Table 1.3 along with a general range of the permeation rates they are capable of measuring.
There are two major classes of permeameters: those based on permeation cells and those based
on scavengers.
Table 1.3 Techniques for measuring the permeation rates of high-barrier materials
Technique Permeating Gas Minimum WVTR
Measurement
Coulometric Permeation Cell166 Water 10-5 g/m2/day
Tunable Laser Diode Spectroscopy
Permeation Cell167
Water 10-6 g/m2/day
Mass Spectroscopy Permeation Cell92 Helium, Oxygen, Water 10-6 g/m2/day
Electrical Calcium Test168,169 Water 10-7 g/m2/day
Optical Calcium Test168–170 Water 4 X 10⁻⁷ g/m2/day
49
Permeation Cells
One class of permeameter is the permeation cell. In a permeation cell, the sample to be
measured acts as a membrane between an upstream side and a downstream side. The
atmosphere on the upstream is carefully controlled and contains the gas to be measured. The
downstream side contains a sensor which measures the gas of interest as it permeates across the
membrane. A variety of different methods can be used to control both the upstream and
downstream atmospheres depending on the exact experimental set-up. The upstream side may
be static or dynamic and contain a pure gas or a mixture of gases. The downstream side can
also be static or dynamic and is often either an inert gas or vacuum. In permeation cells, the
detection limit is determined by the sensitivity of the sensor, the level of contamination in the
downstream side, and the quality of the seal made at the sample between the upstream and
downstream sides of the cell. For very sensitive sensors, the detection limit is often determined
by the amount of background permeant present in the downstream side. This can come from
contamination in the downstream atmosphere or permeation around the edge of the sample and
through the seals between upstream and downstream side.92,166–168
Several different types of sensors have been proposed for this type of permeameter. One
common detector is based on coulometric sensing. This sensor uses phosphorous pentoxide to
absorb water. A voltage is then applied to split the water into H2 and O2 via electrolysis. Using
Faraday’s Law of electrolysis, the voltage can then be converted to a mass of permeated
water.166
Another type of sensor capable of measuring very low permeation rates are those based
on tunable laser diode spectroscopy. This technology shines a laser through the downstream
atmosphere at a sensor on the other side. Trace gases in the downstream atmosphere which
interact with the wavelength produced by the laser lead to a variation in the intensity measured
at the sensor. This signal can then be used to calculate the concentration of permeated gas.167
A third type of sensor is based on mass spectrometry. In this technology, the downstream
side is kept under high vacuum which enables the use of a mass spectrometer as the gas sensor.
This technology enables the testing of multiple different gases and the use of isotopic labelling
of the challenge gas. The use of isotope labelling reduces background noise and thus allows for
precise measures of very low permeation rates.92

50
Scavenger Sensing
Another method for measuring permeation is scavenger sensing. In this method a
scavenger which interacts with the permeant is encapsulated using the material to be tested and
placed into a controlled atmosphere. As the permeant traverses the material, it interacts with
the scavenger and causes a change to the scavenger which can be measured. The type of change
being measured is dependent on the type of scavenger being used. The geometry of the
encapsulation can also change greatly for different types of testing.
Gravimetry
The most well established type of scavenger sensing is gravimetric sensing. This test
uses a material which strongly absorbs/adsorbs the permeant gas which is sealed inside a
relatively impermeable container using the material to be tested. As gas permeates into the
container, it becomes trapped by the absorbent material. By measuring the change in mass of
the absorbent material over time, the permeation rate can be determined. This method is used
mainly for higher permeation rate materials as it can be difficult to accurately measure the very
small mass changes over the long time scales associated with very low permeation rates.171,172
Indicator Paper
Indicator paper is a simple method to visualize optically the rate of permeation. In this
test a paper or other film treated with a sensitizer is encapsulated inside the material to be tested.
When exposed to the permeant gas, the sensitizer causes the film to change color thus providing
a visual representation of the permeation front as it moves through the material. Unfortunately,
it is often quite difficult to precisely link the color change to an exact concentration of permeant,
thus limiting its effectiveness as a quantitative test.60
Calcium Test
Calcium is an excellent material for the scavenger sensing of water as it does not readily
react with oxygen at room temperature, but does with water according to the following173,174:
𝐶𝑎 + 𝐻2𝑂 → 𝐶𝑎𝑂 + 𝐻2
𝐶𝑎𝑂 + 𝐻2𝑂 → 𝐶𝑎(𝑂𝐻)2
The high sensitivity of calcium to water allows it to very accurately measure the small quantities
of water associated with very low permeation rates. Though the exact thickness varies

51
depending on the test method, thin layers of calcium are generally used as they make the
measurable changes to the calcium more evident.168 Detailed studies of calcium degradation
using atomic force microscopy have shown that the degradation of the calcium layer is not
completely homogenous over very short length scales. However, the macro-sized area of the
deposits used in testing creates average measures which are effectively homogenous given that
the concentration of water across the area being measured is also homogenous. It should be
noted though that this inhomogenous degradation does cause some error in the measured
permeation rate with the exact amount of error varying depending on the exact analysis method
used.175 The degradation of calcium is usually measured either electrically or optically.
Electrical Calcium Test
The electrical calcium test places two electrodes at the ends of a thin deposit of calcium.
The calcium is then encapsulated using the material to be measured, often leaving a gas spacer
of inert atmosphere between the calcium and the barrier material. This spacer helps to more
evenly disperse any permeating water leading to a more homogenous macro-scale degradation
of the calcium. The electrodes are then connected as part of a circuit and the resistance of the
calcium deposit is measured over time. A diagram showing an example of an electrical calcium
test can be seen in Figure 1.20.168,169 Since metallic calcium is a conductor while calcium
hydroxide is an insulator, the resistance of the deposit grows as the calcium reacts with water
and allows for a precise calculation of the amount of metallic calcium remaining. The amount
of remaining calcium is then easily converted to a mass of permeated water using the
stoichiometry of the reaction. Because of the geometry needed to incorporate electrodes,
electrical calcium tests are usually limited to measuring the orthogonal permeation through
films. Additionally, the electrical calcium test can often times slightly underestimate the time
lag and WVTR. However, the test does still provide an excellent approximation of water vapor
barrier properties and is usually simpler to automate than the optical calcium test.169,176–178

52
Figure 1.20 (a) A diagram of an example test geometry for an electrical calcium test is shown next to (b) an image of a
sample. (c) An alternative sample geometry for an electrical calcium test is also shown as there is no international
standard for this type of test. The electrical contacts would then be connected into a circuit and the resistance of each
calcium sensor would be measured over time in order to measure the amount of water which has permeated across the
barrier.168,169
Optical Calcium Test
The other option for measuring the degradation of calcium is to do so optically. This
method takes advantage of the change in color from mirror-like metallic calcium to transparent
calcium hydroxide. Therefore, by using a CCD camera to take a series of images over time, it
is possible to track the degradation of a thin layer of calcium. This test is particularly useful for
visualizing the permeation of water, but is much more precise than indicator paper. While this
test is ostensibly qualitative in nature, it is possible to extract quantitative values through the
use of calibration curves.168 Several different variants of the optical calcium test have been

53
reported which are capable of measuring different aspects of water permeation. The three major
types of optical calcium tests are intrinsic, extrinsic and lateral.
Intrinsic tests are used mainly to evaluate deposited barrier layers such as those used in
dyad structures and also for materials to encapsulate OLEDs where the formation of dark spots
is of high importance. For this type of test, the calcium is deposited directly onto a barrier layer.
The calcium is then sealed inside a glass cap and edge sealed with a high barrier sealant. This
geometry minimizes the presence of lateral permeation effectively limiting permeation to that
which traverses the barrier layer being tested. Since permeation in these barrier layers is defect-
dominated, the calcium will degrade first at the defects and then continue degrading outward
from the defect. Visually, this creates transparent spots in the calcium which grow larger with
time. When the defects in the barrier layer are separated by a sufficiently large distance, it is
possible to see the density and relative size of the defects by the density and size of the
transparent spots in the calcium. An example image from this type of calcium test can be seen
in Figure 1.21.71,168,170
Figure 1.21 An encapsulated calcium deposit is shown before and after aging in a humid environment during an intrinsic
optical calcium test. The white points in the second image are regions where the calcium has degraded into transparent
calcium hydroxide. Each point is centered on a defect in the barrier layer of the encapsulation.168
Extrinsic tests are quite similar but instead show an average permeation instead of the
specific points seen in intrinsic tests. This is achieved by depositing the calcium on the glass
cap instead of directly on the barrier being measured. This geometry creates a spacer of inert
gas between the barrier material and the calcium, thus allowing the permeated water vapor to
disperse and degrade the calcium more homogenously on the macro-scale. As previously
mentioned, the degradation of calcium is not perfectly homogenous at small length scales,
however the assumption of homogeneity does allow for an excellent approximation of the water
vapor permeation. An example image from this type of calcium test can be seen in Figure
1.22.168 To extract quantitative values from the optical images, a calibration curve is established
by determining the transparency/grayscale of known thicknesses of calcium. This curve is then
used to relate the transparency/grayscale of each image to a remaining thickness of calcium.

54
Alternatively, the change in the calcium thickness can also be calculated using the Beer-
Lambert Law shown in Equation 1.8 where I is the intensity of light measured in transmission,
ε is the absorptivity (material constant), l is the path length through the absorber (calcium
thickness) and c is the concentration of the absorber (calcium).
Equation 1.8 𝐼𝐼𝑜
⁄ = 𝑒−𝜀𝑙𝑐
Regardless of the calculation method for the calcium thickness, a change in the amount of
calcium can be converted to a mass of permeated water via the stoichiometry of the
reaction.88,168,170,175
Figure 1.22 A series of calcium deposits which have been encapsulated as a single sample are shown at different stages
of degradation after aging in a humid environment during an extrinsic optical calcium test. Rather than white spots of
completely degraded calcium as seen in intrinsic tests, the calcium in these deposits degrades over the entire area of the
calcium. As the metallic calcium layer becomes thinner as it degrades, it becomes more transparent leading to the
progressively lighter shades of gray in the images.168
Lateral permeation can also be measured using the optical calcium test. In this variant,
the calcium is encapsulated between two plates of glass. This prevents any orthogonal
permeation and allows for only lateral degradation, thus making possible the measurement of
the adhesive or edge seal material. Figure 1.23 shows an example of images from this type of
test where the calcium deposit appears to shrink inward from the edges.69 The rate at which the
opaque calcium deposit shrinks shows the rate at which water is permeating laterally. This
permeation is well modeled using a moving boundary approach as the calcium consumes the
water thus altering the permeation rate once the permeation front has reached the calcium. This
technique provides an excellent tool to not only compare adhesives and encapsulants, but also
to aid in encapsulation design by estimating the distance between the edge of the encapsulation
and the edge of the device needed to achieve the desired device lifetime. One major limitation
of this test however is the influence of the interface on the lateral permeation. The interface
would only be valid for a device using glass-to-glass encapsulation. There can be drastic
differences in the interface of an adhesive on a glass substrate versus the plastic surface of a
flexible multi-layer barrier film. This makes it very difficult to predict the interfacial permeation
of a flexible device using this method of calcium test. Replacing the glass with the desired
barrier film in the calcium test would require a new analysis method since the barrier film is

55
not impermeable and would therefore cause changes to the thickness of calcium, invalidating
the modelling which assumes a constant thickness of calcium.52,69,168
Figure 1.23 An example of an optical calcium measuring lateral permeation is shown. The red lines are added to aid in
the visualization of shrinking size of the calcium deposit as it is degraded by water permeating inward from the edges
of the sample.69

56

57
Chapter 2: Experimental
Procedures and Testing
Raw Materials
Barrier Films
Three different commercially available multi-layer barrier films along with one grade
of poly(ethylene terephthalate) (PET) were used throughout the project. The barrier film VX
25T-2PO from Oike & Co., Ltd. was designated as the “reference” barrier film and was used
for the majority of the investigations where flexible barrier films were needed. This barrier film
uses a dual dyad structure consisting of 25μm PET – inorganic barrier layer – 25μm optically
clear adhesive – inorganic barrier layer – 25μm PET as can be seen in Figure 2.1 a. This film
was supplied with protective polymer films on both exposed surfaces which were removed by
hand immediately prior to utilization of the films. This barrier film has a water vapor
transmission rate (WVTR) of 3 X 10⁻⁴ g/m2/day at 40°C and 90% relative humidity as reported
by the manufacturer.
Another multi-layer barrier film which was also supplied by Oike & Co., Ltd. was VX-
50TH. This film uses a structure consisting of an inorganic barrier layer – 50μm PET – hard
coat as can be seen in Figure 2.1 b. The barrier film was supplied with a protective polymer
film on the inorganic barrier layer which was removed immediately prior to utilization of the
films. An alternative version of this film called VX-50TH-OCA was also used. This barrier film
is identical to VX-50TH but also includes a 25μm layer of an optically clear adhesive on top of
the inorganic barrier layer. The protective polymer film is therefore placed on to the adhesive
layer. This barrier film, both with and without adhesive, has a water vapor transmission rate
(WVTR) of 1-4 X 10⁻³ g/m2/day at 40°C and 90% relative humidity as reported by the
manufacturer.
The third multi-layer barrier film used was FTB3-50a supplied by 3M. This barrier film
uses a structure of 50μm PET – polymer – barrier oxide – polymer – 25μm barrier adhesive
(FTBA-25) as can be seen in Figure 2.1 c. The barrier film was supplied with protective polymer
films on both exposed surfaces which were removed immediately prior to utilization of the

58
films. This barrier film, both with and without adhesive, has a water vapor transmission rate
(WVTR) of 10-4-10-5 g/m2/day at 60°C and 90% relative humidity as reported by the
manufacturer.
Figure 2.1. The structure of the barrier films are shown as provided by the manufacturers: a) Oike VX 25T-2PO
where OCA refers to an optically clear adhesive and Barrier Layer refers to a thin inorganic layer; b) Oike VX-50TH
with and without an optically clear adhesive where HC refers to a hard coat; and c) 3M FTB3-50 without and with
(FTB3-50a) adhesive. For the 3M barriers, only the 2mil (50μm) versions were used.
In addition to the barrier films, PET was used as an inexpensive barrier film replacement
for some types of testing and also as a substrate for the evaporation of calcium in the optical
calcium test. The PET film used was Dupont-Teijin Melinex 401 with a film thickness of 50μm.
Adhesives
Commercially Available Adhesives
Several commercially available adhesives were used as benchmark materials during the
project. All of these adhesives were pressure sensitive and supplied in the form of films with a
homogenous thickness.
The adhesives 467MP and 468MP from 3M (United States) are chemically identical and
have thicknesses of 50μm and 125μm respectively. While the exact chemical structure of these

59
materials is unknown, they are based on an acrylic chemistry and are crosslinked. The adhesives
were supplied as rolls coated onto a release liner.
Another pressure sensitive adhesive provided by 3M (United States) is FTBA-25 which
is a state-of-the-art barrier adhesive. No information is currently available in regards to the
formulation of this adhesive. It was supplied both as a 25μm film between two release liners
and pre-coated to 25μm on a multilayer barrier film (FTB3-50a).
The final commercially available adhesive tested was and optically clear adhesive from
Oike & Co., Ltd. (Japan). This is also a pressure sensitive adhesive, though no information is
currently available in regards to its formulation. The adhesive was supplied pre-coated to 25μm
on Oike VX-50TH multilayer barrier films.
MAM Nanostrength® Block Co-Polymers
MAM Nanostrength® adhesives are a class of materials currently under development at
Arkema (France). They are pressure sensitive adhesives based upon an A-B-A block copolymer
structure where the A-block is poly(methyl methacrylate) (PMMA) and the B-block is
poly(butyl acrylate) (PBA). Four different grades with varying ratios of the blocks were used
as is described in Table 2.1. The block ratios are as follows: M65 contains 65% PBA and 45%
PMMA, M75 contains 75% PBA and 25% PMMA, and M85 contains 85% PBA and 15%
PMMA. M85M has identical block ratios to M85 except that the PMMA block is instead a co-
polymer of PMMA and poly(methacrylic acid). All four formulations are produced by Arkema
via a patented “BlocBuilder®” controlled radical polymerization technique. M65 and M75 were
supplied as pellets while M85 and M85M were supplied as slabs of bulk polymer.
Table 2.1 The block ratios for the MAM Nanostrength® adhesives are listed. *M85M contains an unknown amount of
poly(methacrylic acid) in the PMMA block.
Adhesive PMMA PBA
M65 35% 65%
M75 25% 75%
M85 15% 85%
M85M 15%* 85%

60
Acrylate Oligomers, Monomers and Solutions
UV curing acrylate adhesives consist of a mix of monomers, oligomers and photo-
initiators. For these adhesive formulations, a monomer is defined as a small molecule with one
or more functional acrylate groups. Oligomers are defined as molecules which are much larger
than monomers and are often very short chain polymers. The chemistry of the oligomer
backbones can vary greatly (acrylic, epoxy, polyurethane, etc.) however there is always at least
one functional acrylate group. The number of functional acrylate groups per molecule is listed
as the “functionality”. A functionality of one will create a straight chain polymer when cured
whereas higher functionalities will create a networked structure when cured. Details of the
monomers and oligomers can be found in Table 2.2 and Table 2.3 respectively. All monomers
and oligomers were provided by Sartomer (Arkema Group).
Table 2.2 Information on the Sartomer monomers is shown as provided by the manufacturer.
Product
Name
Description Homopolymer
TG
Acrylate
Functionality
SR238 1,6-hexanediol diacrylate 43°C 2
SR285 Tetrahydrofurfuryl acrylate -11°C 1
SR484 Mix of octyl and decyl acrylates NA 1
SR504 Ethoxylated 4-nonyl phenol acrylate -28°C 1
SR506D Isobornyl acrylate 94°C 1
SR9003 Propoxylated 2-neopentyl glycol
diacrylate
32°C 2
SR9050 Monofunctional acid ester NA 1
Table 2.3 Information on the Sartomer oligomers is shown as provided by the manufacturer.
Product
Name
Description Molecular
Weight
Homopolymer
TG
Acrylate
Functionality
CN131B Aromatic epoxy acrylate 300g/mol 14°C 1
CN966H90 Aliphatic urethane diacrylate
+ 10% 2-(2-ethoxyethoxy)
ethylacrylate
7000g/mol -35°C 2
1
CN9001 Aliphatic urethane diacrylate 3250g/mol 54°C 2
CN9002 Aliphatic urethane diacrylate 7650g/mol -55°C 2

61
Two different photo-initiators were used to start the radical curing reaction of the UV
curing acrylate adhesives. Irgacure 184 from Ciba Specialty Chemicals is a powder of 1-
hydroxy-cyclohexyl-phenyl-ketone and is a radical photo-initiator which is activated mainly in
the UVA spectrum. Lucirin TPO-L from BASF is a liquid photo-initiator which is activated by
longer wavelengths of light than Irgacure 184 and consists of ethyl-2,4,6-
trimethylbenzoylphenylphosphinate. The chemical structure and absorption spectra of these
materials at different concentrations in a solvent can be seen in Figure 2.2.
Figure 2.2 The chemical structure and absorption spectra as provided by the manufacturer for (a) Irgacure 184 in
acetonitrile and (b) Lucirin TPO-L in ethanol.
Nanoparticles
Phyllosilicates
Two different grades of phyllosilicates from Southern Clay Products (United States)
were used. Cloisite 10A consists of bentonite modified with benzyl(hydrogenated tallow)
dimethyl quaternary ammonium salt. As can be seen in Table 2.4, the typical particle diameter
is <10μm (d50) while the d001 spacing is 1.9nm. Cloisite 15A consists of a natural
montmorillonite modified with dimethyl di(hydrogenated tallow) quaternary ammonium
chloride. The typical particle diameter is <6μm (d50) while the d001 spacing is 3.15nm.
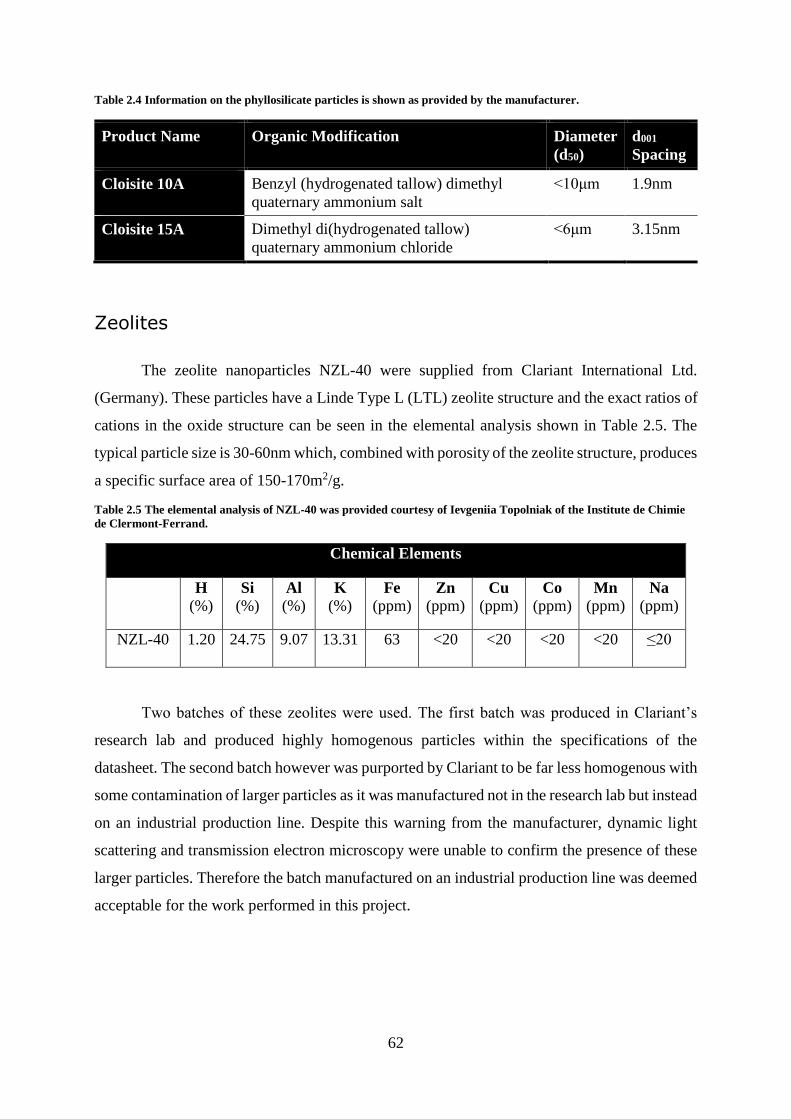
62
Table 2.4 Information on the phyllosilicate particles is shown as provided by the manufacturer.
Product Name Organic Modification Diameter
(d50)
d001
Spacing
Cloisite 10A Benzyl (hydrogenated tallow) dimethyl
quaternary ammonium salt
<10μm 1.9nm
Cloisite 15A Dimethyl di(hydrogenated tallow)
quaternary ammonium chloride
<6μm 3.15nm
Zeolites
The zeolite nanoparticles NZL-40 were supplied from Clariant International Ltd.
(Germany). These particles have a Linde Type L (LTL) zeolite structure and the exact ratios of
cations in the oxide structure can be seen in the elemental analysis shown in Table 2.5. The
typical particle size is 30-60nm which, combined with porosity of the zeolite structure, produces
a specific surface area of 150-170m2/g.
Table 2.5 The elemental analysis of NZL-40 was provided courtesy of Ievgeniia Topolniak of the Institute de Chimie
de Clermont-Ferrand.
Chemical Elements
H
(%) Si
(%) Al
(%) K
(%) Fe
(ppm) Zn
(ppm) Cu
(ppm) Co
(ppm) Mn
(ppm) Na
(ppm)
NZL-40 1.20 24.75 9.07 13.31 63 <20 <20 <20 <20 ≤20
Two batches of these zeolites were used. The first batch was produced in Clariant’s
research lab and produced highly homogenous particles within the specifications of the
datasheet. The second batch however was purported by Clariant to be far less homogenous with
some contamination of larger particles as it was manufactured not in the research lab but instead
on an industrial production line. Despite this warning from the manufacturer, dynamic light
scattering and transmission electron microscopy were unable to confirm the presence of these
larger particles. Therefore the batch manufactured on an industrial production line was deemed
acceptable for the work performed in this project.

63
Materials Preparation
MAM Pressure Sensitive Adhesives
The MAM Nanostrength® adhesives were not available in the form of homogenous
films but were instead supplied as pellets or slabs of bulk polymer. This necessitated the use of
solution processing in order to create homogenous films which was possible thanks to the
thermoplastic nature of these adhesives. Solution processing was also advantageous as it
allowed for facile mixing with nanoparticles. The following section describes the processes
used to create solutions, composites and films of the MAM Nanostrength® adhesives.
Solutions
Solutions of the neat adhesives were created by magnetic stirring of the adhesive with
either acetone or toluene in a closed glass bottle or vial. The exact ratio of adhesive-to-solvent
was dependent on the adhesive and concentration of nanoparticles due to the variations in
viscosity. In general, 30-45 weight% of adhesive was sufficient to fully dissolve the adhesive
and maintain a viscosity easily workable with a wide mouthed disposable pipette. Acetone was
used in early experiments as it is generally considered to be less toxic than toluene. However
the rapid evaporation rate of acetone led to problems under certain conditions which in turn led
to the use of toluene as the preferred solvent. The fast evaporation rate of acetone under ambient
conditions caused the substrate to cool. This cooling effect was often enough to cause water
vapor in the atmosphere to condense onto the adhesive / substrate in the summer or on especially
humid days. Heating the substrate to avoid this cooling caused the evaporation to become too
rapid and often introduced bubbles and/or inhomogeneities in the coatings. The slower
evaporation rate of toluene does not have these problems and was therefore selected as the
preferred solvent for the MAM Nanostrength® adhesives.
Cloisite 10A was found to be slightly more soluble in toluene than Cloisite 15A and was
therefore used for all MAM-phyllosilicate composites. Solutions containing zeolites used
Clariant NZL-40 nanoparticles. The particles were measured as a powder using a balance and
were then added to a previously prepared solution of adhesive in toluene. The composite was
then allowed to stir on a magnetic stir plate until only large clumps of particles or precipitates
remained undispersed. The solution was then sonicated at 45 kHz for 15-30min and returned to

64
magnetic stirring. If necessary, this cycle was repeated until the particles were completely
dispersed. These solutions were generally milky in appearance in comparison to the transparent
solution before the addition of the particles, especially for the phyllosilicates. All solutions of
composites were sonicated again just prior to use.
Solvent Evaporation
Once coated it is necessary to evaporate all of the solvent before using the adhesive.
Residual solvent in the adhesive can greatly affect the properties of the adhesive and cause the
formation of bubbles if it evaporates during subsequent processing. Therefore all samples were
dried immediately after coating. To limit surface roughness, thickness inhomogeneity and
formation of bubbles caused by rapid evaporation of the solvent, the toluene was allowed to
evaporate at room temperature in a fume hood or ventilated bench until no liquid remained.
This was generally achieved in 5-10min. The coated substrates were then dried on a hot plate
at 90°C in a fume hood for 10-15min to remove any toluene which remained absorbed in the
polymer.
UV Curing Acrylates
All UV curing acrylate adhesives used in this project were supplied in the form of
monomers, oligomers or blends of monomers, oligomers and additives. It was therefore
necessary to complete the formulations before use by mixing these materials in the appropriate
ratios with photo-initiators. This class of adhesive also requires the additional step of curing
with ultraviolet light. The process involved for the fabrication and curing of these adhesives is
discussed in this section.
Fabrication
All solutions were mixed in glass bottles or vials via magnetic stirring. Components
were all measured by mass and added directly to the main solution. This was done due to the
tendency of many of the monomers and oligomers to leave a significant amount of residue on
all containers and measuring devices which they come into contact with. Very high viscosity
oligomers were always added first via spatula followed by the remaining liquid monomers and
oligomers whose precision was achieved through dropwise addition. The solution was then
allowed to mix, though not always completely, before the addition of the photo-initiators. After

65
the addition of the photo-initiators the solutions were allowed to thoroughly mix via magnetic
stirring. For several formulations their high viscosity made stirring ineffective. For these
solutions, the magnetic stir plate was warmed to 60°C in order to reduce the viscosity of the
solution and allow for thorough mixing. This warming technique was also used when these
solutions need to be deposited via pipette as they otherwise would not be able to be easily
manipulated by a pipette. Thorough mixing was identified visually by a lack of changes in
refractive index and particulates.
For certain samples, it was necessary to use the adhesives inside an inert atmosphere
glove box. Since the raw materials and the solutions were all prepared in air, oxygen and water
were removed by bubbling dry nitrogen through them overnight. The solutions were then
immediately sealed in their glass bottle under dry nitrogen and placed in the glove box. This
procedure was used as the solutions contain some volatile components which may have been
lost using a vacuum de-gassing process.
For phyllosilicate composites, Cloisite 15A was found to be more soluble in the
adhesives than Cloisite 10A and was therefore used for all UV curing acrylate-phyllosilicate
composites. Cloisite 15A was measured as a powder using a balance and then added to the
adhesive solution. For some earlier composites, the phyllosilicate was added to the solution and
allowed to fully mix before the addition of the photo-initiators. However, this was later changed
to the phyllosilicate being added after the photo-initiators were already well mixed into the
solution. This is because the composites had a milky appearance which made it difficult to
visually confirm if the photo-initiators had fully mixed into the solution.
Zeolite composites used a slightly different method than the phyllosilicates. Because the
zeolites could not be dried under vacuum after addition to the adhesive, they were instead dried
using a Mettler Toledo HX-204 moisture analyzer at 130°C. The particles were then
immediately sealed in a vial under dry nitrogen and placed into an inert atmosphere glove box.
The fully mixed adhesive, including photo-initiators, was also entered into the glove box as
previously described. The dry zeolite particles were then measured as a powder using a balance
and added to the adhesive solution in the glove box. The solution was then mixed via magnetic
stirring in the glove box. The glass bottle of the adhesive solution was then sealed and removed
from the glove box for sonication. Immediately following sonication, the solution was returned
to the glove box for continued stirring. This process of sonication and stirring was repeated as
needed until the solution was well mixed. Care was taken to never expose the solution itself to
air after the addition of the zeolites.

66
Curing
The curing of UV curing acrylate adhesives was carried out using two different lamps.
Curing parameters were confirmed for each lamp separately, however once validated the two
lamps were used interchangeably and considered to provide an equivalent cure. Curing
parameters were confirmed by FTIR-ATR. Parameters for curing include illumination time,
distance from the lamp, intensity of the lamp and type of atmosphere.
A medium pressure mercury lamp, Hönle UVASPOT 400/T-F, with a quartz filter was
used for curing in air and was located in a fume hood or ventilated bench. This lamp produces
a broad spectrum of wavelengths from approximately 200-600nm which can be seen in Figure
2.3. While the intensity of this lamp could not be adjusted, decreasing the distance from the
lamp to the sample does increase the intensity seen by the sample.
Figure 2.3 The spectrum of a Hönle UVASPOT 400/T-F lamp, as published by the manufacturer, is shown with the
vertical axis being Relative Instensity and the horizontal axis being Wavelength in units of nm.
The second UV lamp was located inside an inert atmosphere glove box and used light
emitting diodes (LED) as its source. This lamp, a DELOLUX 20/400, produced a narrow
spectrum of wavelengths with a peak at ~400nm. The structure supporting this lamp did not
allow for the distance between the lamp and the sample to change, however the control unit did
allow for the adjustment of the power supplied to the lamp (and therefore its intensity).
Corona Treatment
Surface treatments by a corona-type discharge were used to modify the surface energy
of substrates prior to bonding with an adhesive. The treatments were performed using a unit
which was incorporated into a roll-to-roll manufacturing line. Samples were affixed to the web

67
just in front of the corona unit using an adhesive tape and were removed immediately after
treatment, thus ensuring the treated surface of the substrate did not come into contact with any
rollers before or after treatment. From contact angle studies on PET surfaces previously
performed internally by the CEA Laboratoire des Modules Photovoltaïques Organiques, a
power of 250W with a web speed of 0.2m/min was selected for the operating parameters.
Other corona treats were also performed using a Vetaphone VE1A-A 620 unit which
was incorporated into a Grafisk Maskinfabrik roll-to-roll manufacturing line. Due to this unit’s
higher power, treatments were performed at 500W with a web speed of 0.4m/min. However,
the increased power of this unit was found to compromise the structural integrity of Oike VX
25T-2PO barriers as discovered in adhesion tests. Therefore this unit was deemed to be unsuited
for use on this project.
Coating
The coating of the adhesive solutions was performed via blade coating using an Erichsen
Coatmaster 509-MC located in a fume hood or ventilated bench or a Zehntner Testing
Instruments ZAA-2300 located inside an inert atmosphere glove box. These machines push the
liquid to be coated with a blade over a flat plate upon which the substrate is fixed. The thickness
of the resulting coating is controlled by the height of the blade over the surface, the speed at
which the blade moves, the temperature and the viscosity of the liquid. To simplify the coating
process and the optimization of the coating thickness, a speed of 25mm/s was used for all
coatings. In addition, all coatings were performed with the blade coater at 23-24°C with the
exception of MAM Nanostrength® composites containing zeolites, which were coated at 40°C.
The coating process was performed by fixing a clean substrate onto the flat plate using an
adhesive tape. The blade was then adjusted to the desired height and positioned over the
substrate. The arm of the blade coater which pushes the blade was then moved into contact with
the blade. The adhesive solution was then deposited along the leading edge of the blade via
pipette. To minimize variations in viscosity (and therefore final coating thickness) due to
solvent evaporation and/or temperature variations between the solution and blade coater, the
coating was performed as quickly as possible after deposition of the adhesive solution.

68
Lamination and Encapsulation Methods
Pressure Sensitive Adhesives
Both the commercially available pressure sensitive adhesives supplied in this form and
laboratory prepared coatings of pressure sensitive adhesives were laminated using one of two
procedures: dual roller lamination or weighted hand rolling. For both techniques, the adhesive
and substrate are prepared in the same manner. Firstly, both the substrate and adhesive were cut
to the approximate size of the final sample. Since it can be difficult to have a perfect alignment
during lamination, it was found to generally be simpler and more accurate to cut the sample to
its correct dimensions after lamination. The surface of the substrates was then prepared in the
desired manner (solvent rinse, sonication in solvent, corona treatment). The next step is to
remove the protective liner (if present) from one side of the adhesive, thus leaving the adhesive
exposed on one side and protected by either a substrate or a second protective liner on the other
side.
At this stage, the two lamination processes differ slightly. Dual roller laminations were
performed using a Dynachem ML-3024 laminator on a Teflon coated glass carrier with a total
thickness of 3.35mm, a roller air pressure of 4bar and a speed of 0.5m/min. This machine,
pictured in Figure 2.4, uses two rubber coated rollers which turn in opposite directions (one
clockwise and one counter-clockwise). The sample is then placed between the two rollers which
provide the pressure needed for lamination. The gap between the rollers can be controlled using
compressed air. Despite the fact that the amount of air pressure directly influences the pressure
the rollers apply to the sample, it should be noted that the actual pressure applied to the sample
is unknown. To perform a lamination with this machine, the substrate is first fixed to the carrier.
The adhesive is then aligned by sight and allowed to contact the leading edge of the substrate.
The carrier is then inserted between the rollers while attempting to minimize contact between
the adhesive and the substrate before entering the rollers. This machine is particularly useful
for larger samples, though the large size of the machine itself prevents its use inside a glove
box.

69
Figure 2.4 (a) A Dynachem ML-3024 laminator such as the one used in this thesis is shown. (b) A close up of a lamination
of two flexible films using the Dynachem ML-3024 is shown. The tan Teflon coated glass plate is advanced through the
red rollers which push the two flexible films into contact.
For those samples using the weighted hand roller technique, the substrate is placed onto
a flat surface with the surface to be laminated facing upward. The adhesive was then aligned
by hand and laminated carefully to the substrate. The weighted hand roller provides the pressure
to ensure good contact between the surfaces and to limit the number of bubbles. The roller,
which can be seen in Figure 2.5, conforms to the PSTC-101 standard and is made of a 45mm
wide steel roll (ϕ 83mm) with a 6.25mm outer coating of a rubber with a Shore A hardness of
80. The mass of the roller portion is 2.045kg. The weighted hand roller is particularly useful
for smaller samples and was used for all laminations inside the glove box.
Figure 2.5 The weighted hand roller used for laminating samples is shown. The gray, soft rubber coating on the metallic,
heavy, steel roller is clearly visible in the image.
For both methods, the type of sample being made determined the next step. For samples
which were not for encapsulation of calcium coupons or OPV cells, any remaining protective
liners were removed and any remaining laminations subsequently performed in the same
manner. For samples involving encapsulation, moisture was then removed from the adhesive

70
coated substrates by drying in a vacuum oven at 80°C / 1-5mbar for a least two days followed
by a cool down to 30°C while still under vacuum. Samples containing zeolites had an additional
first temperature step at 130°C for 30-60min before cooling to 80°C for the standard drying
procedure. For ease of handling and to prevent movement of the samples as atmosphere was re-
introduced, two glass microscope slides were placed on opposite edges of each sample before
the drying step. Once the vacuum oven had returned to 30°C, samples were removed and rapidly
placed inside an inert atmosphere glove box. Once in the glove box, the glass microscope slides
were removed and the object to be encapsulated was positioned onto the adhesive by hand. A
second adhesive coated substrate was then laminated on top using a weighted hand roller.
UV Curing Acrylates
The liquid nature of UV curing acrylates required the use of a different encapsulation
method as compared to the pressure sensitive adhesives. The substrates were first cut to the
approximate size of the final sample. Just as with PSA laminations, it can be difficult to have a
perfect alignment during lamination, thus it was generally found to be simpler and more
accurate to cut the sample to its correct dimensions after lamination. Substrates were surface
treated as desired (solvent rinse, sonication in solvent, corona treatment) and then dried in
vacuum oven at 80°C / 1-5mbar for a least two days followed by a cool down to 30°C while
still under vacuum. The substrates were then rapidly moved to the glove box. The substrates
were then coated with adhesive inside the glove box as previously described. The object to be
encapsulated was immediately laminated onto an adhesive coated substrate by hand. A second
adhesive coated substrate was then laminated on top also by hand. The laminated sample was
then immediately cured as required by the adhesive. The sample was then flipped over and
cured for a second full cycle in order to ensure that areas underneath the encapsulated object
were well cured.
Aging Conditions
For experiments requiring aging, artificial accelerated conditions were used in order to
minimize testing time and ensure that conditions remained consistent for all samples. Two
different aging conditions were used depending on the specific study: accelerated moisture and
accelerated photo-stability testing.

71
Accelerated Moisture
Accelerated moisture aging was performed at 65°C and 85% relative humidity for all
testing regardless of sample type. These conditions were chosen as they correspond to the ISOS-
D-3 standard, which uses the same conditions as described above for the damp heat aging of
organic photovoltaic devices without illumination. These conditions were produced in a
humidity chamber using either a Dycometal CM-25/48 or a Clima Temperatur Systeme C-
40/100. For both chambers, samples were placed on shelves consisting of metal grids. An image
of samples inside a humidity chamber can be seen in Figure 2.6.
Figure 2.6 A sample for an optical calcium test (left) and an encapsulated OPV cell (right) are shown inside a humidity
chamber.
Accelerated Photo-Aging
Accelerated photo-aging was performed using an Atlas Material Testing SEPAP 12/24.
In this apparatus, seen pictured in Figure 2.7a, samples are placed in metal sample holders
which are attached to a carousel that rotates in the center of four 400W medium pressure
mercury lamps. The lamps produce a spectrum as seen in Figure 2.7b thus providing a large
dose of ultraviolet irradiation. The chamber ventilated to maintain a temperature of 60°C.

72
Figure 2.7 (a) The interior of a SEPAP 12/24 is shown with an empty carousel and the four UV lamps. (b) The spectrum
of the UV lamps used in a SEPAP 12/24 is shown as provided by the manufacturer.
Experimental Techniques
Spectroscopic Techniques
Transmission Fourier Transform Infrared Spectroscopy (FTIR)
All testing was performed using a Thermo Electron Corporation Nicolet 5700 and
analyzed using Omnic 8.3 software. Measures were made in absorbance mode with 32 scans
per measure. Measures were made on both free standing films and thin coatings on potassium
bromide substrates.
Attenuated Total Reflection Fourier Transform Infrared
Spectroscopy (FTIR-ATR)
Attenuated total reflection (ATR) is a variant of infrared spectroscopy used to probe the
chemical structure of thin surface layers. The difference between ATR and transmission FTIR
lies in the test configuration, as the basic principles are the same for both techniques. In ATR,
the laser is passed through a crystal at an angle which produces total internal reflection. The
sample to be measured is placed on top of this crystal with care taken to ensure good contact
between the sample and the crystal. As the light reflects off the interface between the crystal
and sample, it penetrates slightly into the sample thus allowing for the absorption of the
73
frequencies corresponding to specific resonant vibrations of the covalent bonds in the sample.
The exact penetration depth, described in Equation 2.1, is dependent on the exact refractive
indexes of the crystal and sample at the wavelengths being tested but is generally on the order
of a few microns for polymeric samples on a diamond crystal.
Testing was performed using a Thermo Electron Corporation Nicolet 5700 with a
SmartOrbit single reflection diamond ATR crystal attachment. This crystal provides a
penetration depth generally in the range of 0.7-2 μm depending on the refractive index of the
material being measured. Measures were made in absorbance mode with 32 scans per measure.
All samples used Omnic 8.3 software for analysis. For solid samples, the surface to be measured
was pressed onto the crystal by hand and held in place by a metal point on the ATR attachment.
Liquid samples were made by depositing a drop of the sample onto the crystal via pipette. The
crystal was always wiped with ethanol, isopropanol, and/or acetone before and after each
measure regardless of the type of material being tested.
Ultraviolet-Visible Spectroscopy (UV-Vis)
All UV-Vis testing was performed using a Shimadzu UV-2600 spectrometer
controlled using UVProbe 2.42 software. Scans were performed over a range of wavelengths
from 200-800nm. Both direct and integrating sphere detectors were used depending on the
measure.
Thermo-mechanical Testing
Dynamic Mechanical Thermal Analysis (DMTA)
DMTA is a technique for measuring the viscoelastic properties of a material over a range
of frequencies and/or temperatures. This machine applies a cyclic load to a sample and has the
ability to control the force, frequency, strain and temperature. The cyclic nature of the loading
causes a time or frequency shift between the stress and the applied load in the case of
viscoelastic materials. The mathematical treatment of the shifted signals allows for the
separation of their in-phase and out-of-phase components, thus leading to the calculation of an
elastic (energy storage) component of the mechanical modulus of the sample (E’), and a viscous
(energy loss) component (E”) of that same modulus.

74
All testing was performed with a TA DMA Q800 with a liquid nitrogen cooling unit.
Tests were performed in tension mode using a strain of 0.1%, a constant frequency of 1Hz and
a temperature sweep from -70°C to 120°C or until failure of the sample. Samples were analyzed
using TA Universal Analysis 2000 4.2E software.
Differential Scanning Calorimetry (DSC)
DSC measures the difference in heat flow between a sample and a reference in order to
illuminate various thermal changes in a sample. These changes include melting, glass transition,
evaporation and chemical reactions and can be either exothermic or endothermic in nature.
Measures were made using a Mettler Toledo DSC 822 controlled with STARe 11.00
software or a TA DSC Q20 using TA Universal Analysis 2000 V4.2 software. All tests were
performed using a temperature sweep at a constant heating rate, with most samples tested from
-70°C to 140°C, though some samples used slightly different ranges depending on the material
being tested. Regardless of the sweep range, the same heating/cooling profiles were used. Tests
began with a 5min isothermal hold at the minimum temperature then ramped at 10°C/min to
the maximum temperature. This was followed by a cooling cycle back to the minimum
temperature with an isothermal hold for 5min once the minimum temperature was reached.
Finally the sample was heated for a second time at 10°C/min. When possible, values from the
second heating run were used for analysis.
T-Peel Adhesion
T-peeling is a technique to measure adhesion when using two flexible substrates. In this
technique, the two substrates are pulled apart at 180° to each other and the force is measured as
a function of the distance peeled. The value is reported as peel strength and is the average force
per unit of width (i.e. N/cm). It should be noted that this value can change as a function of
adhesive thickness and substrate thickness even for the same bonding conditions.
In order to accurately compare samples, an adhesive thickness of 50μm was used
whenever possible. Samples with different adhesive thicknesses are noted as such. All testing
was performed to PSTC 101 standards with a sample width of 24mm and a peeling rate of
300mm/min. The testing was performed using an Instron 3365 electromechanical load frame
equipped with a 50N load cell. The testing configuration can be seen in Figure 2.8. The reported
average peel strength for each individual sample does not include the first and last 10% of the
peeling distance in order to avoid edge effects. Whenever possible, at least 4 individual samples

75
were tested for each condition and the reported peel strength is an average of all individual
samples.
Figure 2.8 A diagram of a T-peel adhesion sample with blue representing the substrates, yellow representing the
adhesive, and red arrows showing the directions of the directions of the applied forces is shown in (a) an un-bent top
view and (b) a bent side view. (c) An image of a T-peel adhesion sample in the load frame during a test is shown. The
upper clamp moves away from the fixed bottom clamp at a constant speed of 300 mm/min.
Microscopy
Atomic Force Microscopy (AFM)
AFM uses an extremely fine tipped cantilever to probe the surface of a material. The
displacement of the tip as it interacts with forces from the surface being observed is able to
provide information on the surface roughness and phase domains of the material. In tapping
mode, as was used for all images in this thesis, the tip is oscillated up and down by a
piezoelectric element at the base of the cantilever. The deviations in the oscillation of the tip
are measured using a laser and allow for the imaging of the surface based on the forces acting
on the tip as it approaches the surface. In this manner the topography, or height, of the surface
can be measured. In addition, phase shifts in the oscillation can be caused by viscoelastic and
adhesion properties of the material being imaged as they dissipate the energy of the tip. This
allows for phase images which can show different domains and morphology even for flat
samples.
All AFM images used in this thesis were taken using a Veeco Nanoscope IIIA mounted
on an air pressure table to minimize vibrations. A digital camera was used to precisely position

76
the tip. Images were taken in tapping mode using a phosphorous doped silicon tip with a radius
of <15nm and a depth of 20µm.
Transmission Electron Microscopy (TEM)
TEM is a versatile imaging technique in which measures the transmission of an electron
beam across a sample. In the bright field technique used in this thesis, the resulting image is
created by differences in electron density within the sample which scatter the electron beam.
The transmitted beam then interacts with a detector which fluoresces to produce an image. The
image is then in turn captured by the CDD camera. In this manner, more electron dense regions
appear darker than those with lower electron density.
All images were taken using a Hitachi H7650 120kV operating with an electron beam
at 80kV and equipped with a Hanamatsu AMT HK 1K x 1K CDD camera. Samples were
prepared by evaporating a dilute solution on a carbon grid. All images were taken with the aid
of the staff of the Centre Hospitalier Universitaire de Clermont-Ferrand where the microscope
was located.
Other Testing
Optical Calcium Test
For a detailed description of the optical calcium test please refer to Chapter 3, which
provides an in-depth explanation of this test.
Optical calcium test measures for this project used an Olympus Optical Co. DP70
Microscope Digital Camera controlled using Olympus DPController 1.2.1.108 software.
Images were analyzed using ImageJ software (Wayne Rasband, National Institutes of Health)
using the plugins TurboReg and StackReg (P. Thévenaz, U.E. Ruttimann, M. Unser, Ecole
Polytechnique Federal de Lausanne). The light source, though replaced occasionally throughout
the project, was always a Coherent ML-0405 cold cathode backlight panel. A foam tape was
place around the perimeter of the light source in order to elevate the samples above the surface
of the light source. This was done to protect the surface from scratches caused by the sample
holders. The camera was fixed vertically over the light source and placed inside a wooden light
blocking enclosure in order to avoid background light from affecting the images. The
experimental set up used for imaging can be seen in Figure 2.9.

77
Figure 2.9 (a) A diagram of the configuration used for imaging in the optical calcium test is shown next to (b) an image
of the actual apparatus.
Calcium deposits were made onto Melinex 401 PET substrates with dimensions of 5cm
x 5cm x 50μm which were cleaned by sonication in isopropyl alcohol and then dried for at least
2 days at 80°C under vacuum (1-5mbar) followed by cooling to 30°C while still under vacuum.
The deposits of calcium were made via physical vapor deposition under vacuum (10-5-10-
6mbar) using a shadow mask. The deposition rate was always <2nm/s as measured by a quartz
microbalance incorporated into the evaporation chamber. The evaporation chamber was located
inside an inert atmosphere glove box and all subsequent storage and handling of the calcium
deposits before testing was performed in an inert atmosphere so as to minimize the oxidation
of the deposit.
Dynamic Light Scattering (DLS)
DLS is a technique which can be used upon true solutions of polymer molecules or upon
dispersions of particles in an inert liquid. In this thesis, the latter case was used exclusively. It
allows for the determination of the particle size distribution for nanoparticles dispersed in the
liquid medium. A laser is passed through a dilute dispersion of the particles which scatter the
light. The constructive and destructive interference patterns of the scattered light vary as a
function of time due to the Browian motion of the particles. These variations, along with
knowledge of the solvent and composition of the particle, allow for the calculation of the
relative amounts of particles of different sizes through mathematical models which exploit a
spatial-temporal second order correlation function. This function is valid for a given type of
particle dispersed in a given liquid medium.

78
All tests used a Malvern Instruments Zetasizer ZEN3600 with a 633nm, 4mW He-Ne
laser. Analysis was performed using Malvern Instruments Zetasizer 7.02 software.
Moisture Content Analysis
The analysis of the moisture content is performed by heating the material to be measured
and recording the mass change as a function of time. Once the rate of mass loss falls below a
specified value, the material is considered to be dry. The loss of mass due to the evaporation of
volatile components is reported as a percentage of the initial mass.
Moisture content analysis was performed using a Mettler Toledo HX204 Moisture
Analyzer. Drying was performed isothermally at 130°C until the rate of mass loss fell below
1mg / 140s. The typical sample size was 1-2g in initial mass.
Current Density – Electric Potential Characterization (J-V)
J-V characterization is a method to measure the performance of photovoltaic devices.
In this test, a device is cycled through a range of electric potentials while measuring the electric
current. This testing can be done with or without illumination of the photovoltaic device
depending on the desired properties to be measured. From this measurement many different
properties of the device can be measured including the power conversion efficiency, short
circuit current density, open circuit voltage, fill factor, series resistance, shunt resistance, leak
current and others.
Two sets of equipment were used: one in air and one integrated with a nitrogen
atmosphere glove box which allowed for the device to be measured to remain in an inert
atmosphere. The apparatus in air used a Keithley 2602A Sourcemeter and illumination from a
Newport Oriel 92190 solar simulator with an Oriel 62771 1600W xenon arc lamp which
provided an AM 1.5 spectrum and an intensity of 100mW/cm2. This experimental set up can be
seen in Figure 2.10a. The apparatus integrated with a glove box used a Keithley 2400
Sourcemeter and illumination from a Newport Oriel 9403A-SR1 solar simulator with an Oriel
6280NS 450W xenon arc lamp which provided an AM 1.5 spectrum and an intensity of
100mW/cm2. The experimental set up for this lamp is shown in Figure 2.10b. For both sets of
equipment, analysis was performed using software developed in-house by the CEA.

79
Figure 2.10 The configurations of the equipment for J-V characterization are shown. (a) The solar simulator in air is
positioned to shine light downward onto the sample to be measured and is surrounded by a light blocking enclosure
(pictured partially open to show the sample) for safety reasons. (b) The simulator which is integrated into the inert
atmosphere glove box is situated underneath the glove box in air. The light is shone upward through a window into the
glove box where (c) the sample is positioned. Several different types of electrical connections are available to ease the
measuring of samples with various different geometries.

80

81
Chapter 3: Development and
Optimization of the Optical
Calcium Test
Introduction
As previously discussed in Chapter 1, the OPV barrier requirements necessitate the use
of materials with very low gas permeation rates which can often be difficult to measure.
However, most of the techniques available for the measurement of permeation are designed for
the measurement of films. Due to their soft and often sticky nature, these techniques are
generally impractical for the measurement of flexible adhesives. However, there are several
techniques which have been designed to measure adhesives, namely indicator paper and the
lateral version of the optical calcium test. Indicator paper is significantly less sensitive than a
calcium probe and can require longer measurement times to achieve a qualitative assessment
of water permeation. For this reason the lateral version of the optical calcium test is generally
the preferred method despite its requirement for sample preparation in inert atmosphere.
This version of the optical test is based upon the assumption of impermeable substrates
which block any orthogonal permeation. Therefore all calcium degradation can be attributed to
lateral permeation. While this is a powerful technique for the evaluation of the water vapor
barrier properties of an adhesive, it does contain a major flaw for flexible encapsulation: the
interfaces. In order to achieve the level of impermeability required to fit the model, thick silica
glass substrates are used. A rigid silica glass plate can present a surface which is vastly different
from a flexible multi-layer barrier film, even if the surface of the film is a thin SiOx barrier
layer. More commonly, the surface of a flexible multi-layer barrier film in contact with the
adhesive is a polymer. The lower surface energies of many polymers can make adhesion to their
surfaces more challenging than silica glass. This different, and usually weaker, interface makes
it difficult to truly evaluate the lateral permeation into a device since the lateral permeation
depends not only on the bulk permeation rate of the adhesive, but also the interfacial permeation
rate. Therefore, for a more accurate evaluation of an adhesive for encapsulating OPV devices,
a lateral optical calcium test should use the same flexible barrier film that is used for
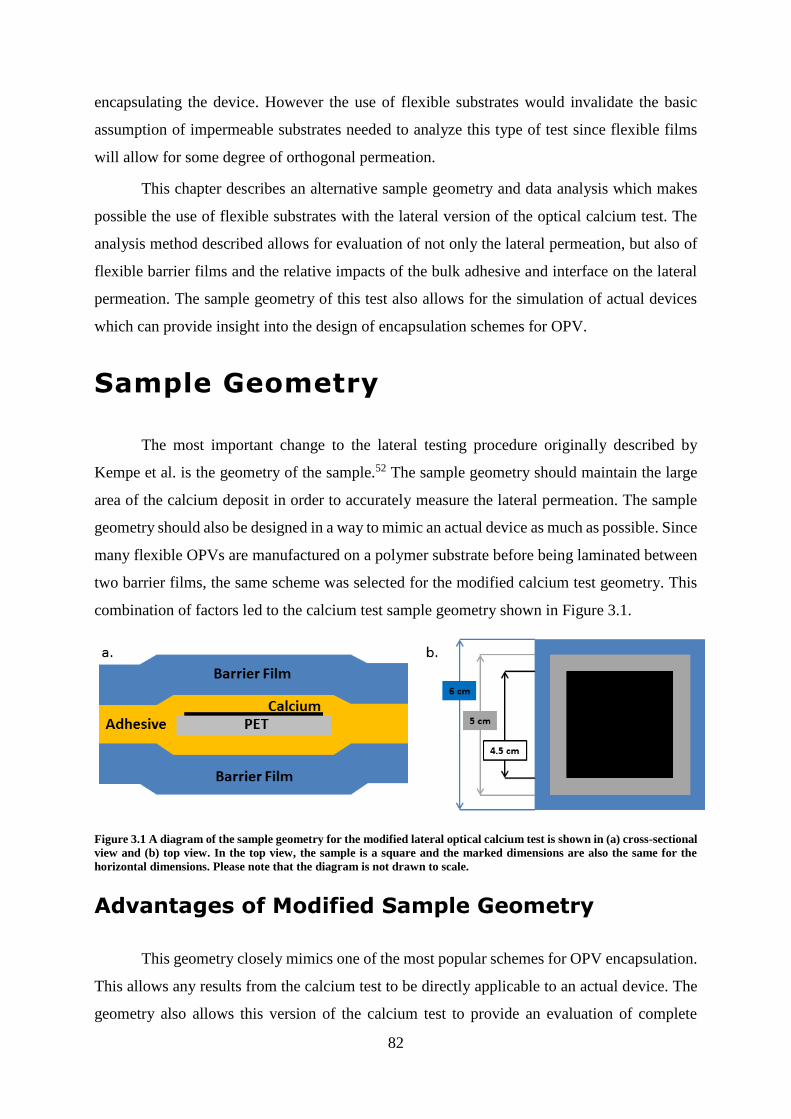
82
encapsulating the device. However the use of flexible substrates would invalidate the basic
assumption of impermeable substrates needed to analyze this type of test since flexible films
will allow for some degree of orthogonal permeation.
This chapter describes an alternative sample geometry and data analysis which makes
possible the use of flexible substrates with the lateral version of the optical calcium test. The
analysis method described allows for evaluation of not only the lateral permeation, but also of
flexible barrier films and the relative impacts of the bulk adhesive and interface on the lateral
permeation. The sample geometry of this test also allows for the simulation of actual devices
which can provide insight into the design of encapsulation schemes for OPV.
Sample Geometry
The most important change to the lateral testing procedure originally described by
Kempe et al. is the geometry of the sample.52 The sample geometry should maintain the large
area of the calcium deposit in order to accurately measure the lateral permeation. The sample
geometry should also be designed in a way to mimic an actual device as much as possible. Since
many flexible OPVs are manufactured on a polymer substrate before being laminated between
two barrier films, the same scheme was selected for the modified calcium test geometry. This
combination of factors led to the calcium test sample geometry shown in Figure 3.1.
Figure 3.1 A diagram of the sample geometry for the modified lateral optical calcium test is shown in (a) cross-sectional
view and (b) top view. In the top view, the sample is a square and the marked dimensions are also the same for the
horizontal dimensions. Please note that the diagram is not drawn to scale.
Advantages of Modified Sample Geometry
This geometry closely mimics one of the most popular schemes for OPV encapsulation.
This allows any results from the calcium test to be directly applicable to an actual device. The
geometry also allows this version of the calcium test to provide an evaluation of complete

83
encapsulation schemes or encapsulation process changes which would otherwise require testing
with functional devices. Compared with a functional device, a calcium probe is more sensitive
to water (i.e. shorter testing time), simpler to prepare, and degrades much more predictably as
the stability of individual devices can vary greatly. Though testing with actual devices is still
necessary to evaluate the effects of the encapsulation materials and processing on the device
itself, this version of the calcium test as a screening process provides a faster, simpler and more
accurate measure of permeation.
The size of the calcium deposit also provides advantages to this sample geometry. Just
as with the geometry proposed by Kempe et al., the larger area of the calcium deposit compared
to other optical calcium tests allows for a longer period of observation of the lateral permeation,
and therefore a more accurate measure of this permeation. The area of the deposit also has
another important characteristic in that it allows for the measure of both the lateral and
orthogonal permeation at the same time. Since calcium rapidly consumes water, the
concentration of water at the surface of the calcium is very low. For the case of lateral
permeation this leads to a visualization of the permeation front where the edge of the calcium
deposit is the leading edge of the front. On the degraded side of the calcium, permeated water
is present while on the metallic side of the calcium the concentration of laterally permeated
water is negligible. This means that regions with metallic calcium have not been affected by
lateral permeation. As a result, any measured changes in the calcium in the interior of the
deposit cannot come from lateral permeation and must be due to orthogonal permeation. This
makes possible the measurement of both the lateral and orthogonal permeation on a single
sample as long as a measureable area of metallic calcium is present. The larger area of the
calcium deposit is therefore extremely helpful as it creates a larger region of calcium in which
to measure the orthogonal permeation.
The impetus for designing this sample geometry comes from the interfaces of glass
substrates which are quite different than those seen in flexible encapsulation. As such, this
geometry also recreates the same types of interfaces present in an actual device. This allows for
an evaluation of the interfacial permeation as well. The exact method of how this is achieved is
detailed in the section on “Modeling and Analysis”.
Limitations of Modified Sample Geometry
Though this sample geometry remedies several of the problems with other published
geometries, it also creates several problems. If either the barrier film or the adhesive is a poor

84
barrier, it may only be possible to measure just the poor barrier material. If too much calcium
is degraded too quickly from either lateral or orthogonal permeation, there may not be sufficient
data to accurately characterize the other permeation pathway. For example a poor adhesive may
cause most of the calcium to degrade rapidly leaving a very small region to measure orthogonal
permeation over a very few time points, thus preventing accurate characterization of the barrier
film. Conversely, a poor barrier film could lead to the degradation of too much calcium before
the lateral permeation front has reached the edge of the calcium deposit and thus prevent the
measurement of the lateral permeation. However, this type of problem is not common as poor
barrier materials are rarely considered for use in encapsulating sensitive devices.
One reason why other lateral optical calcium tests use thick glass substrates is to prevent
orthogonal permeation. This allows for the lateral permeation to be modeled using the
assumptions that the calcium thickness is constant and that all water is due to lateral permeation.
The change in calcium thickness due to orthogonal permeation can be accounted for relatively
easily as described in the section on “Modeling and Analysis”. However, the change of the
lateral concentration gradient due to moisture from orthogonal permeation would greatly
complicate any quantitative model of lateral permeation. The concentration of water in the
adhesive over regions of metallic calcium would remain quite low as it is consumed rapidly by
the calcium, thus having only a small impact on the assumption that the water concentration at
an infinite permeation distance, C∞, is zero. The problem arises in the regions behind the
permeation front. In this region the concentration of water will become elevated due to water
vapor which has permeated across the barrier films. This causes a change in the lateral
concentration gradient which can lead to error when calculating quantitative values for lateral
permeation. While this can have a detrimental effect on quantitative values, the qualitative
assessment of lateral permeation in the system actually becomes more applicable as a similar
effect occurs in actual devices.
Modeling and Analysis
The previously described changes to the sample geometry necessitate modifications to
how the data acquired from this test is analyzed. This section details the modeling and analysis
used to treat the images acquired via this version of the lateral optical calcium test.
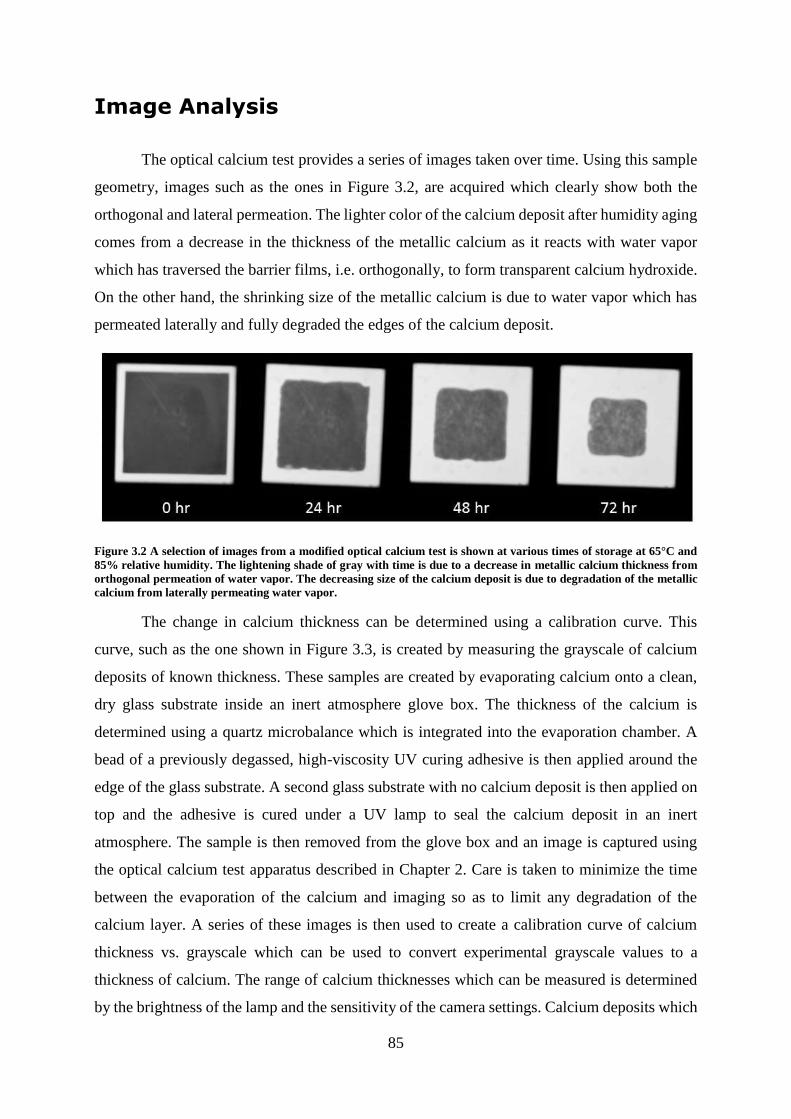
85
Image Analysis
The optical calcium test provides a series of images taken over time. Using this sample
geometry, images such as the ones in Figure 3.2, are acquired which clearly show both the
orthogonal and lateral permeation. The lighter color of the calcium deposit after humidity aging
comes from a decrease in the thickness of the metallic calcium as it reacts with water vapor
which has traversed the barrier films, i.e. orthogonally, to form transparent calcium hydroxide.
On the other hand, the shrinking size of the metallic calcium is due to water vapor which has
permeated laterally and fully degraded the edges of the calcium deposit.
Figure 3.2 A selection of images from a modified optical calcium test is shown at various times of storage at 65°C and
85% relative humidity. The lightening shade of gray with time is due to a decrease in metallic calcium thickness from
orthogonal permeation of water vapor. The decreasing size of the calcium deposit is due to degradation of the metallic
calcium from laterally permeating water vapor.
The change in calcium thickness can be determined using a calibration curve. This
curve, such as the one shown in Figure 3.3, is created by measuring the grayscale of calcium
deposits of known thickness. These samples are created by evaporating calcium onto a clean,
dry glass substrate inside an inert atmosphere glove box. The thickness of the calcium is
determined using a quartz microbalance which is integrated into the evaporation chamber. A
bead of a previously degassed, high-viscosity UV curing adhesive is then applied around the
edge of the glass substrate. A second glass substrate with no calcium deposit is then applied on
top and the adhesive is cured under a UV lamp to seal the calcium deposit in an inert
atmosphere. The sample is then removed from the glove box and an image is captured using
the optical calcium test apparatus described in Chapter 2. Care is taken to minimize the time
between the evaporation of the calcium and imaging so as to limit any degradation of the
calcium layer. A series of these images is then used to create a calibration curve of calcium
thickness vs. grayscale which can be used to convert experimental grayscale values to a
thickness of calcium. The range of calcium thicknesses which can be measured is determined
by the brightness of the lamp and the sensitivity of the camera settings. Calcium deposits which

86
are too thick will register as completely black/opaque while deposits which are too thin appear
as white/transparent. The validity of the calibration curve is verified before every test using a
reference sample of tinted PET which is stored in the dark at room temperature. The thickness
of calcium was then converted to a mass of permeated water via the stoichiometry of the
reaction of calcium and water to form calcium hydroxide.
Figure 3.3 A calibration curve for the modified optical calcium test shown where 0 grayscale is completely black and
250 grayscale is completely white. Each point represents a calibration sample. The curve is a polynomial fit of the data.
To avoid the increased potential for error as the curve steepens at the ends, samples were prepared to have calcium
thicknesses which correspond to the central part of the curve.
Orthogonal Permeation
To measure the orthogonal permeation, the change in the grayscale values over time
was used. To avoid the inclusion of degradation due to lateral permeation, a Central Zone was
defined in the center of the calcium deposit. The boundaries of the Central Zone, such as the
one seen in Figure 3.4, were defined so that no point within the zone was ever subjected to
lateral permeation throughout the test. Using only the data from within the Central Zone, the
orthogonal permeation can be found. A mean grayscale value for the Central Zone is calculated
for each image and these values are used for all subsequent calculations.
0
20
40
60
80
100
120
140
160
0 25 50 75 100 125 150 175 200 225 250
Ca
Thic
knes
s (n
m)
Mean Grayscale

87
Figure 3.4 A selection of images from a modified optical calcium test is shown at various times of storage at 65°C and
85% relative humidity. The red region represents the Central Zone which remains unaffected by lateral permeation for
the duration of the test.
By plotting the mass of permeated water in the Central Zone against time, such as in
Figure 3.5, a curve typical for the permeation of a gas across a membrane is obtained. The
elevated temperature and humidity used for testing generally led to a very short time lag and
the rapid achievement of steady state permeation, which prohibited the presence of a clear
transient region on the curve. The slope of the linear portion of the curve provides a mass
transfer rate which is easily converted to a WVTR by dividing by the area of the Central Zone.
It should be noted that the WVTR of the barrier film itself is one half the total orthogonal
WVTR as there is one film on each side of the calcium probe.
Figure 3.5 A plot of the permeated water vapor per unit area is shown as measured in the Central Zone of a modified
optical calcium test sample. The barrier film used for this sample was 3M FTB3-50 and the storage conditions were
0
0.002
0.004
0.006
0.008
0.01
0.012
0.014
0 0.5 1 1.5 2 2.5 3 3.5
Sigm
a (g
/m^
2)
Time (days)

88
65°C and 85% relative humidity. The linear nature of the curve with no clear transient region indicates a very short
time lag and the rapid establishment of steady state permeation.
The previously discussed modified sample geometry presents neither a completely
extrinsic nor a completely intrinsic measurement. Extrinsic measures use gas spacers to disperse
orthogonally permeated water vapor more evenly across the sample. However a gas spacer
would also disperse lateral permeation thus making it impossible to distinguish between the
two. However, the calcium in the modified sample geometry also is not evaporated directly
onto an inorganic barrier as is done with intrinsic measures. Instead, a combination of both
behaviors is seen with the character of each sample being highly dependent on the materials
being tested and their exact architecture. While polymers are not nearly as effective at
dispersing water vapor as a gas spacer, they will disperse the water vapor to some extent. While
a detailed study is needed to confirm the exact mechanisms, the available evidence has led to
the following hypothesis for the mechanisms.
As water vapor exits a defect in the final inorganic barrier layer of a barrier film and
enters an adjoining polymer layer which contains no permeant, (i.e. an adhesive in contact with
a calcium deposit), it has an equal probability to diffuse in all directions except those blocked
by the inorganic barrier layer. If there is another such defect in close proximity, the diffusion
fronts from each defect will merge. If there are many defects in close proximity a limiting case
of a single 1-D diffusion front is achieved as shown in Figure 3.6a. This limiting case would
lead to an extrinsic calcium test. On the other hand, if the defects are spaced far enough apart
that they do not interact, an intrinsic calcium test would result. The distance between defects
needed for mixing of the diffusion fronts is controlled by the distance between the final
inorganic barrier layer and the calcium deposit which corresponds to the thickness of the
polymer layers between the two. This effect is seen in Figure 3.6b. For smaller polymer
thicknesses, the permeating water can reach the calcium before it reaches the permeation front
of the closest defect. The limiting case of this would be direct contact between the calcium and
inorganic barrier layer – the geometry used for intrinsic calcium tests. Conversely, larger
polymer thicknesses make it more likely that permeating water will reach a neighboring defect’s
permeation front before reaching the calcium thus increasing the extrinsic behavior of the test.
If the polymer thickness becomes very large in comparison to the spacing of the defects, a
limiting case of fully extrinsic behavior is achieved. Therefore the degree of intrinsic and
extrinsic behavior is expected to be a function of the defects in the final inorganic barrier layer,
the thickness of any subsequent polymer layers in the barrier film, and the thickness of the
adhesive.

89
Figure 3.6 These cross-sectional diagrams show water vapor (blue) permeating though defects in an inorganic barrier
layer (red) and into a polymer layer (gray). (a) As the spacing between defects becomes smaller, the permeation fronts
become more convoluted until the limiting case of a single continuous permeation front is achieved. This means that
low defect densities will have more intrinsic behavior in calcium tests while higher defect densities will lead to a more
extrinsic calcium test. (b) At large polymer thicknesses the contact area of the water vapor with the calcium (black) is
very large and thus more extrinsic in nature. As the polymer thickness decreases, the behavior becomes more intrinsic
until the limiting case of a fully intrinsic calcium test is achieved.
The evidence for this hypothesis is not particularly strong at this time as no tests have
been performed using barriers with known defect sizes and densities. Additionally, it is difficult
to establish accurate ratios of extrinsic-to-intrinsic behavior. This determination is currently a
judgment of the researcher based on naked eye observation. This has led to only three categories
of behavior: highly extrinsic, mixed, and highly intrinsic. It should be noted that all three
categories are a mix of the two behaviors. Many tests with widely varying adhesive thicknesses
have been performed using the same barrier film (Oike VX 25T-2PO), however it has proven
difficult to draw any conclusions from this data. This is mainly due to the large variation in the
measured WVTR of the barrier film which indicates a large variance in the defects of the
inorganic barrier layers in the production of the film. The best evidence for this hypothesis
currently comes from the comparison of the Oike VX 25T-2PO barrier film to the 3M FTB3-
50a barrier film. The 3M film’s final barrier layer has a polymer coating of less than 2 microns
and uses an adhesive layer of only 25μm thickness. This is quite small compared to the Oike
film which has 25μm of PET over the final barrier layer and can be coated to high adhesive
thicknesses if desired. A comparison of typical samples for each film is shown in Figure 3.7
which clearly shows the increased intrinsic behavior of the 3M film in agreement with the
proposed hypothesis.
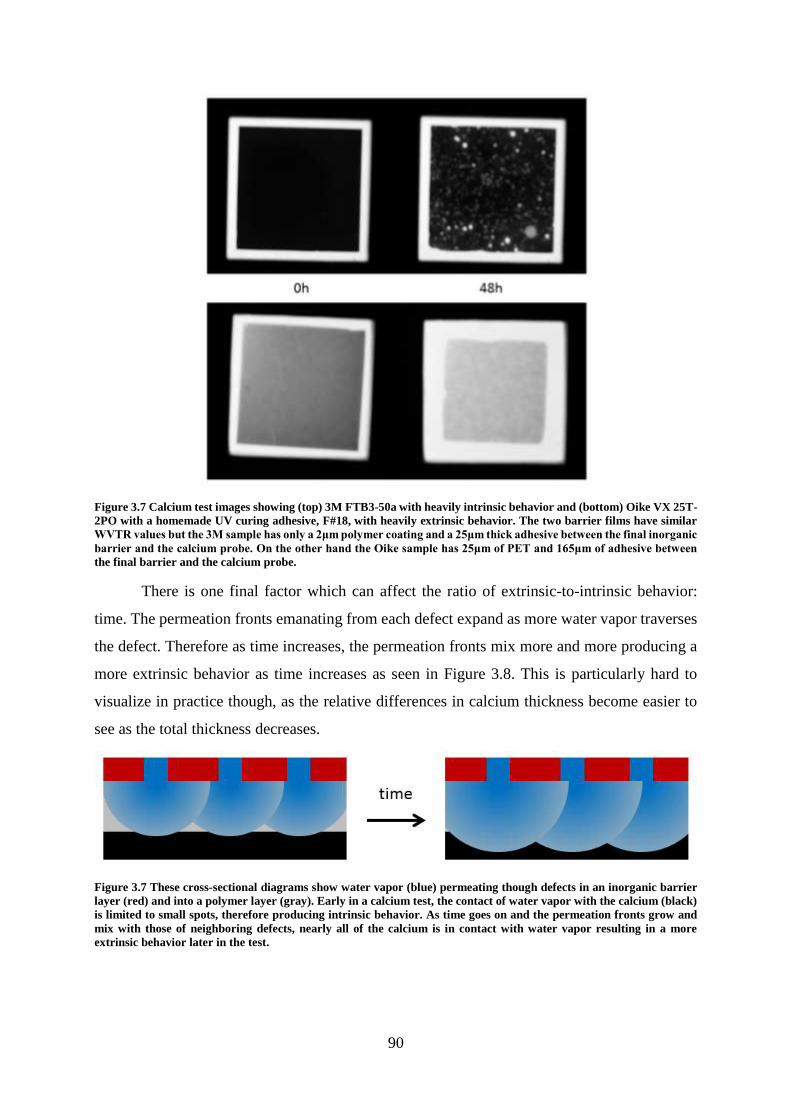
90
Figure 3.7 Calcium test images showing (top) 3M FTB3-50a with heavily intrinsic behavior and (bottom) Oike VX 25T-
2PO with a homemade UV curing adhesive, F#18, with heavily extrinsic behavior. The two barrier films have similar
WVTR values but the 3M sample has only a 2μm polymer coating and a 25μm thick adhesive between the final inorganic
barrier and the calcium probe. On the other hand the Oike sample has 25μm of PET and 165μm of adhesive between
the final barrier and the calcium probe.
There is one final factor which can affect the ratio of extrinsic-to-intrinsic behavior:
time. The permeation fronts emanating from each defect expand as more water vapor traverses
the defect. Therefore as time increases, the permeation fronts mix more and more producing a
more extrinsic behavior as time increases as seen in Figure 3.8. This is particularly hard to
visualize in practice though, as the relative differences in calcium thickness become easier to
see as the total thickness decreases.
Figure 3.7 These cross-sectional diagrams show water vapor (blue) permeating though defects in an inorganic barrier
layer (red) and into a polymer layer (gray). Early in a calcium test, the contact of water vapor with the calcium (black)
is limited to small spots, therefore producing intrinsic behavior. As time goes on and the permeation fronts grow and
mix with those of neighboring defects, nearly all of the calcium is in contact with water vapor resulting in a more
extrinsic behavior later in the test.

91
Lateral Permeation Measurement
The first step to analyze the lateral permeation is to isolate it from the orthogonal
permeation. This can be achieved through the use of a background subtraction of the orthogonal
permeation as measured in the Central Zone. To perform this calculation, a Global Zone is
defined which corresponds to the size of the calcium deposit at the start of the test. An average
grayscale of the Global Zone is calculated for each image and then converted to a mass of water.
Using the orthogonal permeation rate previously calculated for the Central Zone, the amount of
water which would permeate orthogonally in the Global Zone is calculated and subtracted from
the total measured amount of permeated water in the Global Zone for each image. The
difference can be attributed to lateral permeation. Because the mass of water calculated for each
image is based on the amount of calcium degraded, the changing thickness of the calcium
deposit does not affect the calculation of the lateral permeation.
However, the calculated value of the mass of permeated water grossly underestimates
the actual amount of water which has permeated into the sample laterally. This is due to the
presence of water vapor in the regions behind the edge of the permeation front. This region has
a concentration gradient with higher water vapor concentrations closer to the edge of the
sample. Using simulations, Michels et al. have proposed that the exact shape of this
concentration gradient is dependent on several factors and can vary from sample to sample.69
For this reason it is impossible to estimate the amount of water in the region behind the edge of
the permeation front unless the calcium test data is combined with other permeation testing and
computer simulations. Although the value of laterally permeated water calculated from the
calcium test does not provide an accurate quantitative value, it is still quite useful for relative
comparisons of different adhesives, edge seals and adhesive-to-barrier film interfaces.
When the mass of laterally permeated water is plotted against time, three unique regions
are visible as seen in Figure 3.8. At the beginning in Region I, little to no degradation is
observed as the leading edge of the permeation front has not reached the edge of the calcium.
In Region II, the curve then becomes fairly linear, though not perfectly so. The curve of both
the Global Zone and lateral permeation then begin to flatten and obtain a constant value in
Region III. It is not uncommon for individual samples to actually display an increase in the
amount of calcium at the end of the test even though this should not be possible. As the calcium
degrades, often small bubbles can form which eventually fill with water and expand as the
concentration of water vapor in the sample increases. These regions of water are not completely

92
transparent and refract light, often giving them a grayscale value in transmission measurements
if they become large enough. At the end of the test, little metallic calcium remains and these
water filled regions can be quite large, thus creating a non-negligible effect on the average
grayscale of the Global Zone. This is seen as the apparent darkening of the sample and thus the
flattening of the water permeation curves. Therefore, all calculations for lateral permeation are
limited to the region after the permeation front has reached the edge of the calcium but before
60% of the calcium deposit has been degraded, i.e. Region II.
Figure 3.8 The cumulative lateral permeation as measured by the modified optical calcium test is shown for a typical
sample (Oike VX 25T-2PO barrier films; 145μm of Sartomer S3 adhesive; 65°C; 85%RH). Three distinct regions are
visible. Region I shows little permeation as the permeation front has yet to reach the edge of the calcium deposit and
Region III is invalid due to testing artifacts. Therefore only Region II is used for calculations.
Within Region II of the lateral permeation curve, the experimental data is well modeled
using a linear function. While a square root of time dependence is expected for this transient
state permeation, it is not observed.52,66 The reason for this is not known but could come from
the change in calcium thickness due to orthogonal permeation, the effect of non-Fickian
interfacial permeation or other unknown causes. Regardless of the cause, a linear function is
used to model the lateral permeation observed during the test as it provides a relatively good
fit. This also allows for the calculation of an apparent permeation rate using the slope of the
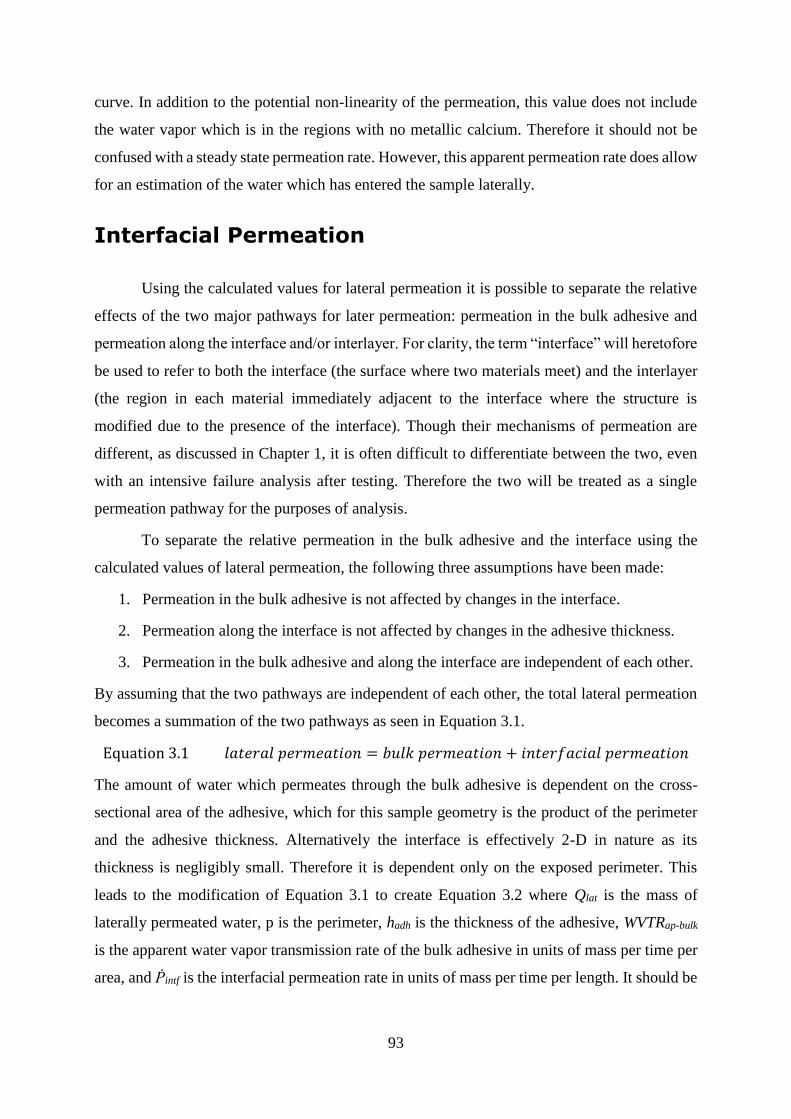
93
curve. In addition to the potential non-linearity of the permeation, this value does not include
the water vapor which is in the regions with no metallic calcium. Therefore it should not be
confused with a steady state permeation rate. However, this apparent permeation rate does allow
for an estimation of the water which has entered the sample laterally.
Interfacial Permeation
Using the calculated values for lateral permeation it is possible to separate the relative
effects of the two major pathways for later permeation: permeation in the bulk adhesive and
permeation along the interface and/or interlayer. For clarity, the term “interface” will heretofore
be used to refer to both the interface (the surface where two materials meet) and the interlayer
(the region in each material immediately adjacent to the interface where the structure is
modified due to the presence of the interface). Though their mechanisms of permeation are
different, as discussed in Chapter 1, it is often difficult to differentiate between the two, even
with an intensive failure analysis after testing. Therefore the two will be treated as a single
permeation pathway for the purposes of analysis.
To separate the relative permeation in the bulk adhesive and the interface using the
calculated values of lateral permeation, the following three assumptions have been made:
1. Permeation in the bulk adhesive is not affected by changes in the interface.
2. Permeation along the interface is not affected by changes in the adhesive thickness.
3. Permeation in the bulk adhesive and along the interface are independent of each other.
By assuming that the two pathways are independent of each other, the total lateral permeation
becomes a summation of the two pathways as seen in Equation 3.1.
Equation 3.1 𝑙𝑎𝑡𝑒𝑟𝑎𝑙 𝑝𝑒𝑟𝑚𝑒𝑎𝑡𝑖𝑜𝑛 = 𝑏𝑢𝑙𝑘 𝑝𝑒𝑟𝑚𝑒𝑎𝑡𝑖𝑜𝑛 + 𝑖𝑛𝑡𝑒𝑟𝑓𝑎𝑐𝑖𝑎𝑙 𝑝𝑒𝑟𝑚𝑒𝑎𝑡𝑖𝑜𝑛
The amount of water which permeates through the bulk adhesive is dependent on the cross-
sectional area of the adhesive, which for this sample geometry is the product of the perimeter
and the adhesive thickness. Alternatively the interface is effectively 2-D in nature as its
thickness is negligibly small. Therefore it is dependent only on the exposed perimeter. This
leads to the modification of Equation 3.1 to create Equation 3.2 where Qlat is the mass of
laterally permeated water, p is the perimeter, hadh is the thickness of the adhesive, WVTRap-bulk
is the apparent water vapor transmission rate of the bulk adhesive in units of mass per time per
area, and Ṗintf is the interfacial permeation rate in units of mass per time per length. It should be

94
noted that the apparent WVTRap-bulk is not a steady state WVTR but is still a material property
which is constant for the material at the same temperature and humidity.
Equation 3.2 𝜕𝑄𝑙𝑎𝑡
𝜕𝑡⁄ = 𝑝 ℎ𝑎𝑑ℎ 𝑊𝑉𝑇𝑅𝑎𝑝−𝑏𝑢𝑙𝑘 + 2 𝑝 �̇�𝑖𝑛𝑡𝑓
Experimentally, all values other than WVTRap-bulk and Ṗintf can be measured for a single sample.
Using the assumption that changing the adhesive thickness will not impact the interfacial
permeation, two samples with the same adhesive and interfaces but different adhesive
thicknesses would provide a system of two equations with two unknowns, thus allowing for the
calculation of WVTRap-bulk and Ṗintf. This means that the relative contributions of the bulk
adhesive and the interface to the lateral permeation can be calculated. As previously discussed
for the apparent lateral permeation rate, WVTRap-bulk and Ṗintf are not accurate values and
underestimate the amount of permeation. They do, however, provide the ability to elucidate
information about the relative contributions of the bulk adhesive and the interface to the lateral
permeation. This ability allows for a better understanding of where the weak points in the
encapsulation lie and whether changing the adhesive thickness or surface would be useful for a
particular combination of barrier film and adhesive.
Identification of Permeation
Pathways Using Reference Materials
Design of Experiment
The previously described modified version of the optical calcium test was used to
elucidate the relative importance of the different permeation pathways present in encapsulated
OPVs. This study was performed using reference materials which are commercially available.
The barrier film used for all tests was Oike VX 25T-2PO. The adhesive was the pressure
sensitive film 3M 467MP or 468MP, which are the same adhesive with thicknesses of 50μm
and 125μm respectively. All samples were encapsulated between two adhesive coated barrier
films with the lamination carried out inside an inert atmosphere glove box using a weighted
hand roller. This created a total adhesive thickness of 100μm and 250μm for the respective
adhesives. Please note that all data shown in this study has been adjusted so that the time is zero
for the first measurement after the lateral permeation front had arrived at the edge of the
calcium.

95
Modified optical calcium tests were performed on both adhesives with the same type of
barrier film and the same surface treatment in order see the effect of adhesive thickness on the
permeation of water vapor. This also allowed for the use of the previously described analysis
to estimate the relative contributions of orthogonal, bulk adhesive and interfacial permeation.
Tests were also performed using different surface treatments of the barrier film in order to vary
the interface and limit the permeation through this pathway. The two surface treatments used
were a solvent cleaning in isopropyl alcohol (IPA) and a corona treatment.
Orthogonal vs. Lateral Permeation
The orthogonal permeation per unit area for all samples is shown in Figure 3.9. The
average WVTR of the barrier film for 467MP IPA cleaned samples was determined to be
3.89x10⁻³ g/m²/day; 2.76 x10⁻³ g/m²/day for 468MP IPA cleaned samples; and 3.98x10⁻³
g/m²/day for the 467MP corona treated samples. This discrepancy in measured WVTR is likely
due to variations in the fabrication and handling of the barrier films as this level of variance
was seen quite often when using this barrier film.
Figure 3.9 The cumulative water vapor permeation as measured by the modified optical calcium test is shown in units
of mass of permeated water per unit area. All measures were in the Central Zone of the respective samples. The time
axis has been adjusted so that 0 corresponds to the first point after residual water in the sample had been consumed.
All curves are linear indicating steady state permeation.
0
0.005
0.01
0.015
0.02
0.025
0 0.5 1 1.5 2 2.5
Sigm
a (g
/m2)
Time (days)
467MP-1
467MP-2
467MP-3
467MP-4
468MP-1
468MP-2
468MP-3
468MP-4
467MP cor-1
467MP cor-2
467MP cor-3
467MP cor-4

96
A comparison of the percentages of the calcium deposit degraded by each permeation
pathway for the IPA cleaned samples is shown in Table 3.1. For a 45mm X 45mm sample, the
lateral permeation has a very strong impact on the overall permeation accounting for 46% and
62% of the calcium degradation for 467MP and 468MP respectively. This exemplifies the
importance of the lateral permeation when designing the encapsulation of devices. With a poor
choice of adhesive or poor encapsulation design, the lateral permeation can easily become the
more dominant permeation pathway for water vapor. Large area OPV would be less susceptible
to this problem as a larger proportion of the device is further from the edges. Smaller devices
would be highly susceptible though as the distance to the edge of the device is never large. This
is particularly applicable to modules designed for niche applications such as backpacks,
clothing and decorative pieces along with OLED applications for handheld devices and
wearable technologies.
Table 3.1 The average percentages of the total calcium degradation measured during modified optical calcium tests of
samples using IPA cleaned barrier films are shown for each permeation pathway.
Influence of Adhesive Thickness
The lateral permeation for each adhesive thickness on IPA cleaned barrier films is
shown in Figure 3.10. It can be seen that the thicker 468MP samples had more lateral
permeation than the thinner 467MP samples with p=0.0012 as calculated from an independent
samples t-test. A reduction in the exposed surface area of the adhesive is expected to limit
permeation in the bulk adhesive as can be seen in Equation 3.2 (linear dependence on hadh).
This is an important conclusion as it directly influences the design of OPV encapsulation. The
experimental data from this study indicates that a thinner adhesive layer is indeed preferred for
minimizing permeation. This information must be taken into account when weighing the
benefits of a thinner adhesive layer (less permeation, thinner final product, less material used)
against the benefits of a thicker adhesive layer (better adhesion strength, easier to avoid voids
around the edges of the device).
Percentage of total calcium degradation
Adhesive Orthogonal Total Lateral Bulk Adhesive Interface
468MP 38% 62% 27% 35%
467MP 54% 46% 11% 35%

97
Figure 3.10 The cumulative lateral permeation as measured by the modified optical calcium test is shown for samples
with IPA washed barrier films. The time axis has been adjusted so that 0 corresponds to the first point after the
permeation front had reached the edge of the calcium deposit. The slopes of these curves show thinner adhesive layer
of 467MP had less lateral permeation than the thicker 468MP adhesive with p=0.0012 as calculated from an independent
samples t-test.
Influence of Surface Treatment
Referring back to Table 3.1, it is important to note the respective percentages of the
calcium degradation due to the bulk adhesive and the interface. The model shown in Equation
3.2 suggests that the interfacial permeation is higher than the permeation in the bulk adhesive
for both IPA cleaned samples. The plot in Figure 3.11, which shows the lateral permeation as a
function of adhesive thickness, also suggests a large amount of interfacial permeation. If all of
the permeation were in the bulk adhesive, one would expect a linear dependence on adhesive
thickness with a fit passing through the origin (zero thickness, zero permeation). However, this
is not the case as a linear fit of the IPA cleaned samples predicts significant permeation at an
adhesive thickness of zero.
0.E+00
1.E-06
2.E-06
3.E-06
4.E-06
5.E-06
6.E-06
0 0.05 0.1 0.15 0.2 0.25 0.3 0.35
Mas
s o
f W
ate
r (g
)
Time (days)
467MP-1
467MP-2
467MP-3
467MP-4
468MP-1
468MP-2
468MP-3
468MP-4

98
Figure 3.11 A plot of the lateral permeation rate as measured by the modified optical calcium test is shown for
467MP/468MP. All values have been normalized to 45mm X 45mm calcium deposits to adjust for slight differences
between samples. Error bars represent ±1 standard deviation.
The large amount of interfacial permeation was surprising for this adhesive as it is not
specifically designed for good bulk barrier properties but has good adhesion to the barrier film.
To address the problem of interfacial permeation, a corona treatment of the surface was tested
as a method to improve the interface. Corona treatments use a plasma of ambient air at room
pressure to modify the chemistry of a surface and increase its surface energy. Corona treatments
of barrier films were performed just prior to the application of the adhesive and showed a
stronger interface with the adhesive as evidenced by the adhesion tests shown in Figure 3.12.
0
2
4
6
8
10
12
14
16
18
20
0 50 100 150 200 250 300
Late
ral W
ate
r P
erm
eati
on
Rat
e (µ
g/d
ay)
Adhesive Thickness (µm)
IPA Cleaned
Corona
Linear (IPA Cleaned)

99
IPA Sonicated + Anneal Corona + Anneal
0
1
2
3
4
5
6
7
Ad
he
siv
e S
tre
ng
th (
N/c
m)
Surface Treatment
Figure 3.12 The T-peel adhesion strength for 467MP on Oike VX 25T-2PO barrier films is shown for two different
surface treatments. The anneal used for all samples was identical to the vacuum degassing process used for calcium test
samples in order to simulate as closely as possible the conditions of the calcium test. Error bars represent ±1 standard
deviation.
Calcium test samples were prepared using 467MP as the adhesive on corona treated
barrier films and the results of the lateral permeation are shown in Figure 3.13. This figure
shows that samples which were corona treated presented lower levels of overall lateral
permeation with p=0.016 as calculated from an independent samples t-test. Using the
previously calculated values of apparent bulk adhesive WVTR and interfacial permeation rate,
a value for the interfacial permeation rate of the corona treated samples was calculated and
found to be 1.84x10⁻⁵g/m/day compared to 2.86x10⁻⁵g/m/day for IPA cleaned samples, a
reduction of 38%. Table 3.1 is reproduced with the addition of the corona treated samples in
Table 3.2. These results imply that the interface was indeed a source of water vapor permeation
as modification of only the interface changed the lateral permeation. It also provides evidence
that corona treatment is an effective technique for the reduction of water vapor permeation.

100
Figure 3.12 The cumulative lateral permeation as measured by the modified optical calcium test is shown for samples
with 3M 467MP as the adhesive on both IPA cleaned (blue) and corona treated (green) barrier films. The time axis has
been adjusted so that 0 corresponds to the first point after the permeation front had reached the edge of the calcium
deposit. The slopes of these curves show corona treated samples had less lateral permeation with p=0.016 as calculated
from an independent samples t-test.
Table 3.2 The average percentages of the total calcium degradation measured during modified optical calcium tests of
samples using either IPA cleaned (IPA) or corona treated (Cor) barrier films are shown for each permeation pathway.
Conclusions
The modified optical calcium test for the measure of water vapor permeation presented
in this chapter addresses several of the problems associated with other versions of the optical
test including simulation of actual flexible devices, interfacial permeation and measurement of
multiple permeation pathways. By using a sample geometry which closely mimics that of a
flexible device, a more analogous measurement is achieved which will display the same types
0.E+00
1.E-06
2.E-06
3.E-06
4.E-06
5.E-06
6.E-06
0 0.1 0.2 0.3 0.4
Mas
s o
f W
ate
r (g
)
Time (days)
467MP-1
467MP-2
467MP-3
467MP-4
467MP cor-1
467MP cor-2
467MP cor-3
467MP cor-4
Percentage of total calcium degradation
Sample Orthogonal Total Lateral Bulk Adhesive Interface
468MP IPA 38% 62% 27% 35%
467MP IPA 54% 46% 11% 35%
467MP Cor 57% 43% 30% 13%

101
of permeation and interactions seen in actual devices. The sample geometry, which uses a
calcium deposit laminated between two flexible barrier films using an adhesive, alleviates the
problem of other lateral calcium tests which do not have the same interfaces as a device. This
provides information on the interfacial permeation for specific adhesive-barrier film pairs. The
large calcium deposit also allows for the measurement of both the orthogonal and lateral
permeation for the same sample. While this version of the optical test does not provide accurate
quantitative values for lateral permeation, it does provide the novel ability to compare the
relative amounts of permeation between barrier films, the bulk adhesive and the interfaces.
This ability to compare permeation pathways was exploited using commercially
available reference materials in order to determine the relative impact of each permeation
pathway. Tests showed that for small devices, similar in size to the calcium test samples, the
lateral permeation can account for more than half of the total calcium degradation. This
highlights the importance of limiting lateral permeation in encapsulation schemes. The data
also showed a higher rate of lateral permeation for a high adhesive thickness, thus providing
encapsulation design guidelines for the effect of changing the adhesive thickness. The tests also
showed that interfacial permeation for this system was a significant permeation pathway for
water vapor. This was confirmed by the decreased lateral permeation seen for samples whose
surface had been modified by corona treatment. The use of a corona treatment, which greatly
improves the adhesion, was shown to be effective in limiting the interfacial permeation for this
system of materials.

102

103
Chapter 4: Adhesive
Characterization
Introduction
There are many factors which must be considered when selecting an adhesive for use in
the flexible encapsulation of OPVs. They must be flexible enough to maintain the advantages
of flexible solar panels, including roll-to-roll processing. They must be transparent as any loss
of light arriving at the active layer directly results in a loss of power conversion efficiency.
They must not interact in a harmful manner with any component of the OPV as this could
degrade the performance. They must have good adhesion to flexible barrier films in order to
provide both mechanical stability and to create an interface which is less susceptible to
permeation. And finally, they must be good barriers to oxygen and water as the main goal of
encapsulation materials is to protect the device.
As can be seen, there are indeed many factors which need to be addressed when
considering an adhesive for use in encapsulating OPV. There is one additional requirement too
as they must also be stable enough to maintain these properties over the course of the device’s
lifetime. This last requirement will be discussed in detail later in Chapter 7. In this current
chapter though, the characterization of several adhesives is presented to evaluate the suitability
of each adhesive for use in OPV encapsulation. The adhesives evaluated fall into two main
categories: pressure sensitive adhesives (PSA) based on block co-polymers and UV curing
materials based on acrylate chemistries. The materials were first evaluated in terms of their
formulation and structure, with the highest risk liquid materials also tested for compatibility.
They were then subjected to various testing to elucidate their physical properties including
rigidity, adhesion, optical transparency and water vapor permeation. Both PSAs and UV curing
acrylates are presented here and compared to each other and reference materials to provide an
overview of why these materials are good candidates for OPV encapsulation.

104
MAM PSAs
MAM PSAs are a newer class of adhesives which have several advantages compared to
traditional PSAs. The MAM in their name refers to their triblock co-polymer structure of methyl
methacrylate – block – n-butyl acrylate – block – methyl methacrylate while the PSA, as
previously mentioned, stands for pressure sensitive adhesive. Their advantages compared to
other PSAs come from their structure and several different ratios of the blocks were evaluated.
Structure of MAM Block Co-Polymers
Block co-polymers have polymer chains with at least two distinct regions of the
backbone consisting of different chemistries. MAM co-polymers have an A-B-A structure
which is represented visually in Figure 4.1. The covalent link between two otherwise different
polymers gives these materials their unique properties. Since most polymers are immiscible
with each other, the different blocks of the co-polymer attempt to phase separate. However, the
covalent link between the blocks limits the length scale of this separation and leads to the
formation of nanoscale morphologies consisting of domains of the different polymers. Longer
chains, i.e. higher molecular weights, will lead to larger domain sizes. Adjusting the ratios of
the blocks can also have an effect on the domain size but can additionally cause changes to the
morphology as different configurations will be favored for different volume ratios of the blocks.
For MAM co-polymers, the large difference in mechanical properties between the blocks is
quite important. At room temperature, PBA is very soft and has a strong pressure sensitive
adhesive character whereas PMMA is below its glass transition temperature (Tg) and relatively
rigid. For MAM co-polymers with a majority of PBA, this leads to a pressure sensitive adhesive
with rigid domains of PMMA that mechanically act in a manner similar to cross-links, thus
changing the mechanical properties of the adhesive. Unlike thermosetting polymers with
covalent cross-links, MAM co-polymers remain fully thermoplastic and capable of being fully
dissolved in organic solvents, thus making their available processing techniques much more
varied. Another important aspect of the rigid domains acting as cross-links is that it allows for
changes in the block ratios to control the mechanical properties of the adhesive without making
large changes to the chemical nature of the adhesive.

105
Figure 4.1 A diagram of a hypothetical MAM block co-polymer is shown with poly(methyl methacrylate) blocks in blue
and poly(n-butyl acrylate) in red.
The MAM co-polymers used in this thesis were Nanostrength® adhesives provided by
Arkema Group. These adhesives are all majority PBA and have the naming convention of MXX
where XX represents the percentage of PBA in each polymer chain. AFM images of bulk
deposits of the three grades of these adhesives used in this thesis can be seen in Figure 4.2.
While further characterization is needed to definitively identify the morphologies, all of the
adhesives except M65 show structures in AFM which are consistent with spherical micelles.
M65 however appears to be consistent with a worm-like morphology. This is more difficult to
identify using only AFM images as horizontally aligned hexagonal cylinders and lamellar
sheets can also present a similar pattern. However, after several images in different regions, the
lack of any edge-on cylinders or large domain spacings from viewing lamellar sheets at an angle
makes worm-like the more likely cause of this pattern. The worm-like morphology, which show
only short range order, could be representative of a thermodynamically unstable structure which
was not allowed enough time to fully organize. Alternatively, it could also be
thermodynamically stable with the morphology being due to the relatively large polydispersity
of the polymer.

106
Figure 4.2 AFM images taken in tapping mode of (a) M65, (b) M75 and (c) M85 are shown in both (top) hieght and
(bottom) phase. All images show an area of 5μm x 5μm. The images for M65 and M85 were taken with the aid of Isabel
Fraga Dominguez at the Institut de Chimie de Clermont-Ferrand while the images of M75 were provided by Arkema.
It can been that M75 and M85 have spheres of rigid PMMA in a soft matrix of PBA. The decreased PMMA content in
M85 leads to smaller PMMA domains. M65 shows a much different morphology which is consistent with a worm-like
structure.
Thermo-Mechanical and Optical Properties
The Tg of each adhesive was found via differential scanning calorimetry (DSC) and the
results are shown in Table 4.1. As the materials have two distinct polymer domains, two glass
transitions were observed. The low temperature Tg corresponds to the soft PBA block (bulk Tg
of -42°C 179) and was very similar for all three adhesives. M65 and M75 also displayed a second
higher temperature Tg which corresponds to the rigid PMMA block (bulk Tg of 105°C 70). This
higher temperature Tg was not observed for M85 most likely due to the relatively small amount
of PMMA not producing a strong enough endothermic signal to be measured. The measurement
of M85 was repeated by Dr. Manuel Hidalgo on a different DSC instrument at Arkema and
similar results were found. All samples also showed an endothermic transition in the range of
60-75°C during the first heating run which was no longer present in the second heating run.
This was attributed to the evaporation of residual solvent dissolved in the polymer.

107
Table 4.1 The glass transition temperatures for the MAM Nanostrength® adhesives are shown for both DSC and
DMTA methods. DSC used a 10°C/min ramp rate while DMTA was performed at 3°C/min, 1Hz and 0.1% strain.
M85 results in parentheses were performed at Arkema.
Adhesive DSC Lower Tg
(PBA)
DMTA Lower Tg (PBA) DSC Upper Tg
(PMMA)
M65 -48°C -37°C 98°C
M75 -44°C -36°C 92°C
M85 -44°C
-47°C, Arkema)
-39°C Not detected
(Not detected, Arkema)
The Tg was also calculated from the peak of the loss modulus curve in tensile dynamic
mechanical thermal analysis (DMTA). Only the low temperature Tg of the PBA block was
visible in this method. These measures were slightly elevated in comparison to DSC measures
due to the strain rate effects of cyclic mechanical testing compared to the extremely low
frequency of DSC where no load is applied. DMTA also showed that all three polymers had
similar Tg values just as was seen in DSC. DMTA was also used to evaluate the storage and
loss moduli of the adhesives with results shown in Figure 4.3. M85 was clearly the softest of
the materials which was in-line with the observations of handling the material at room
temperature. In fact, the polymer was too soft and surpassed the limit of detection of the
apparatus during testing before reaching the desired temperature of 150°C. As the polymer with
the lowest PMMA content, this result is consistent with the hypothesis that changing the block
ratios can create a large change in properties without large changes in the chemical composition
of the material. However, the results of M65 and M75 do not agree with this hypothesis as both
displayed remarkably similar behavior in DMTA. While further study outside the scope of this
thesis is needed to confirm the exact reasons for this deviation, the most likely cause is the
change in morphology.

108
Figure 4.3 Tensile DMTA plots are shown for (a) M65, (b) M75 and (c) M85. (d) An overlay of the storage modulus
curve of all three adhesives shows the comparison of the three adhesives. All tests were performed at 3°C/min, 1Hz and
0.1% strain.
Another important observation from the DMTA data is that of the value of the storage
modulus at room temperature. At 23°C and 1Hz, conditions which correspond well with the
lamination of an adhesive, only M85 meets the Dahlquist criterion for pressure sensitive
adhesion with its measured E’ of 2.3x10⁵Pa. M65 and M75, with E’ values of 3.2 x10⁶Pa and
2.8 x10⁶Pa respectively, are an order of magnitude higher than the Dahlquist criterion. This was
also observed as both of these adhesives, especially M65, had low tack when laminated at room
temperature. However, this criterion can be met by heating the adhesives causing a drop in the
storage modulus.
The T-peel adhesion of each adhesive was also tested to measure the adhesion to flexible
substrates. The results of these tests on poly(ethylene terephthalate) (PET) substrates which had
been rinsed with isopropyl alcohol (IPA) are shown in Table 4.2. PET was chosen as it is a
common substrate for the fabrication of flexible barrier films. These samples used two adhesive
coated substrates which were laminated together at room temperature. This led to the creation
of a third interface where the two adhesive layers meet. This configuration was chosen as it
closely resembles the encapsulation scheme for devices. M85 showed good tack and adhesion
strength when laminated at room temperature. However, as predicted by the Dahlquist criterion,

109
the adhesion of M65 and M75 was very low when laminated at room temperature since they
are too rigid to have a high degree of PSA character. This led to the use of post-lamination
anneals in order to soften the adhesives and allow them to better adhere to the surface. An
annealing study performed on M75 is shown in Figure 4.4. Since OPVs can be sensitive to high
temperatures, anneals were limited to less than 150°C. When the relatively thicker Oike barrier
films were used as substrates instead of PET, slightly longer annealing times were needed. To
be sure that all samples were properly annealed, all subsequent testing with MAM
Nanostrength® adhesives were annealed at 130°C for 10min.
Table 4.2 T-peel adhesion results are shown for samples using 50μm thick PET substrates. Lamination was performed
using two adhesive coated substrates and testing was performed at least 3 days after lamination. Values in parentheses
are the standard deviation. The failure type is color coded where yellow is adhesive failure at the adhesive-to-adhesive
interface; green is adhesive failure at the adhesive-to-substrate interface; and blue is cohesive failure in the adhesive.
Post-Lamination Processing M65 M75 M85
Room Temperature Storage 0.69 N/cm
(0.55 N/cm)
1.63 N/cm
(0.50 N/cm)
2.83 N/cm
(0.29 N/cm)
Annealed 4.85 N/cm
(0.70 N/cm)
4.77 N/cm
(0.55 N/cm)
Not tested
Figure 4.4 Average T-peel adhesion strengths are shown for M75 with various post-lamination anneals on IPA rinsed
50μm PET substrates. All anneals were performed on a hot plate except for overnight samples which used an oven. All
samples had a total adhesive thickness of approximately 50μm, though some had a single layer of adhesive (adhesive
coated substrate-to-uncoated substrate) while others had two thinner layers of adhesive (adhesive coated substrate-to-
adhesive coated substrate).
0
1
2
3
4
5
0 1 2 3 4 5 6 7 8 9 10 11
Ad
hes
ion
Str
engt
h (
N/c
m)
Anneal Time (min)
RT 2 layersRT 1 layer120 C 2 layers120 C 2 layers overnight120 C 1 layer120 C 1 layer overnight130 C 2 layers130 C 2 layers overnight140 C 2 layers

110
To better match the processes used for the other types of adhesives used in this thesis,
subsequent adhesive testing used a single adhesive coated substrate which was laminated to an
un-coated substrate, thus eliminating the adhesive-to-adhesive interface. The results of this
testing are shown in Table 4.3 and, due to the testing conditions used, these values are the most
comparable to the other adhesives used in this thesis. Just as with DMTA, M65 and M75
showed similar performance in adhesion testing while M85 had different results. The better
adhesion for M85 likely comes from the ability of softer materials to better dissipate strain
energy, thus making the strain energy at the interfaces lower. Additionally, the higher PBA
fraction and micellar morphology provides more PBA at the surface which allows for more
PSA character. M65, which is the most rigid of the three adhesives and does not have a micellar
morphology, was prone to stick-slip rupture during adhesion testing. This type of rupture occurs
when the adhesive is unable to dissipate enough strain energy leading to a rapid adhesive failure
over a large area (slip) once the strain energy at the interface passes a critical value (stick).
Since strain energy is dissipation is dependent on the volume of material, thinner adhesive
thicknesses are more prone to exhibiting this type of behavior. This means that M65 was close
to the limit of the minimum thickness which can be used for T-peel adhesion but does not
necessarily indicate insufficient adhesion.
Table 4.3 T-peel adhesion results are shown for samples with a total adhesive thickness of 50μm and 50μm thick PET
substrates. Lamination was performed using one adhesive coated substrate and one uncoated substrate and testing
was performed at least 3 days after lamination. Values in parentheses are the standard deviation. The failure type is
color coded where yellow is adhesive failure at the adhesive-to-adhesive interface; green is adhesive failure at the
adhesive-to-substrate interface; and blue is cohesive failure in the adhesive. *Values with 2 layers of adhesive with a
combined thickness of 50μm are shown for comparison for M65 which was too rigid to measure as a single layer.
Processing M65 M75 M85
Single Adhesive Layer,
50μm PET, Annealed
NA: Stick-Slip 4.77 N/cm
(0.68 N/cm)
7.41 N/cm
(0.53 N/cm) 4.85 N/cm*
(0.70 N/cm)*
Transparency is also an important property for an adhesive which will be in the optical
path of a device since any loss of light transmission directly results in a loss of power conversion
efficiency of the solar cell. Therefore UV-Vis spectroscopy was also performed on the
adhesives. The MAM adhesives were highly transparent and caused little to no loss of
transmission compared to a PET film. An example is shown in Figure 4.5 where a 50μm layer
of M85 coated on a PET substrate showed almost identical transmission to a PET film with no
adhesive. This adhesive thickness was used as it corresponds well to the thickness of adhesive

111
present between the device and the barrier film in a flexible encapsulation scheme. This high
transparency makes these adhesives ideal materials in terms of optical clarity.
Figure 4.5 UV-Vis spectroscopy using a standard detector was performed on both a 50μm thick PET film and a PET
film with a 50μm coating of M85. For the M85 sample, the PET surface was facing the laser source so that the same
amount of reflection was present for both samples.
Permeation
The barrier properties of the MAM Nanostrength® adhesives were evaluated using the
optical calcium test described in Chapter 3. The ability to limit the permeation of water vapor
is of critical importance for OPV encapsulation materials. The results of these tests can be seen
in Figure 4.6 in terms of the total apparent lateral permeation. All samples in this study used
Oike VX 25T-2PO barrier films which had been sonicated in IPA prior to bonding. The
adhesives were coated onto the barrier films from solution in toluene and were annealed at
130°C prior to testing. The large variance for some test conditions comes from the formation
of voids and bubbles in the adhesive which led to an increase in the lateral permeation rate.
While great care was taken to avoid the presence of voids during sample preparation, even small
voids and bubbles grew rapidly once exposed to water vapor for this class of adhesives. This
was especially true for the low tack adhesives M75 and M65, where eliminating voids during
fabrication was extremely difficult. For example, of 11 calcium test samples prepared using
M65, only 3 were able to be analyzed as the rest had large voids and lamination defects.
0
10
20
30
40
50
60
70
80
90
100
250 300 350 400 450 500 550 600 650 700 750 800
Tran
smis
sio
n (
%)
Wavelength (nm)
PET 50um
MAM M85 on 50um PET

112
Figure 4.6 A plot of the apparent lateral permeation rate as measured by the modified optical calcium test is shown for
the MAM Nanostrength® adhesives. All values have been normalized to 45mm X 45mm calcium deposits to adjust for
slight differences between samples.
The variance in the measures makes it difficult to draw firm conclusions from this data,
though there are noticeable trends especially when focusing on the best samples which had the
fewest voids. It appears that M85 and M75 show very similar permeation rates while M65
appears to be slightly less permeable to water vapor. Two initial hypotheses were formulated
for potential trends in permeation. One hypothesis was that the ratio of the blocks affects the
permeation rate as higher percentages of PMMA, which is less permeable to water vapor than
PBA, would result in decreased permeation. This hypothesis would predict that the adhesives
would be consecutively less permeable, but the experimental data does not confirm this.
Alternatively, a hypothesis based on the mechanical properties was also considered. This
hypothesis considered the rigidity of the materials to be an indicator of chain mobility. Higher
chain mobility within a materials with very similar chemical structures was predicted to lead to
more permeation. As M65 and M75 show very similar results for both DMTA (at both room
temperature and 65°C) and T-peel adhesion, this hypothesis predicted that these adhesives
would have similar permeation rates. M85 on the other hand, being much softer indicating more
0
5
10
15
20
25
30
35
0 20 40 60 80 100 120 140 160
Late
ral W
ate
r P
erm
eati
on
Rat
e (µ
g/d
ay)
Adhesive Thickness (µm)
M65 M75 M85

113
chain mobility, would be more permeable. However, this hypothesis also does not fit the
experimental data.
Despite the lack of clear agreement for both of these hypotheses, the competing
permeation pathways of the bulk adhesive and he interface could describe this phenomenon.
The much higher adhesion of M85 compared to the other adhesives may have led to this
adhesive showing a lower total lateral permeation. Optical calcium tests with different thickness
of M65 and M75 are needed to confirm if this effect exists. However, this effect is unlikely to
be very large as the adhesion of M65 and M75 was still quite strong, even though it was much
lower than that of M85.
A third hypothesis which better explains the data observed was also developed. Upon
reviewing the properties of the three adhesives, one difference does appear which could
potentially explain the experimental results: morphology. M75 and M85 both have micellar
morphologies while M65 does not. The worm-like morphology of M65 results in more
permeating molecules being forced to either traverse the less permeable PMMA domains or
take a much longer tortuous path through the PBA domains. However, it appears that this effect
only slightly decreases the permeation rate and the statistical uncertainty of the experimental
data makes it unclear if the effect exists at all.
UV Cure Acrylates
UV curing acrylate adhesives present a very different approach compared to PSAs. As
reactive liquids that do not require a solvent evaporation, they are much easier to process into
void/bubble free samples. The fast curing times also mean that no long waiting times are needed
between lamination and testing, unlike with PSAs which often take days. However, they also
require the extra processing step of curing and can be more difficult to completely degas at the
lab scale, as vacuum can remove needed volatile species. Nonetheless, the advantages of UV
curing acrylates make them a very interesting alternative to PSAs for OPV encapsulation.
Formulation of the Adhesives
UV curing acrylate adhesives consist of a mix of oligomers, monomers, photo-initiators
and potentially other additives, and thus require a balanced formulation to achieve the desired
properties. The formulation of UV curing acrylate adhesives must also take into account several

114
other factors in addition to the general requirements for OPV encapsulation. These include
compatibility with OPV devices and the ability to properly cure using light sources which must
transmit across the barrier film.
Monomers present the greatest risk for incompatibility with the various layers of OPV
devices as they are relatively small organic molecules and contain reactive groups. This can
cause monomers to act as solvents or react chemically with the various layers of an OPV device,
and therefore affect the performance of the device. To ensure that any monomers used in the
formulation did not have an adverse effect on the device, a screening process was used. Several
different monomers were screened by spin coating them onto OPV cells in a dry nitrogen glove
box and characterizing the cells using current density-voltage (J-V) curves after approximately
5min and 10min of exposure to the monomer. The cells used an inverted architecture and had
a structure of PET – indium tin oxide (ITO) – zinc oxide nanoparticles (ZnO) – P3HT:PCBM
– PEDOT:PSS – silver (deposited via evaporation). P3HT:PCBM is a bulk heterojunction
active layer comprised of a blend of poly(3-hexylthiopene) and phenyl C61 butyric acid methyl
ester. PEDOT:PSS is a hole transport layer (HTL) which is a blend of poly(3,4-
ethylenedioxythiopene) and poly(styrene sulfonate). The monomers were spin coated onto the
backside of the cell and were thus directly in contact with both the silver and PEDOT:PSS
layers, though side ingress through the other layers was still possible as well. The results of this
testing can be seen in Table 4.4 and show that most of the tested monomers were compatible
with this type of inverted OPV cell. Only the monomer SR285 (tetrahydrofurfuryl acrylate)
showed strong degradation of the solar cell’s performance after short exposure times. SR238
(1,6-hexyldiol diacrylate) and SR484 (blend of octyl and decyl acrylates) both have, except for
their acrylate groups, completely aliphatic structures which likely limited their ability to interact
with the highly hydrophilic PEDOT:PSS layer. SR9003 (propoxylated 2-neopentyl glycol
diacrylate) is a fairly large molecule which may have limited its ability to diffuse into the layers
of the solar cell.
Table 4.4 The results of J-V testing for OPV cells after exposure to acrylate monomers are shown. OPV cells used the
structure PET – ITO – ZnO – P3HT:PCBM – PEDOT:PSS – Ag and had an active area of 0.28cm2. Two cells were
present per substrate and measurements were made without a light mask. The t=0 measurements were made
immediately before application of the monomer.

115
Using the information from this monomer compatibility study, along with the advice of
experts from Sartomer, Formulation #1 (F1) was devised consisting of 2 oligomers, 2
monomers and 2 photo-initiators. As this adhesive was unable to properly polymerize between
PET substrates, the photo-initiator ratio was changed in favor of longer curing wavelengths to
form F2. This adhesive was able to polymerize but had no adhesion to PET and thus the
formulation was modified further. As can be seen in Table 4.5, Formulations 2-8 and 10 varied
the ratios of the oligomers and monomers more and more in favor of those known to provide
better adhesion to plastic substrates (CN9002 and SR506D). F5 was the first to show any
adhesion, though it was not enough to be measurable in a T-peel test. F6 and F10 also showed
some adhesion but were measured to be at the limit of detection in T-peel testing while
displaying stick-slip behavior. F12 and F15 tried using additional oligomers and adhesion
promoters, but due to the lack of good adhesion, this series of formulations was abandoned in
favor of a new suggestion from Sartomer which became F9. This formulation also had very
weak adhesion at the limit of detection in T-peel testing while displaying stick-slip behavior.
Sample Time
(min)
VOC (mV) JSC
(mA/cm2)
FF
(%)
PCE
(%)
Normalized
ΔPCE (%)
SR238 0 540.5 9.61 47.53 2.47 ---
Cell 1 4 541.7 8.96 48.17 2.34 -5.26
10 541.6 8.85 48.18 2.31 -6.48
SR238 0 553.0 9.70 51.62 2.77 ---
Cell 2 5 557.0 10.0 51.82 2.89 4.33
10 561.7 9.72 51.26 2.80 1.08
SR285 0 540.6 6.98 53.95 2.04 ---
Cell 1 6 543.7 6.45 50.99 1.79 -12.1
SR285 0 549.4 9.23 52.51 2.66 ---
Cell 2 5 554.6 8.71 51.52 2.49 -6.39
10 553.4 8.38 51.41 2.38 -10.5
SR484 0 581.2 9.23 48.39 2.42 ---
Cell 1 4 525.5 9.51 46.59 2.33 -3.72
10 525.6 9.47 46.73 2.33 -3.72
SR484 0 562.3 10.0 52.00 2.93 ---
Cell 2 5 556.4 10.2 53.08 3.03 3.41
10 552.8 10.2 53.94 3.04 3.75
SR9003 0 544.8 8.22 50.81 2.28 ---
Cell 1 6 547.3 8.41 50.64 2.33 2.19
10 544.5 8.43 51.16 2.35 3.07
SR9003 0 550.8 9.87 52.76 2.87 ---
Cell 2 5 553.2 10.0 52.96 2.93 2.09
10 553.0 10.0 53.23 2.96 3.14

116
F9 was then modified using the oligomers and monomers from the previous iterations which
were known to aid in adhesion to plastic substrates in other adhesives. The resulting
modifications, seen in Table 4.6, showed no improvement until F13 which showed measurable
adhesion in T-peel testing. Despite this adhesion, there was still a large degree of stick-slip
behavior present in F13. The “slips” are seen in the peel test data in Figure 4.7 as sudden losses
in strength. The ratios of the oligomers and monomers in F13 were further modified in the hopes
of reducing this stick-slip, ultimately resulting in F18. This formulation had the best adhesion
without having a large degree of stick-slip, and as a result, F18 was selected for further study.
Table 4.5 The formulations based on F1 are shown with red and green values representing decreases and increases
from the previous iteration respectively.
F1 F2 F3 F4 F5 F6 F7 F8 F10 F12 F15
CN131B
Low Tg
oligomer
-- -- -- -- -- -- -- -- -- 10.7% 10.1%
CN9001
Mid Tg
oligomer
20.9% 21.1% 10.5% 10.5% 10.5% 5.2% 8.9% 4.0% -- -- --
CN9002
Very low Tg
oligomer
20.9% 21.1% 31.4% 31.4% 31.4% 36.6% 62.4% 27.3% 42.5% 31.9% 30.2%
SR238
Di-acrylate
monomer
31.4% 31.8% 31.2% 21.0% 10.4% 10.5% 4.7% 12.6% -- -- --
SR506D
Monoacrylate
monomer
21.3% 21.2% 21.1% 31.4% 41.9% 41.9% 19.1% 50.0% 51.9% 52.1% 49.2%
SR9050
Adhesion
Promoter
-- -- -- -- -- -- -- -- -- -- 5.4%
Irgacure 184
UVA initiator
4.8% 2.4% 2.9% 2.9% 2.9% 2.9% 2.4% 3.1% 2.8% 2.6% 2.6%
TPO-L
VIS initiator
0.6% 2.4% 2.9% 2.8% 2.9% 2.9% 2.4% 3.1% 2.8% 2.6% 2.6%
Adhesion Not
cured
None None None Below
testing limit
At testing
limit: Stick-slip
None None At testing
limit: Stick-slip
At testing
limit: Stick-slip
At testing
limit: Stick-slip
Table 4.6 The formulations based on F9 are shown with red and green values representing decreases and increases
from the previous iteration respectively.
F9 F11 F13 F14 F16 F17 F18
CN131B
Low Tg
oligomer
89.5% 89.3% 67.0% 44.8% 78.3% 55.9% 61.6%
CN9002
Very low Tg
oligomer
-- -- 22.3% 44.6% 11.2% 33.6% 28.0%
SR9050 5.6% -- 5.7% 5.7% 5.7% 5.7% 5.6%

117
Adhesion
Promoter
SR506D
Monoacrylate
monomer
-- 5.8% -- -- -- -- --
Irgacure 184
UVA initiator
3.8% 3.8% 3.8% 3.8% 3.7% 3.8% 3.8%
TPO-L
VIS initiator
1.1% 1.1% 1.1% 1.1% 1.0% 1.0% 1.0%
Adhesion
Strength
At testing
limit:
Stick-slip
At testing
limit:
Stick-slip
1.46
N/cm
Stick-slip
0.74
N/cm
1.97
N/cm
Stick-slip
1.28
N/cm
1.32
N/cm
Figure 4.7 T-peel adhesion tests are shown for (a) F13 and (b) F18. F13 showed a large amount of stick-slip behavoir
which can be seen as sudden decreases in adhesion strength. F18 showed only rare instances of stick-slip.
The ability of the adhesive to correctly cure was analyzed using FTIR-ATR on samples
after peeling. This calculation was performed as described in the literature by comparing the
areas of the peak at approximately 830cm-1 (epoxy backbone) and the peak at approximately
810cm-1 (out of plane bending of C-H on RCH=CH2).149 F18 exhibited fairly strong oxygen
inhibition of the curing reaction, necessitating that all samples be cured between two substrates
when cured in air. This geometry is also preferred as it replicates the conditions seen for

118
encapsulating devices. Tests were performed using both 50μm PET and Oike VX 25T-2PO
barrier films as they have different transmission spectra. Tests were also performed with both
available UV lamps to confirm the effectiveness of each process. The results for F18 are shown
in Figure 4.8 and show that very short curing times are sufficient regardless of the process used.
To ensure that all samples were thoroughly cured, a curing time of 30s was selected for
subsequent use with both lamps.
Figure 4.8 The curing of F18 is shown as calculated from FTIR-ATR measurements. Samples were cured between
either 50μm PET substrates or Oike VX 25T-2PO substrates. The lamps used were a 400nm LED source located in a
dry nitrogen glove box and a medium pressure mercury lamp located in air.
Another adhesive was also formulated using a similar iterative process at Sartomer with
the goal of improving the adhesion in comparison to F18. This was achieved by replacing the
two oligomer blend of F18 with a blend of a different oligomer and a monomer. Simultaneously,
a non-reactive aliphatic tackifying resin, Norsolene S95, was also added to the formulation as
an adhesion promoter. The resulting adhesive, named S3 and described in Table 4.7, had an
adhesive strength of 3.01N/cm on PET compared to 1.32N/cm for F18. This improved adhesion
made S3 an interesting alternative to F18 and it was therefore selected for further study. Due to
a large amount of peak convolution, it was not possible to use FTIR-ATR to determine a
quantitative value of the conversion of double bonds, though qualitative comparisons were still
possible to confirm the adhesive had reached its maximum conversion.
0%
10%
20%
30%
40%
50%
60%
70%
80%
90%
100%
0 10 20 30 40 50 60 70
% C
on
vers
ion
of
acry
late
do
ub
le b
on
ds
Cure Time (seconds)
50um PET LED-glove box
Oike LED-glove box
50um PET Hg-air
Oike Hg-air

119
Table 4.7 The formulation of S3 is listed with a breif description of each component.
Component Description wt%
CN966H90 Aliphatic urethane di-acrylate oligomer 29.5%
SR504 Mono-acrylate monomer 30.6%
SR9050 Adhesion promoter 5.6%
Norsolene S95 Aliphatic tackifying resin 29.5%
Irgacure 184 UVA photo-initiator 3.8%
Lucirin TPO-L VIS photo-initiator 1.0%
Comparison of Thermo-Mechanical and Optical
Properties
Just as with the PSAs, the Tg of the UV curing acrylates was also tested by DSC.
Because the conversion of the monomers is not complete during the UV curing of F18, an
exothermic behavior at higher temperatures (>100°C) was seen in DSC which likely
corresponds to the curing of residual monomers. As a result, the Tg observed during the second
heating run was elevated in comparison to the first heating run. The first Tg corresponds to the
polymer as it is after curing while the second Tg is more applicable to samples which have seen
an anneal after curing. However, S3 was tested only to 100°C and did not display this behavior.
Both Tg values are reported in Table 4.8 along with the Tg as measured by the peak of the loss
modulus (E”) curve in DMTA. The value from DMTA is more comparable to the first heating
run of DSC as the sample had not been previously exposed to high temperatures.
Table 4.8 Tg values for UV curing acrylates are shown as calculated from the midpoint of DSC transitions and the
peak of the loss modulus (E”) curve in DMTA. The DSC heating ramp rate was 10°C/min for all samples.
Adhesive 1st DSC Heating 2nd DSC Heating DMTA peak E”
F18 -17°C -11°C -20°C
S3 -27°C -28°C NA
Tensile DMTA was performed on both adhesives, however all attempts at measuring S3
were unsuccessful. The relatively strong adhesion of S3, along with its soft nature, made it
difficult to separate DMTA samples from the substrate after curing. The few samples which

120
were obtained were then very soft and consistently failed during testing. Testing in shear with
a rheometer was also attempted, but samples of sufficient size could not be separated from the
substrates after curing. However, F18 was much easier to process as it is both more rigid and
has lower adhesion. The DMTA curve for F18 tested at 3°C/min, 1Hz and 0.1% strain is shown
in Figure 4.9. The adhesive displayed behavior typical of a crosslinked polymer with a clear
glass transition and a rubbery plateau showing a slight and gradual increase in the storage
modulus above Tg. The loss modulus fell below the detection limit of the equipment at higher
temperatures resulting in its apparent rapid descent to 0 in Figure 4.9. For the purposes of this
thesis F18 is sufficiently flexible, however, there should be some concern about the increased
rigidity at colder temperatures for its use in actual OPV encapsulation where devices can be
exposed to cold winter temperatures outdoors. A slightly softer version of this adhesive may be
needed if the end product is expected to be used in colder climates.
-60 -40 -20 0 20 40 60 80 100 120
1E-3
0,01
0,1
1
10
100
1000
10000
Ta
n D
elta
Mo
du
lus (
MP
a)
Temperature (°C)
Storage Modulus
Loss Modulus
0,0
0,2
0,4
0,6
0,8
1,0
1,2
1,4
1,6
1,8
2,0
Tan Delta
Figure 4.9 The tensile DMTA curve for F18 is shown as tested at 3°C/min, 1Hz and 0.1% strain.
The adhesion of both adhesives was briefly discussed in the formulation section since it
was used as a screening tool for their development. Additional adhesion testing was also
performed on these adhesives using barrier films as substrates. While F18 showed identical
adhesion to both PET and Oike VX 25T-2PO barrier films, S3 showed a large drop in the
measured adhesion compared to PET substrates. Though quantitative measures were not
possible due to peak convolution, a relative comparison of FTIR-ATR peaks, seen in Figure
4.10, showed that the samples using Oike substrates were not fully cured. This was remedied
by increasing the exposure time and intensity of the UV lamp which allowed the adhesive to
recover some of its adhesion. It should also be noted that after adhesion testing, S3 displayed

121
high tack and PSA character. This is likely due to its low modulus and Tg. F18 meanwhile,
showed almost no tack and remained as an intact film after adhesion testing. As the adhesion
values shown in Table 4.9 indicate, the adhesion was not particularly strong for the UV curing
adhesives, especially F18. Therefore adhesion tests on corona treated substrates were also
performed as a method to increase the adhesion. While corona treatments did improve the
adhesion of both adhesives, it was to a lower extent than the increases seen in the PSAs,
especially for F18.
Figure 4.10 FTIR-ATR spectra of S3 are shown for various curing times and substrates. All samples, except for the
liquid, where cured using a medium pressure mercury lamp in air. The conversion of the adhesive can be seen by the
peak at 810cm-1 which corresponds to the out of plane bending of C-H on RCH=CH2.
Table 4.9 The T-peel adhesion strength of the UV acrylate adhesives are shown with the standard deviation in
parentheses. All samples had an adhesive thickness of approximately 50μm. The failure type is color coded where
green is adhesive failure at the adhesive-to-substrate interface and blue is cohesive failure in the adhesive.
*Longer/more intense cure
Adhesive PET (IPA rinsed) Oike (IPA rinsed) Oike (Corona)
F18 1.32 N/cm
(0.15 N/cm)
1.32 N/cm
(0.15 N/cm)
1.82 N/cm
(0.08 N/cm)
S3 3.01N/cm
(0.10 N/cm)
1.00 N/cm
(0.07 N/cm)
2.84 N/cm*
(0.16 N/cm)*
1.76 N/cm*
(0.20 N/cm)*
To evaluate the transparency of the adhesives, UV-Vis spectroscopy was performed and
the results are shown in Figure 4.11. All samples were cured between two PET substrates. Since
both adhesives are known to fail adhesively at the PET interface, they were then peeled apart

122
to produce a coating of adhesive on a single PET film. The PET film was positioned facing the
laser source so that the reflection would be the same for all samples. Both samples have more
absorption at lower wavelengths than the uncoated PET, with S3 being particularly less
transparent at these shorter wavelengths. This is unsurprising as S3 has a yellow-orange color
in very thick layers, though it remains quite clear to the eye in layers of tens of microns. This
color comes mainly from the tackifying resin, thereby creating a trade-off between adhesion
and optical clarity. The lower transparency of S3 could potentially affect the performance of
certain OPV active layers which absorb strongly in the blue part of the spectrum.
Figure 4.11 UV-Vis spectroscopy using a standard detector was performed on both a 50μm thick PET film and PET
films with 50μm coatings of adhesive. For the adhesive samples, the PET surface was facing the laser source so that the
same amount of reflection was present for all samples.
Permeation
The water vapor permeation of both UV curing acrylate adhesives was studied using the
optical calcium test described in Chapter 3. The apparent lateral permeation measured for each
sample is shown in Figure 4.12. It is immediately evident in this plot that the interfacial
permeation plays a very large role as the adhesive thickness has no significant effect on the
lateral permeation for either adhesive. Since bulk permeation is dependent on the adhesive
thickness while interfacial permeation is not, the experimental data implies that the water vapor
permeation in the bulk adhesive is much slower than the interfacial permeation. The relatively
weak adhesion of the UV curing acrylates indicates a weaker interfacial bond which could make
interfacial permeation easier to occur. Also, polymer adhesives are known to have a general
0
10
20
30
40
50
60
70
80
90
100
250 300 350 400 450 500 550 600 650 700 750 800
Tran
smis
sio
n (
%)
Wavelength (nm)
PET 50um
Sartomer F#18 on 50um PET
Sartomer S3 on 50um PET

123
trend that higher cross-link densities lead to lower permeation rates as the chain mobility and
free volume of polymer become smaller. The cross-linked network structure of the UV curing
acrylates may help to limit bulk permeation. The combination of a weaker interface and a cross-
linked bulk structure may have caused the interfacial permeation to become dominant for these
adhesives.
Figure 4.13 A plot of the apparent lateral permeation rate as measured by the modified optical calcium test is shown
for the UV curing acrylate adhesives. All values have been normalized to 45mm X 45mm calcium deposits to adjust for
slight differences between samples. Error bars represent ±1 standard deviation.
A second trend that can be noted from Figure 4.13 is the lower interfacial permeation
for S3 in comparison to F18 for which p=0.0025 using an independent samples t-test. As the
two adhesives are chemically different, there may be a variety of causes for this difference in
permeation, but one major difference which likely played a large role is the presence of a
tackifying resin in S3. The tackifying resin is known to act as an adhesion promoter and S3 did
indeed show more adhesion than F18. This increased adhesion is likely a major cause of the
lower permeation of S3 compared to F18. Additionally, the mostly aliphatic nature of the
tackifying resin makes it hydrophobic in nature, which could potentially further limit the
permeation of highly polar water vapor in the adhesive.
Samples were also prepared using corona treated barrier films for both adhesives.
Improving the interface is of extra importance for F18 and S3 as they are dominated by
interfacial permeation. Corona treatments were shown to improve the adhesion of both
0
2
4
6
8
10
12
0 20 40 60 80 100 120 140 160 180
Late
ral W
ate
r P
erm
eati
on
Rat
e (µ
g/d
ay)
Adhesive Thickness (µm)
F18 F18 Corona
S3 S3 Corona
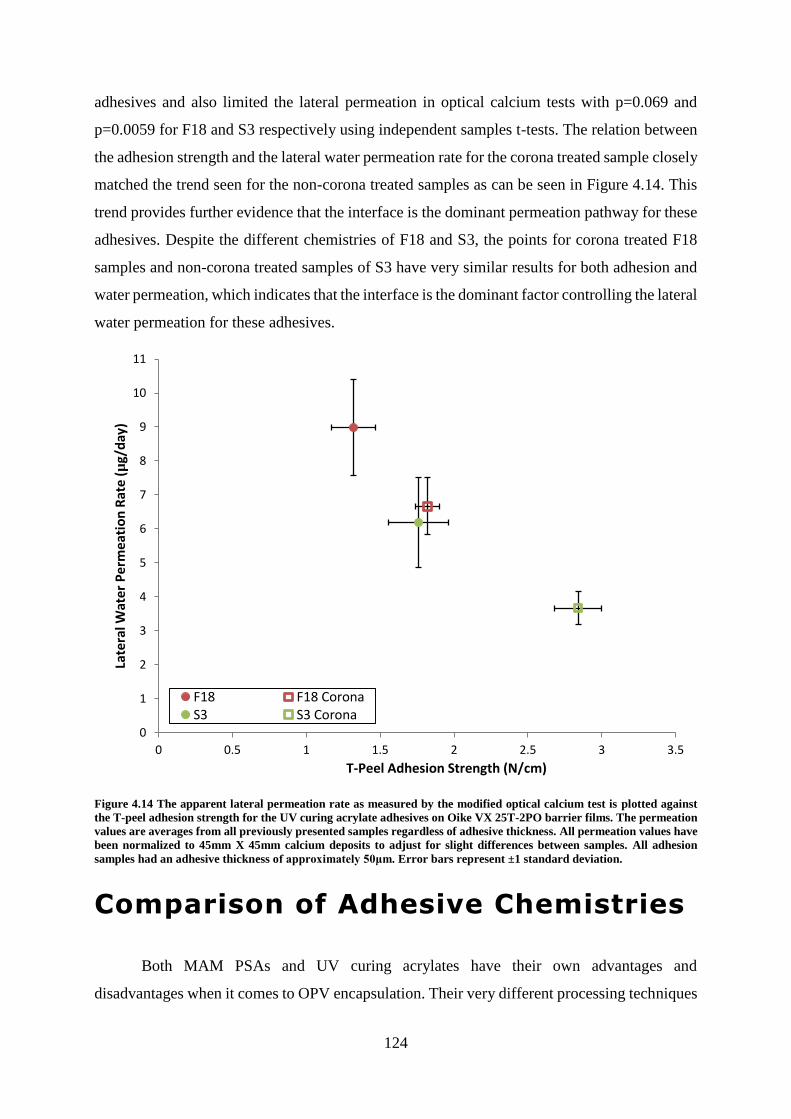
124
adhesives and also limited the lateral permeation in optical calcium tests with p=0.069 and
p=0.0059 for F18 and S3 respectively using independent samples t-tests. The relation between
the adhesion strength and the lateral water permeation rate for the corona treated sample closely
matched the trend seen for the non-corona treated samples as can be seen in Figure 4.14. This
trend provides further evidence that the interface is the dominant permeation pathway for these
adhesives. Despite the different chemistries of F18 and S3, the points for corona treated F18
samples and non-corona treated samples of S3 have very similar results for both adhesion and
water permeation, which indicates that the interface is the dominant factor controlling the lateral
water permeation for these adhesives.
Figure 4.14 The apparent lateral permeation rate as measured by the modified optical calcium test is plotted against
the T-peel adhesion strength for the UV curing acrylate adhesives on Oike VX 25T-2PO barrier films. The permeation
values are averages from all previously presented samples regardless of adhesive thickness. All permeation values have
been normalized to 45mm X 45mm calcium deposits to adjust for slight differences between samples. All adhesion
samples had an adhesive thickness of approximately 50μm. Error bars represent ±1 standard deviation.
Comparison of Adhesive Chemistries
Both MAM PSAs and UV curing acrylates have their own advantages and
disadvantages when it comes to OPV encapsulation. Their very different processing techniques
0
1
2
3
4
5
6
7
8
9
10
11
0 0.5 1 1.5 2 2.5 3 3.5
Late
ral W
ate
r P
erm
eat
ion
Rat
e (µ
g/d
ay)
T-Peel Adhesion Strength (N/cm)
F18 F18 CoronaS3 S3 Corona

125
are but one of the many differences between the two types of adhesives which must be
considered for their application to OPV encapsulation. To better compare these materials and
provide context for their measured properties, reference adhesives were also tested alongside
the MAM PSAs and UV curing acrylates. 3M 467MP and 468MP, which differ only in
thickness, are cross-linked acrylic PSA films which were used as the reference material for
most testing. These materials, while not specifically designed as gas barrier adhesives, have
been used for OPV encapsulation in studies by other laboratories and thus provide a good
reference point for evaluating the materials used in this thesis. This section aims to provide a
general overview of how the two types of adhesives used in this thesis compare to each other
and their suitability for OPV encapsulation.
In general, all of the adhesives were fairly flexible, though F18, M65 and M75 remained
more rigid throughout the entire operating range of temperatures as can be seen in Figure 4.15.
F18 in particular raises some concerns over its rigidity at low temperatures since its Tg falls
within the operating temperature range of outdoor solar modules. It may be possible to re-
formulate this adhesive to have a lower Tg, though this would likely come at the cost of the
adhesion strength as seen from the evaluation of F14 and F17. Overall however, all of the
materials tested are flexible enough to be used in OPV encapsulation for many applications. If
extremely high flexibility or very cold temperature operation is needed, M85 and S3 would be
the best candidates.

126
-80 -60 -40 -20 0 20 40 60 80 100 120 140 160
0,01
0,1
1
10
100
1000
10000
468MP
M65
M75
M85
F18
Sto
rag
e M
odu
lus (
MP
a)
Temperature (°C)
Figure 4.15 Plots of the storage modulus, E', as measured by tensile DMTA at 3°C/min, 1Hz and 0.1% strain are shown
for several adhesives.
The adhesion of the PSAs was generally found to be much stronger than that of the UV
curing acrylates. Just as with the MAM adhesives, the reference adhesive was also found to
have greatly varying adhesion depending on the processing conditions as can be seen in Figure
4.16. To properly compare values from T-peel adhesion tests, it is important that the samples
use the same substrates and have the same adhesive thickness as both of these factors can greatly
affect the results. A comparison of the adhesion strength of several adhesives using the same
substrates and adhesive thickness can be seen in Table 4.10. The MAM PSAs, once annealed,
showed stronger adhesion than the reference material on PET. M85 in particular showed
excellent adhesion to both PET and barrier films. Despite their good adhesion after annealing,
the low tack of M65 and M75 made them quite difficult to process using standard PSA
lamination techniques. This led to many problems when testing these materials in the optical
calcium test and greatly reduces their suitability for OPV encapsulation. Laminating these
adhesives at an elevated temperature may help to alleviate these issues, though this complicates
the lamination process. While S3 showed adhesion similar to that of the reference material, F18
was much weaker. This could be a potential problem for application of this adhesive for OPV
encapsulation due mainly to permeation along the interface. Mechanically, although its
adhesion was lower than that of the reference PSA, F18 did provide enough adhesion to avoid

127
facile delamination of the encapsulation and cannot be ruled out for OPV encapsulation on the
basis of its adhesion.
As Received
As Received + Anneal
IPA Sonicated
IPA Sonicated + AnnealCorona
Corona + Anneal
0
1
2
3
4
5
6
7
8
Adhesive
Thickness
50 um
100 um
125 um
250 um
Ad
he
siv
e S
tre
ng
th (
N/c
m)
Surface Treatment
Figure 4.16 T-peel adhesion results are shown for the reference adhesives 3M 467MP and 468MP on Oike VX 25T-
2PO substrates with various processing. The anneal used in this study was the same as the drying procedure for optical
calcium test samples: 80°C for 2-3 days in a vacuum oven at 1-5mbar. “As Received” samples were laminated to the
barrier film immediately after removal of the barrier film’s protective layer with no subsequent surface preparation.
Error bars represent one standard deviation.
Table 4.10 The T-peel adhesion strength of several adhesives are shown with the standard deviation in parentheses.
All samples had a single adhesive layer with a thickness of approximately 50μm. The failure type is color coded where
yellow is adhesive failure at the adhesive-to-adhesive interface; green is adhesive failure at the adhesive-to-substrate
interface; and blue is cohesive failure in the adhesive. *Values with 2 layers of adhesive with a combined thickness of
50μm are shown for comparison for M65 which was too rigid to measure as a single layer.
Substrate 467MP M65 M75 M85 F18 S3
PET (50μm) 2.35 N/cm 4.85 N/cm*
(0.70N/cm)
4.77 N/cm
(0.68N/cm)
7.41 N/cm
(0.53N/cm)
1.32 N/cm
(0.15N.cm)
3.01 N/cm
(0.10N/cm)
Oike
VX 25T-2PO
2.30 N/cm
(0.27N/cm)
Stick-Slip Not Tested 7.54 N/cm
(1.55N/cm)
1.32 N/cm
(0.15N/cm)
1.76 N/cm
(0.20N/cm)
For optical properties, UV-Vis transmission spectra can be seen in Figure 4.17. The
MAM PSAs have excellent transparency in the UVA and visible range and have no major
concerns in this regard. F18 shows similar performance to the reference PSA with some
absorption of UVA wavelengths. However, most flexible barrier films, such as Oike VX 25T-
2PO, are designed to be UV blocking in order to protect the OPV from photo-degradation. This
makes any UVA absorption by the adhesive moot as this light is mostly blocked before it would

128
arrive at the adhesive layer in an encapsulated device. One adhesive which does have some
cause for concern from transparency is S3, which does have some absorption of wavelengths
which are transmitted by the barrier film. This region is quite small however and should not
cause a large loss of power conversion efficiency in the device unless the active layer has very
strong quantum efficiencies in the blue region. It should also be noted that all of the adhesives
outperformed the reference material at longer wavelengths.
Figure 4.17 UV-Vis spectroscopy using a standard detector was performed on both a 50μm thick PET film and PET
films with 50μm coatings of adhesive. For the adhesive samples, the PET surface was facing the laser source so that the
same amount of reflection was present for all samples. The transmission spectrum for the barrier film Oike VX 25T-
2PO with no adhesive coating is also shown to illustrate its UV blocking.
The permeation of the adhesives was evaluated using the optical calcium test and the
results for lateral permeation are shown in Figure 4.18. It is immediately noticeable that the
PSAs had much higher lateral permeation rates than the UV curing acrylates. As previously
mentioned, the UV curing acrylates do not show a dependence on the adhesive thickness which
indicates that the bulk barrier properties are quite good and that the interface is the dominant
permeation pathway for water vapor. By comparison, M85 shows a strong dependence on
adhesive thickness which indicates relatively high bulk water vapor permeation compared to
the interface. When using the analytical model described in Chapter 3, M85 has an apparent
interfacial permeation rate of 6.59x10⁻⁵g/m/day compared to 2.86x10⁻⁵g/m/day for the reference
material. This shows that despite its strong adhesion, the interface remains an important
permeation pathway for the MAM PSAs. The contrasting trends of M85 to the UV curing
acrylates appear to indicate that good adhesion is necessary but not sufficient for limiting
0
10
20
30
40
50
60
70
80
90
100
250 300 350 400 450 500 550 600 650 700 750 800
Tran
smis
sio
n (
%)
Wavelength (nm)
PET 50um
Oike VX 25T-2PO
3M 467MP on 50um PET
Sartomer F#18 on 50um PET
Sartomer S3 on 50um PET
MAM M85 on 50um PET

129
interfacial permeation. The already strong adhesion and high bulk permeation rate of M85 make
improvement of its bulk barrier properties the simplest method to improve its overall barrier
performance. On the other hand, improvements to the bulk barrier properties of the UV curing
acrylates can be predicted to have only minimal effects on the overall lateral permeation rate of
these adhesives. These hypotheses are investigated in detail in Chapter 5.
Figure 4.18 A plot of the average apparent lateral permeation rate as measured by the modified optical calcium test is
shown for several adhesives. All values have been normalized to 45mm X 45mm calcium deposits to adjust for slight
differences between samples. Error bars represent one standard deviation. “PSA Ref” refers to 3M 367MP and 468MP.
Conclusions
The thermo-mechanical, optical and permeation properties of MAM PSAs and UV
curing acrylate adhesives were studied in order to determine their applicability to OPV
encapsulation. MAM PSAs, which are based on solution processed block co-polymers, showed
very strong adhesion to flexible plastic surfaces after annealing and also provided extremely
good optical clarity in the UVA and visible wavelengths. However, before annealing the most
rigid materials were difficult to properly laminate due to their low tack at room temperature.
While their mechanical properties generally follow the trend of more PMMA leading to more
0
5
10
15
20
25
30
35
0 50 100 150 200 250 300
Late
ral W
ate
r P
erm
eati
on
Rat
e (µ
g/d
ay)
Adhesive Thickness (µm)
PSA Ref.
PSA Ref Corona
M65
M75
M85
F18
F18 Corona
S3
S3 Corona

130
rigidity, there is a discontinuity in this behavior due to a change in morphology from micellar
to worm-like for the highest PMMA content adhesive. This discontinuity was also seen in
optical calcium tests where the two micellar adhesives had similar water vapor permeation
while the worm-like adhesive is possibly slightly less permeable. However, even the lowest
water vapor permeation rates were still quite high compared to the reference PSA and UV
curing acrylates. Not only the bulk permeation but also the interfacial permeation was found to
be high for these materials despite their strong adhesion.
Unlike the MAM PSAs, UV curing acrylates had adhesion problems on flexible plastics
which required adjusting the formulations. The addition of a tackifying resin was found to
increase the adhesion and flexibility of these adhesives, though it also caused the adhesive to
become less transparent in the UVA and blue wavelengths. The UV curing acrylates
outperformed both the MAM PSAs and the reference PSA in optical calcium tests. The results
show no dependence on the adhesive thickness, indicating that the interface was the dominant
permeation pathway for water vapor. The use of a hydrophobic tackifying resin and corona
treatments did lower the permeation rate even further as the lateral water permeation was
strongly linked to the adhesion. The lower water vapor permeation rates and acceptable levels
of adhesion make these adhesives good candidates for OPV encapsulation.
Both types of adhesive showed promise in meeting different requirements for OPV
encapsulation and merit further investigation. The high bulk permeation rate of the MAM
adhesives could potentially be improved through the addition of inorganic particles which limit
permeation. UV curing acrylates on the other hand could benefit from a stronger interface.
Additionally, both types could potentially benefit from the use of active getter materials to limit
permeation. The investigation of these hypotheses for improving the performance of these
adhesives will be discussed in Chapter 5.

131
Chapter 5: Nanocomposites
Introduction
In order to alter various properties of adhesives, the addition of nanoparticles of
inorganic materials to form a nanocomposite is a common method. This idea has been applied
to the adhesives studied in this thesis in order to improve their barrier properties. Two different
approaches to improving the water vapor barrier properties were employed through the use of
either passive or active nanoparticles. Passive phyllosilicate particles were used to lengthen the
diffusion pathway by creating a tortuous path. On the other hand, active zeolite nanoparticles
were used to bind permeating water molecules via adsorption.
Overview of Particles
Phyllosilicates
Phyllosilicates are particles which are commonly used for passive barrier composites.
Although they can often have high water sorption and thus an active nature, this is reliant upon
their structure remaining in the form of stacked layers. Between these layers, ions can be added
which aid in the sorption of water. However, in place of metal ions, organic ions can also be
added. The organic ions then often have other organic structures attached which cause the
particles to become exfoliated into individual plates once introduced into an excess of an
appropriate organic solvent. The exfoliated plate-like particles have very high aspect ratios with
diameters of several microns and thicknesses of only a few nanometers. This creates a large
number of nanoparticles which create a tortuous path for permeating species, thus making a
passive nanocomposite.
Three different grades of phyllosilicates were evaluated consisting of either
montmorillonite or bentonite (a mix of mostly montmorillonite with other phyllosilicates).
Cloisite Na+ used sodium ions between the layers and remained as a precipitate in both acetone
and toluene even after sonication and overnight magnetic stirring. Its lack of organic
modification made this material a poor choice for use in adhesive nanocomposites. Cloisite 10A
and 15A both used ammonium salts to organically modify the particles. Both had two organic

132
tails on each ammonium ion. Cloisite 10A used one benzyl group and one hydrogenated tallow
while 15A used two hydrogenated tallow groups. Both types of particles were able to be
dispersed in toluene, with Cloisite 10A being faster and easier to disperse than 15A. When
tested in dynamic light scattering (DLS) after dispersion in toluene, mono-disperse signals were
seen for both types of particles. Due to their very high aspect ratio and the fact that DLS
calculations assume spherical particles, the sizes of the particles calculated from DLS do not
correspond to accurate particles sizes. Nevertheless, the calculated particle spherical diameters
were 84nm and 237nm for 10A and 15A respectively. Due to its relative ease of use in toluene,
Cloisite 10A was chosen for use with MAM PSAs which are deposited from solution in toluene.
When the particles were added to uncured F18 and S3 however, it was found that
Cloisite 15A was easier to disperse than 10A, and thus Cloisite 15A was chosen for use with
UV curing acrylates. However, it should be noted that the dispersion into these adhesives was
more difficult than into toluene and required long periods of magnetic stirring and several cycles
of sonication. 5wt% of Cloisite 15A did cause the liquid adhesives to become cloudy and
produced a slight increase in viscosity. Concentrations of 10wt% phyllosilicate did not fully
disperse and thus testing was limited to 5wt% phyllosilicate composites.
Zeolites
Nanoparticles of zeolites were tested as active materials which can adsorb water
molecules to prevent them from permeating further into the adhesive. The zeolites tested were
NZL-40 which are nanoparticles of approximately 30-60nm in size with a Linde Type L (LTL)
structure. This structure has pore diameters in the range of 8-11Å and smaller channels of <4Å
in diameter.180 Though aluminosilicates by nature, these particles have had some ions
exchanged with sodium ions. When dispersed in toluene, DLS showed that the particles could
indeed be well dispersed, though they quickly aggregate. However, the aggregations were
relatively weak and could be easily re-dispersed by shaking the cuvette by hand for a few
seconds. This can be seen in Figure 5.1 which shows consecutive runs of DLS measurements
with each measure starting when the previous measure was complete. When cast from toluene,
the particles showed some aggregation as can be seen in the transmission electron microscopy
images in Figure 5.2. It can be seen that despite the aggregation, the total size remains quite
small and the particles were deemed acceptable for use with MAM PSAs. To limit any
aggregation, MAM PSA nanocomposites using NZL-40 particles were sonicated immediately
prior to deposition.
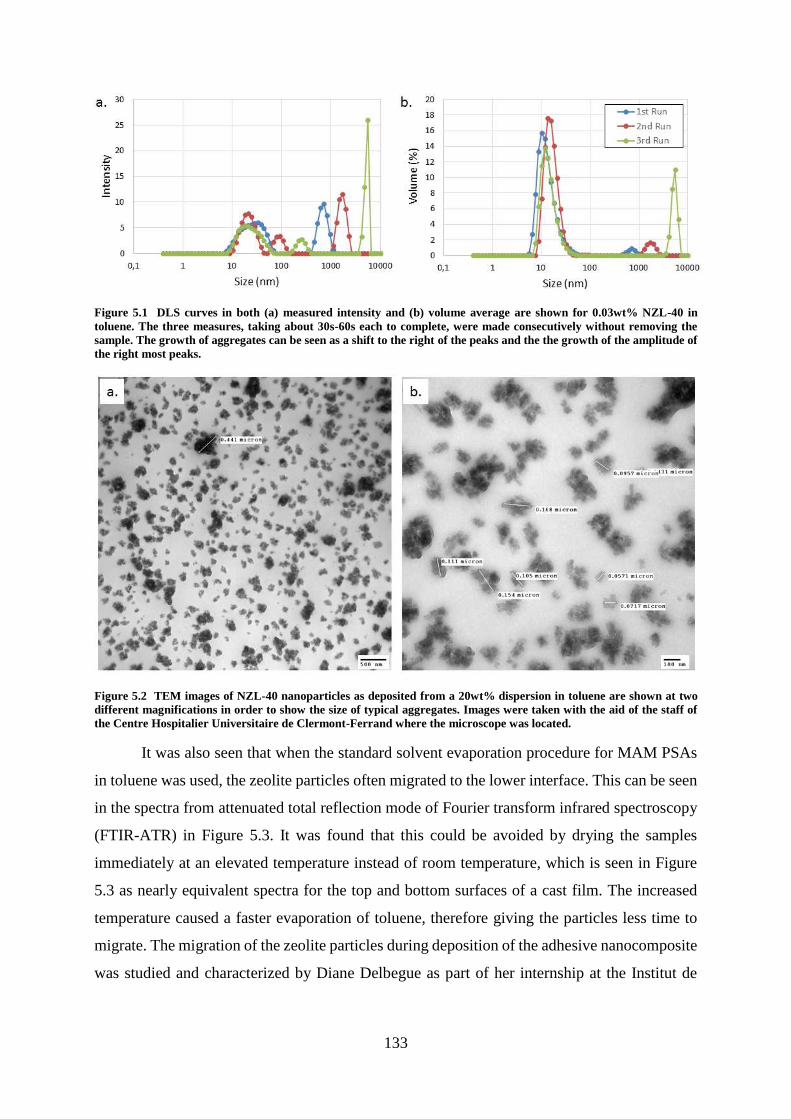
133
Figure 5.1 DLS curves in both (a) measured intensity and (b) volume average are shown for 0.03wt% NZL-40 in
toluene. The three measures, taking about 30s-60s each to complete, were made consecutively without removing the
sample. The growth of aggregates can be seen as a shift to the right of the peaks and the the growth of the amplitude of
the right most peaks.
Figure 5.2 TEM images of NZL-40 nanoparticles as deposited from a 20wt% dispersion in toluene are shown at two
different magnifications in order to show the size of typical aggregates. Images were taken with the aid of the staff of
the Centre Hospitalier Universitaire de Clermont-Ferrand where the microscope was located.
It was also seen that when the standard solvent evaporation procedure for MAM PSAs
in toluene was used, the zeolite particles often migrated to the lower interface. This can be seen
in the spectra from attenuated total reflection mode of Fourier transform infrared spectroscopy
(FTIR-ATR) in Figure 5.3. It was found that this could be avoided by drying the samples
immediately at an elevated temperature instead of room temperature, which is seen in Figure
5.3 as nearly equivalent spectra for the top and bottom surfaces of a cast film. The increased
temperature caused a faster evaporation of toluene, therefore giving the particles less time to
migrate. The migration of the zeolite particles during deposition of the adhesive nanocomposite
was studied and characterized by Diane Delbegue as part of her internship at the Institut de

134
Chimie de Clermont-Ferrand. Additionally, it can be seen in Figure 5.4 that the addition of the
zeolite nanoparticles did not change the morphology of the MAM PSAs.
Figure 5.3 FTIR-ATR spectra of M85 with 5wt% NZL-40 are shown for both the top and bottom surfaces for films
cast with initial drying at room temperature (RT) and at 60°C. After initial drying, all samples were fully dried at 90°C
for 10min. All films were cast to an uncontrolled thickness on fluoropolymer sheets from a solution of 25wt% adhesive
nanocomposite in toluene. The NZL-40 spectrum was recorded in transmission FTIR using a potassium bromide
substrate. All testing was performed by Diane Delbegue.

135
Figure 5.4 AFM images taken in tapping mode of (a) M85, (b) M85 with 5wt% NZL-40, (c) M65 and (d) M65 with
10wt% NZL-40 are shown in both (top) hieght and (bottom) phase. All images show an area of 5μm x 5μm. The images
for M65 and M85 were taken with the aid of Isabel Fraga Dominguez at the Institut de Chimie de Clermont-Ferrand.
It can be seen that the addition of NZL-40 nanoparticles did not change the morphology of the MAM PSAs.
As active water getters, the sorption of water by NZL-40 particles was also characterized
using moisture content analysis. This testing measures the change in mass of a sample when it
is heated. The loss of mass during heating can then be attributed to desorbed gases, which in
the case of zeolites is mainly due to water vapor. In the testing shown in Figure 5.5, particles
were dried using the moisture analyzer at 130°C and then exposed to ambient air for various
periods of time before being dried and measured at 130°C. The results show a rapid sorption of
2-3wt% almost immediately upon exposure to ambient air. The sorption then continues to
increase rapidly after only a few minutes of exposure, ultimately achieving a total water
sorption capacity of 14% after overnight exposure to ambient air. This is a similar capacity to
the 10-13wt% reported by the manufacturer. The results of this testing show the importance of
thoroughly drying the zeolites immediately before use, and that an inert atmosphere should be
used whenever possible when handling the zeolites.

136
Figure 5.5 The measured volatile content of NZL-40 nanoparticles from drying at 130°C is shown after various
exposure times to ambient air at 24°C and 57% relative humidity.
Comparison of Properties: Neat vs.
Phyllosilicate vs. Zeolite
The addition of nanoparticles to the adhesives studied in this thesis was designed to
impact the gas barrier properties of the adhesives. However, as is almost always the case when
changing a material’s formulation, other properties can change as well. It therefore becomes
important to look at all of the changes to the adhesive regardless of whether the goal is to modify
or maintain that property. In this section the effects on the properties of the adhesives as a result
of modification with nanoparticles are discussed. For the MAM PSAs, the similar performance
by all three adhesives in optical calcium tests made M85 the most logical choice for further
testing as it provides the best adhesion and is the easiest of MAM PSAs to laminate. For this
reason, most nanocomposite testing for the MAM PSAs used this polymer adhesive.
0
2
4
6
8
10
12
14
16
1 10 100 1000 10000
Vo
lati
le c
on
ten
t (%
)
Exposure Time (min)
Datasheet maximummoisture content

137
Thermo-mechanical and Optical Properties
In general, the addition of inorganic particles into a polymeric adhesive causes the
composite to become more rigid than the neat adhesive with increases in both elastic modulus
and the glass transition temperature (Tg). Tensile dynamic mechanical thermal analysis
(DMTA) was used to compare the nanocomposites to the neat adhesives in this regard. Figure
5.6 shows curves for M85 and F18 for the neat adhesives, phyllosilicate nanocomposites and
zeolite nanocomposites.
Figure 5.6 The storage (E’, solid lines) and loss moduli curves (E”, dotted lines) from tenisle DMTA tests for materials
based on (a) M85 and (b) F18 are shown. All tests were performed at 3°C/min, 1Hz and 0.1% strain.
The Tg of M85, as measured by the peak of the loss modulus curve, remained relatively
stable with the addition of nanoparticles for both organically modified phyllosilicates and
zeolites. However, a slight increase in the rigidity of the composites below Tg was seen for both
nanocomposites, especially for organically modified phyllosilicates. Despite this increase in
rigidity, the nanocomposites are still very soft and flexible, thus posing no issue for use in
flexible OPV modules. Unfortunately, this soft nature also caused all samples to fall below the
limit of detection for the machine before reaching the 65°C temperatures used for optical
calcium tests.
For F18, the addition of organically modified phyllosilicates did little to change the
rigidity of the adhesive. This nanocomposite did show an elevated storage modulus at
temperatures well below Tg, but then exhibited a sharper transition which gave it a nearly
identical storage modulus as neat F18 throughout most of the glass transition region. The peak
of the loss modulus curve was also slightly modified, moving from -20°C for the neat adhesive
to -9C for the nanocomposite and thus showing an increase in the Tg. For the purpose of
encapsulating OPV modules, the mechanical properties can be considered to be very similar for

138
this nanocomposite. On the other hand, zeolite nanoparticles did cause the adhesive to become
more rigid and showed an increase in the storage modulus throughout the entire temperature
ranged tested. The peak of the loss modulus curve was also shifted from -20C for the neat
adhesive to -10°C for the nanocomposite, thus indicating an increase in the Tg. This increase in
rigidity furthers the need for a more flexible version of F18 if the encapsulated flexible OPV
modules are to be used in colder climates, as discussed in Chapter 4.
As can be seen in Table 5.1, the addition of nanoparticles to M85 had only a minimal
effect on the adhesive strength. Both organically modified phyllosilicates and zeolite
nanoparticles led to slight increases in the adhesion compared to the neat polymer, though the
increases were not large. On the other hand, the addition of nanoparticles caused losses of
adhesion for F18, especially with organically modified phyllosilicates. Given the dominance of
interfacial permeation seen in neat F18 during the optical calcium test, losses in adhesion are
particularly worrying for F18 based nanocomposites. In an effort to increase this adhesion, tests
on corona treated substrates were also performed. The results plotted in Figure 5.7 show that
much of the adhesion loss for F18 with organically modified phyllosilicates could be recovered
through the use of a corona treatment with an average adhesion strength of 1.65N/cm for 50μm
of adhesive on Oike VX 25T-2PO substrates. As this nanocomposite was the weakest in
adhesion testing, it was also tested using the procedures employed for the preparation of optical
calcium test samples. This process requires an extended degassing procedure at 80°C under
vacuum (1-5mbar) between the corona treatment and the deposition of the adhesive onto the
barrier film. This reduces the surface energy gain from the corona treatment and thus raised
concerns for the relatively weak adhesion of the nanocomposite of F18 with organically
modified phyllosilicates. An average adhesion strength of 1.18N/cm was achieved with this
method, which, though lower than when the adhesive is deposited immediately after corona
treatment, is still much larger than the non-corona treated samples which had an average
adhesion strength of only 0.68N/cm.
Table 5.1 The T-peel adhesion strength for several adhesives are shown with the standard deviation in parentheses.
All samples had a single adhesive layer with a thickness of 50-70μm. The failure type is color coded where green is
adhesive failure at the adhesive-to-substrate interface and blue is cohesive failure in the adhesive.
Polymer Neat +5wt% Phyllo. % Change +5wt% zeolite % Change
M85 7.54 N/cm
(1.55N/cm)
7.95 N/cm
(0.60N/cm)
+5.4% 8.10N/cm
(0.48N/cm)
+11.5%
F18 1.32 N/cm
(0.15N/cm)
0.68 N/cm
(0.03N/cm)
-48.5% 1.14N/cm
(0.06N/cm)
-13.6%

139
Figure 5.7 The T-peel adhesion on Oike VX 25T-2PO barrier films for F18 and a nanocomposite of F18 with 5wt%
organically modified phyllosilicates is shown for various surface treatments of the barrier film. The degassing procedure
is the same used for the optical calcium test of 80°C and 1-5mbar for 2 days before cooling to 30°C still under vacuum.
The addition of nanoparticles also had an influence on the optical properties of the
nanocomposites as can be seen in Figure 5.8. All samples were coated onto a single 50μm thick
PET substrate and tested with the PET facing the incoming laser in order to avoid changes from
reflection. M85, which showed almost no difference compared to uncoated PET when neat,
was unaffected optically by the addition of zeolite nanoparticles. However, organically
modified phyllosilicate particles caused a reduction in transparency across the visual spectrum,
especially at shorter wavelengths. F18 showed the opposite behavior in nanocomposites with
organically modified phyllosilicates causing only a minimal loss of transparency at short
wavelengths while zeolite nanoparticles caused a large loss across the whole visual spectrum.
Both M85 with organically modified phyllosilicates and F18 with zeolite nanoparticles would
likely have an impact on the overall performance of OPV modules as they block light which
would normally traverse the barrier film. While further investigation is needed to determine the
exact cause of this contrasting behavior between M85 and F18, the most likely cause is a
difference in ability of the particles to disperse within the polymer matrix. It should also be
noted that all measures were made using a standard detector and not with an integration sphere.
This means that the actual transmission of the composites could be higher as the particles may
have caused enough light scattering that some light that was transmitted across the sample
exited the material at a sufficiently large angle to miss the detector. While a larger amount of
F18 F18 + 5% Phyllo.0.0
0.2
0.4
0.6
0.8
1.0
1.2
1.4
1.6
1.8
2.0
IPA Cleaned
Corona Treated
Corona Treated and Degassed
T-P
ee
l A
dh
esio
n (
N/c
m)
Adhesive
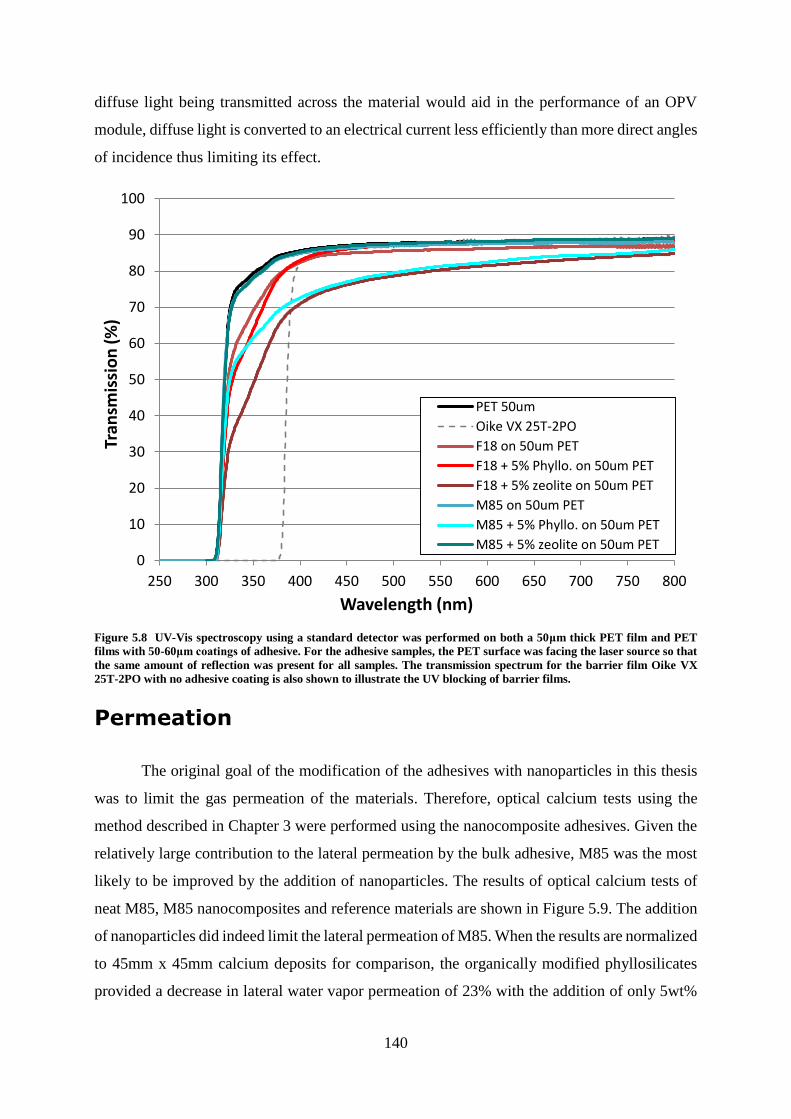
140
diffuse light being transmitted across the material would aid in the performance of an OPV
module, diffuse light is converted to an electrical current less efficiently than more direct angles
of incidence thus limiting its effect.
Figure 5.8 UV-Vis spectroscopy using a standard detector was performed on both a 50μm thick PET film and PET
films with 50-60μm coatings of adhesive. For the adhesive samples, the PET surface was facing the laser source so that
the same amount of reflection was present for all samples. The transmission spectrum for the barrier film Oike VX
25T-2PO with no adhesive coating is also shown to illustrate the UV blocking of barrier films.
Permeation
The original goal of the modification of the adhesives with nanoparticles in this thesis
was to limit the gas permeation of the materials. Therefore, optical calcium tests using the
method described in Chapter 3 were performed using the nanocomposite adhesives. Given the
relatively large contribution to the lateral permeation by the bulk adhesive, M85 was the most
likely to be improved by the addition of nanoparticles. The results of optical calcium tests of
neat M85, M85 nanocomposites and reference materials are shown in Figure 5.9. The addition
of nanoparticles did indeed limit the lateral permeation of M85. When the results are normalized
to 45mm x 45mm calcium deposits for comparison, the organically modified phyllosilicates
provided a decrease in lateral water vapor permeation of 23% with the addition of only 5wt%
0
10
20
30
40
50
60
70
80
90
100
250 300 350 400 450 500 550 600 650 700 750 800
Tran
smis
sio
n (
%)
Wavelength (nm)
PET 50um
Oike VX 25T-2PO
F18 on 50um PET
F18 + 5% Phyllo. on 50um PET
F18 + 5% zeolite on 50um PET
M85 on 50um PET
M85 + 5% Phyllo. on 50um PET
M85 + 5% zeolite on 50um PET

141
of Cloisite 10A compared to the neat adhesive at the same thickness. This value becomes a 53%
decrease when the nanoparticle loading is increased to 10wt%. Though the ability of passive
nanocomposites based on organically modified phyllosilicates to limit gas permeation has been
well demonstrated, these results confirm that this type of nanocomposite is indeed an effective
method to limit the water vapor permeation in thermoplastic block copolymer PSAs. However,
to the knowledge of the author, no gas permeation data has been published for nanocomposites
of zeolite nanoparticles in PSAs. For the active nanocomposite of M85 with NZL-40
nanoparticles, a decrease in lateral water vapor permeation of 57% was seen for a loading of
only 5wt% of nanoparticles compared to neat M85 at the same thickness and calcium deposit
size. This large decrease in the apparent lateral water vapor permeation rate demonstrates the
effectiveness of this type of active nanocomposite for improving gas barrier properties of
flexible adhesives.
Figure 5.9 A plot of the average apparent lateral permeation rate as measured by the modified optical calcium test is
shown for M85 based adhesives and reference materials. All values have been normalized to 45mm X 45mm calcium
deposits to adjust for slight differences between samples. Error bars represent one standard deviation. “PSA Ref” refers
to 3M 367MP and 468MP while FTBA-25 is a state-of-the-art commercial barrier PSA.
Nanocomposites of both 10wt% organically modified phyllosilicate and 5wt% of zeolite
nanoparticles in M85 were able to outperform the reference material of 3M 467MP and 468MP
in optical calcium tests. Despite the large decrease in apparent lateral water vapor permeation,
the relatively high lateral water vapor permeation in neat M85 prevented the nanocomposites

142
from outperforming the state-of-the-art barrier PSA FTBA-25 from 3M. Further development
and formulation of adhesives based on M85 will be required to reach this level, though the use
of active nanoparticles such as NZL-40 provides a powerful tool to improve the water vapor
barrier properties of this class of adhesive without harming the flexibility, adhesion or
transparency.
Nanocomposites of F18 were also tested in optical calcium tests. The dominance of the
interfacial permeation compared to that in the bulk adhesive for F18 made addition of
nanoparticles less likely to limit the overall lateral water vapor permeation than for the MAM
PSAs. Nevertheless, Figure 5.10 shows that there was some improvement, especially for
nanocomposites with organically modified phyllosilicates. This result is particularly surprising
since these nanocomposites showed decreased adhesion, which would imply a weaker interface
for an adhesive which is already susceptible to interfacial permeation. The combination of
weaker adhesion and decreased permeation could indicate an increased concentration of
organically modified phyllosilicate particles near the interface due to sedimentation. This could
lower the permeation rate of the interlayer while simultaneously affecting the adhesion, though
further study is required to test this hypothesis. Regardless of its lower adhesion compared to
neat F18, this nanocomposite did exhibit lower lateral water permeation for corona treated
samples. This continues the trend seen for other materials where increased adhesion leads to
lower lateral water permeation, as long as the adhesives are of the same chemistry.

143
Figure 5.10 A plot of the average apparent lateral permeation rate as measured by the modified optical calcium test is
shown for several F18 based adhesives and a reference material. All values have been normalized to 45mm X 45mm
calcium deposits to adjust for slight differences between samples. Error bars represent one standard deviation.
Samples with zeolite nanoparticles also showed an improvement compared to neat F18,
with the apparent lateral water permeation being very similar to that of the nanocomposites
using organically modified phyllosilicates. The relatively small loss of adhesion compared to
neat F18 for nanocomposites using zeolite nanoparticles indicates a smaller presence of
particles in the interlayer compared to that seen for the organically modified phyllosilicates.
However, the particles continued to act as a sink for moisture in the adhesive allowing for the
decreased water permeation. The lack of a larger impact on the water vapor permeation by the
zeolite nanoparticles in F18 nanocomposites is also somewhat surprising considering the large
effect of these particles on M85’s water vapor permeation. However this result does agree with
the initial hypothesis that improvements to the bulk barrier properties of F18 would not greatly
affect the apparent lateral water vapor permeation as the dominant permeation pathway is along
the interface. Another surprising result for this composite was the increase in water permeation
caused by the use of a corona treatment as this was the only material to display such behavior.
The adhesion for this nanocomposite was not measured on corona treated substrates so it is still
possible that this nanocomposite did not exhibit the same increase in adhesion seen for other
0
2
4
6
8
10
12
0 20 40 60 80 100 120 140 160 180
Late
ral W
ater
Per
mea
tio
n R
ate
(µg/
day
)
Adhesive Thickness (µm)
F18
F18 Corona
F18 +5% Phyllo.
F18 +5% Phyllo. Corona
F18 +5% Zeolite
F18 +5% Zeolite Corona
FTBA-25

144
materials on corona treated substrates. Although further study is needed to determine the exact
cause of the increased lateral water permeation using corona treated substrates, it is possible
that the increased polarity caused a larger migration of zeolite particles to the interface leading
to a weaker interface.
It should also be noted though, that even the best performing F18 based nanocomposites
did not achieve the same level of water vapor barrier protection as the state-of-the-art barrier
adhesive 3M FTBA-25. In order to reach this level of performance in the optical calcium test,
improvements to the interface rather than the bulk adhesive will likely be needed due to this
pathway’s relatively high water vapor permeation for F18.
Nanocomposites based on S3 were also tested in the optical calcium test, though they
were not studied in-depth for changes to thermo-mechanical and optical properties. As the neat
adhesive with the lowest apparent lateral water vapor permeation rate in optical calcium tests,
attempts were made to further improve S3 with the hope of outperforming FTBA-25 in optical
calcium tests. However, changes to the bulk adhesive through the introduction of nanoparticles
showed little effect on the water vapor permeation as can be seen in Figure 5.11. As with F18,
the dominance of the interface as a permeation pathway must first be overcome in order for S3
based materials to reach state-of-the-art water vapor barrier performance.
0
1
2
3
4
5
6
7
8
9
0 20 40 60 80 100 120 140 160
Late
ral W
ater
Per
mea
tio
n R
ate
(µg/
day
)
Adhesive Thickness (µm)
S3
S3 Corona
S3 +5% Phyllo.
S3 +5% zeolite
S3 +5% zeolite Corona
FTBA-25

145
Figure 5.11 A plot of the average apparent lateral permeation rate as measured by the modified optical calcium test is
shown for several F18 based adhesives and a reference material. All values have been normalized to 45mm X 45mm
calcium deposits to adjust for slight differences between samples. Error bars represent one standard deviation.
Conclusions
The inclusion of inorganic nanoparticles into both MAM PSAs and UV curing acrylates
was achieved using both phyllosilicate and zeolite particles. To properly disperse the
phyllosilicates, an appropriate organic modification was necessary, especially for UV curing
acrylates where dispersion took longer to achieve. Zeolite nanoparticles were able to be
dispersed without the use of organic modifiers, though some aggregation did occur over a
period of a few minutes. However, these aggregates were easily re-dispersed leading to the
sonication of all nanocomposites immediately prior to deposition. The observed sedimentation
of zeolite nanoparticles in MAM PSAs during deposition was easily remedied by increasing the
evaporation rate of the solvent. The addition of nanoparticles also caused slight increases in the
viscosity of the adhesives, especially for the UV curing acrylates which already have higher
viscosities. AFM images also confirmed that the morphology of the MAM PSAs was
unchanged by the addition of zeolite nanoparticles.
For the MAM PSAs, the presence of organically modified phyllosilicates caused the
adhesive to become more rigid and less transparent, though neither property was altered to the
point of making the material unsuitable for OPV encapsulation. Zeolite particles had a much
smaller effect on these properties showing only a very slight increase in rigidity and almost no
change in transparency. Both types of nanoparticles had little effect on the adhesion of the
adhesive showing very minor increases in t-peel adhesion strength. For the UV curing acrylate
adhesive F18 however, different trends were seen. Unlike the MAM PSAs, it was zeolite
nanoparticles that had stronger increases in rigidity and larger losses of transparency. The
organically modified phyllosilicates did show an elevated Tg, but did not greatly affect the
rigidity or transparency. The changes in adhesion were more notable for F18 based
nanocomposites with both types of particles showing decreased adhesion compared to the neat
adhesive. This was especially true for organically modified phyllosilicates, though most of the
loss of adhesion could be recouped through the use of a corona treat on the substrate prior to
bonding. This is of particular importance for F18 which was shown in Chapter 4 to water vapor
permeation dominated by the interfacial pathways.
When subjected to optical calcium tests, M85 and F18 both had decreases in apparent
lateral water vapor permeation for all nanocomposites in comparison to the neat respective
146
adhesives. This change was greatest for M85 where nanocomposites of 5wt% and 10wt%
organically modified phyllosilicates decreased the lateral permeation rate by 23% and 53%
respectively compared to the neat adhesive. A nanocomposite of 5wt% zeolite nanoparticles
was even more effective, resulting in a 57% decrease in lateral permeation in optical calcium
tests as compared to the neat adhesive. The relatively large amount of permeation through the
bulk of M85 made the use of nanoparticles to limit permeation very effective. For F18, the
decreases in permeation were smaller, but still present. Nanocomposites of 5wt% organically
modified phyllosilicates and nanocomposites of 5wt% zeolite nanoparticles showed similar
performance to each other in optical calcium tests. It was expected that nanocomposites would
have only minimal effects on the lateral permeation of F18 due to the interfacial permeation
pathway being dominant, however both types of particles sere able to decrease the water vapor
permeation as they were also present near the interface. This is especially true for the
organically modified phyllosilicates which showed a large loss in adhesion indicating the
presence of particles in the interlayer and at the interface. In this location the nanoparticles were
able to have a large enough effect on the water vapor permeation to overcome the decrease in
adhesion, which, according to the trends seen in Chapter 4, would be expected to cause an
increase in permeation.
The results seen in the characterization of nanocomposites of both MAM PSAs and UV
curing acrylates with both organically modified phyllosilicates and zeolite nanoparticles
indicate that these materials have great potential for use in encapsulating flexible OPV devices,
which will be discussed in Chapter 6. In particular, the use of zeolite nanoparticles in MAM
PSAs is very promising given their large reduction in permeation while having little effect on
rigidity, adhesion or transparency. Nanocomposites using UV curing acrylates are also very
intriguing options as they showed the lowest water vapor permeation rates of any of the
materials developed in this thesis.

147
Chapter 6: Encapsulation of
Organic Photovoltaic Cells
Introduction
In addition to the characterization of the adhesives and nanocomposites described in
Chapters 4 and 5, these materials were also tested by encapsulating functional organic
photovoltaic (OPV) devices and subjecting them to accelerated aging conditions. As the end
goal for the development of the materials in this thesis is the encapsulation of flexible OPV
devices, this testing allows the materials to demonstrate their ability, or lack thereof, to be
implemented for their designed purpose. This testing also allows for a comparison of the water
permeation results from optical calcium tests with the aging of actual OPV devices in humid
environments. In this thesis, three different studies were performed using various encapsulation
schemes to test various adhesives.
All tests used OPV cells with an inverted structure and were all fabricated in the same
manner. The exact architecture of the cells can be seen in Figure 6.1 along with an image of a
complete device before encapsulation. All OPV devices for the various studies were prepared
by Lukas Wagner, Florence Ardiaca and Nathalie Nguyen, all of whom worked at the CEA’s
Laboratoire des Modules Photovoltaïques Organiques. The cells used 17mm x 25mm x 175μm
substrates consisting of PET with a transparent conducting oxide (TCO) on one surface. Pads
of chromium coated in gold were then deposited sequentially via evaporative physical vapor
deposition at the ends of the substrates to aid in contacting the electrodes when measuring the
completed cell. The electron transport layer (ETL) was made of zinc oxide nanoparticles spin
coated in ambient atmosphere from a suspension in ethanol. The active layer had a bulk
heterojunction structure of poly(3-hexylthiopene) (P3HT) for an absorber and phenyl C61
butyric acid methyl ester (PCBM) as an electron acceptor. This active layer was spin coated
onto the ETL from solution in dichlorobenzene inside an inert atmosphere glove box. The hole
transport layer (HTL) consisted of poly(3,4- ethylenedioxythiophene) blended with
poly(styrene sulfonate) (PEDOT:PSS) and was spin coated onto the active layer in air from an
aqueous solution. Finally, a silver back electrode was deposited by evaporative physical vapor
deposition in a manner that created two cells per substrate. All cells were then both measured

148
via J-V characterization and stored inside an inert atmosphere glove box. Only cells showing
good performance in J-V characterization were used in the encapsulation studies. All
accelerated aging was performed according to the ISOS-D-3 standard which uses 65°C and
85% relative humidity without illumination.
Figure 6.1 (a) A cross-sectional diagram of an OPV cell used in this thesis is shown with the different layers labeled.
Please note that the diagram is not to scale. (b) An image of the backside of a completed cell is shown. The red color
comes from the active layer while the light gray regions are the silver electrodes and the tan regions are the gold pads.
The configuration of the silver electrodes and gold pads demonstrates how two separate cells were fabricated on a single
substrate. (Photo taken by Matthieu Manceau of the Laboratoire des Modules Photovoltaïques Organiques)
Encapsulation Processes
As different encapsulation schemes present different advantages and problems, several
were considered for the testing used in this thesis. Exiting wires for electrical connections can
often create alternative pathways for permeation and were thus avoided when possible. This is
especially an issue for pressure sensitive adhesives (PSA) which, due to their limited ability to
flow, can often leave a gap at large, sharp changes in a surface such as a wire or bussing on a
substrate. One solution to this problem was to fully encapsulate the cells with no exiting wires
or electrical connections. To measure the cells, the barrier film can be cut open over the
electrodes. To protect the device from the scalpel used to cut the barrier film and from the
scraping needed to remove residual adhesive, a ribbon of 3M Charge-Collecting Solar Tape
3307 bussing was placed over the electrodes prior to encapsulation. This destructive process
means that each device can only be measured once after encapsulation, eliminating the ability
to measure the cells immediately after encapsulation and to track the aging of a single cell over
multiple time points. This scheme will henceforth be referred to as “one-shot” encapsulation
and can be seen in Figure 6.2a. Another solution which avoids exiting wires is to leave the
electrodes un-encapsulated. This scheme allows for repeated and facile measure of the cells,

149
however it also allows for much less control over the distances from the edge of the
encapsulation to the cell. It can also potentially cause the hygroscopic PEDOT:PSS layer to be
exposed to air in some regions outside the encapsulation, which provides a potential pathway
for water vapor permeation. This scheme can be seen in Figure 6.2b and will be henceforth
referred to as “open-electrode” encapsulation. A final encapsulation scheme which was used in
this thesis consists of using 3M Charge-Collecting Solar Tape 3307 bussing to connect the two
cells in parallel and then exit the encapsulation. This scheme provides good control over the
distance from the edge of the encapsulation to the cell and allows for repeated and facile
measure of the cells, however, it also creates the previously discussed problem of electrical
connections which exit the encapsulation. This scheme can be seen in Figure 6.2c and will
henceforth be referred to as “ribbon” encapsulation.
Figure 6.2 Images of ecapsulated OPV cells after ISOS-D-3 aging are shown for (a) one-shot, (b) open electrode and (c)
ribbon encapsulation shemes.
Accelerated Humidity Testing
Reference PSA
In order to verify the findings presented in Chapter 3 that adhesive thickness plays a role
in the total amount of lateral permeation, OPV cells were encapsulated using both 3M 467MP
and 468MP. As PSAs are more susceptible to leaving voids along the edge of electrical
connections which exit the encapsulation, the one-shot encapsulation scheme was chosen for
this study. This scheme also provides a geometry which is the most similar to the one used for
the optical calcium test. In order to measure each cell independently despite being connected in
parallel, a light blocking mask was used which caused only one cell to be illuminated during J-
V characterization. Four OPV devices (8 cells) were encapsulated using each adhesive and Oike
VX 25T-2PO barrier films. Two devices per adhesive were tested after 48 hours of exposure to

150
65°C and 85% relative humidity in dark storage while the remaining two devices per adhesive
were tested after 96 hours of exposure under the same conditions. The results of this testing,
which can be seen in Figure 6.3, were quite varied with some cells showing little degradation
of performance while others showed large amounts of degradation despite having identical
experimental conditions. Both the open circuit voltage (Voc) and fill factor (FF), which are not
shown in Figure 6.3, remained quite stable for most cells with the majority of the loss of
performance coming from a loss in short circuit current density (Jsc). For the cells which did
not show major degradation, the normalized power conversion efficiency (PCE) was quite
similar for both adhesives with the thinner 467MP being generally slightly less degraded for
measures after 96 hours. However, the very small difference in performance, combined with
the catastrophic failure of several cells, makes it difficult to draw conclusions as to whether one
adhesive outperformed the other. As OPV cells are much more complicated devices to fabricate
than a calcium deposit and contain multiple degradation mechanisms, they will often show more
variance in aging tests. This appears to have been the case in this study resulting in the inability
to confirm the effect of adhesive thickness on permeation presented in Chapter 3.

151
Figure 6.3 Plots of the short circuit current density (Jsc) and power conversion efficiency (PCE) of one-shot encapsualted
OPV cells using Oike VX 25T-2PO barrier films are shown after storage for vairous times at 65°C and 85% relative
humidity without illumination. Plots are shown for (a) each individual cell and also as (b) average values which exclude
highly degraded cells. Error bars represent ±1 standard deviation.
Comparison of Different Adhesives
A second more wide ranging study of OPV cell aging was also performed in order to
compare the relative effectiveness of several different adhesives for OPV encapsulation.
Because of the larger number of cells needed for one-shot testing and the desire for repeated
measures to construct aging curves for each cell, the open-electrode encapsulation scheme was
used for this study. F18 at different thicknesses and surface treatments was compared to the
reference material 3M 467MP and the state-of-the-art barrier adhesive 3M FTBA-25 with all
samples using Oike VX 25T-2PO barrier films. The power conversion efficiencies for cells
encapsulated with 150µm of F18 and corona treated barrier films as measured from J-V
characterizations as a function of aging time can be seen in Figure 6.4. These results show a
very large dispersion with some cells greatly outperforming others despite using identical
encapsulation materials and design. Although the encapsulation is designed to extend 7.5mm
outward from the edge of the substrate (the same distance as the optical calcium test) on the
ends sides with no electrodes, thinner materials formed voids along the edge of the device as
can be seen in Figure 6.5a. Since these voids have the potential to shorten the permeation path-

152
length from this edge, samples with these voids are denoted in Figure 6.4 with open markers
while samples with no voids in this location have solid markers.
Figure 6.4 Plots of the power conversion efficiency of open-electrode encapsualted OPV cells using 150µm of F18 and
corona treated Oike VX 25T-2PO barrier films are shown after storage for vairous times at 65°C and 85% relative
humidity without illumination. Open markers indicate voids in the encapsulation along the edge of the devices as seen
in Figure 6.5.
Figure 6.5 (a) Voids along the edges of the device are marked in yellow in this image of an OPV device encapsulated
using a PSA (3M FTBA-25) in an open-electrode scheme. The voids come from the inability of the thin, solid adhesive
(25μm thick per barrier film) to flow and completely enrobe the 175μm thick substrate of the OPV device. (b) The
misalignment of the silver electrodes can be seen by the different distances marked in orange. This can be seen in the
0
0.2
0.4
0.6
0.8
1
1.2
0 50 100 150 200
No
rmal
ized
PC
E
Aging Time (hr)
F18, 150um, cor, 3-1 F18, 150um, cor, 3-2
F18, 150um, cor, 9-1 F18, 150um, cor, 9-2
F18, 150um, cor, 10-1 F18, 150um, cor, 10-2

153
other dimension by the different distances marked in green between images b and c. (c) A region where the OPV
materials are outside the encapsulation is shown marked in blue on a device encapsulated with 150μm of neat F18.
The large differences in the rate of PCE loss likely come partially from the same type
of variance within the cells seen in the study using one-shot encapsulation. However, the open-
electrode encapsulation scheme also introduced another potentially large source of variance
from the imperfect alignment of the cells in relation to the encapsulation. As the cells were
fabricated, the exact placement of the silver electrodes was not carefully controlled. Since the
regions underneath the electrodes are responsible for the vast majority of the measured current,
varying the distance from the electrode to the edge of the substrate creates different permeation
path-lengths. Some cells in this study showed a difference of a few millimeters in this distance
as can be seen in Figure 6.5b. This variance is exacerbated by the relatively short distance to
the edge of the encapsulation in this scheme, causing the variance in electrode placement to
account for a larger percentage of the total permeation path-length. Additionally, the size and
exact location of the regions coated by the other layers of the OPV device were not controlled.
This poses a more significant problem for the open-electrode encapsulation scheme compared
to other schemes as the distance between these regions and the edge of the encapsulation can
be quite small. In fact, for some devices these regions extended past the edge of the barrier film
as can be seen in Figure 6.5c. This creates additional permeation pathways directly into the
device and can be particularly worrisome given the hygroscopic nature of some OPV materials
such as PEDOT:PSS.
The large amount of variance between cells seen in this study makes it difficult to
identify trends between the adhesives, especially for the F18 based adhesives. Nonetheless,
some comparisons can be made, especially when comparing only the best performing cells for
each test condition, as is done in Figure 6.6. Similar to the behavior seen in the study of one-
shot encapsulated devices, the loss of PCE in all cells was closely mirrored by a loss in the short
circuit current while the open circuit voltage and fill factor remained relatively stable. Some
cells did show a gradual loss in their fill factor, though this was always less drastic than the loss
in short circuit current and generally did not occur until the cell was already showing greatly
decreased PCE. In comparison to the reference adhesive 3M 467MP, all F18 thicknesses and
surface treatments had best performances that slower rates of PCE loss. This generally agrees
with the results of water permeation seen in the optical calcium test where F18 displayed a
lower apparent lateral water vapor permeation rate. Also agreeing with the general water vapor
permeation trends seen in the optical calcium test was the relatively slow loss of PCE by cells
encapsulated with FTBA-25. As a state-of-the-art adhesive designed as a water vapor barrier,
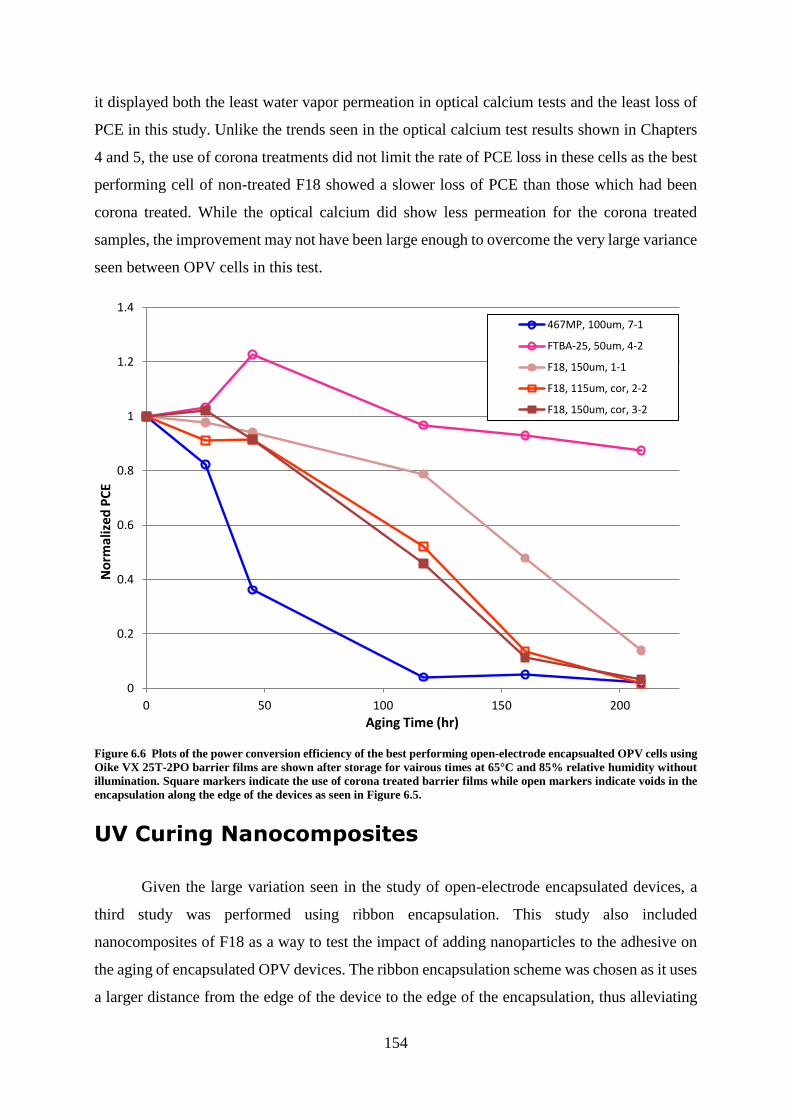
154
it displayed both the least water vapor permeation in optical calcium tests and the least loss of
PCE in this study. Unlike the trends seen in the optical calcium test results shown in Chapters
4 and 5, the use of corona treatments did not limit the rate of PCE loss in these cells as the best
performing cell of non-treated F18 showed a slower loss of PCE than those which had been
corona treated. While the optical calcium did show less permeation for the corona treated
samples, the improvement may not have been large enough to overcome the very large variance
seen between OPV cells in this test.
Figure 6.6 Plots of the power conversion efficiency of the best performing open-electrode encapsualted OPV cells using
Oike VX 25T-2PO barrier films are shown after storage for vairous times at 65°C and 85% relative humidity without
illumination. Square markers indicate the use of corona treated barrier films while open markers indicate voids in the
encapsulation along the edge of the devices as seen in Figure 6.5.
UV Curing Nanocomposites
Given the large variation seen in the study of open-electrode encapsulated devices, a
third study was performed using ribbon encapsulation. This study also included
nanocomposites of F18 as a way to test the impact of adding nanoparticles to the adhesive on
the aging of encapsulated OPV devices. The ribbon encapsulation scheme was chosen as it uses
a larger distance from the edge of the device to the edge of the encapsulation, thus alleviating
0
0.2
0.4
0.6
0.8
1
1.2
1.4
0 50 100 150 200
No
rmal
ize
d P
CE
Aging Time (hr)
467MP, 100um, 7-1
FTBA-25, 50um, 4-2
F18, 150um, 1-1
F18, 115um, cor, 2-2
F18, 150um, cor, 3-2

155
some of the variance from the positioning of the cells and the exposure of the OPV materials
outside of the encapsulation. In this study, this distance was set to 7.5mm as it corresponds to
the distance used in the optical calcium test. Since the ribbon of bussing used to measure the
device exits the encapsulation, care was taken to avoid creating the types of voids seen in Figure
6.5 along the edges of the bussing. This a particularly important issue as it would create a direct
pathway to the device along which gas permeation would occur rapidly. For this reason, no
PSAs were included in this study and only liquid adhesives which have the ability to flow and
close these voids were tested. The geometry used for the placement of the ribbon of bussing
also connected the two cells on each substrate in parallel, therefore creating a single device.
This, combined with the impracticality of using a light blocking mask in this experimental set-
up, led to each device being measured as a single entity instead of as individual cells. All
samples in this study used corona treated Oike VX 25T-2PO barrier films.
The normalized PCE of the cells as a function of aging time at 65°C and 85% relative
humidity in dark storage can be seen in Figure 6.7. Due to a malfunction with the J-V
characterization equipment on the solar simulator located in ambient atmosphere, the initial
measures (t=0) for all devices in this study were instead made using a different solar simulator
located inside an inert atmosphere glove box. Though both simulators are well calibrated and
were within their normal specifications, they do produce slightly different spectra of light. For
absorber materials that have quantum efficiencies that are highly dependent on the wavelengths
at which they are illuminated, such as P3HT, this change in spectra between solar simulators
leads to a reduction in the measured photo-current produced, and thus also the PCE, when using
the simulator in the inert atmosphere glove box. Though several attempts were made to quantify
this difference and correct the measurements after testing, a reliable method was not found.
Therefore, the initial values of PCE for this study appear to be lower than would otherwise have
been measured using the same simulator as the other measurements. This effect is at least
partially responsible for several cells showing immediate and sustained increases in PCE. All
measures made after the initial test used the same simulator located in ambient atmosphere and
are therefore directly comparable.

156
Figure 6.7 Plots of the power conversion efficiency of ribbon encapsualted OPV cells using Oike VX 25T-2PO barrier
films are shown after storage for vairous times at 65°C and 85% relative humidity without illumination. The
thickness of the adhesive layer is noted in the legend.
While all samples showed some formation of bubbles and voids near the edge of the
device where the ribbon of bussing meets the device, the samples using neat F18 with a
thickness of 150μm were especially poor in this respect. This was due to the adhesive layer
being too thin to allow for complete coverage of a region with such large changes in topology.
These voids are the likely source of why the devices encapsulated using thinner layers of neat
F18 decreased in PCE more quickly than those with thicker layers. The phyllosilicate
nanocomposites were not particularly poor with respect to voids but still showed a rapid loss of
PCE compared to the thick coatings of neat F18. This result is somewhat surprising as this
nanocomposite showed less water vapor permeation in optical calcium tests and little change
in transparency compared to neat F18 as was discussed in Chapter 5. The results of this study
indicate that the addition of phyllosilicates to this adhesive does not prolong the device lifetime.
However, this nanocomposite does warrant further study to fully understand why the decreased
water vapor permeation seen in optical calcium tests did not translate to increased device
lifetime. It is possible that another as of yet unidentified factor could also have played a role,
such as an interaction between the particles and the materials of the OPV cell or a change in
0
0.2
0.4
0.6
0.8
1
1.2
1.4
0 50 100 150 200 250 300
No
rmal
ized
PC
E
Aging Time (hr)
F18, 150um-1
F18, 150um-2
F18, 250um-1
F18, 250um-2
F18 + 5% phyllo., 200um-1
F18 + 5% phyllo., 200um-2
F18 + 5% phyllo., 200um-3
F18 + 5% zeolite, 200um-1
F18 + 5% zeolite, 200um-2
F18 + 5% zeolite, 200um-3

157
oxygen permeation. Interaction between the clay particles and the OPV materials is a
particularly pertinent possibility as phyllosilicates frequently have impurities which could
potentially impact OPV performance. On the other hand, active nanocomposites using zeolite
nanoparticles showed slower losses of PCE compared to neat F18. The ability of the zeolites to
adsorb permeating water before it can reach the device was evident by the very stable behavior
of the devices encapsulated with this nanocomposite for the first 50-100 hours of storage in the
very humid conditions of this study. Though nanocomposites of F18 with zeolite nanoparticles
did not show a large difference in water vapor permeation in the optical calcium test, the results
from encapsulating OPV devices imply that the zeolites are indeed effective at scavenging
water in devices.
Conclusions
The accelerated aging of encapsulated OPV devices at 65°C and 85% relative humidity
in dark storage has provided further insight into the barrier properties of F18 and its
nanocomposites. Neat F18 generally showed slower losses of PCE than the reference material,
3M 467MP, which is a material that has been reported in the literature for encapsulating OPV
devices. However, no variant of F18 slowed the loss of PCE more than the state-of-the-art gas
barrier PSA, 3M FTBA-25. The performance of neat F18 in comparison to these two PSAs is
also in agreement with the results seen in optical calcium tests. Neat F18 showed less water
vapor permeation than 467MP but more than FTBA-25 in the optical calcium tests discussed
in Chapter 5. The performance of F18, despite its varying results in OPV device aging, appears
to be suitable for use in encapsulating flexible OPV devices based on the results of accelerated
humidity aging in dark conditions. However, further manipulation of the formulation will be
necessary in order to achieve the performance of state-of-the-art gas barrier adhesives. Aging
under illumination must also be evaluated before implanting this nanocomposite for the
encapsulation of OPV modules. The photo-stability of adhesives and nanocomposites will be
discussed further in Chapter 7.
Phyllosilicate nanocomposites based on F18 did not show the same improved
performance in OPV accelerated humidity aging as was seen in the optical calcium test. The
addition of organically modified phyllosilicates did not improve the device lifetime and may
have even caused faster loss of PCE. Based on the decreased water vapor permeation seen in
the optical calcium test, this nanocomposite warrants further study to determine the cause of its

158
relatively poor performance in OPV accelerated humidity aging. It is likely that another source
besides water vapor aided in accelerating the loss of PCE in OPV cells encapsulated using this
adhesive, with the most likely culprit being contamination and impurities in the phyllosilicate
particles.
Nanocomposites of F18 with zeolite nanoparticles were the best F18 based samples at
preventing the loss of PCE in OPV devices. These active nanocomposites provided excellent
stability for their encapsulated OPV devices for the first 50-100 hours of aging at 65°C and
85% relative humidity in dark storage. This was an improvement over neat F18 and
demonstrates the advantages that active water scavengers can have for the performance of OPV
devices in humid environments.
159
Chapter 7: Photostability
Introduction
As the goal of organic photovoltaic (OPV) modules is to convert light to electricity, they
are by definition exposed to light, oftentimes in the form of intense sunlight. This makes the
photostability of any material to be used in OPV devices critically important. For barrier
adhesives, even materials with excellent physical properties are not good choices if those
properties change overtime upon exposure to light. For this reason, the adhesives and
nanocomposites studied in this thesis were also subjected to aging tests of their photostability
using a SEPAP 12/24, which irradiates samples with large doses of ultraviolet (UV) radiation
while maintaining an elevated temperature of 60°C. This chapter details the results of the
various testing performed using these aging conditions to evaluate the suitability of the
adhesives for use in OPV modules that may be exposed to years of intense sunlight. Tests were
performed to determine both the chemical changes and the changes to some physical properties
after exposure to the accelerated aging conditions. Much of the spectroscopy tests, chemical
treatments, and some sample preparation of the samples presented in this chapter was performed
by Diane Delbegue as part of her internship at the Institut de Chimie de Clermont-Ferrand
(ICCF) under the guidance of Professor Jean-Luc Gardette and Dr. Sandrine Therias and in
collaboration with the author.
MAM PSAs
Degradation Kinetics: Photo-oxidation and
Photolysis
MAM PSAs were tested in transmission using both Fourier transform infrared
spectroscopy (FTIR) and ultraviolet-visual spectroscopy (UV-Vis) with aging preformed both
in air (photo-oxidation testing) and sealed under vacuum in glass tubes (photolysis testing). The
spectra during photo-oxidation testing of M65 and M85 can be seen in Figure 7.1. As they differ
chemically only in their block ratios, it can be seen that both adhesives display changes to the
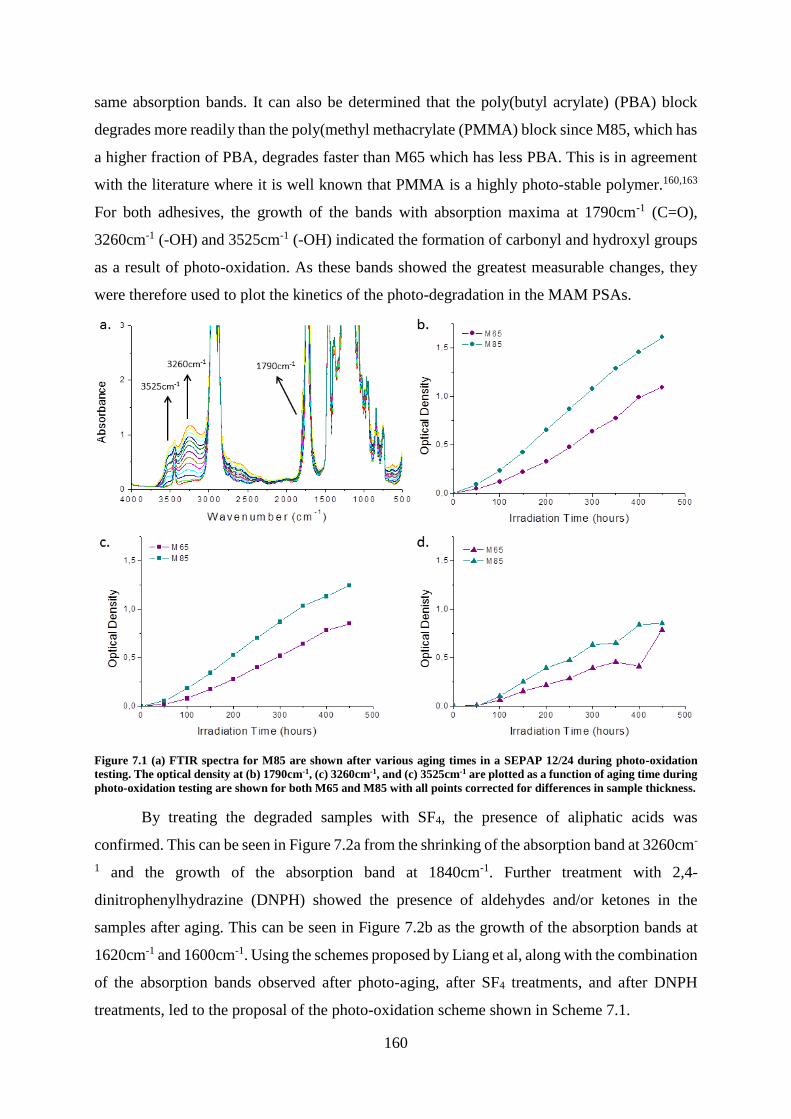
160
same absorption bands. It can also be determined that the poly(butyl acrylate) (PBA) block
degrades more readily than the poly(methyl methacrylate (PMMA) block since M85, which has
a higher fraction of PBA, degrades faster than M65 which has less PBA. This is in agreement
with the literature where it is well known that PMMA is a highly photo-stable polymer.160,163
For both adhesives, the growth of the bands with absorption maxima at 1790cm-1 (C=O),
3260cm-1 (-OH) and 3525cm-1 (-OH) indicated the formation of carbonyl and hydroxyl groups
as a result of photo-oxidation. As these bands showed the greatest measurable changes, they
were therefore used to plot the kinetics of the photo-degradation in the MAM PSAs.
Figure 7.1 (a) FTIR spectra for M85 are shown after various aging times in a SEPAP 12/24 during photo-oxidation
testing. The optical density at (b) 1790cm-1, (c) 3260cm-1, and (c) 3525cm-1 are plotted as a function of aging time during
photo-oxidation testing are shown for both M65 and M85 with all points corrected for differences in sample thickness.
By treating the degraded samples with SF4, the presence of aliphatic acids was
confirmed. This can be seen in Figure 7.2a from the shrinking of the absorption band at 3260cm-
1 and the growth of the absorption band at 1840cm-1. Further treatment with 2,4-
dinitrophenylhydrazine (DNPH) showed the presence of aldehydes and/or ketones in the
samples after aging. This can be seen in Figure 7.2b as the growth of the absorption bands at
1620cm-1 and 1600cm-1. Using the schemes proposed by Liang et al, along with the combination
of the absorption bands observed after photo-aging, after SF4 treatments, and after DNPH
treatments, led to the proposal of the photo-oxidation scheme shown in Scheme 7.1.

161
Figure 7.2 (a) FTIR spectra of M85 after photo-oxidation testing are shown for various treatment stimes with SF4. The
loss of –OH groups at 3260cm-1 and the shift of the C=O band to 1840cm-1 from R-COF indicate the presence of aliphatic
acids in the photo-oxidation prodcuts. (b) FTIR spectra of M85 after photo-oxidation testing are shown fro both before
and after treatment with DNPH. The appearance of bands at 1595cm-1 and 1620cm-1 indicate the prescence of aldehydes
and/or ketones in the photo-oxidation products.
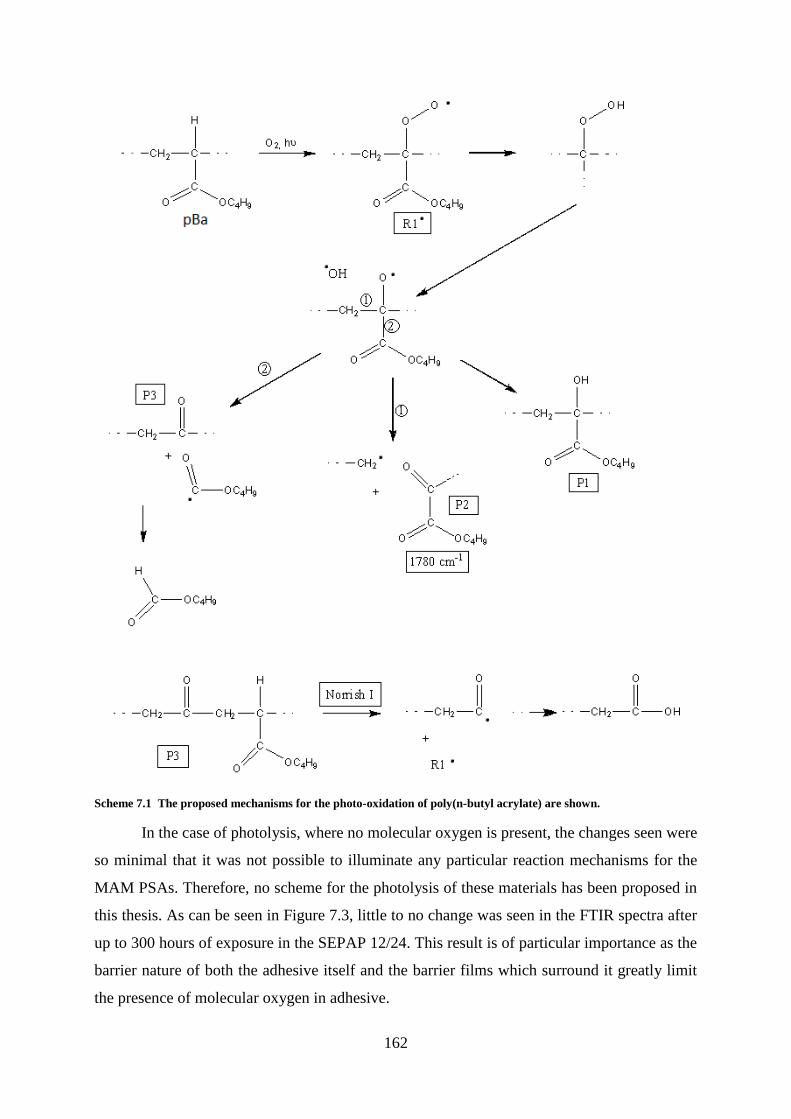
162
Scheme 7.1 The proposed mechanisms for the photo-oxidation of poly(n-butyl acrylate) are shown.
In the case of photolysis, where no molecular oxygen is present, the changes seen were
so minimal that it was not possible to illuminate any particular reaction mechanisms for the
MAM PSAs. Therefore, no scheme for the photolysis of these materials has been proposed in
this thesis. As can be seen in Figure 7.3, little to no change was seen in the FTIR spectra after
up to 300 hours of exposure in the SEPAP 12/24. This result is of particular importance as the
barrier nature of both the adhesive itself and the barrier films which surround it greatly limit
the presence of molecular oxygen in adhesive.

163
Figure 7.3 FTIR spectra of M85 after various aging times during photolysis testing are shown.
The same samples tested in FTIR were also measured via UV-Vis with the spectra
shown in Figure 7.4. An immediate loss of the absorption band at 280nm was seen in photo-
oxidation testing. As such a rapid loss of a band could be due to the evaporation of a solvent,
subsequent testing with and without the presence of toluene in the polymer was performed. The
same results were observed both with toluene present and in dried samples showing that this
absorption band was not due to residual solvent but was indeed coming from the adhesive. Due
to the proprietary nature of the polymerization process used with to synthesize the MAM PSAs
it is unclear exactly what species is responsible for this reaction. After the disappearance of this
band, the film then showed a very slight increase in absorption in the range of 250-290nm,
though the absorption remained well below that seen before testing. In photolysis testing, the
absorption band at 280nm did not disappear, indicating that the disappearance of this band
under irradiation in presence of oxygen was due to the photo-oxidation of a species.
Additionally, while the films were still clear and transparent to the naked eye, the MAM PSAs
did lose some transparency at lower wavelengths during photolysis testing. However, this
increase is rather small and would present only a minimal impact on the transparency of a film
in an encapsulated OPV module.

164
Figure 7.4 UV-Vis spectra for M85 after various aging times are shown for (a) photo-oxidation testing and (b) photolysis
testing.
Effect of Nanoparticles
The impact of the addition of nanoparticles to the MAM PSAs was also studied. The
losses and growths of the same absorption bands in the infrared spectra as the neat adhesive
were seen for nanocomposites of 5wt% organically modified phyllosilicates in M65. The
changes seen in FTIR over the course of photo-oxidation testing showed very similar results to
that of neat M65 as can be seen in Figure 7.5, thus indicating similar reaction kinetics. In UV-
Vis, the decreased transparency of this nanocomposite, as discussed in Chapter 5, prevented the
observation of the absorption band seen at 280nm in the neat material. UV-Vis results did show
an immediate, slight, change in the shape of the absorption spectrum during photo-oxidation
testing, but all subsequent measures were similar with no evident trends as can be seen in Figure
7.5d. This immediate change in shape likely comes from the loss of the tail of the absorption
band at 280nm seen for the neat material. However, its relative impact on the absorption
spectrum of the less transparent nanocomposite was quite small.

165
Figure 7.5 FTIR results, corrected for sample thickness, from photo-oxidation testing of M65 and the nanocomposite
of M65 with 5wt% organically modified phyllosilicates are shown for the absorption bands at (a)1790cm-1, (b) 3260cm-
1, and (c) 3525cm-1. (d) UV-Vis spectra for the nanocompostie of M65 with 5wt% organically modified phyllosilicates
are also shown for various aging times during photo-oxidation testing. All UV-Vis measures after the initial
measurement were quite similar with no evident trends related to aging time.
The addition of zeolite nanoparticles led to slightly greater changes in the FTIR spectra
of the MAM PSAs than that for nanocomposites using organically modified phyllosilicates, but
the changes remained fairly small. As a more extreme case, a nanocomposite of 20wt% zeolite
nanoparticles in M85 was subjected to photo-oxidation testing. This nanocomposite produced
changes to the same absorption bands in FTIR as the neat adhesive and the relative changes in
the intensity of these bands can be seen in Figure 7.6. This nanocomposite did show a slight
change in the ratio of the products compared to the neat adhesive with a slight reduction in –
OH groups (3260cm-1 and 3525cm-1) and slight increase in the C=O bond of P2 from Scheme
1 (1790 cm-1) in comparison to the neat adhesive. The UV-Vis spectra during photo-oxidation
testing, seen in Figure 7.6d, showed a larger change than that seen for the neat adhesive. Despite
this loss of transparency, the sample remained quite clear to the naked eye.

166
Figure 7.6 FTIR results, corrected for sample thickness, from photo-oxidation testing of M85 and the nanocompostie
of M85 with 5wt% zeolite nanoparticles are shown for the absorption bands at (a)1790cm-1, (b) 3260cm-1, and (c)
3525cm-1. (d) UV-Vis spectra for the nanocompostie of M85 with 5wt% zeolite nanoparticles show the loss of
transparency with aging time.
The nanocomposite of 20wt% zeolite nanoparticles in M85 was also subjected to
photolysis testing. The FTIR spectra from this testing can be seen in Figure 7.7. The only major
changes in the observed absorption bands relate to those from the zeolite nanoparticles. These
changes are likely related to the desorption of water from the zeolite nanoparticles as the
nanocomposite was placed into vacuum at elevated temperatures during photolysis testing.

167
Figure 7.7 (a) FTIR spectra of M85 with 20wt% zeolite nanoparticles for various aging times during photolysis testing
are shown. (b) A spectrum for a powder of zeolite nanoparticles as measured by FTIR in attenuated total reflection
mode is shown for comparison with the spectra of the nanocomposite. It can be seen that the changes in the
nanocomposite spectra correspond to absorption bands from the zeolite nanoparticles.
Changes to Properties
As the nanocomposite with zeolite nanoparticles provided a slightly more pronounced
change in properties than the neat adhesive during accelerated photostability testing, the
nanocomposite of M85 with 5wt% zeolite nanoparticles was tested in dynamic mechanical
thermal analysis (DMTA) after photo-oxidation testing. The results as compared to the material
without photo-oxidation testing can be seen in Figure 7.8. It can be seen that after photo-
oxidation testing the Tg of the nanocomposite rose as evidenced by the peak of the loss modulus
curve shifting from -39°C without photo-oxidation testing to -22°C after 125 hours of it. This
increase in the Tg does lead to the material becoming more rigid in the temperature range for
outdoor applications of OPV modules. However, even after this increased rigidity, the
nanocomposite remains highly flexible over this range of temperatures.

168
-80 -60 -40 -20 0 20 400,01
0,1
1
10
100
1000
10000
tan
()
Storage Modulus, No Aging
Storage Modulus, 120h SEPAP
Loss Modulus, No Aging
Loss Modulus, 120h SEPAPM
od
ulu
s (
MP
a)
Temperature (°C)
0,0
0,2
0,4
0,6
0,8
1,0
1,2
1,4
1,6
1,8
2,0
tan(), No Aging
tan(), 120h SEPAP
Figure 7.8 Tensile DMTA results for the nanocomposite of M85 with 5wt% zeolite nanoparticles are shown for both
with and without exposure to in a SEPAP 12/24 in air for 120 hours. All DMTA tests were performed at 3°C/min, 1Hz
and 0.1% strain.
The material was also subjected to T-peel adhesion tests, the results of which can be
seen in Table 7.1. All samples were prepared using Oike VX 25T-2PO barrier films as
substrates, which have a sharp decrease in transmission of light below about 380nm in
wavelength. After 138 hours of photo-oxidation testing, the nanocomposite showed a slight
increase in adhesion. This increase is quite small but could potentially be the result of the
increased rigidity at room temperature seen in DMTA testing. However, the use of gas barrier
films as substrates, in addition to their decreased transmission of UV wavelengths, may have
also caused the aging of these samples to have a more limited presence of photo-oxidation, thus
giving the degradation of the material more character of photolysis conditions that were shown
to be more stable.
Table 7.1 The average adhesion strength from T-peel adhesion tests are shown for M85 with zeolite nanoparticles
both without and after 138 hours of photo-oxidation testing. All samples used Oike VX 25T-2PO barrier films for
substrates; had adhesive thicknesses of about 70µm; and displayed cohesive failure within the adhesive. Values in
parentheses are the standard deviation.
Adhesive No Aging 138h SEPAP % Change
M85 +5wt% zeolite 8.10 N/cm
(0.48 N/cm)
8.95 N/cm
(1.04 N/cm)
10%

169
Calcium test samples for several adhesives and nanocomposites were prepared and
placed in the SEPAP 12/24 in air for 125 hours. These samples were prepared in a dry nitrogen
glove box at the Institut National de l’Engerie Solaire (INES) and then transported in desiccant
filled thermo-sealed bags to the Institut de Chimie de Clermont-Ferrand (ICCF), where upon
arrival they were immediately placed into a dry nitrogen glove box for storage prior to photo-
oxidation testing. All samples also used a larger distance from the calcium to the edge of the
barrier to prevent degradation of the calcium during transport and aging in the SEPAP 12/24.
However, after 125 hours of exposure in the SEPAP 12/24, all samples except those using a
nanocomposite of 5wt% zeolite nanoparticles in M85 showed complete degradation of the
calcium layer. The samples for this nanocomposite, which did not show complete degradation
of the calcium layer, were returned to INES where they were cut to the standard 6cm X 6cm
size and subjected to the optical calcium test as described in Chapter 3. The results of this testing
are shown in Figure 7.9 for the three samples aged in photo-oxidation testing and one control
sample which was transported to and from ICCF but remained in a dry nitrogen glove box
instead of being subjected to the SEPAP 12/24. All samples, including the control, showed large
increases in lateral permeation in the optical calcium test as compared to the previously
discussed results for this material. These results, along with the rapid loss of calcium upon
removal from the dry nitrogen glove box seen in all other samples, appear to imply that the
samples were damaged during transport. Unfortunately, time constraints prohibited the
repetition of this experiment to confirm this hypothesis. However, the need for this experiment
remains as it provides a method to predict the effect of sunlight in outdoor conditions on the
ability of the adhesives and nanocomposites to prevent lateral gas permeation.

170
Figure 7.9 A plot of the average apparent lateral permeation rate as measured by the modified optical calcium test is
shown for M85 and M85 nanocomposites with and without photo-oxidation testing. Aged samples were subjected to
125h in a SEPAP 12/24 in air. All values have been normalized to 45mm X 45mm calcium deposits to adjust for slight
differences between samples. Error bars represent one standard deviation.
UV Curing Acrylates
Degradation Kinetics: Photo-oxidation and
Photolysis
The photostability of F18 was also studied using both photo-oxidation and photolysis
testing. The FTIR spectra of F18 films during photo-oxidation testing can be seen in Figure
7.10a. As this adhesive is a mix of several different oligomers and monomers, each with distinct
chemical structures, it is difficult to identify the exact positions of many peaks as they were
often highly convoluted. Nevertheless, a large amount of changes can be seen over the course
of the 300 hours of photo-oxidation testing. The increases in the absorption bands in the broad
range of 3700-3000cm-1 due to various –OH and –NH signals are commonly seen in the photo-
oxidation of both epoxies and urethanes.141–144,153 Similar trends can be seen in Figure 7.10b for
photolysis testing as well, though the changes in FTIR were not as strongly evident.
0
5
10
15
20
25
30
35
40
0 20 40 60 80 100 120 140 160
Late
ral W
ater
Per
mea
tio
n R
ate
(µg/
day
)
Adhesive Thickness (µm)
M85
M85 +5% Zeolite
M85 +5% Zeolite Aged
M85 +5% Zeolite Aging Control

171
Figure 7.10 FTIR spectra of F18 after various aging times during (a) photo-oxidation testing and (b) photolysis testing
are shown.
Even for very thin coatings on KBr substrates, all samples of F18 appeared very yellow
to the naked eye after both photo-oxidation testing and photolysis testing. This can be seen in
Figure 7.11 as the increased absorption of the samples at shorter wavelengths. An initial change
in shape of the UV-Vis spectrum is seen as a result of the polymerization of residual un-cured
acrylate groups, but the absorption then steadily increases with aging time for both photo-
oxidation and photolysis testing. Photolysis testing in particular showed drastic changes in the
transparency of the samples. This loss of transparency is of great concern for application to
OPV modules as many active layer materials display high quantum efficiencies at the
wavelengths being blocked after aging. This strong yellowing effect also helps to provide
insight into the possible mechanisms of the degradation. Although its characteristic absorption
band at about 1660cm-1 is not visible due to convolution, the evidence suggests the formation
of quinone methide groups which are very strong absorbers at shorter wavelengths and are
known to form with and without the presence of oxygen from the exposure of aromatic epoxies
to UV radiation.141 This would indicate the oligomer CN9002 as the most likely source of the
yellowing seen in F18 during photostability testing.

172
Figure 7.11 UV-Vis spectra of F18 after various aging times during (a) photo-oxidation testing and (b) photolysis testing
are shown.
Changes to Properties
DMTA samples of F18 and its nanocomposites with 5wt% of organically modified
phyllosilicates and 5wt% of zeolite nanoparticles respectively were also subjected to photo-
oxidation testing. The storage modulus for each material both without and after photo-oxidation
testing can be seen in Figure 7.12. All three materials showed similar behavior with larger
transition regions and an increased Tg, which can be seen in Table 7.2 as calculated from the
peak of the loss modulus curve. The larger transition region may come from the more varied
segment length between cross-links caused by the combination of additional cross-linking and
chain scission during photo-oxidation. The increased Tg is expected from an increase in cross-
link density from the polymerization of residual acrylate groups, but may also come from
additional cross-linking resulting from photo-oxidation. The further increase in rigidity is
worrisome for these materials which were already relatively rigid in the operating temperature
range of outdoor OPV modules.
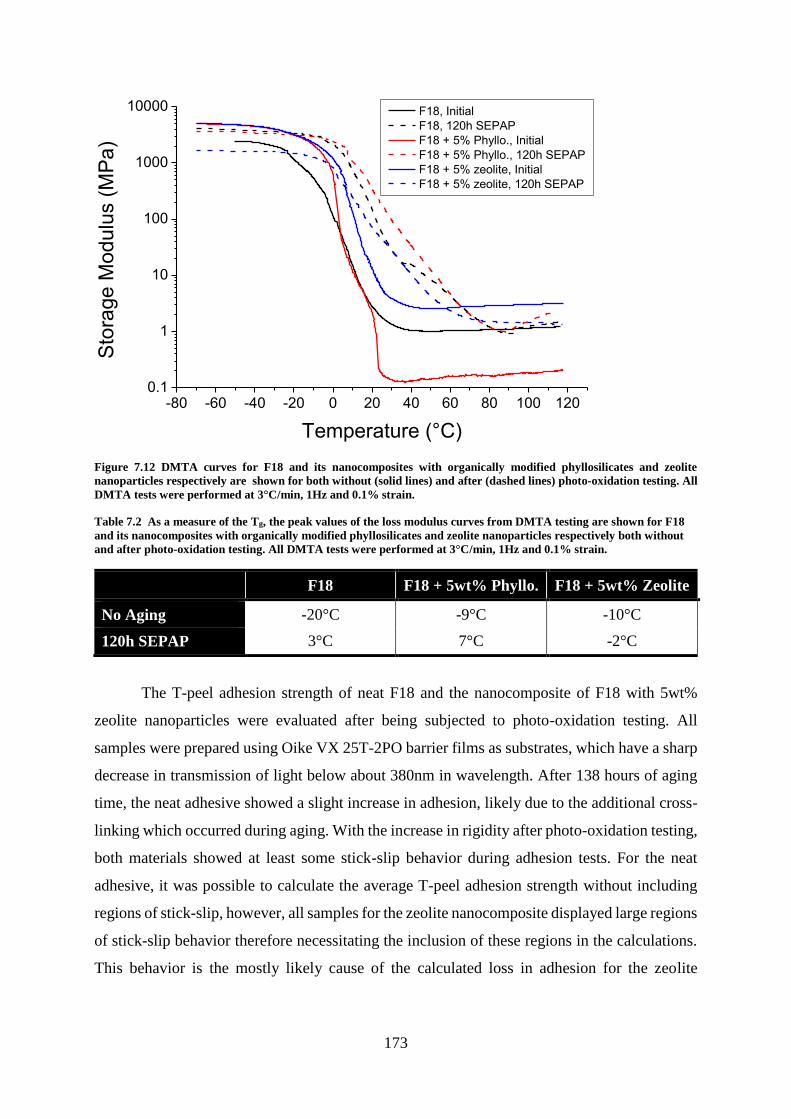
173
-80 -60 -40 -20 0 20 40 60 80 100 1200.1
1
10
100
1000
10000 F18, Initial
F18, 120h SEPAP
F18 + 5% Phyllo., Initial
F18 + 5% Phyllo., 120h SEPAP
F18 + 5% zeolite, Initial
F18 + 5% zeolite, 120h SEPAP
Sto
rage
Modu
lus (
MP
a)
Temperature (°C)
Figure 7.12 DMTA curves for F18 and its nanocomposites with organically modified phyllosilicates and zeolite
nanoparticles respectively are shown for both without (solid lines) and after (dashed lines) photo-oxidation testing. All
DMTA tests were performed at 3°C/min, 1Hz and 0.1% strain.
Table 7.2 As a measure of the Tg, the peak values of the loss modulus curves from DMTA testing are shown for F18
and its nanocomposites with organically modified phyllosilicates and zeolite nanoparticles respectively both without
and after photo-oxidation testing. All DMTA tests were performed at 3°C/min, 1Hz and 0.1% strain.
F18 F18 + 5wt% Phyllo. F18 + 5wt% Zeolite
No Aging -20°C -9°C -10°C
120h SEPAP 3°C 7°C -2°C
The T-peel adhesion strength of neat F18 and the nanocomposite of F18 with 5wt%
zeolite nanoparticles were evaluated after being subjected to photo-oxidation testing. All
samples were prepared using Oike VX 25T-2PO barrier films as substrates, which have a sharp
decrease in transmission of light below about 380nm in wavelength. After 138 hours of aging
time, the neat adhesive showed a slight increase in adhesion, likely due to the additional cross-
linking which occurred during aging. With the increase in rigidity after photo-oxidation testing,
both materials showed at least some stick-slip behavior during adhesion tests. For the neat
adhesive, it was possible to calculate the average T-peel adhesion strength without including
regions of stick-slip, however, all samples for the zeolite nanocomposite displayed large regions
of stick-slip behavior therefore necessitating the inclusion of these regions in the calculations.
This behavior is the mostly likely cause of the calculated loss in adhesion for the zeolite

174
nanocomposite after photo-oxidation testing as the inclusion of “slips” in the calculation will
cause an underestimation of the average adhesion strength.
Table 7.3 The average adhesion strength from T-peel adhesion tests are shown for F18 and its nanocomposite with
5wt% zeolite nanoparticles both without and after photo-oxidation testing. All samples used Oike VX 25T-2PO
barrier films for substrates; had adhesive thicknesses of about 50µm; and displayed adhesive failure at the adhesive-
to-barrier film interface. *All samples for F18 + 5wt% zeolite nanoparticles displayed large amounts of stick-slip
behavoir.
F18 % Change F18 +5wt% zeolite % Change
No Aging 1.32 N/cm
(0.15 N/cm)
-- 1.14 N/cm
(0.06 N/cm)
--
138h SEPAP 1.55 N/cm
(0.12 N/cm)
17% 0.72 N/cm*
(0.18 N/cm)*
-37%*
Conclusions
The accelerated photostability testing of MAM PSAs, UV curing acrylates and various
nanocomposites comprised of these respective adhesives provided insight into their
applicability to OPV modules which are subjected to light over the course of their lifetimes.
The MAM PSAs displayed very good stability, especially under photolysis conditions in the
absence of molecular oxygen where almost no change in the materials could be seen in FTIR
and only minimal changes were observed in UV-Vis. The photo-oxidation of these materials
was dominated by the PBA block of the polymer for which a series of degradation mechanisms
has been proposed. Despite these changes during photo-oxidation testing, the adhesives
remained quite transparent and should be considered as excellent candidates to remain stable
enough to not lose a large amount of performance over the course of the lifetime of an OPV
module outdoors.
In comparison to the MAM PSAs, F18 showed relatively poor photostability in both
photo-oxidation testing and photolysis testing. The strong yellowing, and therefore loss of
transparency in the visible light range, along with the increased rigidity of both the neat
adhesive and its nanocomposites present potential problems for use with OPV modules for
outdoor applications. However, the relatively stable adhesion strength of F18 after photo-
oxidation testing is important to note as the interface with the barrier film is the dominant
permeation lateral pathway for water vapor as discussed in Chapter 4. As UV curing acrylate
adhesives are known to be generally more photostable than epoxies or polyurethanes, the poor

175
performance of F18 in this study is somewhat surprising. However, replacing the aromatic
epoxy backbone of the oligomer CN9002 in F18 provides a potentially facile approach to
improving the photostability of this adhesive. As this is one of the changes to the formulation
used to create S3, photostability studies of this adhesive should be performed to evaluate its use
as a potentially more photo-stable alternative to F18.
Regardless of the polymer matrix used, the addition of nanoparticles to the adhesives
had only minor effects on the photostability of the materials. The photostability of
nanocomposite adhesives using organically modified phyllosilicates agrees well the literature
as they had very little effect on the photostability of the adhesives. Nanocomposites of F18 with
and without these particles showed similar trends for their mechanical properties in photo-
oxidation testing. In addition, FTIR showed almost no difference in the degradation kinetics for
composites of M65 with and without these particles.
The addition of zeolite nanoparticles to these adhesives has not been widely reported in
the literature and was thus of particular interest in this thesis. Nanocomposites comprised of
these materials showed very similar behavior to the neat adhesives during accelerated
photostability testing with both M85 and F18 matrices. For nanocomposites of M85 with high
concentrations of zeolite nanoparticles (20wt%), FTIR showed only a slight change in the ratios
of the products produced during photo-oxidation testing while the same samples also displayed
a small increase in the absorption of light in the UVA and blue light region of the spectrum in
UV-Vis. However, these changes remained fairly small. An increase in the Tg was also seen for
composites of these nanoparticles with both M85 and F18. For M85 this increase is not enough
to directly affect the suitability for OPV modules of the nanocomposite, while for F18 the
increase in Tg was similar to that seen for the neat adhesive. In photolysis testing, the only major
visible change from the results of the neat adhesive can be linked to the desorption of water
from the zeolites during irradiation. Overall, the presence of NZL-40 zeolite nanoparticles
appears to have only a minor impact on the photo-stability of both the MAM PSAs and UV
curing acrylates studied in this thesis.

176

177
Conclusions and Perspectives
Organic photovoltaic (OPV) devices, with their unique combination of properties,
represent a promising source of renewable energy as an alternative to traditional silicon based
photovoltaic devices. With the recent advancements in power conversion efficiency and in
scale-up towards industrial production, OPV devices are in pressing need of more effective
encapsulation technologies in order to limit and delay their degradation from oxygen and water
vapor. While flexible, organic-inorganic, multi-layer films have been shown to be sufficient
barriers for preventing orthogonal permeation into devices, the problem of lateral permeation,
also known as side ingress, still remains as an important permeation pathway and thus limits
the devices’ operational lifetimes. This problem has created the opportunity for the work of this
thesis to develop enhanced gas-barrier adhesives for encapsulation of OPV devices and
methods to evaluate the lateral permeation in encapsulation schemes along multiple permeation
pathways.
A very popular flexible encapsulation scheme for OPV devices is to laminate the device
between two flexible barrier films using an adhesive to make the seal between the films. When
evaluating the lateral permeation in this encapsulation scheme multiple pathways are present,
namely permeation in the bulk adhesive and permeation along the interface between the
adhesive and the flexible film. However, current permeation testing procedures mostly ignore
the effect of interfacial permeation by not using flexible films, while also not allowing for the
separation of the impact of the different permeation pathways. Therefore as part of this thesis,
a modified version of the optical calcium test was developed in order to determine the relative
impacts of the different water vapor permeation pathways present in an encapsulated flexible
OPV device.
By using a sample geometry which closely resembles an actual OPV device, the optical
calcium test that was developed was shown to be capable of distinguishing the relative
contributions of orthogonal permeation, permeation in the bulk adhesive, and interfacial
permeation for pairs of adhesives and barrier films. By defining a region which was not
impacted by lateral permeation during the test, the orthogonal permeation across the barrier
films can be accurately measured to evaluate their water vapor barrier properties. This
information can then be used to perform a background subtraction and determine the total
apparent lateral water vapor permeation. While not an exact quantitative measure of the

178
permeation, this value does provide an excellent relative comparison between samples,
therefore allowing for the identification of the best encapsulation parameters. The results
showed that lateral permeation accounts for a very large proportion of the overall permeation
in samples of this size, often over 50% of the total water vapor permeation. By testing with the
same materials but a different thickness of adhesive, it was also shown that the relative impacts
of the water vapor permeation in the bulk adhesive and along the interfaces could be
determined. The results showed that the ratio of permeation in the bulk adhesive and along the
interface were very dependent on the adhesive-barrier film pair, with some combinations being
overwhelmingly dominated by interfacial permeation – a pathway which has been largely
ignored in other testing methods. The ability of this test to measure both the bulk adhesive and
the interfaces while closely resembling an actual device has also allowed it to evaluate
encapsulation design parameters such as surface treatments and the thickness of the adhesive
layer. It can also be envisioned that other parameters could also be evaluated for their relative
impact including the distance from the edge of the device to the edge of the encapsulation and
the use of edge seal materials. While the inherent variability in the fabrication and performance
of OPV devices, along with the additional impact of the design of the electrical connections,
prevented a definitive link between the results of optical calcium tests and accelerated aging of
encapsulated OPV devices in humid conditions, the modified version of the optical calcium test
remains an effective tool for the evaluation of flexible OPV encapsulation.
With a test established to aid in the determination of the water vapor permeation of
adhesives, two main classes of adhesives were then studied as part of this thesis. One class of
adhesive was pressure sensitive adhesives (PSA) based on block copolymers of poly(methyl
methacrylate)-block-(butyl acrylate)-block-(methyl methacrylate) (MAM). These adhesives,
which were supplied by Arkema Group, are solid adhesives which are above the glass transition
temperature of poly(butyl acrylate) (PBA), which was the majority block for all of the variants
tested. These adhesives excelled in several key areas which are important for flexible OPV
encapsulation materials including excellent transparency in the ultraviolet-A (UVA) and visible
wavelengths, strong adhesion to flexible barrier films, and compatibility with solution
processing and roll-to-roll manufacturing techniques. These materials were also found to have
very good photostability, especially in photolysis where irradiations are performed in the
absence of molecular oxygen. In photo-oxidation, some degradation of the PBA block was
observed with the adhesives becoming slightly more rigid after aging, though this increased
rigidity was not enough to affect their use as a flexible encapsulation material.
179
However, optical calcium tests with these materials showed relatively high water vapor
permeation rates compared with commercial reference adhesives. It was also found that the
water vapor permeation rate in these adhesives was not directly dependent on their mechanical
properties nor their overall poly(methyl methacrylate) (PMMA) content, but instead on their
morphology with the worm-like morphology being slightly less permeable than micelles of
PMMA in a matrix of PBA. The MAM PSAs also showed a combination of permeation through
both the bulk adhesive and along the interface despite their strong adhesion. Additionally, the
most rigid of these materials had low tack and were difficult to laminate without the presence
of bubbles at room temperature.
The other class of adhesives which were examined in this thesis were UV curing
acrylates. These liquid adhesives are a mix of monomers and oligomers containing acrylic
functionalities with photo-initiators which absorb UVA and/or visible wavelengths of light to
generate radicals. The radicals generated upon exposure to a light source corresponding to the
absorption bands of the photo-initiators causes the liquid adhesive to polymerize into a cross-
linked network. One of these adhesives, F18, was formulated by the author using compatibility
with OPV materials and adhesion to flexible polymer substrates as guiding parameters. A
second adhesive, S3, was formulated by Sartomer of the Arkema Group which attempted to
improve upon the adhesion to flexible polymer substrates compared to F18. These adhesives
had relatively weak adhesion to flexible barrier films and were less transparent compared to the
MAM PSAs. The use of a tackifying resin in S3 was able to increase the adhesion but at the
same time caused a loss in transparency. S3 was also less rigid than F18, which is desirable as
F18 was found to be rigid enough at low temperatures to be of concern for OPV modules
operating in cold climates. Despite all these properties, both formulations were still able to meet
the requirements of OPV encapsulation for those properties. However, F18 did exhibit low
photostability compared to the MAM PSAs as it quickly became yellow and lost some
transparency in both photo-oxidation and photolysis. This is likely due to the degradation of the
epoxy backbone in one of the oligomers used in the formulation. Replacing this oligomer with
one having a more stable backbone chemistry would likely greatly aid the photostability of this
material.
Despite these issues, both F18 and S3 showed very good results in optical calcium tests
where both formulations outperformed both the MAM PSAs and the reference adhesive. The
UV curing acrylates showed very good bulk barrier properties with the lateral permeation being
very much dominated by interfacial permeation. It was seen that low apparent lateral water

180
vapor permeation in these adhesives was closely correlated with stronger adhesion to the
flexible barrier film, thus further indicating the importance of the interfacial permeation
pathway. The low lateral water vapor permeation rate of F18 also translated well to aging
studies of encapsulated OPV devices, where devices encapsulated with F18 showed much
slower loss of performance than those encapsulated with the reference adhesive. These
promising results warrant the further development of these adhesives to improve their overall
performance in encapsulating OPV devices.
One such way to further develop both classes of adhesives is through the addition of
nanoparticles. In this thesis, the modification of both classes of adhesives was examined using
organically modified phyllosilicates and zeolite nanoparticles. Organically modified
phyllosilicates were used as passive particles which created high aspect ratio, impermeable
particles that result in a tortuous pathway for permeating gas molecules. On the other hand, the
high surface area zeolite nanoparticles were used as active materials which bind permeating
water molecules to their surfaces. Both types of particles were able to be dispersed into both
classes of adhesive, though with different upper limits on the concentration of particles. Both
types of particles showed only small changes in most properties, with some increased rigidity
and decreased transparency compared to the neat adhesives. The most drastic change was the
loss of adhesion strength for nanocomposites of F18 with organically modified phyllosilicates,
though this was mostly recovered using corona treated substrates. However, the
nanocomposites generally did not exhibit enough difference from the neat adhesive to change
their applicability to OPV encapsulation. Of particular note is that the photostability of the
adhesives also showed only minor changes with the addition of nanoparticles. This is especially
noteworthy for zeolite nanoparticles which, to the knowledge of the author, have not been
previously studied for their effect on the photostability of adhesives.
One property that did exhibit a large change after the addition of nanoparticles was the
water vapor permeation. Optical calcium tests for nanocomposites based on the MAM PSAs
showed large decreases in the apparent lateral water vapor permeation rate for all particle types
and concentrations tested, with zeolite nanoparticles being the most effective at reducing the
permeation. Though the dominance of the interfacial permeation pathway was expected to limit
the effectiveness of the nanoparticles at reducing water vapor permeation in UV curing
acrylates, nanocomposites based on F18 did show a decrease in the apparent lateral water vapor
permeation rate with both types of particles showing similar performance. The ability of the
organically modified phyllosilicates to perform as well as the zeolite nanoparticles is likely due

181
to the organically modified phyllosilicates having a higher concentration of particles
immediately adjacent to the interface. This decreased permeation also manifested itself in aging
tests of encapsulated OPV devices, as devices encapsulated using nanocomposites of F18 with
zeolite nanoparticles showed the slowest loss of performance of any material developed in this
thesis. However, organically modified phyllosilicates did not perform well in these tests, likely
due to an interaction with the OPV materials that was possibly from contaminates in the
particles.
In addition to the tests presented in this thesis, continued testing in several areas could
help to further the efforts of this research. However, due to time constraints, this testing has not
been performed. Outdoor aging tests of OPV devices would aid in determining the device
lifetimes that could be expected using with these enhanced adhesives. Additionally, tests using
industrial scale production methods such as roll-to-roll lamination, slot-die deposition, gravure
printing or ink jetting for the deposition of the adhesives would be a next logical step for the
implantation of the enhanced adhesives developed in this thesis.
Returning to the work presented in this thesis, there are several points which could
benefit from further development. The formulation of the UV curing adhesives could use further
development to increase their photostability and adhesion to flexible barrier films. This could
be of particular interest given the results showing the dominance of interfacial permeation for
these adhesives. Additionally, formulation work on both classes of adhesives could be carried
out by combining both organically modified phyllosilicates and zeolite nanoparticles in the
same adhesive. This combination of both passive and active particles represents an interesting
approach given their respective successes at limiting water vapor permeation.
A final perspective for the work developed in this thesis is the continued development
of the optical calcium test. The current method of manually removing samples from the climatic
chamber and aligning them for imaging could potentially be automated. This type of system
could be envisioned to have the camera and lamp inside a climatic chamber. A carousel could
then be used to rotate different samples in front of the lamp for imaging automatically. This
would greatly reduce the amount of work required to perform the test while simultaneously
eliminating the large gaps in data from overnight periods where no one is present to manually
capture the images. Further automation could also be added in the form of dedicated software
to perform the image analysis and subsequent permeation calculations.

182
Overall, the research presented in this thesis has examined several different classes of
adhesives with enhanced formulations for their applicability to encapsulation flexible OPV
devices. After developing a test to characterize the relative importance of the various
permeation pathways, the characterization of the developed adhesives has shown that the use
of formulation and the creation of nanocomposites can meet the requirements of OPV
encapsulation materials while limiting the permeation of water vapor into devices. Accelerated
aging studies with OPV devices also showed that these enhanced adhesives are a promising
technique for the prolongation of the device lifetime for flexible OPV modules.

183

184

185
References
1. Perez, R. & Perez, M. A Fundamental Look at Energy Reserves for the Planet. IEA
SHC Sol. Updat. (2009).
2. Sawin, J. L. et al. Renewables 2014: Global Status Report. (2014).
3. Krebs, F. C. Fabrication and processing of polymer solar cells: A review of printing
and coating techniques. Sol. Energy Mater. Sol. Cells 93, 394–412 (2009).
4. Angmo, D. et al. Scalability and stability of very thin, roll-to-roll processed, large area,
indium-tin-oxide free polymer solar cell modules. Org. Electron. physics, Mater. Appl.
14, 984–994 (2013).
5. Sondergaard, R. R., Hosel, M. & Krebs, F. C. Roll-to-Roll fabrication of large area
functional organic materials. J. Polym. Sci. Part B Polym. Phys. 51, 16–34 (2013).
6. Steim, R. et al. Organic photovoltaics for low light applications. Sol. Energy Mater.
Sol. Cells 95, 3256–3261 (2011).
7. Janssen, R. a & Nelson, J. Factors limiting device efficiency in organic photovoltaics.
Adv. Mater. 25, 1847–58 (2013).
8. Jørgensen, M., Norrman, K. & Krebs, F. C. Stability/degradation of polymer solar
cells. Sol. Energy Mater. Sol. Cells 92, 686–714 (2008).
9. Jørgensen, M. et al. Stability of Polymer Solar Cells. Adv. Mater. 24, 580–612 (2012).
10. Stability and Degradation of Organic and Polymer Solar Cells. (John Wiley and Sons,
Ltd, 2012).
11. Heliatek GmbH Website. at <http://www.heliatek.com/>
12. Krebs, F. C., Tromholt, T. & Jørgensen, M. Upscaling of polymer solar cell fabrication
using full roll-to-roll processing. Nanoscale 2, 873–886 (2010).
13. Dhez, O. From Lab to Fab Scale-Up Requirements, Printed Large Area Photo
Detectors. in 6th Int. Summit OPV Stab. (2013).
14. Eight19 Website. at <http://www.eight19.com/>
15. Armor Group Website. at <http://www.beautiful-light.eu/en>
16. Disa Solar Website. at <http://www.disasolar.fr/en/>
17. Dracula Technologies Website. at <http://www.dracula-technologies.com/>
18. Beletric OPV GmbH Website. at <http://www.belectric.com/en/organic-
photovoltaics/>
19. Solar Press Website. at <http://www.solar-press.com/>
20. Solar Window Technolgies Inc. Website. at <http://solarwindow.com/>
21. Solarmer Website. at <http://solarmer.com/>
22. Polyera Corporation Website. at <http://www.polyera.com/>
23. ISORG Website. at <http://www.isorg.fr/>
24. Wang, X., Xinxin Zhao, C., Xu, G., Chen, Z. K. & Zhu, F. Degradation mechanisms in
organic solar cells: Localized moisture encroachment and cathode reaction. Sol. Energy
Mater. Sol. Cells 104, 1–6 (2012).
25. Cros, S. et al. Definition of encapsulation barrier requirements: A method applied to
organic solar cells. Sol. Energy Mater. Sol. Cells 95, S65–S69 (2011).
26. Ahmad, J., Bazaka, K., Anderson, L. J., White, R. D. & Jacob, M. V. Materials and
methods for encapsulation of OPV: A review. Renew. Sustain. Energy Rev. 27, 104–
117 (2013).
27. Cao, W. & Xue, J. Recent progress in organic photovoltaics: device architecture and
optical design. Energy Environ. Sci. 7, 2123–2144 (2014).

186
28. Manceau, M. Impact de la lumiere sur la couche active des cellules photovolaiques
organiques. (2009).
29. Richard-Plouet, M. & Brohan, L. Insight on transition metal oxide layers in OPV ,
from the solid state chemistry point of view. in 6th Int. Summit OPV Stab. (2013).
30. Lechene, B. et al. Design of intermediate layers for solution-processed tandem organic
solar cells: Guidelines from a case study on TiOx and ZnO. Sol. Energy Mater. Sol.
Cells 120, 709–715 (2014).
31. Angmo, D. et al. Outdoor operational stability of indium-free flexible polymer solar
modules over 1 year studied in India, Holland, and Denmark. Adv. Eng. Mater. (2014).
doi:10.1002/adem.201400002
32. Simonato, J. Transparent electrodes made of Ag nanowire networks: Fabrication,
physical properties and intergration in OPV cells. in 6th Int. Summit OPV Stab. (2013).
33. National Renewable Energy Laboratory - National Center for Photovoltaics Website. at
<http://www.nrel.gov/ncpv/>
34. Rivaton, A. et al. Photostability of organic materials used in polymer solar cells.
Polym. Int. 63, 1335–1345 (2014).
35. Cao, H. & Ishikawa, K. Lateral oxygen diffusion dominated extrinsic degradation of
small molecular organic solar cells. Sol. Energy Mater. Sol. Cells 109, 215–219 (2013).
36. Dupont, S. R., Oliver, M., Krebs, F. C. & Dauskardt, R. H. Interlayer adhesion in roll-
to-roll processed flexible inverted polymer solar cells. Sol. Energy Mater. Sol. Cells 97,
171–175 (2012).
37. Dauskardt, R. Adhesion and Debonding Kinetics in OPV Devices Hybrid Organic
Films in Device , Energy and Biomedical Technologies. in 6th Int. Summit OPV Stab.
(2013).
38. Schumann, S. et al. New Developments in PEDOT for OPVs. in 6th Int. Summit OPV
Stab. (2013).
39. Zemen, Y. et al. Comparison of new conductive adhesives based on silver and carbon
nanotubes for solar cells interconnection. Sol. Energy Mater. Sol. Cells 109, 155–159
(2013).
40. Muller-Meskamp, L. et al. Encapsulation of Small Molecule OPV Cells: Backelectrode
Barrier Properties and its Influence on Device Degradation. in 6th Int. Summit OPV
Stab. (2013).
41. Han, S. H. et al. Lifetime of organic thin-film transistors with organic passivation
layers. Appl. Phys. Lett. 88, 2004–2007 (2006).
42. Jung, H. et al. Lifetime enhancement of organic thin-film transistors protected with
organic layer. Appl. Phys. Lett. 92, 1–4 (2008).
43. Kim, L. H. et al. Al2O3/TiO2 nanolaminate thin film encapsulation for organic thin
film transistors via plasma-enhanced atomic layer deposition. ACS Appl. Mater.
Interfaces 6, 6731–6738 (2014).
44. Cho, a. R., Kim, E. H., Park, S. Y. & Park, L. S. Flexible OLED encapsulated with gas
barrier film and adhesive gasket. Synth. Met. 193, 77–80 (2014).
45. Ghosh, a. P., Gerenser, L. J., Jarman, C. M. & Fornalik, J. E. Thin-film encapsulation
of organic light-emitting devices. Appl. Phys. Lett. 86, 1–3 (2005).
46. Meyer, J. et al. Reliable thin film encapsulation for organic light emitting diodes grown
by low-temperature atomic layer deposition. Appl. Phys. Lett. 94, (2009).
47. Park, J.-S., Chae, H., Chung, H. K. & Lee, S. I. Thin film encapsulation for flexible
AM-OLED: a review. Semicond. Sci. Technol. 26, 034001 (2011).
48. Park, J. H. & Oh, S. G. Preparation of CaO as OLED getter material through control of
crystal growth of CaCO3 by block copolymers in aqueous solution. Mater. Res. Bull.
44, 110–118 (2009).

187
49. Wu, C. S., Liao, J. Y., Fang, S. Y. & Chiang, A. S. T. Flexible and transparent moisture
getter film containing zeolite. Adsorption 16, 69–74 (2010).
50. Greener, J., Ng, K. C., Vaeth, K. M. & Smith, T. M. Moisture permeability through
multilayered barrier films as applied to flexible OLED display. J. Appl. Polym. Sci.
106, 3534–3542 (2007).
51. Keibler, C., Hild, O., Muller-Meskamp, L. & Leo, K. Direct encapsulation of OLEDs
with different thin film methods. in Large Area Org. Print. Electron. Conv. (2013).
52. Kempe, M. D., Dameron, A. A. & Moricone, T. J. EVALUATION AND MODELING
OF EDGE-SEAL MATERIALS FOR PHOTOVOLTAIC APPLICATIONS. in IEEE
Photovolt. Spec. Conf. (2010).
53. Kempe, M. D. Control of moisture ingress into photovoltaic modules. Conf. Rec.
Thirty-first IEEE Photovolt. Spec. Conf. 2005. (2005).
54. Carcia, P. F., McLean, R. S. & Hegedus, S. Encapsulation of Cu(InGa)Se2 solar cell
with Al2O3 thin-film moisture barrier grown by atomic layer deposition. Sol. Energy
Mater. Sol. Cells 94, 2375–2378 (2010).
55. Coyle, D. J. Life prediction for CIGS solar modules part 1: Modeling moisture ingress
and degradation. Prog. Photovoltaics Res. Appl. 21, 156–172 (2013).
56. Coyle, D. J. et al. Life prediction for CIGS solar modules part 2: Degradation kinetics,
accelerated testing, and encapsulant effects. Prog. Photovoltaics Res. Appl. 21, 173–
186 (2013).
57. Kim, N., Han, C., Baek, D. & Kim, D. Determination of Moisture Ingress through
Various Encapsulants used in CIGS PV Module under Continuously Varying
Environment. in IEEE Photovolt. Spec. Conf. 887–890 (2011).
58. Lee, D. W. et al. Effects of ZnO:Al films on CIGS PV modules degraded under
accelerated damp heat. Sol. Energy Mater. Sol. Cells 105, 15–20 (2012).
59. Selin Tosun, B. et al. Improving the damp-heat stability of copper indium gallium
diselenide solar cells with a semicrystalline tin dioxide overlayer. Sol. Energy Mater.
Sol. Cells 101, 270–276 (2012).
60. Hardikar, K., Vitkavage, D., Saproo, A. & Krajewski, T. A methodology for testing,
characterization and prediction of edge seal performance in PV modules. Photovoltaics
Int. 75–83 (2014).
61. Hodes, G. Applied physics. Perovskite-based solar cells. Science 342, 317–8 (2013).
62. Liu, M., Johnston, M. B. & Snaith, H. J. Efficient planar heterojunction perovskite
solar cells by vapour deposition. Nature 501, 395–8 (2013).
63. Kim, J. H., Williams, S. T., Cho, N., Chueh, C. & Jen, A. K. Enhanced Environmental
Stability of Planar Heterojunction Perovskite Solar Cells Based on Blade-Coating. Adv.
Eng. Mater. 2–7 (2014). doi:10.1002/aenm.201401229
64. Smith, I. C., Hoke, E. T., Solis-ibarra, D., Mcgehee, M. D. & Karunadasa, H. I.
Perovskite Solar Cells A Layered Hybrid Perovskite Solar-Cell Absorber with
Enhanced Moisture Stability. Angew. Chemie Int. Ed. (2014).
doi:10.1002/anie.201406466
65. Snaith, H. J. Perovskites : The Emergence of a New Era for Low-Cost , High-. J. Phys.
Chem. Lett. (2013).
66. Crank, J. THE MATHEMATICS OF DIFFUSION. (1975).
67. Cros, S. et al. Relationship between encapsulation barrier performance and organic
solar cell lifetime. in SPIE (Dhere, N. G.) 7048, 70480U–70480U–12 (2008).
68. Graff, G. L., Williford, R. E. & Burrows, P. E. Mechanisms of vapor permeation
through multilayer barrier films: Lag time versus equilibrium permeation. J. Appl.
Phys. 96, 1840–1849 (2004).

188
69. Michels, J. J., Peter, M., Salem, a., van Remoortere, B. & van den Brand, J. A
combined experimental and theoretical study on the side ingress of water into barrier
adhesives for organic electronics applications. J. Mater. Chem. C 2, 5759 (2014).
70. Painter, P. C. & Coleman, M. M. Essentials of Polymer Science and Engineering.
(DEStech Publications, 2009).
71. Boeffel, C., Fahlteich, J., Steiner, C., Amberg-Schwab, S. & Kuzukpinar, E. Ultra-high
barrier substrates and ALD layers for the encapsulation of organic electronic devices.
in Int. Symp. Flex. Org. Electron. (2014).
72. Doremus, R. H. Glass Science. (John Wiley and Sons, Ltd, 1994).
73. Corning Incorporated Willow Glass Website. at
<http://www.corning.com/displaytechnologies/en/products/flexible.aspx>
74. SCHOTT Inc. Ultra-Thin Glass Website. at
<http://www.us.schott.com/advanced_optics/english/products/wafers-and-thin-
glass/glass-wafer-and-substrates/ultra-thin-glass/index.html>
75. Leterrier, Y. Durability of nanosized oxygen-barrier coatings on polymers. Prog.
Mater. Sci. 48, 1–55 (2003).
76. Roberts, a. P. et al. Gas permeation in silicon-oxide/polymer (SiOx/PET) barrier films:
Role of the oxide lattice, nano-defects and macro-defects. J. Memb. Sci. 208, 75–88
(2002).
77. Howells, D. G. et al. Mechanical properties of SiOx gas barrier coatings on polyester
films. Surf. Coatings Technol. 202, 3529–3537 (2008).
78. Kim, Y. et al. Experimental study of interfacial fracture toughness in a SiN(x)/PMMA
barrier film. ACS Appl. Mater. Interfaces 4, 6711–9 (2012).
79. Struller, C. F. et al. Aluminium oxide barrier films on polymeric web and their
conversion for packaging applications. Thin Solid Films 553, 153–156 (2014).
80. Yang, Y. H., Bolling, L., Priolo, M. a. & Grunlan, J. C. Super gas barrier and
selectivity of graphene oxide-polymer multilayer thin films. Adv. Mater. 25, 503–508
(2013).
81. Elrawemi, M. et al. Modelling water vapour permeability through atomic layer
deposition coated photovoltaic barrier defects. Thin Solid Films 570, 101–106 (2014).
82. Morlier, A., Cros, S., Garandet, J. P. & Alberola, N. Thin gas-barrier silica layers from
perhydropolysilazane obtained through low temperature curings: A comparative study.
Thin Solid Films 524, 62–66 (2012).
83. Morlier, A., Cros, S., Garandet, J. P. & Alberola, N. Gas barrier properties of solution
processed composite multilayer structures for organic solar cells encapsulation. Sol.
Energy Mater. Sol. Cells 115, 93–99 (2013).
84. Wang, K., Gu, M., Motz, G., Flinn, B. D. & Bordia, R. K. Control of Surface Energy of
Silicon Oxynitride Films. Langmuir (2013).
85. Fahlteich, J., Steiner, C., Winkler, S., Fahland, M. & Schiller, N. Ultra-High
Permeation Barrier Films for the Encapsulation of Flexible Electronic Devices. in 6th
Int. Summit OPV Stab. (2013).
86. Kools, J. High Throughput Atomic Layer Deposition of Al2O3 Ultrabarrier
Encapsulation. in Int. Conf. Org. Electron. (2013).
87. George, S. M. Atomic layer deposition: An overview. Chem. Rev. 110, 111–131
(2010).
88. Carcia, P. F., McLean, R. S., Reilly, M. H., Groner, M. D. & George, S. M. Ca test of
Al[sub 2]O[sub 3] gas diffusion barriers grown by atomic layer deposition on
polymers. Appl. Phys. Lett. 89, 031915 (2006).
89. Meyer, J., Schmidt, H., Kowalsky, W., Riedl, T. & Kahn, a. The origin of low water
vapor transmission rates through Al[sub 2]O[sub 3]/ZrO[sub 2] nanolaminate gas-

189
diffusion barriers grown by atomic layer deposition. Appl. Phys. Lett. 96, 243308
(2010).
90. Gaume, J. Etude du photovieillissement de materiaux nanocomposites pour
l’encapsulation de cellules solaires organiques. (2011).
91. Gaume, J. et al. Optimization of PVA clay nanocomposite for ultra-barrier multilayer
encapsulation of organic solar cells. Sol. Energy Mater. Sol. Cells 99, 240–249 (2012).
92. Cros, S. & Morlier, A. GAS BARRIER MEASUREMENT : DEVICE & METHOD
TO CONTROL RAPIDLY. in Large Area Org. Print. Electron. Conv. (2013).
93. Lohwasser, W. Affordable Industrial Flexible High Barrier Materials for the
Encapsulation of Organic Electronics. in Large Area Org. Print. Electron. Conv.
(2013).
94. Mccormick, F. B. Barrier Films and Adhesives for OLED Solid State Lighting. in US
Dep. Energy Solid State Light. Work. (2014).
95. Gaume, J., Wong-Wah-Chung, P., Rivaton, A., Thérias, S. & Gardette, J.-L.
Photochemical behavior of PVA as an oxygen-barrier polymer for solar cell
encapsulation. RSC Adv. 1, 1471 (2011).
96. Kucukpinar, E., Kiese, S., Miesbauer, O. & Noller, K. Encapsulation Materials for
OPVs : Integration of Novel Barrier Adhesives. in 6th Int. Summit OPV Stab. (2013).
97. Schmidt, M. et al. Adhesion and Barrier Performance of Novel Barrier Adhesives Used
in Multilayered High-Barrier Laminates. J. Adhes. Sci. Technol. (2012).
doi:10.1163/156856111X599535
98. Harkema, S., Muelendijks-Kiggen, N. M. M. & Vanee, R. J. Nanocomposite, Method
to Produce the Same, A Barrier Structure for an Electronic Device and an OLED
Comprising the Same. (2014).
99. Hösel, M., Søndergaard, R. R., Jørgensen, M. & Krebs, F. C. Comparison of UV-
curing, hotmelt, and pressure sensitive adhesive as roll-to-roll encapsulation methods
for polymer solar cells. Adv. Eng. Mater. 15, 1068–1075 (2013).
100. Lin, C.-C., Hsu, S.-H., Chang, Y.-L. & Su, W.-F. Transparent hydrophobic durable low
moisture permeation poly(fluoroimide acrylate)/SiO2 nanocomposite from solventless
photocurable resin system. J. Mater. Chem. 20, 3084 (2010).
101. Ravichandran, J., Manoj, a G., Liu, J., Manna, I. & Carroll, D. L. A novel polymer
nanotube composite for photovoltaic packaging applications. Nanotechnology 19,
085712 (2008).
102. Seethamraju, S., Ramamurthy, P. C. & Madras, G. Ionomer based blend as water vapor
barrier material for organic device encapsulation. ACS Appl. Mater. Interfaces 5, 4409–
4416 (2013).
103. Handbook of Adhesives and Sealants. (Elsevier Ltd, 2005).
104. Handbook of Adhesives and Surface Preparation. (Elsevier Inc., 2011).
105. Braun, T. et al. Enhancement of Barrier Properties of Encapsulants for Harsh
Environment Applications. in IEEE Trans. Components Packag. Technol. 1418–1425
(2012).
106. Braun, T. et al. Water diffusion in micro- and nano-particle filled encapsulants.
Electron. Syst. Integr. Technol. Conf. Proc. 1, (2010).
107. Poppe, L., Paskevich, V., Hathaway, J. & Blackwood, D. U. S. Geological Survey
Open-File Report 01-041: A Laboratory Manual for X-Ray Powder Diffraction. at
<http://pubs.usgs.gov/of/2001/of01-041/>
108. Drozdov, A. D., Christiansen, J., Gupta, R. K. & Shah, A. P. Model for Anomalous
Moisture Diffusion through a Polymer – Clay Nanocomposite. J. Polym. Sci. Part B
Polym. Phys. 41, 476–492 (2002).

190
109. Kim, J. K., Hu, C., Woo, R. S. C. & Sham, M. L. Moisture barrier characteristics of
organoclay-epoxy nanocomposites. Compos. Sci. Technol. 65, 805–813 (2005).
110. Uhl, F. M., Davuluri, S. P., Wong, S. C. & Webster, D. C. Organically modified
montmorillonites in UV curable urethane acrylate films. Polymer (Guildf). 45, 6175–
6187 (2004).
111. Uhl, F. M., Webster, D. C., Davuluri, S. P. & Wong, S. C. UV curable epoxy acrylate-
clay nanocomposites. Eur. Polym. J. 42, 2596–2605 (2006).
112. Yano, K., Usuki, A. & Okada, A. Synthesis and Properties of Polyimide-Clay Hybrid
Films. J. Polym. Sci. Part A Polym. Chem. 2289–2294 (2000).
113. Moller, M. W. et al. UV-cured, flexible, and transparent nanocomposite coating with
remarkable oxygen barrier. Adv. Mater. 24, 2142–2147 (2012).
114. Picard, E., Vermogen, a., G??rard, J. F. & Espuche, E. Barrier properties of nylon 6-
montmorillonite nanocomposite membranes prepared by melt blending: Influence of
the clay content and dispersion state. Consequences on modelling. J. Memb. Sci. 292,
133–144 (2007).
115. Granstrom, J., Gällstedt, M., Villet, M., Moon, J. S. & Chatterjee, T. High performance
encapsulation structures utilizing Russian Doll architectures. Thin Solid Films 518,
5282–5287 (2010).
116. Bolis, V., Busco, C. & Ugliengo, P. Thermodynamic study of water adsorption in high-
silica zeolites. J. Phys. Chem. B 110, 14849–14859 (2006).
117. Ng, E. P. & Mintova, S. Nanoporous materials with enhanced hydrophilicity and high
water sorption capacity. Microporous Mesoporous Mater. 114, 1–26 (2008).
118. Valtchev, V. & Tosheva, L. Porous Nanosized Particles : Preparation , Properties , and
Applications. Chem. Rev. (2013). doi:10.1021/cr300439k
119. Liljedahl, C. D. M., Crocombe, a. D., Gauntlett, F. E., Rihawy, M. S. & Clough, a. S.
Characterising moisture ingress in adhesively bonded joints using nuclear reaction
analysis. Int. J. Adhes. Adhes. 29, 356–360 (2009).
120. Sanopoulou, M., Stamatialis, D. F. & Petropoulos, J. H. Investigation of case II
diffusion behavior. 1. Theoretical studies based on the relaxation dependent solubility
model. Macromolecules 35, 1012–1020 (2002).
121. Zanni-Deffarges, M. P. & Shanahan, M. E. R. Diffusion of water into an epoxy
adhesive: comparison between bulk behaviour and adhesive joints. Int. J. Adhes.
Adhes. 15, 137–142 (1995).
122. LaPlante, G., Ouriadov, A. V., Lee-Sullivan, P. & Balcom, B. J. Anomalous moisture
diffusion in an epoxy adhesive detected by magnetic resonance imaging. J. Appl.
Polym. Sci. 109, 1350–1359 (2008).
123. O’Brien, E. P., White, C. C. & Vogt, B. D. Correlating Interfacial Moisture Content
and Adhesive Fracture Energy of Polymer Coatings on Different Surfaces. Adv. Eng.
Mater. 8, 114–118 (2006).
124. Wapner, K., Stratmann, M. & Grundmeier, G. In situ infrared spectroscopic and
scanning Kelvin probe measurements of water and ion transport at polymer/metal
interfaces. Electrochim. Acta 51, 3303–3315 (2006).
125. Baldan, A. Adhesion phenomena in bonded joints. Int. J. Adhes. Adhes. 38, 95–116
(2012).
126. Lam, D. C. C., Yang, F. & Tong, P. Chemical kinetic model of interfacial degradation
of adhesive joints. IEEE Trans. Components Packag. Technol. 22, 215–220 (1999).
127. Leger, R., Roy, a. & Grandidier, J. C. A study of the impact of humid aging on the
strength of industrial adhesive joints. Int. J. Adhes. Adhes. 44, 66–77 (2013).

191
128. Mubashar, a., Ashcroft, I. a., Critchlow, G. W. & Crocombe, a. D. Moisture
absorption-desorption effects in adhesive joints. Int. J. Adhes. Adhes. 29, 751–760
(2009).
129. Mubashar, a., Ashcroft, I. a., Critchlow, G. W. & Crocombe, a. D. Strength prediction
of adhesive joints after cyclic moisture conditioning using a cohesive zone model. Eng.
Fract. Mech. 78, 2746–2760 (2011).
130. Wapner, K. & Grundmeier, G. Spatially resolved measurements of the diffusion of
water in a model adhesive/silicon lap joint using FTIR-transmission-microscopy. Int. J.
Adhes. Adhes. 24, 193–200 (2004).
131. Kapur, J., Proost, K. & Smith, C. A. Determination of moisture ingress through various
encapsulants in glass/glass laminates. Conf. Rec. IEEE Photovolt. Spec. Conf. 001210–
001214 (2009).
132. Tanenbaum, D. M. et al. Edge sealing for low cost stability enhancement of roll-to-roll
processed flexible solar cell modules. Sol. Energy Mater. Sol. Cells 97, 157–163
(2011).
133. Vitriflex Website. at <http://www.vitriflex.com/>
134. Kateeva Website. at <http://kateeva.com/>
135. Elkington, D., Cooling, N., Zhou, X. J., Belcher, W. J. & Dastoor, P. C. Single-step
annealing and encapsulation for organic photovoltaics using an exothermically-setting
encapsulant material. Sol. Energy Mater. Sol. Cells 124, 75–78 (2014).
136. La Notte, L. et al. Influence of encapsulation materials on the optical properties and
conversion efficiency of heat-sealed flexible polymer solar cells. Surf. Coatings
Technol. 255, 69–73 (2014).
137. Hülsmann, P., Weiß, K.-A. & Köhl, M. Temperature-dependent water vapour and
oxygen permeation through different polymeric materials used in photovoltaic-
modules. Prog. Photovoltaics Res. Appl. 22, 415–421 (2014).
138. Gupta, S., Ramamurthy, P. C. & Madras, G. Synthesis and characterization of flexible
epoxy nanocomposites reinforced with amine functionalized alumina nanoparticles: a
potential encapsulant for organic devices. Polym. Chem. 2, 221 (2011).
139. Osman, M. a., Mittal, V., Morbidelli, M. & Suter, U. W. Polyurethane adhesive
nanocomposites as gas permeation barrier. Macromolecules 36, 9851–9858 (2003).
140. Søndergaard, R. R. et al. The use of polyurethane as encapsulating method for polymer
solar cells - An inter laboratory study on outdoor stability in 8 countries. Sol. Energy
Mater. Sol. Cells 99, 292–300 (2012).
141. Mailhot, B., Morlat-Thérias, S., Ouahioune, M. & Gardette, J. L. Study of the
degradation of an epoxy/amine resin, 1 photo- and thermo-chemical mechanisms.
Macromol. Chem. Phys. 206, 575–584 (2005).
142. Mailhot, B., Morlat-Thérias, S., Bussière, P. O. & Gardette, J. L. Study of the
degradation of an epoxy/amine resin, 2 kinetics and depth-profiles. Macromol. Chem.
Phys. 206, 585–591 (2005).
143. Rivaton, A., Moreau, L. & Gardette, J.-L. Photo-oxidation of phenoxy resins at long
and short wavelengths—I. Identification of the photoproducts. Polym. Degrad. Stab.
58, 321–332 (1997).
144. Rivaton, A., Moreau, L. & Gardette, J.-L. Photo-oxidation of phenoxy resins at long
and short wavelengths—II. Mechanisms of formation of photoproducts. Polym.
Degrad. Stab. 58, 333–339 (1997).
145. Woo, R. S. C. et al. Environmental degradation of epoxy-organoclay nanocomposites
due to UV exposure. Part I: Photo-degradation. Compos. Sci. Technol. 67, 3448–3456
(2007).
192
146. Woo, R. S. C., Zhu, H., Leung, C. K. Y. & Kim, J. K. Environmental degradation of
epoxy-organoclay nanocomposites due to UV exposure: Part II residual mechanical
properties. Compos. Sci. Technol. 68, 2149–2155 (2008).
147. Lin, S. H. et al. Synthesis of ultraviolet curable encapsulating adhesives and their
package applications for organic optoelectronic devices. Solid State Sci. 13, 1889–1895
(2011).
148. Chung, M.-H. et al. Preparation of organic/inorganic hybrid nanocomposites by
ultraviolet irradiation and their packaging applications for organic optoelectronic
devices. Appl. Surf. Sci. 257, 9142–9151 (2011).
149. Hong, B. T., Shin, K. S. & Kim, D. S. Ultraviolet-curing behavior of an epoxy acrylate
resin system. J. Appl. Polym. Sci. 98, 1180–1185 (2005).
150. Hwang, J. S., Kim, M. H., Seo, D. S., Won, J. W. & Moon, D. K. Effects of soft
segment mixtures with different molecular weight on the properties and reliability of
UV curable adhesives for electrodes protection of plasma display panel (PDP).
Microelectron. Reliab. 49, 517–522 (2009).
151. Benard, F., Mailhot, B., Mallegol, J. & Gardette, J. L. Photoageing of an electron beam
cured polyurethane acrylate resin. Polym. Degrad. Stab. 93, 1122–1130 (2008).
152. Decker, C. & Zahouily, K. Photodegradation and photooxidation of thermoset and UV-
cured acrylate polymers. Polym. Degrad. Stab. 64, 293–304 (1999).
153. Larche, J. F., Bussire, P. O. & Gardette, J. L. Photo-oxidation of acrylic-urethane
thermoset networks. Relating materials properties to changes of chemical structure.
Polym. Degrad. Stab. 96, 1438–1444 (2011).
154. Arajo, P. H. H., Sayer, C., Giudici, R. & Poo, J. G. R. Techniques for reducing residual
monomer content in polymers: A review. Polym. Eng. Sci. 42, 1442–1468 (2002).
155. Czech, Z. & Pelech, R. THERMAL DEGRADATION OF BUTYL ACRYLATE-
METHYL ACRYLATE-ACRYLIC ACID-COPOLYMERS. J. Therm. Anal. Calorim.
96, 583–586 (2009).
156. Lee, S. W. et al. Optical properties and UV-curing behaviors of optically clear semi-
interpenetrated structured acrylic pressure sensitive adhesives. Int. J. Adhes. Adhes. 38,
5–10 (2012).
157. Lee, S. W. et al. Optical properties and UV-curing behaviors of optically clear PSA-
TiO 2 nano-composites. Int. J. Adhes. Adhes. 44, 200–208 (2013).
158. Sun, S., Li, M. & Liu, A. A review on mechanical properties of pressure sensitive
adhesives. Int. J. Adhes. Adhes. 41, 98–106 (2013).
159. Photochemistry and Photophysics of Polymeric Materials. (John Wiley and Sons, Ltd,
2010).
160. Bennet, F., Barker, P. J., Davis, T. P., Soeriyadi, A. H. & Barner-kowollik, C.
Degradation of Poly ( butyl acrylate ) and Poly ( 2- hydroxyethyl methacrylate ) Model
Compounds Under Extreme Environmental Conditions a. Macromol. Chem. Phys. 211,
2034–2052 (2010).
161. Liang, R. R. H., Tsay, F.-D. & Gupta, A. Photodegradation of poly (n-butyl acrylate).
Photochemical processes in polymeric systems. 8. Macromolecules 15, 974–980
(1982).
162. McGill, W. & Ackerman, L. Photolysis of Poly ( ethyl Acrylate ) and Poly ( n-butyl
Acrylate ) in Vacuo. J. Polym. Sci. 12, 1541–1547 (1974).
163. Soeriyadi, A. H. et al. A detailed surface analytical study of degradation processes in
(meth)acrylic polymers. J. Polym. Sci. Part A Polym. Chem. 50, 1801–1811 (2012).
164. Forsthuber, B. & Grull, G. The effects of HALS in the prevention of photo-degradation
of acrylic clear topcoats and wooden surfaces. Polym. Degrad. Stab. 95, 746–755
(2010).

193
165. Krongauz, V. V. & Ling, M. T. K. Photo-crosslinked acrylates degradation kinetics. J.
Therm. Anal. Calorim. 96, 715–725 (2009).
166. Mocon Website. at <www.mocon.com>
167. Grahlert, W. et al. Reliable determination of the water vapor transmission rate of ultra-
high barrier samples in the 10-4 to 10-6 g/m2/d range enabled by tunable diode laser
spectroscopy. in Large Area Org. Print. Electron. Conv. (2013).
168. Nisato, G. et al. Permeation Measurements Using the Calcium Tests. (2012).
169. Reese, M. O., Dameron, A. a & Kempe, M. D. Quantitative calcium resistivity based
method for accurate and scalable water vapor transmission rate measurement. Rev. Sci.
Instrum. 82, 085101 (2011).
170. Nisato, G. et al. Evaluating High Performance Diffusion Barriers: The Calcium Test.
Asia Disp. (2001).
171. ASTM D570 Standard Test Method for Water Absorption of Plastics.
doi:10.1520/D0570-98R10E01
172. ASTM D5229 / D5229M Standard Test Method for Moisture Absorption Properties
and Equilibrium Conditioning of Polymer Matrix Composite Materials.
doi:10.1520/D5229_D5229M-14
173. Nissen, D. a. The low-temperature oxidation of calcium by water vapor. Oxid. Met. 11,
241–261 (1977).
174. Cros, S., Firon, M., Lenfant, S., Trouslard, P. & Beck, L. Study of thin calcium
electrode degradation by ion beam analysis. Nucl. Instruments Methods Phys. Res.
Sect. B Beam Interact. with Mater. Atoms 251, 257–260 (2006).
175. Klumbies, H., Müller-Meskamp, L., Mönch, T., Schubert, S. & Leo, K. The influence
of laterally inhomogeneous corrosion on electrical and optical calcium moisture barrier
characterization. Rev. Sci. Instrum. 84, 024103 (2013).
176. Paetzold, R., Winnacker, a., Henseler, D., Cesari, V. & Heuser, K. Permeation rate
measurements by electrical analysis of calcium corrosion. Rev. Sci. Instrum. 74, 5147–
5150 (2003).
177. Schubert, S., Klumbies, H., M??ller-Meskamp, L. & Leo, K. Electrical calcium test for
moisture barrier evaluation for organic devices. Rev. Sci. Instrum. 82, 094101 (2011).
178. Klumbies, H. et al. Water ingress into and climate dependent lifetime of organic
photovoltaic cells investigated by calcium corrosion tests. Sol. Energy Mater. Sol. Cells
120, 685–690 (2014).
179. Boutillier, J. Nanostrength Acrylic block copolymers for thermoplastic adhesive
applications. in Eur. Coatings Show (2011).
180. Zeomics. (2014). at <http://helios.princeton.edu/zeomics/>