Embed Size (px)
Citation preview
Debarun DasDepartment of Mechanical and
Materials Engineering,
University of Cincinnati,
593 Rhodes Hall, ML 0072,
Cincinnati, OH 45221
Marwan F. Al-RjoubDepartment of Mechanical and
Materials Engineering,
University of Cincinnati,
593 Rhodes Hall, ML 0072,
Cincinnati, OH 45221
Rupak K. Banerjee1
Fellow ASME
Department of Mechanical and
Materials Engineering,
University of Cincinnati,
593 Rhodes Hall, ML 0072,
Cincinnati, OH 45221
e-mail: [email protected]
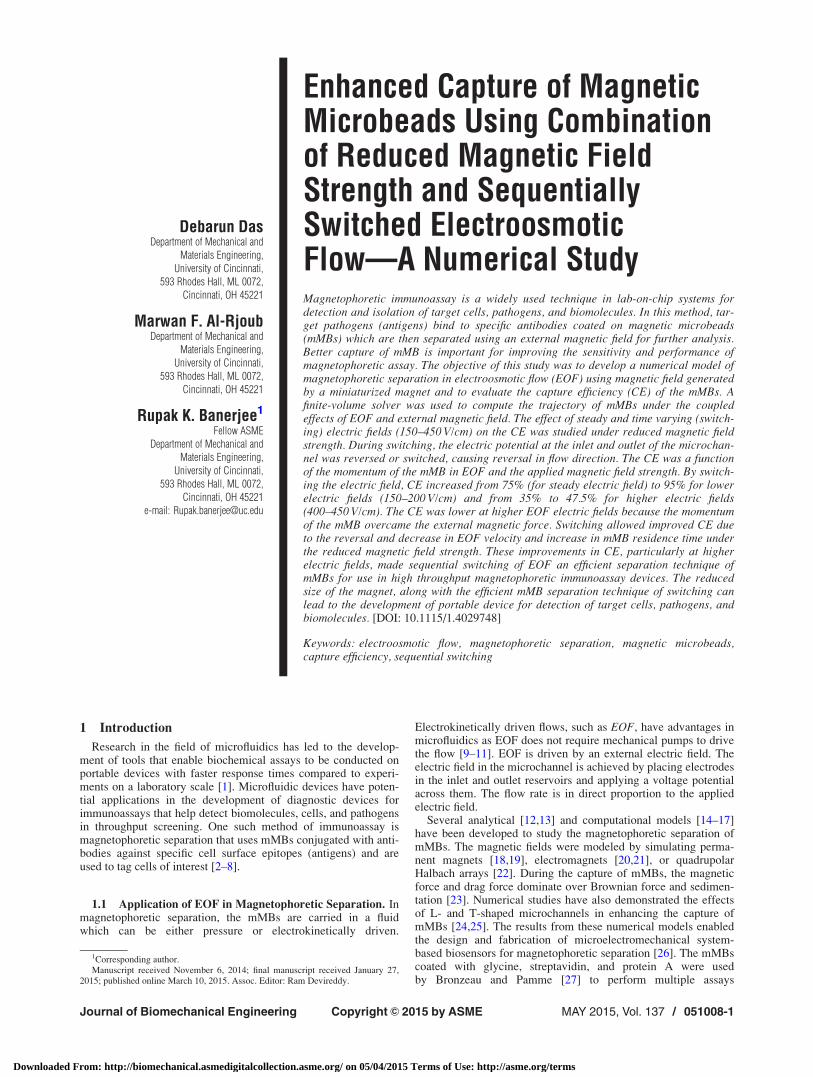
Enhanced Capture of MagneticMicrobeads Using Combinationof Reduced Magnetic FieldStrength and SequentiallySwitched ElectroosmoticFlow—A Numerical StudyMagnetophoretic immunoassay is a widely used technique in lab-on-chip systems fordetection and isolation of target cells, pathogens, and biomolecules. In this method, tar-get pathogens (antigens) bind to specific antibodies coated on magnetic microbeads(mMBs) which are then separated using an external magnetic field for further analysis.Better capture of mMB is important for improving the sensitivity and performance ofmagnetophoretic assay. The objective of this study was to develop a numerical model ofmagnetophoretic separation in electroosmotic flow (EOF) using magnetic field generatedby a miniaturized magnet and to evaluate the capture efficiency (CE) of the mMBs. Afinite-volume solver was used to compute the trajectory of mMBs under the coupledeffects of EOF and external magnetic field. The effect of steady and time varying (switch-ing) electric fields (150–450 V/cm) on the CE was studied under reduced magnetic fieldstrength. During switching, the electric potential at the inlet and outlet of the microchan-nel was reversed or switched, causing reversal in flow direction. The CE was a functionof the momentum of the mMB in EOF and the applied magnetic field strength. By switch-ing the electric field, CE increased from 75% (for steady electric field) to 95% for lowerelectric fields (150–200 V/cm) and from 35% to 47.5% for higher electric fields(400–450 V/cm). The CE was lower at higher EOF electric fields because the momentumof the mMB overcame the external magnetic force. Switching allowed improved CE dueto the reversal and decrease in EOF velocity and increase in mMB residence time underthe reduced magnetic field strength. These improvements in CE, particularly at higherelectric fields, made sequential switching of EOF an efficient separation technique ofmMBs for use in high throughput magnetophoretic immunoassay devices. The reducedsize of the magnet, along with the efficient mMB separation technique of switching canlead to the development of portable device for detection of target cells, pathogens, andbiomolecules. [DOI: 10.1115/1.4029748]
Keywords: electroosmotic flow, magnetophoretic separation, magnetic microbeads,capture efficiency, sequential switching
1 Introduction
Research in the field of microfluidics has led to the develop-ment of tools that enable biochemical assays to be conducted onportable devices with faster response times compared to experi-ments on a laboratory scale [1]. Microfluidic devices have poten-tial applications in the development of diagnostic devices forimmunoassays that help detect biomolecules, cells, and pathogensin throughput screening. One such method of immunoassay ismagnetophoretic separation that uses mMBs conjugated with anti-bodies against specific cell surface epitopes (antigens) and areused to tag cells of interest [2–8].
1.1 Application of EOF in Magnetophoretic Separation. Inmagnetophoretic separation, the mMBs are carried in a fluidwhich can be either pressure or electrokinetically driven.
Electrokinetically driven flows, such as EOF, have advantages inmicrofluidics as EOF does not require mechanical pumps to drivethe flow [9–11]. EOF is driven by an external electric field. Theelectric field in the microchannel is achieved by placing electrodesin the inlet and outlet reservoirs and applying a voltage potentialacross them. The flow rate is in direct proportion to the appliedelectric field.
Several analytical [12,13] and computational models [14–17]have been developed to study the magnetophoretic separation ofmMBs. The magnetic fields were modeled by simulating perma-nent magnets [18,19], electromagnets [20,21], or quadrupolarHalbach arrays [22]. During the capture of mMBs, the magneticforce and drag force dominate over Brownian force and sedimen-tation [23]. Numerical studies have also demonstrated the effectsof L- and T-shaped microchannels in enhancing the capture ofmMBs [24,25]. The results from these numerical models enabledthe design and fabrication of microelectromechanical system-based biosensors for magnetophoretic separation [26]. The mMBscoated with glycine, streptavidin, and protein A were usedby Bronzeau and Pamme [27] to perform multiple assays
1Corresponding author.Manuscript received November 6, 2014; final manuscript received January 27,
2015; published online March 10, 2015. Assoc. Editor: Ram Devireddy.
Journal of Biomechanical Engineering MAY 2015, Vol. 137 / 051008-1Copyright VC 2015 by ASME
Downloaded From: http://biomechanical.asmedigitalcollection.asme.org/ on 05/04/2015 Terms of Use: http://asme.org/terms

simultaneously. Teste et al. [28] used the intrinsic magnetic fieldof mMB, in channels with restricted flow, to trap magnetic nano-beads. In other applications, Wang et al. [29] used mMBs forrapid mixing in microchannels.
1.2 Advantages of mMBs as Antigen–Antibody DiagnosticTool. The micron-sized spherical mMBs consist of iron oxidenanospheres (Fe2O3 or Fe3O4) embedded in a polystyrene sub-strate, with the antibodies attached to the outer surface of thepolymer matrix. Cell separation is achieved by applying an exter-nal magnetic field to impart magnetophoretic mobility to thetagged cells. These functionalized mMBs can be manipulatedindependent of the microfluidic medium and chip substrate, whichhave contrasting magnetic properties [30]. The tagged cells orbiomolecules experience minimal disturbance during the manipu-lation process by external magnetic field [31,32]. Also, the manip-ulation of target cells or biomolecules using mMB is effectivesince the magnetic interactions are not generally affected bysurface charges, pH, ionic concentrations, or temperature [33].Magnetic labeling is more robust than other labeling methods,such as fluorescent labeling, because the magnetic property of aparticle cannot be quenched at normal working temperatures [31].The applications of magnetophoresis in microfluidics have beencovered in detailed reviews by Gijs [31], Pamme [33], andGanguly and Puri [30].
1.3 Significance of mMB CE in MagnetophoreticSeparation. The reduced CE of mMBs affects the sensitivity ofthe device to detect target pathogens from dilute samples [34].Also, imperfect mMB retention leads to the loss of samples andexpensive reagents. While several studies, discussed earlier, havetried to develop novel techniques for capturing mMBs using dif-ferent channel and magnetic field configurations, very few amongthese have focused on the techniques to improve the mMB CEwithout additional complications in the flow path and magneticfield configurations. While some devices and models rely on elab-orate magnetic field to improve the CE, others rely on very lowflow rates for successful mMB separation. There is, therefore, aneed to improve the mMB CE in microfluidics by focusing on thetype of flow, without additional complications to the design.
1.4 Current Study: Capture of mMBs in SwitchedEOF. Most studies have used pressure driven flow to demonstrateCE of mMBs. However, the capture of mMBs in EOF has notbeen reported in current literature. The transport of liquids andsamples through the microchannels is critical in microfluidicimmunoassays and the quality of the fluid-driving system candirectly affect the results of these assays. EOF has been recentlyused as a liquid transport strategy because it offers precise controlover media velocity, sample volume, and provides automation ofsample handling in a microfluidic system [35], when compared topressure driven flow. Because of these advantages, EOF has beenused in microfluidic devices for clinical applications. For example,Gao et al. [36] developed an EOF-driven microfluidic device for si-multaneous detection of multiple microbial targets (E. coli and H.pylori). Using droplet-based microfluidic devices, the applicationof electrokinetic flows has also been demonstrated for clinical diag-nostics of human physiological fluids [37]. Enzyme assays, deoxy-ribonucleic acid (DNA) separation immunoassay, and polymerasechain reaction amplification are some additional processes thathave been integrated in microfluidics using EOF [38,39].
EOF also offers a unique advantage over pressure-driven flowsas the flow direction can be altered rapidly by reversing, orswitching, the polarity of the applied potential at the inlet and out-let. To achieve flow reversal in pressure driven systems, additionalpumps, and conduits with complex designs would be required.Flow reversal to enhance CE has not been investigated byresearchers. The reversal in EOF flow direction within the channelcould cause a momentary drop in the mMB velocity which could
allow the magnetic force to overcome the momentum of the flow-ing mMB, resulting in their capture. Also, reversing the flow nearthe miniaturized magnet could increase the residence time of themMBs in a region of higher magnetic field, thus increasing theirprobability of getting captured.
Accordingly, the goal of this study was to develop a numericalmodel to demonstrate the CE of mMBs by sequential switching ofthe external electric field that drives the EOF. Due to disadvan-tages of using electromagnets, i.e., Joule heating and weakmagnetic field [31], the strongest known magnetic material, per-manent earth magnet or neodymium (NdFeB) [40], was simulatedas a source of external magnetic field in our model. The reducedsize of the magnet in our model led to lower values of magneticfield strength (T, Tesla) within the channels. Despite the reducedfield strength, sequential switching of EOF ensured efficient mMBcapture when using miniaturized magnets. Integrating such mag-nets with an efficient mMB capture method will help in develop-ing smaller scale portable device for field testing. The importantdesign-variable studied in the model was the effect of the appliedelectric field, both constant and time varying (switching), on themMB CE under constant magnetic force. In this study, we wereparticularly interested in improving the CE at higher electricfields, since flow at high electric fields, i.e., higher flow rates,could help design a high throughput microfluidic device withimproved mMB retention and high CE.
2 Methodology
This section describes the governing equations for magnetopho-retic flow, the numerical schemes used to compute the trajectoriesof the mMBs, and the validation of our numerical model. Theclassical Navier–Stokes equation of fluid mechanics was modifiedto account for the influence of external electric field as a drivingforce for the flow [9,10]. The transport of mMBs in the channelwas affected by the flow field and the external magnetic field. ThemMBs were tracked in the computational domain using Euler-ian–Lagrangian approach. The primary figure-of-merit of ourmodel, called the CE, was calculated as the ratio of the number ofmMBs captured by the magnetic field to the number of mMBsinjected through the channel inlet (Eq. (12)).
2.1 Governing Equations. The governing equations for EOFwere derived based on the assumptions given in Krishnamoorthyet al. [41] and Comandur et al. [9], and are listed below
Conservation of mass: rV ¼ 0 (1)
Conservation of momentum: qDV
Dt¼ �rpþ lr2V þ f e (2)
Coulomb force: f e ¼ qeE (3)
Poisson’s equation: r2u ¼ 0 (4)
Electric field: E ¼ �ru (5)
where V represents the fluid velocity, q is the fluid density, l isdynamic viscosity, u is the applied potential, e is the permittivityof fluid, and E is the applied electric field. In the momentum equa-tion (Eq. (2)), fe represents the Coulomb force exerted by theexternal electric field. Additionally, the pressure drop term, rp, inour model was zero because a constant pressure was maintained atthe inlet and outlet of the channel during EOF in the channel. ThePoisson’s equation (Eq. (4)) was then coupled with the momentumequation (Eq. (2)). The electric field in the channel was solvedusing Eq. (5).
The governing equations for the magnetic field, velocity ofthe mMBs and the magnetic force experienced by them are givenbelow
Magneto-static equation: M ¼ B
lolr
lr � 1ð Þ (6)
051008-2 / Vol. 137, MAY 2015 Transactions of the ASME
Downloaded From: http://biomechanical.asmedigitalcollection.asme.org/ on 05/04/2015 Terms of Use: http://asme.org/terms

Magnetic force on mMB: Fm ¼1
2lo
v4
3pr3
b
� �Brð Þ � B (7)
Drag force on mMB: Fd ¼ 6plrb V � vbð Þ (8)
Newton’s second law
force balance on mMBð Þ: 4
3pr3
bqb
� �dvb
dt¼ Fm þ Fd þ Fg þ Ft
(9)
Velocity of mMB: vb ¼ V þ Fm
6prbl(10)
Particle relaxation time: s ¼ mb
6prbl(11)
CE %ð Þ ¼ No: of mMB captured by magnet
No: of mMB injected in channel�100 (12)
where B represents the magnetic field intensity, M is the magnet-ization of NdFeB material, v is the susceptibility of the mMB, Fm
is the magnetic force, lo is magnetic permeability of vacuum, lr isrelative permeability of NdFeB material, Fd is the viscous dragforce on the mMB, vb is the mMB velocity, rb is the mMB radius,qb is the mMB density, and mb is the mass of the mMB.
Based on the equations above, several parameters such as themagnetic field strength and the external electric field driving theflow can be simulated and optimized for the design of an efficientmMB separator. In our model, the magnetic field was kept constantand the electric field was varied to evaluate the changes in CE, for afixed design of the miniaturized magnet. The list of parameters usedin our model and their quantitative values are listed in Table 1.
Previous studies have shown that mMB having a radius greaterthan 40 nm experience a significantly larger drag force (Fd) andmagnetic force (Fm) compared to the Brownian force (Ft) andgravitational force (Fg) [23]. Also, based on the properties of themMBs used in our model, the value of particle relaxation time (s)was found to be significantly small, and consequently the termdvb=dt was nearly zero. Thus, Newton’s Second Law simplified toFm þ Fd ¼ 0 or Fm ¼ �Fd . The velocity of the mMBs, under theinfluence of the flow and magnetic fields, was computed usingEqs. (7)–(10). The mMBs are only affected by the flow field andmagnetic field. The mMBs are not influenced by the electric fieldor the gradient of the electric field because they do not possessany electrical charge.
The magnetic field, simulated using a miniaturized magnet, wascomputed based on the properties of a typical NdFeB magnet. Inour model, a one-way momentum coupling of the mMBs and fluidwas asserted into the numerical method, i.e., the velocity of thefluid (V) affected the velocity (vb) of the mMBs, but not vice versa.This condition was set based on a study by Khashan and Furlani[17] which showed that imposing a one-way particle–fluid cou-pling to calculate the capture of magnetic particles provides a con-servative estimate of CE in the dilute limit. The disadvantage, asoutlined in this study, is that the one way coupled model mayslightly over-predict the magnetic force needed to ensure particlecapture when the results are compared with a fully coupled model.
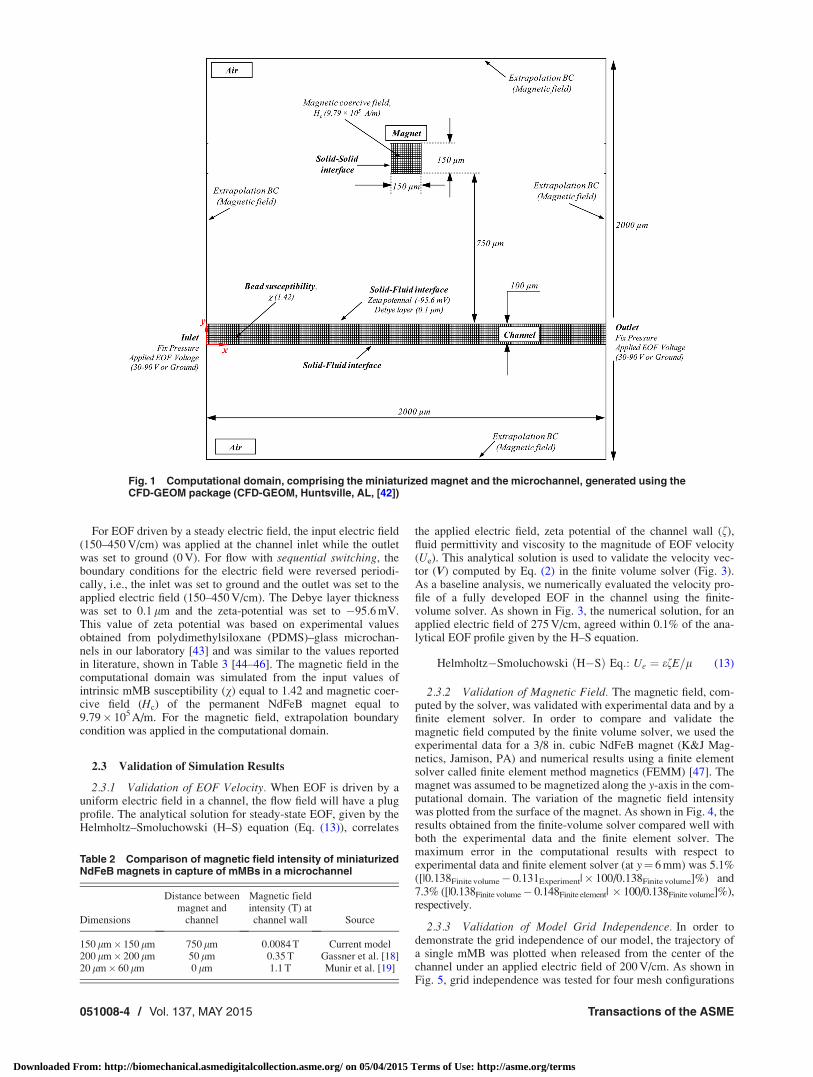
2.2 Computational Model and Method. The two-dimensional computational domain, shown in Fig. 1, comprised of
a miniaturized permanent magnet (150 lm� 150 lm) and amicrochannel (L�H¼ 2000 lm� 100 lm), surrounded by air.Although the length scale of typical microchannels is in the rangeof 1–5 cm, we have simulated a small section of this channel(2 mm), which is in close proximity to the miniaturized magnet.Considering the complex and coupled equations (Eqs. (1)–(10))being solved in the presented model, the aspect ratio of the gridwas kept close to 1. Due to this requirement, a truncated sectionof the device was simulated, while capturing the physics of mMBcapture. A truncated domain of the device was used to keep thenumber of numerical elements manageable and within the avail-able random access memory power of the computer used for thesimulations. Air accounted for the intermediary space between theminiaturized magnet and the channel and allowed the computationof magnetic field in that space. The numerical domain (Fig. 1)was meshed using structured mesh having 36,000 nodes with agrid spacing of 3.5 lm and an aspect ratio of �1.
The dimensions of the miniaturized NdFeB magnet in ourmodel were on the same scale of magnets simulated in previousstudies by other researchers [18,19]. However, the magnetic fieldintensity within the microchannels in the presented model wasmuch smaller compared to these studies, as shown in Table 2. Theincreased distance between the magnet and channel, and conse-quently, the reduce magnetic field intensity in the current modelwas to demonstrate the efficacy of the switching technique whenusing miniaturized magnets in a portable device with sufficientspacing between the magnet and microchannels.
The numerical calculations on the two-dimensional computa-tional model were performed using a finite-volume solver CFD-ACEþ, Huntsville, AL, [42]). The velocity field in the microchan-nel was solved using the modified Navier–Stokes equation (Eq.(2)) which included the Coulomb force due to the applied electricfield (Eq. (3)). The magnetic field was solved using the magneto-static equation (Eq. (6)). The convergence criterion for residualsin the simulations was set to 1� 10�6. The converged solutionof velocity and magnetic fields was then used to compute themagnetic force and drag force on the mMBs. The boundaryconditions for the flow (EOF) and magnetic field are shown inFig. 1. The boundary conditions for driving the EOF, i.e., zetapotential (f) and Debye layer thickness (kD), were applied tothe walls of the microchannel (solid–fluid interface in Fig. 1).The voltage driving the EOF was specified at the inlet and out-let of the channel. The magnetization of NdFeB was specifiedinitially for the magnetic volume and an extrapolation boundarycondition was applied at the walls for computing the magneticfield.
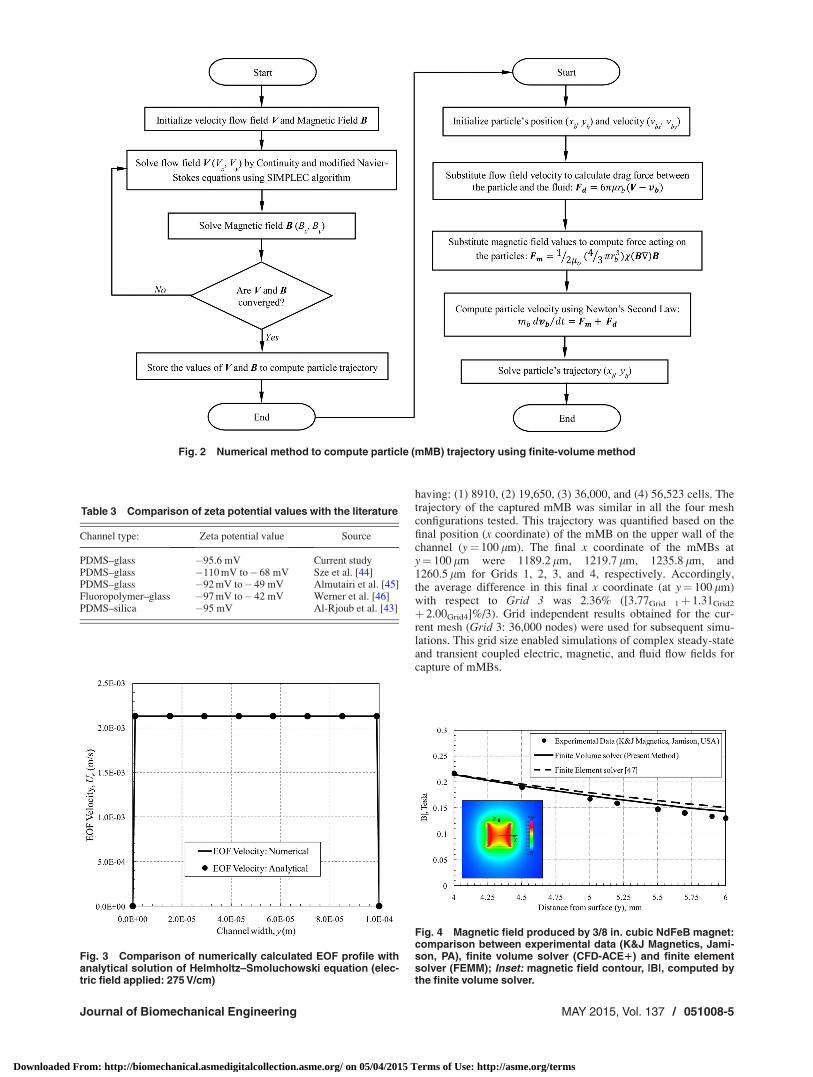
For each simulation, a fixed number of mMBs (20) wereinjected into the microchannel from the inlet. The mMBs weremodeled as discrete phases (or microparticles) using the spraymodule of the solver and were injected uniformly from the inlet.From the values of magnetic force and drag force, the trajectoriesof the mMBs were computed using Newton’s second law (Eq. (9))in a Lagrangian frame of reference. The CE of the microfluidicdevice, based on the number of mMBs injected and the numberof mMBs that escaped through the outlet was computed usingEq. (12). A flow chart of the overall algorithm used to computethe mMBs trajectories is illustrated in Fig. 2. The region in thechannel where the mMBs were immobilized was referred to as thecapture zone.
Table 1 List of properties used in the numerical calculations
Parameter Value Parameter Value
Fluid density (q) 997 kg/m3 EOF electric field 150–450 V/cmDynamic viscosity (l) 8.6� 10�4 Pa � s Radius of mMB (rb) 1.42 lmRelative permittivity (er) 78.8 Density of mMB (qb) 1800 kg/m3
Zeta potential (f) �95.6 mV Susceptibility (v) 1.42Debye-layer thickness (kD) 0.1 lm Magnetic coercive field (Hc) 9.79� 105 A/m
Journal of Biomechanical Engineering MAY 2015, Vol. 137 / 051008-3
Downloaded From: http://biomechanical.asmedigitalcollection.asme.org/ on 05/04/2015 Terms of Use: http://asme.org/terms
For EOF driven by a steady electric field, the input electric field(150–450 V/cm) was applied at the channel inlet while the outletwas set to ground (0 V). For flow with sequential switching, theboundary conditions for the electric field were reversed periodi-cally, i.e., the inlet was set to ground and the outlet was set to theapplied electric field (150–450 V/cm). The Debye layer thicknesswas set to 0.1 lm and the zeta-potential was set to �95.6 mV.This value of zeta potential was based on experimental valuesobtained from polydimethylsiloxane (PDMS)–glass microchan-nels in our laboratory [43] and was similar to the values reportedin literature, shown in Table 3 [44–46]. The magnetic field in thecomputational domain was simulated from the input values ofintrinsic mMB susceptibility (v) equal to 1.42 and magnetic coer-cive field (Hc) of the permanent NdFeB magnet equal to9.79� 105 A/m. For the magnetic field, extrapolation boundarycondition was applied in the computational domain.
2.3 Validation of Simulation Results
2.3.1 Validation of EOF Velocity. When EOF is driven by auniform electric field in a channel, the flow field will have a plugprofile. The analytical solution for steady-state EOF, given by theHelmholtz–Smoluchowski (H–S) equation (Eq. (13)), correlates
the applied electric field, zeta potential of the channel wall (f),fluid permittivity and viscosity to the magnitude of EOF velocity(Ue). This analytical solution is used to validate the velocity vec-tor (V) computed by Eq. (2) in the finite volume solver (Fig. 3).As a baseline analysis, we numerically evaluated the velocity pro-file of a fully developed EOF in the channel using the finite-volume solver. As shown in Fig. 3, the numerical solution, for anapplied electric field of 275 V/cm, agreed within 0.1% of the ana-lytical EOF profile given by the H–S equation.
Helmholtz�Smoluchowski H�Sð Þ Eq:: Ue ¼ efE=l (13)
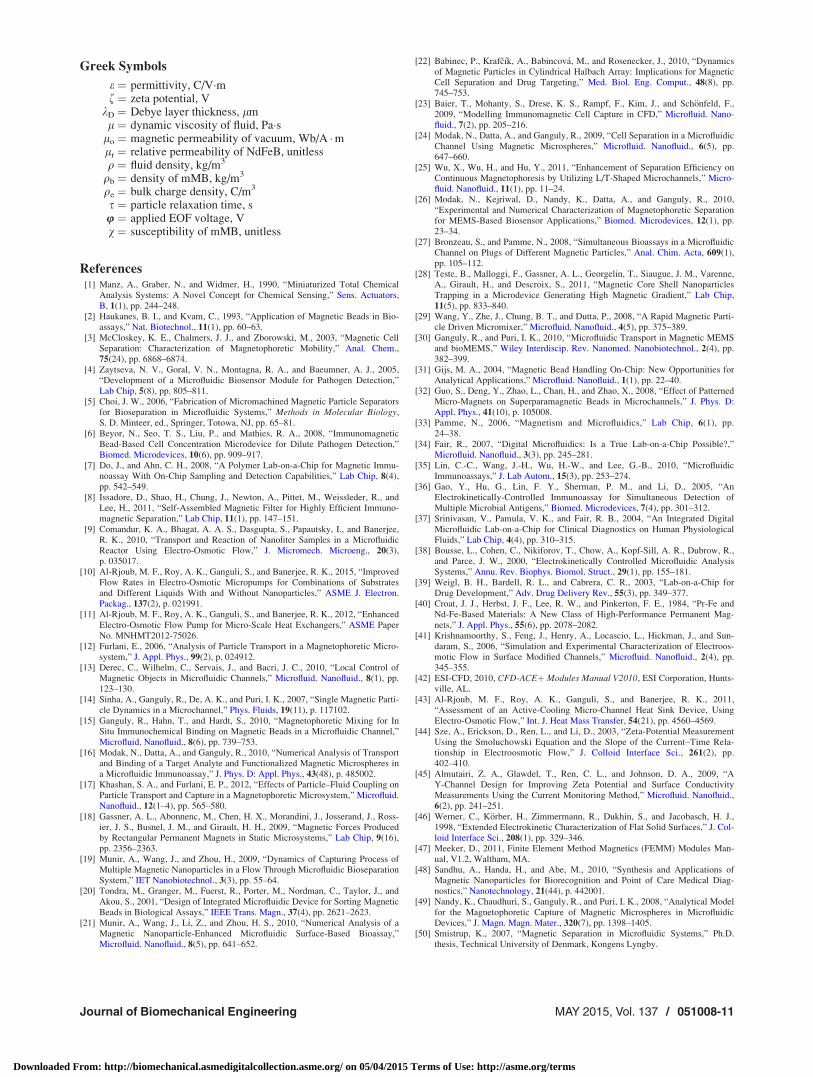
2.3.2 Validation of Magnetic Field. The magnetic field, com-puted by the solver, was validated with experimental data and by afinite element solver. In order to compare and validate themagnetic field computed by the finite volume solver, we used theexperimental data for a 3/8 in. cubic NdFeB magnet (K&J Mag-netics, Jamison, PA) and numerical results using a finite elementsolver called finite element method magnetics (FEMM) [47]. Themagnet was assumed to be magnetized along the y-axis in the com-putational domain. The variation of the magnetic field intensitywas plotted from the surface of the magnet. As shown in Fig. 4, theresults obtained from the finite-volume solver compared well withboth the experimental data and the finite element solver. Themaximum error in the computational results with respect toexperimental data and finite element solver (at y¼ 6 mm) was 5.1%([|0.138Finite volume� 0.131Experiment|� 100/0.138Finite volume]%) and7.3% ([|0.138Finite volume� 0.148Finiteelement| � 100/0.138Finite volume]%),respectively.
2.3.3 Validation of Model Grid Independence. In order todemonstrate the grid independence of our model, the trajectory ofa single mMB was plotted when released from the center of thechannel under an applied electric field of 200 V/cm. As shown inFig. 5, grid independence was tested for four mesh configurations
Table 2 Comparison of magnetic field intensity of miniaturizedNdFeB magnets in capture of mMBs in a microchannel
Dimensions
Distance betweenmagnet and
channel
Magnetic fieldintensity (T) atchannel wall Source
150 lm� 150 lm 750 lm 0.0084 T Current model200 lm� 200 lm 50 lm 0.35 T Gassner et al. [18]20 lm� 60 lm 0 lm 1.1 T Munir et al. [19]
Fig. 1 Computational domain, comprising the miniaturized magnet and the microchannel, generated using theCFD-GEOM package (CFD-GEOM, Huntsville, AL, [42])
051008-4 / Vol. 137, MAY 2015 Transactions of the ASME
Downloaded From: http://biomechanical.asmedigitalcollection.asme.org/ on 05/04/2015 Terms of Use: http://asme.org/terms
having: (1) 8910, (2) 19,650, (3) 36,000, and (4) 56,523 cells. Thetrajectory of the captured mMB was similar in all the four meshconfigurations tested. This trajectory was quantified based on thefinal position (x coordinate) of the mMB on the upper wall of thechannel (y¼ 100 lm). The final x coordinate of the mMBs aty¼ 100 lm were 1189.2 lm, 1219.7 lm, 1235.8 lm, and1260.5 lm for Grids 1, 2, 3, and 4, respectively. Accordingly,the average difference in this final x coordinate (at y¼ 100 lm)with respect to Grid 3 was 2.36% ([3.77Grid 1þ 1.31Grid2
þ 2.00Grid4]%/3). Grid independent results obtained for the cur-rent mesh (Grid 3: 36,000 nodes) were used for subsequent simu-lations. This grid size enabled simulations of complex steady-stateand transient coupled electric, magnetic, and fluid flow fields forcapture of mMBs.
Fig. 2 Numerical method to compute particle (mMB) trajectory using finite-volume method
Table 3 Comparison of zeta potential values with the literature
Channel type: Zeta potential value Source
PDMS–glass �95.6 mV Current studyPDMS–glass �110 mV to� 68 mV Sze et al. [44]PDMS–glass �92 mV to� 49 mV Almutairi et al. [45]Fluoropolymer–glass �97 mV to� 42 mV Werner et al. [46]PDMS–silica �95 mV Al-Rjoub et al. [43]
Fig. 3 Comparison of numerically calculated EOF profile withanalytical solution of Helmholtz–Smoluchowski equation (elec-tric field applied: 275 V/cm)
Fig. 4 Magnetic field produced by 3/8 in. cubic NdFeB magnet:comparison between experimental data (K&J Magnetics, Jami-son, PA), finite volume solver (CFD-ACE1) and finite elementsolver (FEMM); Inset: magnetic field contour, |B|, computed bythe finite volume solver.
Journal of Biomechanical Engineering MAY 2015, Vol. 137 / 051008-5
Downloaded From: http://biomechanical.asmedigitalcollection.asme.org/ on 05/04/2015 Terms of Use: http://asme.org/terms

3 Results
The magnetic field that immobilizes the mMBs, the electricfield that drives the flow and their coupled effects on the CE ofthe mMBs in the microchannel are discussed in this section.First, the magnetic field generated by a miniaturized magnetplaced above the microchannel and its effects on the trajectoryof mMB transported within the channel are described. Second,the CE of the mMBs using EOF is characterized under twoapplied electric field conditions: (a) steady electric field (con-stant inlet electric field, outlet grounded) and, (b) electric fieldaltered by sequential switching of applied potential at inlet andoutlet. The enhancement of CE by the periodic changes in flowdirection, caused by switching, is discussed in further detail.The characteristics of the EOF velocity profile are also assessedfor flows driven by steady and sequentially switched electricfield.
3.1 Effect of Magnetic Field. The magnetic field producedby permanent earth magnets, such as NdFeB have been found tobe effective in immobilizing mMBs in millitubes during immuno-assays [48]. Figure 6 shows the magnetic field contours around amicrochannel when simulated using the properties of NdFeB min-iaturized magnet. From the surface of the magnet, the magneticfield decreases exponentially in space. The magnetic field strengthused in this study is significantly lower than the ones reported inprevious studies (Table 2). The magnetic force exerted due to theexternal magnetic field is critical in determining the number ofmMB immobilized in the microchannel. To study the effect ofthis force on the trajectory of the mMB, 20 mMBs, equally spacedalong the inlet, were injected into the microchannel.
As an example, the trajectory of the mMBs is plotted foran applied EOF electric field of 275 V/cm (Fig. 7). Out of the20 mMBs injected, 10 were captured by the magnetic field. Since
Fig. 5 The mMB trajectory for applied electric field of 200 V/cm demonstrating grid independ-ent results for the computational model, shown for a section of the numerical domain
Fig. 6 Variation of magnetic vector potential (Az) in the computational domain and magneticforce vectors in the microchannel
051008-6 / Vol. 137, MAY 2015 Transactions of the ASME
Downloaded From: http://biomechanical.asmedigitalcollection.asme.org/ on 05/04/2015 Terms of Use: http://asme.org/terms

the magnetic force, similar to the magnetic field, decays as onemoves away from the surface of the miniaturized magnet, themMBs injected from the top of the channel (closer to the magnet)were more susceptible to being captured than those injected fromthe bottom. Therefore, the remaining 10 mMBs, injected near thebottom of the channel, overcame the force exerted by the magnetand eventually reached the outlet. For an applied EOF electricfield of 275 V/cm, the CE, calculated using Eq. (12), was 50%.
3.2 CE Without Switching. The CE at an applied EOF elec-tric field was evaluated for the without switching case by keepingthe polarity of electric field constant at the inlet and outlet of themicrochannel. At all times during the simulations the EOF had aplug profile. The CE of the system decreased with increase inEOF electric field driving the flow (Fig. 8). This decrease wasbecause of increase in fluid velocities at higher electric fields(from Eq. (13), Ue / E). With the increased flow rates, the mMBsin the channel acquired higher momentum. Consequently, themMBs escaped through the outlet after overcoming the strongermagnetic force in the capture zone. For the without switching case(steady electric field), the maximum CE obtained was 85% at
150 V/cm. The average CE at lower electric fields (150–200 V/cm)was 75% ([85150 V/cmþ 75175 V/cmþ 65200 V/cm]%/3). At higherelectric fields (400–450 V/cm), this average decreased to 35%([35400 V/cmþ 35450 V/cm]%/2).
3.3 Variation of EOF Field During Switching
3.3.1 Dynamics of the Debye Layer. As discussed earlier, afully developed EOF velocity in a microchannel has a plug profileand its magnitude is governed by the H–S equation (Ue, Eq. (13)).When the electric potential between the inlet and outlet of themicrochannel was reversed, the flow was first altered within asmall region near the Debye layer. This flow reversal near theDebye layer was due to the instantaneous response of the counterions, concentrated near the Debye layer, to the changed electricfield. The motion of these ions affected the fluid flow in theirimmediate vicinity and this localized flow reversal was in thedirection of the applied electric field but against the flow field inthe core of the channel. The subsequent flow reversal in the coreregion of the microchannel was delayed due to the existing inertiaof the fluid in the core region of the microchannel against theapplied electric field. Eventually, the fluid in the core region wasreversed by the counter-ions in the Debye layer responding to theswitched electric field.
3.3.2 Electric Field and Velocity Variation During Switching.To study the effect of switching on CE, the applied voltage poten-tial was reversed and the duration of this reversal was varied.Reversing the polarity at the inlet and outlet terminals led to theswitching of the flow direction within the channel. It also causedthe mMBs to travel in reverse direction toward the inlet for theduration of the switching or electric field reversal. The potentialwas switched when the uncaptured mMB began to pass the cap-ture zone moving toward the outlet. The distance traveled by themMBs during the electric field reversal was proportional to theduration of switching. As shown in Table 4, the flow was initial-ized with the potential at the inlet set to the applied electric field(275 V/cm) and the outlet kept at ground (0 V) from t¼ 0 s tot¼ 0.51 s. When the electric potentials at the inlet and the outletwere reversed from t¼ 0.51 s to t¼ 0.61 s, a reversal in flow direc-tion was achieved, i.e., the flow was switched. For an applied elec-tric field of 275 V/cm, the corresponding voltage signals at theinput and the output terminals are shown in Fig. 9.
Fig. 7 Trajectory of mMBs under the influence of magnetic field, for an applied electric field of275 V/cm without switching the flow
Fig. 8 CE for flows with and without switching
Journal of Biomechanical Engineering MAY 2015, Vol. 137 / 051008-7
Downloaded From: http://biomechanical.asmedigitalcollection.asme.org/ on 05/04/2015 Terms of Use: http://asme.org/terms

Figure 10 shows an example of the axial velocity profile for anapplied electric field of 275 V/cm (corresponding to an EOF volt-age of 55 V across 2 mm), before the flow was switched (inlet at275 V/cm, outlet at ground: indicated by arrows showingþ 55 V),and after the flow was switched (outlet at 275 V/cm, inlet atground: indicated by arrows showing �55 V).
(i) Forward flow (inlet at 275 V/cm, outlet at ground): Initially(t¼ 0 s–t¼ 0.51 s) the EOF had a plug profile with the axial veloc-ity equal to 2.13� 10�3 m/s in the forward direction (þx).
(ii) Backward flow (inlet at ground, outlet at 275 V/cm): Whenthe electric field was switched at t¼ 0.51 s, the flow in the Debyelayer immediately aligned itself with the direction of the appliedelectric field (–x). However, at this instance, the velocity in thecore of the channel still had a magnitude of �2.13� 10�3 m/s inthe direction (þx) opposite to the reversed electric field (–x).Eventually, the flow in the Debye layer overcame the momentumin the core toward the direction of the electric field (–x); thus,completely overcoming the forward (þx) inertia of the fluidwithin the channel.
(iii) Forward flow (inlet at 275 V/cm, outlet at ground): Whenthe flow was switched back at t¼ 0.61 s in the þx direction, theions in the Debye layer again reversed the flow from –x directionto the direction of applied electric field (þx). About 6� 10�3 safter switching, a steady state velocity field was attained in theþx direction.
3.4 CE With Switching
3.4.1 CE With Switching Compared to WithoutSwitching. For flow without switching, the CE decreased with anincrease in electric field. A similar trend was observed for flowwith switching. However, for the same magnitude of applied elec-tric field, switching the flow led to an increase in the CE (Fig. 8).The initial results of CE with switching indicated that the mMBswhich initially escaped the magnetic field could be captured if theflow field was reversed. At lower electric field (150–200 V/cm)the CE with switching increased to 95% ([100150 V/cmþ 100175 V/cm
þ 85200 V/cm]%/3) compared to 75% for flow without switching. Athigher electric field (400–450 V/cm) CE increased from 35%, forflow without switching, to 47.5% ([50400 V/cmþ 45450 V/cm]%/2) forflow with switching. The enhancement in CE due to switching wassignificant and was further investigated by varying the duration ofelectric field reversal.
3.4.2 Enhancement of CE by Increased Switching Distances.To further enhance the CE with switching, we increased the timeperiod for which the polarity at the inlet and outlet terminals wasreversed. This time period (t0) was based on the time it took for aparticle to travel a given distance (d) in the backward (–x) direc-tion (toward inlet). The time (t0 ¼ d/Ue) was calculated at eachelectric field (150–450 V/cm) for a specified distance (d¼ 200 lm(case A), 300 lm (case B), and 450 lm (case C)) using the corre-sponding values of EOF velocity (Ue). When the period of switch-ing was prolonged, the residence time of the mMB in the capturezone increased. For example, at an electric field of 275 V/cm,increasing the distance traveled by the mMB in the backwarddirection (d) from 200 lm to 450 lm increased the residence time(t0) from 9.4� 10�2 s to 2.1� 10�1 s. This allowed the magneticforce to exert its effect on the mMB in the capture zone for a lon-ger period to overcome the momentum of the mMBs. Due to thisincreased period of switching, the corresponding CE increasedfrom 65% to 80%. During this switching, velocity magnitudemomentarily acquired a nearly zero value. Consequently, the mag-netic force was able to pull the mMB closer to the regions ofstrong magnetic fields under the reduced forward (þx) inertia of
Fig. 9 Voltage signal at the inlet and outlet reservoir to createswitching in the channel for an applied voltage potential of 55 V(corresponding to electric field of 275 V/cm)
Fig. 10 Variation of EOF profile during switching at an appliedvoltage of 55 V (corresponding to electric field of 275 V/cm)
Table 4 Applied electric field conditions for sequential switch-ing of flow
Electric field (V/cm)
Time (s) Inlet Outlet
0.0–0.51 275 00.51–0.61 0 2750.61–1.2 275 0
051008-8 / Vol. 137, MAY 2015 Transactions of the ASME
Downloaded From: http://biomechanical.asmedigitalcollection.asme.org/ on 05/04/2015 Terms of Use: http://asme.org/terms

the fluid. The increased residence time and momentary drop in thevelocity of the mMB resulted in an improvement of CE by theincreased duration of the period of switching.
3.4.3 Relative Increase in CE for Varying Switching Distan-ces. As can be inferred from Fig. 11, a longer period of switchingcaused an increase in the CE for all applied electric fields. Theaverage CE at lower electric field (150–200 V/cm), for all switch-ing distances, was 97.8% (150 V/cm: 100%, 175 V/cm: 100%, and200 V/cm: 93.3%). This average value of CE decreased to 73.3%(225 V/cm: 86.7%, 275 V/cm: 73.3%, and 350 V/cm: 60%) atintermediate electric field (225–350 V/cm) and was 52.5%(400 V/cm: 55% and 450 V/cm: 50%) at higher electric field(400–450 V/cm). As the switching distance was increased, theeffect of relative increase in CE was more profound at higher elec-tric fields. At lower electric field (150–200 V/cm), the averageincrease in CE (with respect to the CE in case A) was 8.1%(150 V/cm: 0%, 175 V/cm: 0% and 200 V/cm: 14.7% increase). Atintermediate electric field (225–350 V/cm) the relative increase inCE was 15.1% (225 V/cm: 12.5% increase, 275 V/cm: 19.2%increase, and 350 V/cm: 13.6% increase), which further increasedto 15.8% (400 V/cm: 15% increase and 450 V/cm: 16.7%increase) at higher electric field (400–450 V/cm). The similar val-ues of slope for the linear correlations (Fig. 11) showed that effectof electric field on CE remained generally similar for differentswitching distances.
4 Discussion
Unique methods have been developed to immobilize function-alized mMBs for microfluidic immunoassays. However, very fewstudies have focused on the improvement of CE of the devices tominimize the loss of samples and reagents [6]. Most pressuredriven microfluidic systems employ external pumps such assyringe pumps. The use of EOF for the mMB immobilizationsystems has not been explored extensively [49]. The presentnumerical model studied the effects of steady and switchedapplied EOF electric field on the CE of mMBs, by simulatingmicron-sized permanent magnets under reduced magnetic fieldstrength. These magnets have potential application when inte-grated in miniaturized devices. The study showed that the flowdirection can be changed using periodic switching of EOF whichcan significantly improve the CE of mMBs in microfluidicsystems. Such switching of the applied electric field also enabledbetter control over flow rate and its direction. Additionally, theplug profile of EOF ensured uniform distribution of mMBs in theflow through the microchannel. The rationale behind switchingwas to increase the residence time of the mMB in the region of
higher magnetic fields. This was achieved by changing the direc-tion of applied electric field, causing the escaped mMBs to returnto the capture zone. The numerical results also showed that flowreversal significantly improved the CE (Fig. 11) as discussed infurther details below.
4.1 Effect of Steady and Switched EOF Electric Field onmMB Capture. To improve throughput of the device, higherflow rates are desired. However, such higher flow rates lead toloss of samples and reagents, such as mMBs that escape the mag-netic field due to higher momentum. In the present study, the CEdecreased with increase in applied electric field in both steadyelectric field and with switching. Figure 8 shows that the CEdecreased linearly with the increase in applied EOF electric field.The trajectory of the mMBs in the microchannel was governed bythe combined effects of flow field velocity, V, and the magneticforce term, (Fm=6prbl), shown in Eq. (10). The mMBs escapedwhen the fluid momentum was greater than the magnetic force inthe momentum equation (V > Fm=6prbl). For the miniaturizedmagnet to capture the mMBs, the term Fm=6prbl needs to begreater than fluid momentum.
The static magnetic field produced by the miniaturized magnetled to a constant magnetic force in the computational domain(Fig. 6). As a result, the mMBs could be captured if, (a) themMBs were in a region of high magnetic field, and (b) if the EOFvelocity of the fluid medium containing the mMBs was lower. Forthe flow without switching, the miniaturized magnet could immo-bilize the mMBs, only when the transverse (þy) magnetic forcewas greater than the force due to steady-state momentum of EOFin the axial direction (þx). The resultant velocity acquired by themMB (vb) was due to the combination of forward (þx) EOF forceand transverse (þy) magnetic force components. The capturedmMBs traveled in a region closer to the magnet and were immobi-lized due to the higher magnetic force. The mMBs whichremained uncaptured did not acquire sufficiently high transversevelocities due to relatively lower magnetic force away from themagnet. These mMBs failed to overcome the axial momentumexerted by the EOF and eventually escaped through the outlet.
In the case of switching, residence time increased due to decel-eration of particles during reversal of the voltage potential. Due tothe static magnetic field, the magnetic force in the channelremained constant, while the momentum due to the fluid velocitydid decrease. The resultant mMB velocity (vb), which was thecombined effect of the magnetic force term Fm=6prbl and flowvelocity (V) decreased due to the reduced flow velocity. Thus, themagnetic force in conjunction with the reversal of flow duringswitching reduced the net velocity of the captured mMBs in com-parison to flow without switching. During the switching period,the magnetic force in the channel was able to overcome thereduced momentum of the flow field, thus, immobilizing addi-tional mMBs which would have otherwise escaped. In addition tomMB captured during the period of switching, some mMBs werealso captured by the miniaturized magnet when the polarity wasreinstated and forward flow was restored from the inlet to the out-let (inlet: applied electric field; outlet: ground). This was due tomMBs being pulled closer toward the magnet in the capture zoneduring the period of switching. As the flow attained its steady stateplug profile, the higher magnetic force near upper wall of themicrochannel was able to overcome the momentum of the flowfield and immobilized additional mMB. Most of the mMBs duringswitching were captured before the flow attained its steady stateplug profile (Ue).
4.2 Advantages of Switching in Improving CE. Previousdesigns demonstrating high CE were sometimes effective butrequired additional manufacturing steps or complex setup ofmagnetic field in the channel. The method of EOF switching canbe implemented by using commercially available off-the-shelfFig. 11 CE under the effect of variable periods of switching
Journal of Biomechanical Engineering MAY 2015, Vol. 137 / 051008-9
Downloaded From: http://biomechanical.asmedigitalcollection.asme.org/ on 05/04/2015 Terms of Use: http://asme.org/terms

systems allowing improved CE of mMBs. Using EOF power sup-plies the polarity of the electrodes placed in the inlet and outletreservoirs can be sequentially changed for altering the flow direc-tion. Replicating the process of switching in pressure drivensystems would require additional pumps, instrumentation and tub-ing which may not be trivial to setup. To compare the proposedmethod with conventional systems, capture of mMBs in a pressuredriven flow was modeled (average velocity equal to Ue for com-parison), as shown in Fig. 12. The CE for pressure-driven flowwas comparable to flow without switching, but was lower thanwhat was obtained with EOF switching.
4.2.1 Assumptions and Limitations. In this research, the com-putational model demonstrates the capture of mMBs tagged withantibodies. The binding kinetics of the target cells (antigens) withthe immobilized microbeads (tagged with antibodies) and anyflow of cell-microbead complex are not modeled in this study.Thus, this study evaluated the event of capture of mMBs taggedwith antibodies in the microchannels, prior to the injection of cellsamples. Also, our current computational model is based oncertain assumptions. The model assumes that the particles aresufficiently small compared to channel width so that the fluidmomentum is not significantly affected due to presence of the par-ticles thereby neglecting the two-way coupling between particlesand fluid. In two-way coupling, the interplay between the mag-netic and particle-induced fluid momentum may enhance the CE[17]. A superparamagnetic microbead when exposed to an exter-nal magnetic field generates an intrinsic magnetic field [50]. Thisphenomenon enhances the magnetic field in the microchannel. Asa result, the particles which may have escaped could be capturedby weaker magnetic fields or their trajectories could be altered.The altered trajectory could primarily lead to mMBs being cap-tured by the external miniaturized magnet and thus enhance theCE of the device. Also, particle–particle interactions were notmodeled in the current numerical method. In this study, themMBs were treated as discrete particles without their intrinsicmagnetic fields. The particle collisions were not modeled. Thisassumption is generally valid for low concentration of particles.The mMBs sticking to the walls were assumed not to ricochetback into the flow field. We anticipate that these assumptionsshould not affect the accuracy of the simulations.
Despite the limitations in the model, we demonstrated thatsequential switching of electric field in EOF under reduced mag-netic field strength has the potential to minimize the loss of mMBsamples and reagents in immunoassays. The optimization of se-quential switching of EOF in conjunction with reduced size of
magnets, or magnetic field strengths, will help fabricate a deviceon a smaller scale and improve the portability as a hand-held mon-itoring unit for field testing. The method can also be extended toimmobilize mMBs for other applications in microfluidics such asmixing. The future scope of this work is to integrate the results ofthe mMBs immobilized with bacteria or pathogens injected intothe channels and study the antigen–antibody kinetics of mMBsand target pathogens. The detection of bacteria from a sample cansubsequently be modeled using antigen–antibody kinetics.
5 Conclusions
In this study, we presented a numerical model which demon-strated a simple technique of sequential switching which can beused in EOF systems for efficient capture of mMBs using minia-turized magnet. The unidirectional flow of mMBs from inlet tooutlet in a steady electric field showed a linear decrease in CEwith increase in applied electric field. The sequential switching ofthis EOF electric field caused the direction of the flow field toreverse periodically, that led to an increase in CE due to thecapture of the mMBs that initially escaped the magnetic field. Thesequential switching of EOF improved the CEs at both high(400–450 V/cm) and low (150–200 V/cm) electric field rangesevaluated by the model. The CE also improved significantly withincrease in switching distances. The increase in CE was due todecreased velocity of flow field and increased residence time ofmMBs in the capture zone. The improvements in CE were moresignificant at higher electric field (400–450 V/cm) where relativeincrease in CE due to prolonged period of switching was 15.8%compared to 4.9% at lower electric field (150–200 V/cm). Themethod of switching efficiently captured the mMBs and overcamethe reduced magnetic field strength (T) in the channel due to thesmaller size of the magnet. The technique of sequential switchingof EOF under reduced magnetic field strength can reduce the lossof samples and reagents during magnetophoretic immunoassays inhigh throughput microfluidic devices. In conclusion, the reducedsize of magnet and mMBs capture with switching can enable thefabrication of efficient and portable devices for field testing.
Acknowledgment
The authors would like to acknowledge Dr. Jagjit S. Yadav foragreeing to explore the concept of this paper in future benchtopexperiments.
Nomenclature
Az ¼ magnetic vector potential, Wb/mB ¼ magnetic field intensity, Wb/m2 or T
CE ¼ capture efficiency, %d ¼ switching distance, mE ¼ electric field, V/m
EOF ¼ electroosmotic flowFd ¼ viscous drag force, Nfe ¼ Coulomb force, N
Fg ¼ gravitational force, NFm ¼ magnetic force, NFt ¼ Brownian force, NH ¼ height of microchannel, lm
Hc ¼ magnetic coercive field, A/mL ¼ length of microchannel, lm
M ¼ magnetization of NdFeB, A/mmb ¼ mass of mMB, kg
NdFeB ¼ neodymium alloyp ¼ pressure, Pa
rb ¼ radius of mMB, mt’ ¼ switching time, s
Ue ¼ EOF velocity magnitude, m/sV ¼ fluid velocity, m/svb ¼ velocity of mMB, m/s
Fig. 12 Comparison of CE in pressure driven flow with flowswith and without switching
051008-10 / Vol. 137, MAY 2015 Transactions of the ASME
Downloaded From: http://biomechanical.asmedigitalcollection.asme.org/ on 05/04/2015 Terms of Use: http://asme.org/terms
Greek Symbols
e ¼ permittivity, C/V�mf ¼ zeta potential, V
kD ¼ Debye layer thickness, lml ¼ dynamic viscosity of fluid, Pa�s
lo ¼ magnetic permeability of vacuum, Wb/A �mlr ¼ relative permeability of NdFeB, unitlessq ¼ fluid density, kg/m3
qb ¼ density of mMB, kg/m3
qe ¼ bulk charge density, C/m3
s ¼ particle relaxation time, su ¼ applied EOF voltage, Vv ¼ susceptibility of mMB, unitless
References[1] Manz, A., Graber, N., and Widmer, H., 1990, “Miniaturized Total Chemical
Analysis Systems: A Novel Concept for Chemical Sensing,” Sens. Actuators,B, 1(1), pp. 244–248.
[2] Haukanes, B. I., and Kvam, C., 1993, “Application of Magnetic Beads in Bio-assays,” Nat. Biotechnol., 11(1), pp. 60–63.
[3] McCloskey, K. E., Chalmers, J. J., and Zborowski, M., 2003, “Magnetic CellSeparation: Characterization of Magnetophoretic Mobility,” Anal. Chem.,75(24), pp. 6868–6874.
[4] Zaytseva, N. V., Goral, V. N., Montagna, R. A., and Baeumner, A. J., 2005,“Development of a Microfluidic Biosensor Module for Pathogen Detection,”Lab Chip, 5(8), pp. 805–811.
[5] Choi, J. W., 2006, “Fabrication of Micromachined Magnetic Particle Separatorsfor Bioseparation in Microfluidic Systems,” Methods in Molecular Biology,S. D. Minteer, ed., Springer, Totowa, NJ, pp. 65–81.
[6] Beyor, N., Seo, T. S., Liu, P., and Mathies, R. A., 2008, “ImmunomagneticBead-Based Cell Concentration Microdevice for Dilute Pathogen Detection,”Biomed. Microdevices, 10(6), pp. 909–917.
[7] Do, J., and Ahn, C. H., 2008, “A Polymer Lab-on-a-Chip for Magnetic Immu-noassay With On-Chip Sampling and Detection Capabilities,” Lab Chip, 8(4),pp. 542–549.
[8] Issadore, D., Shao, H., Chung, J., Newton, A., Pittet, M., Weissleder, R., andLee, H., 2011, “Self-Assembled Magnetic Filter for Highly Efficient Immuno-magnetic Separation,” Lab Chip, 11(1), pp. 147–151.
[9] Comandur, K. A., Bhagat, A. A. S., Dasgupta, S., Papautsky, I., and Banerjee,R. K., 2010, “Transport and Reaction of Nanoliter Samples in a MicrofluidicReactor Using Electro-Osmotic Flow,” J. Micromech. Microeng., 20(3),p. 035017.
[10] Al-Rjoub, M. F., Roy, A. K., Ganguli, S., and Banerjee, R. K., 2015, “ImprovedFlow Rates in Electro-Osmotic Micropumps for Combinations of Substratesand Different Liquids With and Without Nanoparticles,” ASME J. Electron.Packag., 137(2), p. 021991.
[11] Al-Rjoub, M. F., Roy, A. K., Ganguli, S., and Banerjee, R. K., 2012, “EnhancedElectro-Osmotic Flow Pump for Micro-Scale Heat Exchangers,” ASME PaperNo. MNHMT2012-75026.
[12] Furlani, E., 2006, “Analysis of Particle Transport in a Magnetophoretic Micro-system,” J. Appl. Phys., 99(2), p. 024912.
[13] Derec, C., Wilhelm, C., Servais, J., and Bacri, J. C., 2010, “Local Control ofMagnetic Objects in Microfluidic Channels,” Microfluid. Nanofluid., 8(1), pp.123–130.
[14] Sinha, A., Ganguly, R., De, A. K., and Puri, I. K., 2007, “Single Magnetic Parti-cle Dynamics in a Microchannel,” Phys. Fluids, 19(11), p. 117102.
[15] Ganguly, R., Hahn, T., and Hardt, S., 2010, “Magnetophoretic Mixing for InSitu Immunochemical Binding on Magnetic Beads in a Microfluidic Channel,”Microfluid. Nanofluid., 8(6), pp. 739–753.
[16] Modak, N., Datta, A., and Ganguly, R., 2010, “Numerical Analysis of Transportand Binding of a Target Analyte and Functionalized Magnetic Microspheres ina Microfluidic Immunoassay,” J. Phys. D: Appl. Phys., 43(48), p. 485002.
[17] Khashan, S. A., and Furlani, E. P., 2012, “Effects of Particle–Fluid Coupling onParticle Transport and Capture in a Magnetophoretic Microsystem,” Microfluid.Nanofluid., 12(1–4), pp. 565–580.
[18] Gassner, A. L., Abonnenc, M., Chen, H. X., Morandini, J., Josserand, J., Ross-ier, J. S., Busnel, J. M., and Girault, H. H., 2009, “Magnetic Forces Producedby Rectangular Permanent Magnets in Static Microsystems,” Lab Chip, 9(16),pp. 2356–2363.
[19] Munir, A., Wang, J., and Zhou, H., 2009, “Dynamics of Capturing Process ofMultiple Magnetic Nanoparticles in a Flow Through Microfluidic BioseparationSystem,” IET Nanobiotechnol., 3(3), pp. 55–64.
[20] Tondra, M., Granger, M., Fuerst, R., Porter, M., Nordman, C., Taylor, J., andAkou, S., 2001, “Design of Integrated Microfluidic Device for Sorting MagneticBeads in Biological Assays,” IEEE Trans. Magn., 37(4), pp. 2621–2623.
[21] Munir, A., Wang, J., Li, Z., and Zhou, H. S., 2010, “Numerical Analysis of aMagnetic Nanoparticle-Enhanced Microfluidic Surface-Based Bioassay,”Microfluid. Nanofluid., 8(5), pp. 641–652.
[22] Babinec, P., Krafc�ık, A., Babincov�a, M., and Rosenecker, J., 2010, “Dynamicsof Magnetic Particles in Cylindrical Halbach Array: Implications for MagneticCell Separation and Drug Targeting,” Med. Biol. Eng. Comput., 48(8), pp.745–753.
[23] Baier, T., Mohanty, S., Drese, K. S., Rampf, F., Kim, J., and Sch€onfeld, F.,2009, “Modelling Immunomagnetic Cell Capture in CFD,” Microfluid. Nano-fluid., 7(2), pp. 205–216.
[24] Modak, N., Datta, A., and Ganguly, R., 2009, “Cell Separation in a MicrofluidicChannel Using Magnetic Microspheres,” Microfluid. Nanofluid., 6(5), pp.647–660.
[25] Wu, X., Wu, H., and Hu, Y., 2011, “Enhancement of Separation Efficiency onContinuous Magnetophoresis by Utilizing L/T-Shaped Microchannels,” Micro-fluid. Nanofluid., 11(1), pp. 11–24.
[26] Modak, N., Kejriwal, D., Nandy, K., Datta, A., and Ganguly, R., 2010,“Experimental and Numerical Characterization of Magnetophoretic Separationfor MEMS-Based Biosensor Applications,” Biomed. Microdevices, 12(1), pp.23–34.
[27] Bronzeau, S., and Pamme, N., 2008, “Simultaneous Bioassays in a MicrofluidicChannel on Plugs of Different Magnetic Particles,” Anal. Chim. Acta, 609(1),pp. 105–112.
[28] Teste, B., Malloggi, F., Gassner, A. L., Georgelin, T., Siaugue, J. M., Varenne,A., Girault, H., and Descroix, S., 2011, “Magnetic Core Shell NanoparticlesTrapping in a Microdevice Generating High Magnetic Gradient,” Lab Chip,11(5), pp. 833–840.
[29] Wang, Y., Zhe, J., Chung, B. T., and Dutta, P., 2008, “A Rapid Magnetic Parti-cle Driven Micromixer,” Microfluid. Nanofluid., 4(5), pp. 375–389.
[30] Ganguly, R., and Puri, I. K., 2010, “Microfluidic Transport in Magnetic MEMSand bioMEMS,” Wiley Interdiscip. Rev. Nanomed. Nanobiotechnol., 2(4), pp.382–399.
[31] Gijs, M. A., 2004, “Magnetic Bead Handling On-Chip: New Opportunities forAnalytical Applications,” Microfluid. Nanofluid., 1(1), pp. 22–40.
[32] Guo, S., Deng, Y., Zhao, L., Chan, H., and Zhao, X., 2008, “Effect of PatternedMicro-Magnets on Superparamagnetic Beads in Microchannels,” J. Phys. D:Appl. Phys., 41(10), p. 105008.
[33] Pamme, N., 2006, “Magnetism and Microfluidics,” Lab Chip, 6(1), pp.24–38.
[34] Fair, R., 2007, “Digital Microfluidics: Is a True Lab-on-a-Chip Possible?,”Microfluid. Nanofluid., 3(3), pp. 245–281.
[35] Lin, C.-C., Wang, J.-H., Wu, H.-W., and Lee, G.-B., 2010, “MicrofluidicImmunoassays,” J. Lab Autom., 15(3), pp. 253–274.
[36] Gao, Y., Hu, G., Lin, F. Y., Sherman, P. M., and Li, D., 2005, “AnElectrokinetically-Controlled Immunoassay for Simultaneous Detection ofMultiple Microbial Antigens,” Biomed. Microdevices, 7(4), pp. 301–312.
[37] Srinivasan, V., Pamula, V. K., and Fair, R. B., 2004, “An Integrated DigitalMicrofluidic Lab-on-a-Chip for Clinical Diagnostics on Human PhysiologicalFluids,” Lab Chip, 4(4), pp. 310–315.
[38] Bousse, L., Cohen, C., Nikiforov, T., Chow, A., Kopf-Sill, A. R., Dubrow, R.,and Parce, J. W., 2000, “Electrokinetically Controlled Microfluidic AnalysisSystems,” Annu. Rev. Biophys. Biomol. Struct., 29(1), pp. 155–181.
[39] Weigl, B. H., Bardell, R. L., and Cabrera, C. R., 2003, “Lab-on-a-Chip forDrug Development,” Adv. Drug Delivery Rev., 55(3), pp. 349–377.
[40] Croat, J. J., Herbst, J. F., Lee, R. W., and Pinkerton, F. E., 1984, “Pr-Fe andNd-Fe-Based Materials: A New Class of High-Performance Permanent Mag-nets,” J. Appl. Phys., 55(6), pp. 2078–2082.
[41] Krishnamoorthy, S., Feng, J., Henry, A., Locascio, L., Hickman, J., and Sun-daram, S., 2006, “Simulation and Experimental Characterization of Electroos-motic Flow in Surface Modified Channels,” Microfluid. Nanofluid., 2(4), pp.345–355.
[42] ESI-CFD, 2010, CFD-ACEþ Modules Manual V2010, ESI Corporation, Hunts-ville, AL.
[43] Al-Rjoub, M. F., Roy, A. K., Ganguli, S., and Banerjee, R. K., 2011,“Assessment of an Active-Cooling Micro-Channel Heat Sink Device, UsingElectro-Osmotic Flow,” Int. J. Heat Mass Transfer, 54(21), pp. 4560–4569.
[44] Sze, A., Erickson, D., Ren, L., and Li, D., 2003, “Zeta-Potential MeasurementUsing the Smoluchowski Equation and the Slope of the Current–Time Rela-tionship in Electroosmotic Flow,” J. Colloid Interface Sci., 261(2), pp.402–410.
[45] Almutairi, Z. A., Glawdel, T., Ren, C. L., and Johnson, D. A., 2009, “AY-Channel Design for Improving Zeta Potential and Surface ConductivityMeasurements Using the Current Monitoring Method,” Microfluid. Nanofluid.,6(2), pp. 241–251.
[46] Werner, C., K€orber, H., Zimmermann, R., Dukhin, S., and Jacobasch, H. J.,1998, “Extended Electrokinetic Characterization of Flat Solid Surfaces,” J. Col-loid Interface Sci., 208(1), pp. 329–346.
[47] Meeker, D., 2011, Finite Element Method Magnetics (FEMM) Modules Man-ual, V1.2, Waltham, MA.
[48] Sandhu, A., Handa, H., and Abe, M., 2010, “Synthesis and Applications ofMagnetic Nanoparticles for Biorecognition and Point of Care Medical Diag-nostics,” Nanotechnology, 21(44), p. 442001.
[49] Nandy, K., Chaudhuri, S., Ganguly, R., and Puri, I. K., 2008, “Analytical Modelfor the Magnetophoretic Capture of Magnetic Microspheres in MicrofluidicDevices,” J. Magn. Magn. Mater., 320(7), pp. 1398–1405.
[50] Smistrup, K., 2007, “Magnetic Separation in Microfluidic Systems,” Ph.D.thesis, Technical University of Denmark, Kongens Lyngby.
Journal of Biomechanical Engineering MAY 2015, Vol. 137 / 051008-11
Downloaded From: http://biomechanical.asmedigitalcollection.asme.org/ on 05/04/2015 Terms of Use: http://asme.org/terms