Embed Size (px)
Citation preview
National Aeronautics and Space Administration Grant # NNJ04HC76G
Enhanced Characterization of Microorganisms in the Spacecraft Environment
Project Period: October 1,2003 - September 30,2004
Summary of Research Report
Prepared by:
Patricia Cruz, Ph.D. and Linda D. Stetzenbach, Ph.D. (PI) Harry Reid Center for Environmental Studies
University of Nevada, Las Vegas 4505 S. Maryland Parkway Las Vegas, NV 83 i 54-4009
(702) 895- 14 17 FAX 702-895-2688
November 22.2004
https://ntrs.nasa.gov/search.jsp?R=20040172038 2018-09-01T05:19:28+00:00Z

National Aeronautics and Space Administration University of Nevada. Las Vegas
1 .
2 .
3 .
3.1 3.2 3.3 3.4 3.5 3.6 3.6.1 3.6.2 3.6.3 3.6.4 3.6.5 3.6.6 3.7 3.8 3.8.1 3.8.2 3.8.3 3.8.4 3.9
4 . 4.1 4.1.1 4.1.2 4.1.3 4.1.4 4.2 4.3
5 .
6 .
7 .
8 .
CONTENTS
EXECUTIVE SUMMARY ....................................................................................... 1
INTRODUCTION ..................................................................................................... 3
MATERIALS AND METHODS ............................................................................... 3
Experimental design ....................................................................................... 3
Culture analysis .............................................................................................. 5 Environmental background material .............................................................. 5
DNA extraction and purification ....................................................... 5
Test organisms and culture media .................................................................. 3 Preparation of spore suspensions ................................................................... 4
QPCR analysis ............................................................................................... 5
QPCR amplification ........................................................................... 7 Master mix evaluation ........................................................................ 7 Specificity testing ............................................................................... 8 Mixed target detection ....................................................................... 8
Buffer evaluation ........................................................................................... 9 Sample processing ......................................................................................... 10
. .
Quantitation standards and analysis ................................................... 9
Air samples ........................................................................................ 10 Surface samples ................................................................................. 10 Water samples .................................................................................... 11 Bulk samples ...................................................................................... 11
Protocol validation ......................................................................................... 12
RESULTS .................................................................................................................. 12 QPCR analysis ............................................................................................... 12
DNA extraction and purification ....................................................... 12 Master mix evaluation ........................................................................ 13 Specificity testing ............................................................................... 14 Mixed target detection ....................................................................... 14
Buffer evaluation ........................................................................................... 14 Protocol validation ......................................................................................... 15
. .
DISCUSSION ............................................................................................................ 16
CONCLUSIONS ........................................................................................................ 19
LITERATURE CITED .............................................................................................. 20
APPENDIX . ACRONYM INDEX ........................................................................... 39
1
_ _ _ _ ~
National Aeronautics and Space Administration University of Nevada. Las VePas
TABLES
1 .
2 .
3 .
4 .
5 .
6 .
7 .
8 .
9 .
10 .
11 .
12 .
1 .
2 .
3 .
4 .
5 .
6 .
Test organisms for specificity testing of A . fumigatus primers and probe ................. 21
Comparison of DNA purification methods for the removal of PCR inhibitors ......... 22
Comparison of sample concentration and DNA extraction methods ......................... 23
Evaluation of the Power Soil Kit for the removal of PCR inhibitors ........................ 24
Comparison of QPCR master mixes .......................................................................... 25
A . fumigatus specificity testing .................................................................................. 26
Evaluation of combined target seeding ...................................................................... 28
Effect of SDS on Mini MoBio Kit and QPCR ........................................................... 29
Effect of sampling buffers on QPCR ......................................................................... 29
Comparison of sampling buffers for the long-term storage of fungal spores ............ 30
Validation of sampling protocols ............................................................................... 31
Culturable fungi isolated from ISS buik samples ...................................................... 32
FIGURES
A . fumigatus spore suspension before and after purification with the Mini MoBio Kit .................................................................................................................. 33
Effect of sampling buffer on fungal viability and sporulation ................................... 34
Flow diagram illustrating the air sampling protocol .................................................. 35
Flow diagram illustrating the surface sampling protocol .......................................... 36
Flow diagram illustrating the water sampling protocol ............................................. 37
Culturable fungi isolated from ISS particulates found on the HEPA filter screen .... 38
11
National Aeronautics and Space Administration University of Nevada, Las Vegas
1. EXECUTIVE SUMMARY
Spacecraft such as the International Space Station (ISS) and the space shuttles are enclosed environments where crewmembers may spend long periods of time. Currently, crewmembers spend approximately a period of 6 months in the ISS. It is known that these prolonged stays in space may result in weakening of the immune system. Therefore, exposure to opportunistic pathogens or high concentrations of environmental microorganisms may compromise the health of the crew. The detection of biocontaminants in spacecraft environments utilizes culture-based methodology, omitting greater than 90% of all microorganisms including pathogens such as Legionella and Cryptosporidium. Culturable bacteria and fungi have been the only allergens studied; the more potent allergens, such as those from dust mites, have never been tested for in spacecraft environments. In addition, no attempts have been made to monitor microbial toxins in spacecrafts. The present study utilized quantitative polymerase chain reaction (QPCR) as a novel approach for monitoring microorganisms in the spacecraft environment. QPCR is a molecular biology technique that does not rely on the physiological state of the organisms for identification, thereby enabling detection of both culturable and non-culturable organisms. In this project, specific molecular primers and probes were utilized for the detection and quantitation of two fungi of concern in indoor environments, Aspergillus fumigatus and Stachybotrys chartarum. These organisms were selected because of the availability of PCR primers and probes, and to establish the sample processing and analysis methodology that may be employed with additional organisms. Purification methods and QPCR assays were optimized for the detection of these organisms in air, surface, and water; and sample processing and analysis protocols were developed. Preliminary validation of these protocols was conducted in the laboratory with air, surface, and water samples seeded with known concentrations of the target organisms. Additional studies were conducted with bulk materials (HEPA filter pleats and particulate found on the filter screen) obtained from the ISS.
In summary, the observations made during this project were as follows: The UltraCleanTM Soil DNA Kit (Mini MoBio) was evaluated for the removal of PCR inhibitors from samples of the target organisms with environmental background material. 0 A. fumigatus and S. chartarum samples extracted and purified with the Mini
MoBio Kit produced greater DNA amplification than samples extracted/purified with the other protocols tested.
0 The Mini MoBio Kit was adopted as the new protocol for DNA extractiodpurification of samples and PCR quantitation standards.
The UltraCleanTM Mega Prep Soil DNA Kit (Mega MoBio) was utilized to extract fungal DNA from low volume (0.5 ml) samples and compared to the Mini MoBio Kit. The Mega MoBio Kit was less effective than the Mini MoBio Kit for the detection of the target organism; however, the Mega MoBio Kit should be further tested with larger vnliime sample< to exploit the maximum capacity of the method. The PCR was optimized for both target organisms by evaluating the master mix. 0
a
0
0
A. jiimigatus PCR results indicated a decrease in product when the samples were amplified with the Universal master mix; therefore, the current A. fumigutus master mix was not changed (LDL = 1 template per 5 p1 PCR reaction).
1
National Aeronautics and Space Administration University of Nevada, Las Vegas
0 S. chartarum PCR results showed a large increase of amplification product (> 1 log) when the samples were amplified with the Universal master mix. The S. chartarum PCR master mix formulation was changed to the Universal master mix (LDL = 0.3 templates per 5 p1 PCR reaction).
Simultaneous seeding of the target organisms presented difficulties with both culture and PCR analyses. Future experiments should evaluate the use of growth media or antibiotics that inhibit the faster-growing fungi, and the use of multiplex PCR for the detection of DNA from multiple organisms in the same sample. Evaluation of the DNA fixative, TES, revealed that: 0
0
0
0
a
SDS at a concentration of 1% showed no detrimental effect on the Mini MoBio Kit or on the QPCR assay. Environmental background material in the presence of TES had a detrimental effect on the PCR assay and/or the Mini MoBio Kit. Long-term storage of fungal spores in TES buffer showed that spore viability declined rapidly (within the first 7 days). QPCR results were constant until day 21; however, additional work is needed to evaluate sample archival for up to 6 months.
The high concentration of background fi.ingi found on the filter screen of the ISS samples is of concern. A system must be established, if it is not already in place, for the prompt removal and disposal of particulates as they accumulate in these areas. Sample processing and analysis protocols were developed and validated for air (MDS Sampler), surface (SWAB Tube), water bags, and bulk materials obtained from the ISS. These protocols should be further optimized and evaluated with environmental background material present.
0
0
This study provides a protocol for use in the ISS for (i) monitoring the ISS modules immediately prior to launch to develop a baseline of contamination, (ii) monitoring the space shuttle to evaluate sources of new contaniination to the ISS, and (iii) direct sampling of the ISS. The routine use of QPCR analysis will reveal previously undetected microorganisms in real time, resulting in a potentially faster and more comprehensive health assessment of spacecraft during extended missions. It is anticipated that the techniques developed will alter the environmental monitoring of not only spacecraft but also can be applied to ground-based evaluations of office buildings and residences. Future work should expand this optimized protocol to the detection of other organisms of concern, as well as allergens and microbial toxins.
2
National Aeronautics and Space Administration Universitv of Nevada, Las Vegas
2. INTRODUCTION
Spacecraft environments such as the International Space Station (ISS) are semi-closed systems with limited external influence where crewmembers spend long periods of time. Research has shown that microorganisms are ubiquitous in spacecraft such as the ISS and the Mir Space Station (Castro et al., 2004; Ott et ul., 2004; Novikova, 2004). In addition, research suggests that prolonged stays in space may result in weakening of the immune system. Therefore, exposure to opportunistic pathogens or high concentrations of microorganisms may compromise the health of crewmembers. The detection of biocontaminants in spacecraft environments utilizes culture-based methodology, omitting all microorganisms whose nutritional and physical requirements for growth are not met, and likely excludes more than 90% of microorganisms. However, certain fungi are capable of causing health effects whether they are culturable or non-culturable (Levetin, 1995). When molecular techniques have been employed it has been only after the samples are returned to earth (Castro et al., 2004; La Duc et al., 2004). This study utilized a molecular approach for the enhanced detection of microorganisms in the spacecraft environment to better ensure the health, safety, and performance of crewmembers over extended periods of time. Sample processing and analysis methods were established and validated for the detection of two fungal species of concern in indoor environments. These protocols may be of use in future investigations of spacecraft samples such as air, surfaces, water, condensate and bulk materials. This approach will reveal previously undetected microorganisms; therefore, follow-on projects should be designed to detect other organisms, allergens, and microbial toxins in the spacecraft habitable environment.
3. MATERIALS AND METHODS
3.1 Experimental Design
Previously developed fungal polymerase chain reaction (PCR) detection protocols were optimized by expanding specificity testing studies and optimizing the PCR master mix buffer. A previously developed fungal DNA extraction and purification protocol was compared to commercially-available methods. Sample processing and DNA purification protocols were evaluated for the removal of PCR inhibitors. Environmental background material was utilized to evaluate sample concentration and clean-up protocols. The DNA preservative selected by the National Aeronautics and Space Administration (NASA) for sample collection in the International Space Station was evaluated to determine its’ effect on purification protocols and on the amplification reaction. In addition, the long-term effect of this preservative on fungal spores was monitored in archival studies. Processing protocols were developed and validated for air, surface, water and bulk samples.
3.2 Test Organisms and Culture Media
Two fungi served as the test organisms for this study. Aspergillus fumigatus (ATCC 36607) was obtained from the American Type Culture Collection (ATCC, Manassas, VA). A. fumigatus was cultured on malt extract agar (MEA, pH 4.7, Difco Laboratories, Sparks, MD) and incubated for 2-3 days at 45°C. Stachjtbotrys chartarum (HRC-1) was obtained from the Harry Reid Center for Environmental Studies culture collection (University of Nevada, Las Vegas, NV)
3
National Aeronautics and SDace Administration Universitv of Nevada, Las Venas
and submitted to ATCC (assigned accession number: MYA-33 10). Selected experiments were conducted with an additional S. chartarum strain (ATCC 9182). S. chartarum was cultured on potato dextrose agar (PDA, pH 5.6, Difco) and incubated at 25°C for 5-6 days. MEA and PDA amended with chloramphenicol (1 00 pg/ml; MEAC and PDAC, respectively) were utilized for the culture analysis of bulk material samples, and incubated as indicated above.
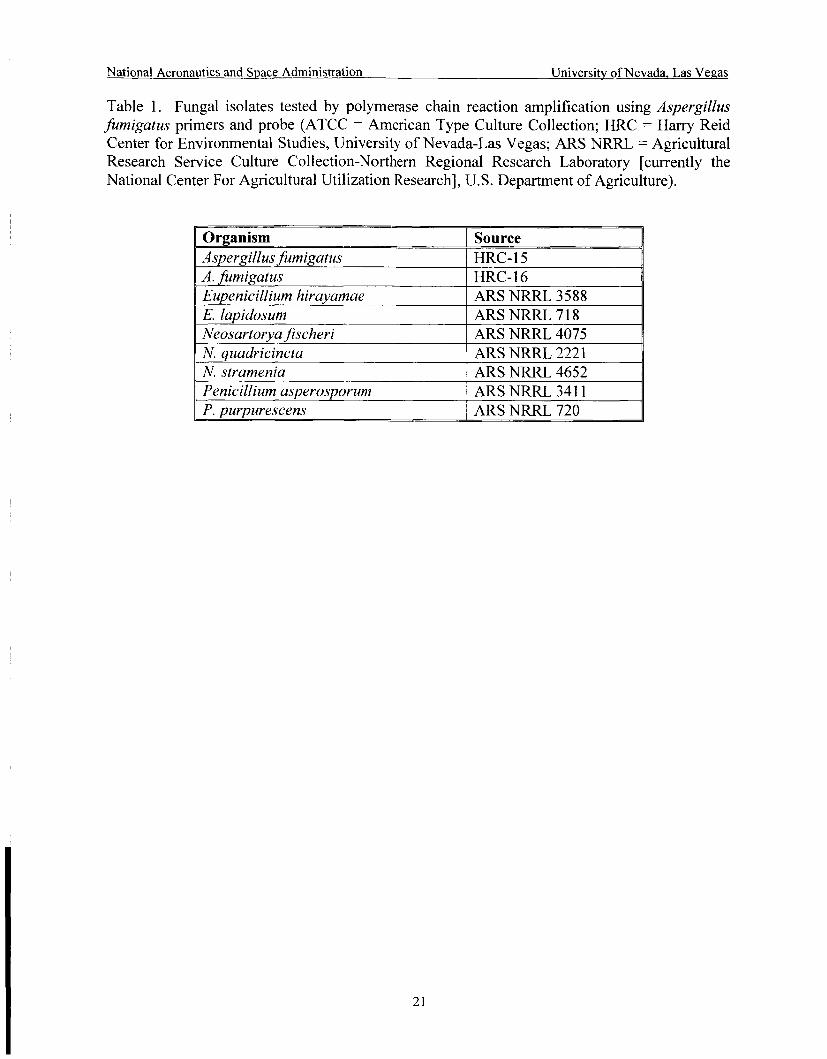
Nine fungal isolates of interest, representing four genera, were obtained from ATCC, the Agricultural Research Service Culture Collection (Northern Regional Research Laboratory [currently the National Center For Agricultural Utilization Research], US Department of Agriculture) or from laboratory stocks, and cultured in the laboratory (Table 1). These isolates were cultured on MEA, PDA, and Czapek yeast extract agar (CYA; Klich, 2002), and incubated at 25°C for 4 days.
Background Aspergillus isolates obtained from bulk material samples were speciated by culturing on CYA, MEAC, Czapek Dox agar (CZ; Klich, 2002), and Czapek yeast agar with 20% sucrose (CY2OS; Klich, 2002). Incubation consisted of 7 days at 25°C for the MEAC, CZ, and CY2OS plates. Duplicate CYA plates were incubated at 25°C and 37°C. Speciation was performed by macroscopic and microscopic morphology (Klich, 2002).
Background Penicillium isolates obtained from bulk material samples were speciated by culturing on CYA, MEAC, 25% glycerol nitrate agar (G25N; Pitt, 2000), and neutral creatine sucrose agar (CSN; Pitt, 2000). Incubation consisted of 7 days at 25°C for the MEAC, G25N, and CSN plates. Triplicate CYA plates were incubated at 5"C, 25"C, and 37°C. Speciation was performed by macroscopic and microscopic morphology (Pitt, 2000).
3.3 Preparation of Spore Suspensions
Spore suspensions of known concentration were prepared by harvesting spores from pure cultures of A. fumigatus (ATCC 36607). Dry spore harvests were performed by inoculating four MEA Petri dishes with A. fumigatus and incubating as described above. The Petri dishes were inverted onto a sterile glass funnel and gently tapped to dislodge the spores into a sterile glass bottle. The spore harvest was stored dry at 4°C until ready for use (Cruz-Perez et al., 2001 a).
Spore suspensions of known concentration were prepared by harvesting spores from pure cultures of S. chartarum (HRC-1). Liquid spore harvests were performed by inoculating 28 PDA Petri dishes with S. chartarum, incubating at 25°C for 17 days, and by following the method of Crow et al. (1994), with modifications. Briefly, this method consisted of flooding the agar plates containing confluent growth of S. chartarum with 3 ml of 0.01 M potassium phosphate buffer with 0.05% Tween 20 (PBT, pH 7.0) and gently agitating the surface of the colony with a sterile L-shaped glass rod. The spore suspensions were collected in two sterile 50 ml centrifuge tubes and centrifuged at 11,500 x g for 5 min at room temperature. The supernatant was removed without disturbing the spore pellets and the spores were washed and centrifuged three times with 10 ml PBT. The final spore pellets were combined and resuspended in 1 ml PBT. Spore and/or hyphal fragments were removed from the S. chartarum spore suspension by sucrose density centrifugation. Briefly, 0.35 M sucrose was added to the spore suspension and centrifuged at 1000 x g for 10 min at room temperature. After incubating at 4°C overnight, the supernatant was removed without disturbing the pellet. A second sucrose density centrifugation was performed with 0.70 M sucrose. The spore pellet was resuspended in 2 ml PBT and stored at -70°C until ready for use (Cruz-Perez et al., 200 1 b).
4
National Aeronautics and Space Administration University of Nevada, Las Vegas
Total concentrations of A. fumigatus and S. chartarum spore suspensions were determined using a Coulter Multisizer I1 electronic particle counter (Beckman Coulter, Inc., Miami, FL). For A. fumigatus, several loopfuls of the dry spores were resuspended in 3 ml of PBT and vortexed at maximum speed for 1 min. For S. chartarum, a 1 :50 dilution of the spore suspension was prepared and vortexed. An aliquot of each spore suspension was diluted in filtered Isoton I1 solution (Beckman Coulter, Inc.) and enumerated using the Coulter Multisizer 11. The data were automatically adjusted by the instrument for coincidence correction and the particles corresponding to the spore size distribution (1.9 to 3.5 pm for A. fumigatus and 3.3 to 9.0 pm for S. chartarum) were counted. The data from ten 50 p1 aliquots of each sample were averaged and the concentration of total spores per ml in the spore suspensions were determined. These spore suspensions of known concentration were used to prepare working spore suspensions for experiments. All spore suspensions were stored at -70°C until ready for use and freeze-thawed a maximum of three times.
3.4 Culture Analysis
Culture analysis was performed on liquid samples containing A. fumigutus or S. chartarum by inoculation onto the appropriate medium, as indicated above. Samples were serially diluted in PBT, prior to inoculation. For bulk materials (see 3.8.4), the weight of the material was determined prior to seeding with the test organisms. Sample processing produced a liquid sample that was assayed as indicated above. The samples were incubated and the number of colony forming units (CFU) was determined and converted to CFU/sample or CFU/g.
3.5 Environmental Background Material
To illustrate the effects of the presence of environmental background material on the PCR, experiments were performed with both test organisms to determine the amount of background material necessary to cause partial inhibition of the PCR assay. Environmental background material was previously obtained from outdoor air filters of commercial buildings from several locations in the United States (Buttner et al., 2004). Culture analysis of the environmental background material indicated fungal concentrations of 1.1 x 1 O4 CFU/g. No A. fumigatus or S. chartarum CFU were cultured from the environmental background material.
3.6 QPCR Analysis
3.6.1 DNA Extraction and Purification
Commercially-available purification protocols for the removal of PCR inhibitors were compared to previously developed DNA extraction and concentration protocols (Cruz-Perez et al., 200 1 a and 200 1 b). Briefly, the A. fumigutus and S. chartarum extraction protocol used as a
(0.5% final concentration) and proteinase K (20 pg/ml final concentration), followed by incubation at 50°C for 10 min and boiling for 15 min. The samples were chilled on ice and bovine serum albumin was added to a final concentration of 0.05%. The samples were incubated for 5 min at 37°C in a rotary shaker followed by concentration with Pellet Paint Co-precipitant (Novagen, Madison, WI) as per the manufacturer’s specifications. The S. chartarum DNA was
sta?,&:,r:! f i r c=r;..pzr:rissr, c=?,s&ed Cf trezt,ticg the spr. sllspeflsinfls yihh sdiflm- dQdPVJTl Plllf2tP J --------
5
National Aeronautics and Space Administration University of Nevada, Las Veaas
further purified with the DNeasy Plant Kit (QiaPlant) (QIAGEN, Inc., Valencia, CA) as per the manufacturer’s specifications.
The amount of dust necessary to produce partial inhibition of the PCR assay was determined with the protocols described above. Two dust suspension concentrations (2 mg/ml and 20 mg/ml) were prepared in PBT to use for spiking into spore suspensions of known concentration (A. fumigatus = 7.93 x lo5 spores/ml; S. chartarum = 1.67 x lo6 sporedml). Un- spiked (i.e., no environmental background) samples were used as controls. A. fumigatus samples were extracted/purified using the boil/Pellet Paint protocol and S. chartarum samples were extracted/purified using the boil/Pellet PaintlQiaPlant protocol as described above. All DNA samples were analyzed by QPCR. In order to mimic the environmental background material present in field samples, the dust concentration shown to produce partial inhibition of the PCR assay was selected for additional experiments.
Commercially-available purification methods evaluated were the UltraCleanTM Soil DNA Kit (Mini MoBio) (MoBio Laboratories, Solana Beach, CA), the UltraCleanTM Mega Prep Soil DNA Kit (Mega MoBio) (MoBio Laboratories), and the Power SoilTM DNA Isolation Kit (MoBio Laboratories). These methods were evaluated in a series of experiments:
1 ) Mini MoBio Kit vs. Boil/Pellet Paint and BoiVPellet Paint/QiaPlant The Mini MoBio Kit was evaluated for the removal of PCR inhibitors from A. fumigatus
and S. chartarum as per the Alternative Protocol supplied by the manufacturer and compared to the boil/Pellet PaidQiaPlant protocol reviously developed. Spore suspensions of known concentration (A. fumigatus = 7.93 x 10 spores/ml and S. chartarum = 1.67 x lo6 sporedml) were spiked with environmental background material (20 mg/ml, final concentration). Un- spiked (i.e., no dust) samples were used as controls. The UNLV extraction/purification protocol for A. fumigatus (boil/Pellet Paint) was compared to the boil/Pellet Paint/QiaPlant and the Mini MoBio protocols. The UNLV extractiodpurification protocol for S. chartarum (boil/Pellet Paint/ QiaPlant) was compared to the Mini MoBio Kit. All DNA samples were analyzed by QPCR.
P
2) Concentration by filtration/Mini MoBio Kit vs. Mega MoBio Kit To maximize the sample volume that can be extracted, especially for water samples, two
extraction/purification methods were tested: i) a sample concentration method combined with the Mini MoBio Kit, and ii) the Mega MoBio Kit tested as per the manufacturer’s specifications with the inclusion of the optional concentration step supplied. The Mini MoBio Kit is designed to extract up to 1 gram of soil or 100 pl liquid samples. The Mega MoBio Kit is designed to extract up to 10 grams of soil. S. chartarum spore suspensions (1.67 x lo6 spores/ml) were extracted/purified by these two methods. Duplicate 0.5 ml samples were filter-concentrated through a 0.65 pm mixed cellulose ester membrane (HA; Millipore C o p , St. Louis, MO) followed by placement of the membrane in the bead tube of the Mini MoBio Kit. The Mega MoBio Kit was used to extract the DNA of duplicate spore suspensions (0.5 ml) without a pre-
pre-filtration step. All DNA samples were analyzed by QPCR. f!tr2t:tizn step. As 8 centre!, 2 0.1 m! samp!e ‘.xi’s extrrctPd with the M h i MQBiQ Kit withnllt a
3) Mini MoBio Kit vs. Power Soil Kit The Powersoil Kit, a method that distinguishes itself from the Ultraclean Kit with a new
humic substance/brown color removal procedure, was tested following manufacturer’s
6
National Aeronautics and Space Administration University of Nevada, Las Vegas
specifications with and without the inclusion of the optional concentration step supplied, and compared to the Mini MoBio Kit. S. chartarum spore suspensions of known concentration (5.53 x lo5 sporedml) were prepared in NASA's DNA fixative for the SWAB project, TES (1OmM Trizma Base [TRIS Free Base, Fisher Scientific, Tustin, CAI, 1mM EDTA [EDTA Disodium Salt, Fisher Scientific, Tustin, CAI with 1 % sodium dodecylsulfate [Lauryl Sulfate Sodium Salt, Sigma Chemical Co., St. Louis, MO]) or PBT, and spiked with environmental background material (20 mg/ml, final concentration). Un-spiked samples were used as controls. Samples prepared in TES were purified by one of three methods: Mini MoBio, Power Soil, and Power SoiUethanol precipitation. Samples prepared in PBT were purified by one of two methods: Mini MoBio and Power Soil. All DNA samples were analyzed by QPCR.
PCR quantitation standards were prepared from A. fumigatus and S. chartarum spore suspensions enumerated electronically as indicated above using the same DNA extraction and purification methods that were selected for sample analysis.
3.6.2 OPCR Amplification
The AB1 Prism 7700 Sequence Detection System (Applied Biosystems, Foster City, CA) was used for PCR analysis. A segment of the 18s rRNA gene was amplified by using primer and probe sequences previously designed and validated that targeted the Internal Transcribed Spacer regions of A. fumigatus and S. chartarum (ITS1 and ITS2, respectively) (Cruz-Perez et al., 2001a and 200 1 b). Sequences for the A. jumigutus primers and probe (patent-pending) were: CgCgTCCggTCCTCg (AfumF400, forward primer), TTAgAAAAATAAAgTTgggTgTCgg (AfumR536, reverse primer), and 6-FAM-5' TGTCACCTGCTCTGTAGGCCCG 3'-TAMRA (fluorescent probe). US 6,733,999 B2) were: gTTgCTTCggCgggAAC (STAF 1, forward primer), TTTgCgTTTgCCACTCAgAg (STAR], reverse primer), and 6-FAM-5'CTG CGC CCG GAT CCA GGC3'-TAMRA (STAP, fluorescent probe). Primers were obtained from Qiagen-Operon Technologies (Alameda, CA) and probes were obtained from A plied Biosystems.
Initial amplification conditions using the TaqMan' Core Reagents Kit (Applied Biosystems) were as follows: fungal DNA template (5 pl); 1 X TaqMan' buffer A; 5 mM MgC12; 0.1 mM dATP; 0.1 mM dCTP; 0.1 mM dGTP; 0.2 mM dUTP; 2.5 U Ampli Taq Gold; 0.5 U AmpErase Uracyl N-Glycosylase; 0.2 pM each A. fumigatus primer or 0.9 pM each S. chartarum primer; 0.2 pM A. fumigatus or S. chartarum probe, for a total reaction volume of 50 pl. TaqManO cycling conditions were as follows: 2 min at 50°C; 10 min at 95°C; 40 cycles of 15 sec at 95°C followed by 1 min at 60°C.
Sequences for the S. chartarum primers and probe (Patent No.:
3.6.3 Master Mix Evaluation
The TaqMan@ Universal PCR Master Mix (Applied Biosystems) was evaluated and compared to the master mix prepared with the TaqMan@ Core Reagents Kit (Applied
a pre-mix containing AmpliTaq Gold' DNA Polymerase, AmpEraseO UNG, dNTPs with dUTP, Passive Reference 1, and optimized buffer components. A. fumigatus and S. chartarum QPCR standards of known concentration (A. fumigatus = 3.97 x 10' to 3.97 x lo6 spores per 5 pl QPCR reaction; S. chartarum = 2.10 x 10' to 2.10 x 1 O5 per 5 p1 QPCR reaction) were extracted as per the UNLV protocols and the DNA was analyzed by amplifying it with the two master mixes.
Bicsystemc). The TJTi.;e:sa! ?"{aster ?"{ix X~T;;~ use:! 25 per the m;~df;ctu;er's specif;,ccticzs &id is
7
National Aeronautics and SDace Administration University of Nevada, Las Vegas
The master mixes were evaluated based on the difference in Ct values observed for each QPCR standard amplified with both master mixes (Ct refers to the PCR cycle at which fluorescence is first detected).
3.6.4 Specificity Testing
The A. fumigatus primer specificity testing previously conducted (Cruz-Perez et al., 2001a) was expanded with additional species closely related to the target organism. Pure cultures (Table 1) were sampled by gently rolling a cotton swab across the surface of the fungal colony and placing the swab in 3 ml PBT. After vortexing at maximum speed for 1 min, the swab was removed. For most cultures, aliquots of 500 p1 of the spore suspension were placed in 2 ml microcentrifuge tubes for subsequent DNA extraction. However, for three isolates (Eupenicillium hirayamae, E. lapidosum, and Neosartorya stramenia) the swabbing method did not yield sufficient spores. Therefore, the collected spores were resuspended in PBT as indicated above and the liquid suspensions were concentrated by filtration through a 0.8 pm-pore-diameter mixed cellulose ester filter membrane (HA; Millipore Corp.). The filter was resuspended in 0.5 ml PBT, vortexed briefly, and the DNA of these samples and the 500 pl aliquots was extracted by the boil/Pellet Paint/QiaPlant protocol detailed above. The purified DNA was subjected to PCR amplification using the A . fumigatus primers and probe.
An ethidium bromide dot quantitation method (Ausubel et al., 1995) was utilized for the determination of the presence of DNA on selected samples prepared for specificity testing. DNA controls were prepared by serial dilutions of a 100 bp DNA ladder (Promega, Madison, WI) in Tris-EDTA buffer (TE, pH 8.0) to obtain concentrations of 1.3, 13.0 and 130.0 pg/ml. Five pl of control or sample DNA was combined with an equal volume of ethidium bromide (1 pg/ml, final concentration) and mixed by vortexing. A negative control was prepared by substituting TE buffer for DNA. Mixed samples were applied in the form of a dot onto a piece of plastic wrap stretched over the surface of an UV transilluminator. A permanent record of the dots was obtained by photographing with a Polaroid MP 4+ Instant Camera System (Fotodyne Inc., Hartland, WI).
3.6.5 Mixed Target Detection
In order to conserve the products supplied by NASA for validation studies (Le., SWAB Tubes, water bags) and to expedite these studies, simultaneous seeding of the target organisms was explored. A pilot study was conducted in which equal volumes of A. furnigatus and S. chartarum spore suspensions prepared in lOmM Trizma Base/lmM EDTA with 1% sodium dodecylsulfate (TES) (7.93 x lo5 spores/ml and 5.53 x lo5 spores/ml, respectively) were combined, extracted and analyzed by PCR. Aliquots containing S. chartarum alone, A. fumigatus alone, and a combination of S. chartarum and A . fumigatus were prepared for DNA extraction. The DNA extracted from the 5'. chartarum aliquot, and the combination of S. chartarum and A. .fumigatus were analyzed in a rLf( cvniaiiiiag s. chi-iai.iiiii-sp""ifiz primers and probe. The DNA extracted from the A. fumigatus aliquot, and the combination of S. chartarum and A . fumigatus were analyzed in a PCR containing A . fumigatus-specific primers and probe.
nnT\
8
National Aeronautics and Space Administration University of Nevada, Las Vegas
3.6.6 Quantitation Standards and Analysis
Quantitation was achieved by amplification of standards containing fungal DNA extracted from spore suspensions of known concentration (1 0’ to 1 0’ templates per reaction). Total concentrations of A. fumigatus and S. chartarum spore suspensions were determined using a Coulter Multisizer I1 electronic particle counter (Beckman Coulter, Inc.) as indicated above. Once a DNA extractiordpurification method was chosen, standards were prepared using the same extraction and purification methods used to process samples to more accurately quantify fungal DNA in test samples. Extraction of known concentration standards in the same manner as samples provides absolute quantitation of target templates. Standards were amplified in duplicate at the same time and under the same conditions as the replicate unknown samples. Once amplification was completed, the data were analyzed using the software provided with the AB1 Prism 7700 Sequence Detection System (Applied Biosystems). Using the concentrations assigned to each standard, the software constructed a standard curve of Ct value versus concentration. Ct refers to the PCR cycle at which fluorescence (i.e., amplification product) is first detected; and is inversely proportional to the initial DNA template concentration. Concentration values for the unknown samples were extrapolated from the standard curve by the software and reported as the mean of two replicates.
3.7 Buffer Evaluation
The buffer selected for the SWAB project was evaluated to: i ) determine the effect of the detergent on the Mini MoBio purification kit, ii) determine the effect of the buffer on the PCR assay, and iii) measure its effect on long-term storage of fungal spores. These questions were answered in a series of experiments:
1) SDS Effect The DNA fixative, 1OmM Trizma Base/lmM EDTA with 1% sodium dodecylsulfate
(TES), was evaluated to determine the effect of the presence of sodium dodecylsulfate (SDS) on QPCR for samples extracted with the Mini MoBio Kit. S. chartarum spore suspensions (1.67 x lo6 spores/ml) were spiked with 0,0.5 or 1.0% of SDS and the DNA was extractedpurified with the Mini MoBio Kit. DNA samples were analyzed by QPCR.
2) Environmental Background and PCR Effect The effect of the DNA fixative on the PCR assay was evaluated. S. chartarum spore
suspensions of known concentration (5.53 x 10’ sporedml) were prepared in one of two buffers, lOmM Trizma Base/lmM EDTA with 1% sodium dodecylsulfate (pH 8.0; TES) or PBT. Half of the spore suspensions prepared in each buffer were spiked with environmental background material (20 mg/ml, final concentration). Un-spiked samples were used as controls. All samples were extracted with the Mini MoBio Kit and analyzed by PCR.
3 ) Archival Study The effect of the DNA fixative on long-term storage of fungal spores was evaluated by
culture and PCR analyses. S. chartarum spore suspensions of known concentration (5.53 x lo5 sporedml) were prepared in TES or in PBT and archived at room temperature. Aliquots were analyzed by culture and QPCR at To days, T3 days and at 1 week intervals. Culture analysis
9
National Aeronautics and Space Administration Universitv of Nevada, L a Vegas
consisted of serially-diluting in the corresponding buffer for the archived sample, plating on PDA, and incubating as indicated above. The culture assay was conducted until day 40 of archival. A photographic record of the plates was obtained for the To days, T3 days and 1 week samples. DNA extraction was performed with the Mini MoBio Kit and analyzed by PCR. The PCR assay was conducted until day 2 1 of archival.
3.8 Sample Processing
Air, surface, and water sampling products designed for the SWAB project were obtained from NASA and tested in order to establish sample processing protocols amenable with QPCR analysis.
3.8.1 Air Samples
Initial studies for the development of the air sample processing method consisted of testing various buffer volumes and incubation temperatures in order to dissolve the gelatin membrane used for air sampling. Testing was also conducted to maximize the sample volume analyzed by filter-concentration. An MD8 Airscan Air Sampler (Sartorius Corp., Edgewood, NY) was loaded with gelatin disposable membranes (Sartorius Corp.) and air samples were collected inside a biological safety cabinet for 15 min at a flow rate of 33.33 lpm. The gelatin membranes were transferred to a Whirl Pak bag (Fisher Scientific, Tustin, CA) and six different dissolving methods were tested.
The final protocol consisted of warming a Whirl Pak bag filled with 20 ml PBT in a water bath at 50°C x 15 min. An air sample (Le., gelatin membrane) was obtained and placed in the pre-filled Whirl Pak bag, making certain that the membrane was completely immersed in the PBT. The sample was incubated at 50°C x 1 min and mixed by hand stomaching for 20 sec. An aliquot of the sample was reserved for culture analysis, and 18 ml were concentrated by filtration through a 0.45 pm mixed cellulose ester (HA) filter membrane for subsequent DNA extraction. The HA membrane was transferred to a 2 ml microcentrifuge tube and resuspended in 0.5 ml PBT. After vortexing at maximum speed for 1 min, sonication in a Branson 1200 Ultrasonic Cleaner (Branson Ultrasonics C o p , Danbury, CT) for 10 min, and vortexing a second time for 1 min, the HA membrane was aseptically removed from the tube and discarded. An aliquot of the sample was extracted with the Mini MoBio Kit and the DNA was amplified by PCR.
3.8.2 Surface Samples
The final sample processing protocol for the SWAB Tube consisted of removing the SWAB Tube body and, with the swab in the collection microtube, cutting-off the swab handle. The SWAB Tube (i.e., handle and body) was discarded and the collection tube was capped with
1200 Ultrasonic Cleaner for 10 min, the swab was aseptically removed from the tube and discarded. Culture analysis was not performed due to the biocide effect of the sampling buffer, TES, in the SWAB Tube. An aliquot of the sample was extracted with the Mini MoBio Kit and the DNA was amplified by PCR.
a siei-ile sciew- cap. Af;ei- iifii<cjiiiig ~t i i ~ ~ i ~ r i i ~ s i ; d f ~ r 1 mi:: ~ q c ! S G S ~ C Z ~ ~ S E i~ 8 EEESCE
10
National Aeronautics and Space Administration University of Nevada, Las Verras
3.8.3 Water Samples
Initial studies for the development of the water sample processing protocol consisted of testing various filtration methods to maximize the sample volume analyzed, as described in the DNA Extraction and Purification (Concentration by filtratiodMini MoBio Kit vs. Mega MoBio Kit) section.
The final processing protocol for the water samples consisted of obtaining a water bag with 800 ml TES and mixing by inversion of the bag. Culture analysis was not performed due to the biocide effect of the DNA fixative, TES. One hundred ml were concentrated by filtration through a 0.45 pm HA membrane for subsequent DNA extraction. The HA membrane was transferred to a 2 ml microcentrifuge tube and resuspended in 0.5 ml PBT. After vortexing at maximum speed for 1 min and sonication in a Branson 1200 Ultrasonic Cleaner for 10 min, the HA membrane was aseptically removed from the tube and discarded. An aliquot of the sample was extracted with the Mini MoBio Kit and the DNA was amplified by PCR.
3.8.4 Bulk Samples
Two types of bulk material were obtained from the International Space Station: HEPA filter pleats and particulates found on the filter screen (lint). Protocol development focused on the addition of a small volume of buffer and analysis of the maximum amount of sample.
The final processing protocol for the HEPA filter pleats consisted of aseptically obtaining a portion of the filter, transferring to a Whirl Pak bag with a mesh liner (Whirl-Pak filter bag, Fisher Scientific) and determining the weight of the filter pleats. Samples were stomached in 20 ml of PBT at normal speed for 1 min using a Stomacher (Lab-Blender Model 80, Tekmar Co., Cincinnati, OH). An aliquot of the sample was reserved for culture analysis, and 11 ml were concentrated by filtration through a 0.45 pm HA membrane for subsequent DNA extraction. The HA membrane was transferred to a 2 ml microcentrifuge tube and resuspended in 0.5 ml PBT. After vortexing at maximum speed for 1 min and sonication for 10 min, the HA membrane was aseptically removed from the tube and discarded. An aliquot of the sample was extracted with the Mini MoBio Kit and the DNA was amplified by PCR.
The final processing protocol for the particulates found on the filter screen (lint) consisted of aseptically obtaining a portion of the sample, transferring to a Whirl Pak bag with a mesh liner and determining the weight of the lint. Samples were stomached in 5 ml of PBT at normal speed for 1 min. An aliquot of the sample was reserved for culture analysis, and approximately 3 ml were concentrated by filtration through a 0.45 pm HA membrane for subsequent DNA extraction. The HA membrane was transferred to a 2 ml microcentrifuge tube and resuspended in 0.5 ml PBT. Difficulties were encountered with one sample during filtration due to clogging of the HA membrane. Therefore, for this sample the filtration was suspended after approximately 1 ml of sample filtered and the HA membrane was resuspended in the remaining sample. For both samples, after vortexing at maximum speed for 1 rnin and
An aliquot of the sample was extracted with the Mini MoBio Kit and the DNA was amplified by PCR.
“ ” l l ~ ” U C l W l . cnn;rot;nn f n v LW. 1n I ” m;n 111111, tho C l l U A 1 1 U A L rnpmhranp ...-..I *v--.*-- w a c . .II I-- .ceptica!ly p m - ~ v r d from- the ti.ihe and discarded.
1 1
National Aeronautics and Space Administration University of Nevada, Las Vegas
3.9 Protocol Validation
The air, surface, water, and bulk sample processing protocols developed were validated in the laboratory. MD8 gelatin membranes were seeded with a combination of A. fumigatus and S. chartarum. Two samples were seeded with 1.1 1 x lo5 S. chartarum spores and 1.59 x 1 O5 A. fumigatus spores. Another two samples were inoculated with 1.1 1 x lo3 S. chartarum and 1.59 x lo3 A. fumigatus spores. SWAB tubes, water bags and International Space Station samples (HEPA filter pleats and lint were seeded in duplicate, but only with S. chartarum spore suspensions (1.1 1 x 1 O5 spores). All samples were processed as per the developed protocols, as described above. Negative controls (unseeded samples) were included for each sample type (i.e., air, surface and water). Unseeded ISS bulk materials were also processed in order to determine the background fungi present in these samples. For culture analysis, samples were plated in duplicate on PDAC and incubated at 25°C for 7 days. MEAC was also used for the enumeration of A. fumigatus from air samples. Because surface and water samples were processed in TES, culture analysis was not performed on these samples. All samples were extracted with the Mini MoBio Kit and the DNA was amplified by QPCR.
4. RESULTS
4.1 QPCR Analysis
4.1.1 DNA Extraction and Purification
The amount of dust necessary to produce partial inhibition of the PCR assay was determined with previously developed DNA extraction and concentration protocols. Two dust suspension concentrations were used for spiking spore suspensions of known concentration of the test organisms. A . fumigatus PCR results showed that samples containing dust at a concentration of 2 mg/ml did not inhibit the amplification reaction (data not shown). Dust concentrations of 20 mg/ml caused partial inhibition of the reaction, affectin the detection of A. fumigatus by decreasing the quantitation from 1 O6 templatedm1 to 10 templatedml. 5’. chartarum PCR results did not show a difference between samples without dust and those containing dust at a concentration of 20 mg/ml (data not shown).
Commercially-available purification protocols for the removal of PCR inhibitors were compared to previously developed DNA extraction and concentration protocols. These methods were evaluated in a series of experiments:
F
1) Mini MoBio Kit vs. Boil/Pellet Paint and Boil/Pellet Paint/OiaPlant The UltraCleanTM Soil DNA Kit (Mini MoBio) (MoBio Laboratories) was evaluated for
the removal of PCR inhibitors from samples of the target organisms spiked with environmental background material. QPCR results for A . fumigatus experiments without environmental b;ckgrsucd rnzteris! shcwec! that there ~ a c a 2-!c?g lnss in DNA associated with the addition of the QiaPlant purification step (Table 2). A. fumigatus samples (with and without environmental background material present) extracted and purified with the Mini MoBio Kit produced greater QPCR quantitation results than samples extracted/purified with the other two protocols tested. The Mini MoBio Kit removed the pigments associated with the dust, producing a clear DNA sample (Figure 1). S. chartarum QPCR results of samples without environmental background
12
National Aeronautics and Space Administration University of Nevada, Las Vegas
material indicated a 2.5-log improvement in the quantitation of the target organism when extracted/purified with the Mini MoBio Kit; a 3.5-log improvement in quantitation was observed in samples with environmental background (Table 2). The QPCR quantitation (templatedml) obtained for the target organisms was greater than the spores/ml applied because DNA extraction protocols for samples and QPCR standards were different. The PCR quantitation standards utilized were extracted as per the UNLV protocols for A. fumigatus and S. chartarum, boil/Pellet Paint and boil/Pellet Paint/QiaPlant, respectively.
2) Concentration by filtratiodMini MoBio Kit vs. Mega MoBio Kit To maximize the sample volume that can be extracted, two extractiordpurification
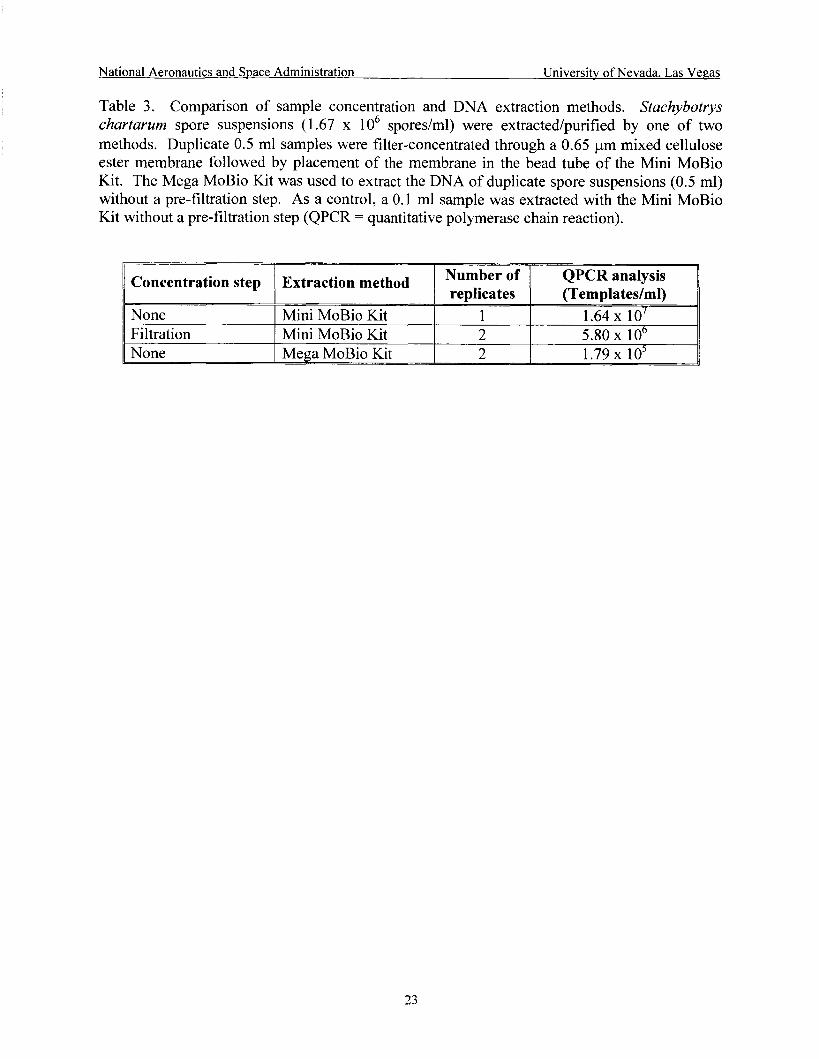
methods were tested with S. chartarum as the test organism: i ) a sample concentration method combined with the Mini MoBio Kit, and ii) the UltraCleanTM Mega Prep Soil DNA Kit (Mega MoBio Kit) (MoBio Laboratories). QPCR results showed that there were losses in DNA associated with the incorporation of the filtration step into the Mini MoBio protocol (Table 3). The Mega MoBio Kit was less effective than the Mini MoBio Kit for the detection of the target organism. The QPCR quantitation (templatedml) obtained for the target organism was greater than the spores/ml applied because DNA extraction protocols for samples and QPCR standards were different. The PCR quantitation standards utilized were extracted as per the UNLV protocol, boil/Pellet Paint/QiaPlant.
3) Mini MoBio Kit vs. Power Soil Kit The Power SoilTM DNA Isolation Kit (MoBio Laboratories) was evaluated with S.
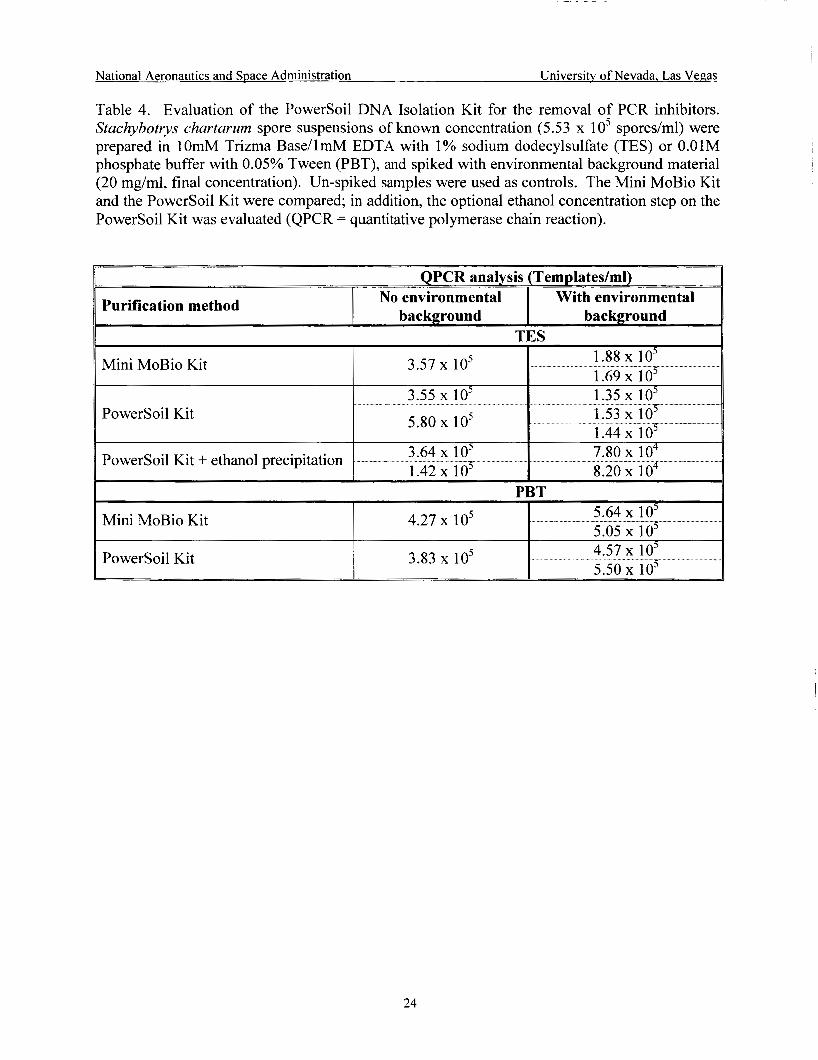
chartarum as the test organism and compared to the Mini MoBio Kit. Samples prepared in TES were purified by one of three methods: Mini MoBio Kit, Power Soil Kit, and Power Soil Kit/ethanol precipitation. Samples prepared in PBT were purified by one of two methods: Mini MoBio Kit and Power Soil Kit. QPCR results showed no large difference in the buffer utilized for spore suspension preparation, although the measurements on PBT samples with environmental background were slightly higher than on TES samples with environmental background (Table 4). The Power Soil Kit was equal to or slightly less effective than the Mini MoBio Kit. In addition, QPCR results of TES suspensions spiked with environmental background indicated that there were losses in DNA associated with the inclusion of the ethanol precipitation step on the Power Soil protocol.
4.1.2 Master Mix Evaluation
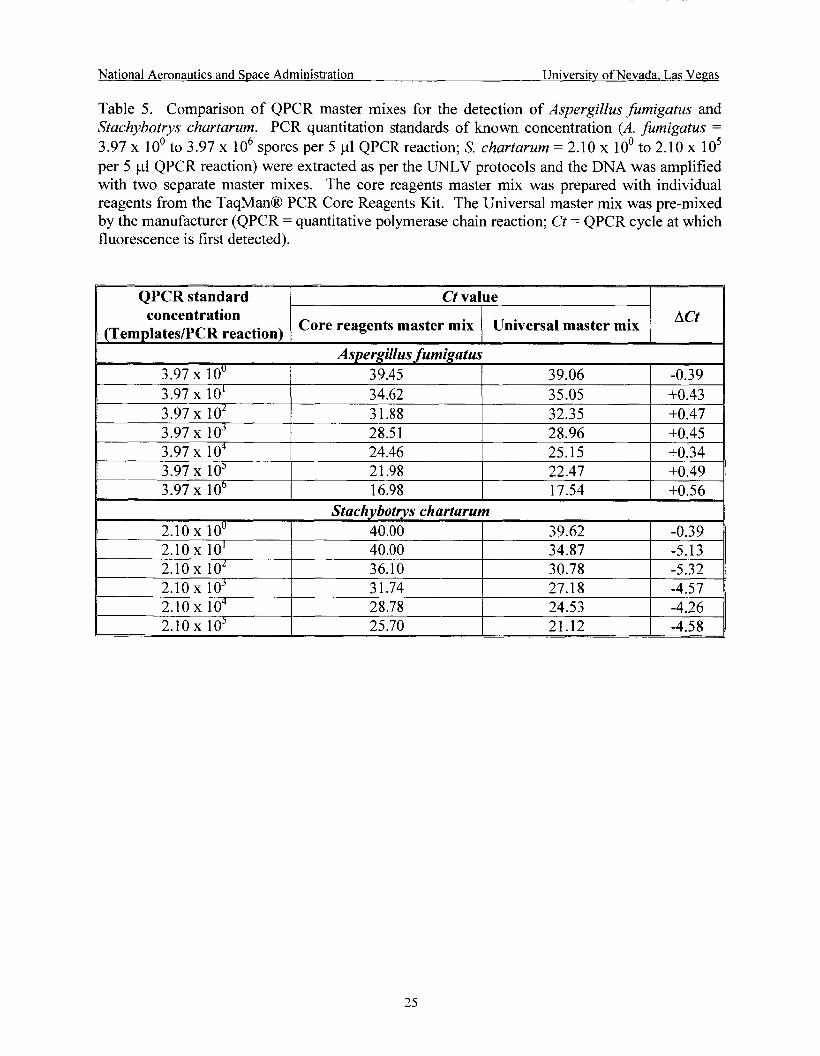
The TaqMan@ Universal PCR Master Mix was evaluated and compared to the master mix prepared with the TaqMan' Core Reagents Kit using QPCR standards of known concentration for both test organisms analyzed by amplifying them with the two master mixes. A. furnigatus PCR results indicated an increase in Ct value (Le., decrease in amplification product) when the samples were assayed with the Universal master mix (Table 5). S. chartarum PCR results shclwed z !zrge decrease in Ct ~ z ! c e $.e.> increase n f > 1 Ing in amplification product) when the samples were assayed with the Universal master mix. Amplification of QPCR standards for both test organisms has shown that concentrations separated by one order of magnitude are 3.7 cycles apart (data not shown).
13
National Aeronautics and Space Administration University of Nevada, Las Vevas
4.1.3 Specificity Testing
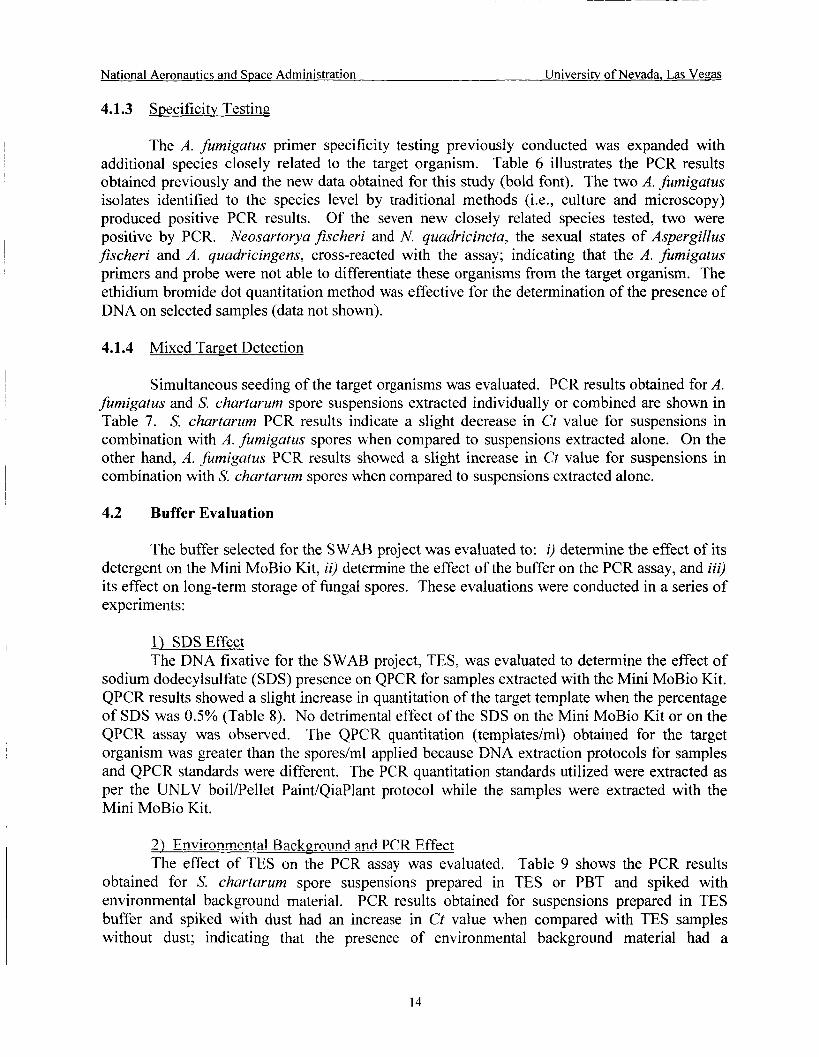
The A. fumigatus primer specificity testing previously conducted was expanded with additional species closely related to the target organism. Table 6 illustrates the PCR results obtained previously and the new data obtained for this study (bold font). The two A. fumigatus isolates identified to the species level by traditional methods (i.e., culture and microscopy) produced positive PCR results. Of the seven new closely related species tested, two were positive by PCR. Neosartorya Jischeri and N. quadricincta, the sexual states of Aspergillus fischeri and A. quadricingens, cross-reacted with the assay; indicating that the A. fumigatus primers and probe were not able to differentiate these organisms from the target organism. The ethidium bromide dot quantitation method was effective for the determination of the presence of DNA on selected samples (data not shown).
4.1.4 Mixed Target Detection
Simultaneous seeding of the target organisms was evaluated. PCR results obtained for A. fumigatus and S. chartarum spore suspensions extracted individually or combined are shown in Table 7. S. chartarum PCR results indicate a slight decrease in Ct value for suspensions in combination with A. fumigatus spores when compared to suspensions extracted alone. On the other hand, A. fumigatus PCR results showed a slight increase in Ct value for suspensions in combination with S. chartarum spores when compared to suspensions extracted alone.
4.2 Buffer Evaluation
The buffer selected for the SWAB project was evaluated to: i ) determine the effect of its detergent on the Mini MoBio Kit, ii) determine the effect of the buffer on the PCR assay, and iii) its effect on long-term storage of fungal spores. These evaluations were conducted in a series of experiments:
I ) SDS Effect The DNA fixative for the SWAB project, TES, was evaluated to determine the effect of
sodium dodecylsulfate (SDS) presence on QPCR for samples extracted with the Mini MoBio Kit. QPCR results showed a slight increase in quantitation of the target template when the percentage of SDS was 0.5% (Table 8). No detrimental effect of the SDS on the Mini MoBio Kit or on the QPCR assay was observed. The QPCR quantitation (templatedml) obtained for the target organism was greater than the spores/ml applied because DNA extraction protocols for samples and QPCR standards were different. The PCR quantitation standards utilized were extracted as per the UNLV boil/Pellet Paint/QiaPlant protocol while the samples were extracted with the Mini MoBio Kit.
- '71 , Fnvirnnmmtal . -- --__-----___. Rarkorniinrl - _ _ _ _ _ _ - _._. -. and -... . PCR Effect The effect of TES on the PCR assay was evaluated. Table 9 shows the PCR results
obtained for S. chartarum spore suspensions prepared in TES or PBT and spiked with environmental background material. PCR results obtained for suspensions prepared in TES buffer and spiked with dust had an increase in Ct value when compared with TES samples without dust; indicating that the presence of environmental background material had a
14
National Aeronautics and Space Administration University of Nevada, Las Vegas
detrimental effect on the PCR assay and/or the Mini MoBio Kit. This effect was not observed in spore suspensions prepared in PBT.
3) Archival Study The effect of TES on long-term storage of fungal spores was determined by culture and
PCR analyses. S. chartarum spore suspensions of known concentration were prepared in TES or in PBT and archived at room temperature and analyzed by culture and QPCR at To days, T3 days and at 1 week intervals. Spore viability declined quickly for samples archived in TES buffer (Table 10 and Figure 2). Sporulation was more abundant on the spore suspension prepared in PBT (Figure 2). PBT was effective in maintaining spore viability until day 14 of archival; decreases in viability were observed beginning with day 21 of archival. Both buffers produced equivalent PCR quantitation of the target organism until day 14 of storage; however, a decrease in quantitation was observed with PBT samples archived for 2 1 days.
4.3 Protocol Validation
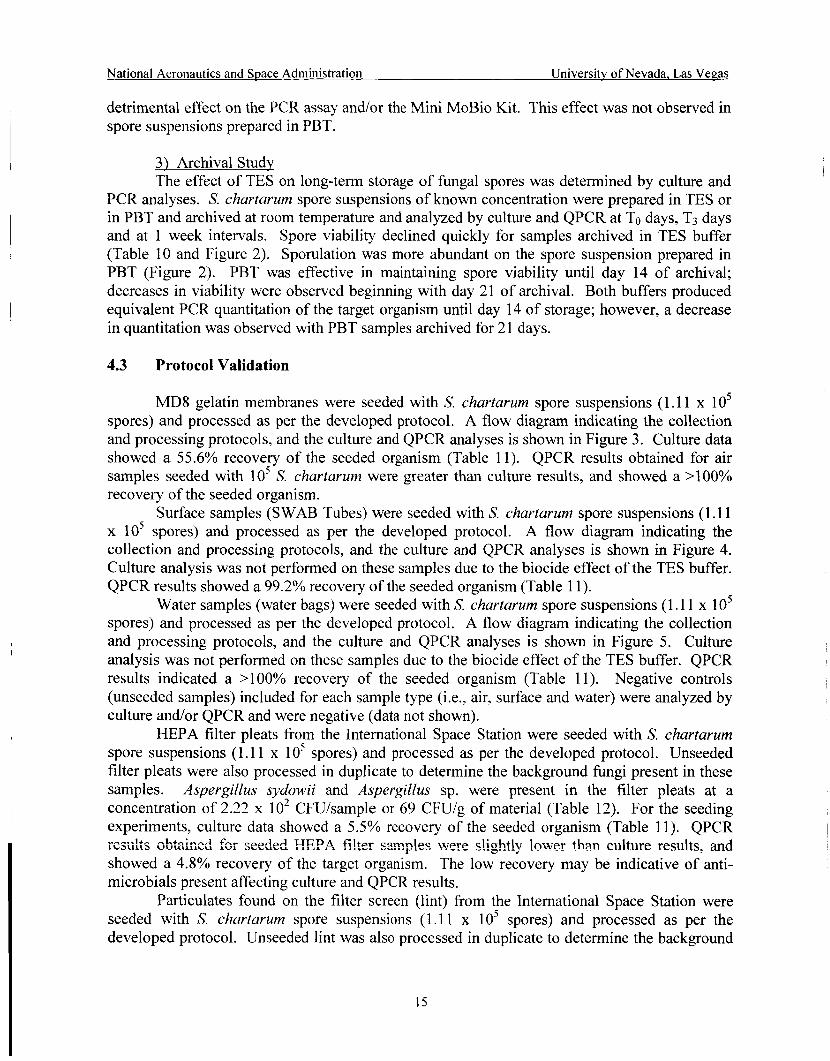
MD8 gelatin membranes were seeded with S. chartarum spore suspensions (1.1 1 x 10’ spores) and processed as per the developed protocol. A flow diagram indicating the collection and processing protocols, and the culture and QPCR analyses is shown in Figure 3. Culture data showed a 55.6% recovery of the seeded organism (Table 11). QPCR results obtained for air samples seeded with 10’ S. chartarum were greater than culture results, and showed a >loo% recovery of the seeded organism.
Surface samples (SWAB Tubes) were seeded with S. chartarum spore suspensions (1.1 1 x 10’ spores) and processed as per the developed protocol. A flow diagram indicating the collection and processing protocols, and the culture and QPCR analyses is shown in Figure 4. Culture analysis was not performed on these samples due to the biocide effect of the TES buffer. QPCR results showed a 99.2% recovery of the seeded organism (Table 11).
Water samples (water bags) were seeded with S. chartarum spore suspensions (1.1 1 x 1 0’ spores) and processed as per the developed protocol. A flow diagram indicating the collection and processing protocols, and the culture and QPCR analyses is shown in Figure 5. Culture analysis was not performed on these samples due to the biocide effect of the TES buffer. QPCR results indicated a >loo% recovery of the seeded organism (Table 11). Negative controls (unseeded samples) included for each sample type (Le., air, surface and water) were analyzed by culture and/or QPCR and were negative (data not shown).
HEPA filter pleats from the International Space Station were seeded with S. chartarum spore suspensions (1.1 1 x lo5 spores) and processed as per the developed protocol. Unseeded filter pleats were also processed in duplicate to determine the background fungi present in these samples. Aspergillus sydowii and Aspergillus sp. were present in the filter pleats at a concentration of 2.22 x lo2 CFU/sample or 69 CFU/g of material (Table 12). For the seeding experiments, culture data showed a 5.5% recovery of the seeded organism (Table 11). QPCR results ol;tair,d fcx .;e&?, FIEPA fi l ter s x ~ l - werp s!ight!y !nwer than culture results: and showed a 4.8% recovery of the target organism. The low recovery may be indicative of anti- microbials present affecting culture and QPCR results.
Particulates found on the filter screen (lint) from the International Space Station were seeded with S. chartarum spore suspensions (1.1 1 x 10’ spores) and processed as per the developed protocol. Unseeded lint was also processed in duplicate to determine the background
r*-- * * - - -
15

National Aeronautics and Space Administration University of Nevada, Las Vegas
fungi present in these samples. Penicillium chrysogenum and Aspergillus sydowii were the predominant species present in the filter screen particulates (Table 12, Figure 6). Other fungi present were Aspergillus niger, Aspergillus sp., Ulocladium sp., and unidentified fungi. These samples had a total fungal load of 1.1 x 1 O4 CFUkample or 3.6 x 1 O4 CFU/g of material (Table 12). For the seeding experiments, culture data showed a 41.6% recovery of the seeded organism (Table 11). QPCR results obtained for seeded lint samples were greater than culture results, and showed a >loo% recovery of the target organism.
5. DISCUSSION
The amount of environmental background material necessary to produce partial inhibition of the PCR assay was determined in order to evaluate DNA extraction and purification protocols. While partial inhibition of the PCR assay was clearly evident with an increase in dust on A. fumigatus suspensions, increasing the amount of dust on S. chartarum spore suspensions did not have a proportional effect on PCR inhibition. It is possible that the additional purification step (i.e., QiaPlant) employed with this target organism was effective in the removal of PCR inhibitors present in the dust at this concentration. Therefore, the dust concentration would have to be further increased to observe PCR inhibition with this purification protocol. However, for ease in the comparison of target organisms and purification kits, the same dust concentration (20 mg dust/ml) was selected for both test organisms.
Losses in DNA as a result of additional or optional manipulations were observed during the evaluation of purification protocols for the removal of PCR inhibitors. Evidence of these losses was observed in: i ) A. fumigatus experiments involving the addition of the QiaPlant purification step after the boil/Pellet Paint protocol; ii) the incorporation of sample concentration by membrane filtration into the Mini MoBio protocol; and iii) the inclusion of the optional ethanol precipitation step on the Power Soil protocol. We have observed that essentially any manipulation of DNA samples will result in DNA losses; therefore, future optimization of the protocols developed should take this in consideration.
It was observed that the Mini MoBio Kit performed more effectively (i.e., removed more PCR inhibitors) in the presence of environmental background material. Experiments conducted with S. chartarum as the test organism revealed that samples with environmental background material had a 1-log improvement in the quantitation of the target when compared to samples without environmental background. The reason for this effect is unknown.
The PCR assay was optimized for both target organisms by evaluating the PCR master mix. The A. fumigatus PCR results indicated an increase in Ct value (Le., decrease in amplification product) when the samples were assayed with the Universal master mix; therefore, the A. fumigatus master mix recipe was not changed. However, the S. chartarum results showed a large decrease in Ct value when assayed with the Universal master mix. Changing the S. chartarum PCR master mix to the Universal mix lowered the sensitivity of detection to 0.3 templates per 5 p1 PCR reaction; therefore, the S. chartarum PCR master mix recipe was
Of the seven closely related species included in the A. fumigatus specificity testing, two were positive by PCR. Neosartorya Jischeri and N. quadricincta cross-reacted with the assay, indicating that the A . fumigatus primers and probe were not able to differentiate these organisms from the target organism. Because Neosartorya species are the sexual states (teleomorphs) of Aspergillus species it is not surprising that these species cross-reacted with the A. fumigatus
-I-----A t- tL,, 1 1..:..,-,,1 -ontor -;" bllallgbu L U L l l b U l l l V b l J U l 1IlUJLb.I 1111A.
16
National Aeronautics and Space Administration University of Nevada, Las Vegas
assay. Neosartorya species are common and their natural habitat is soil. The anamorph (asexual state) of N. Jischeri is AspergillusJischeri and that of N. quadricincta is A. quadricingens (Klich, 2002; Hawksworth et al., 1995). Because iV. .fischeri is sometimes pathogenic to humans, its cross-reactivity with the A. fumigatus PCR may not be of great significance. Very little information is available on the habitat and pathogenicity of N. quadricincta. This may be indicative of a very low incidence of this organism.
Simultaneous seeding of the target organisms was evaluated for two reasons: i ) to mimic a natural phenomenon, where more than one organism may be present in a sample, and ii) to expedite the validation experiments by processing half the number of samples. The results obtained in the pilot seeding experiment were somewhat inconsistent. While the S. chartarum PCR results showed a slight decrease in Ct value for suspensions in combination with A. fumigatus spores, the A. fumigatus PCR results showed a slight increase in Ct value for combined suspensions. Because a small increment or decline in Ct value is fairly common, combined seeding of target organisms was attempted in air sampling validation studies. However, difficulties were encountered with both culture and PCR analyses. Enumeration of the S. chartarum colonies was difficult due to the presence of the faster-growing A. fumigatus. Future experiments may have to consider the use of growth media or antibiotics that inhibit the faster-growing fungi.
At the request of NASA, the effect of the detergent in the DNA fixative for the SWAB project (i.e., TES) on the MoBio Kit was evaluated. No detrimental effect of the SDS on the Mini MoBio Kit or on the QPCR assay was observed. In addition, while utilizing 1% SDS solves the NASA toxicity concerns of this reagent in powder form, it also performed well in QPCR experiments (a slight increase in quantitation of the target template was observed when the percentage of SDS was increased to 0.5%). Additional studies conducted with this buffer showed that PCR quantitation of spore suspensions prepared in TES and spiked with environmental background was slightly lower than PCR results obtained for suspensions prepared in PBT (with environmental background). Furthermore, PCR results obtained for suspensions prepared in TES buffer and spiked with dust had a decrease in quantitation when compared with TES samples without dust; indicating that the presence of environmental background material had a detrimental effect on the PCR assay and/or the Mini MoBio Kit. Because field samples will contain some degree of environmental background material in them, these findings may be of concern. It is anticipated that samples collected at the ISS will remain archived at room temperature for up to 6 months before sample processing and analysis takes place. With this in mind, the effect of TES on long-term storage of fungal spores was evaluated. Spore viability declined quickly for samples archived in TES buffer. This was to be expected as this buffer was formulated to prevent growth of the sampled organisms at room temperature. While both buffers studied produced equivalent PCR quantitation of the target organism, a decrease in quantitation was observed at day 21 of storage for samples archived in PBT. A concern of long-term storage is the possibility of DNA leakage from lysed spores; therefore, additional work is needed to evaluate the storage of spores in TES for a period of up to 6 months.
Protocol validation studies showed that OPCR results recovered more than 100% of the spores seeded in air, water and lint samples. The reason for these results is unknown but it is possible that protocol variation and/or experimental error affected the results, as a limited number of replicates was analyzed for every experiment. The culture and QPCR results obtained for the seeded HEPA filter samples were of interest because of the lower recovery obtained for the target organism when compared to all the other seeded samples. These data may be
17
National Aeronautics and Space Administration Jniversity of Jevada, Las Vegas
indicative of anti-microbials present in the HEPA filter affecting culture and QPCR results. Additional work is needed to identify a mechanism to remove these compounds, if present. The high concentration of background fungi found on the ISS samples, particularly the particulates found on the filter screen (lint), is of concern. The sample location would indicate that these organisms were airborne and eventually were trapped in this screen. The presence of free- floating condensate may exacerbate this situation by adding moisture to the lint and possibly allowing these organisms to amplify. Furthermore, removal of these particulates for disposal may re-aerosolize the organisms present, exposing the crewmembers to high levels of fkngi. A system must be established, if it is not already in place, for the prompt removal and disposal of particulates as they accumulate in this and any other areas.
This study utilized a novel approach for analyzing microorganisms in the spacecraft environment. Purification methods and QPCR assays were optimized for the detection of Aspergillus fumigatus and Stachybotrys chartarum in air, surface, and water samples. Sample processing and analysis protocols were developed and validated in the laboratory with air, surface, and water samples, and on bulk materials obtained from the ISS. Additional work is needed to further evaluate the long-term storage of spores in TES, and to further optimize and evaluate the processing and analysis protocols with environmental background material present. The protocols developed will be useful to the ISS for (i) monitoring the ISS modules immediately prior to launch to develop a baseline of contamination, (ii) monitoring the space shuttle to evaluate sources of new contamination to the ISS, and (iii) direct sampling of the ISS. The routine use of QPCR analysis will reveal previously undetected microorganisms in real time, resulting in potentially faster and more comprehensive health assessment of spacecraft during extended missions. It is anticipated that the developed techniques will alter the environmental monitoring of not only spacecraft but also can be applied to ground-based evaluations of office buildings and residences. Future work should expand these protocols to the detection of other organisms of concern, such as allergens and microbial toxins.
18
National Aeronautics and Space Administration Universitv of Nevada, Las Vegas
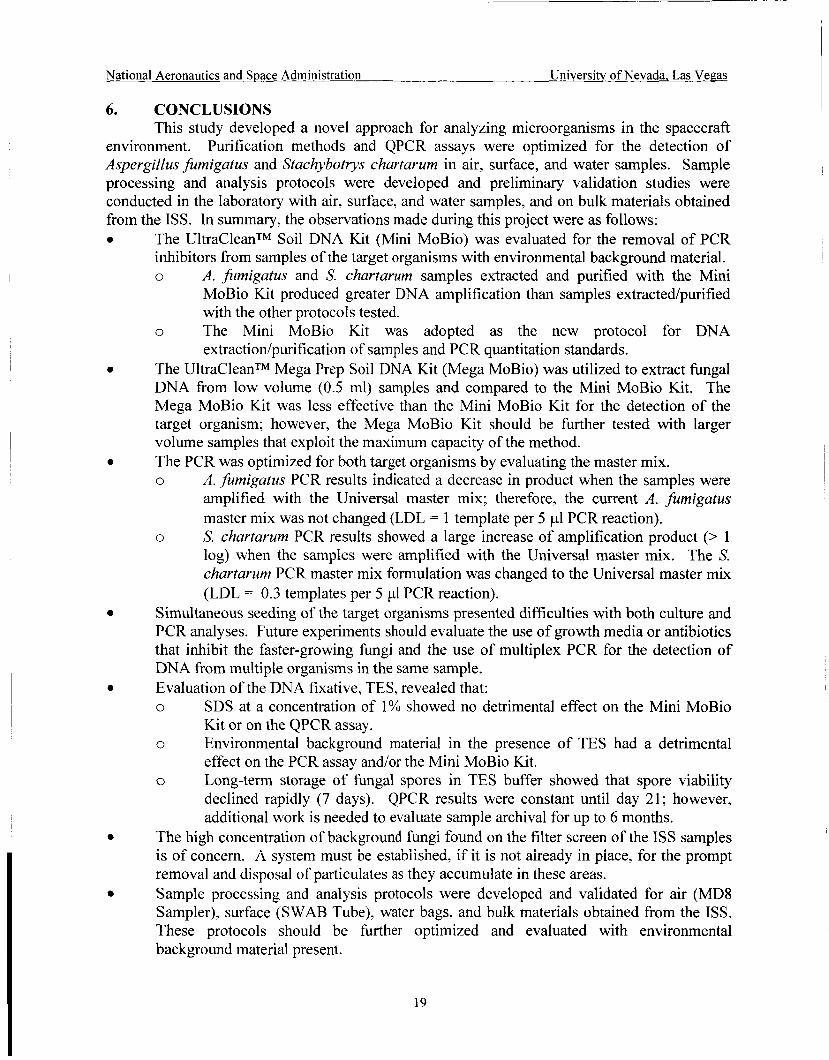
6. CONCLUSIONS This study developed a novel approach for analyzing microorganisms in the spacecraft
environment. Purification methods and QPCR assays were optimized for the detection of Aspergillus fumigatus and Stachybotrys churtarum in air, surface, and water samples. Sample processing and analysis protocols were developed and preliminary validation studies were conducted in the laboratory with air, surface, and water samples, and on bulk materials obtained from the ISS. In summary, the observations made during this project were as follows: e The UltraCleanTM Soil DNA Kit (Mini MoBio) was evaluated for the removal of PCR
inhibitors from samples of the target organisms with environmental background material. 0 A. fumigutus and S. chartarum samples extracted and purified with the Mini
MoBio Kit produced greater DNA amplification than samples extractedlpurified with the other protocols tested.
0 The Mini MoBio Kit was adopted as the new protocol for DNA extractiodpurification of samples and PCR quantitation standards.
The UltraCleanTM Mega Prep Soil DNA Kit (Mega MoBio) was utilized to extract fungal DNA from low volume (0.5 ml) samples and compared to the Mini MoBio Kit. The Mega MoBio Kit was less effective than the Mini MoBio Kit for the detection of the target organism; however, the Mega MoBio Kit should be further tested with larger volume samples that exploit the maximum capacity of the method. The PCR was optimized for both target organisms by evaluating the master mix. o
0
e
A. fumigatus PCR results indicated a decrease in product when the samples were amplified with the Universal master mix; therefore, the current A. fumigatus master mix was not changed (LDL = 1 template per 5 pl PCR reaction). S. chartarum PCR results showed a large increase of amplification product (> 1 log) when the samples were amplified with the Universal master mix. The S. chartarum PCR master mix formulation was changed to the Universal master mix (LDL = 0.3 templates per 5 pl PCR reaction).
Simultaneous seeding of the target organisms presented difficulties with both culture and PCR analyses. Future experiments should evaluate the use of growth media or antibiotics that inhibit the faster-growing fungi and the use of multiplex PCR for the detection of DNA from multiple organisms in the same sample. Evaluation of the DNA fixative, TES, revealed that: 0
0
0
o
e
0
SDS at a concentration of 1% showed no detrimental effect on the Mini MoBio Kit or on the QPCR assay. Environmental background material in the presence of TES had a detrimental effect on the PCR assay and/or the Mini MoBio Kit. Long-term storage of fungal spores in TES buffer showed that spore viability declined rapidly (7 days). QPCR results were constant until day 21; however, additional work is needed to evaluate sample archival for up to 6 months.
The high concentration of background fungi found on the filter screen of the ISS samples is of concern. A system must be established, if it is not aiready in piace, for the prompt removal and disposal of particulates as they accumulate in these areas. Sample processing and analysis protocols were developed and validated for air (MD8 Sampler), surface (SWAB Tube), water bags, and bulk materials obtained from the ISS. These protocols should be further optimized and evaluated with environmental background material present.
0
0
19

National Aeronautics and Space Administration University of Nevada, Las Vegas
7. LITERATURE CITED
Ausubel, F.M., R. Brent, R.E. Kingston, D.D. Moore, J.G. Seidman, J.A. Smith, and K. Struhl. 1995. The Polymerase Chain Reaction, pp. 15.0.1-15.7.1 1, In Current Protocols in Molecular Biology. John Wiley & Sons, Inc., New York.
Buttner, M.P., P. Cruz, L.D. Stetzenbach, A.K. Klima-Comba, V.L. Stevens, and T.D. Cronin. 2004. Determination of the efficacy of two building decontamination strategies by surface sampling with culture and quantitative PCR analysis. Appl. Environ. Microbiol. 70(8):4740- 4747.
Castro, V.A., A.N. Thrasher, M. Healy, C.M. Ott, and D.L. Pierson. 2004. Microbial characterization during the early habitation of the International Space Station. Microb. Ecol. 47:119-126.
Crow, S.A., D.G. Ahearn, J.A. Noble, M. Moyenuddin, and D.L. Price. ecology of buildings: Effects of fungi on indoor air quality. Atmos. Environ. Lab. 6: 16-1 8.
1994. Microbial
Cruz-Perez, P., M.P. Butter, and L.D. Stetzenbach. Detection and quantitation of Aspergillus fumigutus in pure culture using polymerase chain reaction. Mol. Cel. Probes. 1581- 88.
2001a.
Cruz-Perez, P., M.P. Butter, and L.D. Stetzenbach. 2001 b. Specific detection of Stachybotrys chartarum in pure culture using quantitative polymerase chain reaction. Mol. Cel. Probes. 15: 129- 13 8.
Hawksworth, D.L., P.M. Kirk, B.C. Sutton, and D.N. Pegler. Dictionary of the Fungi. Sth Ed. CAB International, New York, NY.
1995. Ainsworth & Bisby’s
Klich, M.A. 2002. Identification of Common Aspergillus Species. Centraalbureau voor Schimmelcultures, The Netherlands.
La Duc, M.T., R. Kern, and K. Venkateswaran. 2004. Microbial monitoring of spacecraft and associated environments. Microb. Ecol. 47: 150-1 58.
Levetin, E. 1995. Fungi. In Bioaerosols (H. Burge, ed.). Lewis Publishers, Boca Raton, FL.
Novikova, N.D. 2004. Review of the knowledge of microbial contamination of the Russian manned spacecraft. Microb. Ecol. 47: 127-132.
Stt, C.pv<., R.J. Bruce, zqc! D.L. Piersnn. 2004. condensate aboard the Mir Space Station. Microb. Ecol. 47: 133-136.
Microbial characterization of free floating
Pitt, J.I. 2000. A Laboratory Guide to Common Penicillium Species. Food Science, Australia.
20
National Aeronautics and SDace Administration University of Nevada. Las Vegas
Organism Source Aspergillus fum igut us A. fumiautus HRC- 16 b.
HRC- 1 5
Table 1. Fungal isolates tested by polymerase chain reaction amplification using Aspergillus fumigutus primers and probe (ATCC = American Type Culture Collection; HRC = Harry Reid Center for Environmental Studies, University of Nevada-Las Vegas; ARS NRRL = Agricultural Research Service Culture Collection-Northern Regional Research Laboratory [currently the National Center For Agricultural Utilization Research], U.S. Department of Agriculture).
Eupenicillium hiruyumue E. luvidosum
ARS NRRL, 3588 ARS NRRL 718
Neosurtoryu Jischeri N. auudricincta
ARS NRRL 4075 ARS NRRL 2221
N. strumeniu Penicillium usperosporunz
11 P. purpurescens I ARS NRRL 720
ARS NRRL 4652 ARS NRRL, 341 1
21

National Aeronautics and Space Administration University of Nevada, Las Veaas
Table 2. Comparison of DNA purification methods for the removal of PCR inhibitors from Aspergillus fumigatus and Stachybotrys chartarum spore suspensions. Spore suspensions of known concentration (A. fumigatus = 7.93 x lo5 spores/ml and S. chartarum = 1.67 x lo6 spores/ml) were spiked with environmental background material (20 mg/ml, final concentration). Un-spiked samples were used as controls. The UNLV extractiodpurification protocol for A. fumigatus (boil/Pellet Paint) was compared to the boil/Pellet PaidQiaPlant and the Mini MoBio protocols. The UNLV extractiodpurification protocol for S. chartarum (boiVPellet PaWQiaPlant) was compared to the Mini MoBio Kit (PCR = polymerase chain reaction).
Purification Method
1.29 x lo6 9.20 x 10’ Boil/Pellet Paint I 2.15 x lo6 3.85 io4
BoiUPellet Paint/ QiaPlant
Mini MoBio Kit 5.52 x IO6 2.18 x lo6 3.18 x lo6
22
National Aeronautics and Space Administration University of Nevada, Las Vegas
Table 3. Comparison of sample concentration and DNA extraction methods. Stachybotrys chartarum spore suspensions (1.67 x lo6 spores/ml) were extracted/purified by one of two methods. Duplicate 0.5 ml samples were filter-concentrated through a 0.65 pm mixed cellulose ester membrane followed by placement of the membrane in the bead tube of the Mini MoBio Kit. The Mega MoBio Kit was used to extract the DNA of duplicate spore suspensions (0.5 ml) without a pre-filtration step. As a control, a 0.1 ml sample was extracted with the Mini MoBio Kit without a pre-filtration step (QPCR = quantitative polymerase chain reaction).
Concentration step Extraction method Number of QPCR analysis replicates (Templates/ml)
None Mini MoBio Kit 1 1.64 io7 Filtration Mini MoBio Kit 2 5.80 x lo6 None Mega MoBio Kit 2 1.79 io5
23
National Aeronautics and Space Administration Universitv of Nevada, Las Veaas
Purification method No environmental background
Table 4. Evaluation of the PowerSoil DNA Isolation Kit for the removal of PCR inhibitors. Stachybotrys chartarum spore suspensions of known concentration (5.53 x 1 Os spores/ml) were prepared in lOmM Trizma Base/lmM EDTA with 1% sodium dodecylsulfate (TES) or 0.01M phosphate buffer with 0.05% Tween (PBT), and spiked with environmental background material (20 mg/ml, final concentration). Un-spiked samples were used as controls. The Mini MoBio Kit and the PowerSoil Kit were compared; in addition, the optional ethanol concentration step on the PowerSoil Kit was evaluated (QPCR = quantitative polymerase chain reaction).
With environmental background
Mini MoBio Kit
PowerSoil Kit
PowerSoil Kit + ethanol precipitation
Mini MoBio Kit 3.57 io5 1.88 io5
3.55 io5 1.35 io5
5 . 8 0 ~ io5
3.64 x lo5 7.80 io4 1.42 x lo5 8.20 io4
1.69 x lo5
1.53 x 10’ 1.44 x 10’
PowerSoil Kit
precipitation
3.57 io5 1.88 io5
3.55 io5 1.35 io5
5 . 8 0 ~ io5
3.64 x lo5 7.80 io4 1.42 x lo5 8-20 io4
1.69 x lo5
1.53 x 10’ 1.44 x 10’
~
PowerSoil Kit + ethanol
Mini MoBio Kit
PowerSoil Kit
5.64 io5 5.05 io5 4.57 io5
4.27 io5
3.83 io5 5.50 x 10’
24
National Aeronautics and Space Administration University of Nevada. Las Vegas
QPCR standard concentration
(Temdates/PCR reaction)
Table 5. Comparison of QPCR master mixes for the detection of Aspergillus fumigatus and Stachybotrys chartarum. PCR quantitation standards of known concentration (A. fumigatus =
3.97 x 10' to 3.97 x 1 O6 spores per 5 pl QPCR reaction; S. chartarum = 2.10 x 10' to 2.10 x 1 O5 per 5 pl QPCR reaction) were extracted as per the UNLV protocols and the DNA was amplified with two separate master mixes. The core reagents master mix was prepared with individual reagents from the TaqManB PCR Core Reagents Kit. The Universal master mix was pre-mixed by the manufacturer (QPCR = quantitative polymerase chain reaction; Ct = QPCR cycle at which fluorescence is first detected).
Ct value Act Core reagents master mix Universal master mix
~~
Asverpillus furnipatus " .I '3
3.97 x 10" 39.45 39.06 -0.39 3.97 x 10' 34.62 35.05 +0.43 3.97x lo2 3 1.88 32.35 +0.47 3.97x IO3 28.5 1 28.96 +0.45 3.97 io4 24.46 25.15 +0.34 3.97 io5 21.98 22.47 +0.49 3.97 x lob 16.98 17.54 I +0.56
Stachybotrys chartarum 2.10 x 10" 40.00 39.62 -0.39 2.10 x 10' 40.00 34.87 -5.13 2.10x loL 36.10 30.78 -5.32 2.10x lo3 3 1.74 27.18 -4.57 2.10 io4 28.78 24.53 -4.26 2 . 1 0 ~ io5 25.70
25
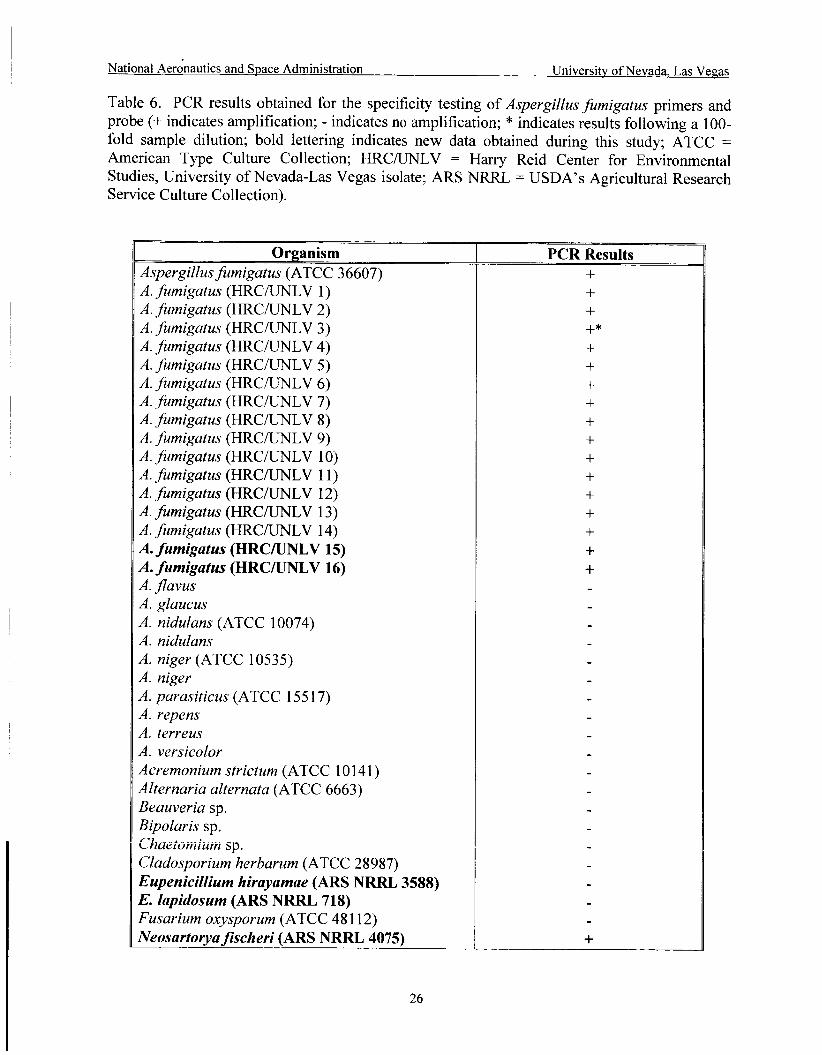
National Aeronautics and Space Administration University of Nevada, Las Vepas
Table 6. PCR results obtained for the specificity testing of Aspergillus fumigatus primers and probe (+ indicates amplification; - indicates no amplification; * indicates results following a 100- fold sample dilution; bold lettering indicates new data obtained during this study; ATCC = American Type Culture Collection; HRC/UNLV = Harry Reid Center for Environmental Studies, University of Nevada-Las Vegas isolate; ARS NRRL = USDA’s Agricultural Research Service Culture Collection).
Organism Aspergillus fumigatus (ATCC 36607) A. fumigatus (HRC/UNLV 1) A. fumigatus (HRC/UNLV 2) A. fumigatus (HRC/UNLV 3) A. fumigatus (HRCAJNLV 4) A. fumigatus (HRC/UNLV 5) A. fumigatus (HRC/UNLV 6) A. fumigatus (HRC/UNLV 7 ) A. fumigatus (HRC/UNLV 8) A. fumigutus (HRC/UNLV 9) A. fumigatus (HRC/UNLV 10) A. fumigatus (HRC/UNLV 11) A. fumigatus (HRC/UNLV 12) A. fumigatus (HRC/UNLV 13) A. fumigatus (HRCAJNLV 14) A. fumigatus (HRCRJNLV 15) A. fumigatus (HRCRJNLV 16) A. flavus A. glaucus A. nidulans (ATCC 10074) A. nidulans A. niger (ATCC 10535) A. niger A. parasiticus (ATCC 155 17) A. repens A. terreus A. versicolor Acremonium strictum (ATCC 1 0 14 1 ) Alternaria alternata (ATCC 6663) Beauveria sp. Bipolaris sp.
Cladosporium herbarum (ATCC 28987) Eupenicillium hirayamae (ARS NRRL 3588) E. lapidosum (ARS NRRL 718) Fusarium oxysporum (ATCC 48 1 12) Neosarto yafischeri (ARS NRRL 4075)
C/iueioiii tiriii sp.
PCR Results + + + +* + + + + + + + + + + + + +
26

-
National Aeronautics and Space Administration University of Nevada, Las Veaas
PCR Results N. quadricincta (ARS NRRL 2221) N. stramenia (ARS NRRL 4652) Penicillium asperosporum (ARS NFUU 341 1) P. chrysogenum (ATCC 9480) P. chrysogenum P. digitatum P. expansum (ATCC 7861) P. frequentans P. purpurescens (ARS NRRL 720) Phoma sp. Rhizopus sp. Stachybotrys chartarum (ATCC 9 182) Trichoderma sp. Ustilago sp. Verticillium sp.
27
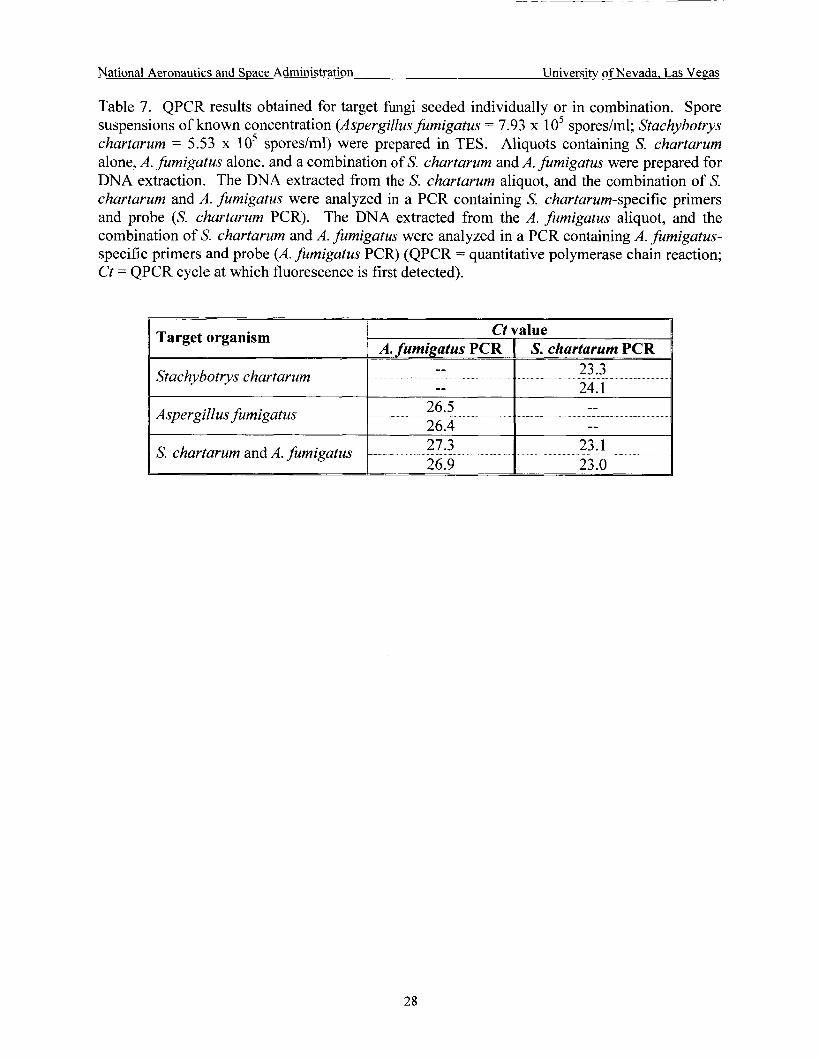
National Aeronautics and SDace Administration University of Nevada, Las Vegas
Target organism
Table 7. QPCR results obtained for target fungi seeded individually or in combination. Spore suspensions of known concentration (Aspergillus fumigatus = 7.93 x 1 O5 spores/ml; Stachybotrys chartarum = 5.53 x lo5 sporedml) were prepared in TES. Aliquots containing S. chartarum alone, A. fumigatus alone, and a combination of S. chartarum and A. fumigatus were prepared for DNA extraction. The DNA extracted from the S. chartarum aliquot, and the combination of S. chartarum and A . fumigatus were analyzed in a PCR containing S. chartarum-specific primers and probe (S. chartarum PCR). The DNA extracted from the A. fumigatus aliquot, and the combination of S. chartarum and A. fumigatus were analyzed in a PCR containing A. fumigatus- specific primers and probe (A. fumigatus PCR) (QPCR = quantitative polymerase chain reaction; Ct = QPCR cycle at which fluorescence is first detected).
Ct value A. fumigatus PCR I S. chartarum PCR
27.3 26.9
S. chartarum and A. fumigatus
-- -- I Stachybotrys chartarum
23.1 23.0
23.3 24.1 1 Aspergill us fum igatus I 26.5
26.4 I -- ...... . . . . ..... ..... ... ........ . --
28
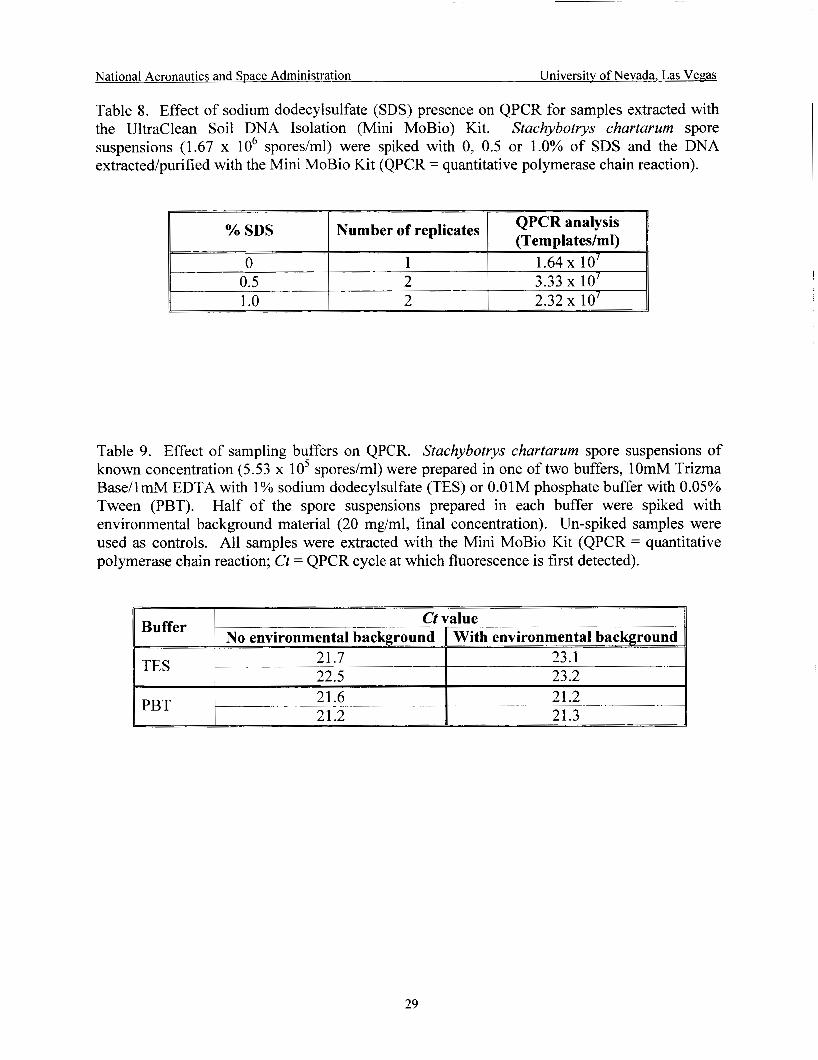
National Aeronautics and Space Administration University of Nevada, Las Vegas
Table 8. Effect of sodium dodecylsulfate (SDS) presence on QPCR for samples extracted with the Ultraclean Soil DNA Isolation (Mini MoBio) Kit. Stachybotrys chartarum spore suspensions (1.67 x lo6 spores/ml) were spiked with 0, 0.5 or 1.0% of SDS and the DNA extracted/purified with the Mini MoBio Kit (QPCR = quantitative polymerase chain reaction).
0.5 1 .o
I QPCR analysis 1 (TemDlates/ml) I %SDS 1 Number of replicates
3.33 io7 2 2.32 10’
~
2
No environmental background 21.7 22.5
TES
21.6 PBT 21.2
With environmental background 23.1 23.2 21.2 21.3
Table 9. Effect of sampling buffers on QPCR. Stachybotrys chartarum spore suspensions of known concentration (5.53 x 10’ spores/ml) were prepared in one of two buffers, 1OmM Trizma Base/lmM EDTA with 1% sodium dodecylsulfate (TES) or 0.01M phosphate buffer with 0.05% Tween (PBT). Half of the spore suspensions prepared in each buffer were spiked with environmental background material (20 mg/ml, final concentration). Un-spiked samples were used as controls. All samples were extracted with the Mini MoBio Kit (QPCR = quantitative polymerase chain reaction; Ct = QPCR cycle at which fluorescence is first detected).
29

National Aeronautics and Space Administration University of Nevada, Las Vepas
Table 10. Summary of culture and QPCR results obtained for Stachybotrys chartarurn spore suspensions archived in one of two buffers. Spore suspensions of known concentration (5.53 x lo5 spores/ml) were prepared in lOmM Trizma Base/lmM EDTA with 1% sodium dodecylsulfate (TES) or in 0.01 M phosphate buffer with 0.05% Tween (PBT) and archived at room temperature. Samples were analyzed by culture and QPCR at To, T3 days and at 1 week intervals. Culture analysis consisted of serially-diluting in the corresponding buffer for the archived sample, plating on potato dextrose agar, and incubating at 25°C. DNA extraction was performed with the Mini MoBio Kit (QPCR = quantitative polymerase chain reaction; nd = not done; TNTC = too numerous to count).
Archival Culture Analysis QPCR Analysis (CFU/ml) (Templatedml)
Buffer (day S)
Tn 6.30 io4 1.78 io5 Ti 1.00 io4 1.96 io5 T7 4 00 1.22 io5
30
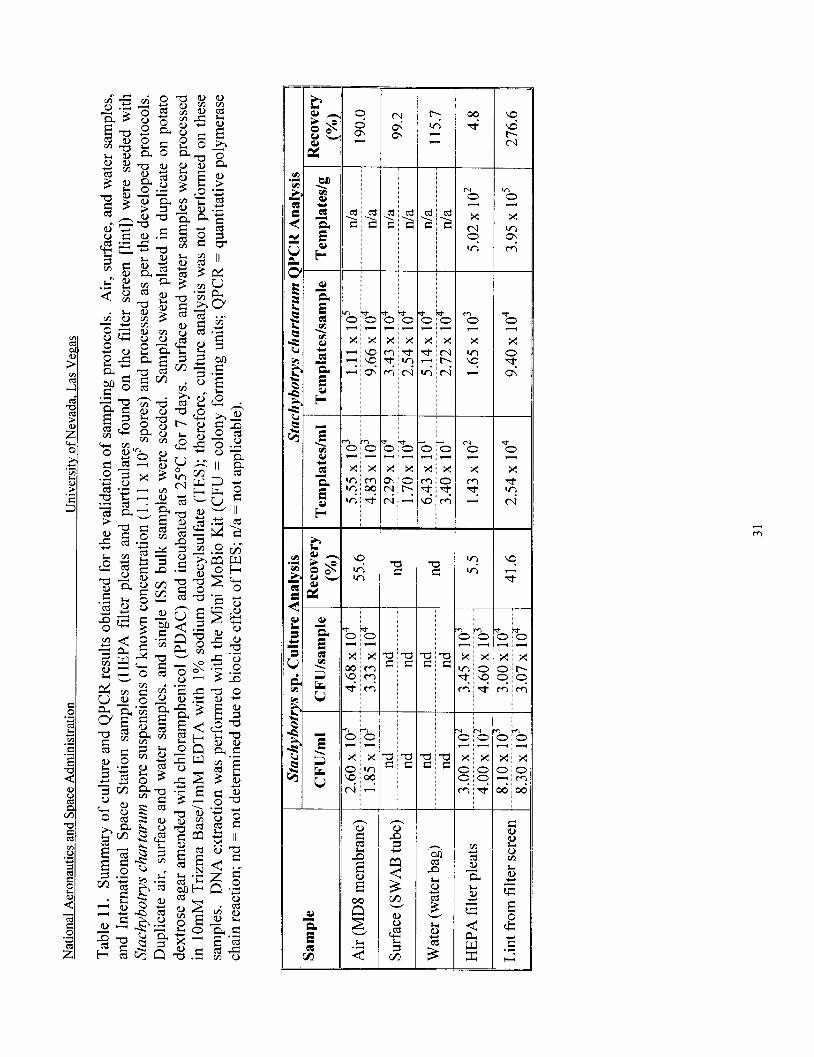
a I
E" 2 \
5 R u
'9 v, v,
E c W
a r=
n e, P 5 c
- -
c': v, 3 3
v? 0
X 3
v,
m o!
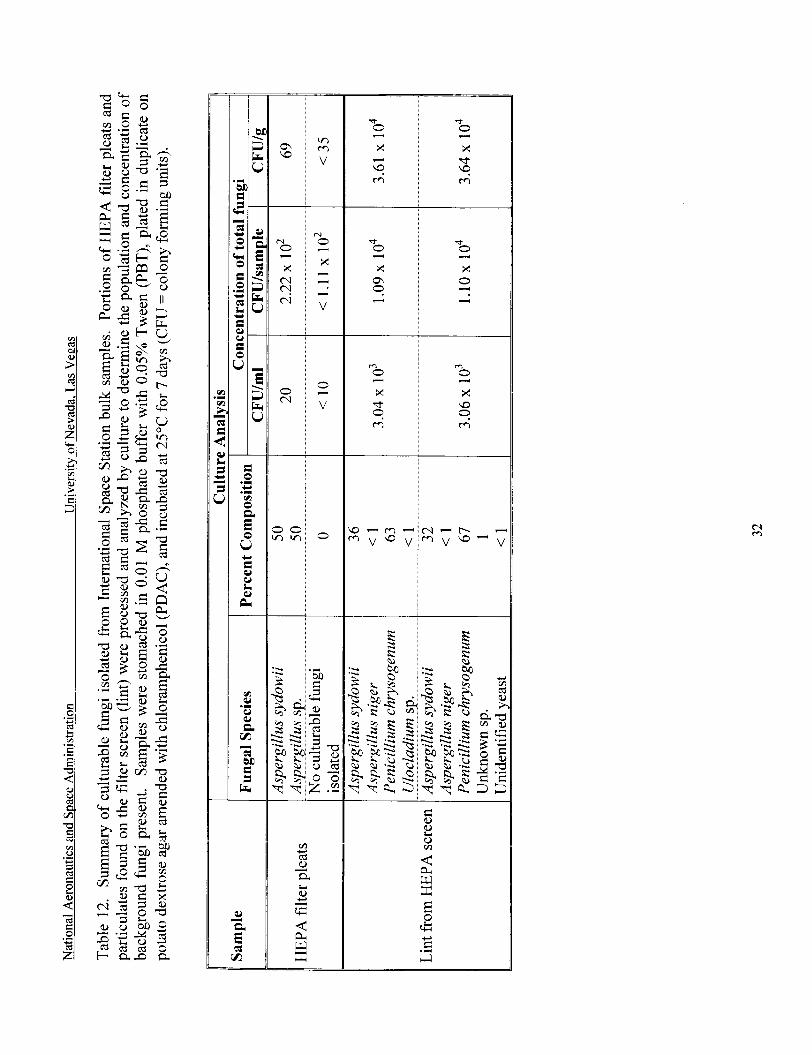
m W
N 0
X c-4
c-4
3
c‘!
0 c\l
0 0 m v ,
- -
v, m V
N 0
X - 3 d
3
V
0
V 3
0
b a Y
-a 0
X 3
\9 m
* 0
X a
3
9 3
m 0
X d.
3
9 crr
* 0
X d
m
3
\9
~
* 0
X 0
3
3
3
m 0
X \D
c?
4
9
N ccr
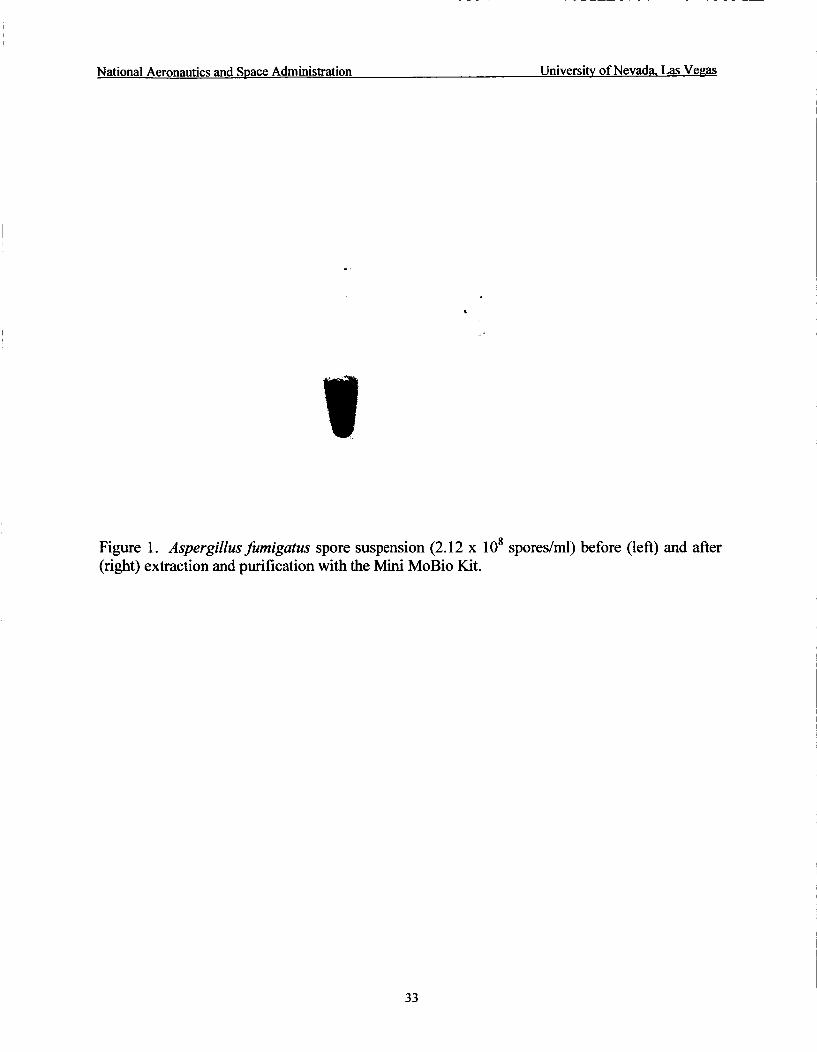
National Aeronautics and SDace Administration University of Nevada. Las Vegas
Figure 1. Aspergillus fumigutus spore suspension (2.12 x lo8 sporedml) before (left) and after (right) extraction and purification with the Mini MoBio Kit.
33
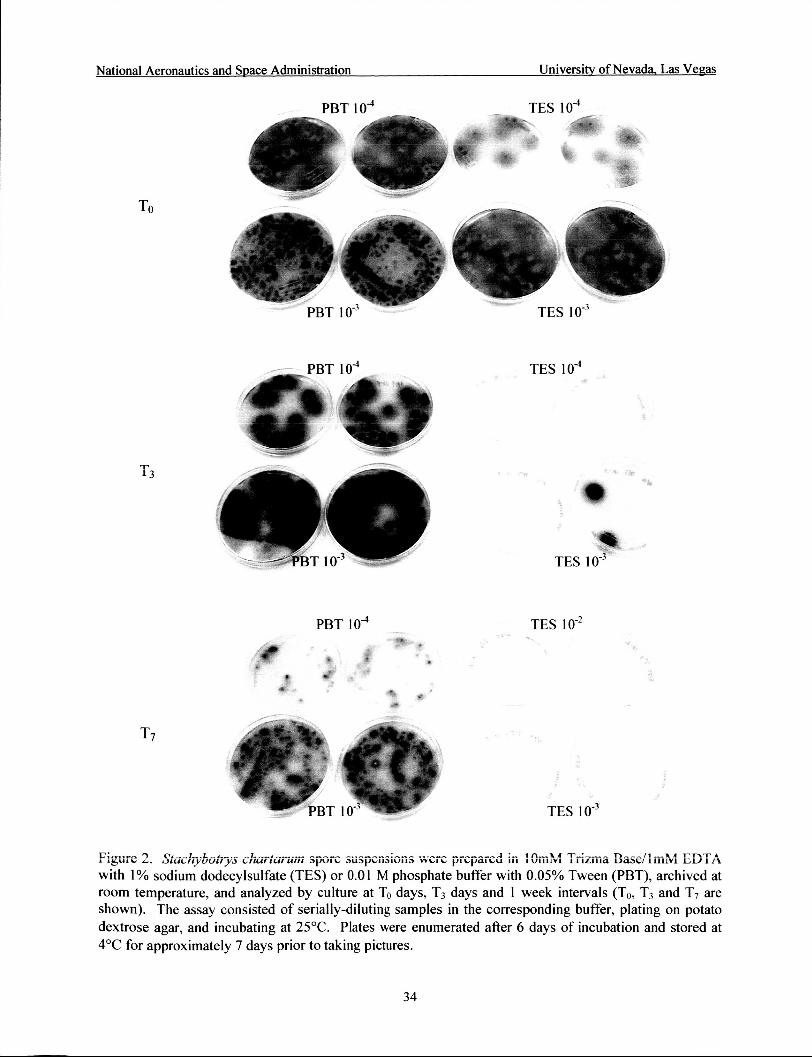
National Aeronautics and Space Administration University of Nevada, Las Vegas
PBT lo4 TES lo4
rn
TES lo4
. A P B T
b
TES 10"
PBT lo4 TES IO-*
e i . a . * '
4-
.--
T7
TES 10"
C;R....- 3 C-'-, . l"-.I.-L.. . ,. --..4--.- "-e-^ .̂."--..".--" ...--- ------- a aBut- L. oruwryuurrya d I u r u . u urn apuib auapi ia;ui ia W G i G piGpaiGC iii l h h ! T i k ~ i i i Eii~dliii?vl EDTA with 1% sodium dodecylsulfate (TES) or 0.01 M phosphate buffer with 0.05% Tween (PBT), archived at room temperature, and analyzed by culture at To days, T3 days and 1 week intervals (To, T3 and T7 are shown). The assay consisted of serially-diluting samples in the corresponding buffer, plating on potato dextrose agar, and incubating at 25°C. Plates were enumerated after 6 days of incubation and stored at 4°C for approximately 7 days prior to taking pictures.
34
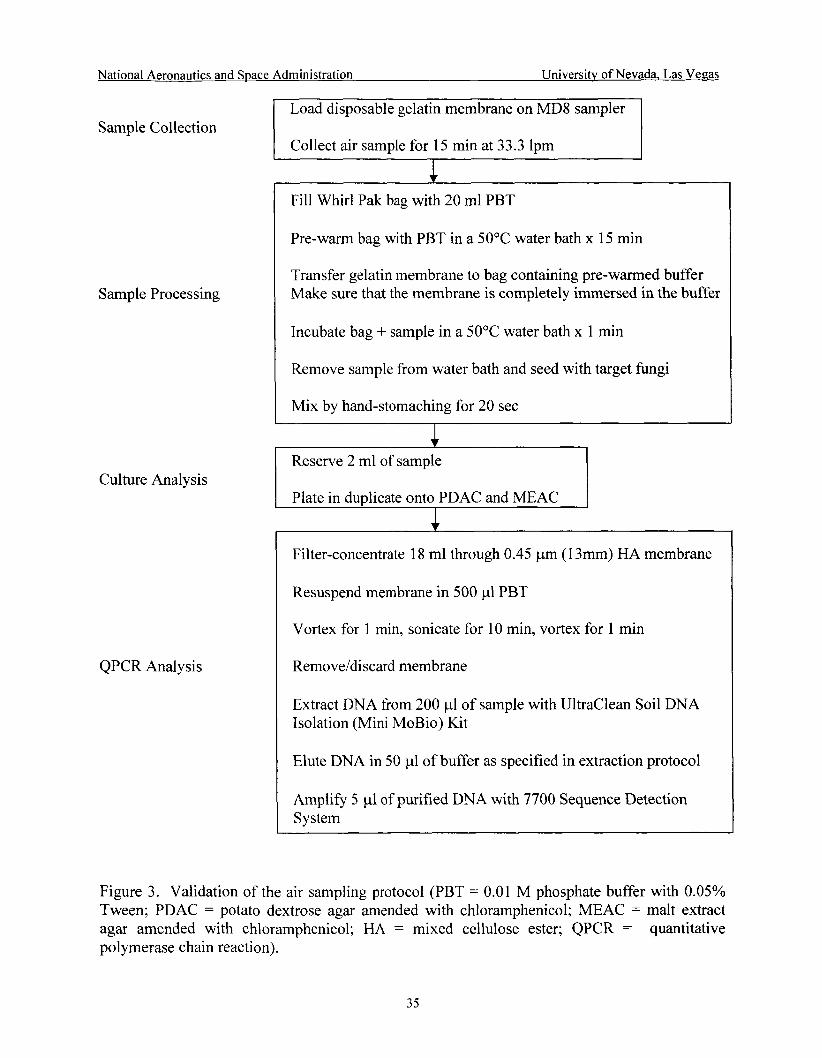
National Aeronautics and Space Administration University of Nevada, Las Vegas
Sample Collection
Sample Processing
.t Fill Whirl Pak bag with 20 ml PBT
Pre-warm bag with PBT in a 50°C water bath x 15 min
Transfer gelatin membrane to bag containing pre-warmed buffer Make sure that the membrane is completely immersed in the buffer
Incubate bag + sample in a 50°C water bath x 1 min
Remove sample from water bath and seed with target fungi
Mix by hand-stomaching for 20 sec
Reserve 2 ml of sample
Plate in duplicate onto PDAC and MEAC Culture Analysis
1
QPCR Analysis
Filter-concentrate 18 ml through 0.45 pm (1 3mm) HA membrane
Resuspend membrane in 500 pl PBT
Vortex for 1 min, sonicate for 10 min, vortex for 1 min
Remove/discard membrane
Extract DNA from 200 p1 of sample with Ultraclean Soil DNA Isolation (Mini MoBio) Kit
Elute DNA in 50 p1 of buffer as specified in extraction protocol
Amplify 5 p1 of purified DNA with 7700 Sequence Detection System
Figure 3. Validation of the air sampling protocol (PBT = 0.01 M phosphate buffer with 0.05% Tween; PDAC = potato dextrose agar amended with chloramphenicol; MEAC = malt extract agar amended with chloramphenicol; HA = mixed cellulose ester; QPCR = quantitative polymerase chain reaction).
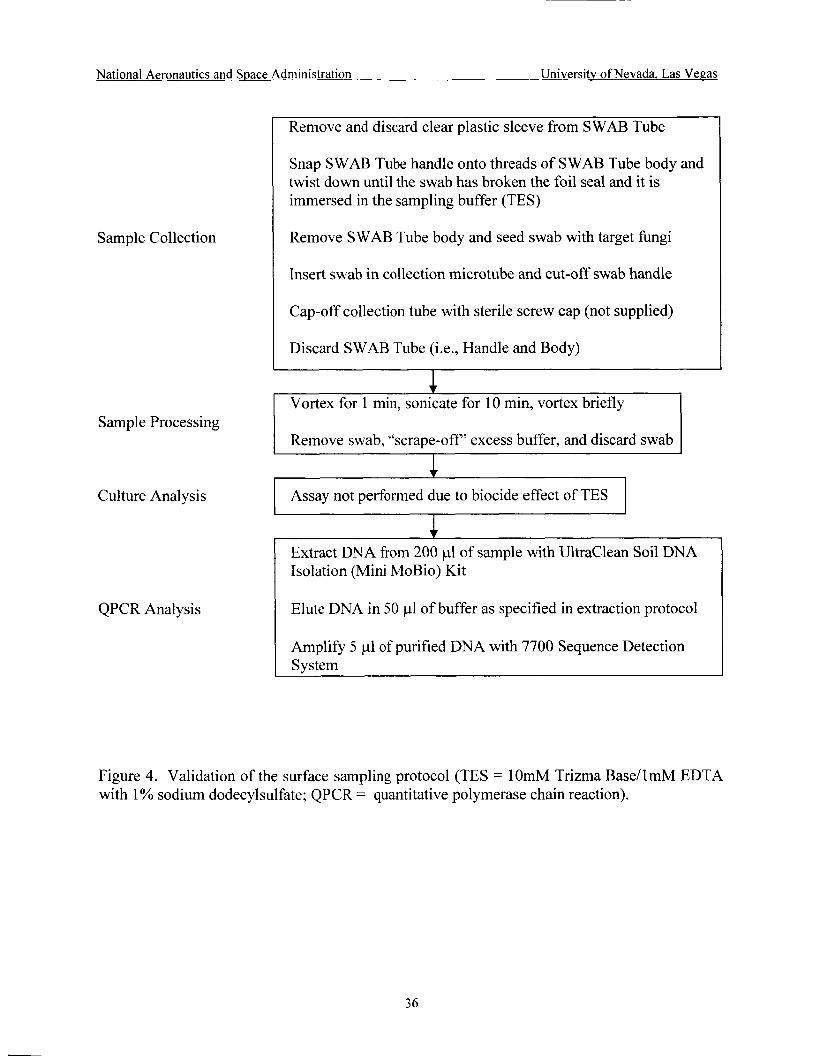
- ~-
National Aeronautics and Space Administration University of Nevada, Las Vegas
Sample Collection
Remove and discard clear plastic sleeve from SWAB Tube
Snap SWAB Tube handle onto threads of SWAB Tube body and twist down until the swab has broken the foil seal and it is immersed in the sampling buffer (TES)
Remove SWAB Tube body and seed swab with target fungi
Insert swab in collection microtube and cut-off swab handle
Cap-off collection tube with sterile screw cap (not supplied)
Discard SWAB Tube (Le., Handle and Body)
Vortex for 1 min, sonicate for 10 min, vortex briefly
Sample Processing : Remove swab, “scrape-off’ excess buffer, and discard swab
Culture Analysis I Assay not performed due to biocide effect of TES I
QPCR Analysis
~~ ~~ ~
1 Extract DNA from 200 1-11 of sample with Ultraclean Soil DNA Isolation (Mini MoBio) Kit
Elute DNA in 50 p1 of buffer as specified in extraction protocol
Amplify 5 p1 of purified DNA with 7700 Sequence Detection System
Figure 4. Validation of the surface sampling protocol (TES = lOmM Trizma Base/lmM EDTA with 1 % sodium dodecylsulfate; QPCR = quantitative polymerase chain reaction).
36
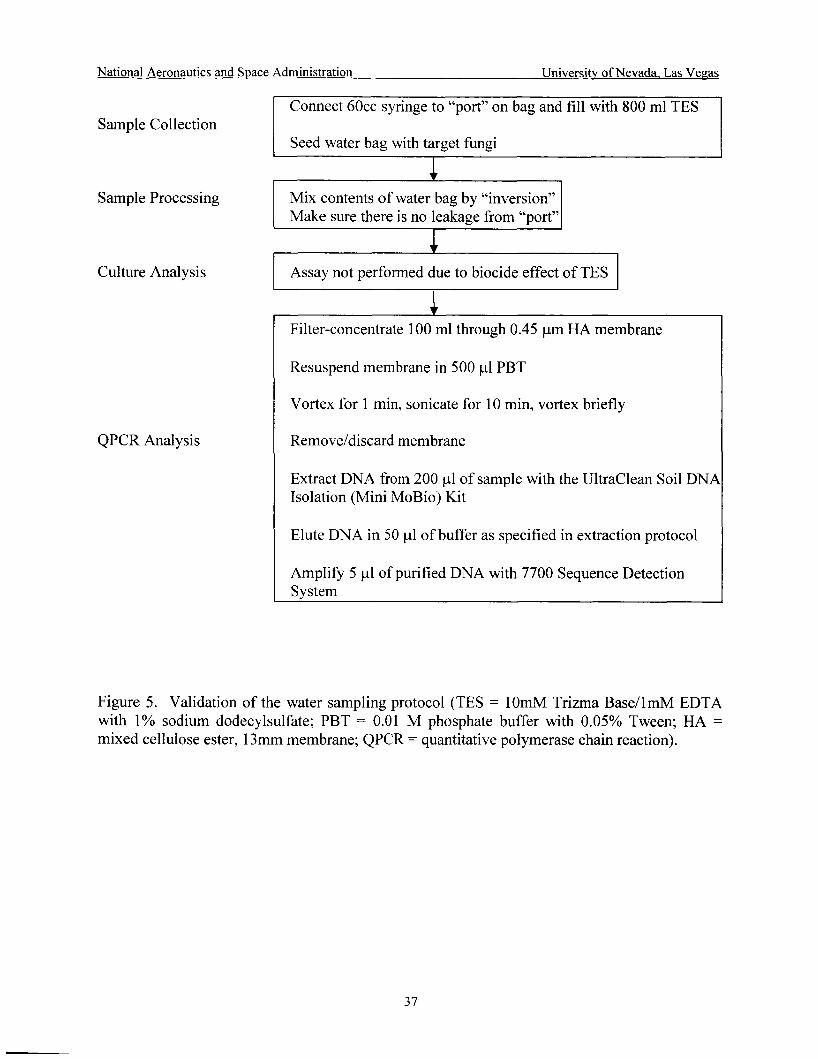
National Aeronautics and Space Administration Universitv of Nevada, Las Vegas
Sample Processing Mix contents of water bag by “inversion” Make sure there is no leakage from “port”
QPCR Analysis
Culture Analysis
Remove/discard membrane
Extract DNA from 200 p1 of sample with the Ultraclean Soil DNA Isolation (Mini MoBio) Kit
Elute DNA in 50 pl of buffer as specified in extraction protocol
Amplify 5 p1 of purified DNA with 7700 Sequence Detection System
Assay not performed due to biocide effect of TES
Figure 5. Validation of the water sampling protocol (TES = lOmM Trizma Base/lmM EDTA with 1% sodium dodecylsulfate; PBT = 0.01 M phosphate buffer with 0.05% Tween; HA = mixed cellulose ester, 1 3mm membrane; QPCR = quantitative polymerase chain reaction).
37
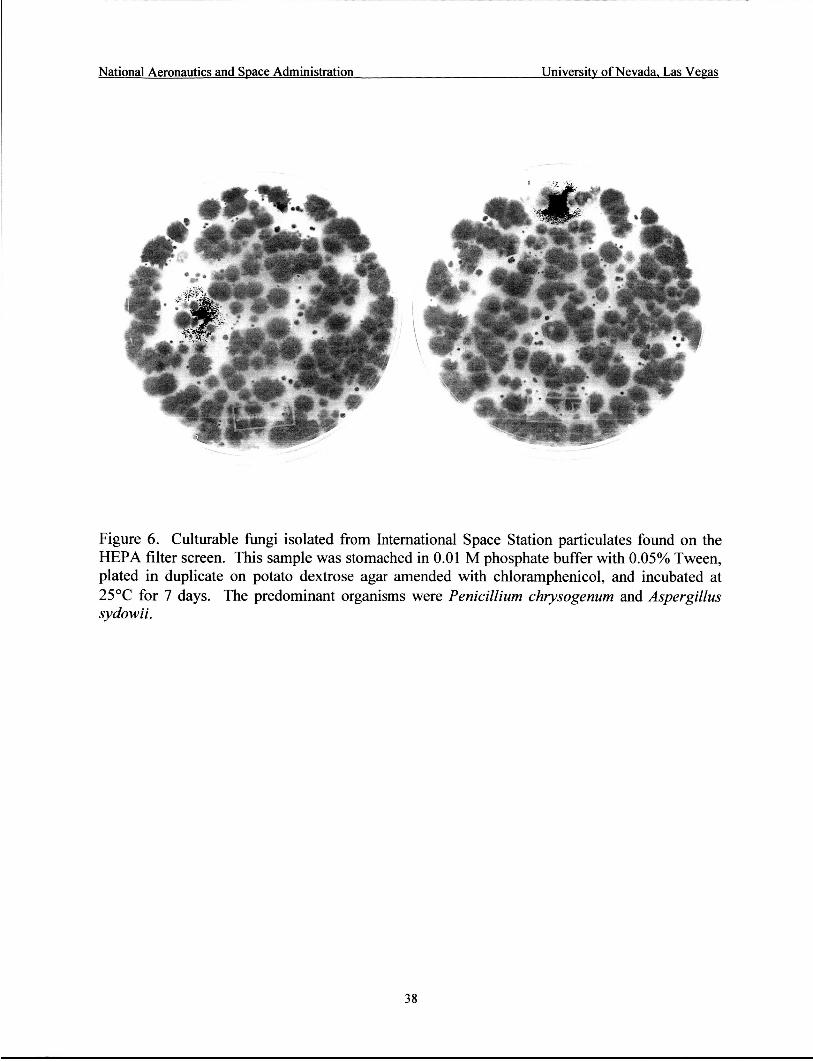
~~
National Aeronautics and Space Administration University of Nevada. Las Vegas
Figure 6. Culturable fungi isolated from International Space Station particulates found on the HEPA filter screen. This sample was stomached in 0.01 M phosphate buffer with 0.05% Tween, plated in duplicate on potato dextrose agar amended with chloramphenicol, and incubated at 25°C for 7 days. The predominant organisms were Penicillium chrysogenum and Aspergillus sydowii.
38
~~
National Aeronautics and Space Administration University of Nevada, Las Vegas
APPENDIX - ACRONYM INDEX
39
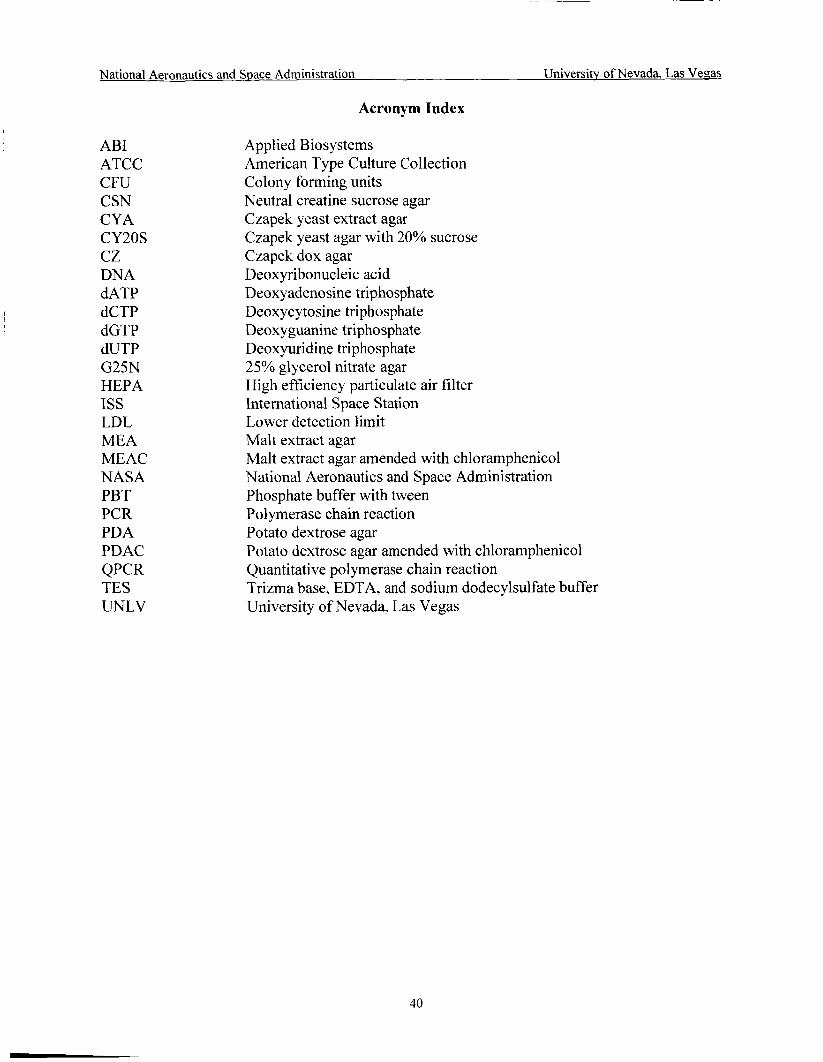
National Aeronautics and Soace Administration University of Nevada, Las Verras
Acronym Index
AB1 ATCC CFU CSN CYA CY2OS cz DNA dATP dCTP dGTP dUTP G25N HEPA ISS LDL MEA MEAC NASA PBT PCR PDA PDAC QPCR TES UNLV
Applied Biosystems American Type Culture Collection Colony forming units Neutral creatine sucrose agar Czapek yeast extract agar Czapek yeast agar with 20% sucrose Czapek dox agar Deoxyribonucleic acid Deoxyadenosine triphosphate Deoxycytosine triphosphate Deoxyguanine triphosphate Deoxyuridine triphosphate 25% glycerol nitrate agar High efficiency particulate air filter International Space Station Lower detection limit Malt extract agar Malt extract agar amended with chloramphenicol National Aeronautics and Space Administration Phosphate buffer with tween Polymerase chain reaction Potato dextrose agar Potato dextrose agar amended with chloramphenicol Quantitative polymerase chain reaction Trizma base, EDTA, and sodium dodecylsulfate buffer University of Nevada, Las Vegas
40


![Research Article jmb RevieThe concept is to use the urease activity of microorganisms [9]. When microorganisms are in contact ... characterization, microorganism, Sporosarcina pasteurii](https://img.pdfslide.net/doc/110x75/6063fdf1646658391265f051/research-article-jmb-the-concept-is-to-use-the-urease-activity-of-microorganisms.jpg)