Embed Size (px)
Citation preview

Enhanced Correspondence and Statistics for Structural
Shape Analysis: Current Research
Martin StynerDepartment of Computer Science and Psychiatry
2
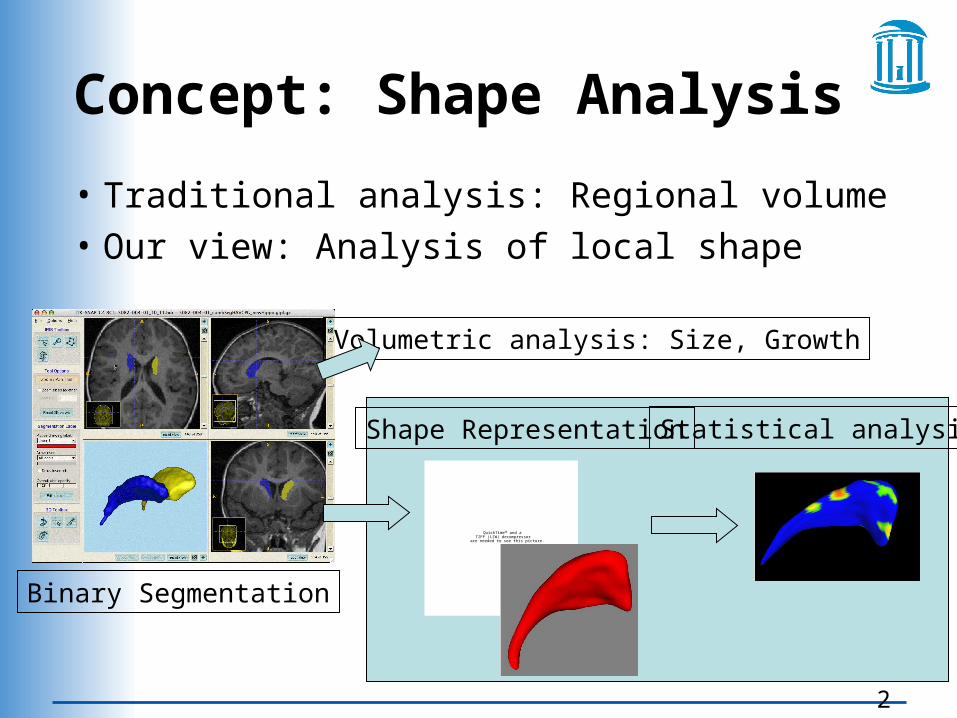
Concept: Shape Analysis
• Traditional analysis: Regional volume
• Our view: Analysis of local shape
QuickTime™ and aTIFF (LZW) decompressor
are needed to see this picture.
Binary Segmentation
Volumetric analysis: Size, Growth
Shape Representation Statistical analysis
3
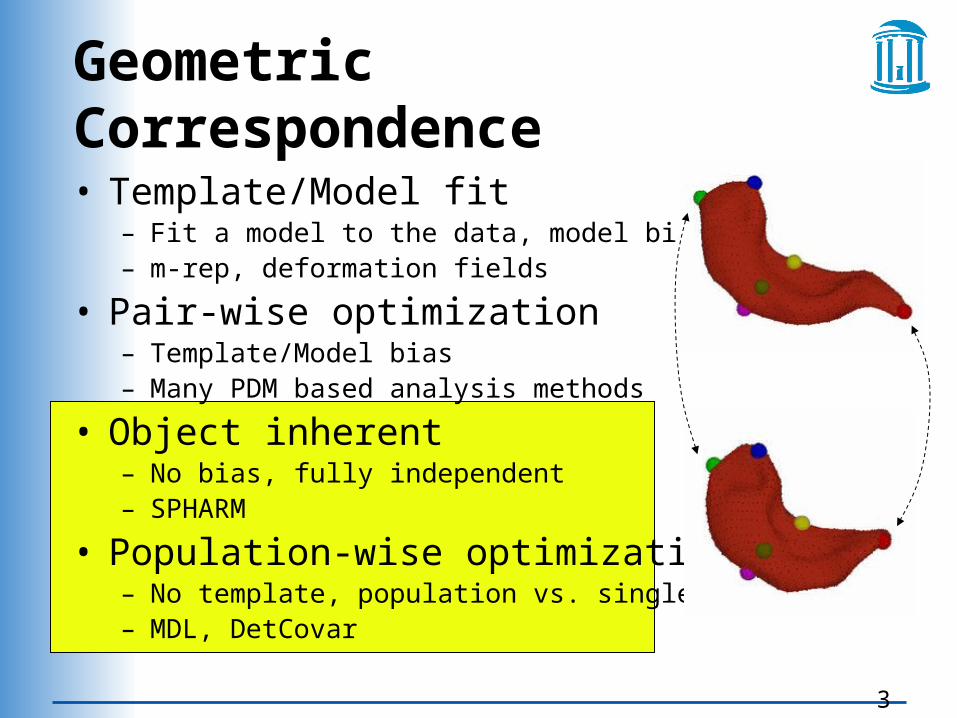
Geometric Correspondence
• Template/Model fit– Fit a model to the data, model bias– m-rep, deformation fields
• Pair-wise optimization– Template/Model bias– Many PDM based analysis methods
• Object inherent– No bias, fully independent– SPHARM
• Population-wise optimization– No template, population vs. single object– MDL, DetCovar
4
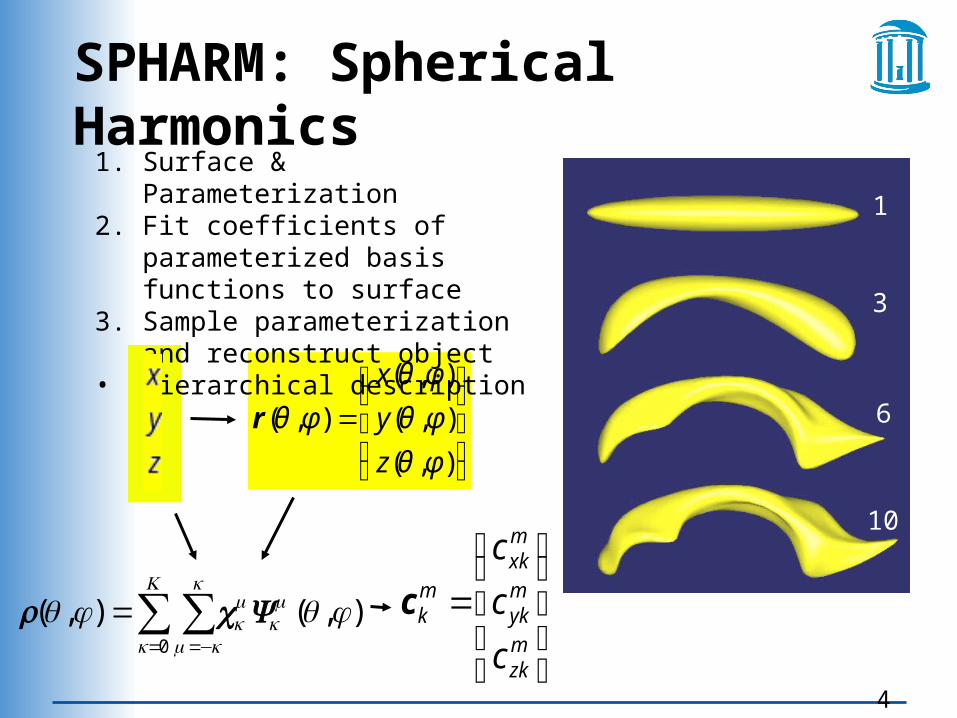
SPHARM: Spherical Harmonics
⎟⎟⎟
⎠
⎞
⎜⎜⎜
⎝
⎛=
),(
),(
),(
),(
φθ
φθ
φθ
φθ
z
y
x
r
),(),(0
φθφθ ∑∑= −=
=K
k
k
km
mk
mk Ycr
⎟⎟⎟
⎠
⎞
⎜⎜⎜
⎝
⎛
=mzk
myk
mxk
mk
c
c
c
c
1
10
3
6
1. Surface & Parameterization2. Fit coefficients of parameterized
basis functions to surface3. Sample parameterization and
reconstruct object• Hierarchical description
5
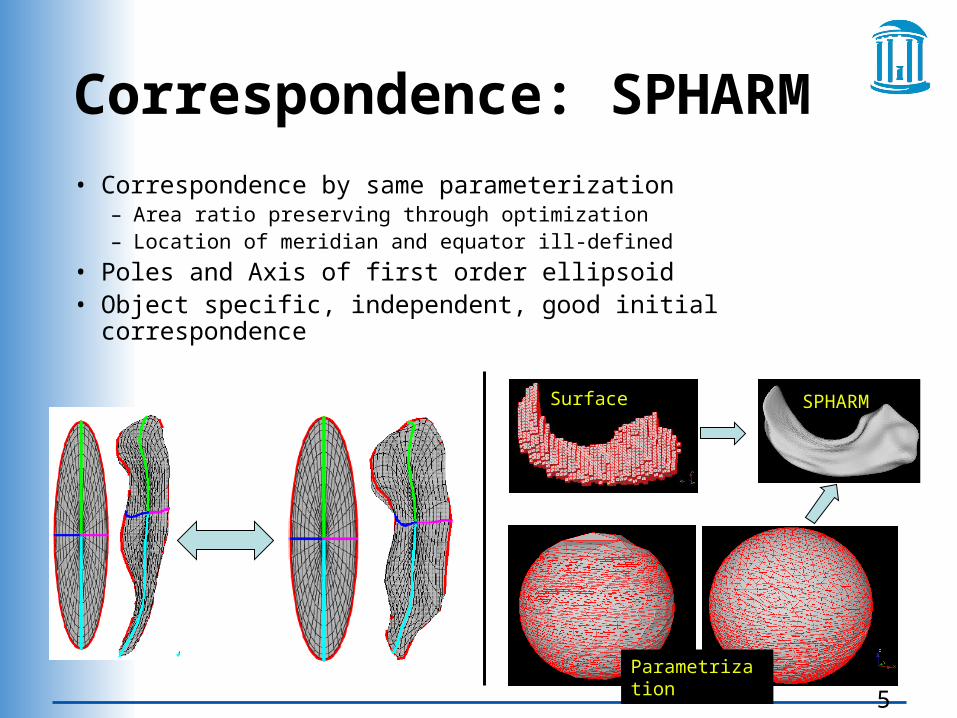
Correspondence: SPHARM
• Correspondence by same parameterization– Area ratio preserving through optimization– Location of meridian and equator ill-defined
• Poles and Axis of first order ellipsoid• Object specific, independent, good initial correspondence
Surface
Parametrization
SPHARM
6
Parameterization based Correspondence • SPHARM
– Can also be used as initialization of other methods
• Optimization of spherical parametrization– Optimize over (φ,), evaluate on surface – Template matching
• Surface geometry: Curvature + Location• Meier, Medical Image Analysis 02
– Population based:• Optimization of location/coordinate distribution• Davies, TMI 02• Our current research (Ipek Oguz)
– Fusion with SPHARM and surface geometry, fusion of all 3 methods
7
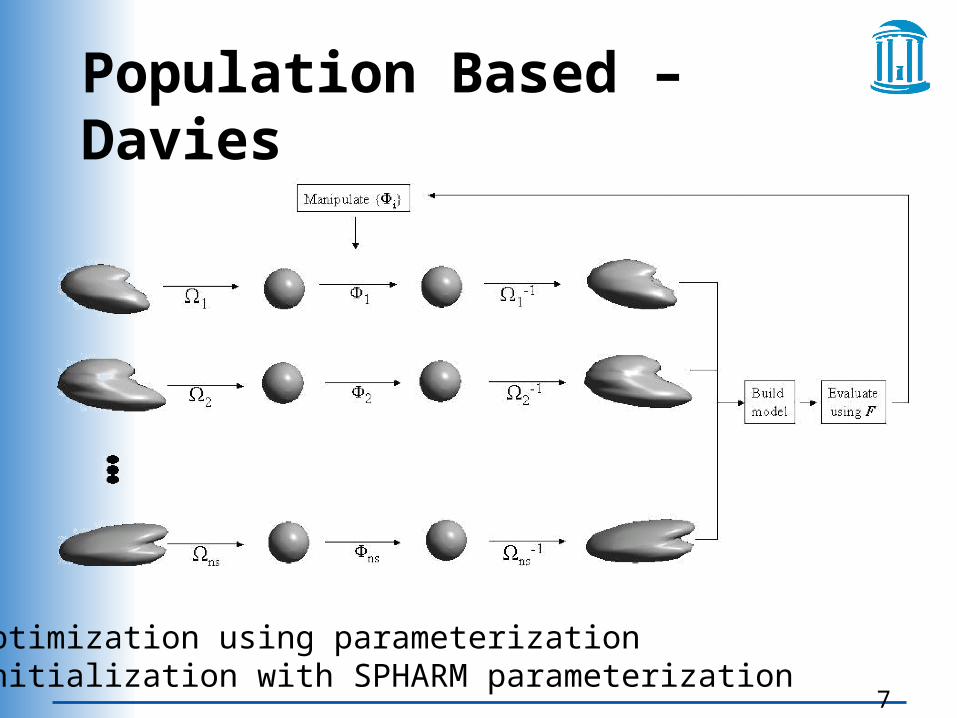
Population Based – Davies
• Optimization using parameterization• Initialization with SPHARM parameterization
8
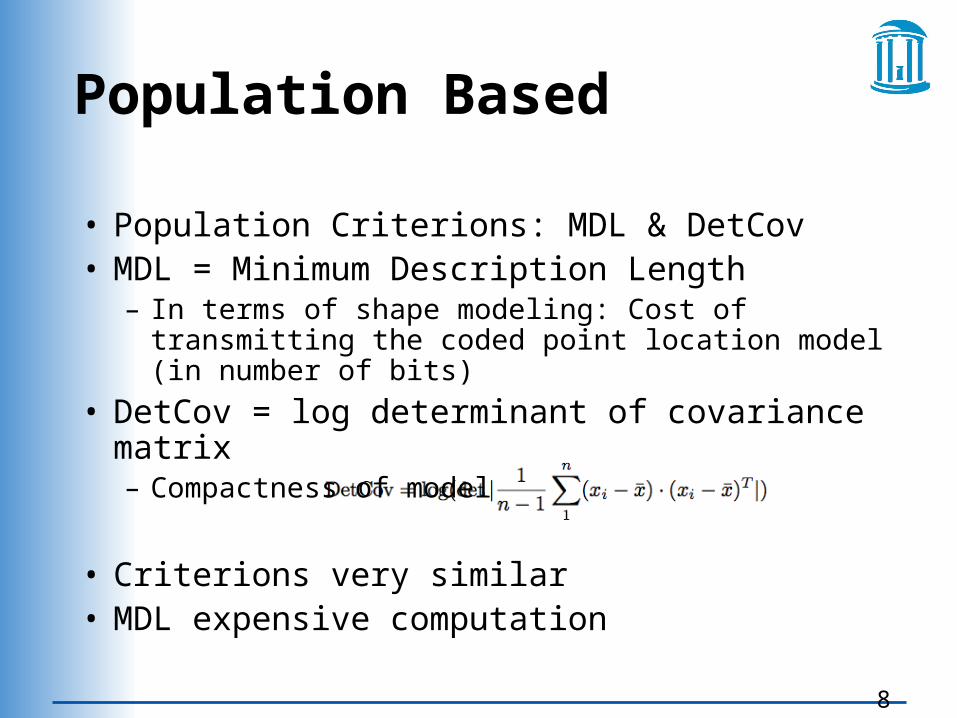
• Population Criterions: MDL & DetCov• MDL = Minimum Description Length
– In terms of shape modeling: Cost of transmitting the coded point location model (in number of bits)
• DetCov = log determinant of covariance matrix– Compactness of model
• Criterions very similar• MDL expensive computation
Population Based
9
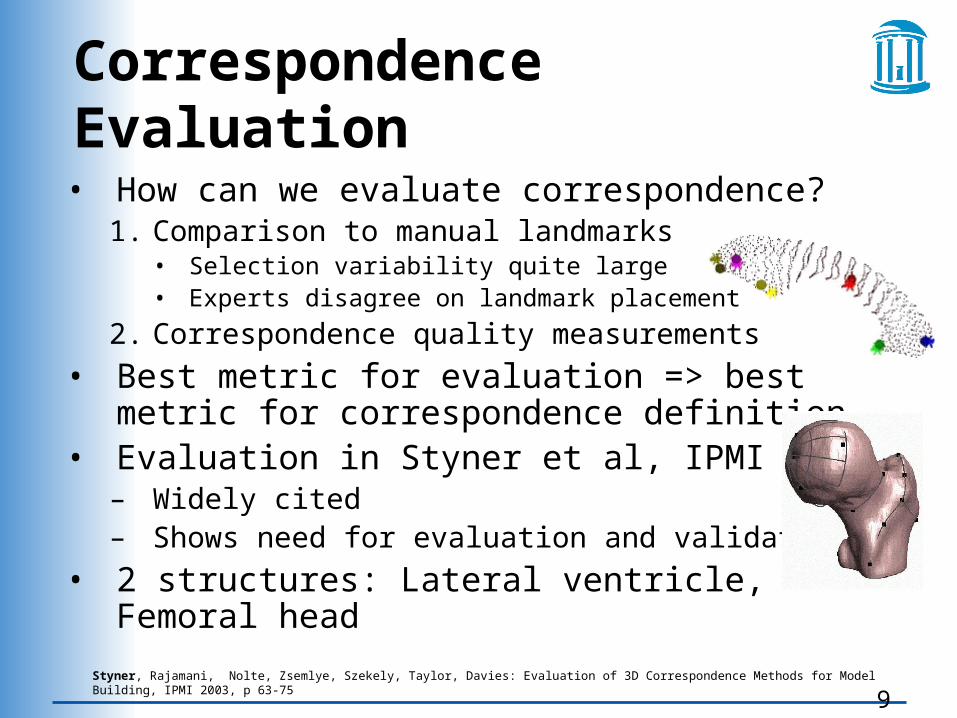
Correspondence Evaluation
• How can we evaluate correspondence?1. Comparison to manual landmarks
• Selection variability quite large• Experts disagree on landmark placement
2. Correspondence quality measurements
• Best metric for evaluation => best metric for correspondence definition
• Evaluation in Styner et al, IPMI 2003– Widely cited– Shows need for evaluation and validation
• 2 structures: Lateral ventricle, Femoral headStyner, Rajamani, Nolte, Zsemlye, Szekely, Taylor, Davies: Evaluation of 3D Correspondence Methods for Model Building, IPMI 2003, p 63-75
10
Correspondence Evaluation
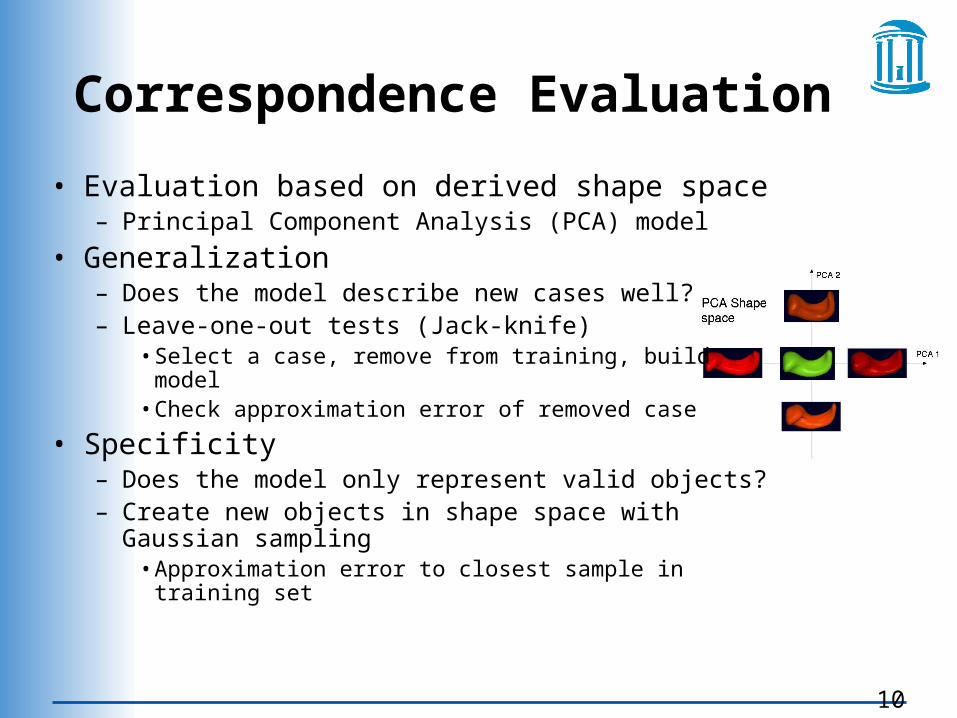
• Evaluation based on derived shape space– Principal Component Analysis (PCA) model
• Generalization– Does the model describe new cases well?– Leave-one-out tests (Jack-knife)
• Select a case, remove from training, build model• Check approximation error of removed case
• Specificity– Does the model only represent valid objects? – Create new objects in shape space with Gaussian
sampling• Approximation error to closest sample in training set
11
Correspondence Evaluation
Femur
LateralVentricle
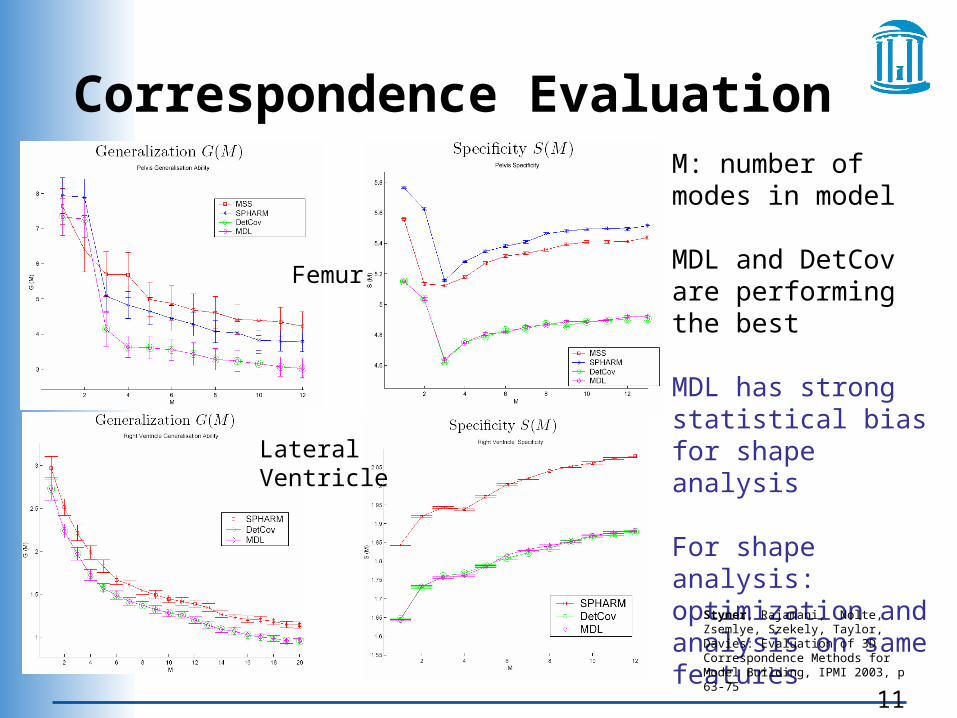
M: number of modes in model
MDL and DetCov are performing the best
MDL has strong statistical bias for shape analysis For shape analysis: optimization and analysis on same features
Styner, Rajamani, Nolte, Zsemlye, Szekely, Taylor, Davies: Evaluation of 3D Correspondence Methods for Model Building, IPMI 2003, p 63-75
12
Population Based Curvature
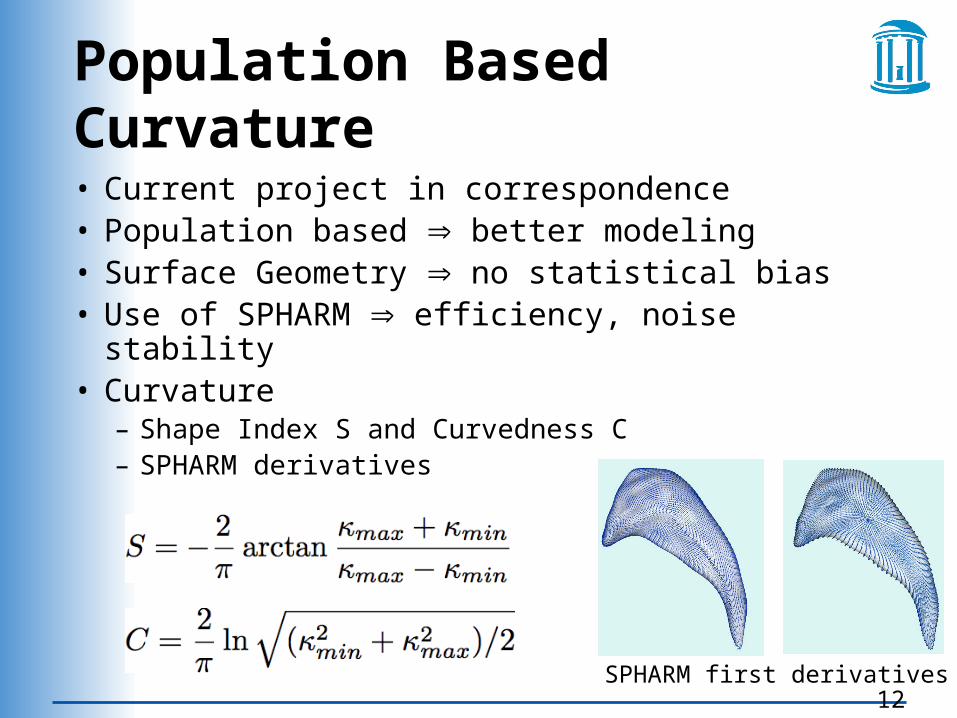
• Current project in correspondence• Population based better modeling• Surface Geometry no statistical bias• Use of SPHARM efficiency, noise stability• Curvature
– Shape Index S and Curvedness C– SPHARM derivatives
SPHARM first derivatives
13
Statistical Analysis
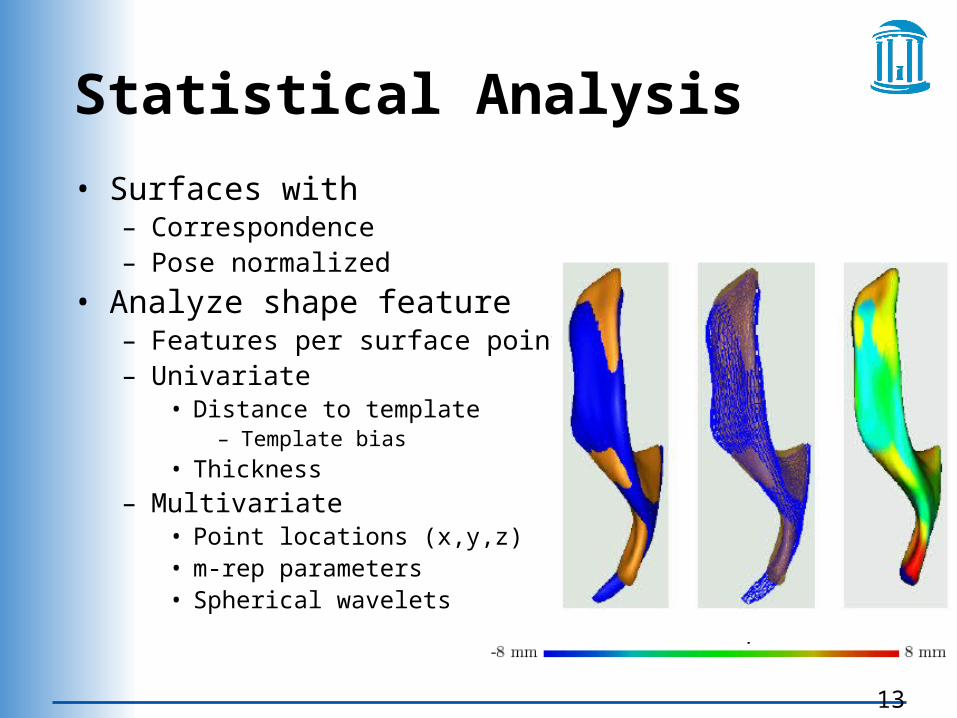
• Surfaces with– Correspondence – Pose normalized
• Analyze shape feature– Features per surface point– Univariate
• Distance to template– Template bias
• Thickness
– Multivariate• Point locations (x,y,z)• m-rep parameters• Spherical wavelets
14
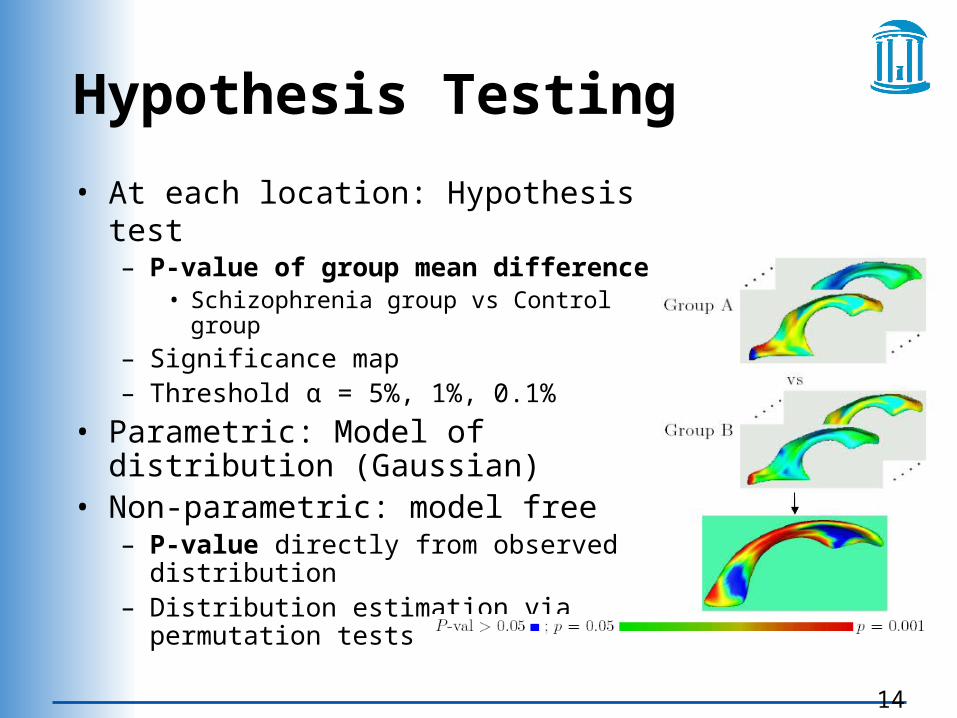
Hypothesis Testing
• At each location: Hypothesis test– P-value of group mean difference
• Schizophrenia group vs Control group
– Significance map– Threshold α = 5%, 1%, 0.1%
• Parametric: Model of distribution (Gaussian)
• Non-parametric: model free– P-value directly from observed distribution– Distribution estimation via permutation tests

15
Many, Many, Too Many…
• Many local features computed independently– 1000 - 5000 features
• Even if features are pure noise, still many locations are significant
• Overly optimistic Raw p-values • Multiple comparison problem
– P-value correction• False-Positive Error control• False Detection Rate
– General Linear Mixed Modeling• Model covariance structure• Dimensionality reduction• Work with Biostatistics
– MICCAI 2003, M-rep
16
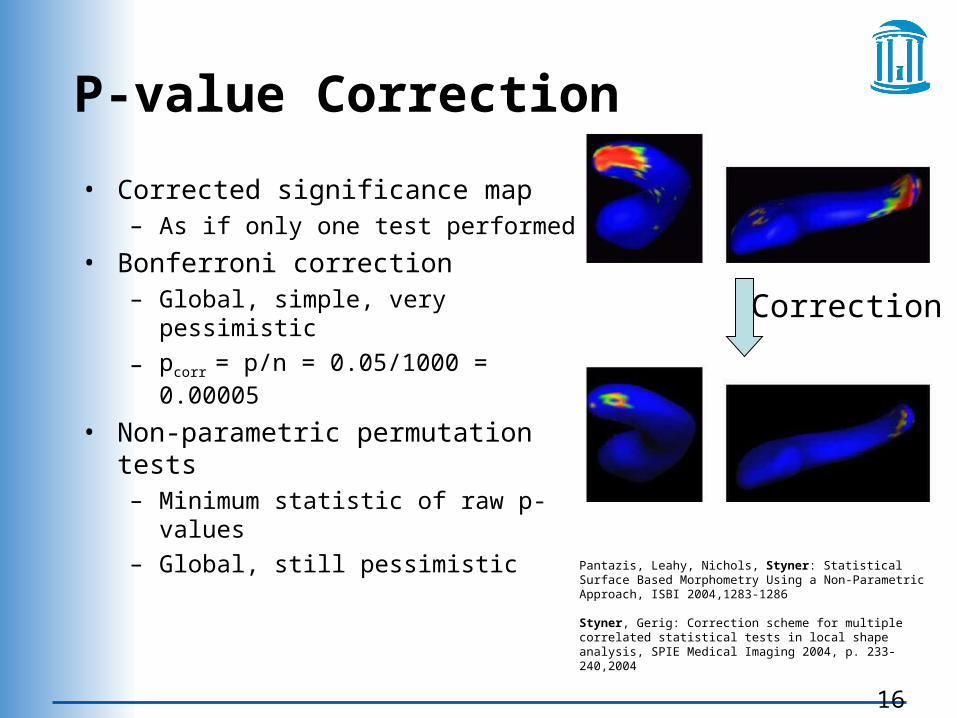
P-value Correction
• Corrected significance map– As if only one test performed
• Bonferroni correction– Global, simple, very pessimistic
– pcorr = p/n = 0.05/1000 = 0.00005
• Non-parametric permutation tests– Minimum statistic of raw p-values
– Global, still pessimistic
Pantazis, Leahy, Nichols, Styner: Statistical Surface Based Morphometry Using a Non-Parametric Approach, ISBI 2004,1283-1286
Styner, Gerig: Correction scheme for multiple correlated statistical tests in local shape analysis, SPIE Medical Imaging 2004, p. 233-240,2004
Correction
17
Ongoing Research
• False Detection Rate (FDR): more relaxed, fMRI, VBM– Currently being added to software
• Program design: Software not based on ITK statistics framework
• Next:– Covariates: No account of covariates– Age, Medication, Gender– General Linear Model, per feature at each location– multivariate analysis of fitted parameters

18
The End
• Questions?
19
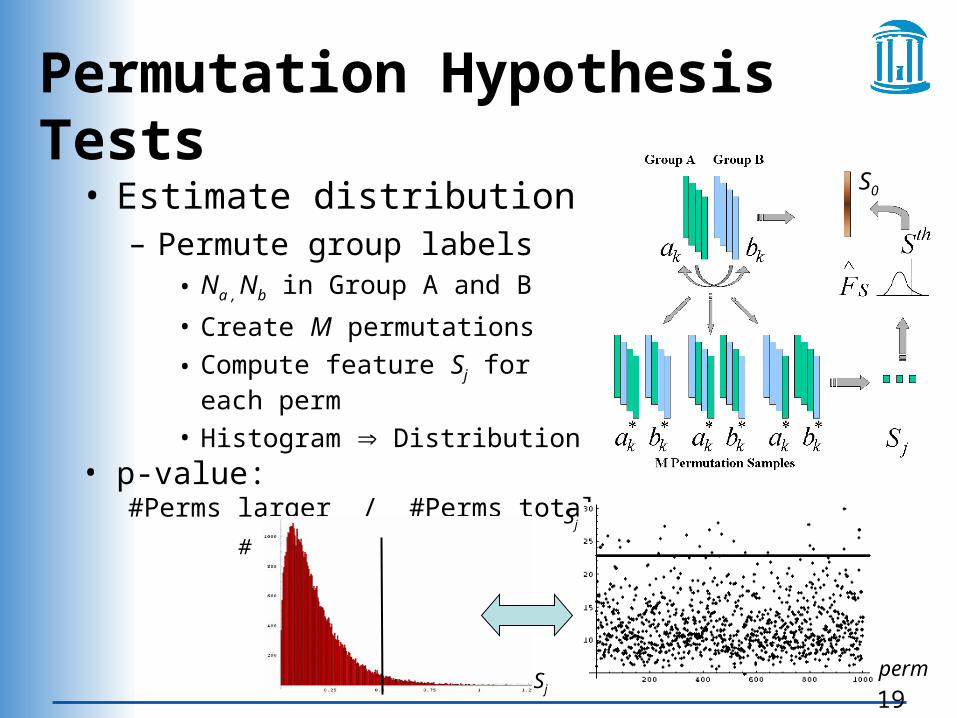
Permutation Hypothesis Tests
• Estimate distribution– Permute group labels
• Na , Nb in Group A and B
• Create M permutations
• Compute feature Sj for each perm
• Histogram Distribution• p-value:
#Perms larger / #Perms total
S0
Sj
Sj
perm
#