Embed Size (px)
Citation preview

Enhanced policy scenarios for major emitting countriesANALYSIS OF CURRENT AND PLANNED CLIMATE POLICIES, AND SELECTED ENHANCED MITIGATION MEASURES
Policy Study


Enhanced policy scenarios for major emitting countries


Enhanced policy scenarios for major emitting countriesAnalysis of current and planned climate policies, and selected enhanced mitigation measures
This report provides an overview of projected greenhouse gas emissions in 13 major emitting countries/regions (Australia, Brazil, Canada, China, European Union, India, Indonesia, Japan, Mexico, the Russian Federation, South Korea, Turkey, and the United States) up to 2030, taking into account the emission trajectories based on current and planned policies, and selected enhanced mitigation measures.

Enhanced policy scenarios for major emitting countries. Analysis of current and planned climate policies, and selected enhanced mitigation measures© PBL Netherlands Environmental Assessment AgencyThe Hague, 2015ISBN: 978-94-91506-92-5PBL publication number: 1631
AuthorsMichel den Elzen (PBL), Hanna Fekete (NewClimate Institute), Annemiek Admiraal (PBL), Nicklas Forsell (IIASA), Niklas Höhne (NewClimate Institute), Anu Korosuo (IIASA), Mark Roelfsema (PBL), Heleen van Soest (PBL), Karlien Wouters (Ecofys), Thomas Day (NewClimate Institute), Markus Hagemann (NewClimate Institute), Andries Hof (PBL), Aline Mosnier (IIASA)
Contributing authorsPetr Havlik (IIASA), Mykola Gusti (IIASA), Michael Obersteiner (IIASA) and Lindee Wong (Ecofys)
Corresponding [email protected]
GraphicsPBL Beeldredactie
English-language editingAnnemieke Righart
Production coordinationPBL Publishers
LayoutTextcetera, The Hague
This report has been prepared by PBL/NewClimate Institute/IIASA/Ecofys under contract to DG CLIMA (Service Contract
n°071303/2011/662342/SER/CLIMA.A4 – Renewal (Ares (2013)3407741)) renewed in November 2013.
The information and views set out in this study are those of the authors and do not necessarily reflect the official opinion of the
Commission. The Commission does not guarantee the accuracy of the data included in this study. Neither the Commission nor any
person acting on the Commission’s behalf can be held responsible for the use of any information from this study.
This publication can be downloaded from: www.pbl.nl/en. Parts of this publication may be reproduced, providing the source is
stated, in the form: Elzen, M. den et al. (2015), Enhanced policy scenarios for major emitting countries. Analysis of current and planned climate
policies, and selected enhanced mitigation measures, The Hague: PBL Netherlands Environmental Assessment Agency.
PBL Netherlands Environmental Assessment Agency is the national institute for strategic policy analyses in the fields of the
environment, nature and spatial planning. We contribute to improving the quality of political and administrative decision-making,
by conducting outlook studies, analyses and evaluations in which an integrated approach is considered paramount. Policy relevance
is the prime concern in all our studies. We conduct solicited and unsolicited research that is both independent and always scientifi-
cally sound.
This project was funded by the European Union.

Contents
Main findings 6
Executive summary 81 Introduction 82 Results per country 93 Results of enhanced policies (top-down scenario) 284. The impact of mitigation enhancement measures on
narrowing the emission gap to achieve the 2 °C target by 2030 31
1 Introduction 32
2 Country sections 362.1 Australia 372.2 Brazil 432.3 Canada 512.4 China 562.5 European Union 642.6 India 702.7 Indonesia 772.8 Japan 842.9 Mexico 892.10 The Russian Federation 942.11 South Korea 1002.12 Turkey 1052.13 United States 109
References 116
Appendix A 125
Appendix B 130

6
| Enhanced policy scenarios for major emitting countries
Main findings
This report provides an overview of projected greenhouse gas emissions in 13 major emitting countries/regions (Australia, Brazil, Canada, China, the European Union, India, Indonesia, Japan, Mexico, the Russian Federation, South Korea, Turkey, and the United States) up to 2030, taking into account the emission trajectories based on current and planned policies and a selection of enhancement measures. In 2010, these countries/regions were responsible for about 65% of global greenhouse gas emissions.
The main findings of this study are:– The degree to which countries/regions are likely to
achieve their 2020 pledges under current policies varies: of those considered in this report, Brazil, China, the EU, India, Japan and the Russian Federation are likely to achieve their pledges through existing policies. Australia, Canada, Indonesia, Mexico, South Korea and the United States require additional measures to achieve their 2020 pledges. The United States and Mexico could achieve their pledges if planned policies are effectively implemented. Turkey has not submitted a mitigation pledge.
– In all the countries/regions considered, significant further reductions are possible through a selection of policy enhancement measures that are in line with national priorities. By replicating ‘best-in-class’ policies or progressing to identified benchmarks, it is possible to significantly enhance current efforts so that all countries/regions considered here would achieve or overachieve their pledges by 2020. The selection of policies and measures is illustrative and not exhaustive.
– Even though current and planned policies are projected to have an effect on emissions, increases would still occur in Australia, China, India, Indonesia, Mexico and Turkey until 2030, due to their projected high economic growth. Emissions in Brazil, Canada, South Korea, the Russian Federation and the United States would remain stable approximately at current
levels. In Japan and the EU, emissions are projected to decrease further under current policies.
– With the selected enhancement measures included here, China and Mexico would stabilise emissions by 2030, at the latest. The EU, Japan, South Korea, and the United States would achieve a pathway with further reductions in line with their long-term targets. Emissions in India, Indonesia and Turkey would continue to increase strongly, but less so than under current and planned policies.
– The priority sectors for current mitigation efforts and the selected enhancement measures vary per country. In most countries/regions, the energy sector has the highest emission levels so that mitigation efforts in this sector – notably that of reducing coal use in power generation – could lead to rapid emission reductions. Other important measures include improving efficiency in transport, industry, and buildings. Apart from reducing greenhouse gases, these measures have significant co-benefits such as improving air quality and energy saving. For Brazil and Indonesia, measures in the land-use sector are of great importance, given the sector’s current high share in total emissions, but also because that is expected lead to significant environmental and social benefits.
– Looking only at 13 major emitting countries/regions, the enhanced policy scenarios in this report could reduce emissions by 6.1 GtCO2e by 2030, compared to under current policies. This is roughly a third of the difference in global emission levels between a scenario consistent with the 2 °C limit and a current policies scenario based on the UNEP’s Emissions Gap Report 2014 (UNEP, 2014). By 2020, reductions of up to 2.3 GtCO2e below what can be expected from current policies would be possible. Hence, our selected enhancement measures for these 13 countries/regions (representing about 65% of global emissions in 2010) will not be sufficient to stay below the target of 2 °C maximum global temperature increase.

7Main findings |
– Uncertainty around future estimates remains high. For example in Japan, decisions on the future of nuclear energy will strongly influence the development of emissions in the power sector. Whether South Korea will achieve its unconditional pledge depends on the enforcement of their emissions trading system. In Australia, the effect of policies replacing the carbon pricing mechanism is difficult to assess. China and India have pledges indexed to economic growth, implying that the absolute emission target level is very uncertain. Emission projections for Turkey are subject to considerable uncertainty which is related to economic growth. In Indonesia, emissions from land use, which are very uncertain, strongly determine total emission projections.
8
| Enhanced policy scenarios for major emitting countries
Executive summary
1 Introduction
This report provides an overview of projected greenhouse gas emissions in 13 major emitting countries/regions (Australia, Brazil, Canada, China, European Union, India, Indonesia, Japan, Mexico, the Russian Federation, South Korea, Turkey and the United States) up to 2030, taking into account the emission trajectories based on the most effective current and planned climate and energy policies, as well as selected enhanced mitigation measures. Earlier studies have explored the extent to which major economies are on track to achieving their 2020 pledges in the Cancún Agreements made under the United Nations Framework Convention on Climate Change (UNFCCC). This report extends these earlier analyses for 13 countries, in several ways. First, the effect of most effective current policies is analysed, in addition to planned ones. As policies are subject to change, this report represents the current state of affairs. Second, this report analyses the impact of a selection of enhanced mitigation measures that are related to current national priorities. Third, it projects the impact of these current, planned, and enhanced policies up to 2030. Finally, an estimation is presented of the aggregated emission reduction that could result from the enhanced policies to narrow the gap between the global emission levels in 2025 and 2030 consistent with achieving the climate target of 2 °C, and those that would result from current and planned policies.
The impact of the most effective current and planned policies on greenhouse gas emissions was estimated by Ecofys & NewClimate Institute, IIASA and PBL. The selection of current and planned policies was based on literature research and expert knowledge. Ecofys & NewClimate Institute based their calculations on existing scenarios from national and international studies (e.g. IEA’s World Energy Outlook 2014), as well as their own calculations of the impact of individual policies in
various subsectors. PBL based their calculations on the FAIR policy and TIMER energy models, and IIASA’s were based on their global land-use model GLOBIOM and global forest model G4M.
A new element in this analysis is the inclusion of enhanced policy scenarios. This study presents two variants of these scenarios:1. Enhanced bottom-up policy scenario: Bottom-up
analysis of selected country-specific mitigation policies in promising areas for enhancement measures, given the relevance and opportunities in a national context (e.g. co-benefits)
2. Enhanced top-down policy scenario: Implementation of sector-specific best available technologies.
Calculations for the enhanced bottom-up policy scenario were done by Ecofys & NewClimate Institute (based on existing scenarios) and PBL (based on FAIR policy and TIMER energy models). The top-down scenario calculations were done by PBL, using the PBL FAIR policy and the TIMER energy models for most of the 13 major emitting countries/regions. Both bottom-up and top-down scenario calculations were supplemented with those on land-use and agricultural policies using IIASA’s global land-use model GLOBIOM and global forest model G4M. Emission projections for all policy scenarios were extended to 2030, based on existing scenarios and PBL TIMER model calculations and, where applicable, on current and scenario targets for 2030.
The main findings regarding the current and planned policies and the enhanced bottom-up policy scenario are presented below, followed by the main findings from the enhanced top-down scenario. The last section of this summary presents the aggregate effect under the enhanced police scenarios (for both bottom-up and top-down) on narrowing the emission gap to achieve the 2 °C temperature target.

9Executive summary |
It should be noted that the bottom-up and top-down ‘enhanced policy’ scenarios aim to show that by replicating ‘best-in-class’ policies or progressing to identified benchmarks, it is possible to significantly enhance current efforts. The selection of policies and measures is illustrative and not exhaustive. The selected enhancement measures are still insufficient to stay below 2 °C global temperature increase, or to achieve long-term goals as adopted by some countries.
2 Results per country
This section summarises the results per country, for both current and planned policies, and under the enhanced bottom-up policy scenario. The emission projections under the enhanced top-down policy scenario for the selected countries/regions are also shown in the figures below, and are described in more detail in Section 3. It should be noted that Australia, Brazil, India and the United States are the only countries in this analysis for which a clear distinction has been made between current and planned policies. This section also briefly describes the co-benefits and opportunities in implementing these options for mitigation enhancement. Finally, the presented countries/regions’ shares of global greenhouse gas emissions (including LULUCF1) of 2010 are calculated using a global emission level of 49.5 GtCO2e for 2010 (Figure SPM.1, IPCC, 2014), as also used by UNEP (2014). The EDGAR database gives 2010 emissions of 50.9 GtCO2e; this difference is mainly due to differences in LULUCF emissions. It should be noted that, for the Annex I countries excluding Australia and the United States, emission projections are presented excluding those from LULUCF, due to the uncertainties around future LULUCF emissions and accounting rules. For all other countries, the results are presented including LULUCF emissions.
AustraliaUnder current policies, Australia’s emissions (including those from LULUCF) are estimated to be between 650 and 665 million tonnes of carbon dioxide equivalent emissions2 (MtCO2e) by 2020 (16% to 19% above 2010 levels) and 670 to 760 MtCO2e by 2030 (20% to 36% above
2010 levels). The expected increase, in contrast to earlier projections, is mainly due to the repeal of the Carbon Pricing Mechanism in August 2014. Australia is currently also considering to cut the Renewable Energy Target, a financial incentive that has successfully stimulated the installation of renewable energy over the last decade, which would further increase emissions. Additional measures in renewable electricity generation and reintroducing an ambitious carbon pricing mechanism may reduce emissions to a level of between 430 and 625 MtCO2e by 2030 (from 24% below to 12% above 2010 levels), dependent on the assumed price levels. Only the lower end of the range would possibly bring Australia’s emissions back onto a pathway of achieving their earlier committed target for 2050 of 80% below 2000 levels. Increasing renewable electricity generation could have co-benefits, such as stimulating economic development in remote areas.
BrazilUnder current policies, Brazil is expected to reduce emissions by about 10% to 13% below 2010 levels, by 2020, thereby achieving its pledged emission level. Policies on the forestry sector have a significant impact on total emissions; in particular the enforcement of the Brazilian Forest Code and efforts to reduce deforestation in the Amazon and Cerrado regions. The impact of the proposed measures in Cerrado depends on the success of policy implementation. If all current and planned policies are successful, emissions (including those from LULUCF) may reach 9% to 16% below 2010 levels by 2030. The identified enhancement options for achieving additional emission reductions are mainly in the LULUCF sector (including enhancement measures related to cattle intensification) and in the transport sector. Measures in these sectors may further decrease emissions to levels of 15% to 26% below 2010 levels, by 2030. Some of these policies have co-benefits; in particular in improvements in cattle management and cattle product output. Examples of such co-benefits connected to those improvements are the smaller land requirement to produce the same amount of output, thus sparing land for other uses, and reduced deforestation.

10 | Enhanced policy scenarios for major emitting countries
Figure 1
1990 2000 2010 2020 2030
0
200
400
600
800
1000Mt CO2 eq per year
Source: PBL FAIR/TIMER model; Ecofys & NewClimate Institute calculations
pbl.n
l
History Current policies
Planned policies
Enhanced policy scenario (bottom-up)
Enhanced policy scenario (top-down)
Pledge
Kyoto target
Including CO2 emissions from land use
Impact of climate policies on greenhouse gas emissions in Australia
1990 2000 2010 2020 2030
0
200
400
600
800
1000Mt CO2 eq per year
pbl.n
l
Excluding CO2 emissions from land use
1990 2000 2010 2020 2030
0
200
400
600
800
1000Mt CO2 eq per year
pbl.n
l
CO2 emissions from land use
Historical greenhouse gas emissions (excluding LULUCF) based on national inventories submitted to UNFCCC, and LULUCF emissions from Climate Change Authority (2014). Section 3 describes the details of the enhanced (top-down) policy scenario.
Table 1Impact of climate policies on greenhouse gas emissions (including LULUCF) in Australia
2010 GHG emissions, incl. LULUCF
Current policies Selection of possible mitigation enhancement measures (bottom-up scenario)
560 MtCO2e1.1% of global emissions
25.1 tCO2e/capita
– Renewable energy targets (mix and capacity)– Closure of 2,000 MW brown coal-fired power
plants and replacement by highly efficient gas-fired power plants
Result (absolute; relative to 2010 levels):650 to 665 MtCO2e; 16% to 19% by 2020670 to 760 MtCO2e; 20% to 36% by 203025.2 to 25.9 tCO2e/capita by 202023.1 to 26.3 tCO2e/capita by 2030
– Enhanced renewable energy targets– Reintroduction of carbon pricing mechanism– Phase-down of consumption and production of
hydrofluorocarbonsResult (absolute; relative to 2010 levels):520 to 615 MtCO2e; -7% to 10% by 2020430 to 625 MtCO2e; -24% to 12% by 203020.3 to 23.9 tCO2e/capita by 202014.9 to 21.6 tCO2e/capita by 2030
Planned policies
– Reduce the target for large-scale renewable energy installations
Result (absolute; relative to 2010 levels):660 to 680 MtCO2e; 18% to 22% by 2020765 to 775 MtCO2e; 37% to 39% by 203025.7 to 26.3 tCO2e/capita by 202026.4 to 26.8 tCO2e/capita by 2030

11Executive summary |
Table 2Impact of climate policies on greenhouse gas emissions (including LULUCF) in Brazil
2010 GHG emissions, incl. LULUCF
Current policies Selection of possible mitigation enhancement measures (bottom-up scenario)
1,690 MtCO2e3.4% of global emissions
8.7 tCO2e/capita
– Pledge anchored in national law– Forestry policy (Brazilian Forest Code for Amazon
region and Cerrado region)– Pasture management– 10 year National Energy Expansion Plan
(renewable energy targets)– Transport: National Plan on Climate ChangeResult (absolute; relative to 2010 levels):1,470 to 1,520 MtCO2e; -10% to -13% by 20201,490 to 1,540 MtCO2e; -9% to -12% by 20307.0 to 7.2 tCO2e/capita by 20206.7 to 6.9 tCO2e/capita by 2030
– Intensification cattle farming– Avoid recarbonisation in electricity sector– Improved vehicle efficiency standards– Phase-down of hydrofluorocarbonsResult (absolute; relative to 2010 levels):1,330 to 1,445 MtCO2e; -15% to -22% by 20201,260 to 1,435 MtCO2e; -15% to -26% by 20306.3 to 6.9 tCO2e/capita by 20205.7 to 6.4 tCO2e/capita by 2030
Planned policies
– Forestry policy (Brazilian Forest Code for the Cerrado region and rest of Brazil)
Result (absolute; relative to 2010 levels):1,390 to 1,520 MtCO2e; -10% to -18% by 20201,425 to 1,540 MtCO2e; -9% to -16% by 20306.6 to 7.2 tCO2e/capita by 20206.4 to 6.9 tCO2e/capita by 2030
Figure 2
1990 2000 2010 2020 2030
0
500
1000
1500
2000
2500Mt CO2 eq per year
Source: PBL FAIR/TIMER model; Ecofys & NewClimate Institute calculations; IIASA GLOBIOM/G4M model
pbl.n
l
History Current policies
Planned policies
Enhanced policy scenario (bottom-up)
Enhanced policy scenario (top-down)
Pledge
Including CO2 emissions from land use
Impact of climate policies on greenhouse gas emissions in Brazil
1990 2000 2010 2020 2030
0
500
1000
1500
2000
2500Mt CO2 eq per year
pbl.n
l
Excluding CO2 emissions from land use
1990 2000 2010 2020 2030
0
500
1000
1500
2000
2500Mt CO2 eq per year
pbl.n
l
CO2 emissions from land use
Historical greenhouse gas emissions (excluding LULUCF) are based on inventory data submitted to the UNFCCC (until 2005), energy-related CO2 emissions from IEA (2013a), non-energy-related emissions from EDGAR 4.2 (JRC and PBL, 2012) and LULUCF emissions from FAOSTAT data (http://faostat3.fao.org/faostat-gateway).

12 | Enhanced policy scenarios for major emitting countries
CanadaUnder current policies, Canada’s emissions are projected to be about 720 to 760 MtCO2e by 2020 and 665 to 815 MtCO2e by 2030 (excluding LULUCF emissions). Projected emissions that include those from LULUCFs are lower (see Table 3), but this highly depends on the projected LULUCF emissions, which are uncertain. Canada’s policy with the largest projected effect is that on the fuel efficiency standard for passenger vehicles, which is harmonised with US standards and will be introduced in two phases. Another policy is the carbon standard for newly built coal-fired power plants. This standard is projected to have only a small effect on 2020 emission levels, as it does not affect existing power plants. Under current and planned policies, Canada will not achieve its Copenhagen pledge of 610 MtCO2 e by 2020 (excluding land-use emissions). Our analysis assumes no significant additional effect of planned policies for Canada.
Enhancement measures in the transport and power sectors and the reduction in methane emissions could result in emission levels of 680 to 720 MtCO2e by 2020 and 585 to 710 MtCO2e by 2030. Although this represents a significant reduction in emissions below the level under current and planned policies, it would not be sufficient to meet the Copenhagen pledge. A co-benefit of these policies is the expected improvement in air quality.
ChinaNational policies from China’s 12th Five-Year Plan (FYP) and 12th FYP for Renewable Development are projected to lead to approximately the same emission levels as would be required to achieve the pledge for 2020 (13.5 GtCO2e, about 33% above 2010 levels). The expected emission levels under current policies strongly depend on future economic growth and will range between 14.7 and 15.4 GtCO2e by 2030 (including LULUCF), which is about 46% to 53% above the 2010 level. The emission targets of China’s pledge and its national policies are coupled to GDP, implying that the absolute emission target is very uncertain.
Under policy enhancement measures in the forestry, transport, buildings, and power sectors, and with reductions in hydrofluorocarbons, total emissions would keep increasing up to 2020 and subsequently would more or less stabilise up to 2030 (13.1–13.7 GtCO2e by 2030). All enhancement measures considered here have large potential for co-benefits, most importantly the improvement in local air quality. Air quality is a concern China is aiming to tackle already, and policies such as efficiency standards for passenger vehicles and buildings, and limits to coal combustion support existing air pollution mitigation policies.

13Executive summary |
Figure 3
1990 2000 2010 2020 2030
-200
0
200
400
600
800
1000Mt CO2 eq per year
Source: PBL FAIR/TIMER model; Ecofys & NewClimate Institute calculations
pbl.n
l
History Current policies
Enhanced policy scenario (bottom-up)
Enhanced policy scenario (top-down)
Pledge
Excluding CO2 emissions from land use
Impact of climate policies on greenhouse gas emissions in Canada
1990 2000 2010 2020 2030
-200
0
200
400
600
800
1000Mt CO2 eq per year
pbl.n
l
CO2 emissions from land use
Historical greenhouse gas emissions (including LULUCF) are based on national inventories submitted to UNFCCC.
Table 3Impact of climate policies on greenhouse gas emissions (excluding LULUCF) in Canada
2010 GHG emissions, excl. LULUCF
Current policies Selection of possible mitigation enhancement measures (bottom-up scenario)
700 MtCO2e1.6% of global emissions (incl. LULUCF)
20.6 tCO2e/capita
– CO2 standard for new power plants– Vehicle efficiency standardsResult (absolute; relative to 2010 levels*):720 to 760 MtCO2e; 3% to 9% by 2020665 to 815 MtCO2e; 17% to -5% by 203019.0 to 20.2 tCO2e/capita by 202016.1 to 19.7 tCO2e/capita by 2030
– Increased share of non-hydrogen renewable energy in electricity generation
– Improved vehicle efficiency standards– Methane emission reductions– Phase-down of hydrofluorocarbonsResult (absolute; relative to 2010 levels):680 to 720 MtCO2e; 3% to -3% by 2020585 to 710 MtCO2e; 2% to -17% by 203018.0 to 19.0 tCO2e/capita by 202014.1 to 17.2 tCO2e/capita by 2030
* Reductions presented here are relative to 2010, excluding LULUCF. The reductions relative to 2010 levels (including LULUCF) highly depend on the projected LULUCF emissions. Reductions including LULUCF are very different.

14 | Enhanced policy scenarios for major emitting countries
Figure 4
1990 2000 2010 2020 2030
-5000
0
5000
10000
15000
20000Mt CO2 eq per year
Source: PBL FAIR/TIMER model; Ecofys & NewClimate Institute calculations; IIASA GLOBIOM/G4M model
pbl.n
l
History Current policies
Enhanced policy scenario (bottom-up)
Enhanced policy scenario (top-down)
Pledge
Including CO2 emissions from land use
Impact of climate policies on greenhouse gas emissions in China
1990 2000 2010 2020 2030
-5000
0
5000
10000
15000
20000Mt CO2 eq per year
pbl.n
l
CO2 emissions from land use
Historical greenhouse gas emissions are based on energy-related emissions (IEA, 2013a), non-energy-related emissions (EDGAR 4.2) (JRC and PBL, 2012) and LULUCF emissions (FAOSTAT). For reporting reasons, the emission projections excluding LULUCF are not presented, as these are similar to those including LULUCF.
Table 4Impact of climate policies on greenhouse gas emissions (including LULUCF) in China
2010 GHG emissions, incl. LULUCF
Current policies Selection of possible mitigation enhancement measures (bottom-up scenario)
10,130 MtCO2e20.5% of global emissions
7.3 tCO2e/capita
– The 12th Five-Year Plan for renewable energy– CO2 / energy intensity targets– Cap on coal consumption from 2020 onwards– A 10% target share of gas in primary energy supply
by 2020– Subsidies for hybrid and electric vehicles– Biofuel targets– Energy efficiency in industry– Forestry policyResult (absolute; relative to 2010 levels):12,535 to 13,420 MtCO2e; 24% to 33% by 202014,700 to 15,415 MtCO2e; 46% to 53% by 20308.8 to 9.5 tCO2e/capita by 202010.3 to 10.8 tCO2e/capita by 2030
– Targets for forest cover for 2020 and 2050– Increased renewable energy targets in electricity
generation– Improved vehicle efficiency standards– Energy efficiency in buildings– Phase-down of hydrofluorocarbonsResult (absolute; relative to 2010 levels):12,135 to 12,890 MtCO2e; 20% to 28% by 202013,075 to 13,660 MtCO2e; 30% to 35% by 20308.5 to 9.1 tCO2e/capita by 20209.2 to 9.6 tCO2e/capita by 2030

15Executive summary |
European UnionThe EU is likely to overachieve its unconditional pledge of reducing greenhouse gas emissions by 20%, below 1990 levels, by 2020. Current policies could result in reductions of 22% to 27%, relative to 1990 levels, by 2020, and 23% to 35%, by 2030.
Enhanced policies could reduce emissions further. With additional measures for energy efficiency in passenger transport and buildings and a phase-down of hydro-fluorocarbons, the announced 40% reduction, below 1990 level, by 2030, could already be achieved. Scenarios exploiting all mitigation options show that further reductions would be possible. An important co-benefit of these enhancement measures for the EU is that of increased energy security.
IndiaUnder current domestic measures, we project that India is likely to achieve its pledge for 2020, with policies consisting of renewable energy targets and the market-based mechanism Perform Achieve and Trade (PAT) scheme for energy efficiency. As for China, emission projections highly depend on future economic growth. Therefore, uncertainty in projections resulting from the pledges is high, because both baseline emission projections and GDP developments are uncertain. Projected emission levels under current policies will reach about 4.8 to 5.5 GtCO2e by 2030 (including LULUCF), which is about 103% to 132% above 2010 levels. Under planned policies (on solar and wind power), emission levels will reach about 4.5 to 5.3 GtCO2e by 2030.
The selected mitigation enhancement measures could further reduce emissions by about0.3 GtCO2e by 2020 and about 0.5 to 0.7 GtCO2e by 2030, compared to under current policies. The total emission level would be 3.3 to 3.7 GtCO2e by 2020 and 4.3 to 4.8 GtCO2e by 2030 (80% to 101% above 2010 levels). All enhancement measures considered here hold large potential for co-benefits, most importantly those of enabling access to electricity through renewable energy and electricity saving on the consumers’ side.

16 | Enhanced policy scenarios for major emitting countries
Figure 5
1990 2000 2010 2020 2030
-2000
0
2000
4000
6000
8000Mt CO2 eq per year
Source: Ecofys & NewClimate Institute calculations
pbl.n
l
History Current policies
Enhanced policy scenario (bottom-up)
Pledge
Excluding CO2 emissions from land use
Impact of climate policies on greenhouse gas emissions in EU28
1990 2000 2010 2020 2030
-2000
0
2000
4000
6000
8000Mt CO2 eq per year
pbl.n
l
CO2 emissions from land use
Historical greenhouse gas emissions (excluding LULUCF) are based on national inventories submitted to UNFCCC.
Table 5Impact of climate policies on greenhouse gas emissions (excluding LULUCF) in the EU28
2010 GHG emissions, excl. LULUCF
Current policies Selection of possible mitigation enhancement measures (bottom-up scenario)
4,750 MtCO2e (excl. LULUCF)9.0% of global emissions (incl. LULUCF)
9.2 tCO2e/capita (excl. LULUCF)
– EU ETS– Renewable Energy Roadmap– Energy Efficiency Directive– Eco-Design Framework– Regulation on CO2 emissions from vehiclesResult (absolute; relative to 2010 levels):4,105 to 4,370 MtCO2e; -9% to -14% by 20203,670 to 4,315 MtCO2e; -10% to -23% by 20307.8 to 8.4 tCO2e/capita by 20207.0 to 8.2 tCO2e/capita by 2030
– Energy efficiency in passenger transport– Energy efficiency in buildings– Phase-down of hydrofluorocarbonsResult (absolute; relative to 2010 levels):3,900 to 4,075 MtCO2e; -15% to -18% by 20203,020 to 3,275 MtCO2e; -32% to -37% by 20307.5 to 7.8 tCO2e/capita by 20205.8 to 6.2 tCO2e/capita by 2030

17Executive summary |
Table 6Impact of climate policies on greenhouse gas emissions (including LULUCF) in India
2010 GHG emissions, incl. LULUCF
Current policies Selection of possible mitigation enhancement measures (bottom-up scenario)
2,380 MtCO2e4.8% of global emissions
2.0 tCO2e/capita
– Renewable energy targets (mix and capacity)– Efficiency in industry (PAT scheme)– Support for biofuels– Forestry policy (Green India Mission)Result (absolute; relative to 2010 levels):3,535 to 3,960 MtCO2e; 49% to 67% by 20204,805 to 5,520 MtCO2e; 103% to 132% by 20302.6 to 2.9 tCO2e/capita by 20203.2 to 3.6 tCO2e/capita by 2030
– Targets for forest cover for 2020– Enable access to electricity through renewable
energy, decentralised solar photovoltaic (PV) system units
– Improved vehicle efficiency standards– Energy efficiency in buildings– Energy efficiency in industry– Phase-down of hydrofluorocarbonsResult (absolute; relative to 2010 levels):3,265 to 3,650 MtCO2 e; 38% to 54% by 20204,270 to 4,775 MtCO2 e; 80% to 101% by 20302.4 to 2.7 tCO2e/capita by 20202.8 to 3.2 tCO2e/capita by 2030
Planned policies
– Increased renewable energy targets (solar and wind missions)
Result (absolute; relative to 2010 levels):3,300 to 3,855 MtCO2e; 39% to 63% by 20204,455 to 5,265 MtCO2e; 88% to 122% by 20302.4 to 2.8 tCO2e/capita by 20202.9 to 3.5 tCO2e/capita by 2030
Figure 6
1990 2000 2010 2020 2030
-2000
0
2000
4000
6000
8000Mt CO2 eq per year
Source: PBL FAIR/TIMER model; Ecofys & NewClimate Institute calculations; IIASA GLOBIOM/G4M model
pbl.n
l
History Current policies
Planned policies
Enhanced policy scenario (bottom-up)
Enhanced policy scenario (top-down)
Pledge
Including CO2 emissions from land use
Impact of climate policies on greenhouse gas emissions in India
1990 2000 2010 2020 2030
-2000
0
2000
4000
6000
8000Mt CO2 eq per year
pbl.n
l
CO2 emissions from land use
Historical greenhouse gas emissions are based on energy-related emissions (IEA, 2013a), non-energy-related emissions (EDGAR 4.2) (JRC and PBL, 2012) and LULUCF emissions (FAOSTAT). For reporting reasons, the emission projections excluding LULUCF are not presented, as these are similar to those including LULUCF.

18 | Enhanced policy scenarios for major emitting countries
IndonesiaA significant share of Indonesia’s emissions is connected to forestry and land use, due to deforestation, peatland destruction, and land-use change. There is a large uncertainty in LULUCF emissions, particularly related to peat oxidations (not including peat fires), which can be in the order of 30% to 50% of total LULUCF emissions. Uncertainty concerning emissions from peat fires is also high and it is well known that these emissions vary significantly between years. This has made it difficult to determine the emission projections for Indonesia and to assess whether the 2020 pledge will be achieved. As a result, Indonesia’s emission reductions resulting from the policies assessed in our analysis are projected to be smaller than the uncertain amount of emissions from land-use changes and forestry. Therefore, emission projections that assume the implementation of these policies are mainly illustrative. Successful implementation of policies on reducing deforestation and forest degradation can lead to significant emission reductions. If all current policies are successful, Indonesia would reduce emissions from LULUCF (including peat oxidation from deforestation, but excluding peat fires) by 35% below 2010 levels by 2030. For the energy sector, the renewable energy and biofuel targets set for 2025 are expected to lead to emission reductions, compared to baseline projections; however, emissions are still projected to increase further.
Overall, current and planned policies will lead to total greenhouse gas emission levels (including LULUCF) of 6% to 8% below 2010 levels by 2020, and 1% to 5% above 2010 levels by 2030. Enhanced policies on the deforestation of peatlands and in the transport sector may lead to further emission reductions, towards a projected emission level of 9% to 10% by 2020 and 2% to 5% by 2030, below 2010 levels. However, uncertainties concerning the implementation of such policies are still high. Furthermore, the emissions projected for 2020 and 2030 strongly depend on the assumed LULUCF emissions.
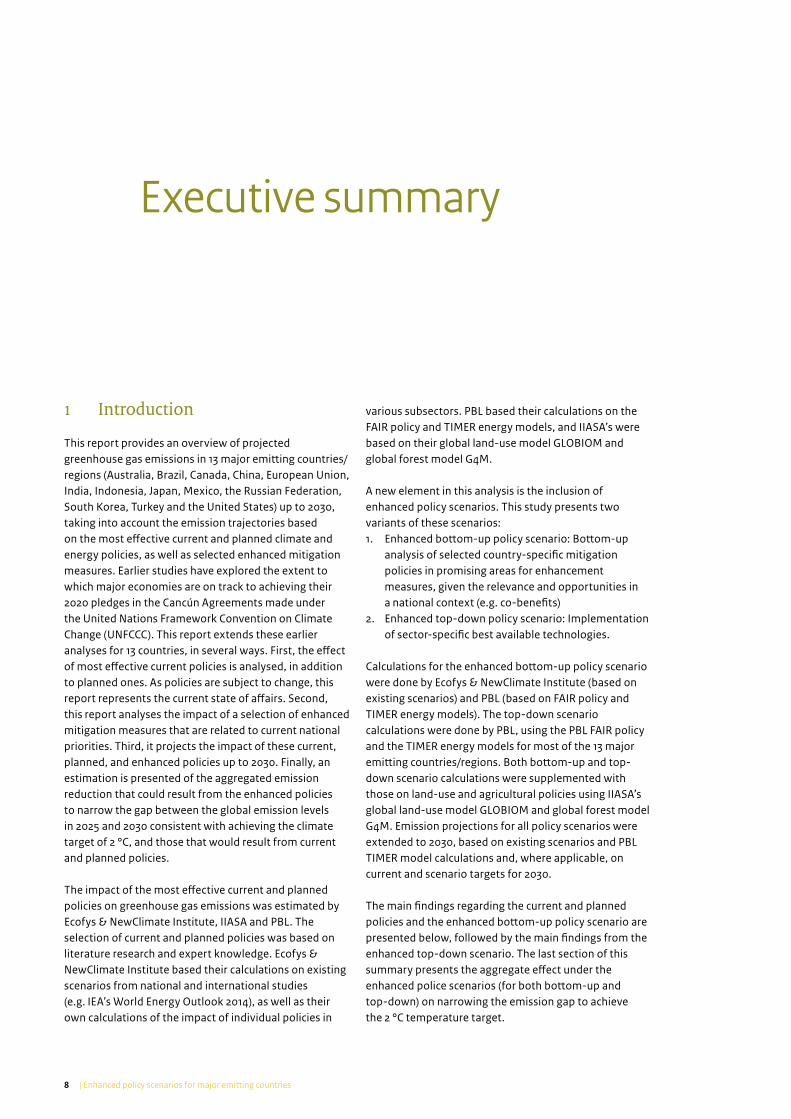
JapanUnder current policies Japan’s emissions (excluding LULUCF) are estimated to be between 1,135 to 1,330 MtCO2e by 2020 (10% below to 6% above 2010 levels) and 1,045 to 1,190 MtCO2e by 2030 (6% to 17% below 2010 levels). The large range is caused by the uncertainty about the phase-out of nuclear energy, as it is not yet fully clear whether this will occur and which energy carriers will replace the nuclear energy capacity. The upper end of the range basically assumes a full phase-out of nuclear energy, while the lower end assumes that some plants will be reconnected to the grid. This means that meeting its new tentative 2020 target, i.e. to reduce emissions by 3.8% from 2005 levels by 2020 (excluding LULUCF; corresponding to a 3.4% increase on 2010 levels), could be challenging for Japan under full nuclear energy phase-out.
Additional enhancement measures in renewable electricity generation and in the areas of efficiency in buildings and transport may reduce emissions to a level of between 965 and 1,065 MtCO2e by 2030 (16% to 24% below 2010), and could compensate potential emissions from a nuclear energy phase-out. Co-benefits of these policies include increased energy security due to fuel saving and less import dependency on coal and other fossil fuels. Furthermore, fuel efficiency in transport might reduce smog-related respiratory and visibility problems.

19Executive summary |
Figure 7
1990 2000 2010 2020 2030
0
500
1000
1500
2000
2500
3000Mt CO2 eq per year
Source: PBL FAIR/TIMER model; Ecofys & NewClimate Institute calculations; IIASA GLOBIOM/G4M model
pbl.n
l
History
History(National Communication)
Current policies
Enhanced policy scenario (bottom-up)
Enhanced policy scenario (top-down)
Pledge
NB: historical land-use emissions include those from peat oxidation caused by deforestation, estimated by IIASA
Including CO2 emissions from land use
Impact of climate policies on greenhouse gas emissions in Indonesia
1990 2000 2010 2020 2030
0
500
1000
1500
2000
2500
3000Mt CO2 eq per year
pbl.n
l
Excluding CO2 emissions from land use
1990 2000 2010 2020 2030
0
500
1000
1500
2000
2500
3000Mt CO2 eq per year
pbl.n
l
CO2 emissions from land use
Historical emissions are based on energy-related emissions (IEA, 2013a), non-energy-related emissions (EDGAR 4.2) (JRC and PBL, 2012), LULUCF emissions (FAOSTAT), and emissions from peat oxidation from deforestation estimated by IIASA.
Table 7Impact of climate policies on greenhouse gas emissions (including LULUCF) in Indonesia
2010 GHG emissions, incl. LULUCF
Current policies Selection of possible mitigation enhancement measures (bottom-up scenario)
2,060 MtCO2e4.2% of global emissions
8.6 tCO2e/capita
– Forestry policy (implementation of FLEGT and policies on peatland fires)
– Renewable energy and biofuel targetsResult (absolute; relative to 2010 levels):1,910 to 1,950 MtCO2 e; -6% to -8% by 20202,070 to 2,145 MtCO2 e; 1% to 5% by 20307.3 to 7.5 tCO2e/capita by 20207.5 to 7.7 tCO2e/capita by 2030
– Reduced deforestation on peatlands– Improved vehicle efficiency standards– Phase-down of hydrofluorocarbonsResult (absolute; relative to 2010 levels):1,855 to 1,895 MtCO2 e; -9% to -10% by 20201,960 to 2,035 MtCO2 e; -2% to -5% by 20307.1 to 7.3 tCO2e/capita by 20207.1 to 7.3 tCO2e/capita by 2030
20 | Enhanced policy scenarios for major emitting countries
Figure 8
1990 2000 2010 2020 2030
-500
0
500
1000
1500
2000Mt CO2 eq per year
Source: PBL FAIR/TIMER model; Ecofys & NewClimate Institute calculations
pbl.n
l
History Current policies
Enhanced policy scenario (bottom-up)
Enhanced policy scenario (top-down)
Pledge
Excluding CO2 emissions from land use
Impact of climate policies on greenhouse gas emissions in Japan
1990 2000 2010 2020 2030
-500
0
500
1000
1500
2000Mt CO2 eq per year
pbl.n
l
CO2 emissions from land use
Historical greenhouse gas emissions (excluding LULUCF) are based on national inventories submitted to UNFCCC.
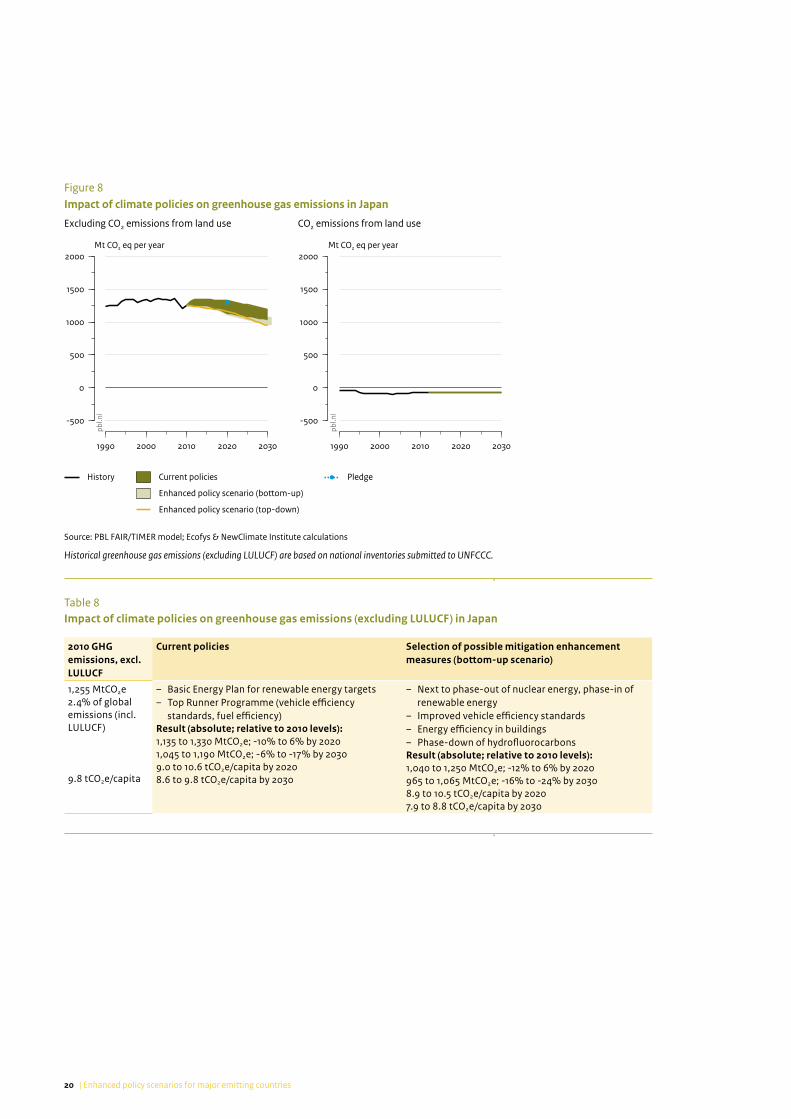
Table 8Impact of climate policies on greenhouse gas emissions (excluding LULUCF) in Japan
2010 GHG emissions, excl. LULUCF
Current policies Selection of possible mitigation enhancement measures (bottom-up scenario)
1,255 MtCO2e2.4% of global emissions (incl. LULUCF)
9.8 tCO2e/capita
– Basic Energy Plan for renewable energy targets– Top Runner Programme (vehicle efficiency
standards, fuel efficiency)Result (absolute; relative to 2010 levels):1,135 to 1,330 MtCO2e; -10% to 6% by 20201,045 to 1,190 MtCO2e; -6% to -17% by 20309.0 to 10.6 tCO2e/capita by 20208.6 to 9.8 tCO2e/capita by 2030
– Next to phase-out of nuclear energy, phase-in of renewable energy
– Improved vehicle efficiency standards– Energy efficiency in buildings– Phase-down of hydrofluorocarbonsResult (absolute; relative to 2010 levels):1,040 to 1,250 MtCO2e; -12% to 6% by 2020965 to 1,065 MtCO2e; -16% to -24% by 20308.9 to 10.5 tCO2e/capita by 20207.9 to 8.8 tCO2e/capita by 2030

21Executive summary |
MexicoProjections of current and planned policies show that Mexico is expected to achieve emission reductions, but these are not sufficient to meet its conditional pledge of 30% emission reduction by 2020, relative to the national baseline levels (about 670 MtCO2e).
Under policy enhancement measures in the energy, transport and forestry sectors, emissions (including LULUCF) could be about 4% to 12% below 2010 levels by 2020 (665–720 MtCO2e), and 17% to 20% below 2010 levels by 2030 (600–625 MtCO2e). The selected mitigation enhancement measures will halt deforestation, increase vehicle efficiency standards, with a strong continuation of renewable energy implementation and strong cuts in gas flaring, as well as phasing-down hydrofluorocarbons. Such measures would have multiple co-benefits in terms of reducing air pollution and agricultural damage, providing energy security and reducing the dependence on fossil fuels.
The Russian FederationUnder the Copenhagen Accord, the Russian Federation pledged an emission reduction of 15% to 25%, relative to 1990 levels, by 2020. In September 2013, the Russian Government committed to the higher end of the target. This could be achieved with already implemented policies. The Russian State Programme includes targets for energy efficiency and renewable electricity generation. Russia’s gas flaring policy could lead to additional emission reductions, but it is unclear whether this policy will be fully implemented. The current policies analysed in this assessment could lead to an emission level of 2,295 to 2,375 MtCO2e by 2020 (4% to 8% above 2010 levels) and 2,175 to 2,770 MtCO2e by 2030 (3% below 2010 levels to 25% above 2010 levels), excluding land-use emissions. Enhanced policies in the transport, energy and buildings sectors could lead to additional emission reductions, resulting in emission levels of 2,260 to 2,340 MtCO2e by 2020 and 2,055 to 2,315 MtCO2e by 2030 (8% below to 5% above 2010 levels). One of the co-benefits of these enhanced policies is that of improved air quality.

22 | Enhanced policy scenarios for major emitting countries
Figure 9
1990 2000 2010 2020 2030
-200
0
200
400
600
800
1000Mt CO2 eq per year
Source: PBL FAIR/TIMER model; Ecofys & NewClimate Institute calculations; IIASA GLOBIOM/G4M model
pbl.n
l
History Current policies
Enhanced policy scenario (bottom-up)
Enhanced policy scenario (top-down)
Pledge
Including CO2 emissions from land use
Impact of climate policies on greenhouse gas emissions in Mexico
1990 2000 2010 2020 2030
-200
0
200
400
600
800
1000Mt CO2 eq per year
pbl.n
l
Excluding CO2 emissions from land use
1990 2000 2010 2020 2030
-200
0
200
400
600
800
1000Mt CO2 eq per year
pbl.n
l
CO2 emissions from land use
Historical greenhouse gas emissions (excluding LULUCF) are based on inventory data of the Fifth National Communication to the UNFCCC (Government of Mexico, 2012)
Table 9Impact of climate policies on greenhouse gas emissions (including LULUCF) in Mexico
2010 GHG emissions, incl. LULUCF
Current policies Selection of possible mitigation enhancement measures (bottom-up scenario)
750 MtCO2e1.5% of global emissions
6.7 tCO2e/capita
– Renewable energy targets (national Climate Change Strategy and the Special Climate Change Programme)
– Forestry targetResult (absolute; relative to 2010 levels):770 to 810 MtCO2e; 4% to 9% by 2020835 to 850 MtCO2e; 12% to 14% by 20306.2 to 6.5 tCO2e/capita by 20206.2 to 6.3 tCO2e/capita by 2030
– Forestry policy– Enhanced renewable energy targets– Improved vehicle efficiency standards– Decrease venting and flaring of methane in oil and
gas production– Phase-down of hydrofluorocarbonsResult (absolute; relative to 2010 levels):665 to 720 MtCO2e; -4% to -12% by 2020600 to 625 MtCO2e; -17% to -20% by 20305.3 to 5.8 tCO2e/capita by 20204.4 to 4.6 tCO2e/capita by 2030

23Executive summary |
Figure 10
1990 2000 2010 2020 2030
-1000
0
1000
2000
3000
4000Mt CO2 eq per year
Source: PBL FAIR/TIMER model; Ecofys & NewClimate Institute calculations
pbl.n
l
History Current policies
Enhanced policy scenario (bottom-up)
Enhanced policy scenario (top-down)
Pledge
Excluding CO2 emissions from land use
Impact of climate policies on greenhouse gas emissions in the Russian Federation
1990 2000 2010 2020 2030
-1000
0
1000
2000
3000
4000Mt CO2 eq per year
pbl.n
l
CO2 emissions from land use
Historical greenhouse gas emissions (excluding LULUCF) are based on national inventories submitted to UNFCCC, and forestry emissions from the Sixth National Communication (Russian Federation, 2013).
Table 10Impact of climate policies on greenhouse gas emissions (excluding LULUCF) in the Russian Federation
2010 GHG emissions, excl. LULUCF
Current policies Selection of possible mitigation enhancement measures (bottom-up scenario)
2,220 MtCO2e3.3% of global emissions (incl. LULUCF)
14.0 tCO2e/capita
– Renewable energy targets– Energy intensity targets– Decrease venting and flaring of methane in oil and
gas productionResult (absolute; relative to 2010 levels*):2,295 to 2,375 MtCO2e; 4% to 8% by 20202,175 to 2,770 MtCO2e; -3% to 25% by 203014.5 to 15.0 tCO2e/capita by 202013.9 to 17.7 tCO2e/capita by 2030
– Enhanced renewable energy targets– Improved vehicle efficiency standards– Energy efficiency in buildings– Phase-down of hydrofluorocarbonsResult (absolute; relative to 2010 levels):2,260 to 2,340 MtCO2e; 2% to 6% by 20202,055 to 2,315 MtCO2e; -8% to 5% by 203014.3 to 14.8 tCO2e/capita by 202013.1 to 14.8 tCO2e/capita by 2030
* Here, reductions relative to 2010 excluding LULUCF are presented. Reductions relative to 2010 levels (including LULUCF) highly depend on the projected LULUCF emissions. Absolute emission levels (excluding LULUCF) are very different.

24 | Enhanced policy scenarios for major emitting countries
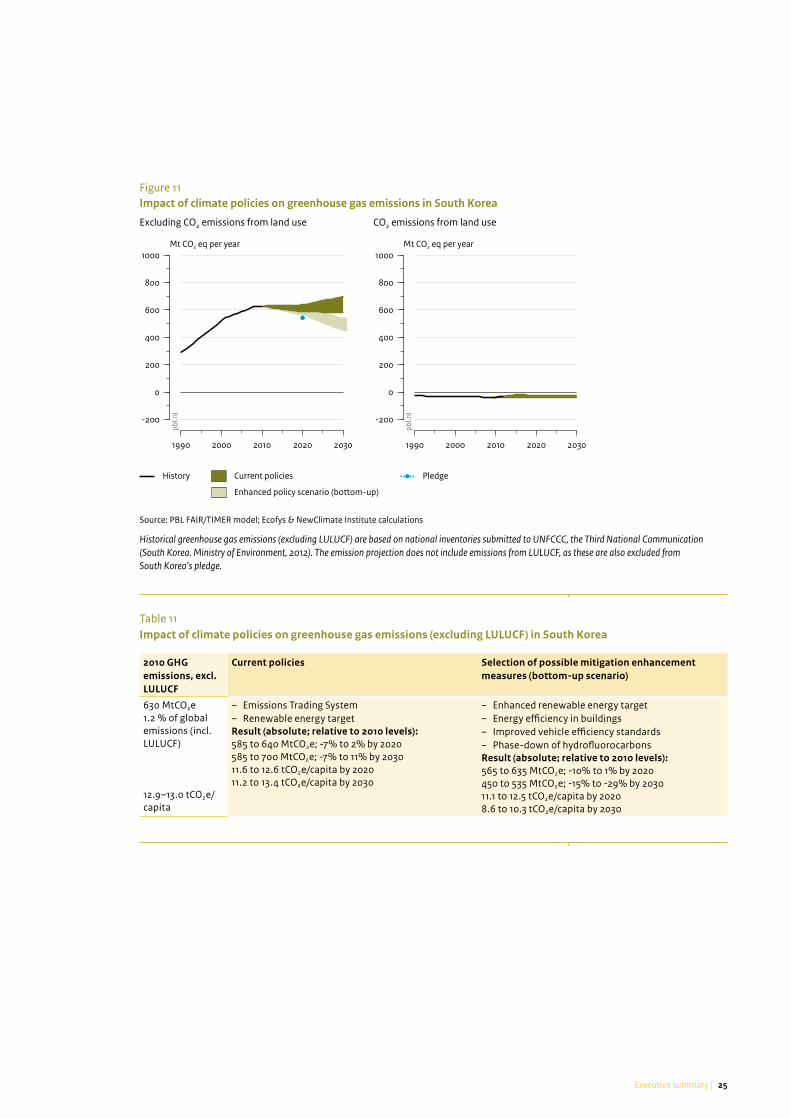
South KoreaSouth Korea introduced a green growth strategy to stimulate green technologies and industries. Based on this strategy, South Korea pledged to reduce emissions unconditionally by 30%, compared to baseline levels, by 2020, implying an emission target level of about 545 MtCO2e, excluding LULUCF. The green growth strategy is supported by renewable targets for 2020 and 2030, which were introduced in the 2010 National Basic Energy Plan. South Korea launched a national emissions trading system (ETS) in January 2015. According to our assessment, the ETS and the renewable energy target could result in stabilisation of South Korea’s emission levels (excluding LULUCF) at 585 to 640 MtCO2e by 2020 and 585 to 700 MtCO2e by 2030. This is a deviation from the historical trend of strongly increasing emissions and is an important step towards achieving the pledge. However, it is not expected to be sufficient to achieve the pledged emission level by 2020. Whether South Korea will achieve its unconditional pledge depends on the enforcement of its emissions trading system.
Under enhancement measures in the power, transport and buildings sectors and a phase-down of hydro-fluorocarbons, South Korea may reduce its emissions to a level of 565 to 635 MtCO2e by 2020 and 450 to 535 MtCO2e by 2030 (excluding LULUCF; about 15% to 29% below 2010 levels). Especially replacing coal by renewable energy in power generation could contribute to significant emission reductions beyond those resulting from current policies. Co-benefits of these enhanced policies consist of improved air quality and a decreased dependency on imported fuels.
TurkeyAlthough Turkey did not submit an international pledge, it has a renewable electricity target and an energy intensity target. If effective policies are implemented to achieve these targets, they could lead to emission levels of 21% to 71% above 2010 levels (excluding LULUCF) by 2020 and 52% to 189% above 2010 levels by 2030. Enhanced policies in the transport, energy and buildings sectors could further reduce emissions to levels of 10% to 64% above 2010 levels by 2020 and 19% to 151% above 2010 levels by 2030. Co-benefits of these enhanced policies include improved air quality and increased energy security, and will also lead to further alignment with EU policies. The actual emission level resulting from the energy intensity target strongly depends on the future development of GDP and is thus surrounded by large uncertainties.
United StatesCurrent policies in the United States are likely not yet sufficient to reduce emissions as pledged to the UNFCCC (17% below 2005 levels, by 2020; corresponding to 13% below 2010 levels). The emissions under current policies (excluding the Climate Action Plan, which is considered as planned policies) are estimated to reach about 8% below to 5% above 2010 levels by 2020, and 12% below to 10% above 2010 levels by 2030. The large range is caused by the uncertainty about whether the planned policies will be implemented. Recent US policy assessments show that emissions could stabilise or even increase between 2010 and 2020. Full implementation of all additional planned policies covered by the Climate Action Plan is expected to reduce emissions close to the level needed to achieve the pledge by 2020, depending on how land-use-related emissions are accounted for. By 2030, these additional policies would achieve an emission level of about 5% to 27% below the 2010 level, including land-use emissions.
The enhanced policies we selected could achieve additional emission reductions in key sectors such as the power sector (including enhancement measures to increase levels of clean electricity generation and tightening energy efficiency standards of power plants) and the industrial sector (improving energy efficiency), and would further reduce emissions to about 17% to 38%, below 2010 levels, by 2030. Such measures would have co-benefits in terms of reducing air pollution and reducing the dependence on fossil fuels.
25Executive summary |
Table 11Impact of climate policies on greenhouse gas emissions (excluding LULUCF) in South Korea
2010 GHG emissions, excl. LULUCF
Current policies Selection of possible mitigation enhancement measures (bottom-up scenario)
630 MtCO2e1.2 % of global emissions (incl. LULUCF)
12.9–13.0 tCO2e/capita
– Emissions Trading System– Renewable energy targetResult (absolute; relative to 2010 levels):585 to 640 MtCO2e; -7% to 2% by 2020585 to 700 MtCO2e; -7% to 11% by 203011.6 to 12.6 tCO2e/capita by 202011.2 to 13.4 tCO2e/capita by 2030
– Enhanced renewable energy target– Energy efficiency in buildings– Improved vehicle efficiency standards– Phase-down of hydrofluorocarbonsResult (absolute; relative to 2010 levels):565 to 635 MtCO2e; -10% to 1% by 2020450 to 535 MtCO2e; -15% to -29% by 203011.1 to 12.5 tCO2e/capita by 20208.6 to 10.3 tCO2e/capita by 2030
Figure 11
1990 2000 2010 2020 2030
-200
0
200
400
600
800
1000Mt CO2 eq per year
Source: PBL FAIR/TIMER model; Ecofys & NewClimate Institute calculations
pbl.n
l
History Current policies
Enhanced policy scenario (bottom-up)
Pledge
Excluding CO2 emissions from land use
Impact of climate policies on greenhouse gas emissions in South Korea
1990 2000 2010 2020 2030
-200
0
200
400
600
800
1000Mt CO2 eq per year
pbl.n
l
CO2 emissions from land use
Historical greenhouse gas emissions (excluding LULUCF) are based on national inventories submitted to UNFCCC, the Third National Communication (South Korea. Ministry of Environment, 2012). The emission projection does not include emissions from LULUCF, as these are also excluded from South Korea’s pledge.

26 | Enhanced policy scenarios for major emitting countries
Figure 12
1990 2000 2010 2020 2030
-400
0
400
800
1200Mt CO2 eq per year
Source: PBL FAIR/TIMER model; Ecofys & NewClimate Institute calculations
pbl.n
l
History Current policies
Enhanced policy scenario (bottom-up)
Enhanced policy scenario (top-down)
Pledge
Excluding CO2 emissions from land use
Impact of climate policies on greenhouse gas emissions in Turkey
1990 2000 2010 2020 2030
-400
0
400
800
1200Mt CO2 eq per year
pbl.n
l
CO2 emissions from land use
Historical greenhouse gas emissions are based on national inventories submitted to UNFCCC. For reporting reasons, the emission projections including LULUCF are not presented, as these are similar to those excluding LULUCF.
Table 12Impact of climate policies on greenhouse gas emissions (excluding LULUCF) in Turkey
2010 GHG emissions, excl. LULUCF
Current policies Selection of possible mitigation enhancement measures (bottom-up scenario)
405 MtCO2e0.7% of global emissions (including LULUCF)
5.3 tCO2e/capita
– Renewable energy target– Energy intensity targetResult (absolute; relative to 2010 levels):485 to 690 MtCO2e; 21% to 71% by 2020615 to 1,165 MtCO2e; 52% to 189% by 20305.8 to 8.2 tCO2e/capita by 20206.7 to 12.7 tCO2e/capita by 2030
– Enhanced renewable energy target– Improved vehicle efficiency standards– Phase-down of hydrofluorocarbonsResult (absolute; relative to 2010 levels):440 to 660 MtCO2e; 10% to 64% by 2020480 to 1,015 MtCO2e; 19% to 151% by 20305.2 to 7.8 tCO2e/capita by 20205.2 to 11.1 tCO2e/capita by 2030

27Executive summary |
Figure 13
1990 2000 2010 2020 2030
-2000
0
2000
4000
6000
8000Mt CO2 eq per year
Source: PBL FAIR/TIMER model; Ecofys & NewClimate Institute calculations
pbl.n
l
History Current policies
Planned policies
Enhanced policy scenario (bottom-up)
Enhanced policy scenario (top-down)
Pledge
Including CO2 emissions from land use
Impact of climate policies on greenhouse gas emissions in the United States
1990 2000 2010 2020 2030
-2000
0
2000
4000
6000
8000Mt CO2 eq per year
pbl.n
l
Excluding CO2 emissions from land use
1990 2000 2010 2020 2030
-2000
0
2000
4000
6000
8000Mt CO2 eq per year
pbl.n
l
CO2 emissions from land use
Historical greenhouse gas emissions (excluding LULUCF) are based on national inventories submitted to UNFCCC, and LULUCF emissions from the Sixth National Communication of the United States of America (United States, 2014).
Table 13Impact of climate policies on greenhouse gas emissions (including LULUCF) in the United States
2010 GHG emissions, incl. LULUCF
Current policies Selection of possible mitigation enhancement measures (bottom-up scenario)
5,905 MtCO2e11.9% of global emissions
18.7 tCO2e/capita
– Vehicle efficiency standards– State renewable energy targets (REN)– ETS California– Biofuel targetResult (absolute; relative to 2010 levels):5,445 to 6,170 MtCO2e; -8% to 5% by 20205,250 to 6,465 MtCO2e; -12% to 10% by 203015.9 to 18.0 tCO2e/capita by 202014.3 to 17.6 tCO2e/capita by 2030
– Enhanced CO2 standard for new power plants– Improved vehicle efficiency standards– Efficiency improvement in industry– Phase-down of hydrofluorocarbonsResult (absolute; relative to 2010 levels):4,400 to 5,565 MtCO2e; -6% to -26% by 20203,710 to 4,920 MtCO2e; -17% to -38% by 203012.8 to 16.3 tCO2e/capita by 202010.1 to 13.4 tCO2e/capita by 2030
Planned policies
– CO2 standard for new and existing power plants– Methane emission reductions in oil and gas
production– Obama climate planResult (absolute; relative to 2010 levels):4,715 to 5,905 MtCO2e; -1% to -21% by 20204,315 to 5,655 MtCO2e; -5% to -27% by 203013.8 to 17.2 tCO2e/capita by 202011.7 to 15.4 tCO2e/capita by 2030

28 | Enhanced policy scenarios for major emitting countries
3 Results of enhanced policies (top-down scenario)
PBL also explored an additional set of mitigation options in a modelling framework. The impact of mitigation options in the power, transport, buildings, and industry sectors on energy-related CO2 emissions in 11 of the 13 major emitting countries/regions were analysed (South Koreas was excluded from this analysis due to data constraints and EU data were based on a literature study) (Figure 14). The options in the energy sector range from specific energy efficiency measures, such as banning traditional light bulbs and enforcing ‘A’ label appliances, to broader policies, such as introducing passenger vehicle efficiency standards and carbon emission standards for power plants (for details, see Table 14). These options were not tailor-made to specific countries/regions, but were assumed to be implemented in a top-down way, by making the same assumptions for countries/regions. The outcomes are only explorative, but it is expected that full implementation of these mitigation measures could decrease emissions for each country, compared to under current policies.
Implementation of these mitigation measures in the United States could lead to major reductions in energy-related CO2 emissions in the power and transport sectors, compared to under current policies. The reductions are smaller compared to planned policies that also include emission standards for power plants. The potential in these sectors is large as existing fuel efficiencies in light commercial vehicles and power plants are relatively low.
The same holds for Brazil and Japan, where the largest potential to reduce emissions is in the transport and industry sectors. For the latter sector, increased efficiencies in steel production could have large effects, partly because demand for these industrial products is expected to rise.
For China and India, we identified the largest opportunities for emission reductions to be in the power and industry sectors. The explored mitigation measures
in the electricity sector are particularly effective in India, mostly because India has a high dependence on coal-based electricity, both historically and in the PBL baseline projections. The study shows that, for India, reductions in the industry sector can be achieved by a combination of the use of advanced steel furnaces, good housekeeping and an improved clinker–cement ratio. In China, the effect is mainly due to improved housekeeping. The effects of increased efficiencies in steel and cement production are relatively large in China and India, partly because demand for these industrial products is expected to rise in the underlying scenarios. In China and the European Union, substantial reductions could also be achieved in the buildings sector, due to increased efficiency in heating and insulation and by a ban on incandescent light bulbs.
In Australia, Mexico and Turkey, the largest potential for reduction is projected to be in the transport sector, due to existing fuel inefficiencies, followed by the industry and electricity sectors. For the last two sectors, significant reductions can be achieved by a lower dependency on coal and improved efficiencies. In Indonesia, certain emission reductions can be achieved in all sectors, none of the sectors in particular.
For Canada, the analysis shows that the largest potential to reduce emissions can be found in the transport and buildings sectors. Emission reductions in the transport sector are mainly high because existing fuel efficiencies are relatively low in Canada, while the level of private car ownership is relatively high. Furthermore, insulation measures in the buildings sector can be particularly effective in Canada.
In the Russian Federation, the largest reduction potential is in the industry sector. Here, the effects of an increased efficiency in steel production are relatively large, in the form of the use of advanced steel furnaces and the implementation of good housekeeping measures. Emission reductions in the transport sector are also high because of low existing fuel efficiencies and a high level of private car ownership.

29Executive summary |
Table 14Overview of policies analysed in the enhanced top-down policy scenario
Sector Policy/measure Target
Energy – Emission standard for new power plants (ban on new coal-fired power plants)
– 1000 lbCO2/GWh (450 gCO2/kWh) by 2015
Transport – Enhanced vehicle efficiency standards – Achieve standards as currently discussed in the EU (46–49 km/l for new passenger cars by 2030 for developed countries, and by 2035 for developing countries)
Industry – Improving the clinker-to-cement ratio– Improved energy efficiency in steel and cement
industries– The use of advanced type steel furnaces
– Maximum standard for clinker-to-cement ratios of 65% by 2030, linearly decreasing from 2015 levels
– Implementation of efficiency measures between 2015 and 2030
– Installation of most efficient steel blast furnace types from 2015 onwards
Buildings – Light-bulb standard
– Implementation of advanced heating and cooling– Efficient appliances
– Increased use of renewable energy
– A ban on incandescent light bulbs from 2015 onwards. To be replaced with compact fluorescent lighting or light emitting diodes (LEDs)
– Implementation of advanced heating and insulation technologies, leading to a standard in energy consumption of 15 KJ per square metre of living space per heating degree day (HDD) for newly built houses by 2030
– Enforcement of ‘A’ label appliances between 2015 and 2030
– Implementation of 1m2 solar PV for every household between 2015 and 2030
Hydrofluorocarbons – Phase-down of production and consumption of HFCs
– Implementation of a reduction scheme for the production and consumption of HFCs in Article 5 and non-Article 5 countries, leading to an 85% reduction by 2045 and 2035. This is based on the North American 2014 HFC submission to the Montreal Protocol. For further details see Appendix A.5
Figure 14
Australia
Brazil
Canada
China
India
Indonesia
Japan
Mexico
Russian Federation
Turkey
United States
0 20 40 60 80 100
%Source: PBL FAIR/TIMER model
pbl.nl
Electricity
Industry
Transport
Buildings
Emission reduction in enhanced policies (top-down) compared to implemented policies
Contribution of energy-related CO2 reductions per sector, 2030

30 | Enhanced policy scenarios for major emitting countries
Table 15The impact of mitigation enhancement measures on narrowing the emission gap to achieving the 2 °C target by 2030
Global 2010 greenhouse gas emissions, incl. LULUCF
Current policies Selection of possible mitigation enhancement measures (bottom-up scenario) (additional to planned policies)
49.5 GtCO2e* – Current emission trajectories from the implemented policies (Section 3.1.3 of UNEP’s Emissions Gap Report 2014)
Result (absolute; relative to 2010 levels):54.5 GtCO2e; 10% by 202059.0 GtCO2e; 19% by 2030
– Enhanced policy bottom-up scenario for 13 countries/regions
Result (absolute; relative to 2010 levels):52.2 GtCO2e; 6% by 202052.9 GtCO2e; 7% by 2030
Planned policies (additional to current policies)
– Planned policies in 13 countries/regionsResult (absolute; relative to 2010 levels):54.0 GtCO2e; 9% by 202058.0 GtCO2e ; 17% by 2030
* Source: IPCC (2014). Note that the Edgar database gives 2010 emissions of 50.9 GtCO2e.
Figure 15
1990 2000 2010 2020 2030 2040
0
20
40
60
80Gt CO2 eq per year
Source: UNEP 2014; PBL 2015
pbl.n
l
History
Business-as-usual emissionlevels (UNEP 2014)
Current policy trajectory(UNEP 2014)
Emission levels consistentwith 2 °C target (UNEP 2014)
Enhanced policy scenarios
Bottom-up
Top-down
Emission gap (UNEP 2014)
Impact of enhanced policy scenarios on narrowing the global greenhouse gas emissions gap
The impact of the identified enhancement measures for the 13 countries/regions, in selected areas for achieving additional emission reductions, on narrowing the emission gaps in 2025 and 2030. The emission gap is based on the difference between emission levels of 2025 and 2030 consistent with meeting the climate target of 2 °C (UNEP, 2014), and levels expected in those two years, based on current emission trajectories.
31Executive summary |
4 The impact of mitigation enhancement measures on narrowing the emission gap to achieve the 2 °C target by 2030
The selected bottom-up mitigation enhancement options for 13 major emitting countries/regions are expected to reduce global emissions by 2.3 GtCO2e by 2020 and 6.1 GtCO2e by 2030, compared to the aggregated emission trajectory in this study, which is based on current policies. This would be a reduction of around 1.7 GtCO2e by 2020 and 5.1 GtCO2e by 2030, compared to planned policies. It should be noted that the impact of the planned policies (compared to current policies) would already be a reduction of 0.5 GtCO2e by 2020 and 1.0 GtCO2e by 2030, which will mainly be the result of US policy proposals (the Obama climate plan) and those of India. UNEP’s Emissions Gap Report 2014 (UNEP, 2014) did not include these planned policies in its global emission trajectory based on current policies (see Figure 3.2 of UNEP, 2014). The selected top-down mitigation enhancement options for 11 of the 13 major emitting countries/regions would achieve slightly larger reductions, in the order of 2.7 GtCO2e by 2020 and 7.4 GtCO2e by 2030, compared to the aggregated emission trajectory in this study, which is based on current policies.
To compare these reductions with the reductions needed for achieving the 2 °C target, a comparison with the emission gap can be made. The emission gap is formulated here as the difference between global emission levels in 2030 consistent with meeting the climate target of 2 °C, and levels expected in that year based on current emission trajectories. This differs slightly from UNEP’s Emissions Gap Report 2014 (UNEP, 2014) in which the gap in 2030 is defined as the difference between global emission levels consistent with the 2 °C target versus the emission levels expected if the pledge cases are extrapolated to 2030.
Similar to in UNEP’s Emissions Gap Report 2014 (UNEP, 2014), for the 2 °C pathway we also assume that only modest emission reductions are achieved up to 2020, followed by stringent mitigation. Most least-cost scenarios in the literature, in contrast, are based on the assumption that immediate action would begin in 2010 in all sectors and countries/regions. As current emission levels are above these least-cost pathways, such scenarios cannot be regarded cost-optimal anymore. In essence, the opportunity for achieving the 2 °C pathway against the lowest costs from 2010 onwards has passed. By postponing rigorous action until 2020, costs of
mitigation in the near term are lower, but will be much higher and carry much greater risks later on, such as: (i) higher rates of global emission reductions in the medium term; (ii) greater lock-in of carbon-intensive infrastructure; and (iii) greater reliance on negative emissions.
This report uses the emission pathways that are consistent with a likely chance of staying below 2 °C, starting with delayed action until 2020 and following cost-optimal paths afterwards (UNEP, 2014). These pathways show emission levels of 47 GtCO2e (range 40–48) by 2025, and 42 GtCO2e (range 30–44) by 2030. The projected 2030 emission level based on the UNEP’s global emission trajectory, which is based on current policies is 59 GtCO2e (UNEP, 2014). The emission projections for the 13 selected countries/regions in the UNEP report are similar to those in this study.
Reduction under our enhanced policy scenario will be 6.1 GtCO2e by 2030, implying that the selected enhancement policies would narrow the global emission gap (as defined in this study) for 2030 by about 36% (Figure 15). Additional reductions through measures taken before 2020 are still possible, and would reduce the risk of not achieving the 2 °C objective in the long term. These additional measures could be taken in the countries/regions considered in this study as well as in other countries.
To summarise, the selected enhancement policies and measures for the 13 major emitting countries/regions would significantly increase current mitigation efforts, and also deliver co-benefits and opportunities for them. Yet, these policies and measures, together, would be insufficient to keep global emissions on track to stay below the 2 °C global temperature increase, or to achieve the long-term goals as adopted by some countries. For a 2 °C pathway, very ambitious measures would have to be implemented throughout all sectors (not only the considered additional measures in the thirteen countries/regions) and in a substantial number of other countries.
Notes
1 LULUCF = emissions and removals from activities relating to
land use, land-use change and forestry.
2 For the purpose of this report, greenhouse gas emissions
(unless otherwise specified) are the sum of the basket of
greenhouse gases listed in Annex A to the Kyoto Protocol,
expressed as carbon dioxide equivalents assuming a
100-year global warming potential.

32
ON
E
| Enhanced policy scenarios for major emitting countries
Introduction
This report provides an overview of projected greenhouse gas emissions in 13 major emitting countries/regions (Australia, Brazil, Canada, China, the European Union, India, Indonesia, Japan, Mexico, the Russian Federation, South Korea, Turkey and the United States) up to 2030, taking into account the emission trajectories based on the most effective current and planned climate and energy policies, as well as selected enhanced mitigation measures. These countries were responsible for about 65% of global greenhouse gas emissions in 2010. Earlier studies (Roelfsema et al., 2014; Fekete et al., 2013b) have explored the extent to which major emitting economies are on track to achieving their 2020 pledges in the Cancún Agreements made under the United Nations Framework Convention on Climate Change (UNFCCC), by analysing how much current and planned policies contribute to reducing greenhouse gas emissions. This report extends these earlier analyses for 13 countries/regions, in several ways. First, the effect of most effective current policies is analysed, in addition to planned ones. As policies are subject to change, so this report represents the current state of affairs. Second, this report analyses the impact of a selection of enhanced mitigation measures that are related to current national priorities. Third, it projects the impact of these current, planned, and enhanced policies up to 2030. Finally, in the executive summary an estimation is presented of the aggregated emission reduction that could result from the enhanced policies to narrow the gap between the global emission levels in 2025 and 2030 consistent with achieving the climate target of 2 °C, and those that would result from current and planned policies.
The impact of the most effective current and planned policies on greenhouse gas emissions was estimated by Ecofys & NewClimate Institute, IIASA and PBL. The selection of current and planned policies was based on literature research and expert knowledge. Ecofys & NewClimate Institute based their calculations on existing scenarios from national and international studies (e.g. IEA s World Energy Outlook 2014), as well as their own
calculations of the impact of individual policies in various subsectors. PBL based their calculations on the FAIR policy and TIMER energy models, and IIASA’s were based on their global land-use model GLOBIOM and global forest model G4M.
A new element in this analysis is the inclusion of enhanced policy scenarios. The analysis focuses on the impact on the emission trajectories of a selection of enhancement measures, which were selected based on expert knowledge of policy makers and climate policy analysts. The selection of the enhancement measures is illustrative and not exhaustive. Therefore, this report does not give a quantitative assessment of the full climate and energy policy portfolio of possible enhancement measures, but it tries to give a good impression of the enhancement measures for the selected countries/regions that go beyond current domestic policies.
This study presents two variants of the enhanced policy scenarios:1. Enhanced bottom-up policy scenario: Bottom-up
analysis of selected country-specific mitigation policies in promising areas for enhancement measures, given the relevance and opportunities (e.g. co-benefits)1 in the national context (e.g. no new coal-fired power plants in China);
2. Enhanced top-down policy scenario: Implementation of sector-specific best available technologies.
The impact of the enhanced policy scenarios on greenhouse gas emissions was estimated based on two methods: (i) calculations by Ecofys & NewClimate Institute based on existing scenarios from national and international studies (e.g. IEA s World Energy Outlook), complemented with own calculations of the impact of individual policies in various subsectors (Fekete et al., 2013b) and (ii) calculations by PBL using the PBL FAIR policy model (Den Elzen et al., 2014a) and the TIMER energy model (Van Vuuren et al., 2014) for most of the

331 Introduction |
ON
E
ONE
Box 1.1 Exploring the impacts of enhanced policy scenariosIndicating the possible impacts of enhancement measures in the context of various countries/regions is beset with uncertainty. A real estimate would require an in-depth analysis of the potential to implement reduction measures in the countries, something that could not be done within the context of this study (neither in terms of the available tools nor within the time frame of the study). The tools used only allow a rough exploration of possible impacts. The calculations of Ecofys & NewClimate Institute are based on a bottom-up method which allows a more detailed assessment of the reduction potential, but does not take into account dynamic feedbacks of the various measures (e.g. impacts on energy prices). The method implemented by PBL is based on the IMAGE/TIMER energy model. This model is generally used to explore long-term climate policies for large global regions. The focus here on the more intermediate impacts means that also more short-term dynamics play a role such as the exact sub-sectoral interactions and feedbacks of various processes and technologies and implementation dynamics. The outcomes can therefore not be used more than as an indication of the possible impacts and are not suitable for interpreting the exact impact for individual countries. Such assessments need to be based on individual country studies, using detailed country-specific models and insights of the effectiveness of various measures at the country level.
Table 1.1Overview of policies analysed in the enhanced top-down policy scenario as applied for the countries selected for this study
Sector Policy/Measure Target
Energy – Emission standard for new power plants (ban on new coal-fired power plants)
– 1000 lbCO2/GWh (450 gCO2/kWh) by 2015
Transport – Enhanced vehicle efficiency standards – Achieve standards as currently discussed in the EU (46-49 km/l for new passenger cars by 2030 for developed countries, and by 2035 for developing countries). For further details see Chapter 2 and Appendix A.2
Industry – Improving the clinker-to-cement ratio– Improved energy efficiency in steel and
cement industries– The use of advanced type steel furnaces
– Maximum standard for clinker-to-cement ratios of 65% by 2030, linearly decreasing from 2015 levels
– Implementation of efficiency measures between 2015 and 2030
– Installation of most efficient steel blast furnace types from 2015 onwards
Buildings – Light-bulb standard
– Implementation of advanced heating and cooling
– Efficient appliances
– Increased use of renewable energy
– A ban on incandescent light bulbs from 2015 onwards; to be replaced with compact fluorescent lighting or light emitting diodes (LEDs)
– Implementation of advanced heating and insulation technologies, leading to a standard in energy consumption of 15 KJ per square metre of living space, per heating degree day (HDD), for newly built houses by 2030
– Enforcement of ‘A’ label appliances between 2015 and 2030– Implementation of 1m2 solar PV for every household
between 2015 and 2030
Hydrofluorocarbons (HFCs)
– Phase-down of production and consumption of HFCs
– Implementation of a reduction scheme for the production and consumption of HFCs for Article 5* and non-Article 5 countries leading to an 85% reduction by 2045 and 2035. This is based on the North American 2014 HFC submission to the Montreal Protocol**. For further details see Appendix A.5
* List of Parties categorised as operating under Article 5, paragraph 1 of the Montreal Protocol (considered as developing countries). http://ozone.unep.org/new_site/en/parties_under_article5_para1.php.
** UNEP (2014b). See also: http://www.epa.gov/ozone/intpol/mpagreement.html.
34 | Enhanced policy scenarios for major emitting countries
ON
E
13 major emitting countries/regions, supplemented with own calculations (Roelfsema et al., 2013; Roelfsema et al., 2014), and using an updated baseline emission projection (no climate policy) as used in OECD (2012) (hereafter referred to as PBL baseline), but corrected for the implementation of current policies. Emission projections for all policy scenarios were extended to 2030, based on existing scenarios and PBL TIMER model calculations and, where applicable, on current and scenario targets for 2030. Both (i) and (ii) were supplemented with calculations on land-use and agricultural policies using IIASA’s global land-use model GLOBIOM and global forest model G4M. The enhanced bottom-up policy scenario is calculated by Ecofys & NewClimate Institute, PBL and IIASA and the enhanced top-down policy scenario is calculated by PBL, building upon the study of Deetman et al. (2012). As the latter scenario is only calculated by PBL, no ranges can be given for expected greenhouse gas emissions in this scenario.
It should be noted that the bottom-up and top-down ‘enhanced policy’ scenarios aim to show that by replicating ‘best-in-class’ policies or progressing to identified benchmarks, it is possible to significantly enhance current efforts. The selection of policies and measures is illustrative and not exhaustive. The selected enhancement measures are still insufficient to stay below 2 °C global temperature increase, or to achieve long-term goals as adopted by some countries/regions.
Chapter 2 describes the overall situation for the 13 major emitting countries/regions, which includes an analysis of the current and planned policies, and enhanced policy scenarios. It includes a description of the method and the country-specific assumptions of the first variant of the enhanced policy scenario. Table 1.1 describes the assumptions underlying the second variant of the enhanced policy scenario used in the PBL TIMER energy model. It focuses on the mitigation measures for the sectors energy supply, transport, industry and buildings, as adopted for 11 of the 13 major emitting countries/regions (excluding South Korea and the EU). These measures are not tailor-made to specific countries and the outcomes are only explorative. The mitigation options are described in more detail in Appendix A. The only exceptions are the transport and HFC sectors, for which the same assumptions are used for both variants of the enhanced policy scenario, which are briefly described in the country sections, and more extensively in Appendix A.2 and Appendix A.5.
Note
1 A recent report by World Bank and ClimateWorks
Foundation provides an elaborate assessment and
quantification of the various benefits of mitigation
measures. The measures and sectors in that report partly
overlap with our current study; for example, World Bank
and ClimateWorks Foundation look at the sectors
transportation, industry and buildings. These benefits
include economic growth, job creation, improved crop
yields, energy security and energy saving, public health
improvements, and lives saved. See the tables in the
country sections for country-specific benefits, partly based
on this World Bank and ClimateWorks Foundation (2014)
report.

ON
E

36
TWO
| Enhanced policy scenarios for major emitting countries
Country sections
This chapter summarises the results per country, for both current and planned policies, and under the enhanced bottom-up policy scenario. The emission projections under the enhanced top-down policy scenario for the selected countries/regions are also shown in the figures below, and are described in more detail in the last sub-section of each country-section. It should be noted that Australia, Brazil, India and the United States are the only countries in this analysis for which a clear distinction has been made between current and planned policies. This chapter also briefly describes the co-benefits and opportunities in implementing these options for mitigation enhancement.

372 Country sections |
TWO
TWO
2.1 Australia
2.1.1 Summary of resultsUnder current policies, Australia’s emissions (including those from LULUCF) are estimated to be between 650 and 665 million tonnes of carbon dioxide equivalent emissions (MtCO2e) by 2020 (16% to 19% above 2010 levels) and 670 to 760 MtCO2e by 2030 (20% to 36% above 2010 levels) (see Figure 2.1 and Table 2.1). The expected increase, in contrast to earlier projections, is mainly due to the repeal of the Carbon Pricing Mechanism in August 2014. Australia is currently also considering to cut the Renewable Energy Target, a financial incentive that has successfully stimulated the installation of renewable energy over the last
decade, which would further increase emissions. Additional measures in renewable electricity generation and reintroducing an ambitious carbon pricing mechanism may reduce emissions to a level of between 430 and 625 MtCO2e by 2030 (from 24% below to 12% above 2010 levels), dependent on the assumed price levels. Only the lower end of the range would possibly bring Australia’s emissions back onto a pathway of achieving their earlier committed target for 2050 of 80% below 2000 levels. Increasing renewable electricity generation could have co-benefits, such as stimulating economic development in remote areas.
Figure 2.1
1990 2000 2010 2020 2030
0
200
400
600
800
1000Mt CO2 eq per year
Source: PBL FAIR/TIMER model; Ecofys & NewClimate Institute calculations
pbl.n
l
History Current policies
Planned policies
Enhanced policy scenario (bottom-up)
Enhanced policy scenario (top-down)
Pledge
Kyoto target
Including CO2 emissions from land use
Impact of climate policies on greenhouse gas emissions in Australia
1990 2000 2010 2020 2030
0
200
400
600
800
1000Mt CO2 eq per year
pbl.n
l
Excluding CO2 emissions from land use
1990 2000 2010 2020 2030
0
200
400
600
800
1000Mt CO2 eq per year
pbl.n
l
CO2 emissions from land use
Historical greenhouse gas emissions (excluding LULUCF) based on national inventories submitted to UNFCCC. The LULUCF emission projections, resulting from the current and enhanced policies, are based on the Climate Change Authority (2014). The Kyoto pathway is taken from Climate Action Tracker (2014a). See also Figure 2.2 for details of the enhanced top-down policy trajectory that is calculated by PBL only and, therefore, no range is presented.

38 | Enhanced policy scenarios for major emitting countries
TWO
Table 2.1Greenhouse gas emissions in Australia according to various policy scenarios, including and excluding LULUCF emissions, by 2020 and 2030, relative to 2010 levels
Scenario 2020 2030
Including LULUCF
Pledge* [-24%;-6%]
Kyoto pathway** 3%
Current policies* [16%; 19%] [20%; 36%]
Planned policies* [18%; 22%] [37%; 39%]
Enhanced bottom-up policy scenario [-7%; 10%] [-24%; 12%]
Enhanced top-down policy scenario 5% -3%
Excluding LULUCF
Pledge [-25%; -6%]
Current policies [15%; 18%] [18%; 35%]
Planned policies [17%; 20%] [36%; 38%]
Enhanced bottom-up policy scenario [-6%; 10%] [-23%; 13%]
Enhanced top-down policy scenario 6% -1%
* The LULUCF emission projections are based on Australia’s Sixth National Communication** The Kyoto pathway is taken from Climate Action Tracker (2014a).
Table 2.2Overview of the policies analysed for Australia
Policy status Sector Policy/measure Target
Current policies Energy Supply Policies supporting the implementation of the Renewable Energy Target
Target for renewable electricitygeneration of 20% by 2020, set via Renewable Energy Target Scheme, which aims to install 45 TWh renewable electricity (capacity) by 2020 (of which 41 TWh from large-scale renewable energy installations)
Energy Supply Closure of 2,000 MW brown-coal-fired power plants
Closure of 2,000 MW brown-coal-fired power plants and replacement by highly efficient gas-fired power plants
Agriculture, Waste Carbon Farming Initiative
Planned policies Energy Supply Renewable Energy Target Reduce the target for large-scale renewable energy installations to 27 TWh of electricity generation
Enhanced bottom-up policy scenario
Energy Supply Strengthen renewable energy support
Increase renewable electricity share by 1.35 percentage points per year, reaching 21% by 2020 and 35% by 2030
Industry, transport Carbon Pricing Mechanism Reintroduce a strong carbon price
HFCs Phase-down of HFCs 35% reduction in HFC consumption and production by 2023, 70% by 2029, and 85% by 2035

392 Country sections |
TWO
TWO
2.1.2 Results in detail2.1.2.1 Copenhagen pledgeAustralia has pledged to decrease its emissions by 5%, 15%, or 25% below its 2000 emission level by 2020, including emissions from afforestation, reforestation and deforestation. The higher (15% and 25%) reduction targets are conditional on international action. According to Australia’s Sixth National Communication, these targets would result in respective emission levels of 537, 481 and 424 MtCO2e by 2020, including emissions from LULUCF (Australian Government, 2013). Excluding LULUCF, the emission levels would be 510, 454 and 397 MtCO2e, assuming the same LULUCF emissions under all scenarios1.
In addition to the 2020 pledge, Australia has a commitment under the second commitment period of the Kyoto Protocol (2013–2020), to limit average yearly emissions to 99.5% of 1990 base levels (a 0.5% reduction compared to 1990 levels). However, after taking into account special provisions of the Kyoto Protocol that apply to Australia – which allow it to include deforestation emissions in its base year (1990) – and the Climate Action Tracker assessment of likely aggregate credits due to Kyoto land-use change activities, the Kyoto target could imply levels of greenhouse gas emissions excluding LULUCF of 47% to 59% above 1990 by 2020, based on the Climate Action Tracker (2014a).
2.1.2.2 Current policiesUnder current policies, Australia’s emissions are expected to reach levels of 650 to 665 MtCO2e by 2020 and 670 to 760 MtCO2e by 2030, including LULUCF. These levels are 16% to 19% higher by 2020 and 20% to 36% higher by 2030, compared to 2010 levels (Tables 2.1 and 2.3). The lower limit of the range is based on a reference scenario with a relatively high share of renewable electricity by 2030.
Main policies. On the federal level, Australia has established a Renewable Energy Target (RET), the Carbon Farming Initiative (CFI), and recently passed the Direct Action Plan through Senate, meaning that the ‘Emissions Reduction Fund’ will come into force soon (Table 2.2). The ‘Direct Action Plan’ proposed by the new government has committed AUD 2.55 billion (about 1.8 billion euros) to be put in an ‘Emissions Reduction Fund’ to implement mitigation measures.2
Energy supply. The Australian Government has set a target to achieve 20% of electricity production by 2020 from renewable sources. This target should be achieved through the Renewable Energy Target Scheme (RET). The RET came into force in 2000 with the introduction of the Renewable Energy (Electricity) Act. It provides financial incentives for both small and large-scale renewable electricity installations, aiming at increasing renewable electricity generation capacity to 45 TWh by 2020 (Australian Government, 2014a). Electricity generation from renewable energy sources is currently less than 15%, so an increase to around 20% would be significant.
The Carbon Farming Initiative (CFI), started in 2011, is a market based programme for sectors that were not covered under the repealed Carbon Pricing Mechanism (CPM): agriculture, forestry and waste. It provides a framework for these sectors to generate emission reduction credits and sell them to individuals or organisations that voluntarily offset their emissions (Australian Government, 2014a). Previously, credits from the CFI were also accredited for use under the CPM.
The Emissions Reduction Fund (ERF) replaces the repealed CPM and extends the CFI to other sectors. Through this fund, the Government of Australia will purchase emission reduction credits from mitigation projects, additionally to
Table 2.3Greenhouse gas emissions (including LULUCF) in Australia, according to various policy scenarios for 2005 and 2010, and by 2020 and 2030
Scenario 2005 2010 2020 2030
MtCO2e
Pledge* [425; 535]
Kyoto pathway** 590 [570; 600]
Current policies 610 560 [650; 665] [670; 760]
Planned policies [660; 680] [765; 775]
Enhanced bottom-up policy scenario [520; 615] [430; 625]
Enhanced top-down policy scenario 585 545
* Based on Australia’s Sixth National Communication.** The Kyoto pathway is taken from Climate Action Tracker (2014a).

40 | Enhanced policy scenarios for major emitting countries
TWO
the demand from the voluntary market. The ERF includes measures in the following areas: energy efficiency improvements in the commercial buildings sector, using the coal mine waste gas method3, cleaning up power stations, and efforts in the transport sector and in large industrial facilities (Clean Energy Regulator, 2014). Projects currently run under the CFI will be absorbed by the ERF. The impact of the ERF on future emissions has been analysed in various studies, with varying results (Gerardi, 2013; RepuTex Carbon Analytics, 2013; Hare et al., 2013); therefore, the impact of this plan was not included in our analysis.4
Power plant standard. The power plant standard is an energy efficiency measure introduced in the electricity sector to close down around 2000 MW of inefficient coal-fired electricity production plants. Replacing them by gas-fired power plants, as assumed here, will increase the efficiency of electricity production and decrease CO2 emissions by 5 MtCO2 against a baseline scenario (without current policies) based on PBL calculations.
2.1.2.3 Planned policiesEnergy supply. The Australian Government has announced to cut the RET for large-scale installations from 41 TWh to 27 TWh by 2020 (Maher and White, 2014). This is expected to slow down the installation of additional renewable electricity plants. In our calculations for the planned policies scenario, we assumed that the new target will be achieved and renewable energy generation will have decreased by 14 TWh by 2020, compared to the reference scenario. According to our calculations, this would result in emission levels of 660 to 680 MtCO2e by 2020 and 765 to 775 MtCO2e by 2030 (including LULUCF emissions) (Table 2.3).
2.1.2.4 The enhanced bottom-up policy scenarioThe implementation of enhancement measures could decrease emissions by 50 to 125 MtCO2e by 2020 and by 75 to 320 MtCO2e5 by 2030, relative to those under the current policies scenario (including emission reductions in the LULUCF sector). Reduction levels for both years depend significantly on the carbon pricing level, which explains the large projected emission range (Figure 2.1).
Energy supply. Enhancement of the current renewable energy target – as opposed to the planned decrease in ambition – to best practice policy standards, and also guaranteed continuation beyond 2020, could generate substantial emissions reductions. Long-term targets would provide security to investors and potentially support job creation in the sector (Climate Change Authority, 2012) (Table 2.4). For the enhanced policy scenario, we assume an increase in the share of renewable electricity of 1.35 percentage points per year. This equals the average over the last decade of Germany and the United Kingdom, countries with successful renewable energy policy frameworks. This translates into a renewable share of 21% in Australia by 2020, which is slightly above the implemented target. In 2030, the share of electricity generated by renewable energy technologies would be 35%. According to Ecofys & NewClimate Institute calculations, this would lead to reductions of 43 MtCO2e below the current policies scenario and 58 MtCO2e below the planned policies scenario, by 2030. As the electricity sector is covered by the carbon pricing mechanism (assumed to be reintroduced, see below), there is strong overlap between these policies. Implementing enhanced renewable energy targets and providing financial incentives can, however, provide investment security in times when the carbon price may drop. It further assures that renewable energy projects become an option for mitigation, whereas
Table 2.4Possible areas for enhancement measures in Australia
Area Increased renewable electricity generation Reintroduce Carbon Pricing Mechanism
Implications for the energy mix and greenhouse gas emissions
– Electricity sector share of emissions is currently 40%*
– Overlap with carbon pricing
– Can cover a large range of sectors
Mitigation potential and costs
– Abundant renewable resources available (solar power, wind power, hydropower, geothermal power)**
– Carbon price significant driver of reductions ***
Co-benefits – Economic development in remote areas****
– Possibly job creation and retail competition in electricity market*****
– Dependent on sector and mitigation measure realised
Importance on national level
– Renewable energy target already exists and could be enhanced
– Infrastructure already exists, as a mechanism is already in place
* UNFCCC (2014a); ** Geoscience Australia & BREE (2014); *** Climate change authority (2014); **** Pittock (2011); ***** Climate Change Authority (2012).

412 Country sections |
TWO
TWO
without support they would be less profitable than other projects for purchasing credits.
Reintroduction of a strong carbon pricing mechanism. Considering the Australian Government’s decision to repeal the Carbon Pricing Mechanism in August 2014, emissions in Australia are projected to increase again. Under the enhanced scenario, we assume that a strong carbon pricing mechanism is reintroduced. Ecofys & NewClimate Institute calculations use existing scenarios developed by the Climate Change Authority of Australia (2014), and adapt the projected emission reductions to the reference scenario. Depending on the carbon price, emissions could be reduced by 110 to 290 MtCO2e by 2030. In addition, emissions in the LULUCF sector would also be affected, decreasing from 33 MtCO2e under the current policies scenario to 10 to 19 MtCO2e under the enhanced policies scenario, by 2030 (Climate Change Authority, 2014). PBL also calculated potential reductions, based on calculations by Roelfsema et al. (2013) that assume a full implementation of the formerly implemented pricing mechanism, and also reach the same target level by 2020 as in the original mechanism. The calculated reduction beyond the level under the current policies scenario will be about 57 MtCO2e by 2030 (excluding LULUCF emissions), assuming the same reduction effort against baseline levels (no climate policy) for 2030 as for 2020, and a full overlap between the pricing mechanism and the renewable energy targets.
HFC production and consumption. Under the enhanced scenario, a phase-down schedule for production and consumption of HFCs based on the 2014 North American
Amendment Proposal (Appendix A.5) is assumed. For Australia, categorised as a non-Article 5 Party in the proposal, this would imply a reduction in HFC consumption to levels that will be 10% below the baseline by 2018, 35% by 2023, 70% by 2029 and 85% by 2035 (US EPA, 2014b). The baseline for a non-Article 5 country is calculated as 100% of average HFC consumption and production and 40% of average HCFC consumption and production in 2011 and 2012. According to the PBL and Ecofys & NewClimate Institute calculations, implementation of this reduction schedule in Australia could result in a reduction of about 0 MtCO2e by 2020 and 2 to 6 MtCO2e by 2030, below current-policy emission projections. Projection by Ecofys & NewClimate Institute are based on Australia’s Sixth National Communication (Australian Government, 2013), which is lower than PBL’s business as usual HFC emission projection.
2.1.2.5 The enhanced top-down policy scenarioPBL analysis explored the emission reduction potential by implementing sector-specific technologies, as shown in Table 1.1 and further discussed in Appendix A. Full implementation of these top-down mitigation measures and the land-use mitigation options described above would decrease all greenhouse gas emissions in Australia by about 75 MtCO2e by 2020 and 125 MtCO2e by 2030, compared to the current policies scenario.
The impact of the mitigation options on the energy-related CO2 emissions is illustrated in Figure 2.2. Here we focus on the mitigation measures of Table 1.1, related to the energy-related emissions. The presented results show a total impact lower than the reduction in all
Figure 2.2
2000 2005 2010 2015 2020 2025 2030 2035
0
100
200
300
400
500Energy-related CO2 emissions (Mt CO2 per year)
Source: PBL TIMER model
pbl.n
l
History
Current policies
Enhanced policy scenario(top-down)
Reduction per sector
Electricity
Industry
Transport
Buildings
Contribution of enhanced reduction measures per sector, for Australia
Impact of policies on energy-related CO2 emissions for Australia, per sector, under the enhanced top-down policy scenario. Reductions in this figure are relative to the current policies scenario.

42 | Enhanced policy scenarios for major emitting countries
TWO
greenhouse gases, as it excludes the reductions of the HFC and land-use mitigation options, as described in the sections above.
Figure 2.2 shows that the largest potential to reduce energy-related CO2 emissions is in the electricity and transport sectors, and smaller potential in the industry and buildings sectors (see also Table A.2 in Appendix A.6). The mitigation measures in the electricity sector include an average standard for new power plants of 450 gCO2/kWh from 2015 onwards, which leads to no new coal fired power plants after 2020. The additional reductions in the transport sector come from the enhanced vehicle efficiency standards, which are set as currently discussed in EU (46–49 km/l for new passenger cars by 2035). The effect is mainly due to the relatively low fuel efficiencies in light commercial vehicles in this country and the large car ownership per 1,000 inhabitants (World Bank, 2015). In the building and industry sectors, the largest reductions are shown by heating and insulation measures and the enforcement of advanced type steel furnaces.
2.1.3 Data sources and assumptionsPledgeThe emission levels accounting for the implementation of the pledges are given by the Sixth National Communication of Australia.
Current and planned policies trendsHistorical emissions were taken from the national inventories submitted to UNFCCC. Historical LULUCF emissions were taken from the Climate Change Authority (2014). The emission projections for the period after 2010 by PBL and Ecofys & NewClimate Institute were harmonised with these historical data.
Current policies calculated by Ecofys & NewClimate Institute are based on the ‘no carbon price scenarios’ of the Australian Climate Change Authority (2014). For the planned policies scenario, we replaced 14 TWh in renewable energy in 2020 with power from coal- and gas-fired plants, maintaining the shares of the two fossil fuels in electricity generation as under the current policies scenario. LULUCF emission projections for current policies were taken from the Climate Change Authority’s (2014) ‘no price’ scenario, while projections for enhanced policies were taken from the ‘low price’ and ‘high price’ scenarios. For this report, we used Climate Change Authority data instead of the data from the National Communication because it includes fully consistent data points for the complete time period covered here (1990–2030).
PBL’s update for Australia first extended the projections for current policies to 2030 using the PBL’s baseline emission projection and the methodology of Roelfsema et al. (2013). Key policies included in the analysis for current policies were 1) the closure of 2,000 MW brown-coal-fired power plants and replacement by highly efficient gas-fired power plants, and 2) a renewable energy target of 21.7% for 2020. For the projection of current policies up to 2030, we assumed the same emission reduction effort as for 2020, compared to those under the baseline scenario.
Enhanced policiesFor the enhanced policy scenario, Ecofys & NewClimate Institute calculations considered enhanced renewable energy targets and reintroduction of a carbon pricing mechanism. We assumed that there is 100% overlap, meaning that the emission reductions of the potential pricing mechanism cover those of the increased renewable energy share. For the carbon pricing mechanism, we used the low and the high price scenarios given by the Climate Change Authority (2014) and scaled them to the current policies scenario.
PBL’s analysis for enhanced policies included the same renewable energy target for 2020 as the current policies scenario, because the share of renewable energy in PBL’s baseline scenario is already higher than the target. It further includes a reintroduction of the carbon pricing mechanism with the original emission target level. The emission reduction due to the carbon pricing mechanism was calculated in two steps. First, the national target level for the carbon pricing mechanism (based on the national baseline scenario) was corrected for a 60% coverage of total emissions; and second, the target level was subtracted from the corrected PBL baseline (accounting for the 60% coverage), giving an emission reduction against PBL’s baseline scenario (without climate policy) of about 65 MtCO2e by 2020. Australia’s Sixth National Communication (Australian Government, 2013, see e.g. Table 4.3) confirms that the pricing mechanism is expected to result in larger emission reductions compared to other current policies (such as policies for implementing the renewable energy target). For the projection of enhanced policies to 2030, the same emission reduction effort was assumed as for 2020, compared with that under the PBL baseline scenario. Similar to Ecofys & NewClimate Institute, PBL also assumed 100% overlap between the carbon pricing mechanism and renewable energy targets.

432 Country sections |
TWO
TWO
2.2 Brazil
2.2.1 Summary of resultsUnder current policies, Brazil is expected to reduce emissions by about 10% to 13% below 2010 levels, by 2020, thereby achieving its pledged emission level. Policies on the forestry sector have a significant impact on total emissions; in particular the enforcement of the Brazilian Forest Code and efforts to reduce deforestation in the Amazon and Cerrado regions. The impact of the proposed measures in Cerrado depends on the success of policy implementation. If all implemented and planned policies are successful, emissions (including those from LULUCF) may reach 9% to 16% below 2010 levels by 2030 (Table 2.5). The identified enhancement options for achieving additional
emission reductions are mainly in the LULUCF sector (including enhancement measures related to cattle intensification) and in the transport sector. Measures in these sectors may further decrease emissions to levels of 15% to 26% below 2010 levels, by 2030. Some of these policies have co-benefits; in particular in improvements in cattle management and cattle product output. Examples of such co-benefits connected to those improvements are the smaller land requirement to produce the same amount of output, thus sparing land for other uses, and reduced deforestation.
Figure 2.3
1990 2000 2010 2020 2030
0
500
1000
1500
2000
2500Mt CO2 eq per year
Source: PBL FAIR/TIMER model; Ecofys & NewClimate Institute calculations; IIASA GLOBIOM/G4M model
pbl.n
l
History Current policies
Planned policies
Enhanced policy scenario (bottom-up)
Enhanced policy scenario (top-down)
Pledge
Including CO2 emissions from land use
Impact of climate policies on greenhouse gas emissions in Brazil
1990 2000 2010 2020 2030
0
500
1000
1500
2000
2500Mt CO2 eq per year
pbl.n
l
Excluding CO2 emissions from land use
1990 2000 2010 2020 2030
0
500
1000
1500
2000
2500Mt CO2 eq per year
pbl.n
l
CO2 emissions from land use
Historical greenhouse gas emissions (excluding LULUCF) are based on inventory data submitted to the UNFCCC (until 2005), energy-related CO2 emissions from IEA (2013a), and non-energy-related emissions from EDGAR 4.2 (JRC and PBL, 2012). The LULUCF emission projections, a range resulting from planned and current policies (Table 2.6), are based on IIASA calculations. Historical land-use emissions are based on data from FAOSTAT. See also Figure 4 for details on the enhanced top-down policy trajectory.

44 | Enhanced policy scenarios for major emitting countries
TWO
Table 2.5Greenhouse gas emissions in Brazil, according to various policy scenarios, including LULUCF emissions, by 2020 and 2030, relative to 2010 levels
Scenario 2020 2030
% relative to 2010 levels
Pledge [17%; 22%]
Current policies [-10%; -13%] [-9%; -12%]
Planned policies [-10%; -18%] [-9%; -16%]
Enhanced bottom-up policy scenario [-15%; -22%] [-15%; -26%]
Enhanced top-down policy scenario -17% -21%
Table 2.6Overview of the policies analysed for Brazil
Policy status Sector Policy/measure Target
Current policies Forestry & Agriculture
Implementation of the Brazilian Forest Code for the Amazon region
Energy Supply 10 Year National Energy Expansion Plan– Renewable capacity target
– Renewable mix target
National Plan on Climate Change (2008)– Renewable mix target
38 GW installed by 2022 (17.4 GW wind, 13.8 GW biomass, 6.9 GW small hydropower installations) and 114 GW large hydropower installations by 202241.4% REN share in total primary energy supply
16% REN (electricity, excluding hydropower) by 2020
Planned policies Forestry & Agriculture
Implementation of the Brazilian Forest Code for the Cerrado region and the rest of Brazil
Enhanced bottom-up policy scenario
Forestry & Agriculture
Intensification of cattle farming (part of Low-Carbon Agriculture (ABC) Plan)
Energy Supply Avoid recarbonisation of electricity sector
Keep emission intensity at 2015 levels
Transport Fuel efficiency in transport Achieve vehicle efficiency standards, as currently discussed in the EU, with a five year delay (34.4 km/l for new cars by 2030 and 47.5 by 2035)
HFCs Phase-down of HFCs 30% reduction in HFC consumption and production by 2025, 60% by 2031

452 Country sections |
TWO
TWO
2.2.2 Results in detail2.2.2.1 Copenhagen pledgeBrazil has pledged to reduce its emissions by 36% to 39% by 2020, compared to the projections under their national baseline scenario . The pledge will be implemented in accordance with the principles and provisions of the UNFCCC (UNFCCC, 2011) and is conditional to international financing. It was originally proposed in November 2009 and submitted to the Copenhagen Accord on 29 January 2010. Brazil has regulated this pledge by law, under National Decree No. 7390, December 2010 (Government of Brazil, 2010). Brazil’s baseline scenario projections have also been entered into law, under National Decree No. 7390 (3,235 MtCO2e by 2020).
2.2.2.2 Current policiesAccording to our assessment, the current policies scenario results in a total greenhouse gas emission level of about 1,470 to 1,520 MtCO2e by 2020, which is well below the pledged target, and between 1,490 and 1,540 MtCO2e by 2030 (Table 2.7). Of these levels, about 990 to 1,120 MtCO2e by 2020 and 1,075 to 1, 195 MtCO2e by 2030 are emissions outside the LULUCF sector. LULUCF emissions are about 485 MtCO2e by 2020 and 410 MtCO2e by 2030, depending on the reference development (baseline estimates taken from IIASA). The LULUCF emissions projections are harmonised with historical 1990–2010 emissions from the FAOSTAT emission database (for further details, see Section 2.2.3 and Box 2.1).
Main policies. Brazil has been implementing climate related policies in all main emitting sectors. The largest emission
reductions in Brazil are to be expected from the agricultural and forestry sectors, and high reductions have been achieved in these sectors already. This is mainly due to the already occurring reduction in deforestation in the Amazon (Figure 2.3). There are several policies that affect emissions in these sectors. In 2010, the Brazilian Government approved the Federal Decree No. 7390, which lists sectoral plans and initiatives to achieve emission reductions. In order to achieve the targeted reduction in emissions from deforestation, an Action Plan for Deforestation Prevention and Control in the Legal Amazon (PPCDAm) and an Action Plan for Deforestation Prevention and Control in the Cerrado region (PPCerrado) have been implemented. Furthermore, a Low-Carbon Agriculture Plan (ABC Plan) has been implemented, targeting emission reduction in the agricultural sector. Here we will concentrate on these three plans through the fulfilment of the revised Brazilian Forest Code which has been officially sealed through Law 12.651 and was ratified in 2012. In our calculations we evaluate the implementation of the PPCDAm in the current policies, PPCerrado in the planned policies, and the ABC plan in the enhanced policies. PPCerrado is considered as planned policy, due to implementation barriers. The main barrier for implementing the PPCerrado is perceived to be the setting up of monitoring systems similar to those being used for the PPCDAm and reaching acceptance to enforce the targets.
Forestry and agriculture. If the policies on forestry and agriculture as discussed above would be achieved, it is estimated that the national LULUCF emissions would be
Table 2.7Greenhouse gas emissions in Brazil, according to various policy scenarios, including and excluding LULUCF emissions, for 2005 and 2010 and by 2020 and 2030
Scenario 2005 2010 2020 2030
MtCO2e Including LULUCF
Pledge [1,975, 2,070]
Current policies 2,060 1,690 [1,470; 1,520] [1,490; 1,540]
Planned policies [1,390; 1,520] [1,425; 1,540]
Enhanced bottom-up policy scenario [1,330; 1,445] [1,260; 1,435]
Enhanced top-down policy scenario 1,410 1,350
Scenario 2005 2010 2020 2030
MtCO2e Excluding LULUCF
Pledge [1,080; 1,170]
Current policies 865 900 [990; 1,120] [1,075; 1,195]
Planned policies [990; 1,120] [1,075; 1,195]
Enhanced bottom-up policy scenario [970; 1,085] [965; 1,140]
Enhanced top-down policy scenario 1,050 1,055

46 | Enhanced policy scenarios for major emitting countries
TWO
960 MtCO2e by 2020 and 905 MtCO2e by 2030. The contribution of each individual policy is discussed below.
The Action Plan for Deforestation Prevention and Control in the Legal Amazon (PPCDAm) calls for an 80% reduction in the annually deforested area in the Amazon Rainforest by 2020, compared to the historical average over the 1996–2005 period. According to national projections, which are based on annually deforested area and assuming a constant average biomass density (484 tCO2/ ha), this would reduce emissions by roughly 760 MtCO2e by 2020. IIASA calculations are based on the assumption that deforestation emissions already decline in the IIASA baseline due to changes in socio-economic drivers and therefore come to lower estimates of emission reduction from deforestation by the PPCDAm. Projections by IIASA estimate that the PPCDAm could potentially reduce emissions by roughly 210 MtCO2e by 2020 assuming that the Forest Code is not implemented for the Amazon (see further comment below).
Brazil belongs to the few non-Annex I countries (together with India and Mexico) that currently have suitable capacities and long experience in forest inventories and monitoring (Romijn et al., 2012). Based on satellite information, Brazil can track deforestation events at real time and with high accuracy. Therefore, uncertainties in emissions are likely to decrease in the future. Projections of national and international models diverge because of methodological differences (Groen et al., 2013).
Apart from action plans to curb deforestation, Brazil announced policies to restore grazing land, in order to increase productivity and carbon storage in grasslands. According to Brazilian estimates, these policies could achieve an annual emission reduction of 83 to 104 MtCO2e (UNFCCC, 2011). However, according to IIASA calculations, a reduction of this size would require additional management measures for approximately 15% to 25% of total Brazilian pasture area, assuming a constant and generic carbon sequestration rate. This is about twice the pasture area targeted by the policies, implying that there are uncertainties regarding the average sequestration potential and the implementation of the policy. We therefore assumed that policies targeted at grassland restoration will only realise 50% of the expected emission reductions, resulting in a reduction of 40 to 50 MtCO2e by 2020.
Another policy that possibly could lead to higher carbon sequestration in the future is forest restoration on illegally deforested areas. The Brazilian Forest Code severely restricts deforestation on private properties through Legal Reserve and Areas of Permanent Preservation. Legal Reserve forces private owners to set aside a certain
share of their properties (e.g. 80% of the total property area in the Legal Amazon) and forbid conversion of natural vegetation on Areas of Permanent Preservation that are environmentally sensitive areas. After a lot of debate, the Brazilian Forest Code has now been revised. However, the enforcement of the Forest Code has proved to be challenging in the past and we assumed for these estimates that the Forest Code will only be successfully implemented for the Amazon region. IIASA calculations project that the potential emission reduction resulting from the Forest Code is in the order of 90 MtCO2e by 2020.
Energy supply and transport. In addition to measures related to land use, Brazil states in its national 10-year plan for Energy Expansion6 that the country will triple its use of ‘new’ energy (excluding large hydropower installations) by 2020: from 9 GW in wind and biomass energy and small hydropower installations in 2010, to 38 GW by 2022 (17.4 GW wind power, 13.8 GW biomass, 6.9 GW small hydropower installations). In addition, 114 GW from large hydropower installations is planned. This would result in a 16% share of renewable electricity (excluding large hydropower installations) by 2020. If these targets are achieved, they would result in significant emission reductions by 2020. The current update also includes additional policies (biofuel quotas) in the transport sector, although these will have only a limited impact on emissions.
Change compared to earlier analysis. Our 2020 emission projections for Brazil, based on current policies, are significantly lower than those in an earlier study (Roelfsema et al., 2013). This is mainly due to the lower projections for LULUCF CO2 emissions in this study, because we accounted for the most recent historical emission trend.
2.2.2.3 Planned policiesForestry. An additional measure in Brazil to reduce emissions as analysed here is the Action Plan for Deforestation Prevention and Control in the Cerrado region (PPCerrado). PPCerrado calls for a 40% reduction in the annual deforestation area in the savannahs, compared to the historical 1999–2008 average. When assuming a constant biomass density (206 tCO2/ha) in the savannah, this measure could avoid emissions of about 130 MtCO2e by 2020, compared to national projections. The main component in achieving this reduction is the implementation of the Forest Code for the Cerrado region and rest of Brazil. The new Brazilian Forest Code is valid on a national level and could as such be enforced in all of Brazil, through the implementation of a strong monitoring system of deforestation and forest degradation. IIASA calculations project that the

472 Country sections |
TWO
TWO
implementation of the Forest Code for the whole of Brazil is expected to reduce emissions from the LULUCF sector by roughly 80 MtCO2e by 2020.
2.2.2.4 The enhanced bottom-up policy scenarioImplementing additional policies linked to current trends and domestic circumstances in the transport and the power sectors, emissions in Brazil could reach 970–1,085 MtCO2e by 2020 and 965–1,140 MtCO2e by 2030 excluding LULUCF (Table 2.7). With increased ambition levels with respect to cattle farming intensification, emissions in the LULUCF sector could be 850 to 840 MtCO2e by 2020 and 820 to 810 MtCO2e by 2030.
Forestry and agriculture. An enhanced policy scenario for Brazil that has been analysed is that of Intensification cattle farming. This policy could potentially be implemented as part of the ABC agricultural plan. Brazil has a significant cattle farming sector which is impacting the deforestation development in Brazil (Alston and Libecap, 1999; Bowman et al., 2011). Intensification of cattle farming would spare land and decrease the pressure for deforestation (Table 2.8). However, currently few incentives exist for improving productivity in management practices and incorporating best practices in cattle farming. A significant amount of research and
development has been done on best management practices (boas práticas); however, such practices are not yet widespread, partly due to high up-front costs (Cohn et al., 2014).
For the analysis of the enhanced policy scenario, the IIASA economic land-use model was used. The policy was analysed in the form of a subsidy for semi-intensive pasture and the adoption of best management practices. The subsidy was evaluated in the form of an annual per hectare payment to all cattle ranches that adopt the semi-intensive system. The IIASA analysis found that the policy could potentially induce moderate sparing of land, which in turn would lead to a moderate abatement of emissions. One of the reasons that the policy only has a moderate effect is that the subsidy is projected to lead to an expansion of the livestock sector, thereby increasing emissions from the agricultural sector. Our analysis indicates that the policy could lead to reductions within the range of 35 MtCO2e by 2020 and 25 MtCO2e by 2030 (Table 2.9).
Fuel efficiency in transport. Brazil has a substantial share of biofuels in transport (roughly a quarter) and all cities with more than 20,000 inhabitants are developing urban mobility plans to improve transport in cities (Owen et al.,
Table 2.8Possible areas for enhancement measures in Brazil *
Intensification of cattle farming***
Fuel efficiency in transport Avoiding recarbonisation of electricity supply
Implications for the energy mix and greenhouse gas emissions
– Would induce land sparing and reduce greenhouse gas emissions from land-use change
– Already high share of biofuels – Would keep carbon intensity at current low levels (opposed to the increase under the World Energy Outlook Current Policies scenario)
– Would increase the share of renewable energy
Mitigation potential and costs
– Potential to reduce deforestation
– Cost in the form of subsidy for semi-intensive pasture farming
– Low-cost option in transport sector****
– n/a
Co-benefits – Improvements in cattle management and cattle product output
– Fewer emissions of other pollutants
– Energy security through fuel saving**
– Reduce smog-related respiratory and visibility problems**
– Renewable energy allows participation of smaller players in market, e.g. roof top solar
– Reduce smog-related respiratory and visibility problems**
Importance on national level
– Reduce the pressure on deforestation from the expansion of cattle farming
– Fuel economy complements other policies in the transport sector well (biofuels, urban mobility)
– Stop recarbonisation trend through the exploitation of fossil fuel reserves
– Avoid lock-in fossil fuel structures
* Main sources: IRENA (2011a), Brazilian Ministry of Mines and Energy (2007), De Gouvello (2010), McKinsey & Company (2009a) and OECD, IEA (2011); ** World Bank and ClimateWorks Foundation (2014); *** Cohn et al. (2014); **** McKinsey & Company (2009a, p.100).

48 | Enhanced policy scenarios for major emitting countries
TWO
2012). However, little incentives for efficiency improvement exist. In fact, there has been a trend towards larger cars in the recent years, moving specific fuel consumption upwards. With an increasing share of light commercial vehicles in passenger transport, developments in the fuel economy of these type of vehicles largely influence the projected emissions.
For the enhanced policy scenario, we assume that Brazil can complement its already existing mitigation policies in transport with a fuel economy standard as described in Appendix A.2. This means a linear development from today’s level towards a fuel economy standard of 47.5 km/l for newly sold cars by 2035. The impact of such a standard would show in the medium to long term, in terms of emission reductions, by changing the efficiency of the overall stock as new cars are produced. Ecofys & NewClimate Institute further assumed an emission factor for biofuels that is 35% lower than the emission factor for conventional fuels, and applied that factor to the share of biofuels by 2020. According to PBL and Ecofys & NewClimate Institute calculations, these enhanced transport policies could lead to a decrease in emissions in comparison to today, opposed to the increasing trend with current policies. Relative to the current policies scenario, reductions will be 12 to 37 MtCO2e by 2020 and 57 to 100 MtCO2e by 2030.
Avoid recarbonisation of electricity sector. Given fossil fuel reserves, the carbon intensity of electricity supply is currently expected to grow. Especially imported coal is currently an economically attractive option. Promoting renewable energy and as such investing in a long-term sustainable infrastructure may counter this trend. Other technologies aside from large hydropower installations still have significant potential and their deployment can involve smaller stakeholders and thus generate new sources of income. In the enhanced bottom-up policy scenario, emission intensity is assumed to remain at current levels of 71 g/kWh (IEA, 2013c). Our calculations show that avoiding recarbonisation in that way has a moderate impact on emissions in the short term, because
our reference scenarios do not yet include a strong increase in coal use. Keeping emission intensity at current levels would – for the Ecofys & NewClimate Institute analysis – lead to reductions of 7 MtCO2e by 2020 and 24 MtCO2e by 2030, compared to the current policies scenario. For this scenario, the World Energy Outlook Current Policies scenario (IEA, 2013c) is assumed. In the PBL analysis there is no effect, as the intensity level decreases further under the PBL baseline scenario, which already includes significant hydropower production and bio-energy from co-fired power plants.
HFC production and consumption. A full implementation of the reduction scheme for the production and consumption of HFCs based on the 2014 North American Amendment Proposal (Appendix A.5) is assumed. For Brazil, categorised as an Article 5 Party7 in the proposal, this would imply a reduction in HFC consumption to levels that would be 30% below the baseline by 2025 and 60% by 2031 (US EPA, 2014b). The baseline for Article 5 countries is calculated as the sum of the 100% of the average HFC consumption and production and 40% of the average HCFC consumption and production, over the 2011–2012 period. PBL and Ecofys & NewClimate Institute calculations show a reduction below the current policies scenario of about 0 MtCO2e by 2020 and 14 to 15 MtCO2e by 2030.
2.2.2.5 The enhanced top-down policy scenarioFull implementation of the top-down mitigation measures (see Table 1.1) is projected to decrease all greenhouse gas emissions in Brazil by about 110 MtCO2e by 2020 and 190 MtCO2e by 2030, compared to the current policies scenario.
The impact of the mitigation options on the energy-related CO2 emissions is illustrated in Figure 2.4 and in Table A.2 (Appendix A.6). The largest potential to reduce energy-related CO2 emissions is in the transport and industry sector. The assumed mitigation measures in the transport sector are the same as in the enhanced bottom-up scenario (see previous section). As existing fuel
Table 2.9Estimated greenhouse gas emissions* resulting from policies, as calculated by IIASA
MtCO2e/y Emissions source 2020 2030
Current policies Emissions from forestry 480 410
Emissions from agriculture 480 495
Planned policies Emissions from forestry 400 350
Emissions from agriculture 475 495
Additional intensification of cattle farming
Emissions from forestry 360 300
Emissions from agriculture 480 520
Emissions are expressed in MtCO2e/y and separated into those from forestry and agriculture. Emissions from agriculture include CO2, N2O and CH4.

492 Country sections |
TWO
TWO
Figure 2.4
2000 2005 2010 2015 2020 2025 2030 2035
0
200
400
600
800Energy-related CO2 emissions (Mt CO2 per year)
Source: PBL TIMER model
pbl.n
l
History
Current policies
Enhanced policy scenario(top-down)
Reduction per sector
Electricity
Industry
Transport
Buildings
Contribution of enhanced reduction measures per sector, for Brazil
Impact of policies on energy-related CO2 emissions for Brazil, per sector, under the enhanced top-down policy scenario. Reductions in this figure are relative to the current policies scenario.
Box 2.1 Assumptions about and sources of LULUCF emissions (in detail)The land-use emission projection for Brazil is to a large extent influenced by the harmonisation procedure being used to link historical emissions to the projections by GLOBIOM. The approach selected for this project is to harmonise the land-use emissions as provided by GLOBIOM to FAOSTAT estimates for the year 2010 (see Appendix B for further details of this procedure).With this approach, the GLOBIOM estimated emissions are harmonised with the estimates as provided by the FAOSTAT (roughly 420 MtCO2e from agriculture and 790 MtCO2e from Forest Land). However, there are large uncertainties in the forest land-use emissions as of 2010 and large variations in the estimates have been provided. As an example, the Brazilian Ministry of Science, Technology and Innovation (2013) has estimated that the land-use change emissions in Brazil were roughly 420 MtCO2e in 2010. This estimate is based on a deforestation rate in the Amazon area of 0.7 Mha/year as estimated by INPE-PRODES (2015) and a deforestation rate in the Cerrado of 0.3 Mha/year as estimated by UFG-LAPIG (2015).However, these national estimates are not taken into account within the FAOSTAT dataset which still provide high estimates of land-use emissions. FAOSTAT emission estimates are applying area and carbon stocks data as of FAO FRA 2010, which provides deforestation rate of 2.4 Mha/year for the whole of Brazil. To provide a consistent approach between countries, the FAOSTAT estimates of land-use emissions was also used to harmonise GLOBIOM numbers for Brazil. However, we do recognise that the choice of source of data to which the GLOBIOM estimates are harmonised to has a large influence on the projections. If estimates of deforestation rate for Brazil where to be provided in the FAO FRA 2015 in line with Brazilian estimates as above, the projected LULUCF emission for Brazil would change significantly.
50 | Enhanced policy scenarios for major emitting countries
TWO
efficiencies in transport are relatively low in Brazil, the potential for reduction is relatively high. In the industry sector, the largest emission reductions are achieved by both the implementation of good housekeeping measures and the enforcement of advanced type of steel furnaces. The power plant standard in the electricity sector has a relatively low impact, as the share of renewable energy (especially hydropower) in this sector is already substantial in the current policies situation. The measures in the buildings sector have a relatively small effect on emissions in Brazil compared to other sectors. Within this sector the largest reductions are achieved by the ban on incandescent light bulbs.
2.2.3 Data sources and assumptionsPledgeThe baseline national greenhouse gas emissions and forestry CO2 emissions projections were taken from Brazil’s Second National Communications (Federative Republic of Brazil, 2010).
Current trendsProjections by Ecofys & NewClimate Institute are based on those in the World Energy Outlook 2013 Current Policies scenario for energy-related CO2 emissions, which is up to 2030 (IEA, 2013c), the US EPA non-CO2 emission projections up to 2030 (US EPA, 2012), inventory data submitted to the UNFCCC for historical information up to 2005, energy-related CO2 emissions from IEA (2013a), and historical non-energy-related emissions from the EDGAR 4.2 database (JRC and PBL, 2012). World Energy Outlook data were further updated with information from the most recent Ten Year Energy Expansion Plan. The PBL projections include projections as calculated by the IMAGE TIMER energy model (Van Vuuren et al., 2014) in an updated analysis including all policy options, and results were harmonised with the emission trend as used by Ecofys & NewClimate Institute.
Data on historical land-use emissions are from the FAOSTAT data (http://faostat3.fao.org/faostat-gateway). The projections of land-use emissions are based on GLOBIOM model calculations of IIASA, and harmonised with the historical emissions trend from the FAOSTAT data.

512 Country sections |
TWO
TWO
2.3 Canada
2.3.1 Summary of resultsUnder current policies, Canada’s emissions are projected to be about 720 to 760 MtCO2e by 2020 and 665 to 815 MtCO2e by 2030 (excluding LULUCF emissions). Projected emissions that include those from LULUCFs are lower, but this highly depends on the projected LULUCF emissions, which is uncertain. Canada’s policy with the largest projected effect is that on the fuel efficiency standard for passenger vehicles, which is harmonised with US standards and will be introduced in two phases. Another policy is the carbon standard for newly built coal-fired power plants. This standard is projected to have only a small effect on 2020 emission levels, as it does not affect existing power plants. Under current
policies, Canada will not achieve its Copenhagen pledge of 610 MtCO2 e by 2020 (excluding land-use emissions). Our analysis assumes no significant additional effect of planned policies for Canada.Enhancement measures in the transport and power sectors and the reduction in methane emissions could result in emission levels of 680 to 720 MtCO2e by 2020 and 585 to 710 MtCO2e by 2030. Although this represents a significant reduction in emissions below the level under current policies, it would not be sufficient to meet the Copenhagen pledge. A co-benefit of these policies is the expected improvement in air quality.
Figure 2.5
1990 2000 2010 2020 2030
-200
0
200
400
600
800
1000Mt CO2 eq per year
Source: PBL FAIR/TIMER model; Ecofys & NewClimate Institute calculations
pbl.n
l
History Current policies
Enhanced policy scenario (bottom-up)
Enhanced policy scenario (top-down)
Pledge
Excluding CO2 emissions from land use
Impact of climate policies on greenhouse gas emissions in Canada
1990 2000 2010 2020 2030
-200
0
200
400
600
800
1000Mt CO2 eq per year
pbl.n
l
CO2 emissions from land use
Historical greenhouse gas emissions (including those from LULUCF) are based on national inventories submitted to UNFCCC. The LULUCF emission projection is based on Canada’s Sixth National Communication (Government of Canada, 2014) (assuming a constant emission level after 2020). See also Figure 2.6 for details of the enhanced top-down policy trajectory.

52 | Enhanced policy scenarios for major emitting countries
TWO
Table 2.10Greenhouse gas emissions in Canada, according to various policy scenarios, excluding LULUCF emissions, by 2020 and 2030, relative to 2010 and 2005 levels
Scenario 2020 2030 2020 2030
Relative to 2010* Relative to 2005*
Pledge -13% -17%
Current policies [3%; 9%] [-5%; 17%] [-3%; 4%] [-11%; 11%]
Enhanced bottom-up policy scenario [-3%; 3%] [-17%; 2%] [-3%; -8%] [-23%; -4%]
Enhanced top-down policy scenario -2% -17% -7% -21%
* Here reductions relative to 2010 excluding LULUCF are presented. The reductions relative to 2010 levels (including LULUCF) highly depend on the projected LULUCF emissions. Reductions including LULUCF are different.
Table 2.11Overview of the policies analysed for Canada
Policy status Sector Policy/measure Target
Current policies Energy Supply Standard for new power plants 420 gCO2/kWh from 1 July 2015
Transport Efficiency standards light commercial vehicles
34.1 mpg (14.9 km/l) by 2017, 55 mpg (23.2 km/l) by 2025
Efficiency standards heavy-duty trucks Differs per type of truck
Enhanced policies(bottom-up)
Energy Supply Strengthen renewable energy support Increase the share of non-hydro renewable energy by 1.35 percentage points per year, up to 11% by 2020 and 25% by 2030
Transport Enhanced fuel economy Efficiency standards for light commercial vehicles
Achieve efficiency standards as currently implemented and discussed in the EU (47.5 km/l for new cars by 2030)
HFCs Phase-down of HFCs 35% reduction in HFC consumption and production by 2023, 70% by 2029, and 85% by 2035
Oil and gas Methane emission reductions 40% to 45% reduction from 2012 level by 2025
2.3.2 Results in detail2.3.2.1 Copenhagen pledgeCanada has pledged to reduce its emissions by 17% below 2005 levels, mirroring the target proposed by the United States. Canada’s pledge is conditional on the passing of domestic legislation. The emission target level is 610 MtCO2e for 2020 (excluding land-use emissions), compared to the 2005 level of 735 MtCO2 e. Emission projections that include LULUCFs are lower, but highly depend on the projected LULUCF emission level, which is uncertain (see Section 2.3.3).
2.3.2.2 Current policiesThe most important national climate policies include a carbon standard for new coal-fired power plants and a fuel efficiency standard for light commercial vehicles (Table 2.11). Current policies are expected to lead to total emissions of 720 to 760 MtCO2e by 2020 and 665 to
815 MtCO2e by 2030 (both excluding LULUCF emissions) (Table 2.12).
Energy supply. The standard for coal-fired power plants was published in September 2012 as a regulation under the Canadian Environmental Protection Act (CEPA) of 1999. This standard will come into effect in mid-2015 (Environment Canada, 2012). Power plants constructed after July 2015 will have to keep their emissions below 420 gCO2/kWh, which is the emissions intensity level of Natural Gas Combined Cycle technology, a high efficiency type of power generation using natural gas. We project only a small effect of this standard on 2020 emissions levels, because the standard does not affect existing power plants (which may well be in operation for another 50 years), and because CCS-ready (carbon capture and storage) power plants do not fall under this regulation. Furthermore, the share of coal is also projected to

532 Country sections |
TWO
TWO
decrease under national baseline scenarios, in favour of natural gas.
The fuel efficiency standards limit the average emission intensity of light commercial vehicles and heavy-duty vehicles manufactured in Canada. While the standards are less ambitious than those in for example the EU, they reflect a significant improvement in comparison to baseline levels and may lead to emission reductions especially in the medium to long term. The fuel efficiency standard for light commercial vehicles is harmonised with US standards, and will be introduced in two phases. The first phase covers the 2012–2016 period, and the second phase, with higher standards, the 2017–2025 period. Full implementation of these standards for light commercial vehicles implies an average fuel economy of 19.6 km/l for new passenger cars and 13.1 km/l for new light commercial vehicles by 2025. This will be a respective improvement of 41% and 37%, compared to model year 2010 (Environment Canada, 2014). The first phase and second phase of the standards for light commercial vehicles has already been included in the baseline emission projection of Environment Canada. Emissions
from cars and trucks will decrease from around 150 MtCO2e in 2010 to 140 MtCO2 by 2030 according to the Government of Canada 2014 projections and to 105 MtCO2 according to the PBL analysis. Both projections take the implementation of fuel efficiency standards into account.
2.3.2.3 The enhanced bottom-up policy scenarioThe implementation of enhancement measures in the areas of light commercial vehicles and renewable electricity supply could decrease emissions to 680 to 720 MtCO2e by 2020 and 585 to 710 MtCO2e by 2030, compared to the current policies scenario (both excluding land-use emissions). This reduction can mainly be achieved by increasing the share of non-hydro renewable energy in the electricity supply. Although implementation of these enhancement measures would result in a strong deviation from the current policies pathway, these measures are not enough to meet Canada’s Copenhagen pledge (Table 2.12).
Enhanced fuel economy standards for light commercial vehicles. Canada has already introduced fuel efficiency standards for new passenger vehicles and heavy-duty vehicles, as
Table 2.12Greenhouse gas emissions in Canada, according to various policy scenarios, excluding LULUCF emissions, for 2005 and 2010 and by 2020 and 2030
Scenario 2005 2010 2020 2030
MtCO2e
Pledge 610
Current policies 735 700 [720; 760] [665; 815]
Enhanced bottom-up policy scenario [680; 720] [585; 710]
Enhanced top-down policy scenario 690 585
Table 2.13Possible areas of enhancement measures in Canada
Area Increased renewable electricity generation Transport efficiency
Implications for the energy mix and greenhouse gas emissions
– Share of non-hydro renewable energy only 2% in 2011***
– Transport is currently the largest emitting sector***
Mitigation potential and costs – High potential for wind and solar power* – Large mitigation potential*
Co-benefits – Improved air quality*****
– Job creation– Decreased household expenditure on fuels****
– Improvements in air quality****/*****
– Decrease in the emission of other pollutants *****
Importance on national level – Several provinces have already adopted renewable energy generation or capacity targets**/***
– Canada is amongst the top 5 countries investing in wind energy***
– Implemented vehicle efficiency standard could be further strengthened
– Substantial transport demand due to vast land area*
Main sources: *SDSN & IDDRI (2014), **REN21 (2014a) ***Government of Canada (2014) **** World Bank & ClimateWorks Foundation (2014) *****Caton & Constable (2000).
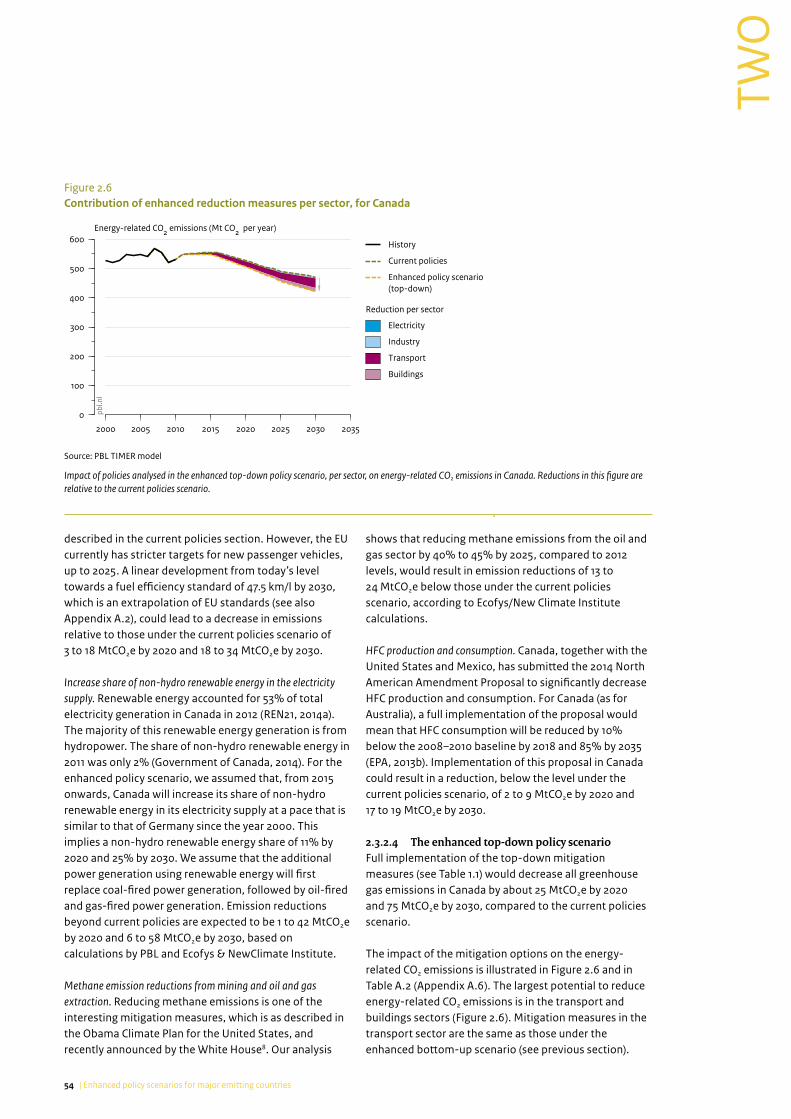
54 | Enhanced policy scenarios for major emitting countries
TWO
described in the current policies section. However, the EU currently has stricter targets for new passenger vehicles, up to 2025. A linear development from today’s level towards a fuel efficiency standard of 47.5 km/l by 2030, which is an extrapolation of EU standards (see also Appendix A.2), could lead to a decrease in emissions relative to those under the current policies scenario of 3 to 18 MtCO2e by 2020 and 18 to 34 MtCO2e by 2030.
Increase share of non-hydro renewable energy in the electricity supply. Renewable energy accounted for 53% of total electricity generation in Canada in 2012 (REN21, 2014a). The majority of this renewable energy generation is from hydropower. The share of non-hydro renewable energy in 2011 was only 2% (Government of Canada, 2014). For the enhanced policy scenario, we assumed that, from 2015 onwards, Canada will increase its share of non-hydro renewable energy in its electricity supply at a pace that is similar to that of Germany since the year 2000. This implies a non-hydro renewable energy share of 11% by 2020 and 25% by 2030. We assume that the additional power generation using renewable energy will first replace coal-fired power generation, followed by oil-fired and gas-fired power generation. Emission reductions beyond current policies are expected to be 1 to 42 MtCO2e by 2020 and 6 to 58 MtCO2e by 2030, based on calculations by PBL and Ecofys & NewClimate Institute.
Methane emission reductions from mining and oil and gas extraction. Reducing methane emissions is one of the interesting mitigation measures, which is as described in the Obama Climate Plan for the United States, and recently announced by the White House8. Our analysis
shows that reducing methane emissions from the oil and gas sector by 40% to 45% by 2025, compared to 2012 levels, would result in emission reductions of 13 to 24 MtCO2e below those under the current policies scenario, according to Ecofys/New Climate Institute calculations.
HFC production and consumption. Canada, together with the United States and Mexico, has submitted the 2014 North American Amendment Proposal to significantly decrease HFC production and consumption. For Canada (as for Australia), a full implementation of the proposal would mean that HFC consumption will be reduced by 10% below the 2008–2010 baseline by 2018 and 85% by 2035 (EPA, 2013b). Implementation of this proposal in Canada could result in a reduction, below the level under the current policies scenario, of 2 to 9 MtCO2e by 2020 and 17 to 19 MtCO2e by 2030.
2.3.2.4 The enhanced top-down policy scenarioFull implementation of the top-down mitigation measures (see Table 1.1) would decrease all greenhouse gas emissions in Canada by about 25 MtCO2e by 2020 and 75 MtCO2e by 2030, compared to the current policies scenario.
The impact of the mitigation options on the energy-related CO2 emissions is illustrated in Figure 2.6 and in Table A.2 (Appendix A.6). The largest potential to reduce energy-related CO2 emissions is in the transport and buildings sectors (Figure 2.6). Mitigation measures in the transport sector are the same as those under the enhanced bottom-up scenario (see previous section).
Figure 2.6
2000 2005 2010 2015 2020 2025 2030 2035
0
100
200
300
400
500
600Energy-related CO2 emissions (Mt CO2 per year)
Source: PBL TIMER model
pbl.n
l
History
Current policies
Enhanced policy scenario(top-down)
Reduction per sector
Electricity
Industry
Transport
Buildings
Contribution of enhanced reduction measures per sector, for Canada
Impact of policies analysed in the enhanced top-down policy scenario, per sector, on energy-related CO2 emissions in Canada. Reductions in this figure are relative to the current policies scenario.

552 Country sections |
TWO
TWO
Emission reductions in this sector are relatively high because existing fuel efficiencies are relatively low in Canada, while car ownership per 1,000 inhabitants is relatively high (World Bank, 2015). In the buildings sector, the reductions are almost completely due to the implementation of advanced heating and insulation technologies. This is probably because of the large space heating demand. Notable is the small effect in the electricity sector. This effect is only small, because the Canadian Government has already implemented a standard for coal-fired power plants in its current policies.
2.3.3 Data sources and assumptionsPledgeThe target for 2020 was calculated from the most recent UNFCCC national inventory submissions.
Current trendsEcofys & NewClimate Institute projections are based on the with measures scenario from Canada’s Sixth National Report on Climate Change (Government of Canada, 2014). PBL projections used the IMAGE TIMER energy model (Van Vuuren et al., 2014) for an updated analysis including all policy options, as summarised in Table 2.11. The projections were harmonised with historical 1990–2010 emissions from the UNFCCC National Inventory Submissions for Canada. Forestry emissions were also taken from the Sixth National Communications of Canada.
LULUCF emissionsLULUCF emission projections for Canada are based on their Sixth National Communications (Government of Canada, 2014) and it is assumed that emission levels stay constant after 2020. Canada’s LULUCF emissions are highly correlated with the development of the forest carbon stock, which is also foreseen as the main driver of the negative LULUCF emissions from 2020 onwards. This development is also foreseen in the IIASA projections of LULUCF emissions for Canada. However, given the notable impact of extreme natural disturbances such as fire and outbreak of insect infestations on Canada’s forests, the LULUCF projections for Canada are uncertain. Another source of uncertainty is that of future forest management activities and harvest levels. If the ongoing restructuring of the Canadian forest sector will lead to increased competitiveness of domestically produced wood products, and if economic developments for main trading partners continue to be positive, forest harvest levels are likely to increase and will impact LULUCF emission levels.
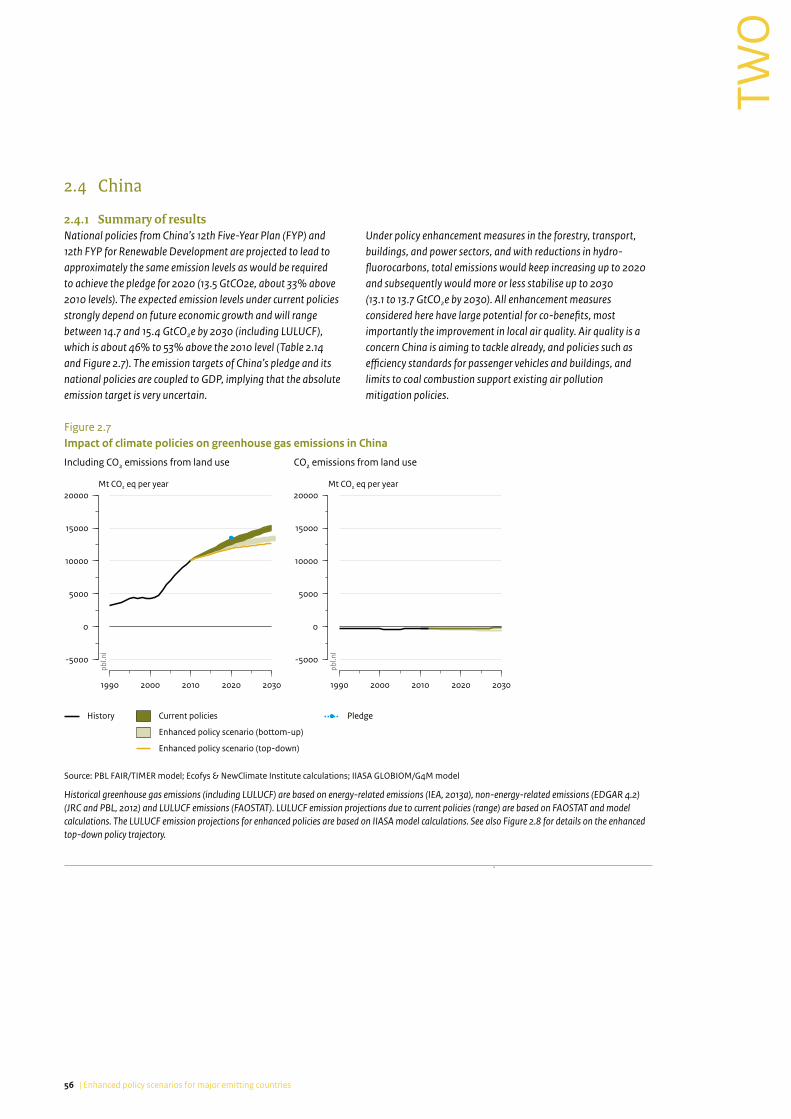
56 | Enhanced policy scenarios for major emitting countries
TWO
2.4 China
2.4.1 Summary of resultsNational policies from China’s 12th Five-Year Plan (FYP) and 12th FYP for Renewable Development are projected to lead to approximately the same emission levels as would be required to achieve the pledge for 2020 (13.5 GtCO2e, about 33% above 2010 levels). The expected emission levels under current policies strongly depend on future economic growth and will range between 14.7 and 15.4 GtCO2e by 2030 (including LULUCF), which is about 46% to 53% above the 2010 level (Table 2.14 and Figure 2.7). The emission targets of China’s pledge and its national policies are coupled to GDP, implying that the absolute emission target is very uncertain.
Under policy enhancement measures in the forestry, transport, buildings, and power sectors, and with reductions in hydro-fluorocarbons, total emissions would keep increasing up to 2020 and subsequently would more or less stabilise up to 2030 (13.1 to 13.7 GtCO2e by 2030). All enhancement measures considered here have large potential for co-benefits, most importantly the improvement in local air quality. Air quality is a concern China is aiming to tackle already, and policies such as efficiency standards for passenger vehicles and buildings, and limits to coal combustion support existing air pollution mitigation policies.
Figure 2.7
1990 2000 2010 2020 2030
-5000
0
5000
10000
15000
20000Mt CO2 eq per year
Source: PBL FAIR/TIMER model; Ecofys & NewClimate Institute calculations; IIASA GLOBIOM/G4M model
pbl.n
l
History Current policies
Enhanced policy scenario (bottom-up)
Enhanced policy scenario (top-down)
Pledge
Including CO2 emissions from land use
Impact of climate policies on greenhouse gas emissions in China
1990 2000 2010 2020 2030
-5000
0
5000
10000
15000
20000Mt CO2 eq per year
pbl.n
l
CO2 emissions from land use
Historical greenhouse gas emissions (including LULUCF) are based on energy-related emissions (IEA, 2013a), non-energy-related emissions (EDGAR 4.2) (JRC and PBL, 2012) and LULUCF emissions (FAOSTAT). LULUCF emission projections due to current policies (range) are based on FAOSTAT and model calculations. The LULUCF emission projections for enhanced policies are based on IIASA model calculations. See also Figure 2.8 for details on the enhanced top-down policy trajectory.
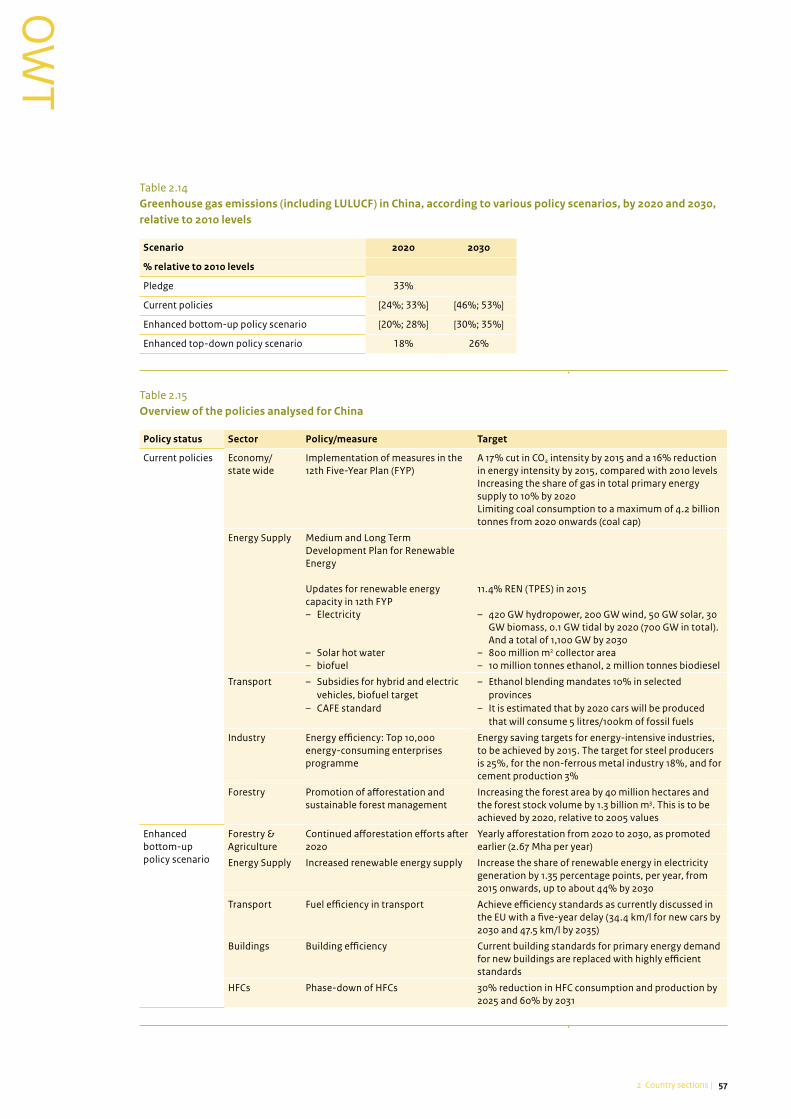
572 Country sections |
TWO
TWO
Table 2.14Greenhouse gas emissions (including LULUCF) in China, according to various policy scenarios, by 2020 and 2030, relative to 2010 levels
Scenario 2020 2030
% relative to 2010 levels
Pledge 33%
Current policies [24%; 33%] [46%; 53%]
Enhanced bottom-up policy scenario [20%; 28%] [30%; 35%]
Enhanced top-down policy scenario 18% 26%
Table 2.15Overview of the policies analysed for China
Policy status Sector Policy/measure Target
Current policies Economy/state wide
Implementation of measures in the 12th Five-Year Plan (FYP)
A 17% cut in CO2 intensity by 2015 and a 16% reduction in energy intensity by 2015, compared with 2010 levelsIncreasing the share of gas in total primary energy supply to 10% by 2020Limiting coal consumption to a maximum of 4.2 billion tonnes from 2020 onwards (coal cap)
Energy Supply Medium and Long Term Development Plan for Renewable Energy
Updates for renewable energy capacity in 12th FYP– Electricity
– Solar hot water– biofuel
11.4% REN (TPES) in 2015
– 420 GW hydropower, 200 GW wind, 50 GW solar, 30 GW biomass, 0.1 GW tidal by 2020 (700 GW in total). And a total of 1,100 GW by 2030
– 800 million m2 collector area– 10 million tonnes ethanol, 2 million tonnes biodiesel
Transport – Subsidies for hybrid and electric vehicles, biofuel target
– CAFE standard
– Ethanol blending mandates 10% in selected provinces
– It is estimated that by 2020 cars will be produced that will consume 5 litres/100km of fossil fuels
Industry Energy efficiency: Top 10,000 energy-consuming enterprises programme
Energy saving targets for energy-intensive industries, to be achieved by 2015. The target for steel producers is 25%, for the non-ferrous metal industry 18%, and for cement production 3%
Forestry Promotion of afforestation and sustainable forest management
Increasing the forest area by 40 million hectares and the forest stock volume by 1.3 billion m3. This is to be achieved by 2020, relative to 2005 values
Enhanced bottom-up policy scenario
Forestry & Agriculture
Continued afforestation efforts after 2020
Yearly afforestation from 2020 to 2030, as promoted earlier (2.67 Mha per year)
Energy Supply Increased renewable energy supply Increase the share of renewable energy in electricity generation by 1.35 percentage points, per year, from 2015 onwards, up to about 44% by 2030
Transport Fuel efficiency in transport Achieve efficiency standards as currently discussed in the EU with a five-year delay (34.4 km/l for new cars by 2030 and 47.5 km/l by 2035)
Buildings Building efficiency Current building standards for primary energy demand for new buildings are replaced with highly efficient standards
HFCs Phase-down of HFCs 30% reduction in HFC consumption and production by 2025 and 60% by 2031
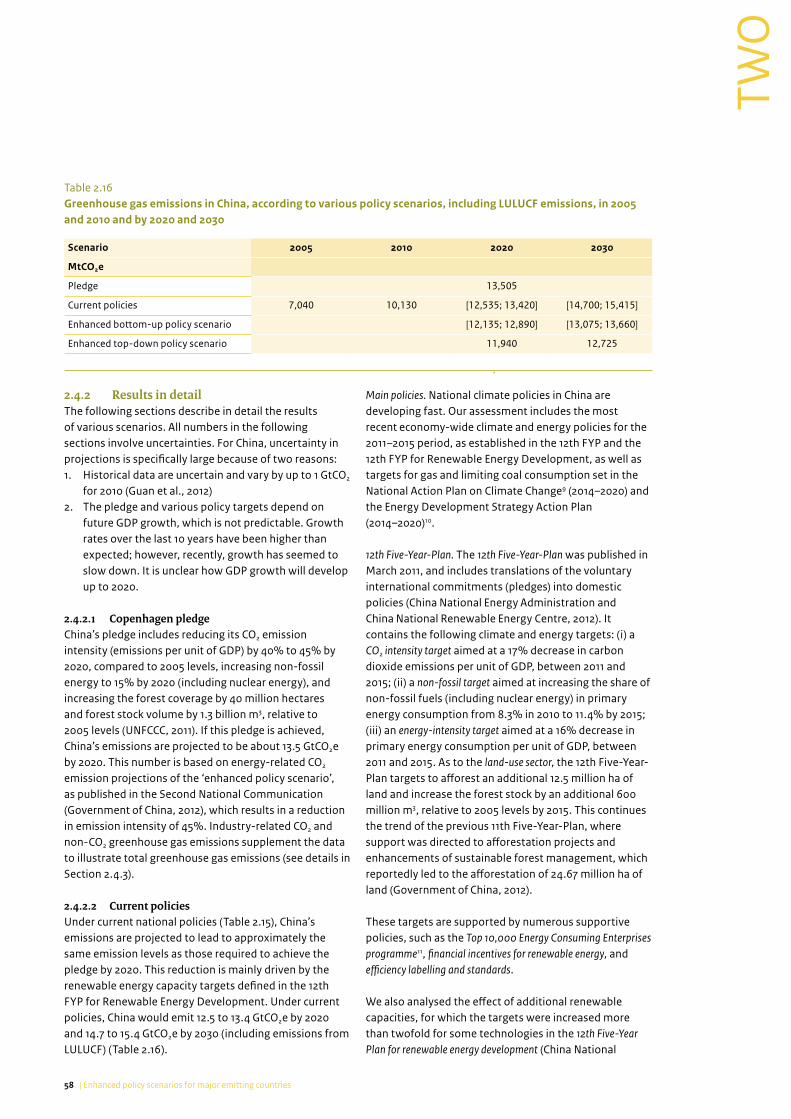
58 | Enhanced policy scenarios for major emitting countries
TWO
2.4.2 Results in detailThe following sections describe in detail the results of various scenarios. All numbers in the following sections involve uncertainties. For China, uncertainty in projections is specifically large because of two reasons:1. Historical data are uncertain and vary by up to 1 GtCO2
for 2010 (Guan et al., 2012)2. The pledge and various policy targets depend on
future GDP growth, which is not predictable. Growth rates over the last 10 years have been higher than expected; however, recently, growth has seemed to slow down. It is unclear how GDP growth will develop up to 2020.
2.4.2.1 Copenhagen pledgeChina’s pledge includes reducing its CO2 emission intensity (emissions per unit of GDP) by 40% to 45% by 2020, compared to 2005 levels, increasing non-fossil energy to 15% by 2020 (including nuclear energy), and increasing the forest coverage by 40 million hectares and forest stock volume by 1.3 billion m3, relative to 2005 levels (UNFCCC, 2011). If this pledge is achieved, China’s emissions are projected to be about 13.5 GtCO2e by 2020. This number is based on energy-related CO2 emission projections of the ‘enhanced policy scenario’, as published in the Second National Communication (Government of China, 2012), which results in a reduction in emission intensity of 45%. Industry-related CO2 and non-CO2 greenhouse gas emissions supplement the data to illustrate total greenhouse gas emissions (see details in Section 2.4.3).
2.4.2.2 Current policiesUnder current national policies (Table 2.15), China’s emissions are projected to lead to approximately the same emission levels as those required to achieve the pledge by 2020. This reduction is mainly driven by the renewable energy capacity targets defined in the 12th FYP for Renewable Energy Development. Under current policies, China would emit 12.5 to 13.4 GtCO2e by 2020 and 14.7 to 15.4 GtCO2e by 2030 (including emissions from LULUCF) (Table 2.16).
Main policies. National climate policies in China are developing fast. Our assessment includes the most recent economy-wide climate and energy policies for the 2011–2015 period, as established in the 12th FYP and the 12th FYP for Renewable Energy Development, as well as targets for gas and limiting coal consumption set in the National Action Plan on Climate Change9 (2014–2020) and the Energy Development Strategy Action Plan (2014–2020)10.
12th Five-Year-Plan. The 12th Five-Year-Plan was published in March 2011, and includes translations of the voluntary international commitments (pledges) into domestic policies (China National Energy Administration and China National Renewable Energy Centre, 2012). It contains the following climate and energy targets: (i) a CO2 intensity target aimed at a 17% decrease in carbon dioxide emissions per unit of GDP, between 2011 and 2015; (ii) a non-fossil target aimed at increasing the share of non-fossil fuels (including nuclear energy) in primary energy consumption from 8.3% in 2010 to 11.4% by 2015; (iii) an energy-intensity target aimed at a 16% decrease in primary energy consumption per unit of GDP, between 2011 and 2015. As to the land-use sector, the 12th Five-Year-Plan targets to afforest an additional 12.5 million ha of land and increase the forest stock by an additional 600 million m3, relative to 2005 levels by 2015. This continues the trend of the previous 11th Five-Year-Plan, where support was directed to afforestation projects and enhancements of sustainable forest management, which reportedly led to the afforestation of 24.67 million ha of land (Government of China, 2012).
These targets are supported by numerous supportive policies, such as the Top 10,000 Energy Consuming Enterprises programme11, financial incentives for renewable energy, and efficiency labelling and standards.
We also analysed the effect of additional renewable capacities, for which the targets were increased more than twofold for some technologies in the 12th Five-Year Plan for renewable energy development (China National
Table 2.16Greenhouse gas emissions in China, according to various policy scenarios, including LULUCF emissions, in 2005 and 2010 and by 2020 and 2030
Scenario 2005 2010 2020 2030
MtCO2e
Pledge 13,505
Current policies 7,040 10,130 [12,535; 13,420] [14,700; 15,415]
Enhanced bottom-up policy scenario [12,135; 12,890] [13,075; 13,660]
Enhanced top-down policy scenario 11,940 12,725

592 Country sections |
TWO
TWO
Energy Administration and China National Renewable Energy Centre, 2012), compared to the previous version from 2007. The 12th FYP also contains targets for 2020; the installed renewable energy capacity target for 2020 aims at 420 GW of hydropower, 200 GW of wind power, 50 GW of solar power and 30 GW of biomass power (total target of 700 GW). This 2020 target will be extrapolated to 1,100 GW renewable energy capacity by 2030. Additionally, the Medium and Long Term Development Plan for Renewable Energy contains targets for increasing solar thermal water heating (800 million m2 area of solar thermal collectors by 2020) and use of biofuels (10 million tonnes ethanol, 2 million tonnes biodiesel by 2020). The plan also contains targets of a smaller order of magnitude for biogas and geothermal heat (National Development Reform Commission, 2007). In terms of transport, the plan also contains a fuel efficiency standard starting in 2015, and a standard of 20 km/l by 2020 is currently under review (Braun et al., 2014). Furthermore, subsidies exist for hybrid and electric vehicles.
Cap on coal and a target for the share of gas. Finally, we also analysed the targets for gas and for limiting coal consumption as set in the National Action Plan on Climate Change (2014–2020) and the Energy Development Strategy Action Plan (2014–2020), i.e. (i) a fossil target aimed at increasing the share of gas in total primary energy supply to 10% by 2020, and (ii) limiting coal consumption to a maximum of 4.2 billion tonnes from 2020 onwards (coal cap). This target of 4.2 billion tonnes of coal can be converted into about 2,200 Mtoe (million tonnes of oil equivalent), based on the assumption of an average heating value of coal in China of 22.4 MJ/kg coal (Sun, 2010) and a world average of 30.1 MJ/kg coal12. According to the World Energy Outlook 2014 (IEA, 2014), coal consumption in 2012 was 1,977 Mtoe. In order to limit coal consumption to 2,200 Mtoe, a maximum increase in consumption of 11% is allowed between 2012 and 2020, and this should stabilise thereafter. Under PBL’s current policies scenario, historical coal consumption before 2012 was similar to the World Energy Outlook 2014 trend. The increase towards 2020 will be about 10%, which is below the growth rate that corresponds with the cap of 2,200 Mtoe. Coal consumption is projected to stabilise thereafter. In the PBL calculations, this peaking of coal consumption is already due to the renewable energy policies as stated in the 12th Five-Year-Plan, therefore no additional policy is required. The same holds for the gas share target of 10% for 2020. In the calculations of Ecofys & NewClimate Institute, the cap on coal will also have a limited impact by 2020. However, with the assumption that coal consumption will not increase further thereafter, the cap limits emissions in 2030 and thus will have an impact in that year. The assumption that the use of coal will not increase after 2020 is based on recent
developments of actual decreasing coal consumption in China and on discussions about peaking coal as a prerequisite to peak emissions by 2030 at the latest.
The Air Pollution Control Action Plan (Government of China, 2013) further bans construction of coal fired power plants in various regions. While this helps to reduce local air pollution, the overall effect on emissions is unclear, as the same capacities could be moved to other geographic regions.
Change compared to earlier analysis. Our estimates for China of the 2020 emission projection resulting from the current policies are significantly higher than in the previous analysis (Roelfsema et al., 2013). This results from a change in the underlying data set: the current update takes into account China’s Second National Communication which provides emission projections and illustrates the upper end of the range in the results. The update of the World Energy Outlook and US EPA data also affects the results, shifting the numbers slightly downwards (lower end of current update’s range). The PBL analysis has also been updated, by including the impact of the subsidy policy for electric cars next to the measures from the 12th Five-Year Plan and the renewable capacity targets from the Five-Year Renewable Energy Plan. The PBL update did not have a significant effect on the results compared to the previous analysis.
2.4.2.3 Planned policiesOther policies. A pilot ETS scheme at the national level is being planned and according to most recent information to start in 2020 (Chen and Reklev, 2014), and an emission control target defined in terms of industrial value added.
2.4.2.4 The enhanced bottom-up policy scenarioWhile the enhancement measures will have a moderate impact on emissions by 2020, the reductions below the planned scenario by 2030 will be approximately 1.7 GtCO2e according to the Ecofys & NewClimate Institute analysis, only due to the measures considered here. In the PBL analysis, the reduction is lower – about 1.6 GtCO2e – due to the lower emissions projection under the current policies scenario, resulting from an increasing renewable share in the power sector after 2020.
The Ecofys analysis is based on the World Energy Outlook current policies scenario, which shows a stabilisation trend in renewable energy. In the PBL TIMER energy model calculations the renewable share increases due to the assumed ongoing renewable investments after 2020, and also due to the learning effects of installed renewable capacity. Nevertheless, both emission projections for the enhanced bottom-up policy scenario of PBL and Ecofys & NewClimate Institute almost lead to
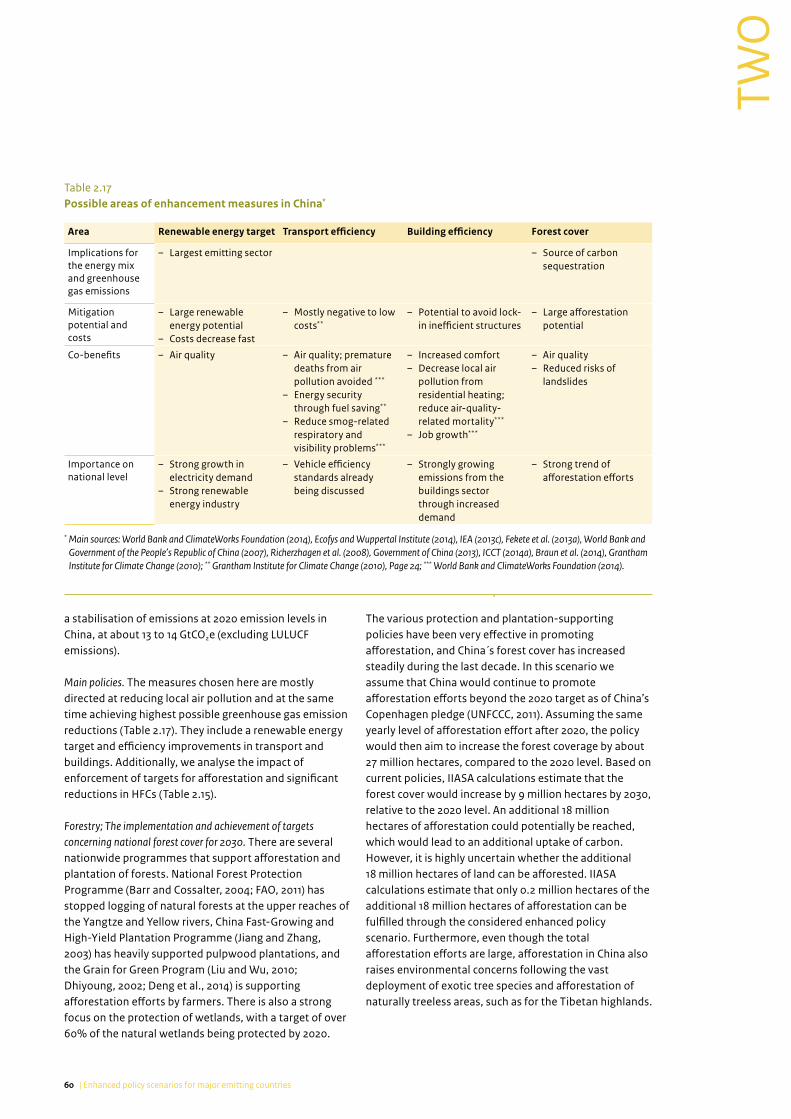
60 | Enhanced policy scenarios for major emitting countries
TWO
a stabilisation of emissions at 2020 emission levels in China, at about 13 to 14 GtCO2e (excluding LULUCF emissions).
Main policies. The measures chosen here are mostly directed at reducing local air pollution and at the same time achieving highest possible greenhouse gas emission reductions (Table 2.17). They include a renewable energy target and efficiency improvements in transport and buildings. Additionally, we analyse the impact of enforcement of targets for afforestation and significant reductions in HFCs (Table 2.15).
Forestry; The implementation and achievement of targets concerning national forest cover for 2030. There are several nationwide programmes that support afforestation and plantation of forests. National Forest Protection Programme (Barr and Cossalter, 2004; FAO, 2011) has stopped logging of natural forests at the upper reaches of the Yangtze and Yellow rivers, China Fast-Growing and High-Yield Plantation Programme (Jiang and Zhang, 2003) has heavily supported pulpwood plantations, and the Grain for Green Program (Liu and Wu, 2010; Dhiyoung, 2002; Deng et al., 2014) is supporting afforestation efforts by farmers. There is also a strong focus on the protection of wetlands, with a target of over 60% of the natural wetlands being protected by 2020.
The various protection and plantation-supporting policies have been very effective in promoting afforestation, and China´s forest cover has increased steadily during the last decade. In this scenario we assume that China would continue to promote afforestation efforts beyond the 2020 target as of China’s Copenhagen pledge (UNFCCC, 2011). Assuming the same yearly level of afforestation effort after 2020, the policy would then aim to increase the forest coverage by about 27 million hectares, compared to the 2020 level. Based on current policies, IIASA calculations estimate that the forest cover would increase by 9 million hectares by 2030, relative to the 2020 level. An additional 18 million hectares of afforestation could potentially be reached, which would lead to an additional uptake of carbon. However, it is highly uncertain whether the additional 18 million hectares of land can be afforested. IIASA calculations estimate that only 0.2 million hectares of the additional 18 million hectares of afforestation can be fulfilled through the considered enhanced policy scenario. Furthermore, even though the total afforestation efforts are large, afforestation in China also raises environmental concerns following the vast deployment of exotic tree species and afforestation of naturally treeless areas, such as for the Tibetan highlands.
Table 2.17Possible areas of enhancement measures in China*
Area Renewable energy target Transport efficiency Building efficiency Forest cover
Implications for the energy mix and greenhouse gas emissions
– Largest emitting sector – Source of carbon sequestration
Mitigation potential and costs
– Large renewable energy potential
– Costs decrease fast
– Mostly negative to low costs**
– Potential to avoid lock-in inefficient structures
– Large afforestation potential
Co-benefits – Air quality – Air quality; premature deaths from air pollution avoided ***
– Energy security through fuel saving**
– Reduce smog-related respiratory and visibility problems***
– Increased comfort– Decrease local air
pollution from residential heating; reduce air-quality-related mortality***
– Job growth***
– Air quality– Reduced risks of
landslides
Importance on national level
– Strong growth in electricity demand
– Strong renewable energy industry
– Vehicle efficiency standards already being discussed
– Strongly growing emissions from the buildings sector through increased demand
– Strong trend of afforestation efforts
* Main sources: World Bank and ClimateWorks Foundation (2014), Ecofys and Wuppertal Institute (2014), IEA (2013c), Fekete et al. (2013a), World Bank and Government of the People’s Republic of China (2007), Richerzhagen et al. (2008), Government of China (2013), ICCT (2014a), Braun et al. (2014), Grantham Institute for Climate Change (2010); ** Grantham Institute for Climate Change (2010), Page 24; *** World Bank and ClimateWorks Foundation (2014).

612 Country sections |
TWO
TWO
Energy supply; renewable energy target. For the enhanced policy scenario for China, we assumed the same enhanced renewable energy policy as assumed for Australia and Canada. This implies reaching a share of around 44% renewable energy in electricity supply (excluding nuclear energy) by 2030 (2012: share 20.1%). The additional generation from renewable energy replaces coal-fired generation first, followed by oil and gas. This policy, in combination with the coal consumption cap in the current policies, leads to a situation where no new coal-fired power plants are being built after 2020. Emission reductions beyond the current policies scenario are expected to be 395 to 500 MtCO2e by 2020 and 900 to 1,400 MtCO2e by 2030, based on PBL and Ecofys & NewClimate Institute calculations. This target is in line with the Renewable Energy Roadmap 2030 (IRENA, 2014), according to which China could increase its share of renewable energy in the power sector from 20% to nearly 40% by 2030. These targets assume a substantive growth in wind, solar and hydropower.
Transport; Fuel efficiency improvements. Private vehicle ownership has increased strongly in China, over the last years, and this trend is expected to continue. Urban transport is currently one of the main causes of local air pollution in Chinese cities. A light commercial vehicle standard starting in 2015 is already in place and a standard of 20 km/l by 2020 is currently under review (Braun et al., 2014). We assume this standard could be enhanced and kept at an ambitious level after 2020. With an efficiency standard of 47.5 km/l, to be implemented by 2035, transport emissions would peak in 2025, in spite of a continuously increasing trend in activity. According to our analysis, this would decrease emissions by 1 to 54 MtCO2e by 2020 and 7 to 50 MtCO2e by 2030, below the current policies development, based on calculations by PBL and Ecofys & NewClimate Institute.
Buildings; efficiency improvements. Residential housing and commercial floor space is increasing strongly in China due to a high level of new construction. Efficiency improvements in buildings would lead to additional emission reductions of about 16 to 75 MtCO2e by 2020 and 132 to 200 MtCO2e by 2030, beyond those under current policies. In the analysis by Ecofys & NewClimate Institute, current building standards are replaced with a maximum primary energy demand of 50 kWh/m²/a for new buildings, starting today. Based on a reference building in Shanghai, we estimate that current Chinese standards imply a primary energy demand of around
120 kWh/m²/a. Additionally, we assume an autonomous efficiency improvement of 1% per year. In the PBL analysis, the implementation of advanced heating and insulation measures was assumed. This encompasses a gradual installation of advanced insulation in newly built houses between 2015 and 2030 and a 10% improvement in the energy efficiency of water heating. The PBL estimates are at the lower end of the presented reduction ranges.
Co-benefits of enhancements in current building standards consist of energy saving and increasing comfort levels for end users, and reducing pollutant emissions from direct fuel combustion in cities.
HFC production and consumption. A full implementation of the reduction scheme for the production and consumption of HFCs based on the 2014 North American Amendment Proposal (Appendix A.5) is assumed. For China, categorised as an Article 5 Party in the proposal, this would imply a 30% reduction in HFC consumption below the baseline by 2025 and a 60% reduction by 2031 (US EPA, 2014b) (see Brazil). The PBL and Ecofys & NewClimate Institute calculations show a reduction below the current policies scenario of about 0 to 185 MtCO2e by 2020 and 150 to 460 MtCO2e by 2030.
2.4.2.5 The enhanced top-down policy scenarioFull implementation of the top-down mitigation measures will decrease all greenhouse gas emissions in China by about 595 MtCO2e by 2020 and 1,975 MtCO2e by 2030, compared to the current policies scenario.The impact of the mitigation options on the energy-related CO2 emissions is illustrated in Figure 2.8 and in Table A.2 (Appendix A.6). The largest potential to reduce energy-related CO2 emissions is in the buildings, electricity and industry sectors (Figure 2.8). In the buildings sector, reductions could mainly be achieved by a ban on incandescent light bulbs, followed by the enforcement of ‘A’ label appliances. In the industry sector, increased energy efficiency through the implementation of good housekeeping could lead to substantial reductions in the steel and cement industries. The effects of increased efficiencies in steel and cement production are relatively large for China, because this is a large sector in China and demand for these industrial products is expected to rise (Deetman et al., 2012). Additional reductions in the transport sector are low, because China already has implemented current policies in this sector.

62 | Enhanced policy scenarios for major emitting countries
TWO
2.4.3 Data sources and assumptionsPledgeAs China only makes available two inventory years which do not have the same scope and are thus not directly comparable, the projection of Ecofys & NewClimate Institute uses a combination of international data sources for energy-related emissions (IEA, 2013a) and non-energy-related emissions (EDGAR 4.2), and inventory data for LULUCF to determine historical emissions until 2010.
For the PBL projection the historical emissions were taken from the energy-related emissions (IEA, 2013a), non-energy-related emissions (EDGAR 4.2) (JRC and PBL, 2012) and LULUCF emissions (FAOSTAT).
The pledge illustrated here consists of energy-related CO2 emissions from the Second National Communication of China (‘enhanced policy scenario’) and CO2 process emissions and non-CO2 emissions as indicated in the next section.
Current policiesThe greenhouse gas projections of Ecofys & NewClimate Institute are based on the energy-related CO2 emission projections in the current policies scenario of the World Energy Outlook 2014 (IEA, 2014), the US EPA non-CO2 emission projections up to 2030 (US EPA, 2012), the energy-related CO2 emission inventory data submitted to the UNFCCC for historical information up to 2005, and the historical non-energy-related CO2 emissions from EDGAR 4.2 (JRC and PBL, 2012). For projections of non-energy-
related CO2 emissions, the growth rates from the IEA’s Energy Technology Perspectives 2010 were applied.
For the LULUCF emission projection, it is assumed that emission sinks will become slightly smaller (by 20% relative to 2005) and that emissions from forest and grassland conversion will remain stable.
For the projections of PBL, we use the IMAGE TIMER energy model (Van Vuuren et al., 2014) for an updated analysis including all policy options as summarised in Table 2.15. For LULUCF emission projection the quantification is based on GLOBIOM and G4M model calculations of IIASA.
The targets have been analysed for the year 2015 using the reference projections as described above, except for the Second National Communication, which did not contain enough detail on energy projections. The CO2-intensity and energy-intensity targets and the non-fossil-fuel target for 2015 are achieved in all PBL baseline (no climate policy) projections. As the policies from the 12th FYP are already included in the current policies scenario of the World Energy Outlook 2013, these targets do not lead to any further reductions.
Uncertainty. The effect of the various policies on emission reductions compared to the PBL baseline projections is uncertain, for several reasons. First, historical emissions are uncertain, as for example illustrated recently by Guan et al. (2012). Despite this uncertainty, it is known that emissions in China have increased faster than previously expected, and reached around 11 GtCO2e in 2010 (JRC and
Figure 2.8
2000 2005 2010 2015 2020 2025 2030 2035
0
2000
4000
6000
8000
10000
12000Energy-related CO2 emissions (Mt CO2 per year)
Source: PBL TIMER model
pbl.n
l
History
Current policies
Enhanced policy scenario(top-down)
Reduction per sector
Electricity
Industry
Transport
Buildings
Contribution of enhanced reduction measures per sector, for China
Impact of policies analysed in the enhanced top-down policy scenario, per sector, on energy-related CO2 emissions in China. Reductions in this figure are relative to the current policies scenario.

632 Country sections |
TWO
TWO
PBL, 2012). Second, the baseline projections are uncertain, as is illustrated by the large range of emissions by 2020, with a difference of about 2.2 GtCO2e between the highest and lowest projection for current policies. Third, the effect of CO2 intensity targets and energy intensity targets depends on future GDP growth. Higher economic growth would make it easier to achieve the intensity target, assuming the baseline emissions are not or relatively less affected by this higher GDP growth. The Second National Communication assumes an annual GDP growth of 7% between 2010 and 2020, which is also assumed in the World Energy Outlook 2014. A 1% higher growth rate would increase the targeted emission level of the CO2 intensity target by about 1 GtCO2e (Den Elzen et al., 2013). Yang et al. (2014) conclude that China is not on track to meet its CO2-intensity commitment by assuming a GDP growth of 7.5% and forecasting CO2 emissions based on historical trends of GDP per capita, secondary industry in GDP, urbanisation, population and car ownership on the provinces’ emission levels. As this study does not explicitly model the Chinese climate and energy policies, we have not included it in our analysis, but it does mean the assumptions made in our analysis should be treated with care.
Assumptions and sources for LULUCFThe projections for LULUCF are based on GLOBIOM (Havlík et al., 2014) and G4M (Gusti, 2010) model calculations by IIASA. These projections have been harmonised with the land-use CO2 emissions for the year 2010 from the FAOSTAT data. From 2010 and onwards, the trend is fully based on model estimates, taking into account socio-economic development (see Appendix B for further details).

64 | Enhanced policy scenarios for major emitting countries
TWO
2.5 European Union
2.5.1 Summary of resultsThe EU is likely to overachieve its unconditional pledge of reducing greenhouse gas emissions by 20%, below 1990 levels, by 2020. Current policies could result in reductions of 22% to 27%, relative to 1990 levels, by 2020, and 23% to 35%, by 2030.Enhanced policies could reduce emissions further. With additional measures for energy efficiency in passenger transport and
buildings and a phase-down of hydrofluorocarbons, the announced 40% reduction, below 1990 level, by 2030, could already be achieved. Scenarios exploiting all mitigation options show that further reductions would be possible. An important co-benefit of these enhancement measures for the EU is that of increased energy security.
Figure 2.9
1990 2000 2010 2020 2030
-2000
0
2000
4000
6000
8000Mt CO2 eq per year
Source: Ecofys & NewClimate Institute calculations
pbl.n
l
History Current policies
Enhanced policy scenario (bottom-up)
Pledge
Excluding CO2 emissions from land use
Impact of climate policies on greenhouse gas emissions in EU28
1990 2000 2010 2020 2030
-2000
0
2000
4000
6000
8000Mt CO2 eq per year
pbl.n
l
CO2 emissions from land use
Historical greenhouse gas emissions and LULUCF emissions are based on national inventories submitted to UNFCCC.

652 Country sections |
TWO
TWO
Table 2.18Greenhouse gas emissions in the European Union, according to various policy scenarios, excluding LULUCF emissions, by 2020 and 2030, relative to 2010 levels (upper) and 1990 levels (lower)
Scenario 2020 2030
% relative to 2010 levels
Pledge -5%
Current policies [-14%; -9%] [-23%; -10%]
Enhanced bottom-up policy scenario [-18%; -15%] [-37%; -32%]
% relative to 1990 levels
Pledge -20%
Current policies [-27%; -22%] [-35%; -23%]
Enhanced bottom-up policy scenario [-36%; -31%] [-46%; -42%]
Table 2.19Overview of the policies analysed for the European Union
Policy status Sector Policy/measure Target
Current policies Economy/state wide EU ETS Directive (2003/87/EC revised by Directive 2009/29/EC)
Emission cap on emissions from electricity/heat and industry of 21% below 2005 levels, by 2020
Energy Supply Renewable Energy Roadmap/ Directive (2009/28/EC)
Target of 20% renewable energy by 2020
Energy Efficiency Directive (2012/27/EC)
Target of 20% energy efficiency improvement by 2020
Buildings – Appliances Eco-design Framework Directive (Directive 2009/125/EC)
Specific standards for a wide range of appliances
Transport Regulation of CO2 emissions from passenger vehicles (443/2009)
Passenger vehicle emission standard of 95 g CO2/km, phasing in for 95% of vehicles by 2020 with 100% compliance by 2021Light commercial vehicle standards of 147 g CO2/km by 2020
Enhanced bottom-up policy scenario
Energy efficiency in buildings Refurbishment of existing buildings as described in Bossmann et al. (2012)
Energy efficient passenger vehicles
Improved technology of passenger vehicles as described in Bossmann et al. (2012)
HFCs Phase-down of HFCs 10% reduction in HFC consumption and production by 2018, 35% by 2023, 70% by 2029, and 85% by 2035

66 | Enhanced policy scenarios for major emitting countries
TWO
2.5.2 Results in detail2.5.2.1 Copenhagen pledgeThe EU is likely to over-achieve its unconditional 2020 target of reducing emissions by 20% relative to 1990. Current policies could result in reductions of 22% to 27%, relative to 1990 levels, by 2020, which brings the EU also close to its conditional pledge of 30% below 1990 levels (Table 2.18).
2.5.2.2 Proposal for post-2020 contributionIn a two-day meeting on 23 and 24 October 2014, the European Council decided on a new set of targets for 2030, including binding targets for domestically reducing greenhouse gas emissions by 40% by 2030, compared to 1990 levels, for increasing the share of renewable energy to 27%, and for improving energy efficiency by at least 27% compared to baseline projections of future energy demand (European Council, 2014). The analysis below focuses on the internal agreement of the EU to reduce domestic greenhouse gas emissions by at least 40%. The exact way in which LULUCF emissions were taken into account and the potential use of surplus allowances is yet to be clarified.
LULUCFs currently are a net sink in the EU, and projections provided by the European Council (European Council,
2014) show a gradually declining sink. This decline is largely due to forestry developments in the EU and the expected increase in harvest levels for material and energy purposes. The target to increase the share of renewable energy is expected to result in an increasing demand for biomass for energy purposes. It is expected that a large share of biomass for energy purposes is to be met by domestic feedstock, thereby impacting the timber demand and the forest carbon sink. However, if a large share of biomass for energy purposes would be met by increasing the import of wood pellets, or if the increasing demand would be met by increased use of perennial energy crops, the LULUCF emission trajectory for the EU would also be impacted.
2.5.2.3 Current policiesThe EU has a comprehensive policy package in place that affects greenhouse gas emissions and has led to a significant decline compared to 1990 (Table 2.19). The 2020 energy and climate package includes targets for greenhouse gas emissions, renewable energy and energy efficiency and is implemented through various directives. The Emissions Trading Directive puts a cap on around 45% of Europe’s emissions (European Commission, 2013). The Renewable Energy Directive and the Energy Efficiency Directive ask member states to implement supportive
Table 2.20Greenhouse gas emissions in the European Union, according to various policy scenarios, excluding LULUCF emissions, in 2005 and 2010 and by 2020 and 2030
Scenario 2005 2010 2020 2030
MtCO2e
Pledge 4,500
Current policies 5,180 4,750 [4,105; 4,370] [3,670; 4,315]
Enhanced bottom-up policy scenario [3,900; 4,075] [3,020; 3,275]
Table 2.21Possible areas of enhancement measures in the European Union
Area Vehicle efficiency Efficiency of building envelope
Implications for the energy mix and greenhouse gas emissions
– Reduced oil use and greenhouse gas emissions
– Reduced use of heating fuels
Mitigation potential and costs – Mostly negative or low costs* – Potential to avoid lock-in inefficient structures
Co-benefits – Air quality; premature deaths from air pollution avoided **
– Energy security through fuel saving**
– Reduce smog-related respiratory and visibility problems**
– Increased comfort– Decrease local air pollution from
residential heating; reduce air-quality-related mortality**
– Job growth**
Importance on national level – Existing vehicle emission standards could be strengthened
– Relevant especially for the renovation of existing buildings
** Grantham Institute for Climate Change (2010), Page 24; *** World Bank and ClimateWorks Foundation (2014)

672 Country sections |
TWO
TWO
policies for renewable energy and energy efficiency. The Eco-design Framework Directive and the regulation on CO2 emissions from vehicles set energy and emission standards for appliances and cars. Member States implement these directives in addition to other national policies that affect greenhouse gas emissions.
2.5.2.4 The enhanced bottom-up policy scenarioWith selected energy efficiency measures, the announced 40% reduction by 2030 can be reached according to Ecofys & NewClimate Institute analysis. With those measures taken into account, reductions of 42% to 46% below 1990 would be reached by 2030 (see Figure 2.9). Scenarios in literature show that reductions of up to 53% below 1990 are possible, taking into account a broader set of measures than considered here (Bossmann et al., 2012; Greenpeace and European Renewable Energy Council, 2012).
Vehicle efficiency. Increasing the efficiency of vehicles is often described as a cost-effective measure. We assume here that the standards for passenger vehicles are enhanced and new standards are introduced for freight vehicles. Basis for the calculations is the potential provided in Bossmann et al. (2012, p. 217). Adapting the results to our reference scenarios (the scenarios including current policies), this results in reductions of 90 to 180 MtCO2e by 2030.
Buildings efficiency. Significant energy efficiency potential still exists in the buildings sector, where in particular the renovation rate of buildings could be improved through support mechanisms and standards. Basis for the calculations is the potential provided in Bossmann et al. (2012, p. 217). Adapting the results to our reference scenarios (the scenarios including current policies), this results in reductions of 210 to 250 MtCO2e by 2030.
HFC production and consumption. Canada, together with the United States and Mexico, has submitted the 2014 North American Amendment Proposal to significantly decrease HFC production and consumption. A full implementation of the proposal would mean that HFC consumption is reduced by 10% below the 2008–2010 baseline by 2018 and 85% by 2035 (EPA, 2013b). Implementation of this proposal in the EU could result in a reduction below the level under the current policies scenario of 11 MtCO2e by 2020 and 55 MtCO2e by 2030.
Vehicle and buildings efficiency measures and the HFC phase-down as described above provide the upper end of the emission level provided in Figure 2.9 under the enhanced bottom-up policy scenario.
Several studies show additional mitigation potential, which is displayed here as the lower end of the range in Figure 9: the EU impact assessment scenario ‘GHG45/EE/RES35’ (European Commission, 2014) and the World Energy Outlook ‘New policy scenario’ (IEA, 2014).
Some scenarios show even further reductions of up to 53% below 1990 levels (not shown in Figure 2.9). Fraunhofer ISI (Bossmann et al., 2012) finds significant energy efficiency potential; most of these options have negative costs. The Greenpeace Energy [R]evolution report (Greenpeace and European Renewable Energy Council, 2012) shows particularly high shares of renewable energy. Taking into account also reductions in non-CO2 emissions, these scenarios could lead to respective reductions of 53% and 52% by 2030, below 1990 levels.
2.5.2.5 The enhanced top-down policy scenarioFor the European Union, a top-down analysis with similar mitigation options was done in an earlier PBL analysis by Deetman et al. (2012). They showed that the combination of all options could reduce greenhouse gas emissions to 65% below European 1990 levels by 2050. Although this is less than the objective of the EU to reduce emissions by 80% to 95% by 2050, relative to 1990 levels, they conclude that this does not imply that these reduction targets are infeasible, as the set of measures is not exhaustive. The analysis itself provides some insights into the effectiveness of measures across sectors, and confirms the finding of other modelling studies that the power generation sector is crucial in reaching deep emission reductions.
2.5.3 Data sources and assumptionsAll scenarios were standardised to the latest UNFCCC CRF data. Where only CO2 emissions were reported (e.g. in IEA scenarios), we complemented these with the non-CO2 emissions projections from the IIASA GAINS model, as part of the PRIMES reference scenario (Capros et al., 2013).For the current policies path we used the following scenarios:– EEA scenario ‘with existing measures’ (European
Environment Agency, 2014): It is mainly based on member states submissions between 2012 and 2013; therefore, it does not fully factor in all recent EU level policies, especially the energy efficiency directive and the energy performance of buildings directive implementation into national law (European Environment Agency, 2014, pp. 60–61).
– PRIMES 2013 scenario (Capros et al., 2013): This scenario includes all ‘policies and measures adopted by the Member States by April 2012, and policies, measures

68 | Enhanced policy scenarios for major emitting countries
TWO
and legislative provisions (including on binding targets) adopted or agreed in the first half of 2012 at EU level in such a way that there is almost no uncertainty with regard to their adoption.’ (Capros et al., 2013, p. 20)
– Current policies scenario of the World Energy Outlook 2014 (IEA, 2014): This scenario includes ‘government policies and implementing measures that had been formally adopted as of mid-2014’. IEA (2014, p. 687) not explicitly mentions the inclusion of the Energy Efficiency Directive. We added the emission of non-CO2 greenhouse gases from GAINS data (Capros et al., 2013).
– EEA scenario ‘with additional measures’: The EEA also includes a scenario ‘with additional measures’ (European Environment Agency, 2014). It includes additional measures planned by member states to implement the already adopted EU directives. This scenario results in higher emissions than the two scenarios above. We therefore put it in the category of current measures.
Table 2.22 provides a summary of all current policies scenarios used. For each scenario, the table gives the emission reductions (in %) relative to 1990 levels, as reported in the original studies (first column) named above. This study harmonises the emission projections of those scenarios with historical emissions (as reported in the national communications, see UNFCCC website). This harmonisation process leads to small differences in emission reductions. The estimated emission reductions
(after harmonisation) in this study are also reported in Table 2.22. For PRIMES, the numbers show the largest deviation, because the PRIMES scenario includes international aviation, whereas the UNFCCC data do not.
For the enhanced policies, we started from the PRIMES 2013 reference scenario and added enhancement measures from Fraunhofer ISI (Bossmann et al., 2012):– Buildings: Based on the rationale that enhanced
energy efficiency standards for new buildings and especially the refurbishment of old buildings would be possible, we included the options from the Fraunhofer ISI study (Bossmann et al., 2012, p. 217) for new buildings, refurbishment of existing buildings, efficient heating and cooling, and efficient household appliances (listed as under non-cost-effective measures in households and the tertiary sector).
– Transport: Based on the rationale that enhanced emission standards for passenger vehicles would be possible, we included the option ‘technical improvements’ from the Fraunhofer ISI study (Bossmann et al., 2012, p. 217).
We adjusted the emission reductions for the fact that the Fraunhofer ISI study reports the reduction relative to the PRIMES 2009 baseline scenarios. We deducted the policy impact from the reported estimated emission reduction potential. Furthermore we normalised the emission reduction potential to the 2013 baseline by applying a percentage wise reduction method.
Table 2.22Reduction targets of the current policies according to the original studies (as described in above) and this study (after harmonisation with historical emissions)
Study Original studies (see above)
This study (after harmonisation)
Original studies (see above)
This study (after harmonisation)
2020, % relative to 1990 levels 2030, % relative to 1990 levels
EEA scenario ‘with existing measures’ (European Environment Agency, 2014)
-21% -22% -22% -23%
PRIMES 2013 scenario (Capros et al., 2013)
-25% -27% -32% -35%
World Energy Outlook 2014 Current Policies scenario (IEA, 2014)
n/a* -23% n/a* -26%
EEA scenario ‘with additional measures’ (European Environment Agency, 2014)
-24% -22% -28% -27%
* No data available on non-CO2 greenhouse gas emissions.

692 Country sections |
TWO
TWO
The enhanced bottom-up policy scenario range also includes the World Energy Outlook ‘New policy scenario’ (IEA, 2014) (plus GAINS for non-CO2 emissions) and the EU impact assessment scenario ‘GHG45/EE/RES35’ (European Commission, 2014).
Additional scenarios that were included for reference:– Greenpeace Energy [R]evolution (Greenpeace and
European Renewable Energy Council, 2012) plus GAINS for non-CO2 greenhouse gas emissions.
– The full emission reduction potential as reported by Bossmann et al. (2012) plus GAINS for non-CO2 greenhouse gas emissions.

70 | Enhanced policy scenarios for major emitting countries
TWO
2.6 India
2.6.1 Summary of resultsUnder current domestic measures, we project that India is likely to achieve its pledge for 2020, with policies consisting of renewable energy targets and the market-based mechanism Perform Achieve and Trade (PAT) scheme for energy efficiency. As for China, emission projections highly depend on future economic growth. Therefore, uncertainty in projections resulting from the pledges is high, because both baseline emission projections and GDP developments are uncertain. Projected emission levels under current policies will reach about 4.8 to 5.5 GtCO2e by 2030 (including LULUCF), which is about 103% to 132% above 2010 levels. Under planned policies (on solar and wind power), emission levels will reach about 4.5 to 5.3 GtCO2e by 2030.
The selected mitigation enhancement measures could further reduce emissions by about 0.3 GtCO2e by 2020 and about 0.5 to 0.7 GtCO2e by 2030, compared to under current policies. The total emission level would be 3.3 to 3.7 GtCO2e by 2020 and 4.3 to 4.8 GtCO2e by 2030 (80% to 101% above 2010 levels). All enhancement measures considered here hold large potential for co-benefits, most importantly those of enabling access to electricity through renewable energy and electricity saving on the consumers’ side.
Figure 2.10
1990 2000 2010 2020 2030
-2000
0
2000
4000
6000
8000Mt CO2 eq per year
Source: PBL FAIR/TIMER model; Ecofys & NewClimate Institute calculations; IIASA GLOBIOM/G4M model
pbl.n
l
History Current policies
Planned policies
Enhanced policy scenario (bottom-up)
Enhanced policy scenario (top-down)
Pledge
Including CO2 emissions from land use
Impact of climate policies on greenhouse gas emissions in India
1990 2000 2010 2020 2030
-2000
0
2000
4000
6000
8000Mt CO2 eq per year
pbl.n
l
CO2 emissions from land use
Historical greenhouse gas emissions are based on energy-related emissions (IEA, 2013a), non-energy-related emissions (EDGAR 4.2) (JRC and PBL, 2012) and LULUCF emissions (FAOSTAT). The LULUCF emission projections as a result of the current and enhanced policies are based on model calculations and FAOSTAT, extended with an extrapolation of trends. See also Figure 2.11 for details on the enhanced top-down policy trajectory.

712 Country sections |
TWO
TWO
2.6.2 Results in detail2.6.2.1 Copenhagen pledgeIndia pledged to reduce CO2 emission intensity (emissions per unit GDP) by 20% to 25% by 2020, compared to 2005 levels (excluding emissions from the agricultural sector). The Indian Government presented a ‘Determined Effort’ scenario, in which the country could achieve 23% to 25% emission intensity reduction compared to 2005 levels, based on average annual GDP growth rates of 8% and 9% (Planning Commission Government of India, 2011). These projections lead to between 3,375 and 4,140 MtCO2e by 2020 (including LULUCF emissions, and after harmonisation with historical emissions). The uncertainty in projections is high as GDP projections are uncertain.
2.6.2.2 Current policiesCurrent policies are expected to lead to a range in total emissions of about 3,535 to 3,960 MtCO2e by 2020, and 4,805 to 5,520 MtCO2e by 2030, including emissions from LULUCF (Table 2.25). Our analysis shows that the 2020 emission level after implementation of current policies is likely to be below the pledged emission targets (Figure 10). The uncertainty of future emissions and impacts of policies in India is large because both baseline emission projections and GDP developments are uncertain.
Main policies. In 2008, India launched a National Action Plan on Climate Change (NAPCC).The NAPCC provides eight national missions on sustainable development in key areas (Government of India, 2008). The two missions that directly impact greenhouse gas emissions are the National Mission for Enhanced Efficiency (NMEE) and the National Solar Mission (NSM). The market-based mechanism Perform Achieve and Trade (PAT) is part of the NMEE. The NAPCC also sets a renewable electricity target for 2020. These policies from the NAPCC were included in our analysis. In addition, we included the Strategic Plan for New and Renewable Energy Sector (Planning Commission Government of India, 2011), which
covers the 2011–2017 period and contains detailed targets for the electricity sector.
Capacity targets for renewable electricity. The capacity targets for 2017 are 27.3 GW wind, 4 GW solar, 5 GW biomass (agricultural waste and cogeneration) and 5 GW other renewable energy. The strategic plan also contains aspirational targets for 2022, i.e. 38.5 GW wind, 20 GW solar, 7.3 GW biomass and 6.6 GW other renewable energy.
Renewable electricity target. The NAPCC introduced a target for renewable energy in electricity production of 15% by 2020, which was reconfirmed in the Second National Communication (Government of India, 2012). A market-based mechanism was introduced to address this goal, using so-called Renewable Energy Certificate (REC) schemes.
Energy efficiency scheme (PAT). The Perform, Achieve and Trade (PAT) scheme was introduced as one of the four pillars of the National Mission on Enhanced Energy Efficiency (NMEE), which is part of the NAPCC. The PAT scheme was agreed on by the Indian Government on 30 March 2012. The scheme aims to improve energy efficiency in large industries and the power sector through a market based mechanism. It covers facilities that together account for around 45% of the total energy consumed in India. The target was set to reach 5% energy consumption reduction below baseline projections in the industry sector in 2015. The effect after 2015 heavily depends on the rules governing the continuation of the scheme, which have yet to be decided.
Land use and land-use change and forestry (LULUCF). Greening India Mission (GIM) is a national forestry programme launched in 2011 (Ravindranath and Murthy, 2010). Its targets are to reforest or restore 20 million hectares of forests until 2020, to increase carbon sequestration of forests to 43 MtCO2e annually, and to enhance the
Table 2.23Greenhouse gas emissions in India, according to various policy scenarios, including LULUCF emissions, by 2020 and 2030
Scenario 2020 2030
% relative to 2010 levels
Pledge [65%; 70%]
Current policies [49%; 67%] [103%; 132%]
Planned policies [39%; 63%] [88%; 122%]
Enhanced bottom-up policy scenario [38%; 54%] [80%; 101%]
Enhanced top-down policy scenario 30% 49%

72 | Enhanced policy scenarios for major emitting countries
TWO
Table 2.24Overview of the policies analysed for India
Policy status Sector Policy/measure Target
Current policies Energy Supply National Action Plan on Climate Change (2008)– Renewable target (electricity)National Action Plan on Climate Change (Pew Center on Global Climate Change, 2008, Government of India, 2008)– Solar Mission
Strategic Plan for New and Renewable Energy Sector– Renewable Capacity target 2017
– Renewable Capacity target 2022
12th Five Year Plan– Renewable Capacity Target
15% REN (electricity) by 2020
20 GW solar by 2022
In 2017: 5.065 GW biomass (1.525 GW biomass/waste, 3.216 GW bagasse, 0.324 GW urban and industrial waste), 5.0 GW small hydropower installations, 4.0 GW Solar, 13.4 GW WindIn 2022: 5.065 GW biomass (2.5 GW biomass/waste, 4.0 GW bagasse, 0.8 GW U&I), 6.6 GW Solar heating panels, 20.0 GW Solar, 38.5 GW Wind
Add 30,000 MW of renewable energy capacity between 2012 and 2017
Industry Renewable Portfolio Standard (PAT scheme)
It is expected to save 6.6 Mtoe (4.8% energy reduction in the industries covered, representing around 60% of primary energy consumption)
Transport Support for biofuels No clear target set, therefore not accounted for in this study
Forestry The implementation of the Green India Mission (GIM) for restoration of forest cover stock and restoration of degraded forests
Restoration of forest cover in moderately dense forests: 2 Mha Restoration/reforestation of deforested areas: 4 Mha
Planned policies Energy supply Increased renewable targets for the solar mission and new wind mission
100 GW solar by 202247 GW wind by 2020 and 83 GW by 2030
Enhanced bottom-up policy scenario
Forestry & Agriculture
The implementation and fulfilment of targets concerning national forest cover by 2020.
Achieve the 33% forest cover goal
Energy Supply Small, decentralised solar PV units increase electrification rate while avoiding additional coal fired power plants
Assume full electrification by 2030 through increased use of PV
Transport Fuel efficiency in transport Achieve standards as currently discussed in the EU with a five-year delay (34.4 km/l for new cars by 2030 and 47.5 km/l by 2035)
Buildings Building efficiency Strong increase in floor area can be expected at low efficiency standards; therefore, current building standards for primary energy demand for new buildings are replaced with highly efficient standards
Buildings Efficiency of appliances in industry and buildings
Assume that electricity demand can be decreased by 12% in industry and 15% in buildings below a scenario excluding an ambitious policy
HFCs Phase-down of HFCs 30% reduction in HFC consumption and production by 2025 and 60% by 2031
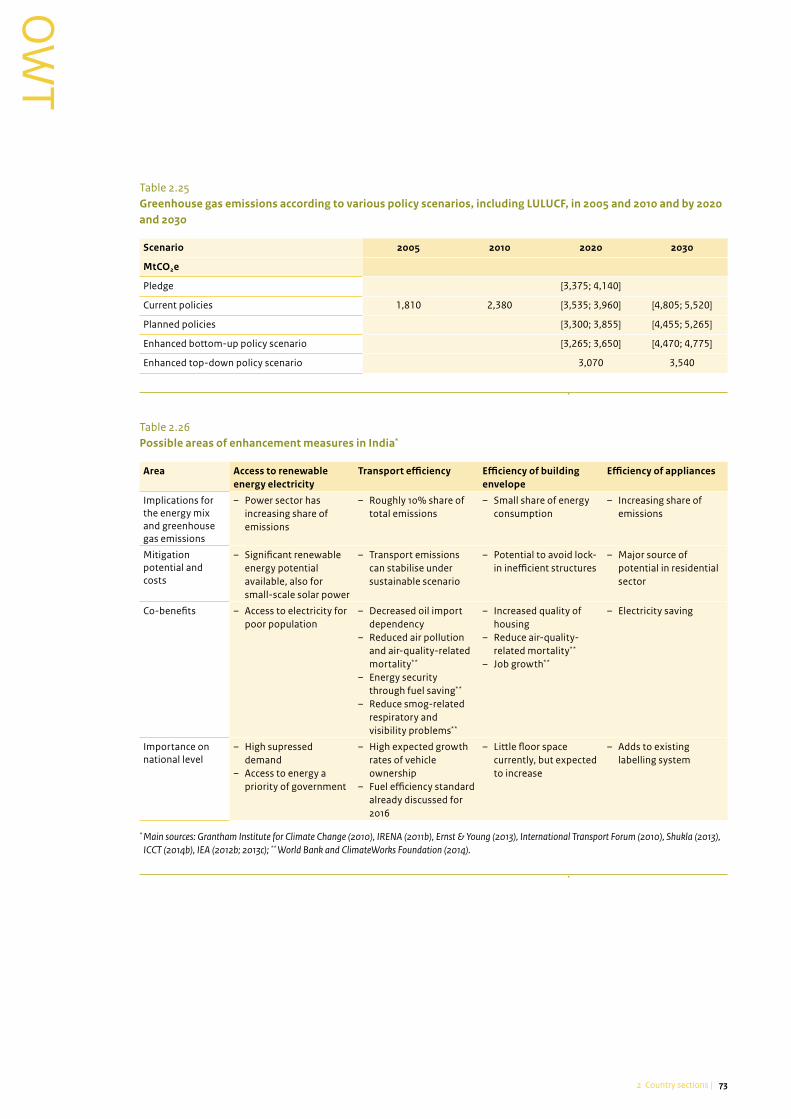
732 Country sections |
TWO
TWO
Table 2.25Greenhouse gas emissions according to various policy scenarios, including LULUCF, in 2005 and 2010 and by 2020 and 2030
Scenario 2005 2010 2020 2030
MtCO2e
Pledge [3,375; 4,140]
Current policies 1,810 2,380 [3,535; 3,960] [4,805; 5,520]
Planned policies [3,300; 3,855] [4,455; 5,265]
Enhanced bottom-up policy scenario [3,265; 3,650] [4,470; 4,775]
Enhanced top-down policy scenario 3,070 3,540
Table 2.26Possible areas of enhancement measures in India*
Area Access to renewable energy electricity
Transport efficiency Efficiency of building envelope
Efficiency of appliances
Implications for the energy mix and greenhouse gas emissions
– Power sector has increasing share of emissions
– Roughly 10% share of total emissions
– Small share of energy consumption
– Increasing share of emissions
Mitigation potential and costs
– Significant renewable energy potential available, also for small-scale solar power
– Transport emissions can stabilise under sustainable scenario
– Potential to avoid lock-in inefficient structures
– Major source of potential in residential sector
Co-benefits – Access to electricity for poor population
– Decreased oil import dependency
– Reduced air pollution and air-quality-related mortality**
– Energy security through fuel saving**
– Reduce smog-related respiratory and visibility problems**
– Increased quality of housing
– Reduce air-quality-related mortality**
– Job growth**
– Electricity saving
Importance on national level
– High supressed demand
– Access to energy a priority of government
– High expected growth rates of vehicle ownership
– Fuel efficiency standard already discussed for 2016
– Little floor space currently, but expected to increase
– Adds to existing labelling system
* Main sources: Grantham Institute for Climate Change (2010), IRENA (2011b), Ernst & Young (2013), International Transport Forum (2010), Shukla (2013), ICCT (2014b), IEA (2012b; 2013c); ** World Bank and ClimateWorks Foundation (2014).

74 | Enhanced policy scenarios for major emitting countries
TWO
resilience of forests to help local communities adapt to climate change and its impacts. The GIM also aims to restore 2 million hectares of moderately dense forest, and restore or reforest 4 million hectares of degraded forest. Moreover, there are specific goals to restore and enhance conservation on wetlands and mangrove forests, and to maintain corridors for wildlife migration within the landscape. IIASA calculations estimate that roughly 9 million hectares of forest can potentially be restored by 2030, compared to the 2000 level, due to existing land-use pressure. Overall, this would imply a minor improvement in terms of abatement of greenhouse gas emissions, because of the time it takes to build up the associated forest carbon stock.
2.6.2.3 Planned policiesEnergy supply. In November 2014, the government announced plans to increase the solar ambition to 100 GW installed capacity by 2022 (Das and Gopinath, 2015) but official legislation does not reflect this target yet. Additionally the Global Wind Energy Council projects India’s wind energy capacity to reach 47 GW by 2020 and 83 GW by 2030, based on IEA’s new policies scenario (Global Wind Energy Council and Greenpeace, 2014). If we take into account this wind policy and assume that the planned policies on solar energy supply continue at the same pace beyond 2020 (in terms of capacity increase), they could reduce emissions by 105 to 230 MtCO2e by 2020 and 255 to 350 MtCO2e by 2030, compared to the current policies scenario.
2.6.2.4 The enhanced bottom-up policy scenarioThe enhancement measures identified could reduce emissions by 270 to 305 MtCO2e by 2020 and 510 to 700 MtCO2e by 2030, compared to the current policies scenario. Compared to the planned policies scenario, emission reductions are about 40 to 200 MtCO2e by 2020 and 180 to 490 MtCO2e by 2030. Absolute remaining emissions would be about 3,265 to 3,650 MtCO2e by 2020 and 4,270 to 4,775 MtCO2e by 2030. This is a strong increase compared to current emission levels, but still keeps per-capita emissions at a relatively low level (2.8-3.2 tCO2e/cap by 2030).
Energy supply; enable access to electricity through renewable energy. Granting access to modern energy is one of the priorities in the development agenda of India. Today, 306 million persons have no access to electricity, and only half this number will gain access by 2030 under current developments (IEA, 2013c). Through decentralised renewable electricity generation, such as small-scale solar power, Indian households could be supplied with a sustainable source of electricity.
The Indian Government has announced plans to introduce solar lighting for all households in India; these endeavours could be extended to fully supply all individuals with sufficient electricity through solar PV. In our enhanced policy scenario, the Ecofys & NewClimate Institute analysis supplies all persons currently without access to electricity with solar electricity, assuming that each person consumes 500 kWh of electricity per year. This means that total electricity generation is higher than under the current scenario, but nevertheless emissions are reduced because of a higher share of solar in the total electricity mix. In the PBL analysis we assumed that each household in India is provided with 1 m2 solar PV, which will be gradually installed between 2015 and 2030.
This enhanced policy scenario option is expected to lead to emissions that are 5 to 50 MtCO2e lower than under planned policies, by 2020, and 60 to 90 MtCO2e lower by 2030, for PBL and Ecofys/New Climate Institute calculations. The change would imply an additional capacity increase in solar electricity of 50 to 70 GW by 2030.
Transport; fuel efficiency. Private vehicle ownership is expected to increase from 10 million vehicles in 2007 to approximately 250 million vehicles by 2025 (ICCT, 2014b). Besides efforts to shift transport to cleaner or more efficient modes (such as modern public transport), the efficiency of these additional vehicles is crucial to save fuel and limit local pollution. Currently, there is no efficiency or greenhouse gas emission intensity standard; however, there are some considerations for a standard starting in 2016 (ICCT, 2014b). Implementing a standard for new cars, as explained in Appendix A.2, would lead to an efficiency of 47.5 km/l by 2035, and result in emission reductions of 20 to 53 MtCO2e by 2020 and 105 to 200 MtCO2e by 2030, below the current development.
Industry and residential; efficiency improvements of electric appliances. India has various efficiency labels for appliances but few mandatory standards. For the industrial sector, the Perform, Achieve and Trade scheme exists, however not covering the complete sector. We assume that additional mandatory efficiency standards could lead to electricity saving of 12% of consumption under current policies in the industrial sector and 15% in the residential and commercial sector13. This would result in an additional reduction of 70 MtCO2e by 2020 and 90 MtCO2e by 2030. These numbers already include the lower emission intensity of the electricity sector as described in the paragraph above.
Buildings; efficiency improvements. Per capita floor space in India is still very low. Today, only a small share of floor space in India is heated or cooled. With the ongoing

752 Country sections |
TWO
TWO
development, additional buildings are necessary to provide adequate residential facilities for the growing population. We expect that the demand especially for cooling will grow significantly. No building standards currently exist, and with fast constructions needed India risks locking itself in an inefficient building stock. More efficient building envelopes can reduce energy costs for end consumers and significantly increase comfort and safety of housing.
Replacing current standards with a maximum primary energy demand of 50 kWh/m²/a for new buildings (starting today) would lead to additional emission reductions of about 20 MtCO2e by 2020 and 70 MtCO2e by 2030, beyond current policies. Based on a reference building in Mumbai, we estimate that current constructions reflect a primary energy demand of around 290 kWh/m²/a (almost completely used for cooling). Additionally, we assume an autonomous efficiency improvement of 1% per year and a demolition rate of 1.5%. Ecofys & NewClimate Institute further assume 30% of the buildings will be heated or cooled by 2020, increasing to 40% by 2030. In the PBL analysis advanced heating and insulation measures were implemented. This encompasses a gradual installation of advanced insulation in newly built houses between 2015 and 2030 and a 10% improvement in the energy efficiency of water heating. This leads to additional emission reductions of about 1 MtCO2e by 2020 and 5 MtCO2e by 2030.
Land use and land-use change and forestry (LULUCF). A possible enhancement policy of relevance for India is that of supports for increasing the national forest land cover.
The National Forestry Action Programme is being implemen ted in India but its full implementation, to date, has not been realised. The policy target is for a forest land cover of 33% by 2020. As a general point of reference, India’s forest cover in 2010 was estimated at roughly 68 million hectares, which amounts to roughly 23% of the total land area (FAO, 2010). The policy was evaluated in terms of the implementation of a carbon tax14 that is beneficial for both afforestation and halting deforestation. Calculations by IIASA estimate the implementation of the policy could expand the national forest cover by roughly 10 million hectares of forest by 2020, which would imply a national forest cover of roughly 26%. These estimates thus show that it will be difficult to achieve the overall target of 33% forest land cover.
HFC production and consumption. A phase-down schedule for consumption of HFCs based on the 2014 North American Amendment Proposal (Appendix A.5) is assumed here, similar as for China. A full implementation of the reduction scheme in India could result in a reduction below the current policies scenario of about 0–16 MtCO2e by 2020 and 42–55 MtCO2e by 2030.
2.6.2.5 The enhanced top-down policy scenarioFull implementation of the top-down mitigation measures could decrease all greenhouse gas emissions in India by about 460 MtCO2e by 2020 and 1,270 MtCO2e by 2030, compared to the current policies scenario.The impact of the mitigation options on the energy-related CO2 emissions is illustrated in Figure 2.11 and in Table A.2 (Appendix A.6). The largest potential to reduce
Figure 2.11
2000 2005 2010 2015 2020 2025 2030 2035
0
1000
2000
3000
4000Energy-related CO2 emissions (Mt CO2 per year)
Source: PBL TIMER model
pbl.n
l
History
Current policies
Enhanced policy scenario(top-down)
Reduction per sector
Electricity
Industry
Transport
Buildings
Contribution of enhanced reduction measures per sector, for India
Impact of policies analysed in the enhanced top-down policy scenario, per sector, on energy-related CO2 emissions in India. Reductions in this figure are relative to the current policies scenario.

76 | Enhanced policy scenarios for major emitting countries
TWO
energy-related CO2 emissions is in the electricity and industry sectors, with a smaller potential in the transport sector (Figure 2.11). The measure in the electricity sector (a ban on coal-fired power plants) is particularly effective in India in our assessment, mostly because India has a high dependence on coal based electricity historically in the PBL baseline projections and the current renewable energy policies only lead to moderate emission reductions. Reductions in the industry sector are achieved by a combination of the enforcement of advanced steel furnaces, good housekeeping and an improved clinker–cement ratio. All measures show an equal effect. According to Deetman et al. (2012) the effects of increased efficiencies in steel and cement production are relatively large for India, because demand for these industrial products is expected to rise.
2.6.3 Data sources and assumptionsPledgeHistorical emissions concern energy-related emissions (IEA, 2013a), non-energy-related emissions (EDGAR 4.2) (JRC and PBL, 2012) and LULUCF emissions (FAOSTAT).India provided an official quantification of emissions as a result of its pledge, based on annual GDP growth projections of 8% and 9% (Planning Commission Government of India, 2011).
Current trendsThe projections of Ecofys & NewClimate Institute are based on the projections under the current policies scenario of the World Energy Outlook 2013 for CO2 only until 2030 (IEA, 2013c), the US EPA non-CO2 emission projections until 2030 (US EPA, 2012), inventory data submitted to the UNFCCC and via national communications for historical information until 2007 and historical non-energy-related CO2 emissions from EDGAR 4.2 (JRC and PBL, 2012). For the projections of PBL, we use the IMAGE TIMER energy model (Van Vuuren et al., 2014) for an updated analysis including all policy options as summarised in Table 2.24.
The projections for LULUCF are based on GLOBIOM (Havlík et al., 2014) and G4M (Gusti, 2010) model calculations of IIASA. These estimates have been harmonised with FAO estimated emissions for the year 2010. From 2010 and onwards, the trend is fully based on model estimates taking into account socio-economic development (see Appendix B for further details).

772 Country sections |
TWO
TWO
2.7 Indonesia
2.7.1 Summary of resultsA significant share of Indonesia’s emissions is connected to forestry and land use, due to deforestation, peatland destruction, and land-use change. There is a large uncertainty in LULUCF emissions, particularly related to peat oxidations (not including peat fires), which can be in the order of 30% to 50% of total LULUCF emissions. Uncertainty concerning emissions from peat fires is also high and it is well known that these emissions vary significantly between years. This has made it difficult to determine the emission projections for Indonesia and to assess whether the 2020 pledge will be achieved. As a result, Indonesia’s emission reductions resulting from the policies assessed in our analysis are projected to be smaller than the uncertain amount of emissions from land-use changes and forestry. Therefore, emission projections that assume the implementation of these policies are mainly illustrative. Successful implementation of policies on reducing deforestation and forest degradation can lead to significant emission reductions. If all implemented policies
are successful, Indonesia would reduce emissions from LULUCF (including peat oxidation from deforestation, but excluding peat fires) by 35% below 2010 levels by 2030. For the energy sector, the renewable energy and biofuel targets set for 2025 are expected to lead to emission reductions, compared to baseline projections; however, emissions are still projected to increase further.Overall, current policies will lead to total greenhouse gas emission levels (including LULUCF) of 6% to 8% below 2010 levels by 2020, and 1% to 5% above 2010 levels by 2030. Enhanced policies on the deforestation of peatlands and in the transport sector may lead to further emission reductions, towards a projected emission level of 9% to 10% by 2020 and 2% to 5% by 2030, below 2010 levels. However, uncertainties concerning the implementation of such policies are still high. Furthermore, the emissions projected for 2020 and 2030 strongly depend on the assumed LULUCF emissions.
Figure 2.12
1990 2000 2010 2020 2030
0
500
1000
1500
2000
2500
3000Mt CO2 eq per year
Source: PBL FAIR/TIMER model; Ecofys & NewClimate Institute calculations; IIASA GLOBIOM/G4M model
pbl.n
l
History
History(National Communication)
Current policies
Enhanced policy scenario (bottom-up)
Enhanced policy scenario (top-down)
Pledge
NB: historical land-use emissions include those from peat oxidation caused by deforestation, estimated by IIASA
Including CO2 emissions from land use
Impact of climate policies on greenhouse gas emissions in Indonesia
1990 2000 2010 2020 2030
0
500
1000
1500
2000
2500
3000Mt CO2 eq per year
pbl.n
l
Excluding CO2 emissions from land use
1990 2000 2010 2020 2030
0
500
1000
1500
2000
2500
3000Mt CO2 eq per year
pbl.n
l
CO2 emissions from land use
Historical emissions are based on energy-related emissions (IEA, 2013a), non-energy-related emissions (EDGAR 4.2) (JRC and PBL, 2012), LULUCF emissions (FAOSTAT), and emissions from peat oxidation from deforestation estimated by IIASA. The projected policy scenarios include land-use emissions from FAOSTAT&IIASA (excluding emissions from peat fires but accounting for peat oxidation due to deforestation). The historical emissions (including emissions from peat oxidation due to deforestation and peat fires) in the Second National Communication are also presented. The emissions resulting from the pledge of Indonesia are based on the baseline projection in the Second National Communication.

78 | Enhanced policy scenarios for major emitting countries
TWO
Table 2.27Greenhouse gas emissions for Indonesia, excluding and including LULUCF (including peat oxidation from deforestation, but excluding peat fires), relative to 2010 levels, for 2020 and 2030 for various policy scenarios
Scenario 2020 2030 2020 2030
% relative to 2010 levels Excluding LULUCF Including LULUCF
Pledge -3%
Current policies [29%; 34%] [65%; 76%] [-6%; -8%] [1%; 5%]
Enhanced bottom-up policy scenario [27%; 33%] [60%; 70%] [-9%; -10%] [-2%; -5%]
Enhanced top-down policy scenario 24% 50% -12% -9%
Table 2.28Overview of policies analysed in our study for Indonesia
Policy status Sector Policy/measure Target
Current policies Forestry & Agriculture Implementation of FLEGT and policies for peatland fires
Energy supply Renewable energy target 15%–23% share of renewable energy in primary energy supply by 2025*
Transport Biofuel quota 15% share of biofuels in all transportation fuels by 2025
Enhanced policies Forestry & Agriculture Reduced deforestation on peatland
Transport Fuel efficiency in transport Achieve a standard of 34.4 km/l for new passenger cars by 2030
HFCs Phase-down of HFCs 30% reduction in HFC consumption and production by 2025, 60% by 2031
* 15% by 2025 is mentioned in the Second National Communication (Ministry of Environment Indonesia, 2010), while L. G. S. Online (2014) mentions 23% by 2025. Both targets are analysed, accounting for overlap with the biofuel quota.
Table 2.29Greenhouse gas emissions for Indonesia, including and excluding LULUCF, for 2005, 2010, 2020 and 2030 for various policy scenarios
Scenario 2005 2010 2020 2030
MtCO2e Including LULUCF
Pledge [1,770; 2,185]*
Current policies 1,855 2,060 [1,910; 1,950] [2,070; 2,145]
Enhanced bottom-up policy scenario [1,855; 1,895] [1,960; 2,035]
Enhanced top-down policy scenario 1,830 1,890
Scenario 2005 2010 2020 2030
MtCO2e Excluding LULUCF
Pledge
Current policies 635 725 [925; 965] [1,190; 1,265]
Enhanced bottom-up policy scenario [920; 955] [1,150; 1,225]
Enhanced top-down policy scenario 895 1,080
* The pledge of Indonesia is based on LULUCF emissions from the Second National Communication.

792 Country sections |
TWO
TWO
2.7.2 Results in detailThe following sections describe in detail the results of various scenarios. All IIASA projections of LULUCF emissions are harmonised with historical 1990–2010 emissions from the FAOSTAT emission database (see further details in Section 2.7.3 and Appendix B). Given that historical emissions are still surrounded with large uncertainties due to differences in calculation methods and data sources being used, it is noticeable that the LULUCF emissions for 2010 are very similar for the IIASA projections and the baseline projection in the Second National Communication (Ministry of Environment Indonesia, 2010). The difference between the two relates to peat fires; IIASA does not provide own projections of peat fire emissions. In the IIASA estimates, only peat oxidation related to deforestation is accounted for.
2.7.2.1 Copenhagen pledgeIndonesia submitted an unconditional pledge to reduce emissions by 26% from its baseline emission projections. At the Bangkok conference (April 2011) Indonesia also submitted a high pledge of 41%, conditional on international support. The 2020 emission target resulting from the pledges would be between 1.8 and 2.2 GtCO2e, including LULUCF emissions, based on the baseline projection in the Second National Communication (Ministry of Environment Indonesia, 2010). The 2020 pledge is defined in terms of baseline emissions, which are very uncertain for Indonesia due to the uncertainty surrounding the LULUCF emissions, in particular from peatlands (see Section 2.7.2.2). Business-as-usual emissions by 2020, including those from LULUCF, are projected to be 2,145 MtCO2e according to PBL/IIASA and 2,520 MtCO2e according to the Second National Communication (Ministry of Environment Indonesia, 2010). For 2030, this is 2,411 and 3,450 MtCO2e. Indonesia’s LULUCF emissions are mainly originating from deforestation, peatlands, and peat fires. The baseline emission projection for 2020 from the Second National Communication includes peatland emissions of about 1.0 GtCO2e, besides emissions of about 0.5 GtCO2e from peat oxidation related to peat fires and deforestation on peat soils. The IIASA baseline scenario projects deforestation and peatland emissions of 1.1 GtCO2e by 2020 and about 1.0 GtCO2e by 2030. IIASA does not provide projections for peat fire emissions; peatland emissions only include those from peat oxidation due to deforestation.
2.7.2.2 Uncertainty in LULUCF emissionsThere are large differences in estimates of LULUCF emissions for Indonesia, related to high uncertainty in data and assumptions underlying published estimates. This makes comparisons between various data sets and emission projections difficult. Large sources of uncertainties relate to deforestation rates
and to emissions from deforestation, peatland areas, decomposition of peat, and peatland fires.
In terms of deforestation rates, published estimates for the period from 2000 to 2005 vary between 0.7 Mha/year gross deforestation (Busch et al., 2012), 1.1 Mha/year gross deforestation (DNPI, 2010), and 1.9 Mha/year net deforestation (FAO, 2005). The Indonesian Ministry of Forestry (2008) reports a gross deforestation rate of 1.1 Mha/year in the 2000–2006 period, which is used as the basis for the baseline projections in the Second National Communication. The baseline projections in the Second National Communication also assume that the deforestation rate will remain constant from 2010 until 2030. From this range of estimates, IIASA assumes a gross deforestation rate of 1.55 Mha/year in 2000, 1.38 Mha/year in 2005 and 1.16 Mha/year in 2010.
Another large source of uncertainty is that of decomposition emissions that follow deforestation. Emission estimates for peatland deforestation vary from about 185 MtCO2e/year (Ministry of Forestry, 2008), to 300 MtCO2e/year (DNPI, 2010), and 590 MtCO2e/year (Busch et al., 2012). To a large extent, these differences relate to changes in underlying assumptions and which sources of emissions are taken into account; for example, whether deforested biomass is also accounted for.
Based on the uncertainties in underlying data sources available, it is recognised that reconciling assumptions and further collection of spatially explicit information on aspects such as peat soil, carbon stocks, and land change dynamics would significantly help to breach barriers to providing reliable estimates of LULUCF projections. Further specification and details of the assumptions that were taken for the IIASA projections can be found in Section 2.7.3.
2.7.2.3 Current policiesIn Indonesia, current policies may lead to total greenhouse gas emission levels (including LULUCF) of 6% to 8% below 2010 levels by 2020, and 1% to 5% above 2010 levels by 2030. Absolute remaining emissions would be about 1,910–1,950 MtCO2e by 2020 and 2,070–2,145 MtCO2e by 2030 (both including LULUCF). Emission levels projected for 2020 and 2030 strongly depend on the assumed 2010 level. Levels are different when taking into account land-use data from the Second National Communication or from FAOSTAT.
Main policies. Indonesia has several policies in place for the LULUCF sector and energy sector. Our assessment included two policies on logging, and one on controlling emissions from peatlands. For the energy sector, we

80 | Enhanced policy scenarios for major emitting countries
TWO
included the renewable targets for 2025, which overlap with the biofuel target set for 2025.
Forestry (LULUCF sector). Indonesian land-use emissions are mainly the result of deforestation and peatland destruction. There are many factors causing deforestation and forest degradation in Indonesia. These include (i) forest fires, (ii) illegal logging, (iii) forest encroachment, (iv) forest conversion for establishment of agricultural plantations, transmigration areas and new districts, (v) development of new rice fields, and (vi) large-scale mining activities. The first three factors are defined as unplanned deforestation and the remaining factors as planned deforestation (Ministry of Environment Indonesia, 2010). We looked into two policies that address both types of deforestation: a reduction in illegal logging through FLEGT measures, and a reduction in legal logging through forest conservation initiatives.
Forestry; ban on illegal logging – FLEGT. Illegal logging is one of the major sources of greenhouse gas emissions in Indonesia. The country has made efforts to control the problem through law enforcement and trade-based measures such as FLEGT-VPA. Although only a fraction of the volumes logged illegally are likely to enter the markets abroad, FLEGT is still estimated to have a notable impact on reducing CO2 emissions, ranging from 70 MtCO2e (national estimates based on Ministry of Finance, 2009) to 130 MtCO2e (IIASA estimate). The large difference between the estimates derives from the very uncertain figures in both the CO2 sequestration estimates of the IIASA baseline (especially for peatland), and the anticipated impacts of FLEGT that are largely due to varying estimates of the forests affected by illegal logging.
Legal measures to halt illegal logging have also been introduced such as the Presidential Instruction No. 10/2011 on ‘The postponement of issuance of new licenses and improving governance of primary natural forest and peatland’. This legal instrument imposes a two-year moratorium on new forest concession licenses for harvesting peatlands and natural primary forests. Instead, clearing and logging must be directed to degraded non-forest lands and existing concessions. However, as the time limit of the logging ban is uncertain and as vast expanses of selectively logged forests are excluded from the ban, the effect of the ban is highly uncertain and could potentially be very small.
Forestry; peatland fires. In 2005, a quarter of Indonesia’s total emissions was attributed to peat fires. While the ignition of such fires is hard to suppress and severity depends to a large degree on climatic factors, there is clearly a higher vulnerability of degraded peat swamp
forests. Risks for Indonesia that might lead to higher emissions by 2020 are manifold, the largest being natural disturbance. Between 1989 and 2008, fire was the primary proximate cause of deforestation in West Kalimantan (for 93% of the deforested area) and contributed to 69% of net carbon emissions of the region. To reduce emissions, protecting logged forests has earlier achieved greater reductions (21%) than protecting intact forests alone (9%) (Carlson et al., 2012).
Energy supply; renewable energy targets. According to the National Energy Policy passed in early 2014, Indonesia has a target of 23% share of renewable energy sources in the total primary energy supply by 2025 (LGS Online, 2014). This target has evolved from previous ones and is more ambitious (previously: 15% by 2025, or 17% including a 2% share of liquefied coal). Indonesia has feed-in tariffs in place for all relevant renewable electricity technologies, and has established a biofuel quota supporting the target. From 2011 to 2012, the share of renewable energy has increased from 3% to 5% (Ministry of Energy and Mineral Resources, 2013). One policy aimed at achieving the renewable energy target is the biofuel quota, which aims at a 15% share of biofuels in all transportation fuels by 2025 (Ministry of Environment Indonesia, 2010). As the renewable energy target includes assumptions on increased use of biomass, the emission reductions resulting from the biofuel target will overlap with those from the renewable energy target.
Ecofys & NewClimate Institute calculated the impacts of the change in the total share of renewable energy in primary energy, including biofuels, but also other renewable energy sources, on energy-related CO2 emissions, based on the World Energy Outlook Special Report on Southeast Asia (IEA, 2013b). The results are significantly lower than energy-related CO2 emissions projected in the Second National Communication: 460 MtCO2e for 2010 and 1330 MtCO2e for 2025. The IEA, however, already estimates emission levels with current policies to be lower than indicated in the Second National Communication.PBL analysed both the renewable and biofuel target, accounting for overlap by implementing the biofuel target in the TIMER energy model and subtracting the additional reductions due to the renewable energy target (mainly achieved by a growth in geothermal energy) from the remaining emissions. For the renewable energy target, a range of 15% to 23% in primary energy supply by 2025 was taken, based on the Second National Communication (Ministry of Environment Indonesia, 2010) and LGS Online (2014). The PBL projection of the energy-related CO2 emissions is 649 MtCO2e for 2020 and 911 MtCO2e for 2030, which is below the estimates in the Second National Communication for 2020 but above those for 2030.

812 Country sections |
TWO
TWO
2.7.2.4 The enhanced bottom-up policy scenarioEnhanced policies on deforestation of peatland and measures in the transport sector may lead to further emission reductions, towards a projected emission level of 9% to 10% below 2010 levels by 2020, and 2% to 5% below 2010 levels by 2030 (Table 2.27). Absolute remaining emissions would be about 1,855 to 1,895 MtCO2e by 2020 and 1,960 to 2,035 MtCO2e by 2030 (both including LULUCF).
Forestry & Agriculture. An additional enhanced policy scenario that has been analysed within the context of Indonesia is that of reducing peatland emissions. Peatland emissions are a significant source of carbon emissions in Indonesia; this is caused by fires on peatland, the extension of oil palm plantations, and logging operations. Thus, reduction in deforestation and degradation on peatland could potentially lead to significant reductions in the country’s CO2 emissions.
For the analysis of the enhanced policy scenario, the IIASA G4M forest model was used. The policy was analysed in the form of a control and monitoring system of peatland areas, successfully leading to a reduction in deforestation in the mapped area. The policy was assumed to reduce deforestation on peatlands starting from 2015, linearly decreasing deforestation over time
and leading to a reduction of 75% compared to IIASA baseline levels by 2030. Estimates are based on the assumption that total net deforestation is not impacted by the policy due to the spill over to other areas of deforestation. That is, a complete leakage effect from peatland areas to other land areas within that country was assumed. This is a strong assumption taken due to limitation of the approach and further reduction in emissions from this policy due to a hindering of the leakage effect could be expected. IIASA calculations project that the implementation of the policy could potentially reduce emissions from the LULUCF sector by roughly 40 MtCO2e by 2020, and roughly 70 MtCO2e by 2030 (Table 2.31).
Transport. PBL analysed the effect of enhanced policies in the transport sector, implementing a fuel efficiency standard of 34.3 km/l for all new passenger cars, to be achieved by 2030. This enhanced policy scenario results in emission reductions of 10 MtCO2e by 2020 and 35 MtCO2e by 2030, compared to the current policies scenario. The reduction is small due to the overlap with the biofuel quota in the current policies scenario. These emission reductions in the transport sector were only calculated by PBL, but their effect on total emission reductions is minor.
Table 2.30Possible areas of enhanced action in Indonesia
Area Reduced peatland deforestation Transport efficiency
Implications on the energy mix and greenhouse gas emissions
– Medium mitigation potential
Mitigation potential and costs – Significant reductions below baseline still available
– Minor effect on total emissions
Co-benefits – Increased air quality and reduced forest fires– Protection of valuable primary forest areas– Protection of key biodiversity areas in
natural forests
– Mostly negative to low costs
Importance on national level – Laws concerning the protection of peatland ecosystems are already in place and could potentially be strengthened
– Air quality; premature deaths from air pollution avoided
– Energy security through fuel saving– Reduce smog-related respiratory and
visibility problems
Table 2.31Estimated total forest land-use emissions in Indonesia for the various policies*
MtCO2/y Emissions source 2020 2030
Current policies Forest land 980 880
Enhanced policies Forest land 940 810
* Emissions as estimated by GLOBIOM and G4M have been harmonised with historical emissions from FAO based on 2010, and include emissions related to above- and belowground biomass, dead organic matter, and soil organic carbon.

82 | Enhanced policy scenarios for major emitting countries
TWO
HFC production and consumption. A phase-down schedule for consumption of HFCs based on the 2014 North American Amendment Proposal (Appendix A.5) is assumed here, similar as for China. Implementation of this proposal in Indonesia would result in a reduction below the current policies scenario of about 0 MtCO2e by 2020 and 2–4 MtCO2e by 2030.
2.7.2.5 The enhanced top-down policy scenarioIt is expected that full implementation of the top-down mitigation measures could decrease all greenhouse gas emissions in Indonesia by about 80 MtCO2e by 2020 and 180 MtCO2e by 2030, compared to the current policies scenario.
The impact of the mitigation options on the energy-related CO2 emissions is illustrated in Figure 2.13 and in Table A.2 (Appendix A.6). The largest potential to reduce energy-related CO2 emissions is in the power, transport and buildings sectors, while additional reductions from the industry sector are limited (Figure 2.13). The measure in the electricity sector is particularly effective in Indonesia in our assessment, mostly because, historically, Indonesia has had a high dependence on coal-based electricity, as in the PBL baseline projections, and a low share of renewable energy. The additional reductions in the transport sector come from the enhanced passenger vehicle standards, which are the same as those in the enhanced bottom-up scenario as discussed in the previous section. The potential in this sector is large as existing fuel efficiencies in light commercial vehicles are
relatively low. In the buildings sector, major emission reductions can be achieved by introducing a ban on incandescent light bulbs and by the installation of solar photovoltaic (PV) systems.
2.7.3 Data sources and assumptionsCurrent trendsThe projections for LULUCF are based on GLOBIOM (Havlík et al., 2014) and G4M (Gusti, 2010) model calculations of IIASA. These estimates have been harmonised with FAO estimated emissions for the year 2010. From 2010 and onwards, the trend is fully based on model estimates taking into account socio-economic development (see Appendix B for further details).Non-CO2 projections, CO2 process emissions and projections of emissions of LULUCF of NewClimate Institute & Ecofys are based on the baseline in the Second National Communication for all sectors except the energy-related emissions. Those are calculated based on the World Energy Outlook Special Report for Southeast Asia (IEA, 2013b), as this scenario includes the most recently implemented policies.
For the projections of PBL, we use the IMAGE TIMER energy model (Van Vuuren et al., 2014). The projections were harmonised with historical 1990–2010 emissions from the energy-related emissions (IEA, 2013a), non-energy-related emissions (EDGAR 4.2) (JRC and PBL, 2012) and LULUCF emissions excluding peatland emissions (FAOSTAT). Details concerning assumptions on peatland emissions are described below.
Figure 2.13
2000 2005 2010 2015 2020 2025 2030 2035
0
200
400
600
800
1000Energy-related CO2 emissions (Mt CO2 per year)
Source: PBL TIMER model
pbl.n
l
History
Current policies
Enhanced policy scenario(top-down)
Reduction per sector
Electricity
Industry
Transport
Buildings
Contribution of enhanced reduction measures per sector, for Indonesia
Impact of policies analysed in the enhanced top-down policy scenario, per sector, on energy-related CO2 emissions in Indonesia. Reductions in this figure are relative to the current policies scenario.

832 Country sections |
TWO
TWO
Box 2.2 Assumptions on and sources of LULUCF (in detail)In IIASA’s G4M model, the gross deforestation rate was estimated to have been 1.55 Mha/year in 2000 and 1.38 Mha/year in 2005. This is in line with the national estimates by DNPI (2010), who estimated deforestation rates of 1.8 Mha/year in the late 1990s, decreasing to 1.1 Mha/year in 2000 to 2005. IIASA’s estimates are based on the forest maps by Hansen et al. (2013), where some reported forest loss corresponds to forest management operations (logging and planting). According to Hansen et al. (2013), forest logging is detected as gross forest cover loss. This could potentially cause the IIASA’s estimates of deforestation to be too high, as some forest management activities will be classified as deforestation. FAO FRA reports a net deforestation rate of 1.87 Mha/year for 2005 and an average net deforestation rate of 0.5 Mha/year between 2000 and 2010 (FAO, 2005; FAO, 2010). However, as these figures give the net deforestation, they are not directly comparable to the IIASA’s gross deforestation estimates.In G4M, the initial (1990) carbon stock in forest living biomass (above and belowground) is taken from a map by Kindermann et al. (2008), who used FAO FRA 2005 data (FAO, 2005). The average carbon stock for Indonesia in FAO FRA 2005 is about 50 tC/ha in aboveground biomass and 17 tC/ha in below ground biomass (67 tC/ha in total), which is just half of the carbon stock reported in FAO FRA 2010 (FAO, 2010) and FAO STAT (according to the FAO STAT Metadata, the numbers are based on FAO FRA 2010 data). In the projections by G4M, the average carbon stock in remaining forests grows by 99 tC/ha by 2005, which is still 42% less than the FAO FRA 2010 number. Therefore, deforestation emissions from biomass estimated by G4M may be about 40% lower than other estimates.G4M starts modelling in 1990 while it uses land cover as of 2000 (based on GLC2000). Therefore, the forest area in the model is not changed during 1990–2000, although the deforestation and afforestation emissions are estimated. Also, it is assumed that peatland that is not covered with forest in the initial year has been deforested before 2000 and emissions are estimated as described in the next paragraph. This model spin-up is important for estimation of soil and peat decomposition emissions, because they are accounted for over a long time. In G4M, the deforestation rate on peatland forests during 1990–2000 simulates forest loss of about 9 Mha by 2000, which corresponds to the value reported by Hoojer et al. (2006).For estimation of peat decomposition emissions that follow deforestation, we apply emission factors recommended by Hooijer et al. (2014). The emission factor is 179 tCO2/(ha year) for the first five years after deforestation and 55 tCO2/(ha year) for all consequent years. We assume that the average annual subsidence rate of peat is 5.1 cm/year (Valin et al., 2014) and average peat thickness is 4.5m (Jaenicke et al., 2008). Every deforested and drained peat unit used for agriculture emits CO2 until it is completely depleted. For every simulation period in each cell with deforested peatland, the peat decomposition emissions are estimated as a sum of recently deforested units multiplied by 179.66 tCO2/(ha year) and area of earlier deforested units multiplied by 55 tCO2/(ha year), and peat thickness of the units is decreased by 5.1 cm annually. The deforested units contribute to the total current peat emissions of the cell while their peat thickness is greater than zero.

84 | Enhanced policy scenarios for major emitting countries
TWO
2.8 Japan
2.8.1 Summary of resultsUnder current policies Japan’s emissions (excluding LULUCF) are estimated to be between 1,135 to 1,330 MtCO2e by 2020 (10% below to 6% above 2010 levels) and 1,045 to 1,190 MtCO2e by 2030 (6% to 17% below 2010 levels). The large range is caused by the uncertainty about the phase-out of nuclear energy, as it is not yet fully clear whether this will occur and which energy carriers will replace the nuclear energy capacity. The upper end of the range basically assumes a full phase-out of nuclear energy, while the lower end assumes that some plants will be reconnected to the grid. This means that meeting its new tentative 2020 target, i.e. to reduce emissions by 3.8% from 2005 levels by 2020 (excluding
LULUCF; corresponding to a 3.4% increase on 2010 levels), could be challenging for Japan under full nuclear energy phase-out.Additional enhancement measures in renewable electricity generation and in the areas of efficiency in buildings and transport may reduce emissions to a level between 965 and 1,065 MtCO2e by 2030 (16% to 24% below 2010), and could compensate potential emissions from a nuclear energy phase-out. Co-benefits of these policies include increased energy security due to fuel saving and less import dependency on coal and other fossil fuels. Furthermore, fuel efficiency in transport might reduce smog-related respiratory and visibility problems.
Figure 2.14
1990 2000 2010 2020 2030
-500
0
500
1000
1500
2000Mt CO2 eq per year
Source: PBL FAIR/TIMER model; Ecofys & NewClimate Institute calculations
pbl.n
l
History Current policies
Enhanced policy scenario (bottom-up)
Enhanced policy scenario (top-down)
Pledge
Excluding CO2 emissions from land use
Impact of climate policies on greenhouse gas emissions in Japan
1990 2000 2010 2020 2030
-500
0
500
1000
1500
2000Mt CO2 eq per year
pbl.n
l
CO2 emissions from land use
Historical greenhouse gas emissions (excluding LULUCF) are based on national inventories submitted to UNFCCC. The LULUCF emission projections are based on the assumption that emissions will not change between 2010 and 2030. Historical emission data are taken from the Sixth National Communication (see details in Section 2.8.3). See also Figure 2.15 for details on the enhanced top-down policy trajectory.

852 Country sections |
TWO
TWO
Table 2.32Greenhouse gas emissions (excluding LULUCF) for Japan, relative to 2010 and 2005 levels, by 2020 and 2030 for various policy scenarios
Scenario 2020 2030
% relative to 2010 levels
Pledge 3.4%
Current policies [-10%; 6%] [-17%; -6%]
Enhanced bottom-up policy scenario [-12%; 6%] [-24%; -16%]
Enhanced top-down policy scenario -8% -25%
% relative to 2005 levels
Pledge -3.8%
Current policies [-16%; -2%] [-23%; -12%]
Enhanced bottom-up policy scenario [-18%; -2%] [-29%; -22%]
Enhanced top-down policy scenario -14% -31%
Table 2.33Overview of policies analysed in our study for Japan
Policy status Sector Policy/measure Target
Current policies Energy Supply Basic Energy Plan/Renewable Energy Act
13.5% renewable electricity by 202020% renewable electricity by 2030(supported by FIT scheme)
Transport
F-gases
Top Runner Programme
Act on Rational Use and Proper Management of Fluorocarbons
16.8 km/l by 2015, 20.3 km/l by 2020
Control recycling of equipment using F-gases
Enhanced bottom-up policy scenario
Energy Supply Phase out nuclear energy Replace nuclear energy generation by renewable energy in the long term
Transport Fuel efficiency in transport Achieve standards as currently discussed in the EU (47.5 km/l for new cars by 2030)
Buildings Building efficiency Current building standards for primary energy demand for new buildings are replaced with highly efficient standards
HFCs Phase-down of HFCs 10% reduction in HFC consumption and production by 2018, 35% by 2023, 70% by 2029, and 85% by 2035
Table 2.34Greenhouse gas emissions (excluding LULUCF) for Japan, for 2005, 2010, 2020 and 2030 for various policy scenarios
Scenario 2005 2010 2020 2030
MtCO2e
Pledge 1,300
Current policies 1,350 1,255 [1,135; 1,330] [1,045; 1,190]
Enhanced bottom-up policy scenario [1,040; 1,250] [965; 1,065]
Enhanced top-down policy scenario 1,170 940

86 | Enhanced policy scenarios for major emitting countries
TWO
2.8.2 Results in detail2.8.2.1 Copenhagen pledgeJapan revised its 2020 pledge on 15 November 2013 due to the Fukushima disaster and the consequent uncertainty regarding the future role of nuclear energy and now aims to reduce emissions by 3.8% compared with 2005 levels by 2020, excluding LULUCF (UNFCCC, 2014b) (Table 2.32). The new 2020 pledge is equivalent to an increase of 5.2% above 1990 levels (excluding LULUCF) and represents a strong decrease in ambition in comparison to the previous mitigation target of 25% below 1990. In absolute terms, Japan’s pledge implies a target level of 1,300 MtCO2e for 2020, excluding LULUCF. The Climate Action Tracker calculates potential credits from LULUCF sinks of 44 MtCO2e by 2020. The absolute value of the pledge level excluding LULUCF could thus be slightly higher (Climate Action Tracker, 2014b). This aspect is not considered further in the data in this report.
2.8.2.2 Current policiesIn Japan, current policies may lead to total greenhouse gas emission levels (excluding LULUCF) of 2% to 16% below 2005 levels by 2020, and 12% to 23% below 2005 levels by 2030 (Tables 2.33 and 2.34). Absolute remaining emissions would be about 1,135 to 1,330 MtCO2e by 2020 and 1,045 to 1,190 MtCO2e by 2030 (both excluding LULUCF) (Table 2.35). Our analysis shows that the 2020 emission level after implementation of current policies is likely to be below the pledged emission target of 1,300 MtCO2e for 2020, excluding LULUCF. However, it also shows that Japan will only achieve its pledge under current policies if nuclear energy is not fully phased out.
Energy sector. The government announced a complete revision of the national energy and climate policy after the Fukushima incident. The new Basic Energy Plan that came out halfway 2014 does not include midterm quantitative reduction targets on nuclear energy, but does call for the restart of nuclear power plants (Kuramochi, 2014). Although the nuclear energy phase-out as secured after the Fukushima incident in the Innovative strategy for energy and the environment (The Energy and Environment Council Government of Japan, 2012) is being implemented, the current developments point at withdrawal of this policy (Kuramochi, 2014). Therefore the current policies scenarios as calculated by Ecofys & NewClimate Institute account for two alternative trajectories around the implementation of nuclear energy. The first assumes a nuclear energy phase-out and the second that several reactors will be able to restart, based on projections under the current policies scenario in the World Energy Outlook 2013. The PBL analysis assumes that nuclear energy developments are the same as in the PBL baseline projections, so no nuclear energy phase-out.
The energy plan further includes a 13.5% renewable electricity target for 2020 and 20% for 2030 that is supported by a Feed-in-Tariff (FIT) scheme. The FIT scheme is included in the Ecofys & NewClimate Institute analysis, whereas PBL only includes the renewable electricity targets. Interestingly, calculations of Ecofys & NewClimate Institute show that the capacity assumed here could result in a higher renewable energy share than the 13.5% target for 2020, indicating the success of the Renewable Energy Act.
Transport sector. Japan had already introduced effective policies in the transport sector starting in 1998, of which the Top Runner Progamme15 has the highest impact and was updated in 2013. The result is a vehicle efficiency standard for new cars of 16.8 km/l by 2015 and 20.3 km/l by 2020. But all in all, we can conclude that given the uncertain development in the power sector, emission projections for Japan are uncertain. The projected range in emissions after implementation of current policies shows that Japan will only achieve its pledge if nuclear energy is not fully phased out.
F-gases. Japan is currently implementing a programme to control recovery of F-gases from cooling and other appliance use (Kazuhiro, 2013). Japan’s first Biennial Report projects reductions of 9.7–15.6 MtCO2e by 2020 resulting from these efforts. We include this range of reductions in the scenario of current policies, assuming enforcement of the legislation as planned.
2.8.2.3 The enhanced bottom-up policy scenarioThe implementation of enhancement measures could decrease emissions to between 1,040 and 1,250 MtCO2e by 2020 and between 965 and 1,065 MtCO2e by 2030, relative to those under the current policies scenario. The reduction by 2030 is especially large compared to under the current policies scenario with nuclear energy phase-out. This again shows that the decision regarding nuclear energy phase-out, including the possible technology that could replace the nuclear energy capacity, significantly affects expected greenhouse gas emissions.
Energy supply; nuclear and renewable energy. The new energy plan does not include quantified targets for nuclear energy until 2030. In contrast to the current policies scenario that takes into account both phase-out and no phase-out of nuclear energy, the enhanced policy scenario assumes that nuclear energy phase-out will be implemented and that Japan will implement renewable electricity technologies at the same pace as Germany has done since the year 2000. The remaining electricity production in the Ecofys & NewClimate Institute calculations is assumed to come from coal-fired power plants. In the PBL calculations, a ban on new coal-fired

872 Country sections |
TWO
TWO
power plants is introduced. Therefore, it is assumed that new capacity for electricity production consists of highly efficient power plants (gas or coal with CCS) or renewable technologies.
Transport; fuel efficiency. Japan already introduced fuel efficiency standards for new passenger and heavy-duty vehicles in 1979, which were included in the Top Runner Programme in 1998 (Kuramochi, 2014). But despite the long history and ambitious targets in the past, the EU currently has stricter targets for new passenger vehicles until 2025. Therefore, we assume the same enhanced transport policy as for Canada. This could lead to a decrease in emissions of 30 to 55 MtCO2e by 2030, relative to the current policies scenario.
Buildings; efficiency improvements. With the Top Runner Programme, Japan has achieved high efficiency levels for appliances. Efficiency in the buildings sector, on the other hand, is lower. Current building standards for residential buildings translate into 390 MJ/m²/a of cooling/heating load (taking the median of various climate zones). With an assumed energy conversion efficiency in the buildings sector of 50%, this results in primary energy demand of 80 kWh/m²/a. Increasing the standard to 40 kWh/m²/a for new buildings (starting today) would reduce emissions further by 2 to 11 MtCO2e by 2020 and 8 to 24 MtCO2e by 2030. The standard is comparable to a standard that is secured in German legislation for new and renovated buildings, which is accompanied by financial support.
HFC production and consumption. For Japan, the North American Amendment Proposal would mean that HFC consumption is reduced by 10% by 2018 and 85% by 2035, below the baseline (EPA, 2013b) (see also Australia). Implementation of this proposal in Japan could result in a reduction below the current policies scenario of about 11–42 MtCO2e by 2020 and 50–70 MtCO2e by 2030.
2.8.2.4 The enhanced top-down policy scenarioFull implementation of the top-down mitigation measures would decrease all greenhouse gas emissions in Japan by about 65 MtCO2e by 2020 and 180 MtCO2e by 2030, compared to the current policies scenario.
The impact of the mitigation options on the energy-related CO2 emissions is illustrated in Figure 2.15 and in Table A.2 (Appendix A.6). The largest potential to reduce energy-related CO2 emissions is in the transport and industry sectors, with smaller potential in the electricity and buildings sectors (Figure 2.15). The reductions in the transport sector come from the enhanced passenger vehicle efficiency standards, which are the same as those in the enhanced (bottom-up) scenario. The effect is due to the relatively large car ownership per 1,000 inhabitants in Japan (World Bank, 2015). The reductions in the industry sector are mainly due to the implementation of advanced steel furnaces and good housekeeping measures.
Table 2.35Possible areas of enhanced action in Japan*
Area Increased renewable electricity generation
Fuel efficiency in transport Energy efficiency in building envelope
Implications on the energy mix and greenhouse gas emissions
– Increased emissions in recent years after Fukushima accident
– Road vehicles major share in transport
– Together with appliances approx. 30% of energy consumption
Mitigation potential and costs
– Replace nuclear energy generation by renewable energy in the long term
– Significant reductions below baseline still available (e.g. 24% by 2030 according to IEA)
– 40% energy consumption reduction below 1990 level possible (including efficiency of appliances)
Co-benefits – Decrease in coal import dependency
– Decrease in fuel import dependency
– Energy security through fuel saving**
– Reduce smog-related respiratory and visibility problems**
– Increased comfort– Decreased dependency on
fuel imports
Importance on national level
– Little public acceptance of nuclear energy
– High dependency on coal imports (2nd net importer)
– High dependency on oil imports (3rd net importer)
– Some efficiency standards already exist
– Building standard already in place – could be strengthened
* Main Sources: EIA (2013c; 2014b; 2014c), OECD and IEA (2009), REN21 (2014b), International Transport Forum (2010), IEA (2013c, 2013a), Braun et al. (2014), Murakami et al. (2009); ** World Bank and ClimateWorks Foundation (2014).

88 | Enhanced policy scenarios for major emitting countries
TWO
The mitigation measures in the electricity sector include a ban on new coal fired power plants after 2020. The effect of this measure is relatively small, as Japan already implemented quite some renewable energy policies and has a large share of nuclear energy in their current policies.
2.8.3 Data sources and assumptionsPledgeHistorical and future emissions were taken from the national inventories submitted to UNFCCC. For the absolute pledge value including LULUCF, IIASA’s LULUCF projection was used.
LULUCF emissionsLULUCF emissions projections for Japan are based on the assumption that the emissions will remain constant and do not change between 2010 and 2030. Japan’s negative LULUCF emissions are highly correlated with the CO2 removals from forest land. Historically, the forest land and removals of CO2 related to the forest sector have been stable. The IIASA projections of LULUCF emissions for Japan also show a trend of stable CO2 removals. However, the trend of decreasing domestic demand of wood and decline in active forest management makes the LULUCF emission projections uncertain. Changing forest management and reduction in forest harvest levels can have notable implications for the LULUCF emissions for Japan.
Current trendsThe projections of Ecofys & NewClimate Institute are based on those under the current policies scenario of the World Energy Outlook 2013 for CO2 only until 2030 (IEA,
2013c), the US EPA non-CO2 emission projections until 2030 (US EPA, 2012), and inventory data submitted to the UNFCCC for historical information up to 2010.
The current policies scenario of the World Energy Outlook does not cover the updated energy strategy which would lead to higher REN targets than those assumed under the current policies scenario. Therefore, we additionally quantified the new targets assuming that the approved installations under the feed-in schemes will go fully in operation. The capacity assumed here results in a higher renewable energy share than the 13.5% target for 2020. The additional reduction was subtracted from the projections under the current policies scenario of the World Energy Outlook 2013, because we used the underlying data of the World Energy Outlook. In an alternative scenario, we use emission projections from the Sixth National Communication. The emissions here are slightly higher, as for the power sector, the share of energy carriers was frozen at 2012 values given the uncertainty of future development of nuclear energy. In 2012, Japan had no nuclear energy connected to the grid and a high share of coal fired power generation.
For the scenario projections of PBL, we use the IMAGE TIMER energy model (Van Vuuren et al., 2014) and included all policy options as summarised in Table 2.33. The LULUCF emission projections are based on the assumption that emissions will not change between 2010 and 2030. Historical emissions are taken from the Sixth National Communication. The projections were harmonised with historical 1990–2010 emissions from the UNFCCC National Inventory Submissions, Common Reporting Format Tables for Japan.
Figure 2.15
2000 2005 2010 2015 2020 2025 2030 2035
0
400
800
1200
1600Energy-related CO2 emissions (Mt CO2 per year)
Source: PBL TIMER model
pbl.n
l
History
Current policies
Enhanced policy scenario(top-down)
Reduction per sector
Electricity
Industry
Transport
Buildings
Contribution of enhanced reduction measures per sector, for Japan
Impact of policies analysed in the enhanced top-down policy scenario, per sector, on energy-related CO2 emissions in Japan. Reductions in this figure are relative to the current policies scenario.

892 Country sections |
TWO
TWO
2.9 Mexico
2.9.1 Summary of resultsProjections of current policies show that Mexico is expected to achieve emission reductions, but these are not sufficient to meet its conditional pledge of 30% emission reduction by 2020, relative to the national baseline levels (about 670 MtCO2e).Under policy enhancement measures in the energy, transport and forestry sectors, emissions (including LULUCF) could be about 4% to 12% below 2010 levels by 2020 (665–720 MtCO2e), and 17% to 20% below 2010 levels by 2030 (600–625 MtCO2e). The selected
mitigation enhancement measures will halt deforestation, increase vehicle efficiency standards, with a strong continuation of renewable energy implementation and strong cuts in gas flaring, as well as phasing-down hydrofluorocarbons. Such measures would have multiple co-benefits in terms of reducing air pollution and agricultural damage, providing energy security and reducing the dependence on fossil fuels.
Figure 2.16
1990 2000 2010 2020 2030
-200
0
200
400
600
800
1000Mt CO2 eq per year
Source: PBL FAIR/TIMER model; Ecofys & NewClimate Institute calculations; IIASA GLOBIOM/G4M model
pbl.n
l
History Current policies
Enhanced policy scenario (bottom-up)
Enhanced policy scenario (top-down)
Pledge
Including CO2 emissions from land use
Impact of climate policies on greenhouse gas emissions in Mexico
1990 2000 2010 2020 2030
-200
0
200
400
600
800
1000Mt CO2 eq per year
pbl.n
l
Excluding CO2 emissions from land use
1990 2000 2010 2020 2030
-200
0
200
400
600
800
1000Mt CO2 eq per year
pbl.n
l
CO2 emissions from land use
Historical greenhouse gas emissions (excluding LULUCF) are based on inventory data of the Fifth National Communication to the UNFCCC (Government of Mexico, 2012). The LULUCF emission projections as a result of the current policies (range) are based on the Fifth National Communication and model calculations by IIASA. See also Figure 2.17 for details of the enhanced top-down policy trajectory.

90 | Enhanced policy scenarios for major emitting countries
TWO
Table 2.36Greenhouse gas emissions for Mexico (including LULUCF), by 2020 and 2030 for various policy scenarios
Scenario 2020 2030
% relative to 2010 levels
Pledge -10%
Current policies [4%; 9%] [12%; 14%]
Enhanced bottom-up policy scenario [-12%; -4%] [-20%;-17%]
Enhanced top-down policy scenario 5% -9%
Table 2.38Greenhouse gas emissions (including LULUCF) for Mexico, for 2005, 2010, 2020 and 2030 for various policy scenarios
Scenario 2005 2010 2020 2030
MtCO2e
Pledge 670**
Current policies 655 750 [770; 810] [835; 850]
Enhanced bottom-up policy scenario [665; 720] [600; 625]
Enhanced top-down policy scenario 780 685
** Pledge is 30% below national baseline emission projections
Table 2.37Overview of policies analysed in our study for Mexico
Policy status Sector Policy/measure Target
Current policies Energy supply Special Climate Change Programme on 2013–2018 (2014)
Increase share of renewable energy in energy production: from 22.8% by 2018 to 26.5% by 2027
Forestry Protected areas according to the payments for Ecosystem Services (PES) scheme for promoting conservation, restoration and sustainable forest use
To reach zero net emissions associated with land-use change by 2020
Enhanced bottom-up policy scenario
Forestry & Agriculture
National Climate Change Strategy, 10-20-40 Vision (2013), defining milestones after 10, 20 and 40 years
10 year goals include: Protection of the most vulnerable ecosystems20 year goals include: Positive rate in forest carbon sinks, Stop in deforestation
Energy Supply Enhance renewable energy target (following National Climate Change Strategy)
35% REN (electricity) by 202440% REN (electricity) by 203450% REN (electricity) by 2044
Continue strong trend of renewable targets, backed by supportive measures to assure implementation
Transport Fuel efficiency in transport Achieve standards as currently discussed in the EU with a five year delay (34.4 km/l for new cars by 2030 and 47.5 km/l by 2035)
Fugitive emissions Decrease vented and flared emissions Assume that a maximum of 5% of gas is flared. Apply reduction below baseline for this specific sector to all fugitive emissions (preliminary percentage: 65% reduction)
HFCs Phase-down of HFCs 30% reduction in HFC consumption and production by 2025, 60% by 2031

912 Country sections |
TWO
TWO
2.9.2 Results in detailFigure 2.16 shows the emission projections based on harmonised historical emission trends using the official national estimates (Government of Mexico, 2012; NCCS, 2013). Historical emissions of greenhouse gases differ between data sources, and using another historical data set for harmonisation would affect the emission projection. The historical pathway based on the IEA, EDGAR and FAO databases, for instance, shows a lower trend compared to what is shown in Figure 2.16 (Government of Mexico, 2012; NCCS, 2013). The CO2 emissions (including LULUCF) are similar for both sources, but the non-CO2 greenhouse gas emissions in 2010 are more than 100 MtCO2e lower according to EDGAR than according to official estimates, indicating the large uncertainty in historical data for non-CO2 greenhouse gas emissions.
2.9.2.1 Copenhagen pledgeMexico was one of the first developing countries to ratify the Kyoto Protocol and one of the first to adopt a long-term reduction target for 2050, consisting of a 50% emission reduction relative to year 2000 levels. For 2020, it has pledged to reduce greenhouse gas emissions by 30% against national baseline emission projections (UNFCCC, 2011). The 2020 emission level if the pledge is
achieved is expected to be around 670 MtCO2e (NCCS, 2013), including LULUCF emissions. Mexico’s pledge is conditional on adequate financial and technological support from developed countries as part of a global agreement.
2.9.2.2 Current policiesAccording to our calculations, the emission projections including Mexico’s current national policies are about 4% to 9% above 2010 emission levels, including LULUCF, by 2020. This is about 17% below national baseline emission projections for 2020, so about half-way towards its pledge (Tables 2.36 and 2.38).
Main policies. In 2012 the General Law on Climate Change16 was adopted, which provides a solid institutional framework to support mitigation measures and sets several targets for 2020 and 2024. The first target is to achieve a 30% emission reduction by 2020 relative to baseline projections. This secures Mexico’s international Cancún pledge in a national climate law. The second target aims at a 35% share of electricity generated from clean energy sources by 2024. Both targets are confirmed in the National Climate Change Strategy (NCCS) 10-20-40 Vision (NCCS, 2013). The NCCS also adds a target of 40% share of renewable electricity generated to be reached in
Table 2.39Possible areas of enhanced action in Mexico*
Area Increase renewable electricity generation
Reduce fugitive emissions from fossil fuel production
Efficiency in transport
Implications on the energy mix and greenhouse gas emissions**
– Electricity generation 23% of total emissions in 2010
– 15% of total emissions in 2010 – Transport sector 33% of total emissions in 2010
– Sector with strongest emission growth since 1990
Mitigation potential and costs
– High potential at moderate costs available
– A variety of renewable energy resources exists (all of wind power, solar power, geothermal power, biomass, and hydropower)
– Mostly negative costs and measures which are implemented easily
– Substantial reductions by 2030 possible through improved emission standards
Co-benefits – Job creation (175,000 jobs, IRENA, 2013)
– Reduced ground-level ozone and related agricultural and health damage***
– Upstream energy saving– Improved health and reduced crop
losses through reduced ground-level ozone (smog)***
– Decrease in local air pollution
– Decrease fossil fuel dependency
– Energy security through fuel saving***
– Reduce smog-related respiratory and visibility problems***
Importance on national level
– Increasing interest of private sector in renewable energy (specifically wind power)
– Government of Mexico as well as PEMEX are founding partners of Global Methane Initiative
* Main sources: IRENA (2011c, 2013), OECD and IEA (2009), CTS Mexico (2010), Robinson et al. (2003); **Government of Mexico (2012); *** World Bank and ClimateWorks Foundation (2014).

92 | Enhanced policy scenarios for major emitting countries
TWO
20 years and a target of 50% share of renewable electricity in 40 years. The Special Renewable Energy Programme (Government of Mexico, 2014) of 2014 also introduces renewable electricity targets in terms of increasing the share of renewable energy in energy production to 22.8% by 2018 and 26.5% by 2027. As there are various renewable targets for the period until 2030, our calculations for the current policies scenario assume that the Special Renewable Energy Programme targets for 2027 are achieved. Another target, as defined in the Vision de Mexico Sobre REDD+ (Comisión Nacional Forestal, 2010), aims at zero net carbon loss from forest ecosystems and is also included in our current policies scenario.
2.9.2.3 The enhanced bottom-up policy scenarioAccording to our study, enhanced policy measures in the energy supply, transport and forestry sectors in Mexico could lead to an emission level (including LULUCF) of 17% to 20% below 2010 levels, by 2030 (Table 2.36).
Continuation of strong renewable energy targets. In contrast to the current policies scenario, where we assumed meeting the less ambitious 2027 renewable electricity target, in the enhanced policy scenario we assumed implementation of the more ambitious target from the NCCS (2013) that aims to achieve a 35% share of electricity generated from clean energy sources by 2024, and 40% by 2034. Achieving a 37% share of renewable energy by 2030 (based on a linear path towards the 40% target for 2034) will have limited effect on 2020 emission levels, compared to the current policies scenario, and is expected to reduce emissions by 20 to 100 MtCO2e by 2030. In order to achieve this target, some financial incentives are in place together with the opportunity for the private sector to produce electricity and heat.
Fuel efficiency in transport. For the enhanced policy scenario, we assume that Mexico can increase mitigation efforts in transport with a fuel economy standard (the same as for Brazil). According to our calculations, the expected emission reduction will be 15 to 30 MtCO2e by 2020 and 55 to 90 MtCO2e by 2030, relative to the current policies scenario.
Reduce fugitive emissions from fossil fuel production. Total fugitive emissions of the oil and gas sector were 77 MtCO2e in 2010, roughly 15% of total emissions in Mexico (Government of Mexico, 2012). As it is unclear what the baseline projections from the World Energy Outlook and the Fifth National Communication assume on flaring reductions, we made our own associated petroleum gas (APG) utilisation baseline projections. Our calculations assumed that no autonomous improvement on APG utilisation will take place, and used crude oil
production projections as a proxy for APG utilisation projections. Assuming that flared or vented emissions are reduced to 5% of gas production, this additional policy is projected to reduce emissions by 65% below our reference scenario. If we assume that similar emission reductions could be achieved for all fugitive emissions from fossil fuel production in all years, emissions could be reduced by 70 MtCO2e by 2020 and 90 MtCO2e by 2030.
Land use and land-use change and forestry (LULUCF). NCCS (2013) defines milestones for mitigating the climate change impacts in three time horizons, 10, 20 and 40 years. The 10 year goals include for example protection of the most vulnerable ecosystems. This is also supported by the National Forestry Programme for 2014 to 2018, which focuses on increasing the production and productivity of sustainable forestry, protection and restoration of forest ecosystems, and decreasing the level of annual deforestation. These are then reflected in the 20-year goals of the NCCS, which aim at a full stop in deforestation and reaching a positive rate in forest carbon sinks. While the targets are ambitious, it should also be noted that deforestation is here not specified further. As highlighted by Brown and Zarin (2013), if deforestation is interpreted as a net value (difference in forest area between two points in time), its effects on the CO2 emissions may be ambiguous as it is possible that losses in native forests are compensated by young secondary forests or plantations.
For the analysis of the enhanced policy scenario, the IIASA G4M forest model was used. The policy was analysed in the form of an implementation of a carbon price providing forest owners incentives to reduce deforestation and enhance afforestation. The IIASA analysis found that full implementation of the policy would be difficult, particularly in terms of a full stop of deforestation by 2030. Calculations estimate that net deforestation by 2030 would still be in the range of 120,000 ha per year. Still, our analysis shows that the policy would reduce emissions by 35 MtCO2e by 2030 (see Figure 2.16).
HFC production and consumption. An implementation of the North American Amendment Proposal to phase-down the HFC production and consumption would mean that Mexico’s HFC consumption would be reduced by 30% by 2025 and 60% by 2031, below the baseline17 (EPA, 2013b), leading to a reduction below the current policies scenario of about 0–8 MtCO2e by 2020 and 21–29 MtCO2e by 2030.
2.9.2.4 The enhanced top-down policy scenarioFull implementation of the top-down mitigation measures (see Table 1.1) would decrease all greenhouse gas emissions in Mexico by about 30 MtCO2e by 2020 and 165 MtCO2e by 2030, compared to the current policies scenario.

932 Country sections |
TWO
TWO
The impact of the mitigation options on the energy-related CO2 emissions is illustrated in Figure 2.17 and in Table A.2 (Appendix A.6). The largest potential to reduce energy-related CO2 emissions is in the transport sector, followed by the industry sector (Figure 2.17). The electricity and buildings sectors have the lowest reduction potential. The potential in the transport sector is substantial as existing fuel efficiencies in light commercial vehicles are relatively low, approximately similar as in Brazil and Russia. The reductions in the industry sector are mainly due to the implementation of advanced steel furnaces and good housekeeping measures.
2.9.3 Data sources and assumptionsCurrent trendsFor the projections of Ecofys, we use the previous baseline as included in Mexico’s Special Climate Change Programme (PECC) (SEMARNAT, 2009). For the current trend scenarios, we apply growth rates from the policy scenario of the Climate Action Tracker’s detailed country analysis from 2012 (Höhne et al., 2012)
to historical emissions and as an alternative scenario use data from the Fifth National Communication (Government of Mexico, 2012), assuming that the reductions achieved through the PECC in 2012 will remain stable until 2030. For the scenario projections of PBL, we use the IMAGE TIMER energy model (Van Vuuren et al., 2014), and included all policy options as summarised in Table 2.37.
The projections for LULUCF are based on GLOBIOM (Havlík et al., 2014) and G4M (Gusti, 2010) model calculations by IIASA. These estimates have been harmonised with Fifth National Communication emissions for the year 2010. From 2010 and onwards, the trend is fully based on model estimates taking into account socio-economic development (see Appendix B for further details).
The projections were harmonised with historical 1990–2010 emissions from the inventory data in the Fifth National Communication.
Figure 2.17
2000 2005 2010 2015 2020 2025 2030 2035
0
100
200
300
400
500
600Energy-related CO2 emissions (Mt CO2 per year)
Source: PBL TIMER model
pbl.n
l
History
Current policies
Enhanced policy scenario(top-down)
Reduction per sector
Electricity
Industry
Transport
Buildings
Contribution of enhanced reduction measures per sector, for Mexico
Impact of policies analysed in the enhanced top-down policy scenario, per sector, on energy-related CO2 emissions in Mexico. Reductions in this figure are relative to the current policies scenario.

94 | Enhanced policy scenarios for major emitting countries
TWO
2.10 The Russian Federation
2.10.1 Summary of resultsUnder the Copenhagen Accord, the Russian Federation pledged an emission reduction of 15% to 25%, relative to 1990 levels, by 2020. In September 2013, the Russian Government committed to the higher end of the target. This could be achieved under current policies. The Russian State Programme includes targets for energy efficiency and renewable electricity generation. Russia’s gas flaring policy could lead to additional emission reductions, but it is unclear whether this policy will be fully implemented. The current policies analysed in this assessment could lead to an emission
level of 2,295 to 2,375 MtCO2e by 2020 (4% to 7% above 2010 levels) and 2,175 to 2,770 MtCO2e by 2030 (3% below 2010 levels to 25% above 2010 levels), excluding land-use emissions. Enhanced policies in the transport, energy and buildings sectors could lead to additional emission reductions, resulting in emission levels of 2,260 to 2,340 MtCO2e by 2020 and 2,055 to 2,315 MtCO2e by 2030 (8% below to 5% above 2010 levels). One of the co-benefits of these enhanced policies is that of improved air quality.
Figure 2.18
1990 2000 2010 2020 2030
-1000
0
1000
2000
3000
4000Mt CO2 eq per year
Source: PBL FAIR/TIMER model; Ecofys & NewClimate Institute calculations
pbl.n
l
History Current policies
Enhanced policy scenario (bottom-up)
Enhanced policy scenario (top-down)
Pledge
Excluding CO2 emissions from land use
Impact of climate policies on greenhouse gas emissions in the Russian Federation
1990 2000 2010 2020 2030
-1000
0
1000
2000
3000
4000Mt CO2 eq per year
pbl.n
l
CO2 emissions from land use
Historical greenhouse gas emissions (excluding LULUCF) are based on national inventories submitted to UNFCCC, and forestry emissions from the Sixth National Communication (Russian Federation, 2013). The land-use emission projections are based on the Sixth National Communication (Russian Federation, 2013).

952 Country sections |
TWO
TWO
Table 2.40Greenhouse gas emissions (excluding LULUCF) for the Russian Federation, by 2020 and 2030 for various policy scenarios
Scenario 2020 2030
% relative to 2010 levels
Pledge [14%]
Current policies [4%; 8%] [-3%; 25%]
Enhanced bottom-up policy scenario [2%; 6%] [-8%; 5%]
Enhanced top-down policy scenario 2% -12%
* Here, reductions relative to 2010 excluding LULUCF are presented. Reductions relative to 2010 levels (including LULUCF) highly depend on the projected LULUCF emissions. Absolute emission levels (excluding LULUCF) are very different.
Table 2.41Overview of policies analysed in our study for the Russian Federation
Policy status Sector Policy/measure Target
Current policies Energy supply Energy intensity target 26.5–40% reduction in energy intensity (TPES) of GDP by 2020, compared to 2007 and 44% by 2030, compared to 2005 level
Energy supply Renewable mix target 2.5% to 4.5% renewable energy in the power sector by 2020
Fugitive emissions Gas flaring target 5% limit on gas flaring for 2012 and subsequent years
Enhanced bottom-up policy scenario
Transport Fuel efficiency in transport
Achieve standards as currently discussed in the EU (35.9 km/l by 2025 and 47.5 km/l by 2030 for new cars)
Buildings Building efficiency Reduced energy use for heating and hot water supply in residential (49% of 2005 level) and public (42% of 2005 level) buildings
Energy supply Renewable mix target Increase the renewable energy share by 1.35 percentage points per year, up to 21% by 2030
HFCs Phase-down of HFCs 35% reduction in HFC consumption and production by 2023, 70% by 2029, and 85% by 2035
Table 2.42Greenhouse gas emissions (excluding LULUCF) for the Russian Federation, for 2005, 2010, 2020 and 2030 for various policy scenarios
Scenario 2005 2010 2020 2030
MtCO2e
Pledge 2,525
Current policies 2,135 2,220 [2,295; 2,375] [2,175; 2,770]
Enhanced bottom-up policy scenario [2,260; 2,340] [2,055; 2,315]
Enhanced top-down policy scenario 2,255 1,975

96 | Enhanced policy scenarios for major emitting countries
TWO
2.10.2 Results in detail2.10.2.1 Copenhagen pledgeUnder the Copenhagen accord, the Russian Federation pledged a greenhouse gas emission reduction of 15% to 25% relative to 1990 levels by 2020. The pledge is conditional on appropriate accounting of LULUCF and on the largest emitting countries taking on legally binding obligations. A Presidential Decree (No. 752, September 2013) confirmed the more ambitious target of 25% reduction on 1990 levels by 2020 (UNFCCC, 2014c).
2.10.2.2 Current policiesRussia’s energy efficiency, renewable energy, and gas flaring policies are expected to lead to total emission levels of 2,295 to 2,375 MtCO2e by 2020 and 2,175 to 2,770 MtCO2 by 2030 (excluding LULUCF). This implies that the Russian Federation will achieve its pledged level of emissions by 2020. The range of emission projections for 2030 is quite large and consists of an energy CO2 emission projection of the current policies scenario of World Energy Outlook 2014 used by Ecofys/NewClimate with an increasing trend between 2020 and 2030 and the PBL baseline scenario showing a decreasing trend. Both projections have the same underlying annual GDP growth assumption of 3.5%.
Main policies. The Russian Federation’s energy strategy states that decreasing the energy intensity of the economy is its main objective (UNFCCC, 2012). This main policy is complemented with a target for the share of renewable energy in the power mix and a limit on gas flaring.
Energy efficiency. In order to improve its energy efficiency, the Russian Federation has passed several laws and rules (GLOBE International, 2013). The main programme, ‘Energy saving and energy efficiency improvement until 2020’, was developed in 2010 and supported by a federal law on energy saving. As part of this programme, the Russian Federation launched a mechanism for public-private partnerships in the field of energy efficiency and renewable energy sources. Between 2010 and 2012, there were further discussions regarding additional state energy efficiency programmes, but so far none have been implemented.
In the ‘Energy saving and energy efficiency’ programme, the Russian Federation committed to reduce energy intensity of GDP by 40% by 2020 compared to 2007 levels. Russia’s Energy Strategy (Ministry of Energy of the Russian Federation, 2010) further set a goal for 2030: reduce energy intensity of GDP by 44% compared with 2005. In the PBL TIMER baseline projections that take into account the renewable energy target (see below), energy intensity of GDP decreases by 32% between 2007 and
2020 and by 60% between 2005 and 2030. Therefore, no additional emission reductions come from the energy intensity policy. Ecofys & NewClimate Institute calculations are based on the current policies scenario of World Energy Outlook 2014 (IEA, 2014), which includes the implementation of the federal law on energy conservation and energy efficiency with the target for 2020 (compare Table B.1 of the World Energy Outlook 2014). Using constant 2005 USD GDP, this scenario projects energy intensity to decrease by only 14% between 2007 and 2020 and by 42% between 2005 and 2030. The differences in the energy intensity improvements for both projections (PBL and Ecofys & NewClimate Institute), explain the wide range of emission projections (Figure 2.18). Achieving the full targets would result in emission reductions of almost 500 MtCO2e by 2020. For comparison, the Russian Energy Agency (2011) projects energy intensity of GDP to decrease by 26.5% by 2020 compared to 2007 without additional government support, due to autonomous efficiency improvements and structural shifts in the energy market. The 26.5% improvement would result in 250 MtCO2e reductions by 2020, below those under the current policies scenario of the IEA’s World Energy Outlook. Moving from the 42% improvement already considered in the World Energy Outlook 2014 to the 44% target, would reduce emissions by 70 MtCO2e by 2030. The improvements of 26.5% by 2020 and 44% by 2030 are included in the aggregated scenario of Ecofys & NewClimate Institute.
Renewable energy. In 2009, the government published a decree for enhancing energy efficiency18 through renewable energy (Ministry of Natural Resources Russian Federation, 2010), which called for an increase in the share of renewable energy sources in the power mix to 4.5% by 2020, excluding large-scale hydropower. However, the International Finance Corporation (2013a) mentions that the 2020 target might not be reached: ‘Following delays with the implementation of the federal renewable energy policy, strong doubts can be expressed as regards to whether the 4.5 per cent target can be achieved by 2020.’ The 4.5% target has never officially been amended. However, more recent government documentation refers to capacity based targets in line with a 2.5% share of renewable power (excluding large-scale hydropower) (IFC, 2013a, IFC, 2013b). Therefore, the PBL and Ecofys & NewClimate institute calculations assumed a range of 2.5%–4.5% by 2020. This target would lead to emission reductions of between 0 and 10 MtCO2e by 2020, according to PBL calculations. According to Ecofys & NewClimate Institute calculations, the resulting emission level would be 10 to 40 MtCO2e below that under the current policies scenario of the World Energy Outlook (IEA, 2014).

972 Country sections |
TWO
TWO
Reduce emissions from gas flaring. The Russian Federation is one of the most important oil and gas producers in the world. In January 2009, a government decree was adopted aimed at reducing emissions from gas flaring. A 5% limit for gas flaring has been set for 2012 and subsequent years with fines being imposed if this threshold is exceeded. The 5% limit can also be reformulated as a 95% minimum utilisation of Associated Petroleum Gas (APG). In 2005, CO2 emissions from flaring in the Russian Federation were approximately 150 MtCO2. It is unclear what the baseline projections from the World Energy Outlook and Sixth National Communication assume on flaring reductions. However, a study carried out by Pöyry Management Consulting (Norway) concludes that it is unlikely that the Russian Federation will reach its 95% utilisation goal within the next three to five years (Loe, 2012). In spite of increased fees for excessive flaring, it is often cheaper to pay the fines than to utilise more APG. Complex technological, economic and political factors impede increased APG utilisation. While many existing oil fields are located in remote areas without infrastructure and technological solutions for APG utilisation, new oil fields are planned in even more remote areas, without access to gas transportation systems. Consequently, more efficient APG utilisation will require large investments and pose limitations on oil production. There are large uncertainties concerning flaring emissions in the Russian Federation. Therefore, we have made our own APG utilisation baseline projections. Our calculations assumed that no autonomous improvement on APG utilisation will take place, and used crude oil production projections as a proxy for APG
utilisation projections. We assumed that the emission target will be achieved and will remain constant at the 2012 level, due to the implementation barriers, leading to reductions of 12 to 36 MtCO2e by 2020 and 31 to 56 MtCO2e by 2030 (for reference: in 2010, emissions were 37 MtCO2e).
2.10.2.3 The enhanced bottom-up policy scenarioThe implementation of enhancement measures in the transport, energy and buildings sectors could together decrease emissions to a projected level of 2,260 to 2,340 MtCO2e by 2020 and 2,055 to 2,315 MtCO2e by 2030 (excluding LULUCF). This strong reduction is mainly achieved by increasing the share of renewable energy in power generation. Ecofys & NewClimate Institute calculations find a much stronger emission reduction in absolute terms compared to PBL calculations. However, because Ecofys & NewClimate Institute calculations project higher emissions with current policies, the projected ranges for enhanced policies are smaller. Ecofys & NewClimate Institute results presented below are compared to the current policy projections excluding the energy intensity targets. In the aggregated enhanced policy scenario, only emission reductions additional to achieving the energy intensity targets are taken into account.
Fuel efficiency in transport. For the enhanced policy scenario, we calculated the effect of a fuel economy standard for new cars, assuming the same enhanced transport policy as for Canada. According to our calculations, emission reductions will be 15 to 30 MtCO2e by 2020 and 45 to
Table 2.43Possible areas of enhanced action in the Russian Federation
Area Transport efficiency Building efficiency Renewable power generation
Implications on the energy mix and greenhouse gas emissions
– Emissions from road transport are projected to grow due to increased car ownership*/***
– Primary energy saving potential of 49% in the residential and 42% in the commercial sector compared to 2005 levels*
– Large share of emissions from power generation
Mitigation potential and costs
– Large saving potential at negative abatement costs***
– Large saving potential at negative abatement costs***
Co-benefits – Reduced air pollution and air-quality-related mortality**
– Decreased household expenditures on fuels**
– Increased quality of housing– Reduce air-quality-related
mortality**
– Job growth**
– Improved air quality
Importance on national level
– Transport Strategy of the Russian Federation until 2030 includes the objective to reduce energy consumption in transport to the level of the more advanced countries*
– Energy consumption per square meter is very high compared to other countries***
– Strong projected growth of floor space***
– Large potential for renewable energy remains largely untapped*
– Targets are already in place and could be enhanced
Main sources: * UNFCCC (2012); ** World Bank and ClimateWorks Foundation (2014); ***McKinsey & Company (2009b)

98 | Enhanced policy scenarios for major emitting countries
TWO
106 MtCO2e by 2030, relative to the current policies scenario.
Building efficiency. The 2005 energy saving potential for heating was 49% in residential buildings and 42% in commercial buildings (UNFCCC, 2012). Ecofys & NewClimate Institute calculations assume that this potential will be achieved by 2030 and take into account an autonomous efficiency improvement rate of 1% per year. This will lead to a reduction of 27 to 32 MtCO2e by 2020 and 84 to 99 MtCO2e by 2030, below the current policies scenario (excluding intensity targets). The PBL calculations show only marginal reductions of 4 MtCO2e by 2020 and 10 MtCO2e by 2030, compared to those under the current policies scenario, as the effects of improvements were already included in the baseline.
Energy supply. For the enhanced policy scenario for the Russian Federation, we assumed the same enhanced renewable energy policy as for Canada. This would lead to a share of non-hydro renewable energy of 7.5% by 2020 and 21% by 2030. Emission reductions beyond current policies are projected to be 5 MtCO2e by 2020 and 65 MtCO2e by 2030, based on PBL calculations. Ecofys & NewClimate Institute calculations indicate a reduction of 81 MtCO2e by 2020 and 272 MtCO2e by 2030, below the current policies scenario (excluding intensity targets).
HFC production and consumption. For the Russian Federation, a full implementation of the North American Amendment Proposal could result in a reduction compared to the current policies scenario of about
5 to 33 MtCO2e by 2020 and 33 to 84 MtCO2e by 2030, according to PBL and Ecofys & NewClimate Institute calculations.
2.10.2.4 The enhanced top-down policy scenarioFull implementation of the top-down mitigation measures (see Table 1.1) would decrease all greenhouse gas emissions in the Russian Federation by about 115 MtCO2e by 2020 and 230 MtCO2e by 2030, compared to the current policies scenario.
The impact of the mitigation options on the energy-related CO2 emissions is illustrated in Figure 2.19 and in Table A.2 (Appendix A.6). The largest potential to reduce energy-related CO2 emissions is in the industry and transport sectors, with smaller potential in the building and electricity sectors (Figure 2.19). The reduction effects of increased efficiencies in steel and cement production in the industry sector are relatively large for the Russian Federation, as steel and cement production are two of the key industries in this region. These industries are currently also relatively energy intensive, so efficiency improvements could affect emissions significantly. Main reductions in this study come from the enforcement of advanced steel furnaces, followed by the implementation of good housekeeping measures in both the steel and cement industries. The reductions in the transport sector come from the enhanced passenger vehicle efficiency standards (see enhanced bottom-up scenario). The potential in this sector is large as existing fuel efficiencies in light commercial vehicles are relatively low and total car ownership in this country is large.
Figure 2.19
2000 2005 2010 2015 2020 2025 2030 2035
0
500
1000
1500
2000Energy-related CO2 emissions (Mt CO2 per year)
Source: PBL TIMER model
pbl.n
l
History
Current policies
Enhanced policy scenario(top-down)
Reduction per sector
Electricity
Industry
Transport
Buildings
Contribution of enhanced reduction measures per sector, for the Russian Federation
Impact of policies analysed in the enhanced top-down policy scenario, per sector, on energy-related CO2 emissions in the Russian Federation. Reductions in this figure are relative to the current policies scenario.

992 Country sections |
TWO
TWO
2.10.3 Data sources and assumptionsPledgeThe target for 2020 was calculated from the most recent UNFCCC national inventory submissions, excluding land-use emissions.
Current trendsEcofys & NewClimate Institute projections are based on the current policies scenario of the World Energy Outlook 2014 for CO2 from fuel combustion (IEA, 2014), the US EPA projections for non-CO2 emissions (US EPA, 2012) and extrapolation of the historical trend for other CO2 emissions. In addition, the flaring limit, renewable electricity generation targets and energy intensity targets are quantified. The reduction from limiting flaring is based on historical flaring data (NOAA, 2011), historical oil production data (IEA, 2013a) and projections for oil production (BP, 2014). Calculations for the renewable power generation target are based on the current policies scenario of the World Energy Outlook 2014 (IEA, 2014).For the projections of PBL, we use the IMAGE TIMER energy model (Van Vuuren et al., 2014) for an updated analysis including all policy options as summarised in Table 2.41.The projections were harmonised with historical 1990–2010 emissions from the UNFCCC National Inventory Submissions for the Russian Federation. Forestry emissions were also taken from the Sixth National Communication of the Russian Federation, based on the projection under current level of land-use activities (Russian Federation, 2013).

100 | Enhanced policy scenarios for major emitting countries
TWO
2.11 South Korea
2.11.1 Summary of resultsSouth Korea introduced a green growth strategy to stimulate green technologies and industries. Based on this strategy, South Korea pledged to reduce emissions unconditionally by 30%, compared to baseline levels, by 2020, implying an emission target level of about 545 MtCO2e, excluding LULUCF. The green growth strategy is supported by renewable targets for 2020 and 2030, which were introduced in the 2010 National Basic Energy Plan. South Korea launched a national emissions trading system (ETS) in January 2015. According to our assessment, the ETS and the renewable energy target could result in stabilisation of South Korea’s emission levels (excluding LULUCF) at 585 to 640 MtCO2e by 2020 and 585 to 700 MtCO2e by 2030. This is a deviation from the historical trend of strongly increasing emissions and is an important step towards achieving the pledge. However, it is not
expected to be sufficient to achieve the pledged emission level by 2020. Whether South Korea will achieve its unconditional pledge depends on the enforcement of its emissions trading system.Under enhancement measures in the power, transport and buildings sectors and a phase-down of hydrofluorocarbons, South Korea may reduce its emissions to a level of 565 to 635 MtCO2e by 2020 and 450 to 535 MtCO2e by 2030 (excluding LULUCF; about 15% to 29% below 2010 levels). Especially replacing coal by renewable energy in power generation could contribute to significant emission reductions beyond those resulting from current policies. Co-benefits of these enhanced policies consist of improved air quality and a decreased dependency on imported fuels.
Figure 2.20
1990 2000 2010 2020 2030
-200
0
200
400
600
800
1000Mt CO2 eq per year
Source: PBL FAIR/TIMER model; Ecofys & NewClimate Institute calculations
pbl.n
l
History Current policies
Enhanced policy scenario (bottom-up)
Pledge
Excluding CO2 emissions from land use
Impact of climate policies on greenhouse gas emissions in South Korea
1990 2000 2010 2020 2030
-200
0
200
400
600
800
1000Mt CO2 eq per year
pbl.n
l
CO2 emissions from land use
Historical greenhouse gas emissions (excluding LULUCF) are based on the national inventories submitted to the UNFCCC and the Third National Communication (South Korea. Ministry of Environment, 2012). LULUCF emission projections as a result of current policies are based on the Third National Communication and model calculations.
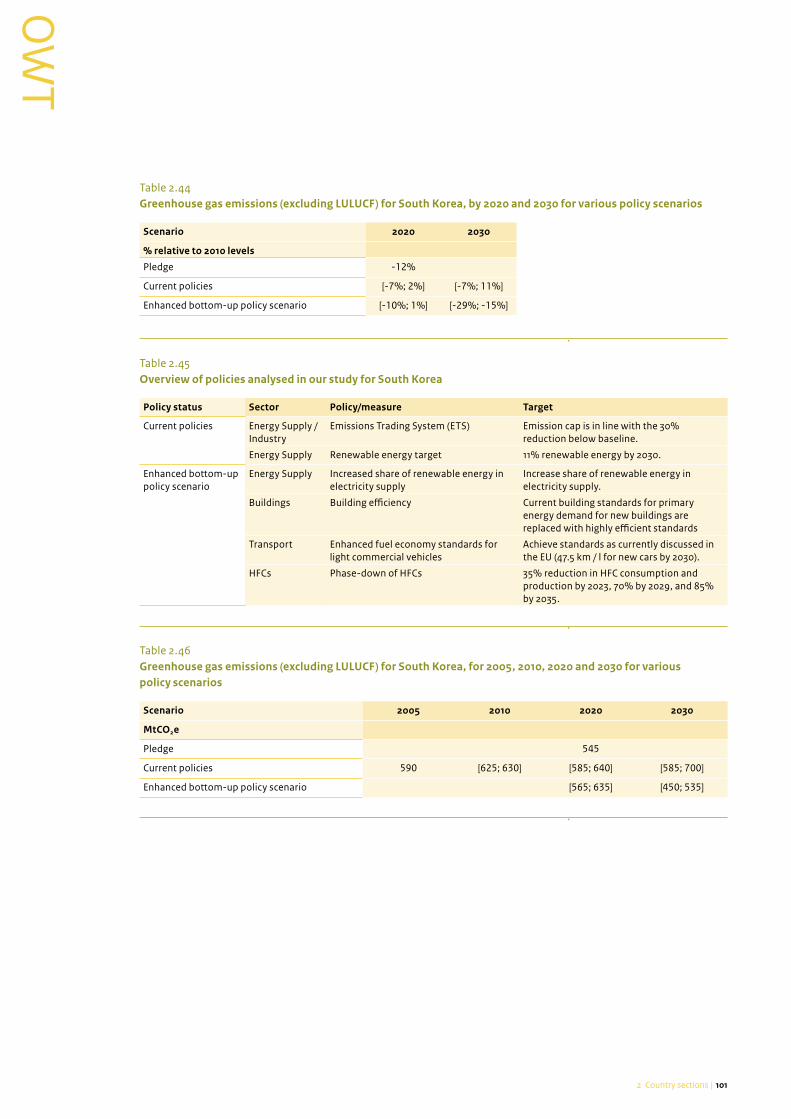
1012 Country sections |
TWO
TWO
Table 2.44Greenhouse gas emissions (excluding LULUCF) for South Korea, by 2020 and 2030 for various policy scenarios
Scenario 2020 2030
% relative to 2010 levels
Pledge -12%
Current policies [-7%; 2%] [-7%; 11%]
Enhanced bottom-up policy scenario [-10%; 1%] [-29%; -15%]
Table 2.45Overview of policies analysed in our study for South Korea
Policy status Sector Policy/measure Target
Current policies Energy Supply / Industry
Emissions Trading System (ETS) Emission cap is in line with the 30% reduction below baseline.
Energy Supply Renewable energy target 11% renewable energy by 2030.
Enhanced bottom-up policy scenario
Energy Supply Increased share of renewable energy in electricity supply
Increase share of renewable energy in electricity supply.
Buildings Building efficiency Current building standards for primary energy demand for new buildings are replaced with highly efficient standards
Transport Enhanced fuel economy standards for light commercial vehicles
Achieve standards as currently discussed in the EU (47.5 km / l for new cars by 2030).
HFCs Phase-down of HFCs 35% reduction in HFC consumption and production by 2023, 70% by 2029, and 85% by 2035.
Table 2.46Greenhouse gas emissions (excluding LULUCF) for South Korea, for 2005, 2010, 2020 and 2030 for various policy scenarios
Scenario 2005 2010 2020 2030
MtCO2e
Pledge 545
Current policies 590 [625; 630] [585; 640] [585; 700]
Enhanced bottom-up policy scenario [565; 635] [450; 535]

102 | Enhanced policy scenarios for major emitting countries
TWO
2.11.2 Results in detail2.11.2.1 Copenhagen pledgeSouth Korea has pledged to reduce emissions by 30% by 2020, compared to baseline projections (UNFCCC, 2011). This is an unconditional pledge. South Korea lowered its baseline projections from 813 to 776 MtCO2e in its Third National Communication (South Korea. Ministry of Environment, 2012). With this lowered baseline projection, the pledge would result in an emission level of about 545 MtCO2e by 2020 (excluding LULUCF). In 2014, the Ministry of Environment published its National Greenhouse Emissions Reduction Roadmap. This roadmap reconfirms the national baseline projections and emissions reduction pledge and provides a sectoral breakdown of the emission reduction.
2.11.2.2 Current policiesThe ETS and renewable target together could achieve emission reductions, which would be a big step towards achieving the pledged emission level. The energy efficiency measures that are part of the energy plans could lead to further reductions. Therefore, with additional policies targeting the sectors not covered by the ETS, South Korea would be heading in the right direction towards achieving its international pledge.
Main policies. South Korea declared its green growth plan19 in 2008. The plan is backed by the Framework Act on Low Carbon and Green Growth, which was passed by the National Assembly in 2010. The key objectives are to reduce greenhouse gas emissions and to encourage green technologies and industries. The National Basic Energy Plan supports the green growth plan and contains energy efficiency and renewable energy targets. Our assessment focused on the renewable energy target and the upcoming Emissions Trading System (ETS).
Emissions Trading System (ETS). In May 2012, South Korea approved legislation announcing the implementation of a National Emissions Trading System modelled after the EU ETS, to be launched in 2015 and covering all installations with emissions higher than 25 ktCO2e/year. South Korea already introduced a Target Management System (TMS) in 2012, as an instrument for preparing the national ETS system. The absolute emission cap of the ETS is to be in line with the international emission reduction pledge of 30% against baseline projections. The ETS will cover approximately 490 of the country’s largest emitters, which cover around 60% of the total emissions (EDF and IETA, 2014). As it is not yet clear whether a comprehensive MRV20 system will be in place, we assumed that the ETS will meet 94%–100% of its reduction target. The emission reductions expected from the ETS are between 154 and 164 MtCO2e by 2020, based on PBL TIMER projections. Based on Ecofys & NewClimate Institute calculations,
the emission reduction is estimated to be between 109 and 117 MtCO2e by 2020. The impact of the ETS system beyond 2020 is highly dependent on the enforcement of the ETS.
Renewable energy. The long-term renewable target, introduced in the National Basic Energy Plan (Ministry of Knowledge Economy South Korea, 2010), has been set at 11% renewable energy by 2030. This target is to be realised by the five-year action plan, which includes a target for 2020 aimed at increasing the share of renewable energy to 6.1% (UNEP, 2010). This target is expected to decrease emissions by about 30–49 MtCO2e by 2020 and 80–97 MtCO2e by 2030, according to Ecofys & NewClimate Institute and PBL calculations. In order to achieve this target, South Korea initiated several programmes. In 2012, the Renewable Portfolio Standard (RPS) replaced the previous feed-in tariff system. The RPS mandates large power utilities to meet annual generation targets from renewable energy increasing from 2% in 2012 to 10% by 2022 (Kemco, 2014b). For the housing sector, a subsidy programme has been in place since 2004, which aims at one million homes being supplied by renewable energy by 2020 (Kemco, 2014a). Both Ecofys & NewClimate Institute and PBL calculations assume an overlap of 25% to 75% between the renewable energy target and the ETS, based on expert judgement.
2.11.2.3 The enhanced bottom-up policy scenarioThe implementation of enhancement measures in four sectors (Table 2.45) could decrease emissions by 0 to 22 MtCO2e by 2020 and 105 to 160 MtCO2e by 2030 compared to the current policies scenario.21 This strong reduction can mainly be achieved by replacing coal-fired electricity generation by renewable energy. South Korea could move towards a trajectory that is close to their Copenhagen pledge by implementing these enhancement measures.
Increased share of renewable energy in electricity supply. Renewable energy accounted for 3.7% of total electricity generation in South Korea in 2012 (REN21, 2014a). For the enhanced policy scenario, we assumed the same enhanced renewable energy policy as for Australia. From the 3.7% share in 2012 (REN21, 2014a), this would imply reaching a share of 14.5% by 2020 and 28% by 2030. The additional generation using renewable energy replaces coal-fired generation. Expected emission reductions beyond those from current policies (excluding the ETS) are 42 MtCO2e by 2020 and 101 MtCO2e by 2030, based on Ecofys & NewClimate Institute calculations. PBL calculations result in reductions of 1 to 13 MtCO2e by 2020 and 2 to 31 MtCO2e by 2030.

1032 Country sections |
TWO
TWO
Efficiency improvements of building envelope. In 2008, the Building Design Criteria for Energy Saving were adopted, which cover building envelope requirements for all new buildings. Besides this mandatory standard, South Koreas has also implemented a number of voluntary programmes to enhance building energy efficiency (Evans et al., 2009). However, energy intensity in the residential and commercial sector remains relatively high in South Korea (Young, 2014).
For the enhanced policy scenario we assumed an ambitious new building standard of 40 kWh/m2/a primary energy for heating and cooling (starting today). We further assumed that with current policies, new buildings have 20% to 40% lower primary energy demand compared to the average energy demand per square metre of a typical Korean house. Expected emission reductions are 3 to 5 MtCO2e by 2020 and 8 to 14 MtCO2e by 2030, based on Ecofys & NewClimate Institute calculations.
Enhanced fuel economy standards for light commercial vehicles. A fuel economy standard of 17 km/l for new light commercial vehicles is already in place in South Korea (Façanha et al., 2012). However, no target has yet been adopted for the period after 2015. For the enhanced policies area, we assume the same enhanced transport policy as for Brazil. Ecofys & NewClimate Institute calculations indicate that this could result in emission reductions beyond the current standard (excluding the ETS) of 6 MtCO2e by 2020 and 31 MtCO2e by 2030.
HFC production and consumption. For the enhanced policy scenario, similar as Brazil, a full implementation of the North American Amendment Proposal is assumed. Implementation of this proposal in South Korea could result in a reduction below the current policies scenario of about 0 MtCO2e by 2020 and 51–65 MtCO2e by 2030, according to Ecofys/NewClimate Institute and PBL calculations.
2.11.3 Data sources and assumptionsPledgeHistorical emissions in South Korea were taken from the national inventories submitted to UNFCCC and the Third National Communication (South Korea. Ministry of Environment, 2012). Baseline projections were taken from the Third National Communication.
Current trendsProjections of Ecofys & NewClimate Institute are based on the International Energy Outlook 2013 Reference case projections for CO2 emissions only until 2030 (EIA, 2013a), the U.S. EPA non-CO2 emission projections until 2030 (EPA, 2013a) and historical emission data from national inventories submitted to UNFCCC and the Third National Communication (South Korea. Ministry of Environment, 2012). The International Energy Outlook 2013 projections are further updated to include the Renewable Portfolio Standard, ’1 Million Green Homes’ Project and ETS. It is assumed that, with these policies, the share of renewable energy in total energy supply will be 6.1% by 2020 and 11% by 2030 (UNEP, 2010). The ETS system is assumed
Table 2.47Possible areas of enhancement measures in South Korea
Area Renewable energy Transport efficiency Building efficiency
Implications on the energy mix and greenhouse gas emissions
– Power sector is biggest emitting sector
– 3.7% renewable electricity generation in 2012***
– Strong increase in vehicle activity projected**
Mitigation potential and costs
– Large shares of renewable energy possible**
– Strong emission mitigation potential*
– Potential to avoid lock-in in inefficient structures
– Energy Audits have identified energy saving potential****
Co-benefits – Improvements in air quality– Decrease dependency of
imported fuels**
– Job creation
– Decreased household expenditures on fuels*
– Decrease in local air pollution; avoidance of premature deaths from air pollution*
– Increased comfort– Decreased energy bills*
– Job creation*
Importance on national level
– 96.5% of fossil fuel demand is currently met by imports**
– Vehicle efficiency standard for 2015 is already in place and could be strengthened
– Building standard is already in place and could be strengthened
Main sources: * World Bank & ClimateWorks Foundation (2014), **SDSN & IDDRI (2014), ***REN21 (2014a), **** South Korea. Ministry of Environment (2012).

104 | Enhanced policy scenarios for major emitting countries
TWO
to cover 60% of total emissions by 2020 and to cap emissions at 30% below the baseline projections (EDF and IETA, 2014). An implementation barrier of 0% to 6% is assumed. As Phase III22 of the ETS runs until 2026 and no information on the design of this phase is available yet, its effect on 2030 emissions is uncertain. The range reflects two possible pathways to 2030; 1) The cap and coverage of the ETS remain at the 2020 level; 2) The ETS will no longer be in place in 2030 and emissions increase at the reference growth rate. Overlap between the emission reductions resulting from the increased use of renewable energy and the ETS is assumed to be 25% to 75%.
PBL’s update for South Korea first extended the projections for current policies to 2030, using PBL’s baseline emission projections and the methodology of Roelfsema et al. (2013). The assumptions for the implementation of the ETS and renewable energy (including the impact of overlap) were similar to the analysis of Ecofys & NewClimate Institute. More specifically, the emission reduction due to the ETS was calculated in three steps: first, the national target level for ETS (30% reduction from national baseline of 776 MtCO2e by 2020) was corrected for a 60% coverage of total emissions; second, the target level was subtracted from the corrected PBL baseline (accounting for the 60% coverage); and third, the emission reduction was further adjusted for an assumed implementation barrier of 0% to 6%. As the ETS has a target level for 2020 but not for 2030, the same emission reduction effort was assumed for the ETS effect by 2030. PBL’s analysis for enhanced policies includes model calculations of enhanced renewable energy targets, assuming the same overlap and implementation factors as in current policies, and uses the Ecofys & NewClimate Institute estimates of the reductions in the transport and buildings sectors.

1052 Country sections |
TWO
TWO
2.12 Turkey
2.12.1 Summary of resultsAlthough Turkey did not submit an international pledge, it has a renewable electricity target and an energy intensity target. If effective policies are implemented to achieve these targets, they could lead to emission levels of 21% to 71% above 2010 levels (excluding LULUCF) by 2020 and 52% to 189% above 2010 levels by 2030. Enhanced policies in the transport, energy and buildings sectors could further reduce emissions to levels of 10% to 64%
above 2010 levels by 2020 and 19% to 151% above 2010 levels by 2030. Co-benefits of these enhanced policies include improved air quality and increased energy security, and will also lead to further alignment with EU policies. The actual emission level resulting from the energy intensity target strongly depends on the future development of GDP and is thus surrounded by large uncertainties (see Figure 2.21).
Figure 2.21
1990 2000 2010 2020 2030
-400
0
400
800
1200Mt CO2 eq per year
Source: PBL FAIR/TIMER model; Ecofys & NewClimate Institute calculations
pbl.n
l
History Current policies
Enhanced policy scenario (bottom-up)
Enhanced policy scenario (top-down)
Pledge
Excluding CO2 emissions from land use
Impact of climate policies on greenhouse gas emissions in Turkey
1990 2000 2010 2020 2030
-400
0
400
800
1200Mt CO2 eq per year
pbl.n
lCO2 emissions from land use
Historical greenhouse gas emissions and LULUCF emissions are based on national inventories submitted to UNFCCC. The LULUCF emission projections as a result of current and enhanced policies (range) are based on IIASA calculations.

106 | Enhanced policy scenarios for major emitting countries
TWO
Table 2.48Greenhouse gas emissions (excluding LULUCF) for Turkey, by 2020 and 2030 for various policy scenarios
Scenario 2020 2030
% relative to 2010 levels
Pledge N.A.
Current policies [21%; 71%] [52%; 189%]
Enhanced bottom-up policy scenario [10%; 64%] [19%; 151%]
Enhanced top-down policy scenario 24% 30%
Table 2.49Overview of policies analysed in our study for Turkey
Policy status Sector Policy/measure Target
Current policies Energy Supply Energy Efficiency Law Reduce primary energy intensity by 20% by 2023, compared to the 2008 level
Energy Supply Law for the Utilisation of the Renewable Energy Resources for the Electricity Energy Production
13% to 30% share of renewable energy resources in electricity production by 2023
Enhanced bottom-up policy scenario
Transport Fuel efficiency in transport Achieve standards as currently discussed in the EU (35.9 km/l by 2025 and 47.5 km/l by 2030 for new cars)
Energy supply Enhanced renewable energy policy 30–45 GW hydropower and 3 GW solar power by 2023
HFCs Phase-down of HFCs 30% reduction in HFC consumption and production by 2025, 60% by 2031
Table 2.50Greenhouse gas emissions (excluding LULUCF) for Turkey, for 2005, 2010, 2020 and 2030 for various policy scenarios
Scenario 2005 2010 2020 2030
MtCO2e
Pledge n/a
Current policies 330 405 [485; 690] [615; 1165]
Enhanced bottom-up policy scenario [440; 660] [480; 1015]
Enhanced top-down policy scenario 500 525

1072 Country sections |
TWO
TWO
2.12.2 Results in detail2.12.2.1 Copenhagen pledgeTurkey is the only Annex I country and the only OECD country that has not submitted a mitigation pledge.
2.12.2.2 Current policiesIf the energy intensity and renewable electricity targets are achieved, the expected emission level of Turkey is 485 to 690 MtCO2e by 2020 and 615 to 1165 MtCO2e by 2030, excluding land-use emissions.
Energy intensity. The energy intensity target is aimed at reducing primary energy intensity by 20% by 2023, compared to the 2008 level. This target is supported by the 2007 Energy Efficiency Law, which provides an institutional framework, allocates responsibilities, and establishes various programmes targeting various sectors. The actual emission reductions will depend on various factors, especially GDP growth. In the PBL baseline, the energy intensity target of 20% is already met (based on an average annual GDP growth of 4.5% for the 2010–2030 period). Ecofys & NewClimate Institute use the baseline energy and GDP projections from Turkey’s First National Communication (Ministry of Environment and Forestry, 2007). GDP growth is assumed to be about 6.5% for the 2015–2030 period here. The First National Communication does not project the effect of the economic crisis, and thus overestimates GDP growth and likely also energy use. Under this baseline scenario, energy intensity would even increase, thus the energy intensity target leads to projected emission reductions of 140 to 160 MtCO2e by 2020 compared to baseline emissions from the First National Communication. The range results from the various shares of renewable energy (see next paragraph).
Renewable energy. In 2005, Turkey passed the Law for the Utilisation of the Renewable Energy Resources for the Electricity Energy Production. The main target of this law is to achieve a 30% share of renewable energy resources in the electricity production by 2023. This target was reconfirmed in the strategic plan for 2010 to 2014 from the Ministry of Energy and Natural Resources. Further, the target is supported by a feed-in tariff for renewable electricity. Our assessment finds that the incentives provided through the tariffs will not be sufficient to achieve the 30% target, but would rather end up at 13% by 2023 (according to PBL TIMER calculations). Depending on whether the target is achieved or the share is increased to 13% only, the policies lead to emission reductions of about 7–85 MtCO2e by 2020 and 8–210 MtCO2e by 2030.
2.12.2.3 The enhanced bottom-up policy scenarioThe implementation of enhancement measures in the sectors transport and energy supply could decrease emissions by 30 to 55 MtCO2e by 2020 and 95 to 230 MtCO2e by 2030 (excluding LULUCF) compared to the current policies scenario.
Fuel efficiency in transport. For the enhanced policy scenario for Turkey, we assume the same enhanced transport policy as for Canada. According to our calculations, the emission reductions are expected to be 15 to19 MtCO2e by 2020 and 50 to 88 MtCO2e by 2030, relative to the current policies scenario.
Renewable energy. The National Climate Change Action Plan (Ministry of Environment and Urbanisation, 2011) estimates a potential for renewable energy of 30 to 45 GW hydropower (International Hydropower Association, 2014, Erdogdu, 2011) and 3 GW solar power
Table 2.51Possible areas of enhanced action in Turkey
Area Transport efficiency Renewable energy
Implications on the energy mix and greenhouse gas emissions
Transport emits almost 20% of energy related greenhouse gas emissions, of which major share of road transport*
Energy industries emit almost 40% of energy-related greenhouse gas emissions*
Mitigation potential and costs – Medium efficiency of light commercial vehicles**
– 30–45 GW hydropower + 3 GW solar power by 2023 possible*
Co-benefits – Alignment with EU legislation*
– Innovation and Competitiveness*
– New employment opportunities*
– Energy security*
– Decrease local environmental pollution*
Importance on national level – Existing: ‘Regulation on the Information of Consumers on the Issue of Fuel Economy of New Vehicles and on CO2 emissions’
– Relatively high dependency on fossil fuel imports*
– Renewable energy planning and other efforts are already relatively advanced*
* Ministry of Environment and Urbanisation (2011); ** IEA (2012a).

108 | Enhanced policy scenarios for major emitting countries
TWO
by 2023 (Clover, 2014). For the enhanced policies scenario, we assume this can be achieved, resulting in emission reductions beyond the current policies scenario of 5 to 35 MtCO2e by 2020 and 65 to 120 MtCO2e by 2030. The reductions are significantly higher according to the calculations by Ecofys & NewClimate Institute, as these assume hardly any growth of hydropower capacity in a scenario without this target. The target for solar power is already covered by the current targets for renewable energy.
HFC production and consumption. For the enhanced policy scenario, as for Brazil, a full implementation of the North American Amendment Proposal is assumed. Implementation of this proposal in Turkey could result in a reduction below the current policies scenario of about 0 MtCO2e by 2020 and 1 to 6 MtCO2e by 2030.
2.12.2.4 The enhanced top-down policy scenarioFull implementation of the top-down mitigation measures would decrease all greenhouse gas emissions in Turkey by about 50 MtCO2e by 2020 and 115 MtCO2e by 2030, compared to the current policies scenario.The impact of the mitigation options on the energy-related CO2 emissions is illustrated in Figure 2.22 and in Table A.2 (Appendix A.6). The largest potential to reduce energy-related CO2 emissions is in the transport sector, followed by the building and industry sectors (Figure 2.22). The mitigation measures in the transport sector are the same as in the enhanced bottom-up scenario (see previous section). The potential in the transport sector is substantial due to the increasing total car ownership. The effects of increased efficiencies in
steel and cement production can mainly be achieved by the implementation of good housekeeping measures. In the buildings sector, reductions are mainly due to the ban on incandescent light bulbs.
2.12.3 Data sources and assumptionsCurrent trendsEcofys & NewClimate Institute’s projections are based on an assessment of the impact of Turkey’s current and enhanced policies on an estimated baseline. This baseline was derived from growth rates obtained from Turkey’s First National Communication on Climate Change (Ministry of Environment and Forestry, 2007) for energy- and industry-related CO2 emissions, and the US EPA (2012) for non-CO2 greenhouse gas emissions, harmonised to match historical data from the UNFCCC database.
For the projections of PBL, we use the IMAGE TIMER energy model (Van Vuuren et al., 2014) for an updated analysis including all policy options as summarised in Table 2.49. The projections were harmonised with historical 1990–2010 emissions from the UNFCCC National Inventory Submissions for Turkey.
The projections for LULUCF are based on GLOBIOM (Havlík et al., 2014) and G4M (Gusti, 2010) model calculations of IIASA. These estimates have been harmonised with the First National Communication for the year 2010. From 2010 and onwards, the trend is fully based on model estimates taking into account socio-economic development.
Figure 2.22
2000 2005 2010 2015 2020 2025 2030 2035
0
100
200
300
400
500
600Energy-related CO2 emissions (Mt CO2 per year)
Source: PBL TIMER model
pbl.n
l
History
Current policies
Enhanced policy scenario(top-down)
Reduction per sector
Electricity
Industry
Transport
Buildings
Contribution of enhanced reduction measures per sector, for Turkey
Impact of policies analysed in the enhanced top-down policy scenario, per sector, on energy-related CO2 emissions in Turkey. Reductions in this figure are relative to the current policies scenario.

1092 Country sections |
TWO
TWO
2.13 United States
2.13.1 Summary of resultsCurrent policies in the United States are likely not yet sufficient to reduce emissions as pledged to the UNFCCC (17% below 2005 levels, by 2020; corresponding to 13% below 2010 levels). The emissions under current policies (excluding the Climate Action Plan, which is considered as planned policies) are estimated to reach about 8% below to 5% above 2010 levels by 2020, and 12% below to 10% above 2010 levels by 2030. The large range is caused by the uncertainty about whether the planned policies will be implemented. Recent US policy assessments show that emissions could stabilise or even increase between 2010 and 2020. Full implementation of all additional planned policies covered by the Climate Action Plan is expected to reduce emissions close to the level needed to achieve the pledge by 2020,
depending on how land-use-related emissions are accounted for. By 2030, these additional policies would achieve an emission level of about 5% to 27% below the 2010 level, including land-use emissions (Figure 2.23 and Table 2.52).The enhanced policies we selected could achieve additional emission reductions in key sectors such as the power sector (including enhancement measures to increase levels of clean electricity generation and tightening energy efficiency standards of power plants) and the industrial sector (improving energy efficiency), and would further reduce emissions to about 17% to 38%, below 2010 levels, by 2030. Such measures would have co-benefits in terms of reducing air pollution and reducing the dependence on fossil fuels.
Figure 2.23
1990 2000 2010 2020 2030
-2000
0
2000
4000
6000
8000Mt CO2 eq per year
Source: PBL FAIR/TIMER model; Ecofys & NewClimate Institute calculations
pbl.n
l
History Current policies
Planned policies
Enhanced policy scenario (bottom-up)
Enhanced policy scenario (top-down)
Pledge
Including CO2 emissions from land use
Impact of climate policies on greenhouse gas emissions in the United States
1990 2000 2010 2020 2030
-2000
0
2000
4000
6000
8000Mt CO2 eq per year
pbl.n
l
Excluding CO2 emissions from land use
1990 2000 2010 2020 2030
-2000
0
2000
4000
6000
8000Mt CO2 eq per year
pbl.n
l
CO2 emissions from land use
Historical greenhouse gas emissions (excluding LULUCF) are based on national inventories submitted to UNFCCC, and LULUCF emissions from the Sixth National Communication (United States, 2014). The LULUCF emission projections (range) are based on the Sixth National Communication. See also Figure 2.24 for details of the enhanced top-down policy scenario.

110 | Enhanced policy scenarios for major emitting countries
TWO
Table 2.52Greenhouse gas emissions (including LULUCF) for the United States relative to 2010 levels (upper) and relative to 2005 levels (lower), by 2020 and 2030 for various policy scenarios
Scenario 2020 2030
% relative to 2010 levels
Pledge -13%
Current policies [-8%; 5%] [-12%; 10%]
Planned policies [-21%; -1%] [-27%; -5%]
Enhanced bottom-up policy scenario [-26%; -6%] [-38%; -17%]
Enhanced top-down policy scenario* -9% -27%
% relative to 2005 levels
Pledge -17%
Current policies [-13%; -1%] [-16%; 4%]
Planned policies [-25%; -6%] [-31%; -10%]
Enhanced bottom-up policy scenario [-30%; -11%] [-41%; -21%]
Enhanced top-down policy scenario* -14% -31%
* Only for the PBL model result, therefore no range presented here.
Table 2.53Overview of policies analysed in our study for the United States
Policy status Sector Policy/measure Target
Current policies Economy/state wide ETS California 1990 levels by 2020
Transport Efficiency standards light commercial vehicles
34.1 mpg (14.9 km/l) by 2016, 55 mpg (23.2 km/l) by 2025
Efficiency standards heavy-duty trucks Differs per type of truck
Renewable fuel standard Volume of renewable fuel required to be blended into transportation fuel from 9 billion gallons in 2008 to 36 billion gallons by 2022
Energy Supply State renewable portfolio standards Aggregate 16% REN share in electricity generation by 2020
Planned policies Energy Supply Standard for existing power plants 30% emission reduction compared to 2005 levels in electricity sector
Standard for new power plants 1000 lbCO2/GWh (450 gCO2/kWh) by 2018
REN target Climate Plan Double REN electricity production by 2020, compared to 2010–2012 levels
Methane Reduction in CH4 emissions from oil and gas production
40% to 45%, from 2012 levels, by 2025
Enhanced bottom-up policy scenario
Energy Supply Power plant standard 40%–60% emission reduction compared to 2005 levels by 2030
Industry Efficiency improvement in fossil fuel use of industry
28% reduction compared to 2005 levels by 2030
Transport Fuel efficiency in transport Achieve standards as currently discussed in the EU (47.5 km/l for new cars by 2030)
HFCs Phase-down of HFCs 35% reduction in HFC consumption and production by 2023, 70% by 2029, and 85% by 2035

1112 Country sections |
TWO
TWO
2.13.2 Results in detail2.13.2.1 Copenhagen pledgeIn the Copenhagen Accord, the United States announced reductions of 17% relative to 2005 levels, applying to all gases and sectors. In absolute terms, this will mean a level of 5,145 MtCO2e by 2020 (including LULUCF) or 5,875 (excluding LULUCF), assuming that LULUCF emissions by 2020 are about -730 MtCO2e (average estimate of the range presented in the Sixth National Communication (United States, 2014)). The United States also stated a long-term target of reducing emissions by 83% by 2050 (US Department of State, 2010). The 2020 target is confirmed in the first biennial report of the United States (United States, 2014).
2.13.2.2 Current policiesBased on Ecofys & NewClimate Institute and PBL calculations, the consolidated range in emissions of the United States resulting from the implementation of current policies will be 6,315–6,825 MtCO2e by 2020 and 6,150–7,065 MtCO2e by 2030 (both excluding LULUCF; see Table 2.54). This would not be sufficient to achieve the pledge, unless LULUCF accounting would add significant reductions. The Sixth National Communication reports LULUCF emission projections of between -585 and -870 MtCO2e by 2020, and -530 and -900 MtCO2e by 2030. The most relevant policies included in the current trends for the United States are listed in Table 2.53.
Main policies. Emissions have been constantly increasing between 1990 and 2007. The financial crisis from 2008 led to a drop in emissions. In 2010, emissions started to increase again, but in 2011 there was a downward move resulting mainly from a strong shift to natural gas. In the United States, a variety of efforts that will reduce greenhouse gas emissions are taking place both on state and federal level and in all sectors. Especially the second phase of the light commercial vehicle standards starting in 2017 will have a significant impact in terms of affecting the structure of the transport sector and is likely to
reduce emissions in the long term. According to the United States’ first Biennial Report, further areas of recent changes on the federal level include the development of renewable energy, strengthening appliance efficiency standards, and regulating emissions from the oil and natural gas industry. Furthermore, policies on state level keep playing an important role in the U.S. climate policy framework.
State Renewable targets. These targets in most cases set a certain share of renewable electricity generation. The targets in terms of electricity generation vary significantly among the large states, the most ambitious ones being Maine (40% by 2017), California (33% by 2020), and New York (29% by 2015). Overall, the targets will result in a modest increase in the share of renewable energy, from 13% today to roughly 16% by 2020 and 16.5% by 2030. Nation-wide, the PBL baseline already shows a renewable share in electricity generation of 17%, so the state renewable targets do not lead to an increased ambition with respect to the PBL baseline.
Transport policies– Federal legislation for renewable energy (Renewable
Fuel Standard). The American Recovery and Reinvestment Act grants tax incentives to producers of renewable energy. Under the Energy Independence and Security Act of 2007, the volume of renewable fuel that is required to be blended into transportation fuel increases from 9 billion gallons in 2008 to 36 billion gallons by 2022. In the PBL analysis this is translated to a 10% share of biofuels in the transport sector for cars and trucks, resulting in a reduction of almost 100 MtCO2, compared to PBL Baseline (no climate policy) by 2030.
– Fuel efficiency standards (CAFE standards). The standards limit the average emission intensity of light commercial and heavy-duty vehicles sold by car manufacturers in the United States. While the standards are less ambitious than for example those
Table 2.54Greenhouse gas emissions (including LULUCF) for the United States, for 2005, 2010, 2020 and 2030 for various policy scenarios
Scenario 2005 2010 2020 2030
MtCO2e
Pledge 5,145
Current policies 6,225 5,905 [5,445; 6,170] [5,250; 6,465]
Planned policies [4,715; 5,905] [4,315; 5,655]
Enhanced bottom-up policy scenario [4,400; 5,565] [3,710; 4,920]
Enhanced top-down policy scenario 5,385 4,315

112 | Enhanced policy scenarios for major emitting countries
TWO
in the EU, they reflect a significant improvement in comparison with current levels (see Appendix A.2) and may lead to emission reductions especially in the medium to long term.
CO2 emissions from cars and trucks will decrease from around 1,600 MtCO2 in 2010 to between 1,200 MtCO2 by 2030, according to the AEO 2014, and to 1,350 MtCO2 in the PBL analysis. These projections both account for implementation of vehicle efficiency standards (for details on these standards, see Canada). According to PBL, the reductions resulting from these policies will be around 190 MtCO2e by 2030, compared to the PBL baseline scenario (no policy case), but in AEO 2014 these have already been included in the AEO baseline projections. The biofuel target of 36 billion gallons ethanol equivalent by 2022 is not achieved under the AEO2014 scenario, largely because of a decline in petrol consumption as a result of newly implemented CAFE standards (EIA, 2014a). The 10% share of biofuels is fully achieved under the PBL scenario, partly explaining the difference between the emission projections of AEO and PBL. The projected emission levels after implementation of the CAFE standards are similar between PBL and AEO calculations.
Other policies are included in the current policies scenario (but not specifically analysed) as many are already included in the underlying scenarios. Examples are the ETS in California, appliance and lighting efficiency standards, and the Energy Star building standards. Those policies have existed for years and are expected to affect emissions; however, their individual impact is difficult to assess.
2.13.2.3 Planned policiesWith implementation of the planned and proposed measures, emissions would reach between 5,585 and 6,655 MtCO2e (excluding LULUCF) by 2020 (about 8%–23% below 2005 levels) and between 5,215 and 6,435 MtCO2e by 2030 (about 11%–28% below 2005 levels), according to the Ecofys & NewClimate Institute and PBL calculations.
Main policies. The additional measures as suggested by the Obama Government in ‘The President’s Climate Action Plan’ (CAP) in June 2013 (Executive Office of the President U.S., 2013) are not all quantified here. However, the United States’ Draft Sixth National Communication shows that these measures could lead to achieving the pledge even without additional reduction from the LULUCF sector. Key efforts under the Climate Action Plan include the target to double renewable energy generation by 2020 relative to 2010. Although some of the efforts are already in the pipeline and are building upon past efforts, the document indicates that the details of most measures
are yet to be developed and speaks of the ‘potential scale of additional reductions’. Our analysis focuses on those measures, which have already led to concrete steps (e.g. proposed legislation):
Electricity generation– Clean Power Plan (CPP). The CPP assigns targets for
emissions per kWh to all states, which can be met through renewable energy deployment, other low-carbon technologies, or efficiency improvements on demand and supply side. Overall, EPA foresees reductions of 30% below the electricity sector’s 2005 emissions by 2030. The resulting emission reductions will be around 220 MtCO2e by 2020 and 495 MtCO2e by 2030, according to the PBL analysis. For comparison, Rhodium Group (Larsen et al., 2014) estimates that EPA’s current proposal for the CPP could result in 310–463 MtCO2e of economy-wide emission reductions by 2020, compared to a reference emissions level (including all current policies) of 5,880 MtCO2e. Rhodium Group (Larsen et al., 2014) adds that the pledge cannot be reached without the CPP, which accounts for nearly 60% of estimated total emission reduction between the U.S. 2020 target and a scenario without policy action.
– New Source Performance Standard (NSPS). The NSPS limits CO2 emissions per kWh of new power plants from 2015 on to 450 g/kWh. As current AEO 2014 projections already foresee a limited increase in coal fired capacity, we expect little additional reducing effect from this policy. It remains unclear what the overlap is between the New Source Performance Standard and the Clean Power Plan after it is accepted. In the PBL analysis it is assumed that there is full overlap between both policies. The calculations by Ecofys & NewClimate Institute consider the two extremes – no overlap and complete overlap – and thus result in a range. Given the small expected additional impact of the NSPS, the range is small.
– Renewable target. The President’s Climate Action Plan states a goal of doubling renewable electricity generation by 2020. This target is already met in the PBL baseline and is also expected to have a very large overlap with the reductions from the Clean Power Plan.
Based on Ecofys and PBL calculations, U.S. emissions in the electricity sector after implemented Clean Power Plan and NSPS are expected to be around 32% below 2005 levels by 2030. For comparison, the latest IEA scenario aiming at meeting a two degree target shows a 70% reduction compared to 2010 levels (IEA, 2013c).
Reduction in methane emissions. In January 2015, the US administration announced the target to reduce methane

1132 Country sections |
TWO
TWO
emissions from oil and gas production by 40% to 45% by 2025, compared to 2012 levels.23 The announcement also suggests a number of measures to meet this target. Those include new standards for methane emissions, enhance leakage detection and reporting, provide budget for research and development, modernise gas infrastructure and introduction of voluntary programmes for the industrial sector. If the target is achieved, emissions would be reduced by 15–80 MtCO2e by 2020, 85–155 MtCO2e by 2025 and 90–170 MtCO2e by 2030 in comparison to the scenario with current policies.
2.13.2.4 The enhanced bottom-up policy scenarioAdditional to the current and planned policies, larger emission reductions are possible. Two promising areas for enhancement measures in the United States are the industry and electricity sectors. In the first, energy intensity and methane reduction could be achieved and in the second, emission reductions from electricity generation additional to the Clean Power Plan are feasible. Table 2.55 summarises the relevance and opportunities in implementing mitigation efforts in these areas (as shown in Table 2.53).
Full implementation of these additional policy measures in these areas would further decrease emissions towards a level of 4,400 to 5,565 MtCO2e by 2020 and to 4,510 to 5,530 MtCO2e by 2030 (excluding LULUCF). This reflects reductions of 13% to 28% below 2005 by 2020 and 24% to 38% by 2030. The measures decrease emissions
significantly below the emission levels of the scenario with current or planned policies, and are also sufficient to achieve the 2020 pledge. These findings compare well with a recent analysis by Rhodium Group (Larsen et al., 2014), which estimates that, by 2020, emission reductions from the CPP and other policy measures in the energy sector (including methane and HFC abatement) will be between 435 MtCO2e and 793 MtCO2e, compared to a reference emission level of 5,880 MtCO2e, or between 12.4% and 18.1%, compared to 2005 levels.
Reducing emissions of electricity generation. Our analysis shows that emission reductions in the power sector can contribute significantly to total emission reductions for the United States. By replacing all fossil fuelled power plants by the most efficient natural gas combined cycle (NGCC) plants, emissions would decrease to 40% below 2005 levels. Using decarbonisation rates similar to those of the United Kingdom after implementation of ambitious renewable energy policies would lead to emissions of about 43% by 2030, below 2005 levels. Other studies support these findings of higher reductions, which go beyond the target of the Clean Power Plan. For example, Bianco et al. (2013), in a WRI report on US policies, project emissions will be 74% below the 2010 level, by 2035. The Greenpeace Energy [R]evolution report achieves a 60% reduction below 2005 (Teske et al., 2014). Both studies also include measures on demand and supply side. The Union of Concerned Scientists calculates possible emission reductions of roughly 50%, including
Table 2.55Possible areas of enhanced action in the United States*
Area Reducing emissions of electricity generation Energy efficiency in industry
Implications on the energy mix and greenhouse gas emissions
– Largest emitting sector– 12% share of renewable energy in 2011***
– Industry as major energy consumer– High dependency of the sector on oil and gas
Mitigation potential and costs
– High carbon intensity compared to other developed countries
– Potential available both on supply and demand side
– Short to medium pay-back periods– In global comparison, U.S. industry is still
inefficient
Co-benefits – Improvements in air quality – Correlation between energy efficiency and productivity
– Increased safety and comfort for employees– Increased crop yields through reduced crop
damage from ozone emissions**
Importance on national level
– Enhancement measures can streamline existing programmes on state and national level and create momentum
– Current shale gas boom
– Several voluntary programmes for energy efficiency in industry exist
– Efficiency improvements in industry are more cost-effective than in other sectors
– Spill-over effects to other sectors through mainstreaming energy efficiency
* Main sources: EIA (2013b, EIA, 2014a), Energy Information Administration (2012), IEA (2013a), U.S. Environmental Protection Agency (2014a), Bianco et al. (2013), NREL (2012), Sreedharan (2012), Machol (2013); ** World Bank and ClimateWorks Foundation (2014); *** IRENA (2012).

114 | Enhanced policy scenarios for major emitting countries
TWO
reductions in the electricity demand (Union of Concerned Scientists, 2013).
Efficiency increase in fossil fuel use of industry. Bianco et al. (2013) show that emission intensity in industry can decrease approximately twice as fast as under the current baseline development. In their most ambitious scenario, absolute emissions of industry from fossil fuel consumption decrease by 28% by 2030 below 2005.
Fuel efficiency in transport. The United States already introduced fuel efficiency standards for new passenger and heavy-duty vehicles as described under the current policies section. However, the EU currently has stricter targets for new passenger vehicles until 2025. Therefore, we assume a linear development from today’s level towards a fuel economy standard of 47.5 km/l by 2030 (see Appendix B.4). This could lead to a decrease in emissions of 305 MtCO2e by 2030, relative to the current policies scenario.
HFC production and consumption. The United States, Canada, and Mexico have submitted the North American Amendment Proposal (Appendix A.5) to significantly decrease HFC consumption. The President’s Climate Action Plan states that HFCs will be reduced through leadership in international diplomacy and domestic measures. The proposal suggests stepwise reductions below current levels. For the United States, the proposal would mean that HFC consumption will be reduced by 10% by 2018, 70% by 2029 and 85% by 2035, below the baseline (EPA, 2013b). The baseline for a non-Article 5
country is calculated as 100% of average HFC consumption and production and 40% of average HCFC consumption and production in 2011 and 2012. Implementation of this amendment in the United States could result in a reduction below the current policies scenario of 0 to 80 MtCO2e by 2020 and 242 to 305 MtCO2e by 2030.
2.13.2.5 The enhanced top-down policy scenarioIt is expected that full implementation of the top-down mitigation measures (see Table 1.1) could decrease all greenhouse gas emissions in the United States by about 560 MtCO2e by 2020 and 1,300 MtCO2e by 2030, compared to the current policies scenario.The impact of the mitigation options on the energy-related CO2 emissions is illustrated in Figure 2.24 and in Table A.2 (Appendix A.6). The largest potential to reduce energy-related CO2 emissions is in the power and transport sectors (Figure 2.24). The impact of the enhanced passenger vehicle efficiency standards in the transport sector was described before. The standards on new coal-fired power plants in the electricity sector lead to the highest reductions, because the United States has a historical high dependence on coal-based electricity, as in our baseline projections. The potential in the transport sector is large as the fuel efficiency of light commercial vehicles already on the road are relatively low, and due to the large car ownership per 1,000 inhabitants in this country (World Bank, 2015). In the buildings sector, insulation measures are particularly effective in the United States and result in more than 90% of the reductions in this sector.
Figure 2.24
2000 2005 2010 2015 2020 2025 2030 2035
0
2000
4000
6000
8000Energy-related CO2 emissions (Mt CO2 per year)
Source: PBL TIMER model
pbl.n
l
History
Current policies
Enhanced policy scenario(top-down)
Reduction per sector
Electricity
Industry
Transport
Buildings
Contribution of enhanced reduction measures per sector, for the United States
Impact of policies analysed in the enhanced top-down policy scenario, per sector, on energy-related CO2 emissions in the United States. Reductions in this figure are relative to the current policies scenario.

1152 Country sections |
TWO
TWO
2.13.3 Data sources and assumptionsPledgeTargets for 2020 were calculated from the most recent UNFCCC national inventory submissions. The United States have announced that they prefer a comprehensive, land-based approach that takes advantage of the broadest scope of mitigation measures. For the post-2012 period (2013–2020), LULUCF accounting was calculated using a land-based approach, which assumes net-net accounting relative to 1990, using data from the Sixth National Communication (United States, 2014).
Current trendsFor the projections of Ecofys & NewClimate Institute, we sum up energy-related emission projections from EIA’s Annual Energy Outlook 2013 (EIA, 2014a), non-CO2
emissions from the EPA’s Global Non-CO2 greenhouse gas Emissions: 1990–2030 (US EPA, 2012), and non-energy-related CO2 emissions from EDGAR 4.2 (JRC and PBL, 2012). For the projections of PBL, we use the IMAGE TIMER energy model (Van Vuuren et al., 2014) for an updated analysis including all policy options.The projections were harmonised with historical 1990–2010 emissions from the UNFCCC National Inventory Submissions for the United States.
Notes
1 Australia’s 6th National Communication states that LULUCF
emissions according to Kyoto accounting rules would be
27 MtCO2 by 2020.
2 http://www.environment.gov.au/climate-change/
emissions-reduction-fund/about
3 The coal mine waste gas method provides an incentive to
implement new methane destruction activities or expand
on existing activities.
4 RepuTex (2014) estimates reductions of 67 MtCO2e/a by
2020. Effects of the fund have earlier been estimated by
Hare et al. (2013) to be only between 27 MtCO2e (RepuTex
Carbon Analytics, 2013) and 41 MtCO2e (Gerardi, 2013) by
2020, leading to emissions levels of about 12% above 2005
levels.
5 It should be noted that the total reduction shows quite
some differences between the estimates of PBL and Ecofys
& NewClimate Institute due to the differences in price
assumptions.
6 http://www.epe.gov.br/PDEE/20120302_2.pdf, p. 31.
7 http://ozone.unep.org/new_site/en/parties_under_
article5_para1.php
8 http://www.whitehouse.gov/the-press-office/2015/01/14/
fact-sheet-administration-takes-steps-forward-climate-
action-plan-anno-1
9 http://www.sdpc.gov.cn/gzdt/201411/
W020141104591413713551.pdf.
10 http://www.gov.cn/zhengce/content/2014-11/19/
content_9222.htm.
11 http://iepd.iipnetwork.org/policy/
top-10000-energy-consuming-enterprises-program.
12 http://www.engineeringtoolbox.com/coal-heating-
values-d_1675.html.
13 The numbers are based on an impact analysis of the
European EcoDesign Directive (Molenbroek et al., 2013).
14 The carbon tax will amount to 8 USD per tCO2 in 2020,
increasing to 13 USD per tCO2 by 2030. These carbon prices
should be seen relatively high estimates to provide an upper
boundary for the potential benefits of the considered policy.
15 http://www.meti.go.jp/english/press/2011/1020_02.html.
16 http://gaceta.diputados.gob.mx/Gaceta/61/2012/
abr/20120412-IV.html.
17 The baseline for Article 5 countries is calculated as the sum
of the 100% of the average HFC consumption and
production and 40% of the average HCFC consumption and
production, over the 2011–2012 period.
18 In this case defined as ‘energy intensity’, see http://
wupperinst.org/uploads/tx_wupperinst/energy_efficiency_
definition.pdf for other definitions.
19 http://www.greengrowth.go.kr/
20 Measurement Reporting and Verification.
21 It should be noted that the total reduction shows quite
some differences between the PBL and Ecofys estimates.
For PBL 2020: 12–22 vs. Ecofys 0–4 MtCO2e. For 2030: PBL
111–134 vs. Ecofys 104–162 MtCO2e.
22 Phase III spans the 2021–2026 period. In Phase III, up to 90%
of allowances will be freely allocated, implying at least 10%
of allowances will be auctioned (EDF and IETA, 2014).
23 http://www.whitehouse.gov/the-press-office/2015/01/14/
fact-sheet-administration-takes-steps-forward-climate-
action-plan-anno-1.
116 | Enhanced policy scenarios for major emitting countries
References
Alston LJ and Libecap GD. (1999). Titles, Conflict, and Land Use: The Development of Property Rights and Land Reform on the Brazilian Amazon Frontier. Ann Arbor, MI: University of Michigan Press.
Australian Government (2013). Australia’s Sixth National Communication on Climate Change – A report under the United Nations Framework Convention on Climate Change. Canberra: Department of Industry, Innovation, Climate Change, Science, Research and Tertiary Education.
Australian Government (2014a). The Renewable Energy Target (RET) Scheme [Online]. Canberra: Australian Government, Department of the Environment. Available: http://www.environment.gov.au/climate-change/renewable-energy-target-scheme [Accessed 7 November 2014].
Australian Government (2014b). Carbon Farming Initiative [Online]. Canberra: Australian Government, Department of the Environment. Available: http://www.climatechange.gov.au/reducing-carbon/carbon-farming-initiative [Accessed 7 November 2014].
Barr C and Cossalter C. (2004). China’s development of a plantation-based wood pulp industry: government policies, financial incentives, and investment trends. International Forestry Review, 6, 267–281.
Bianco N, Litz F, Meek K and Gasper R. (2013). Can the U.S. Get There from Here? Using Existing Federal Laws and State Action to Reduce Greenhouse Gas Emissions. Washington. See www.wri.org.: World Resources Institute.
Bossmann T, Eichhammer W and Elsland R. (2012). Contribution of energy efficiency measures to climate protection within the European Union until 2050. In: FRAUNHOFER ISI (ed.) Concrete Paths of the European Union to the 2 °C Scenario: Achieving the Climate Protection Targets of the EU by 2050 through Structural Change, Energy Savings and Energy Efficiency Technologies. Karlsruhe: Fraunhofer Institute for Systems and Innovation Research ISI.
Bowman MS, Soares-Filho BS, Merry FD, Nepstad DC, Rodrigues H and Almeida OT. (2011). Persistence of cattle ranching in the Brazilian Amazon: A spatial analysis of the rationale for beef production. Land Use Policy 29, 558–568.
BP (2014). BP Energy Outlook 2035. http://www.bp.com/en/global/corporate/about-bp/energy-economics/energy-outlook/outlook-to-2035.html: BP.
Braun N, Healy S, Höhne N, Schumacher K, Hagemann M, Duscha V and Day T. (2014). Instruments to increase climate policy ambition before 2020 – economic and political implications in selected industry and emerging countries. Freiburg: Ecofys & Öko-Institut e.V.
Brazilian Ministry of Mines and Energy (2007). Plano nacional de energia 2030. Brasília: Ministério das Minas e Energia.
Brown S and Zarin D. (2013). What Does Zero Deforestation Mean? Science, 342, 805–807.
Busch J, Lubowski R, Godoy F, Steininger M, Yusuf AA, Austin K, Hewson J, Juhn D, Farid M and Boltz F. (2012). Structuring economic incentives to reduce emissions from deforestation within Indonesia. PNAS, 109 1062–1067.
Capros P, Vita AD, Tasios N, Papadopoulos D, Siskos P, Apostolaki E, Zampara M, Paroussos L, Fradiadakis K, Kouvaritakis N, Höglund-Isaksson L, Winiwarter W, Purohit P, Böttcher H, Frank S, Havlík P, Gusti M and Witzke HP. (2013). EU Energy, Transport and GHG Emissions – Trends to 2050 – Reference Scenario 2013. Luxembourg: Publications Office of the European Union / European Commission: Directorate-General for Energy, Directorate-General for Climate Action and Directorate-General for Mobility and Transport.
Carlson KM, Curran LM, Ratnasari D, Pittman AM, Soares-Filho BS, Asner GP, Trigg SN, Gaveau DA, Lawrence D and Rodrigues HO. (2012). Committed carbon emissions, deforestation, and community land conversion from oil palm plantation expansion in West Kalimantan, Indonesia. Proceedings of the National Academy of Sciences of the United States of America, 109, 7559–7564.
Caton R and Constable S. (2000). Clearing The Air: A Preliminary Analysis of Air Quality Co-Benefits from Reduced Greenhouse Gas Emissions in Canada. Vancouver: David Suzuki Foundation. http://cleanairinitiative.org/portal/sites/default/files/69562_paper.pdf.
Change GIFC. (2010). Achievement of international near term targets for CO2 emissions mitigation [Online]. Available: http://www.metoffice.gov.uk/media/pdf/n/1/AVOID_WS2_D1_16_China_and_India_V2.pdf.
Chen K and Reklev S. (2014). China’s national carbon market to start in 2016 -official [Online]. Beijing: Reuters. Available: http://uk.reuters.com/article/2014/08/31/

117References |
china-carbontrading-idUKL3N0R107420140831 [Accessed 27 January 2015].
China National Energy Administration & China National Renewable Energy Centre (2012). China 12th Five-Year Plan for Renewable Energy Development (2011–2015). Beijing: China National Renewable Energy Centre.
Clean Energy Regulator (2014). Key differences between the Carbon Farming Initiative and the Emissions Reduction Fund [Online]. Canberra: Australian Government, Clean Energy Regulator. Available: http://www.cleanenergyregulator.gov.au/Emissions-Reduction-Fund/The-Emissions-Reduction-Fund-and-other-schemes/Key-differences-between-the-CFI-and-the-ERF/Pages/Default.aspx [Accessed 7 November 2014].
Climate Action Tracker (2014a). Australia [Online]. Climate Action Tracker. Available: http://climateactiontracker.org/countries/australia.html [Accessed 4 February 2015].
Climate Action Tracker (2014b). Japan [Online]. Climate Action Tracker. Available: http://climateactiontracker.org/countries/japan.html [Accessed 4 February 2015].
Climate Change Authority (2012). Renewable Energy Target Review. Melbourne: Climate Change Authority.
Climate Change Authority (2014). Reducing Australia’s Greenhouse Gas Emissions—Targets and Progress Review final Report. Melbourne: Climate Change Authority.
Clover I. (2014). Turkey eyeing one-third renewable energy target for 2023 [Online]. PV Magazine. Available: http://www.pv-magazine.com/news/details/beitrag/turkey-eyeing-one-third-renewable-energy-target-for-2023_100013820/#axzz3M36dDzuJ [Accessed 16 December 2014].
Cohn AS, Mosnier A, Havlík P, Valin H, Herrero M, Schmid E, O’Hare M and Obersteiner M. (2014). Cattle ranching intensification in Brazil can reduce global greenhouse gas emissions by sparing land from deforestation. Proceedings of the National Academy of Sciences, 111, 7236–7241.
Comisíon Nacional Forestal (2010). Visión de Méxio Sobre REDD+: Hacia Una Estrategia Nacional. Zapopan, Jalisco, México: Comisión Nacional Forestal.
Das KN and Gopinath S. (2015). India’s Modi raises solar investment target to $100 bln by 2022 [Online]. Reuters. Available: http://www.reuters.com/article/2015/01/02/india-solar-idUSL3N0UG13H20150102?feedType=RSS&feedName=rbssEnergyNews [Accessed 5 January 2015].
De Gouvello C. (2010). Brazil Low-carbon Country Case Study. Washington DC: The World Bank Group.
Deetman S, Hof AF and Van Vuuren DP. (2012). Deep greenhouse gas emission reductions: a global bottom-up model approach RESPONSES project, http://www.responsesproject.eu/pdf/3.2%20RESPONSES%20project%20report.pdf. Bilthoven: PBL Netherlands Environmental Assessment Agency.
Den Elzen M, Hof A, Van den Berg M and Roelfsema M. (2014a). Climate policy. In: Stehfest E, Van Vuuren D, Kram T and Bouwman L. (eds.) Integrated Assessment of Global Environmental Change with IMAGE 3.0 – Model description and policy applications. The Hague: PBL Netherlands Environmental Assessment Agency.
Den Elzen MGJ, Fransen T, Asuka J, Damassa T, Fekete H, Fennham J, Hof A, Jiang K, Levin K, Mathur R, Roelfsema M and Schaeffer R. (2014b). The emissions gap, In: UNEP The UNEP Emissions Gap Report 2014. Nairobi, Kenia: United Nations Environment Programme.
Den Elzen MGJ, Hof AF and Roelfsema M. (2013). Analysing the greenhouse gas emission reductions of the mitigation action plans by non-Annex I countries by 2020. Energy Policy, 56, 633–643.
Deng L, Liu GB and Shangguan ZP. (2014). Land-use conversion and changing soil carbon stocks in China’s ‘Grain-for-Green’ Program: a synthesis. Global Change Biology, 20, 3544–3556.
Dhiyoung L. (2002). A policy review on watershed protection and poverty alleviation by the Grain for Green Programme in China [Online]. FAO. Available: http://www.fao.org/docrep/008/ae537e/ae537e0j.htm [Accessed 14 October 2014].
DNPI (2010). Indonesia’s greenhouse gas abatement cost curve. Jakarta: Dewan Nasional Perubahan Iklim.
Ecofys and Wuppertal Institute (2014). Linking Mechanisms: Carbon Markets, Climate Finance and National Policies. Ecofys & Wuppertal Institute.
EDF and IETA (2014). South Korea – The World’s Carbon Markets: A Case Study Guide to Emissions Trading. Washington, DC: Environmental Defense Fund & International Emissions Trading Association.
EIA (2013a). International Energy Outlook 2013. Washington, D.C.: U.S. Energy Information Administration.
EIA. (2013b). International Energy Outlook 2013 [Online]. Available: http://www.eia.gov/forecasts/ieo/.
EIA (2013c). Today in Energy: Japan is the second largest importer of fossil fuels in the world [Online]. Available: http://www.eia.gov/todayinenergy/detail.cfm?id=13711 [Accessed 08/09/2014.
EIA (2014a). Annual Energy Outlook 2014 – with projections to 2040. Washington, DC: U.S. Energy Information Administration.
EIA (2014b). Japan Analysis Brief [Online]. Available: http://www.eia.gov/countries/analysisbriefs/Japan/japan.pdf [Accessed 08/09/2014.
EIA (2014c). Japan: Analysis [Online]. Available: http://www.eia.gov/countries/cab.cfm?fips=JA [Accessed 8 September 2014].
EIA (2012). How old are U.S. power plants [Online]. Available: http://www.eia.gov/tools/faqs/faq.cfm?id=110&t=3 [Accessed 3 July 2014].

118 | Enhanced policy scenarios for major emitting countries
Environment Canada (2012). Canada’s Emissions Trends. Gatineau: Environment Canada.
Environment Canada (2014). Passenger Automobile and Light Truck Greenhouse Gas Emission Regulations. Ottawa: Minister of Justice, Government of Canada.
EPA (2013a). Global Mitigation of Non-CO2 Greenhouse Gases: 2010–2030. United States Environmental Protection Agency (EPA), Washington DC, report EPA-430-R-13-011, http://www.epa.gov/climatechange/Downloads/EPAactivities/MAC_Report_2013.pdf.
EPA (2013b). Summary: North American 2013 HFC Submission to the Montreal Protocol [Online]. U.S. Environmental Protection Agency. Available: http://www.epa.gov/ozone/intpol/mpagreement.html [Accessed 13 October 2014].
Erdogdu E. (2011). An Analysis of Turkish Hydropower Policy. Ankara/Cambridge: Energy Market Regulatory Authority/University of Cambridge.
ERNST & YOUNG 2013. Mapping India’s Renewable Energy growth potential: Status and outlook 2013. India: Ernst & Young LLP.
European Commission (2013). The EU Emission Trading System (EU ETS) [Online]. European Union. Available: http://ec.europa.eu/clima/publications/docs/factsheet_ets_en.pdf [Accessed 27 January 2015].
European Commission (2014). Impact Assessment accompanying the document – Communication from the Commission to the European Parliament, the Council, the European Economic and Social Committee and the Committee of the Regions – A policy framework for climate and energy in the period. Brussels, Belgium: European Commission.
European Council (2014). European Council (23 and 24 October 2014) Conclusions on 2030 Climate and Energy Policy Framework. Report No. EUCO SN 79/14. Brussels: European Council. Available at http://www.consilium.europa.eu/uedocs/cms_data/docs/pressdata/en/ec/145356.pdf.
European Environment Agency (2014). Trends and projections in Europe 2014 – Tracking progress towards Europe’s climate and energy targets for 2020. Copenhagen / Luxembourg: European Environment Agency / Publications Office of the European Union.
Evans M, Chon H, Shui B and Lee S-E. (2009). Country Report on Buiding Energy Codes in Republic of Korea. Oak Ridge: Pacific Northwest National Laboratory.
Executive Office of the President (2013). The President’s Climate Action Plan. United States Government, Executive Office of the President.
Façanha C, Blumberg K and Miller J. (2012). Global Transportation Energy and Climate Roadmap. Washington DC: International Council on Clean Transportation (ICCT).
FAO (2005). Global Forest Resources Assessment 2005 – Progress towards sustainable forest management.
Rome: Food and Agriculture Organization of the United Nations.
FAO (2010a). Global Forest Resources Assessment 2010 – FAO Forestry Paper 163. Rome: Food and Agriculture Organization of the United Nations.
FAO (2011). Natural Forest Formations: China [Online]. FAO. Available: http://www.fao.org/forestry/country/18314/en/chn/ [Accessed 14 October 2014].
Federative Republic of Brazil (2010). Brazil’s pledge to the Copenhagen Accord. In: UNFCCC (ed.) Compilation of information on nationally appropriate mitigation actions to be implemented by Parties not included in Annex I to the Convention. 2011 ed. Bonn: UNFCCC.
Fekete H, Vieweg M and Mersmann F. (2013a). Climate change mitigation in emerging economies: From potentials to action [Online]. Dessau, Germany. Available: http://www.umweltbundesamt.de/sites/default/files/medien/378/publikationen/cc_19_2013_vorabexemplar_fkz_3711_41_120_abschlussbericht_october_2013_neu.pdf [Accessed 6 December 2013].
Fekete H, Vieweg M, Rocha M, Braun N, Lindberg M, Gütschow J, Jefferey L, Höhne N, Hare B, Schaeffer M, Macey K and Larkin J. (2013b). Analysis of Current Greenhouse Gas Emission Trends. Climate Action Tracker. Climate Analytics, Ecofys and the Potsdam Institute for Climate Impact Research (PIK).
Forum IT. (2010). Reducing transport greenhouse gas emissions: Trends and Data [Online]. Available: http://www.internationaltransportforum.org/Pub/pdf/10GHGTrends.pdf.
Geoscience Australia and Bree (2014). Australian Energy Resource Assessment. 2nd Ed. Canberra: Geoscience Australia.
Gerardi W. (2013). A Review of Subsidy and Carbon Price Approaches to Greenhouse Gas Emission Reduction. Melbourne: Sinclair Knight Merz / The Climate Institute.
Global Wind Energy Council and Greenpeace (2014). Global Wind Energy Outlook 2014. Brussels / Amsterdam: Global Wind Energy Council / Greenpeace International.
Globe International (2013). Climate Legislation Study: A Review of Climate Change Legislation in 33 Countries. Third Edition. In: TOWNSHEND, T., FANKHAUSER, S., AYBAR, R., COLLINS, M., LANDESMAN, T., NACHMANY, M. & PAVESE, C. (eds.). GLOBE International.
Government of Brazil (2008). National Plan on Climate Change Brazil, Executive Summary. In: CHANGE, I. C. O. C. (ed.) Decree No. 6263. Brasília, Brazil, http://www.mma.gov.br/estruturas/208/_arquivos/national_plan_208.pdf
Government of Brazil (2010). Decree No. 7390, 9 December 2010 [Online]. Available: http://www.planalto.gov.br/ccivil_03/_Ato2007-2010/2010/Decreto/D7390.htm [Accessed 26 January 2015].

119References |
Goverment of Canada (2014). Canada’s Sixth National Report on Climate Change. http://unfccc.int/files/national_reports/annex_i_natcom/submitted_natcom/application/pdf/nc6_can_resubmission_english.pdf Government of Canada, Ministry of the Environment.
Government of China (2012). The second national communication on climate change of the People’s Republic of China.: National Development and Reform Commission, http://unfccc.int/resource/docs/natc/chnnc2e.pdf.
Government of China (2013). Air Pollution Control Action Plan. Beijing: State Council.
Government of India (2008). National Action Plan on Climate Change. http://indiaclimateportal.org/the-napcc/: Government of India, Prime Minister’s Council on Climate Change.
Government of India (2012). India. Second national communication to the United Nations Framework Convention on Climate Change.: Ministry of Environment and Forests, http://unfccc.int/resource/docs/natc/indnc2.pdf.
Government of Mexico (2012). México quinta comunica-ción nacional ante la Convención Marco de las Naciones Unidas sobre el Cambio Climático. Tlalpan, México: Secretaría de Medio Ambiente y Recursos Naturales & Instituto Nacional de Ecología y Cambio Climático, http://unfccc.int/resource/docs/natc/mexnc5s.pdf.
Government of Mexico (2014). Programa Especial para el Aprovechamiento de Energías Renovables. Diario Oficial de la Federación. Tlalpan, Ciudad de México: Secretaría de Medio Ambiente y Recursos Naturales & Instituto Nacional de Ecología y Cambio Climático.
Government of South Korea, Ministry of Environment (2012). Korea’s Third National Communication under the United Nations Framework Convention on Climate Change. Low Carbon, Green Growth. Government of South Korea. Available at: http://unfccc.int/resource/docs/natc/kornc3.pdf
Graus W, Blomen E, Kleßmann C, Capone C and Stricker E. (2009). Global technical potentials for energy efficiency improvement – IAEE European Conference. Vienna: Ecofys Netherlands bv.
Graus W, Blomen E and Worrell E. (2011). Global energy efficiency improvement in the long term: a demand- and supply-side perspective. Energy Efficiency, 4, 435–463.
Greenpeace and European Renewable Energy Council (2012). Energy [R]evolution – A sustainable EU 27 energy outlook. Brussels: Greenpeace International, European Renewable Energy Council.
Groen TA, Verkerk PJ, Böttcher H, Grassi G, Cienciala E, Black KG, Fortin M and Blujedea V. (2013). What causes differences between national estimates of forest management carbon emissions and removals
compared to estimates of large-scale models? Environmental Science and Policy, 33, 222–232.
Guan D, Liu Z, Geng Y, Lindner S and Hubacek K. (2012). The gigatonne gap in China’s carbon dioxide inventories. Nature Climate Change, 2, 672–675.
Gusti M. (2010). An algorithm for simulation of forest management decisions in the global forest model. Artificial Intelligence, N4, 45–49.
Hansen MC, Potapov PV, Moore R, Hancher M, Turubanova SA, Tyukavina A, Thau D, Stehman SV, Goetz SJ, Loveland TR, Kommareddy A, Egorov A, Chini L, Justice CO and Townshend JRG. (2013). High-Resolution Global Maps of 21st-Century Forest Cover Change. Science, 342, 850–853.
Hare B, Vieweg M, Höhne N, Braun N, Gütschow J, Macey K and Rocha M. (2013). Australia: Backtracking on promising progress – Climate Action Tracker Policy Brief. http://climateactiontracker.org/publications/briefing/145/Australia-Backtracking-on-promising-progress.html: Ecofys, Climate Analytics, Potsdam Institute for Climate Impact Research.
Havlík P, Valin H, Herrero M, Obersteiner M, Schmid E, Rufino MC, Mosnier A, Thornton PK, Böttcher H, Conant RT, Frank S, Fritz S, Fuss S, Kraxner F and Notenbaert A. (2014). Climate change mitigation through livestock system transitions. Proceedings of the National Academy of Sciences of the United States of America, 111, 3709–14.
Höhne N, Moltmann S, Hagemann M, Fekete H, Grözinger J, Schüler V, Vieweg M, Hare B, Schaeffer M and Rocha M. (2012). Climate Action Tracker Mexico: Assessment of Mexico’s policies impacting its greenhouse gas emissions profile. Potsdam: Ecofys and Climate Analytics.
Hooijer A, Page S, Navratil P, Vernimmen R, Van der Vat M, Tansey K, Konecny K, Siegert F, Ballhorn U and Mawdsley N. (2014). Carbon Emissions from Drained and Degraded Peatland in Indonesia and Emission Factors for Measurement, Reporting and Verification (MRV) of Peatland Greenhouse Gas Emissions: A summary of KFCP research results for practitioners. Jakarta, Indonesia: IAFCP, Kalimantan Forests and Climate Partnership.
Hooijer A, Silvius M, Wösten H and Page S. (2006). Peat-CO2: Assessment of CO2 Emissions from Drained Peatlands in SE Asia. Delft hydraulics report Q3943. Delft: Delft Hydraulics.
ICCT (2014a). Where we work: China [Online]. Available: http://www.theicct.org/china.
ICCT (2014b). Where we work: India [Online]. Available: http://www.theicct.org/india.
ICF INTERNATIONAL (2014a). Compendium of Policies Governing Hydrofluorocarbons (HFCs). In: UNEP (ed.) Submissions by parties on the implementation of decision XIX/6 – Submission by the United States of America.

120 | Enhanced policy scenarios for major emitting countries
Washington, DC: ICF International / U.S. Environmental Protection Agency.
ICF INTERNATIONAL (2014b). HFC Policy Analysis Report: A Review of Country and Regional Policy Mechanisms and other Initiatives Targeting HFC Consumption and Emissions. In: UNEP (ed.) Submissions by parties on the implementation of decision XIX/6 – Submission by the United States of America. Washington, DC: ICF International / U.S. Environmental Protection Agency.
IEA (2012a). Technology Roadmap – Fuel Economy of Road Vehicles. Paris: OECD/IEA.
IEA (2012b). World Energy Outlook 2012. Paris: International Energy Agency.
IEA. (2013a). Energy Statistics and Energy Balances [Online]. Paris: IEA. Available: http://www.iea.org/statistics/topics/energybalances/ [Accessed 9 December 2014].
IEA (2013b). Southeast Asia Energy Outlook – World Energy Outlook Special Report. Paris: International Energy Agency.
IEA (2013c). World Energy Outlook 2013, Paris, France, International Energy Agency.
IEA 2014. World Energy Outlook 2014. Paris, France, International Energy Agency.
IFC (2013a). Regional Renewable Energy Tariffs in Russia. Washington, DC: International Finance Corporation.
IFC (2013b). Russia’s New Capacity-based Renewable Energy Support Scheme: An Analysis of Decree No. 449. Washington, DC: International Finance Corporation.
INPE-PRODES (2015). Projeto Prodes � Monitoramento da Floresta Amazônica Brasileira por Satélite [Online]. Available: http://www.obt.inpe.br/prodes/index.php [Accessed 3 February 2015].
International Hydropower Association (2014). Turkey [Online]. International Hydropower Association. Available: http://www.hydropower.org/country-profiles/turkey [Accessed 1 December 2014].
IPCC (2014a). Climate Change 2014: Mitigation of Climate Change. Contribution of Working Group III to the Fifth Assessment Report of the Intergovernmental Panel on Climate Change, Cambridge, United Kingdom and New York, NY, USA, Cambridge University Press.
IPCC (2014b). Summary for Policymakers. In: Edenhofer O, Pichs Madruga R, Sokona Y, Farahani E, Kadner S, Seyboth K, Adler A, Baum I, Brunner S, Eickemeier P, Kriemann B, Savolainen J, Schlomer S, Stechow CV, Zwickel T and Minx JC. (eds.) Climate Change 2014: Mitigation of Climate Change. Contribution of Working Group III to the Fifth Assessment Report of the Intergovernmental Panel on Climate Change. Cambridge, United Kingdom and New York, NY, USA.: Cambridge University Press.
IRENA (2011a). Renewable Energy Country Profile: Brazil [Online]. Available: http://www.irena.org/REmaps/CountryProfiles/Latin%20America/Brazil.pdf [Accessed 8 September 2014].
IRENA (2011b). Renewable Energy Country Profile: India [Online]. Available: http://www.irena.org/REmaps/countryprofiles/asia/India.pdf#zoom=75 [Accessed 8 September 2014].
IRENA (2011c). Renewable Energy Country Profile: Mexico [Online]. Available: http://www.irena.org/REmaps/CountryProfiles/Latin%20America/Mexico.pdf [Accessed 8 September 2014].
IRENA (2012). Renewable Energy Country Profile: United States [Online]. IRENA. Available: http://www.irena.org/REmaps/CountryProfiles/Latin%20America/UnitedStates.pdf#zoom=75 [Accessed 15 October 2014].
IRENA (2013). Renewable Energy and Jobs [Online]. Available: http://www.irena.org/rejobs.pdf.
IRENA (2014). Renewable Energy Prospects: China, REmap 2030 analysis. Abu Dhabi: IRENA, www.irena.org/remap.
Isaac M and Van Vuuren DP. (2009). Modeling global residential sector energy demand for heating and air conditioning in the context of climate change. Energy Policy, 37, 507–521.
Jaenicke J, Rieley JO, Mott C, Kimman P and Siegert F. (2008). Determination of the amount of carbon stored in Indonesian peatlands. Geoderma, 147, 151–158.
Jiang Z and Zhang SY. (2003). China’s plantation forests for sustainable wood supply and development [Online]. Québec City, Canada: XII World Forestry Congress, 2003. Available: http://www.fao.org/docrep/article/wfc/xii/0955-b4.htm [Accessed 14 October 2014].
JRC and PBL (2012). EDGAR version 4.2 FT2010. Joint Research Centre of the European Commission & PBL Netherlands Environmental Assessment Agency.
Kaya D, Phelan P, Chau D and Ibrahim Sarac H. (2002). Energy conservation in compressed-air systems. International Journal of Energy Research, 26, 837–849.
Kazuhiro S. (2013). Actions to Control Emission of HFCs in Japan: Implementation of ‘the Act on Rational Use and Proper Management of Fluorocarbons’ [Online]. JRAIA (the Japan refrigeration and Air Conditioning Industry Association). Available: http://unfccc.int/files/bodies/awg/application/pdf/08_japan_racia_kazuhiro_sato.pdf [Accessed 3 February 2015].
KEMCO (2014a). 1 million green homes program [Online]. Korea Energy Management Corporation. Available: http://www.kemco.or.kr/new_eng/pg02/pg02040602.asp [Accessed 6 November 2014].
KEMCO (2014b). Renewable Portfolio Standards (RPS) [Online]. Korea Energy Management Corporation. Available: http://www.kemco.or.kr/new_eng/pg02/pg02040705.asp [Accessed 6 November 2014].
Kindermann G, Obersteiner M, Sohngen B, Sathaye J, Andrasko K, Rametsteiner E, Schlamadinger B, Wunder S and Beach R. (2008). Global cost estimates of reducing carbon emissions through avoided
121References |
deforestation. Proceedings of the National Academy of Sciences of the United States of America, 105, 10302–10307.
Kuramochi T. (2014). GHG Mitigation in Japan: An Overview of the Current Policy Landscape – Working Paper. Washington, D.C.: World Resources Institute. Available online at wri.org/publication/ghg-mitigation-policy-japan
Larsen J, Larsen K and Ketchum W. (2014). Is the US on Track? EPA’s Clean Power Plan and the US 2020 Climate Goal [Online]. Rhodium Group. Available: http://rhg.com/notes/is-the-us-on-track-epas-clean-power-plan-and-the-us-2020-climate-goal [Accessed 8 October 2014].
LGS ONLINE (2014). House of Representatives Passes National Energy Policy [Online]. Lubis Ganie Surowidjojo. Available: http://www.lgsonline.com/pages/g/lgs52e8715d67339/node/lgs4a1d77eb99e7a [Accessed 1 November 2014].
Liu C and Wu B. (2010). ‘Grain for Green programme’ in China: Policy making and implementation? Nottingham: The University of Nottingham, China Policy Institute.
Loe JSP. (2012). Effective resource management in Russia: Economic potential and hindrances for increased associated petroleum gas (APG) utilization [Online]. Pöyry Management Consulting. Available: http://www.uin.no/omuin/fakulteter/hhb/senter/nordomradesenteret/narec/Pages/JULIA-S.P.-LOE.aspx [Accessed 12 December 2014].
Machol R. (2013). Economic value of U.S. fossil fuel electricity health impacts. Environment International, 75–80.
Maher S and White A. (2014). Renewable energy target deal key to ‘saving jobs’. The Australian, October 23, 2014.
Martinez H. (2010). Transforming Transportation: GHG mitigation potential in the transport sector in Mexico [Online]. Washington, D.C.: Centro de Transporte Sustentable de México. Available: http://www.slideshare.net/EMBARQNetwork/ghg-mitigation-potential-in-the-transport-sector-in-mexico.
McKinsey & Company (2009a). Pathways to a Low-Carbon Economy for Brazil. São Paulo: McKinsey & Company.
McKinsey & Company (2009b). Pathways to an energy and carbon efficient Russia: Opportunities to increase energy efficiency and reduce greenhouse gas emissions. Moscow: McKinsey & Company.
Ministry of Energy and Miniral Resources (2013). Indonesia Energy Outlook 2013. Jakarta: Kementerian Energi Dan Sumber Daya Mineral.
Ministry of Energy of the Russian Federation (2010). Energy Strategy of Russia for the Period up to 2030. Moscow: Institute of Energy Strategy.
Ministry of Environment and Forestry (2007). First National Communication of Turkey on Climate Change. Ankara: Ministry of Environment and Forestry.
Ministry of Environment and Urbanization (2011). National Climate Change Action Plan 2011–2023. Ankara: Ministry of Environment and Urbanization.
Ministry of Environment Indonesia (2010). Indonesia Second National Communication Under the United Nations Framework Convention on Climate Change. Jakarta: Ministry of Environment, Republic of Indonesia.
Ministry of Finance (2009). Ministry of Finance Green Paper: Economic and Fiscal Policy Strategies for Climate Change Mitigation in Indonesia. Jakarta: Ministry of Finance and Australia–Indonesia Partnership.
Ministry of Forestry (2008). Reducing emissions from deforestation and forest degradation in Indonesia. Jakarta, Indonesia: Ministry of Forestry of the Republic of Indonesia. http://www.forestcarbonpartnership.org/sites/forestcarbonpartnership.org/files/IFCA_Consolidation_report_REDD_Indonesia_0.pdf.
Ministry of Natural Resources of the Russian Federation (2010). Fifth National Communication on Climate Change of the Russion Federation. http://unfccc.int/resource/docs/natc/rus_nc5_resubmit.pdf.
Ministry of Science Technology and Innovation (2013). Estimativas anuais de emissões de gases de efeito estufa no Brasil. Brasília: Ministro de estado da ciência tecnologia e inovação. http://www.mct.gov.br/upd_blob/0228/228468.pdf.
Ministry of Knowledge Economy South Korea (2010). The 5th Basic Plan for Long-term Electricity Supply and Demand (2010–2014). Seoul: Ministry of Knowledge Economy.
Molenbroek E, Groenenberg H, Cuijpers M, Janeiro L, Smith M, Surmeli N, Waide P, Attali S, Fischer C, Krivosik J, Fonseca P, Santos B and Fong J. (2013). Background report I: Literature review – Evaluation of the Energy Labelling Directive and specific aspects of the Ecodesign Directive. Utrecht: Ecofys.
Murakami S, Levine MD, Yoshino H, Inoue T, Ikaga T, Shimoda Y, Miura S, Sera T, Nishio M, Sakamoto Y and Fujisaki W. (2009). Overview of energy consumption and GHG mitigation technologies in the building sector of Japan. Energy Efficiency 2, 179–194.
National Development Reform Commission (2007). Medium and Long Term Development Plan for Renewable Energy in China.
NCCS (2013). National Climate Change Strategy. 10-20-40 Vision. Mexico: Federal Government of Mexico.
NOAA (2011). Global Gas Flaring Estimates [Online]. Available: http://ngdc.noaa.gov/eog/interest/gas_flares.html [Accessed 11 December 2014].

122 | Enhanced policy scenarios for major emitting countries
NREL. 2012. U.S. Renewable Energy Technical Potentials: A GIS-Based Analysis [Online]. Available: http://www.nrel.gov/docs/fy12osti/51946.pdf [Accessed 3 July 2014].
OECD (2012). OECD Environmental Outlook to 2050. Paris: Organisation for Economic Co-operation and Development.
OECD and IEA (2009). National and sectoral GHG mitigation potential: A comparison across models. Paris: OECD and IEA.
OECD and IEA (2011). Technology Roadmap: Biofuels for Transport. Paris Cedex, France: OECD / IEA.
Owen B, Carrigan A and Hidalgo D. (2012). Evaluate, Enable, Engage – Principles to Support Effective Decision Making in Mass Transit Investment Programs. Washington, DC: EMBARQ.
Pew Center on Global Climate Change (2008). Summary: India’s National Action Plan on Climate Change [Online]. Pew Center on Global Climate Change. Available: http://www.c2es.org/international/key-country-policies/india/climate-plan-summary [Accessed 14 October 2014].
Pittock B. (2011). Co-benefits of large-scale renewables in remote Australia: energy futures and climate change. The Rangeland Journal, 33, 315–315.
Planning Commission Government of India (2011). Low Carbon Strategies for Inclusive Growth: An Interim Report. Interim Report of the Expert Group on Low Carbon Strategies for Inclusive Growth, New Delhi, India, http://moef.nic.in/downloads/public-information/Interim%20Report%20of%20the%20Expert%20Group.pdf.
Ravindranath NH and Murthy IK. (2010). Greening India Mission. Current Science, 99, 444–449.
REN21 (2014a). Renewables 2014 – Global Status Report 2014. Paris: REN21.
REN21 (2014b). Renewables country profile: Japan [Online]. Available: http://www.map.ren21.net/PDF/ProfilePDF.aspx?idcountry=72 [Accessed 8 September 2014].
Reputex Carbon Analytics (2013). Emissions Trading versus Direct Action: Achieving Australia’s Emissions Reduction Objectives. Melbourne: RepuTex.
Reputex Carbon Analytics (2014). Market Update: Re-thinking the Direct Action Plan. Melbourne: RepuTex.
Richerzhagen C, Von Frieling T, Hansen N, Minnaert A, Netzer N and Rußbild J. (2008). Energy efficiency in buildings in China: Policies, barriers and opportunities, Bonn, German Development Institute.
Robinson D, Fernandez R and Kantamaneni R. (2003). Methane emissions mitigation options in the global oil and natural gas industries [Online]. Available: http://www.coalinfo.net.cn/coalbed/meeting/2203/papers/naturalgas/NG020.pdf.
Roelfsema M, Den Elzen MGJ, Höhne N, Hof AF, Braun N, Fekete H, Brandsma R, Larkin J and Böttcher H. (2013). Assessment of climate and energy policies of major
emitting countries. Bilthoven, the Netherlands, http://www.pbl.nl/en/publications/assessment-of-climate-and-energy-policies-of-major-emitting-countries: PBL Netherlands Environmental Assessment Agency.
Roelfsema M, Den Elzen MGJ, Höhne N, Hof AF, Braun N, Fekete H, Brandsma R, Larkin J and Böttcher H. (2014). Are major economies on track to achieve their pledges for 2020? An assessment of domestic climate and energy policies. Energy Policy, 67, 781–796.
Romijn E, Herold M, Kooistra L, Murdiyarso D and Verchot L. (2012). Assessing capacities of non-Annex I countries for national forest monitoring in the context of REDD+. Environmental Science and Policy, 19–20, 33–48.
Russian Energy Agency (2011). PPP Instruments for Energy Efficiency in Russia [Online]. Available: http://www.unescap.org/esd/Energy-Security-and-Water-Resources/energy/trade_and_cooperation/cooperation/gbd4/documents/Session2_C_Olga_ULASAVICH.pdf.
Russian Federation (2013). Sixth National Communication to the UNFCCC [Online]. Moscow: UNFCCC. Available: http://unfccc.int/national_reports/annex_i_natcom/submitted_natcom/items/7742.php [Accessed 12 December 2014].
SDSN and IDDRI (2014). Pathways to Deep Decarbonization. 2014 report. http://unsdsn.org/wp-content/uploads/2014/09/DDPP_Digit.pdf: Sustainable Development Solutions Network & Institute for Sustainable Development and International Relations
Semarnat (2009). Programa especial de cambio climático 2009–2012. Mexico D.F.: SEMARNAT. http://www.semarnat.gob.mx/programas/Documents/PECC_DOF.pdf.
Shukla P. (2013). Mitigation Potential towards achieving global 2C Stabilization Target: Assessment for India [Online]. Available: http://www.unep.org/Transport/lowcarbon/Pdf’s/MitigationPotential_India.pdf.
Sreedharan P. (2012). recent estimates of energy efficiency potential in the U.S [Online]. Available: https://ethree.com/documents/EEPotential_Sreedharan_2012.pdf.
Sun G. (2010). Coal in China: Resources, Uses, and Advanced Coal Technologies. In: PEW CENTER ON GLOBAL CLIMATE CHANGE (ed.) Coal Initiative Reports – White Paper Series. Arlington, VA: Pew Center on Global Climate Change.
Teske S, Ash K and Sawyer S. (2014). Energy [R]evolution. A sustainable USA energy outlook. Washington DC: Greenpeace International & European Renewable Energy Council.
The Energy and Environment Council (2012). Innovative Strategy for Energy and the Environment. In: UNDESA, ESCAP, ILO & UNEP (eds.) Expert Group Meeting on Green Growth and Green Jobs for Youth: Session 1 – Creating an enabling environment for a job centred inclusive growth and

123References |
green economy. The Energy and Environment Council Government of Japan.
US Department of State (2010). U.S. Climate Action Report 2010: Fifth National Communication of the United States of America Under the United Nations Framework Convention on Climate Change [Online]. Washington D.C, US. Available: http://unfccc.int/resource/docs/natc/usa_nc5.pdf [Accessed 6 December 2013].
US Department of State (2014). United States Climate Action Report 2014: Sixth National Communication of the Unites States of America – First Biennial Report of the United States of America. Washington, D.C.: U.S. Department of State.
US Environmental Protection Agency (2012). Global Anthropogenic Non-CO2 Greenhouse Gas Emissions: 1990–2030: Revised Version 2012 [Online]. Available: http://www.epa.gov/climatechange/Downloads/EPAactivities/EPA_Global_NonCO2_Projections_Dec2012.pdf [Accessed 9 December 2014].
US Environmental Protection Agency (2014a). Inventory of U.S. Greenhouse Gas Emissions and Sinks [Online]. Available: http://www.epa.gov/climatechange/Downloads/ghgemissions/US-GHG-Inventory-2014-Main-Text.pdf [Accessed 3 July 2014].
US Environmental Protection Agency (2014b). Summary: North American 2014 HFC Submission to the Montreal Protocol. http://www.epa.gov/ozone/intpol/mpagreement.html: U.S. Environmental Protection Agency.
UFG-LAPIG (2015). Available: http://www.lapig.iesa.ufg.br/lapig/index.php/ [Accessed 3 February 2015].
UNEP 2010. Overview of the republic of Korea’s national strategy for green growth. Geneva: United Nations Environment Programme.
UNEP (2011). HFCs: A Critical Link in Protecting Climate and the Ozone Layer – A UNEP Synthesis Report. Nairobi: United Nations Environment Programme (UNEP).
UNEP (2014a). The Emissions Gap Report 2014: A UNEP Synthesis Report. Nairobi: United Nations Environment Programme (UNEP).
UNEP (2014b). Proposed amendment to the Montreal Protocol submitted by Canada, Mexico and the United States of America. Twenty-Sixth Meeting of the Parties to the Montreal Protocol on Substances that Deplete the Ozone Layer. Nairobi: United Nations Environment Programme.
UNEP (2014c). Proposed amendment to the Montreal Protocol submitted by the Federated States of Micronesia. Twenty-Sixth Meeting of the Parties to the Montreal Protocol on Substances that Deplete the Ozone Layer. Nairobi: United Nations Environment Programme.
UNEP (2014d). Submissions by parties on the implementation of decision XIX/6. Twenty-Sixth Meeting of the Parties to the Montreal Protocol on Substances
that Deplete the Ozone Layer. Nairobi: United Nations Environment Programme.
UNEP (2014e). Submissions by parties on the implementation of decision XIX/6. Open-ended Working Group of the Parties to the Montreal Protocol on Substances that Deplete the Ozone Layer – Thirty-fourth meeting. Nairobi: United Nations Environment Programme.
UNEP Technology and Economic Assessment Panel (2014). Montreal Protocol on Substances that Deplete the Ozone Layer – Decision XXV/5 Task Force Report: Additional Information on Alternatives to ODS. Nairobi: United Nations Environment Programme.
UNFCCC (2011). Compilation of information on nationally appropriate mitigation actions to be implemented by Parties not included in Annex I to the Convention. UNFCCC: Ad Hoc Working Group on Long-term Cooperative Action under the Convention, http://unfccc.int/resource/docs/2011/awglca14/eng/inf01.pdf
UNFCCC (2012). Report of the in-depth review of the fifth national communication of the Russian Federation. http://unfccc.int/resource/docs/2011/idr/rus05.pdf: UNFCCC.
UNFCCC (2014a). Greenhouse Gas Inventory Data – Detailed data by Party [Online]. United Nations Framework Convention on Climate Change. Available: http://unfccc.int/di/DetailedByParty.do [Accessed 14 November 2014].
UNFCCC (2014b). Submitted Biennial Reports – BR1 CTF Japan. http://unfccc.int/national_reports/biennial_reports_and_iar/submitted_biennial_reports/items/7550.php: UNFCCC.
UNFCCC (2014c). Submitted Biennial Reports – BR1 CTF Russian Federation. http://unfccc.int/national_reports/biennial_reports_and_iar/submitted_biennial_reports/items/7550.php: UNFCCC.
Union of Concerned Scientists (2013). Public benefits of renewable energy [Online]. Available: http://www.ucsusa.org/clean_energy/our-energy-choices/renewable-energy/public-benefits-of-renewable.html [Accessed 03/07/2014.
Valin H, Frank S, Pirker J, Mosnier A, Forsell N and Havlik P. (2014). Improvements to GLOBIOM for Modelling of Biofuels Indirect Land Use Change. Ecofys, IIASA, E4tech: ILUC Quantification Consortium – Website: www.globiom-iluc.eu.
Van Vuuren D, Van Ruijven B, Girod B, Daioglou V, Edelenbosch O and Deetman S. (2014). Energy Supply and Demand. In: Stehfest E, Van Vuuren D, Kram T and Bouwman L. (eds.) Integrated Assessment of Global Environmental Change with IMAGE 3.0 – Model description and policy applications. The Hague: PBL Netherlands Environmental Assessment Agency.
Velders GJM, Fahey DW, Daniel JS, McFarland M and Andersen SO. (2009). The large contribution of

124 | Enhanced policy scenarios for major emitting countries
projected HFC emissions to future climate forcing. Proceedings of the National Academy of Sciences of the United States of America, 106, 10949–10954.
World Bank (2015). Passenger cars (per 1,000 people) [Online]. Available: http://data.worldbank.org/indicator/IS.VEH.PCAR.P3 [Accessed 16 January 2015].
World Bank and ClimateWorks Foundation (2014). Climate-Smart Development: Adding up the benefits of actions that help build prosperity, end poverty and combat climate change. Washington DC/San Francisco: International Bank for Reconstruction and Development/The World Bank and ClimateWorks Foundation.
World Bank and Government of the People’s Republic of China (2007). Cost of pollution in China: Economci estimates of physical damages [Online]. Available: http://siteresources.worldbank.org/INTEAPREGTOPENVIRONMENT/Resources/China_Cost_of_Pollution.pdf.
Yang Y, Zhang J and Wang C. (2014). Is China on Track to Comply with Its 2020 Copenhagen Carbon Intensity Commitment? [Online]. Available: http://www.escholarship.org/uc/item/1r5251g8 [Accessed 15 October 2014).
Young R. (2014). Global Approaches: A Comparison of Building Energy Codes in 15 Countries. American Council for an Energy-Efficient Economy Summer Study on Energy Efficiency in Buildings, 3, 351–366.

125Appendix A |
Appendix AAssumptions in the enhanced top-down policy scenario, based on best available technologies
This appendix describes mitigation by sector-specific best available technologies (based on the work of Deetman et al., 2012) for 11 of the 13 major emitting countries (South Koreas and the EU are excluded from this analysis due to data constraints (South Korea) and model limitations (EU, as the PBL energy model excludes individual EU Member States)). This enhanced policy scenario aims at the implementation of sectoral targets/measures in the PBL energy model.
A.1 Energy Supply
Two mitigation options are analysed:1. Implementation of renewable energy technologies (solar PV/
CSP, wind and biomass) is based on the full implementation of the renewable energy targets, as adopted in the current and planned policies, see Roelfsema et al. (2013) and Fekete et al. (20 13b). As the renewable energy targets are mainly defined for target years around 2020, assumptions need to be made for the period until 2030. For the current policies scenario, renewable energy capacity levels are assumed to remain at the target levels (similar as in Fekete et al., 2013b). For the enhanced policies scenario, the trend of the renewable energy capacity development is calculated by the energy model, applying similar assumptions as in the baseline.
2. Gradual ban of coal-fired power plants. All newly built power plants are limited to emit about 500 gCO2/MWh starting from 2015 onwards. This measure is based on the power plant standard in the United States as proposed by the EPA (1100 lbCO2/MWh from 2015 onwards). In this enhanced policy scenario, this standard is applied to all 11 countries from 2015 onwards.
Appendix C reports renewable mix shares, for example, the calculated share of renewable energy supply in the total energy mix. In addition, the analysis reports the greenhouse gas intensity of the power generation in terms of gCO2/kWh.
A.2 Transport
For the transport sector, this study focuses on enhancement measures for light commercial vehicles. Heavy-duty vehicles are not considered in this analysis, as it is very difficult to compare fuel efficiency standards across regions (see e.g. www.theicct.org/blogs/staff/europes-global-leadership-vehicle-emission-standards-at-risk-truck-sector), due to, for example: different sized vehicles; different payloads; and different speed limits for trucks (US trucks are allowed to drive much faster than EU trucks).The only mitigation action analysed here is:1. Enhanced vehicle standards for the 11 countries,
needed to meet the trajectory towards fuel efficiency standards of 46 to 49 km/l for passenger cars by 2030 (developed countries) or 2035 (developing countries), as described in more detail below.
The analysis reports efficiency in terms of km/l for passenger cars. As targets for 2030, we assume that developed countries can implement standards as ambitious as the EU standards for years 2020 and 2025 (as shown in Figure A.1), extrapolated to 2030. This would result in 46 to 49 km/l by 2030. For developing countries, we assume a five year delay in the implementation of the standards. Further, the differences in national car fleets result in a differentiation of overall efficiency of the sector between countries. We assume a linear development from today’s level to 2030.
Current and planned vehicle standardsTable A.1 shows the current and planned policy vehicle standards for the EU, Japan, China and the United States. Most practices are based on either fuel economy standards and/or, for the more progressive policies (i.e. EU), greenhouse gas emission standards (gCO2/km). Standards are set as fleet averages and therefore include flexible compliance mechanisms across specific vehicle categories.

126 | Enhanced policy scenarios for major emitting countries
Figure A.1
1995 2000 2005 2010 2015 2020 2025 2030
0
10
20
30
40km / l
Source: Braun et al. 2014
pbl.n
l
History
EU28
Japan
China
United States
Enhanced policy scenario
Vehicle efficiency
Comparison of achieved light commercial vehicle fuel efficiency and proposed standards for the EU, Japan, China and the United States, MY 1995–2025 (Braun et al., 2014).
Table A.1Summary of current and planned vehicle standards in the EU, Japan, China and the United States.
EU Japan China United States
2020 95 gCO2/km (2021)~ 26.3 km/l
20.3 km/l 20 km/l (subject to review)
17.1–17.4 km/l (2021)40.3–41.0 mpg
2025 32.0–36.8 km/l (subject to review)
None None 23.2 km/l54.5 mpg163 gCO2/mile(subject to review)
Enhanced vehicle standards– The graph above shows high rates of improvement in
the next decade but little evidence of convergence, suggesting that the limits of improvement are not yet being approached.
– Assuming an improvement rate up to 2030 that will equal the annual improvement rate implied by policy between 2015 and 2020, the EU standard could reach approximately 46 to 49 km/l by 2030.
– We assume all OECD countries could adopt the target set by the EU for 2030 and developing countries for 2035.
– Considering the high ambition of the frontrunner (EU) in terms of continual improvement, EU targets might be an unrealistic target for developing countries who: a) have a very different starting point, and b) have much older vehicle fleets – including a large share of older (decommissioned) vehicles from developed countries.
– A more reasonable target for developing countries, although still ambitious, might be the trajectories currently set by China and the United States. This is also appropriate since the current vehicle fleets in Latin America, Africa and low-income Asia are heavily based on imports from the United States and China.
Emission reduction potential and co-benefits– The transport sector is a major source of greenhouse
gas (17% in the United States); in the EU, emissions from the transport sector continue to increase at a high rate, despite overall decreasing greenhouse gas emissions from all sectors combined.
– Adoption of best practice would likely reverse the emission trend as early as in 2020, and cause significant reductions by 2030, despite the projected high increase in activity.
– Energy security and import dependence (US transport consumes 14 million barrels of oil per day, 2/3 of which is imported. Energy cost saving in the EU is projected for 2050 at 8 billion euros).

127Appendix A |
A.3 Industry
The industry sector represents about 30% of total world greenhouse gas emissions. Industry greenhouse gas emissions can be divided into direct emissions that are produced at the industrial facility, indirect emissions that occur off-site but are associated with the facility (electricity and heat), and process emissions. We will only focus at CO2 emissions as they represent by far the largest part of industry emissions.The industry sector consists of various sub-sectors (IPCC, 2014a), here understood to include: Iron and steel; cement; chemicals; pulp and paper; non-ferrous (aluminium/others); food processing; textiles and leather; and mining. Our analysis focuses on the production of iron, steel and cement, as these sub-sectors together are responsible for 44% of all CO2 emissions (IPCC, 2014a).Three mitigation measures were analysed:1. Improving the clinker-to-cement ratio, leading to a lower
demand for clinker, per tonne of cement. Current cement production includes large amounts of clinker, which comes with high CO2 emissions. These can be partly replaced and if 100% of substituting materials were to be used, the clinker content would decrease to about 60% on a global average. This improved clinker-to-cement ratio is modelled by placing a maximum standard for clinker ratios of 65% by 2030, linearly decreasing from 2015 levels.
2. Good housekeeping measures in the steel and cement industries could improve energy efficiency significantly (Deetman et al., 2012). In this study, this is modelled by the gradual implementation of several measures between 2015 and 2030; using efficient lighting (and lighting management), more efficient and flexibly adjustable motors, optimised compressed air systems (Kaya et al., 2002) and more preventive maintenance.
3. Enforcing advanced type steel furnaces. This is modelled by enforcing all newly built steel furnaces to be of the most efficient steel blast furnace types from 2015 onwards.
Note that these measures do not assume early retirement of existing industries, but only improve efficiency in current plants where possible or enforce efficiency in newly built plants.
A.4 Buildings
Four measures are analysed in the buildings sector, based on Deetman et al. (2012):1. An instantaneous global ban on the sales of incandescent
light bulbs from 2015 onwards is simulated. The light bulbs are replaced with advanced lighting options,
consisting of a mix of compact fluorescent lighting (CFL) and light emitting diodes (LEDs).
2. The implementation of advanced heating and insulation technologies. Based on the best available technologies as specified by Graus et al. (2009, 2011) we derived the lowest possible value of total energy consumption, which is 15 kJ per square metre of living space per heating degree day (HDD, as applied by Isaac and Van Vuuren (2009)). We assume a gradual implementation of this standard for newly built houses from 2015 until 2030.
3. The enforcement of ‘A’ label appliances between 2015 and 2030, which is modelled by assuming a decrease in the energy use of dishwashers by 27%, of refrigerators (A++) by 67%, of tumble dryers by 48%, of laundry machines by 29%, of televisions by 52%, and of air conditioners by 24%.
4. The implementation of 1 m2 solar PV panels for every household. In the analysis we simulated the installation of 1 m2 solar PV on the rooftop of every household in the six selected countries between 2015 and 2030. We use a conversion efficiency of 10.8% (Deetman et al., 2012) and assume that all generated electricity is either used directly or fed back to the grid, so the generated electricity is subtracted from the residential energy use.
In the TIMER model, the results of these four measures become visible in both the buildings sector and the electricity sector. Measures that have an effect on the electricity consumption of households and other buildings show emission reductions in the electricity sector. In order to show the total reductions due to measures in the buildings sector, the additional reductions of these measures within the electricity sector are dedicated to the buildings sector.
A.5 HFC consumption and production
The Montreal Protocol has been an effective instrument for protecting the Earth’s stratospheric ozone layer by providing an international framework for phasing out ozone depleting substances (ODSs), including chlorofluorocarbons (CFCs) and hydrochlorofluorocarbons (HCFCs). The phase-out of ODSs has been accomplished by curtailing their production and consumption. The phase-out of the ODSs requires either substitute chemicals or other approaches, and hydrofluorocarbons (HFCs) have become the major replacements in many ODS applications, as they can be used with relative ease (technically) in place of CFCs and HCFCs.Like the ODSs, HFCs are greenhouse gases, and HFC emissions are increasing rapidly as a result of their use as ODS replacements, and HFCs have the potential to

128 | Enhanced policy scenarios for major emitting countries
substantially influence climate in the future (Velders et al., 2009). However, environmentally sound alternatives are already available for most sectors, as indicated by UNEP (2011), submissions by countries in the context of the negotiations on the Montreal Protocol (UNEP, 2014d, UNEP, 2014e, ICF International, 2014a, ICF International, 2014b) and explored in more detail in the UNEP report of the technology and economic assessment panel (UNEP Technology and Economic Assessment Panel, 2014).The Montreal Protocol, potentially, could incorporate a phase-down schedule for production and consumption of HFCs based on the same reduction schedules for ODSs, see for example the proposals by Canada, Mexico and the United States, i.e. the 2014 North American Amendment Proposal to Address HFCs under the Montreal Protocol (UNEP, 2014b), and the Federated States of Micronesia (UNEP, 2014c).This report assumes for the enhanced policy scenario a full implementation of the 2014 North American Amendment Proposal (UNEP, 2014b). It should be noted that the North American amendment proposal is a starting point for discussions to adopt an amendment to the Montreal Protocol on HFCs. Key elements of the North American proposal:– Lists 19 HFCs as a new Annex F.– Recognises that there may not be alternatives for all
HFC applications today and therefore proposes a gradual phasedown with a plateau, as opposed to a phase-out (see below).
– Proposes separate provisions for non-Article 5 and Article 5 countries’ phase-down of production and consumption on a global warming potential (GWP)-weighted basis.o The baseline for Article 5 countries1 is calculated
as 100% of average HFC consumption and production and 40% of average HCFC consumption and production from 2011 to 2012.
o For non-Article 5 countries, the baseline is calculated as 100% of average HFC consumption and production and 85% of average HCFC consumption and production from 2008 to 2010.
o Uses GWP weighting as compared to typical Montreal Protocol weighting by Ozone Depleting Potential.
Proposed HFC Reduction Steps for Article 5 and Non-Article 5 Countries (% of baseline):
Potential Steps for Non-A5 Parties
Potential Steps for A5 Parties
2018 90% 2020 100%
2023 65% 2025 70%
2029 30% 2031 40%
2035 15% 2045 15%
Table A.2Overview of potential energy-related CO2 reductions per policy measure (Mt CO2) by 2030 in the enhanced top-down policy scenario and their combined effect, compared to the current policies scenario
Countries
Buildings sector Industry sector Transport sector
Energy sector
Combined effect
Improved insulation
Light bulb standard
Solar PV
A-label appliances
House-keeping
Steel furnaces
Clinker cement
ratio
Efficiency standard
Power-plant
standard
Australia 7 2 3 2 2 10 2 30 16 64
Brazil 4 8 6 4 24 30 6 57 26 143
Canada 13 1 0 0 2 3 1 33 0 58
China 132 113 57 78 330 229 148 6 1,075 1,992
India 4 21 20 18 121 194 114 103 741 1,205
Indonesia 2 12 9 7 9 5 10 33 34 106
Japan 8 4 2 4 15 30 5 55 16 129
Mexico 3 4 3 2 10 18 4 57 14 104
Russia 8 4 2 1 35 52 5 43 29 157
Turkey 3 5 3 2 12 8 5 51 2 82
United States
99 6 8 11 14 50 8 325 485 966

129Appendix A |
A.6 Main results
Table A.2 shows the energy-related CO2 reductions per policy measure (Mt CO2) by 2030 of the enhanced top-down policy scenario and their combined effect, compared to the non-harmonised emission projection of the current policies scenario. The combined effect is less than the sum of all reductions, due to overlap in the effect of the policies.As the combined effect in CO2 reductions is non-harmonised, total greenhouse gas reductions (by adding reductions in HFCs, non-CO2 and land-use emissions) can be different from the total greenhouse gas reductions presented in the country sections, which are reductions compared to harmonised projections.
Notes
1 http://ozone.unep.org/new_site/en/parties_under_
article5_para1.php.
2 www.GLOBIOM.org.

130 | Enhanced policy scenarios for major emitting countries
Appendix BLinking historical data and projections of LULUCF emissionsIIASA estimates of LULUCF emissions are based on the GLOBIOM model.2 This model provides projections of land-use emission from 2000 up until 2030 for the forest and agricultural sector. Projections of LULUCF emissions as provided by GLOBIOM have here been correlated with historical trends from FAOSTAT (http://faostat3.fao.org/faostat-gateway) as of 2010. The historical trend from 1990 until 2010 is as such fully based on FAOSTAT numbers. Projects from GLOBIOM as of 2010 and onwards have on the other hand been decreased to fit with FAOSTAT data through the introduction of fixed reduction constants. Three constants have been added to correlate the various sources of emissions. One constant relates to net CO2 emission/removal from forest land, one constant relates to total net N2O emissions from agriculture, and one relates to total CH4 emissions from agriculture. The three reduction constants are based on the difference in emissions for 2010 and kept fixed over time all the way until 2030.


PBL Netherlands Environmental Assessment Agency
Mailing addressPO Box 303142500 GH The HagueThe Netherlands
Visiting addressOranjebuitensingel 62511VE The HagueT +31 (0)70 3288700
www.pbl.nl/en
April 2015
This report provides an overview of projected greenhouse gas emissions in 13 major emitting countries/regions (Australia, Brazil, Canada, China, European Union, India, Indonesia, Japan, Mexico, the Russian Federation, South Korea, Turkey, and the United States) up to 2030, taking into account the emission trajectories based on current and planned policies, and selected enhanced mitigation measures.