Embed Size (px)
Citation preview

Enhanced Pulseshaping Capabilities and Reduction of Non-Linear Effects in All-fiber MOPA Pulsed System
Bertrand Morasse*, Stéphane Chatigny, Éric Gagnon, Jean-Philippe de Sandro, Cynthia Desrosiers
CorActive High-Tech, 2700 Jean-Perrin, suite 121, Québec, Canada, G2C 1S9
ABSTRACT
Pulseshaping is important in high energy pulsed fiber MOPA system to mitigate non-linear effects and optimize the processing of different materials. However, pulseshaping is greatly limited by the spectral features of the semiconductor seed source commonly used as the master oscillator. Through the appropriate design of an external fiber Bragg grating (FBG) and adequate current modulation, the spectrum of the fiber-coupled seed laser was broadened to suppress stimulated Brillouin scattering occurring in the amplifier chain and the central emission wavelength and bandwidth were controlled. Pulseshaping is also quickly limited by the saturation energy and doping level of standard aluminosilicate ytterbium doped fibers used in the power amplifier even with large core diameter. Co-doping the fiber with phosphorus greatly increases the saturation energy of the system, which gives smoother pulseshape and significantly lower stimulated Raman scattering (SRS). It is shown that going from 1060 nm to longer emission wavelength at 1090 nm with this fiber increases further the pulseshaping capabilities and reduces SRS. The phosphorus codoping also allows higher ytterbium doping level without photo-degradation, which decreases nonlinear effects generation during the amplification while giving more flexible pump wavelength choice and efficiency. Keywords: SBS suppression, pulse shaping, ytterbium doped fiber, double cladding pulsed amplifier, fiber Bragg grating, MOPA system, phosphorus co-doped fiber, non-linear effects reduction
1. INTRODUCTION Pulsed laser sources are required in many applications such as material processing. The nanosecond pulsewidth range with kW peak power is often seeked to get a good interaction with the material in several applications such as marking and drilling. A master oscillator power amplifer (MOPA) configuration is then of good interest to do so. A low power source is modulated with precise control and then amplified in amplifier stages to the energy level required by the application. Regarding the master oscillator, a semiconductor diode modulated in current offers a great flexibility in pulsewidth, repetition rate and pulseshape compare to other pulsed source such as a Q-switch lasers. The current waveform completely determines the pulse characteristics and the wafer composition independently determines the emission wavelength. Regarding the power amplifier, silica fiber amplification is of great interest for its excellent beam quality, large heat dissipation, high power handling and robustness which give significant advantages over traditional gas or crystal based lasers. Especially, ytterbium (Yb) doped fiber amplifier is used for its high efficiency, high doping concentration, and large pump absorption band. Furthermore, double-cladding optical fiber (DCOF) configuration allows a large amount of low brightness high power pump source to be coupled in the fiber cladding and amplify a high brightness signal to high power in a small core with high beam quality. Fiber-coupled semiconductors in the 1.06-1.09 µm especially match the amplification band of Yb DCOF and thus both make a good combination to achieve nanosecond pulsed laser source with high peak power and flexible pulse parameters.
Nevertheless, semiconductor sources have modes with a narrow wavelength linewidth that can create Stimulated Brillouin Scattering (SBS) during amplification[1], which must be suppressed adequately for a reliable operation of the system. The long interaction length of DCOF brings other non-linear effects such as Stimulated Raman Scattering (SRS) and Self-Phase Modulation (SPM) that must be properly managed as well[1]. In higher energy regime typically greater than 50 µJ, the ytterbium fiber amplification brings pulse deformation that can limit the desired output pulseshape and creates unwanted high peak power that enhances nonlinear effects. The high inversion level of the pulsed ytterbium power amplifier can also cause photodarkening of the fiber core and decrease the output power over time.
*[email protected]; phone 1 418 845-2466 #224; fax 1 418 845-2609; www.coractive.com
Copyright 2009 Society of Photo-Optical Instrumentation Engineers. This paper is published in Proceeding of SPIE (Photonics West 2009) and is made available as an electronic reprint (preprint) with permission of SPIE. One print or electronic copy may be made for personal use only. Systematic or multiple reproduction, distribution to multiple locations via electronic or other means, duplication of any material in this paper for a fee or for commercial purposes, or modification of the content of the paper are prohibited.

In this paper, we investigate the different limitations of MOPA systems based on current modulated diode and Yb fiber amplifier and propose solutions to overcome or minimize them. After introducing the experimental configuration used, we first present solutions to decrease SBS generated in the fiber amplifier by adequately operating the diode, particularly for many industrial applications that does not require narrow linewidth. We then present ways to address the pulse deformation created in the power amplifier at higher energy regime using phosphosilicate fibers and pulseshaping. Finally we describe solutions to optimize the system parameter and make it reliable on the long term and easy to integrate and operate.
2. EXPERIMENTAL CONFIGURATION
The configuration used to conduct the experiment is shown on Figure 1. A Bookham 1064 nm single-emitter seed diode (model LC96A1060-20R) fiber pigtailed in a polarization maintening (PM) panda type singlemode fiber is used to emit the pulses. The seed diode is soldered to an Analog Modules OEM diode driver (model 762) that convert a 0-1V signal applied to the driver mini-coax input into a 0-2A to the diode anode while maintening the diode temperature at 25°C; a DC current offset can also be applied by the diode driver. The desired waveform at a given repetition rate is generated with an arbitrary function generator from Tektronix (model AFG3101). The minimum and maximum rise time achievable by the system is around 5 to 10 ns measured with a fast temporal photodetector from Thorlabs (model D400FC) and an oscilloscope with 500 MHz bandwidth.
Figure 1. MOPA configuration used for the experiments
The pre-amplifier stage amplifier was made with a 1+1�1 multimode combiner with a singlemode signal feedthough at 1060 nm from AOFR (model LC2010105HP). This enables to inject a 915 nm pump diode fiber coupled in a 105µm/0.22NA fiber core diameter/NA from Sheaumann (model SP-915-280) into the Yb pre-amplifier fiber, which is made with 7 m of the CorActive’s Las-Yb-07-01, a 7µm/0.19NA core and125µm/0.46 octogonal cladding fiber with 0.8 dB/m of absorption at 915 nm. Low power single stage isolators from AFW Technologies (model ISOS-64-B-1-0) pigtailed with Corning HI1060 fiber are placed after the seed and the pre-amplifier to block any downstream feedback. Typically, 1.5W of pump power is used to pre-amplify the signal from a few mW to around 200 mW of average power measured after the isolator located after the pre-amplifier. A pre-amplifier gain smaller than 25 dB is used to avoid amplified stimulated emission (ASE) lasing that can destroy the seed laser even if an isolator protects it. A 99.9%-0.1%
pump diode Symbols: splice & recoat
Output SCOF
isolator
Yb fiber
Pulse generator
Coreless angle cleave end cap
All fiber pre-amplifier
Driver and seed diode
tap coupler

tap coupler from Gooch & Housego (Model FSM-064M32A10) is spliced after the seed to monitor on-line the spectrum and power from the seed and the pre-amplifier with the 0.1% forward branch; the backward branch of the second tap coupler is also used to monitor stimulated Brillouin scattering coming from the power amplifier.
The power amplifier is made with a 2+1�1 combiner from ITF Labs with 105µm/0.22NA pump branch, a 10µm/0.08 signal feedthrough having a 125µm/0.46NA output DCOF fiber. A 35W pump module fiber coupled in 105µm/0.22NA sold by Fianium (PUMA module) at 915 nm are used to pump the second stage. These pumps come with a protection against signal feedback which is important because any SBS backward pulse immediately kills non-protected pump diodes during the investigations. A single cladding fiber is used at the output as a delivery fiber; the fiber is CorActive’s Si-12-20 with a core of 20µm/0.12NA and cladding of 125µm. An 8 degrees angle cleave end cap of less than 2 mm length is made at the output with a 125 µm coreless fiber. The end cap could be made on the DCOF Yb fiber directly but the 4% Fresnel reflection at the output injects signal back into the cladding and can damage the pumps at very high peak power even if they are protected. The single clad fiber also eliminates residual pump power. Two ytterbium fibers of different glass composition, but with similar geometry were used in the experiments for the power amplifier. The core diameter of the fiber was 20 µm with a NA around 0.10 with a 128 µm flat to flat octogonal cladding diameter. One fiber, the CorActive’s Hpa-Yb-20/130-01, is an aluminosilicate type fiber with absorption of 3.2 dB/m at 915 nm and the second, the Hpa-Yb-20/60/128-01, is a phosphosilicate fiber with 9.0 dB/m at 915 nm. Table 2 presented in section 4.2 also summarizes the parameters of these fibers. The low NA of the phosphosilicate fiber was achieved with a pedestal of 60 µm diameter surrounding the core.
The power amplifiers operate with slope efficiencies in the 60 to 70 % range with respect to the launched pump power at 915 nm depending on the exact operating conditions. Typical slope efficiencies are shown on Figure 2-(a) for the 20-125 Yb fibers described above up to 10W output powers for a 20 dB long absorption cavity at 915 nm. At any time during amplification, the backward branch of the tap coupler placed before the power amplifier is used to monitor any instabilities such as ASE lasing or SBS pulses. The branch is connected to a temporal detector and any instability will be seen on an oscilloscope. For instance, a typical sporadic SBS pulses are shown on Figure 2-(b) when the amplifier is not optimized for SBS-free operation. The oscilloscope cannot trig on the sporadic pulses but the instability will be clearly seen when they appear. Note that on Figure 2-(b), only the small nanosecond spikes are backward SBS, the 200 ns pulse is the output pulse coming from the forward direction.
y = 0.6237x - 0.7417
y = 0.668x - 0.9172
0
2
4
6
8
10
12
0 5 10 15 20
Launched pump power at 915 nm (W)
Out
put s
igna
l at 1
064
nm (W
)
phosphosilicatealuminosilicate
(a) (b)
Figure 2. (a) Typical slope efficiency of the power amplifier and (b) typical SBS signature measured in the backward branch of the tap coupler placed before the power amplifier
3. SEED DIODE OPTIMIZATION The generation of SBS in the power amplifier is mainly caused by the spectral characteristics of the semiconductor seed diode. Commercially available diodes at 1064 nm, based on the diode technology developed for the telecommunication market, have a Fabry-Perot (FP) or a distributed feedback (DFB) structure that consists of one or several modes that have a spectral width in the tens of MHz range that cannot be individually resolved by standard grating based optical spectrum analyzers (OSA)[2]. Such a small spectral width easily initiates SBS since this non-linear effect is fully stimulated by a 20 MHz linewidth source and a larger linewidth will proportionally decrease SBS. Many industrial applications do not require narrow linewidth giving flexibility on the spectral width of the system and thus any enlargement of the seed linewidth will decrease SBS in the power amplifier. Methods of increasing the linewidth of the diode will be described below.
Backward SBS spikes

3.1 Diode chirping
SBS generated by semiconductor diodes is well known from the high power CATV transmission since it was one of the main limitations of these systems[3]. A solution presented at that time was to use transmitter modulation such as phase modulation or direct current modulation of the diode to enlarge the linewidth by a chirp effect[4],[5],[6]. Phase modulation was not attempted in our experiment since it was not considered to be cost effective, but we are confident that it would significantly broaden the spectrum; but direct current modulation can easily be experimented since the diode is operated by a direct current pulse. An easy observation is that when a given seed diode is operated in continuous wavelength (CW), SBS could be detected with a threshold as low as 10W of output power, but the SBS threshold in pulsed operation is easily above the kW level. However, special care must be taken to increase the SBS threshold with the applied direct modulation as described below.
The modulation waveform will impact the diode spectral linewidth. A waveform with fast rising edge such as a square pulse enlarges the linewidth much more than a slow rising edge from a Gaussian pulse as shown in Figure 3-(a), where the Fourier Transform of the two different pulses are shown. The square pulse has a spectral bandwidth of 7 GHz while the Gaussian pulse’s bandwidth is smaller than 0.1 GHz. This feature was experimentally tested by operating the power amplifier with the aluminosilicate fiber at a repetition rate of 20 kHz with a square pulsewidth of 200 ns. The rise time of the square pulsewidth could be changed online with the waveform generator from 5 ns to 150 ns. For a given rise time, the output average power where the backward SBS pulses appeared was monitored. It was clearly noted that the faster the rise time, the higher the SBS threshold was as shown on Figure 3-(b); thus a steeper waveform enlarges the linewidth as the Fourier transforms predicts and reduces SBS.
0
0.1
0.2
0.3
0.4
0.5
0.6
-10 -5 0 5 10
Frequency (GHz)
Am
plitu
de
100ns square pulse : FWHM ~ 7GHz
100ns gaussian pulse : FWHM < 0.1 GHz
(a) (b)
Figure 3. (a) Comparison of the Fourier transform of a 100 ns square pulse versus a 100 ns Gaussian pulse showing the larger spectral width for the square pulse. (b) Average output power where SBS appears as a function of the rise time of the leading edge of the 100 ns square pulse used at 20 kHz repetition rate; a faster rise time increases the SBS threshold occurring in the power amplifier.
The depth of modulation of the current waveform also impacts the diode spectrum[7]: the higher the applied peak current, the larger the diode linewidth is. The output spectrum of a Fabry-Perot diode operated at a pulsewidth of 200 ns and repetition rate of 20 kHz with different applied peak current is shown on Figure 4. At 0.5 A peak current, a few Fabry-Perot modes oscillate and dominate the spectrum of the diode. At 1.5 A peak current, the output power is evenly distributed among several tens of modes and this distribution is stable over time. Then, each mode contributes evenly to amplification and will excite independently the Brillouin phonon of the glass matrix; so instead of having a high output peak power from the power amplifier contained in one or two modes, this power is distributed onto many modes and increases the overall SBS threshold. The increase of SBS threshold by distributing the power at different wavelength has also been reported before[6]. It is thus advantageous to drive the diode at the highest possible peak current to decrease SBS, the effect was directly seen on the power amplifier where the SBS threshold increases significantly. The limitation in peak current is determined by the catastrophic optical damage of the diode and also by its long term reliability, which also can depend upon the repetition rate and pulsewidth used (the overall duty cycle) that bring different stresses to the diode wafer. We typically did not operate the diode at more than 2A peak current as specified by the manufacturer in the 20 to 100 kHz range at 200 ns pulsewidth.

0
0.00001
0.00002
0.00003
0.00004
0.00005
0.00006
1055 1057 1059 1061 1063
Wavelength (nm)
Am
plitu
de (l
inea
r)
peak current : 0.5 A
peak current : 1.5 A
Figure 4. Output spectrum of a Fabry-Perot seed diode for different applied peak currents when operated at a repetition rate of
20 kHz with a 200 ns square pulsewidth Finally, a DC bias current applied to the diode is sometimes wanted to modulate the diode above the lasing threshold at all time, but we noticed that a too high DC offset can create CW modes with narrow linewidth or directly decrease the linewidth enlargement effect of the modulation, which then significantly decrease the SBS threshold during amplification. So a minimum DC bias or no bias at all is used to decrease the SBS threshold occurring in pulsed amplifier.
3.2 FBG-stabilized diode
As discussed previously, semiconductor diodes inherently emit narrow linewidth modes that are often not necessary for many applications and generate SBS. Another way to affect the diode linewidth is to give a feedback to the diode. This phenomenon has been reported in the literature by many authors[9],[10],[11]: depending on the feedback level and phase, the spectrum can be narrowed down or broadened. One interesting feedback regime to suppress SBS occurs when a feedback between 0.01% to 10% (-40 dB to -10 dB) is applied to the diode as reported by Tkach and Chraplyvy[9]. At this feedback level, the diode falls in a regime called coherence collapse and the spectrum can become as broad as 100 GHz. While these authors used free-space optics and mirror to give feedbacks to the diode, an easy way to incorporate a feedback in an all-fiber configuration is to use a Fiber Bragg grating (FBG) after the diode to give a defined feedback level to the diode. The FBG can further lock the central wavelength of the diode to the desired value required by the application. Using a FBG after the seed was tested in our experiment: using a FBG typically increases by a factor of 4 the SBS threshold independently of the fiber used in the power amplifier. So this method can be very successful in mitigating SBS but special cares must be taken in the choice of the FBG and configuration used.
Typical semiconductor diodes emit a linear polarization and, as mentioned by Petermann[10], the polarization of the feedback must match with the output polarization of the diode to make the feedback effective. Therefore a diode pigtailed with polarization maintening (PM) panda type fiber was used in the experiments. A FBG written in a singlemode PM fiber was spliced to the diode by taking care of aligning the stress rod with a PM splicer (Vytran FFS-2000). We found that using FBG in non-PM fiber or not aligning the stress rods of FBG written in PM fiber were both less effective to reduce SBS. For instance, SBS thresholds are shown in Table 1 for a pulsed amplifier operated at a repetition rate of 20kHz and pulsewidth of 330 ns for a pulse rise time of 200 ns. The 200 mW pre-amplified signal at 1064 nm was amplified with 915 nm pump in 6 m of singlemode 10µm/0.08NA Yb fiber of 1.3 dB/m of absorption at 915 nm. The results clearly show that a FBG increases the SBS threshold and that using a FBG in PM fiber with the stress rod aligned with the seed PM fiber further increases the SBS threshold.
Seed configuration Average power level where SBS appears
(W) Seed diode without FBG 1.40
Seed diode with FBG in non-PM fiber 2.15
Seed diode and FBG in PM fiber 2.60
Table 1. SBS threshold as a function of the FBG configuration spliced after the seed pulsed amplifier operated at a repetition rate of 20 kHz and pulsewidth of 330 ns and pulse rise time of 200 ns amplified in 6 m of 10µm/0.08NA Yb fiber.

The bandwidth of the FBG is also important to consider. As discussed previously, current modulation is desirable to enlarge the spectrum to several nanometers and reduce SBS. However, if a narrow bandwidth FBG is used, the output spectrum of the diode will be narrowed down and SBS is enhanced. This was tested using a Bookham seed with a 0.5 nm bandwidth FBG placed at 10 cm away from the diode. The diode was operated at repetition rate of 20 kHz and 200 ns pulsewidth and amplified in a two stage amplifiers with a 15µm/0.13NA phosphosilicate ytterbium fiber used in the power amplifier. Adding the FBG effectively locked the spectrum and reduced the diode FWHM from 3.9 nm to 0.73 nm. It was found that the SBS threshold was lower by a factor of three when the FBG was used compared to amplification with no FBG at all after the diode. The results are reported on Figure 5 where the diode spectrum and SBS threshold are shown. So using the FBG did not reduce SBS generation at all, but had the opposite behavior because the overall spectrum of the diode was narrowed down. Typically, we found out that FBG with FWHM around 3 to 5 nm and 12% reflectivity was effective to create coherence collapse and not to narrow down the spectrum at the same time.
0
0.00002
0.00004
0.00006
0.00008
0.0001
0.00012
0.00014
1058 1060 1062 1064 1066
Wavelength (nm)
Pow
er s
pect
rum
(lin
ear)
With FBGWithout FBG
(a) (b)
Figure 5. (a) Output spectrum of a diode with a narrow bandwidth FBG of 0.5 nm and without FBG at all. (b) SBS threshold measured in the power amplifier operated at 20 kHz repetition rate with a 200 ns square pulsewidth with and without a narrow bandwidth FBG.
The distance between the FBG and the diode must be considered as well. Tkach and Chraplyvy[9] reported that in the coherence collapse regime, the phase of the feedback does not need to be controlled. We observed that the FBG could be added after the seed to suppress SBS without taking any special care to the path length of the traveling light (using a piezoelectric translator for instance). Nevertheless, since the diode is operated in pulsed mode, the distance between the FBG and the diode will change the effect of the feedback. The farther away is the diode, the longer the time required for a pulse to do a round trip, so the reflected pulse can be delayed compared to the emitted pulse. This can decrease the coherence collapse of the diode and the wavelength stabilization as well. On Figure 6, the output spectra of a diode with a FBG spliced at 2 m away from the diode and 0.5 m away are shown. The FBG has a central wavelength of 1065.5nm and a bandwidth of 1 nm and the diode is operated at a repetition rate of 20 kHz and a pulsewidth of 200 ns. The FBG placed closer to the diode locks practically all the spectrum within its bandwidth while some power is out of band when the FBG is at 2 meters away. The mitigation of SBS is also reduced with the FBG placed farther away from the diodes.
0
0.001
0.002
0.003
0.004
0.005
0.006
0.007
0.008
0.009
1062 1063 1064 1065 1066 1067 1068
Wavelength (nm)
Pow
er s
pect
rum
(lin
ear)
FBG 2m awayFBG 0.5m away
Figure 6. (a) Output spectrum of a diode operated at a repetition rate of 20 kHz and pulsewidth of 200ns with a FBG spliced at 2
m or 0.5 m away from the diode. The FBG closer to the diode better locks the diode spectrum.
Seed configuration Average power
where SBS appears
(W) With narrow bandwidth FBG 3.1
Without FBG 9.2
4. PULSESHAPING One of the interesting feature of semiconductor based MOPA system is the independent control of pulseshape and repetition rate compared for instance to Q-switch system. The current waveform applied to the diode is directly translated to optical power in the same manner. However, different issues must be considered when doing such pulseshaping as discussed below.
4.1 Saturation energy limitation and glass matrix
Even if any given arbitrary pulseshape is easy to produce at the seed diode level, it is harder to maintain it at higher output energy when amplified. When the amplification reaches the saturation energy of the power amplifier, the leading edge of the pulse takes all the gain and there is no amplification left for the remaining part of the pulse. This phenomenon has been reported in fiber amplifier by several authors12-15 and can be easily understood by a simple equation. The saturation energy of a gain medium can be calculated with the following formula[16]:
( )( )Γ+
=ae
oosat
AhcE
σσλ
(1)
Where h is the Planck constant, co is the speed of light in vacuum, and �o is the wavelength of the signal in vacuum, A is the fiber core area, � is the portion of the signal mode profile that overlaps with the ytterbium ions, �e and �a are respectively the emission and absorption cross-section at the signal wavelength. For instance, for a fiber with 20 µm core diameter operated at 1064 nm with an overlap of 1, the saturation energy is around 0.15 mJ for an aluminosilicate fiber with �e = 3.8x10⁻²⁵ m2 (�a can be neglected at the signal wavelength). This means that any amplification close or beyond 0.15 mJ will deform the pulse. Though fiber amplifiers give excellent beam quality and easy integration, the small core area quickly limits the saturation energy of the system. Not much flexibility is possible for increasing the core area without degrading the beam quality or compromising the fiber integration.
An alternative parameter that can be played with is the cross-sections of the fiber, which depends of the glass matrix used. A phosphosilicate glass host is interesting in that sense since the cross-section of ytterbium is typically two times lower than aluminosilicate fiber. Incorporating only 8 to 12 mol% of P2O5 in the silicate glass will give this effect while maintening the excellent mechanical and thermal properties of pure silica; the spliceability to pure silica fiber is not affected as well. So a 20 µm core fiber will have a saturation energy around 0.35 mJ using a phosphosilicate matrix with �e = 1.7x10⁻²⁵ m2 (�a can also be neglected at the signal wavelength in this matrix). Other glass matrix could be used such as germanosilicate or fluorate glass but the photo-induced or mechanical properties are then less attractive.
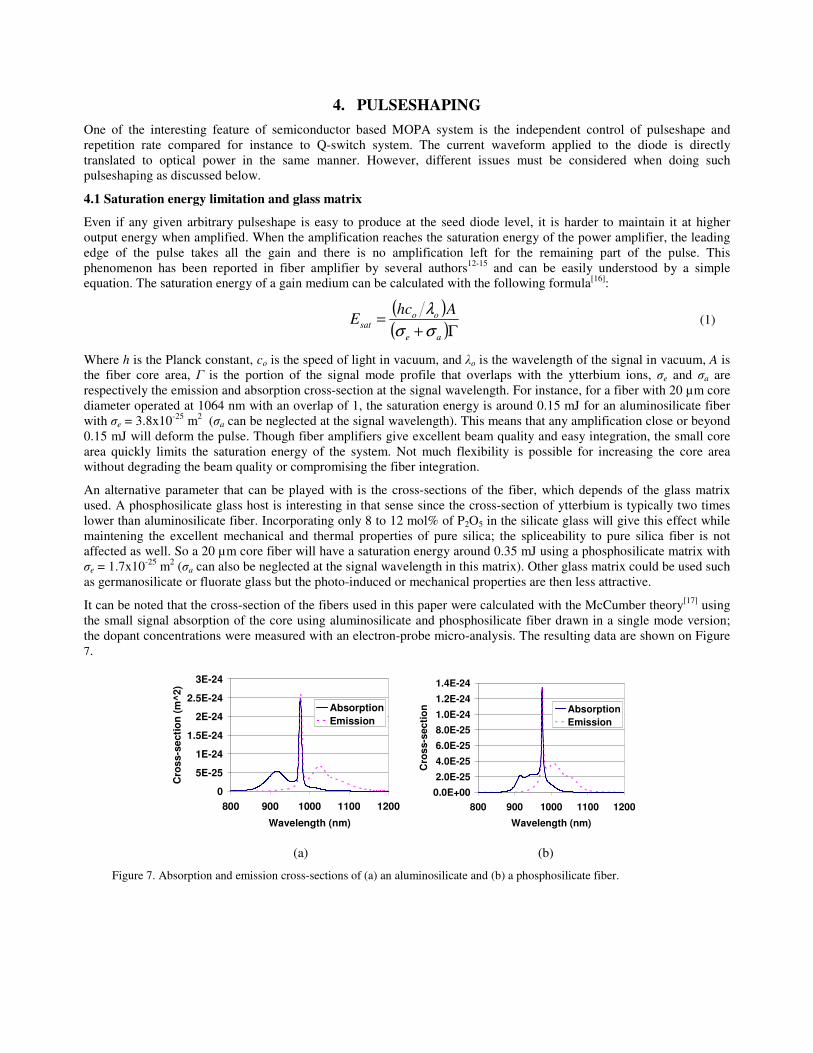
It can be noted that the cross-section of the fibers used in this paper were calculated with the McCumber theory[17] using the small signal absorption of the core using aluminosilicate and phosphosilicate fiber drawn in a single mode version; the dopant concentrations were measured with an electron-probe micro-analysis. The resulting data are shown on Figure 7.
0
5E-25
1E-24
1.5E-24
2E-24
2.5E-24
3E-24
800 900 1000 1100 1200
Wavelength (nm)
Cro
ss-s
ectio
n (m
^2)
AbsorptionEmission
0.0E+002.0E-25
4.0E-25
6.0E-25
8.0E-251.0E-24
1.2E-24
1.4E-24
800 900 1000 1100 1200
Wavelength (nm)
Cro
ss-s
ectio
n AbsorptionEmission
(a) (b)
Figure 7. Absorption and emission cross-sections of (a) an aluminosilicate and (b) a phosphosilicate fiber.

4.2 Enhanced pulseshaping with phosphosilicate fiber
From equation (1) and Figure 7, phosphosilicate fibers should have significant advantage in controlling the output pulseshape compared to other silicate fiber such as aluminosilicate because of their smaller cross-sections. This was investigated and verified with pulsed fiber amplifier simulations and experiments.
To simulate pulsed fiber amplifier, the software Photonics Workbench from the company Inspired Photonics[18] was used. This is a time-space dependent gain model based on a modified complex power algorithm that can simulate any fiber system from the dispersive femtosecond regime to CW operation. The software was validated internally over CW and pulsed fiber amplifier experiments and happened to adequately predict the results using a two manifolds system for ytterbium ions. The software was used to simulation the nanosecond pulsewidth and kHz repetition regime discussed in this paper with the 20µm/128µm core/cladding fibers diameter presented in the experimental configuration section. A typical pulsed simulation takes around 1 minute to conduct in this regime.
Additional parameters need to be determined for the simulation. The ytterbium concentration was calculated from the cladding absorption measurement and the cross-section measurement (Figure 7), considering a pump overlap factor proportional to the core/cladding area. The fluorescence lifetime was measured by strongly inverting the ytterbium ions of a 2 cm sample of singlemode fiber with 200 mW of pulsed pump power at 977 nm angle cleaved at the output and measuring the decays time from the side of the fiber with a temporal detector and oscilloscope. The overall simulation parameters are presented in Table 2. Background losses were neglected due to the short propagation length in the fiber amplifier.
Parameters Unit Hpa-Yb-20/130-01 Hpa-Yb-20/60/128-01 Glass matrix - aluminosilicate phosphosilicate
Core diameter µm 20.4 19.4 Core numerical aperture - 0.09 0.11
Cladding shape µm octagonal octagonal Flat-to-flat cladding diameter µm 130 128
Cladding absorption at 915 nm dB/m 3.5 8.1 Fluorescence lifetime ms 0.80 1.35
Ytterbium concentration ions/m3 0.47x1026 3.5x1026 Fiber length m 6.0 2.5 �e at 1064 nm m2 3.8x10⁻²⁵ 1.7x10⁻²⁵ �a at 915 nm m2 7.4x10⁻²⁵ 2.2x10⁻²⁵
Signal wavelength nm 1064 1064 Pump wavelength nm 915 915
Table 2. Simulation parameters for the two fibers used in the power amplifier
The amplification was made using a square pulse with 200 ns pulsewidth at a repetition rate of 20 kHz. The square pulseshape is shown on the upper-right corner of Figure 8-(a) and has a peak power of 0.8W. The pulses is pre-amplified to 180 mW average power and is launched into the power amplifier and amplified to 10W output power with around 17 W of pump power at 915 nm launched in co-pumping as illustrated on Figure 1. The resulting output pulseshapes of the 20 µm core aluminosilicate and phosphosilicate fibers are compared on Figure 8-(a) at 10W average output power. The simulations are in good agreement with the experimental data as shown in parallel on the same figure. It can easily be seen that the phosphosilicate fiber gives much less pulse deformation than the aluminosilicate as predicted by equation (1) and preserves more the initial pulseshape pre-defined by the user and also limit the output peak power.

�
�
�
�
�
��
��
��
� �� ��� ��� ��� ��� ���
�� �����
��� ������
���� ����������
������������
�
�
�
�
�
��
��
��
� �� ��� ��� ��� ��� ���
�� �����
��� ������
���� ����������
������������
(a) square input pulse (b) triangular input pulse
Figure 8. Comparison of the output pulseshape of a 20 µm core aluminosilicate versus a phosphosilicate fiber at an output power of 10W at 20 kHz repetition rate using (a) a 200 ns input square pulsewidth and (b) a 200 ns input triangular pulsewidth. The input pulseshape used for each case is shown on the upper-right corner of each figure. The simulated output profiles are juxtaposed to the experimental results showing that the phosphosilicate fiber reduces the output peak power and pulse deformation at higher energy even when pulseshaping is used with a triangular input pulseshape.
Pulse deformation and high peak power, as occurring on Figure 8-(a), can also be reduced by adaptive pulseshaping as presented by Vu and al.[12]. For instance, to decrease the output peak power, a triangular pulse can be used at the input of the amplifier as shown on the upper-right corner of Figure 8-(b) (note that a minimum fast rising edge is required to chirp the diode spectrum and reduce SBS). This kind of pulseshape is able to reduce the output peak power and get a resulting pulseshape that is more square shaped. Nevertheless, pulseshaping has limitation and phosphosilicate fibers are required to increase further the pulseshaping capabilities. As shown on Figure 8-(b), even with the triangular input pulseshape, the output pulseshape shows high peak power with the aluminosilicate fiber at 0.5 mJ output energy and deviates a lot from an output square pulse. Getting a low peak power square pulse at 0.5 mJ energy is not acheivable with the aluminosilicate fiber because the saturation energy is too low and pulse deformation cannot be avoided; a larger core diameter would then be necessary with lower beam quality. The phosphosilicate fiber is required to get an output square pulse at 0.50 mJ energy from a 20 µm core fiber. By decreasing pulse deformation and thus lowering the output peak power, stimulated Raman scattering is also decreased in the phosphosilicate fiber.
5. AMPLIFIER OPTIMIZATION Even if an optimal pulseshape and SBS free operation are reached, other system parameters are important such as a its long term reliability and easiness to package. Phosphosilicate fiber can play an important role once again as it did for pulseshaping since it is proven to be much more resistant to photodarkening than aluminosilicate fiber even at the higher ytterbium doping level[19]. The same behavior was observed in our experiment: even though the Hpa-Yb-20/60/128-01 has three times more absorption than the Hpa-Yb-20/130-01, its long term operation over 300 hours at 11W/40kHz/100ns reveals no photodarkening at all as shown on Figure 9-(a) compared to the Hpa-Yb-20/130-01 that showed 10% degradation. Furthermore, because of the higher saturation energy that gives less non linear effect from the reduced pulse deformation and lower peak power, phosphosilicate fiber can reached the same operating condition than aluminosilicate fiber using smaller core and higher NA while maintaining similar beam quality. For instance, a 20µm/0.11 NA phosphosilicate fiber can be used instead of a 30µm/0.075NA fiber to get the same pulse deformation. The higher NA gives a higher resistance to bending loss, as shown on Figure 9-(a), and allows using a smaller cladding diameter without getting micro-bending, which is easier to splice and package.
�
� �
� �
� �
� �
�
� ��� ��� ���
�������!�����
��� ������
�
� �
� �
� �
� �
�
� ��� ��� ���
�������!�����
��� ������

0
2
4
6
8
10
12
0 100 200 300 400
Time (hours)
Out
put p
ower
(W)
Phosphosilicate fiberAluminosilicate fiber
0
0.2
0.4
0.6
0.8
1
1.2
1.4
0 2 4 6 8 10
Coiling diameter (cm)
Ben
ding
loss
(dB
/m)
Aluminosilicate
Phosphosilicate
(a) (b)
Figure 9. (a) Long term test at average output power of 11W, repetition rate of 40kHz, and pulsewidth of 100 ns with the phosphosilicate fiber Hpa-Yb-20/60/128-01 and the aluminosilicate fiber Hpa-Yb-20/130-01 (b) Bending loss of a 15µm/0.13NA phosphosilicate fiber versus a 20µm/0.09NA aluminosilicate fiber.
Phosphosilicate fiber can further mitigate pulse deformation and non-linear effect by selecting the central signal wavelength. Double cladding amplifier has a standard emission bandwidth at wavelengths greater than 1040 nm[20] from 1060 to 1090 nm typically. As it can be seen on Figure 7, the aluminosilicate’s emission cross-section is quite constant in that range while the phosphosilicate’s can decrease by a factor of two from 1060 nm to 1090 nm. A lower cross-section can give the advantage to further increase the saturation energy of the system, which can be significantly done in phosphosilicate fibers by moving the signal wavelength to longer values. For instance, the amplification of a pulsed signal at 1068 nm versus 1074 nm was done in the phosphosilicagte fiber Hpa-Yb-20/60/128-01 to an output average power level of 15W at a repetition rate of 20 kHz with 200 ns square pulsewidth. The obtained output spectrum at maximum power is shown on Figure 10. SRS is 3% reduced by shifting the signal wavelength by only 6 nm to longer value due to the increase in saturation energy and thus lower output peak power. Therefore, phosphosilicate fibers increase further the threshold of SRS by its lower cross-section at longer wavelength. A trade-off of moving the signal wavelength toward 1090 nm is that a higher input power is required to saturate the amplifier. For instance, a 15 um core diameter phosphosilicate fiber operated at 1090 nm will required 1W of input signal instead of 200 mW at 1064 nm to efficiently amplify the signal to several watts output power without ASE. In addition, phosphosilicate fibers have a narrower emission bandwidth than aluminosilicate fiber, thus the emission cross-sections in the 1100 to 1150 nm wavelength range are much lower. Such a feature is desired to decrease the amplification of SRS as described by Wang[21]; nevertheless, we measured and reported in another paper[22] that for a fixed signal wavelength, no significant difference was measured in the SRS threshold between a phosphosilicate and aluminosilicate fiber; so the advantage of phosphosilicate fiber should come from the reduced cross-sections at the signal wavelength but not at the Raman wavelength.
Moreover, the higher ytterbium doping level of phosphosilicate fiber without increased photodarkening allows decreasing significantly the fiber length, which in turn decreases non-linear effects such as SRS. Typically, a phosphosilicate fiber can have three times more absorption at 915 nm as previously introduced with the Hpa-Yb-20/60/128-01 fiber versus the Hpa-Yb-20/130-01; thus three times less fiber length can be used and the SRS threshold can approximately be increased by a factor of three in the doped fiber. This factor of difference can still be higher with 975 nm pumping since for phosphosilicate fibers, the ratio of the peak absorption at 975nm compared 915nm is higher than in aluminosilicate (typically 6 instead of 5).

-80
-75
-70
-65
-60
-55
-50
-45
-40
-35
900 950 1000 1050 1100 1150 1200Wavelength (nm)
Pow
er s
pect
rum
(dB
)
1068 nm1074 nm
Figure 10. Comparison of the amplification of a signal at 1068 nm versus 1074 nm in a phosphosilicate ytterbium fiber showing
reduced SRS with the longer 1074 nm wavelength.
6. CONCLUSION
We presented different issues to consider and optimize in MOPA system with a current modulated semiconductor diode as the master oscillator and double cladding ytterbium fiber used for the power amplifier. For many applications where narrow linewidth is not required, a fast rising time waveform with high peak current enlarges the diode spectrum and increases the onset of SBS. It was demonstrated that the feedback of a FBG placed after the diode further enlarges the diode linewidth and increases the SBS threshold. This feedback is enhanced with a FBG located close to the diode with a large bandwidth and the feedback maintained in polarization-maintaining fiber. It was then demonstrated that phosphosilicate fibers increase the saturation energy level of the power amplifier due to lower emission cross-sections, which decreases pulse deformation and give a better control over the output pulseshape at high energying. It was then shown that phosphosilicate fiber allows three times more absorption at 915 nm, thus decreasing the onset of non-linear effects, while maintaining a photodarkening free operation, which gives a stable output power over time. With this fiber type, a lower core with higher NA could also be used to decrease bending losses, thus facilitates the packaging of the fiber and allowed the used of smaller cladding fiber with easier spliceability. It was shown further that the lower cross-section of phosphosilicate fiber decreases peak power and SRS, especially when the emission wavelength is shifted to longer wavelength.
7. ACKNOWLEDGEMENT We would like to acknowledge Antoine Bellemare from Laval University, Alain Villeneuve from Optav Solution, Michel Têtu from TeraXion, and Hägen Zimer from JT Optical for fruitful discussions; and also Bookham for providing seed diode samples.
REFERENCES
[1] Agrawal, G.P., [Nonlinear Fiber Optics], Academic Press, San Diego, (2001). [2] Derickson, D., [Fiber Optics Test and Measurement], Prentice-Hall, New Jersey, USA, (1998). [3] Cotter, D., "Transient stimulated Brillouin scattering in long single-mode fibres," Elec. Lett. 18 (12), 504-506 (1982). [4] Eskildsen, L., Hansen, P. B. , Grubb, S. G., Vengsarkar, A. M., Strasser, T. A., Alphonsus, J. E. J., DiGiovanni, D.
J., Peckham, D. W., Truxal, D., Cheung, W. Y., "465-km, 2.488 Cbit/s repeaterless transmission using a directly modulated DFB laser," OFC Tech. Digest, TuN8 (1996).
[5] Cotter, D., "Suppression of stimulated Brillouin scattering during transmission of high-power narrowband laser light in monomode fibre," Elec. Lett. 18 (15), 638-640 (1982).
[6] Willems, F. W., Muys, W., Leong, J. S., "Simultaneous Suppression of Stimulated Brillouin Scattering and Interferometric Noise in Externally Modulated Lightwave AM-SCM Systems," IEEE Phot. Tech. Lett. 6 (12), 1476-1478 (1994).

[7] Jez, D.R., Jackson, M.K., "Transmitter Power and Chirp Measurement for Quantitative Prediction of SBS Suppression,” Digest LEOS Summer Topical Meetings, IV51 (1999).
[8] Bronder, T. J., Shay, T. M., Dajani, I., Gavrielides, A., Robin, C. A., Lu, C. A., "SBS mitigation with ‘two-tone’ amplification: a theoretical model," Proc. of SPIE 6873, 68731R (2008).
[9] Tkach, R.W., Chraplyvy, A.R., "Regimes of Feedback Effects in 1.5-µm Distributed Feedback Lasers," J. Light. Tech. 4 (11), 1655-1661 (1986).
[10] Petermann, K., "External Optical Feedback Phenomena in Semiconductor Lasers," IEEE J. of Sel. Top. Quan. Elec. 1 (2), 480-489 (1995).
[11] Henry, C.H., Kazarinov, R., "Instability of semiconductor lasers due to optical feedback from distant reflectors," IEEE J. Quantum Electron. 22 (2), 294-301 (1986).
[12] Vu, K.T., Malinowski, A., Richardson, D. J., Ghiringhelli, F., Hickey, L. M. B., Zervas, M. N., "Adaptive pulse shape control in a diode-seeded nanosecond fiber MOPA system," Opt. Expr. 14 (23), 10996-11001 (2006).
[13] Schimpf, D. N., Ruchert, C., Nodop, D., Limpert, J., Tünnermann, A., Salin, F., "Compensation of pulse-distortion in saturated laser amplifiers," Opt. Expr. 16 (22), 17637-17646 (2008)
[14] Zervas, M. N., Durkin, M., Ghiringhelli, F., Vysniauskas, K., Hickey, L., Gillooly, A., Turner, P., Kao B., "High peak power, high rep-rate pulsed fibre laser for marking applications," Proc. SPIE 6102, 61020Q-1 (2006).
[15] He, F., Price, J.H.V., Vu, K. T., Malinowski, A., Sahu, J. K., Richardson, D. J., "Optimisation of cascaded Yb fiber amplifier chains using numerical-modelling," Opt. Exp. 14 (26), 12846-12858 (2006).
[16] Siegman, A. E., [Lasers], University Science Books, Sausalito, (1986). [17] Desurvire, E., [Erbium-doped fiber amplifier], John Wiley & Sons Inc., New York, (1994). [18] www.inspiredphotonics.com [19] Sahu, J. K., Yoo, S., Boyland, A. J., Basu, C. Kalita, M. P., Webb, A., Sones, C. L., Nilsson, J. Payne, D. N., "488
nm irradiation induced photodarkening study of Yb-doped aluminosilicate and phosphosilicate fibers," Proc. of CLEO/QELS, JTuA27 (2008).
[20] Paschotta, R., Nilsson, J., Tropper, A. C., Hanna, D.C., "Ytterbium-Doped Fiber Amplifiers," IEEE J. Quan. Elec. 33 (7), 1049-1056 (1997).
[21] Wang, Y., Xu, C.-Q. Po, H., "Analysis of Raman and thermal effects in kilowatt fiber lasers," Opt. Comm. 242, 487–502 (2004).
[22] Morasse, B., Chatigny, S., Desrosiers, C., Gagnon, E., Lapointe, M.-A., de Sando, J.-P., "Simple Design for Singlemode High Power CW Fiber Laser using Multimode High NA Fiber," Proc. SPIE 7195, 7195-4 (2009).