Embed Size (px)
Citation preview

Enhanced Requirements for IRRBB ManagementInsights from EY European IRRBB Survey 2016 for banks

ContentsExecutive summary . . . . . . . . . . . . . . . . . . . . . . . . . . . . . . . . . . 1
About this survey . . . . . . . . . . . . . . . . . . . . . . . . . . . . . . . . . . . 3
Governance roles and responsibilities . . . . . . . . . . . . . . . . . . . . 4
Metrics, modelling and methodology . . . . . . . . . . . . . . . . . . . . . 9
Stress and scenario testing . . . . . . . . . . . . . . . . . . . . . . . . . . . 20
Limits and capital framework . . . . . . . . . . . . . . . . . . . . . . . . . . 24
Data and systems . . . . . . . . . . . . . . . . . . . . . . . . . . . . . . . . . . . 27

1Enhanced Requirements for IRRBB Management Insights from EY European IRRBB Survey 2016 for banks
Historically, Interest Rate Risk in the Banking Book (‘IRRBB’) has been a risk to which many in the market have paid less attention compared to liquidity risk and credit risk. The Financial Crisis (which saw many banks suffer from basis risk crystallisation) and the subsequent extended period of low to negative interest rates has caused the market and supervisors to focus more heavily on IRRBB.
Supervisors have become concerned about the potential effects of rising rates in a market which has spent many years dealing with heavily compressed margins. Both the EBA and the BCBS have released new guidelines on IRRBB as well as national supervisors such as the PRA, and recently revisions to the CRD and CRR provisions for IRRBB have been consulted on.
The enhanced regulations have many things in common such as enhanced governance and controls over IRRBB including monitoring of IRR positions, the requirement to model a range of interest rate scenarios across all products, and the requirement to hold adequate capital against positions. In addition, Fundamental Review of the Trading Book has an impact on the types of risks that can be held in the banking book.
EY consider this to be the optimal time to conduct a Europe-wide survey of IRRBB as banks are under way in adapting their processes to the changes in regulation.
We surveyed 42 banks and building societies including G-SIBs, D-SIBs and Non D-SIBs of varying sizes across nine countries to understand their approach to IRRBB management. Three key themes emerged from the results:
1. Governance and Controls: the supervisory guidance places much emphasis on the governance framework around IRRBB and it was clear that most banks have both a formal IRRBB Policy along with a relevant IRRBB risk appetite. We did note however that despite many banks modelling a range of metrics, it was typically some of the more traditional metrics of PV200 and Interest Rate Gap that had formal limits set against them with far fewer banks monitoring NII or EaR limits.
2. Metrics and Methodology: we noticed a wide range of metrics being calculated for IRRBB but significant variance across jurisdictions with countries like Germany, Switzerland and France preferring PV metrics or VaR and limited use of NII or other earnings based metrics. This is also true when considering the banking model with traditional investment banks (even with large banking book positions) preferring VaR type modelling.
We noticed the use of dynamic modelling to be relatively limited, especially across some of the smaller banks but even in some larger G-SIBs. Recent supervisory guidelines have included a focus on banks’ ability to understand how balance sheet projections
Executive summary

2 Enhanced Requirements for IRRBB Management Insights from EY European IRRBB Survey 2016 for banks
change under different scenarios and how customer behaviours may change in different circumstances. It is clear that use of dynamic assumptions around pre-payments, balance sheet growth assumptions and the behaviour of retail depositors is still in early stages and has the potential to be a cause of focus in future supervisory reviews. We were surprised to note that monitoring of basis risk (particularly among D-SIBs) was not extensive which we consider to be a cause for concern for supervisors.
Finally we found practices for the ‘profiling’ of Non-Dated items to be worthy of note. Most respondents reported that average duration for equity was 2.5 to 5 years. However when we consider the profiles of non-dated customers we found a range of approaches often correlated to the size of the bank. G-SIBs for example were more likely to assume longer average durations (often longer than five years) versus smaller banks. Those banks relying on longer durations for retail deposits will need to support those assumptions with underlying data and observations and the results of the survey show that the use of extensive statistical analysis of depositor behaviour is limited.
Executive summary
3. Data and Systems: we asked banks about their use of data and models for the management of IRRBB. We found the use of vendor models for the calculation of IRRBB to be extensive even amongst very small banks. Larger banks, especially G-SIBs appear to be relying more on their own proprietary models along with vendor solutions. We found that many of the larger banks rated themselves lower than smaller banks in their ability to accurately capture the interest rate risk of all products, and to reconcile IRRBB data with the balance sheet. We consider the ability to accurately and completely capture product data to be one of the key impediments to banks’ ability to calculate IRRBB under a range of scenarios and assumptions. This is particularly evident amongst larger banks with multiple source systems.

3Enhanced Requirements for IRRBB Management Insights from EY European IRRBB Survey 2016 for banks
Over a period of six months, we surveyed 42 banking entities across nine countries in Europe for the EY European Interest Rate Risk Survey 2016. The aim was not only to identify practices in the larger banking groups but to identify practices within banks of varying sizes and scope of activities across a number of different countries. The participants include 13 banks designated as global systemically important banks (G-SIBs), 14 domestically systemically important banks (D-SIBs) as well as 15 smaller banks (non D-SIBs). The scope of activities and services range from globally active full-scope banking groups covering a range of retail and non-retail banking activity through to domestic only retail banks and building societies. We have also captured a number of so called ‘challenger banks’ in the survey.
Given the sensitive nature of much of the content, the majority of participants requested we do not reveal their names. We can confirm that a significant number of banks from France, UK, Germany, Switzerland and Italy participated including many of those countries’ largest institutions. In addition, several banks from across the Nordics, Spain and continental Europe also took part.
In order to populate the report we circulated copies of the excel-based survey to the participants which included a mixture of multi-choice and free-form questions designed to balance ease of participation and aggregation and completeness of answers recognising the fact that some answers to some questions required greater qualitative narrative. In some cases we followed up (either via meeting or email) on the survey with additional questions of clarification.
The survey is structured across five key topics:
1. Governance, Roles and Responsibilities
2. Metrics, Modelling and Methodology
3. Stress and Scenario Testing
4. Limits and Capital Framework
5. Data and Systems
The objective is to provide banking book interest rate risk management benchmarks on a European level to support peer comparisons.
This report will be shared amongst participating banks.
About this survey

Governance roles and responsibilities

5Enhanced Requirements for IRRBB Management Insights from EY European IRRBB Survey 2016 for banks
Sections one and two of the survey relate to the organisational structure and governance and risk appetite framework.
1.1 to 1.5
The purpose of the first part of the survey is to capture the scope and structure of participants in order to define appropriate benchmarks throughout the survey. Questions relate to balance sheet size (including banking book balance sheet), firm categorisation (G-SIB, D-SIB, non D-SIB) as well as scope of activities.
Based on the information gathered we consider it to be appropriate to divide the participants into the following categories:
14
1315 G-SIB
D-SIB
Non D-SIB
Firm category
Country of headquarters
118
6
5
5
7
France
UK
Italy
Germany
Switzerland
Other
1.6 How many employees (full-time equivalents) are dedicated to interest rate risk management?
Unsurprisingly the number of FTE dedicated to IRRBB is largely driven by the size and scope of the organisation. For GSIBs with significant balance sheet and global reach the FTE number is over 20 with roughly 40% of those banks employing more than 50 people dedicated to IRRBB management.
For D-SIBs the number is between 5–20 and for the smaller non D-SIBs 70% have five people or less focused on this risk.
0%
10%
20%
30%
40%
50%
60%
70%
G-SIB D-SIB Non D-SIB
Less than 5 5 to 9 10 to 20 21 to 50 50+ Not disclosed
1.7 What would you consider to be the main risk to your organisation?
We expected the majority of banks to answer this question as falling or flat rates being the biggest risk posed due to further compression of already squeezed margins. As illustrated in the chart below, for the majority of respondents this was the case however a small number reported the reverse.
On investigation, of the five banks that highlighted rising rates as the main threat are all non D-SIBs or D-SIBs, from France, Germany and Italy including some specialist lenders that may be more restricted in their ability to re-price assets.
Number of IRRBB FTE
Bank categorisation
Country

6 Enhanced Requirements for IRRBB Management Insights from EY European IRRBB Survey 2016 for banks
12%
12%
61%
83%
2%
10%
0%
81%
14%
5%
5%
5%Best outcome
Secondworst outcome
Worstoutcome
High/rising interest rates Low/falling interest ratesFlat rates Not disclosed
2.1 Which committee/body has primary oversight of IRRBB?
We found across all sizes of bank and all jurisdictions that roughly 70% identify the ALCO (or similar) governance committee as the primary committee responsible for IRRBB. In almost all cases the alternative is a Board Risk Committee or Executive Risk Committee (or similar).
0% 20% 40% 60% 80% 100%
G-SIB
D-SIB
Non D-SIB
ALCO Executive Management Committee
BSM Committee Risk CommitteeBoard
Primary oversight committee
This split is also reflective of where the day-to-day management of IRRBB sits with roughly a 70/30 split between Treasury and Risk. For those banks where the primary oversight is within Risk, it is important to ensure there is proper 1st and 2nd line of defence division.
2.2 Is IRRBB management centralised or decentralised
It was also clear that the decision on a centralised vs. de-centralised structure is highly dependent on scale and geographical reach with G-SIBs slightly favouring a decentralised approach, D-SIBs and Non D-SIBs with a smaller scale almost exclusively favouring a centralised structure.
0%10%20%30%40%50%60%70%80%90%
100%
All G-SIB D-SIB Non D-SIB
Centralised Decentralised
Centralised vs. decentralised
2.3 If decentralised, how is it organised?
2.4 In accordance with the organisation, who does IRRBB management report to?
We did not find that geographical location of the parent had any impact on these broad splits.
2.5 Does the firm set a formal risk appetite statement for IRRBB?
2.6 Does the firm have a formal IRRBB Policy?
We found that roughly 90% of participants have a formal IRRBB risk appetite and IRRBB Policy. Of the four banks without a risk appetite statement for IRRBB, one is in the process of developing one. Three of the four are either G-SIBs or D-SIBs. Supervisors would normally expect most banks, especially systemically important banks to have a Board-set risk appetite statement for IRRBB given that it is often a material risk for banks.
2.7 Does the IRRBB perimeter include all assets and liabilities within the Banking Book?
14% of banks across different jurisdictions and firm categorisation do not include all banking book assets in the IRRBB perimeter. On investigation half of those exclude non-interest bearing liabilities, and half exclude defaulted loans and non-financial assets.
Governance roles and responsibilities

7Enhanced Requirements for IRRBB Management Insights from EY European IRRBB Survey 2016 for banks
2.8 Does your IRRBB framework provide an internal developed model or an external vendor-supported model?
We found that all the respondents make use of vendor models for some elements of IRRBB risk management. Around half of the banks surveyed combine the use of an external vendor-supported model with internal models/EUCs. Although there is no supervisory requirement to use externally developed models, the models must be able to capture key elements of product IRRBB.
When we investigated this we found that the larger G-SIBs were more advanced in their development of their own ALM models.
31%
31%
38%External vendor model
Internally developed
Both
External vendor model
Internally developed
Both
14%
21%
64%
External vendor model
Internally developed
Both
47%
7%
47%
ALM model development (G-SIB)
ALM model development (D-SIB)
ALM model development (Non D-SIB)
2.9 How does your bank make use of its ALM model/ALM System?
The use of the ALM models (internally or externally developed) is broad with almost all banks use these models for the monitoring and reporting of positions versus IRRBB limits, for stress testing and planning and forecasting.
Use of ALM models
0% 10% 20% 30% 40% 50% 60% 70% 80% 90% 100%
Calculate reg capital
Calculate economic capital
IRRBB ALCO Limit Reporting
Planning and forecasting
Calculate FTP rates/deals
Aid BSM strategy
Stress testing
Governance roles and responsibilities

8 Enhanced Requirements for IRRBB Management Insights from EY European IRRBB Survey 2016 for banks
36%
2%29%
14%
10%
7%
2%
Annual
Daily
Monthly
Other
Quarterly
Ad-hoc
Half-Yearly
Only a small minority of banks use the models for the calculation of supervisory capital. A number of conclusions can be drawn from this, namely that complex dynamic calculations are not used for the calculation of supervisory capital with most banks using a simpler methodology. These splits are fairly consistent across sizes of banks although interestingly the percentage of D-SIBs using their models for the calculation of supervisory capital doubles to around 40%.
2.10 With what frequency are models subject to formal review and update?
Around 80% of all banks formally review their models on an annual cycle.
2.11 On what frequency are IRRBB hedge strategies subject to formal review and updated?
The formal review cycle of hedging strategies tends (65%) to be on either an annual or monthly frequency split evenly between the two. The choice between annual or more frequent review
surprisingly does not alter much depending on the size of bank, range of activities or geographical location. We did note a slight tendency for G-SIBs to review strategy more often than smaller banks.
In one case the strategy was reviewed daily and in one case was not formally reviewed at all!
Governance roles and responsibilities
Frequency of hedge strategy review

9Enhanced Requirements for IRRBB Management Insights from EY European IRRBB Survey 2016 for banks
Metrics, modelling and methodology

10 Enhanced Requirements for IRRBB Management Insights from EY European IRRBB Survey 2016 for banks
The next section of the survey is concerned with the metrics and modelling approaches used by banks to calculate, monitor and report IRRBB.
3.1 Which of the following IRRBB metrics are monitored?
We found most banks rely on a range of metrics for the calculation of IRRBB.
IRRBB metrix monitored
Frequency of monitoring
0% 10% 20% 30% 40% 50% 60% 70% 80% 90% 100%
NIIEaREVEVaR
PV0/PVBPPV
Interest Rate Gap
The top three metrics used across banks are the interest rate gap, a PV200, PVBP or PV01 valuation based approach and NII, and almost all banks used these metrics.
The use of VaR is almost non-existent amongst non D-SIBs which is not surprising given the traditional use of VaR to monitor traded market risk. Similarly, EVE approaches tend to be used by G-SIB and D-SIB banks.
Metrix G-SIB D-SIB Non D-SIB
NII 85% 79% 80%
EaR 38% 29% 20%
EVE 46% 71% 53%
VaR 69% 79% 13%
PV01/PVBP 77% 86% 67%
PV200 85% 86% 87%
Interest rate gap 85% 86% 67%
We found significant differences across jurisdictions however. Looking at the table below we note NII used extensively in most locations except France and Germany where a PV01/PV200 is preferred. EaR is not used at all in France and not significantly in any other jurisdiction except Switzerland. VaR is used extensively in Germany and Switzerland and quite extensively in the UK but France and Italy do not use it.
Metrix France UK Italy Germany Switzerland Other
NII 64% 88% 100% 67% 100% 80%
EaR 0% 38% 29% 33% 60% 40%
EVE 27% 63% 71% 50% 100% 60%
VaR 9% 63% 29% 100% 80% 80%
PV01/PVBP 64% 88% 43% 83% 100% 100%
PV200 82% 75% 86% 100% 80% 100%
Interest rate gap
91% 75% 57% 83% 80% 80%
The EBA and BCBS guidance requires banks to use an appropriate range of metrics for managing IRRBB including earnings and value based metrics.
3.2 on what frequency are these metrics monitored and reported?
Metrics such as NII, Gap report and PV200, where used, are typically calculated and monitored on a monthly basis whereas PV01 and VaR is typically monitored daily. We found where other frequencies are used, they tend to be for those metrics which are not the primary IRRBB metrics monitored.
0% 10% 20% 30% 40% 50% 60% 70% 80% 90% 100%
NIIEaREVEVaR
PV01/PVBPPV200
Interest Rate Gap
Daily Weekly Monthly
Quarterly Half Yearly Annually
N/A or not disclosed
Metrics, modelling and methodology

11Enhanced Requirements for IRRBB Management Insights from EY European IRRBB Survey 2016 for banks
3.3 Is the IRRBB measurement for each metric based on Static (Re-investment), Dynamic, or Run-off measurement?
A key area of consideration within the EBA/BCBS guidance updates in 2015 and 2016 respectively has been the use of dynamic assumptions in relation to projections. These questions focus on the use of dynamic assumptions for the different metrics.
As shown in the chart below, across all banks we found that dynamic assumptions are typically only used for earnings based approaches such as EaR or NII whereas for the Interest rate Gap and value-based approaches, a run-off is typically used.
0% 20% 40% 60% 80% 100%
NII
EaR
EVE
VaR
PV01/PVBP
PV
Interest Rate Gap
Dynamic Runoff Static N/A or not disclosed
If we break this down further by type of firm we can see that whereas roughly 40% of all firms use some sort of dynamic assumptions, only 25% of Non D-SIBs do.
3.4 Where dynamic measurement is used, which component(s) are dynamic?
Across the board we found that the figures support the analysis above that dynamic assumptions are largely reserved for earnings measures. We also note the relatively limited use of dynamic assumptions by smaller firms.
Those banks that do use dynamic assumptions tend to use the top three (Interest Rates, Volumes and Behavioural assumptions). Surprisingly we noted a wider use of dynamic assumptions amongst the D-SIBs. Where smaller non D-SIBs do use dynamic assumptions (rarely) these tend to be Interest Rates and Volumes.
Dynamic, static or run-off
G-SIB use of dynamic assumptions
D-SIB use of dynamic assumptions
Non D-SIB use of dynamic assumptions
Metrics, modelling and methodology
0
1
2
3
4
5
6
7
Interest rates Liquidity spread Credit spread Volume
Hedging strategies Behavioural curves Other
NII EaR EVE VaR PV01 PV200 IRR GapPVBP
0
1
2
3
4
5
6
Interest rates Liquidity spread Credit spread Volume
Hedging strategies Behavioural curves Other
NII EaR EVE VaR PV01 PV200 IRR GapPVBP
Interest rates Liquidity Spread Credit Spread Volume
Hedging Strategies Behavioural Curves Other
0
1
2
3
4
5
6
NII EaR EVE VaR PV01 PVBP PV200 IRR Gap

12 Enhanced Requirements for IRRBB Management Insights from EY European IRRBB Survey 2016 for banks
3.5 What type of discount rate/curve is applied? Does the model provide different rates/curves for different types of assets/liabilities, segments, products? (i .e ., instrument specific curves).
Across all banks roughly 20% use instrument specific curves with the remainder almost exclusively using currency swap-curves (G8 and CHF). However when we looked at the smaller non D-SIB banks the number able to differentiate between products was only 7% of the total.
3.6 Where New Business (volume growth) assumptions are used, are they scenario specific (i.e., dependent on rates)?
Balance sheet volumes and customer balances can either be kept static, run off or subject to growth assumptions (new business). We found that 62% of all banks surveyed use new business volume assumptions when calculating IRRBB. Of those modelling new volumes, across all banks roughly 26% will vary the new business growth depending on the interest rate scenario modelled. The chart below shows that smaller banks are less likely to model dynamic volumes than larger ones.
Volumes rate dependent
However, when we consider country specific figures we can see that Germany and Switzerland pull up the average across banks considerably and banks in the other jurisdictions are closer to 15% dynamically modelling volumes based on rate movements.
3.7 Do you have assumptions regarding product migration, and if so, are they static or dynamic?
Product migration assumptions can be used to project customers moving from one type of product to another over time (e.g., fixed rate products to variable rate etc.) and dynamic assumptions
are sometimes used. In our experience we find that this type of analysis is often complicated as it involves separating business forecasts into new customers and migrating customers which is not often the way these projections are done.
We found that only half of the banks surveyed consider product migration as part of their modelling. G-SIBs and D-SIBs that do use migration assumptions tend to use dynamic assumptions whereas smaller banks use static assumptions.
0%10%20%30%40%50%60%
G-SIB D-SIB Non D-SIB
Volumes driven by rates Volumes not driven by rates
Volumes changes not modelled
0% 20% 40% 60% 80% 100%
G-SIB
D-SIB
Non D-SIB
Dynamic product migration Static product migration
Migration not modelled
Product migration
3.8 Is Basis Risk captured in your modelling?
Most banks (60%) capture and model basis risk. We were surprised to see that a large proportion of D-SIBs were not capturing basis risk in their calculations. The practice was more common in the UK (100%) and Germany (80%) than in the other regions. EBA and BCBS guidelines make specific reference to capturing basis risk.
Basic risk modelling
0% 20% 40% 60% 80% 100%
G-SIB
D-SIB
Non D-SIB
Model basis risk Do not model basis risk
Metrics, modelling and methodology
13Enhanced Requirements for IRRBB Management Insights from EY European IRRBB Survey 2016 for banks
Equity 3.9 Is Own Equity included in your modelling?
The next part of the survey focused on the inclusion of assumptions around equity in IRRBB calculations. EBA and BCBS guidelines differ in their proposed treatment of equity for the purposes of the supervisory standard shocks.
Some banks choose to show assumptions that equity has a medium to long-term duration and choose to ‘invest’ this position in longer dated assets to manage earnings volatility
0% 20% 40% 60% 80% 100%
G-SIB
D-SIB
Non D-SIB
Equity Modelled Equity Not Modelled
Modelled equity
We were surprised to note that relatively few of the D-SIBs use equity assumptions in their modelling and therefore we wanted to investigate this by country.
The chart below shows some significant variances in approach between the countries across all bank sizes. Banks in France, UK and Switzerland all tend to model equity whereas in Germany, Italy and the other countries this was not a practice used at all.
Modelled equity (by country)
0% 20% 40% 60% 80% 100%
France
UK
Germany
Italy
Switzerland
Other
Equity modelled Equity not modelled
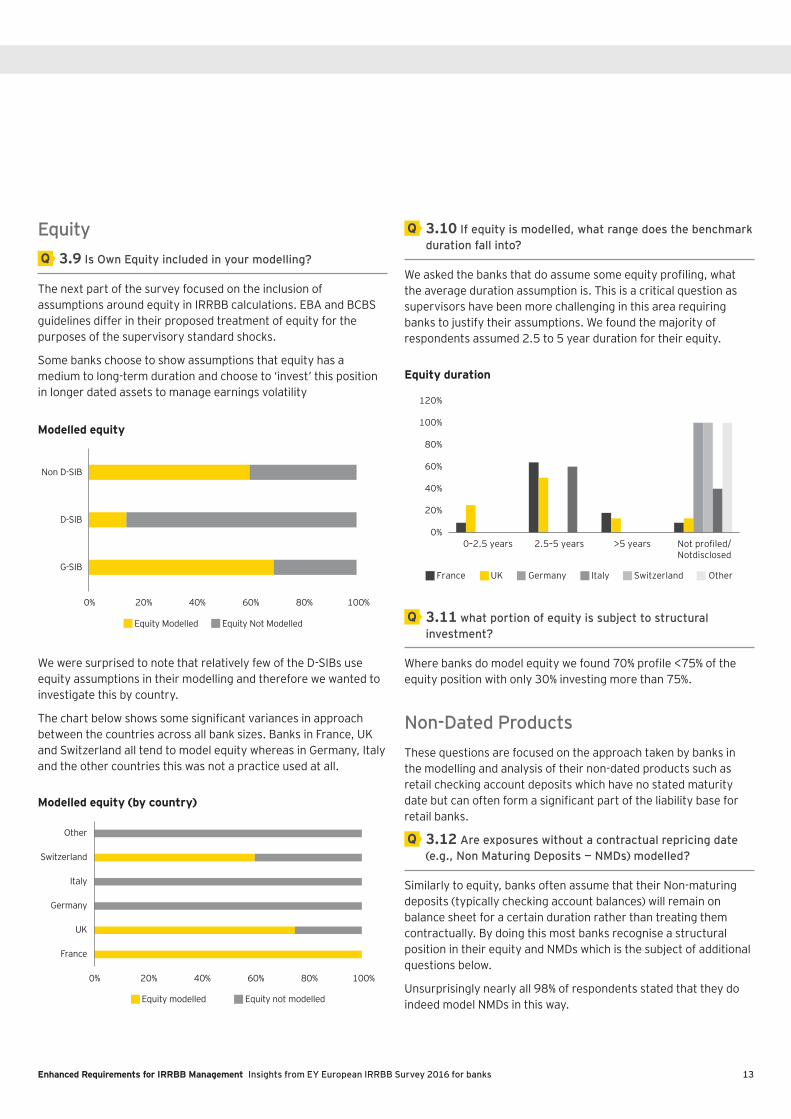
3.10 If equity is modelled, what range does the benchmark duration fall into?
We asked the banks that do assume some equity profiling, what the average duration assumption is. This is a critical question as supervisors have been more challenging in this area requiring banks to justify their assumptions. We found the majority of respondents assumed 2.5 to 5 year duration for their equity.
Equity duration
3.11 what portion of equity is subject to structural investment?
Where banks do model equity we found 70% profile <75% of the equity position with only 30% investing more than 75%.
Non-Dated ProductsThese questions are focused on the approach taken by banks in the modelling and analysis of their non-dated products such as retail checking account deposits which have no stated maturity date but can often form a significant part of the liability base for retail banks.
3.12 Are exposures without a contractual repricing date (e .g ., Non Maturing Deposits — NMDs) modelled?
Similarly to equity, banks often assume that their Non-maturing deposits (typically checking account balances) will remain on balance sheet for a certain duration rather than treating them contractually. By doing this most banks recognise a structural position in their equity and NMDs which is the subject of additional questions below.
Unsurprisingly nearly all 98% of respondents stated that they do indeed model NMDs in this way.
Metrics, modelling and methodology
0%
20%
40%
60%
80%
100%
120%
0–2.5 years 2.5–5 years >5 years
France UK Germany Italy Switzerland Other
Not profiled/Notdisclosed

14 Enhanced Requirements for IRRBB Management Insights from EY European IRRBB Survey 2016 for banks
3.13 In relation to core/non-core splits and behavioural life, how are these determined?
Banks tend to determine a core vs. non-core of deposits they consider should be modelled in this way with the non-core element usually considered to be more transient. Once the core element is determined, banks will then consider what the duration should be (i.e., the behaviourally adjusted duration).
The modelling of behavioural lives and core/non-core split is often a complicated one involving a both management judgement and qualitative techniques.
The chart below shows the techniques banks tend to use for modelling NDMs this way. The chart shows that most banks use some element of quantitative or statistical approach with only four or five preferring a solely qualitative approach. It was surprising to see a G-SIB UK bank using a solely qualitative approach to the determination of the behavioural life of its NMDs.
Quant + Qual Quantitative Statistical
Non disclosed Qualitative Replicating portfolio
26%
17%
24%
17%
5%
7%
17%
14%
10%
12%
19%
33%
Core/non core
Behavioural life
Core/non-core and behavioural lives
3.14 Are assumptions relating to core/non-core splits and behavioural life static or dynamic?
As with previous questions on dynamic assumptions, the majority of banks surveyed (who answered this question) do not use dynamic assumptions for determining the split of core and non-core deposits, instead assuming the same splits prevail under a range of interest rate scenarios.
Core vs. non-core splits (dynamic or static)
62%
57%
12%
17%
5%
5%
21%
21%Across interestrate scenarios
Within sameinterest rate
forecast horizon
Static Dynamic Combination Not Disclosed
We note that the percentage using dynamic assumptions is similar across all bank types.
3.15 With specific reference to Non Maturing Deposits, how many clusters are in place for modelling?
As expected, the number of clusters was correlated to the size and scope of the banks surveyed. The larger banks with multiple geographical locations tend to have a larger number of clusters than smaller banks. However we found it rare for banks to model more than 10 clusters even for the G-SIBs.
0%
10%
20%
30%
40%
50%
60%
70%
10–20 Clusters 5–10 Clusters 1–5 Clusters Not dsclosed
G-SIB D-SIB Non D-SIB All
NMD modelling clusters
Metrics, modelling and methodology

15Enhanced Requirements for IRRBB Management Insights from EY European IRRBB Survey 2016 for banks
3.16 If you apply a replicating portfolio approach, for what product sets does this apply?
A number of banks in Q 3.13 stated they use a replicating portfolio approach and 3.15 to 3.23 are designed to focus on the approach used for the different products.
On the whole, roughly half the banks surveyed use a replicating portfolio (such as interest rate swaps) in relation to their demand deposits but only a very small proportion use such an approach in relation to other products.
12% 88%Mortgages
14% 86%Credit cards
17% 83%Revolver loans
45% 55%Demand deposits
19% 81%Retirement savings
48% 52%Low Interest savings
12% 88%Money market
17% 83%Custody accounts
7% 93%Cash Management accounts
0% 100%Settlement accounts
Yes No
Use of replicating portfolio
For the purposes of this survey we have therefore decided to focus on Demand Deposits (including Checking Accounts) and Low Interest Savings accounts for analysis.
3.17 What is the primary goal of the replication (if applicable)?
The purpose most banks gave for using such an approach was either to meet supervisory requirements, reduce interest rate gaps and to minimise volatility of earnings (typically by producing a replicating portfolio to match the liability cashflows thus reducing volatility of Net Interest Income). The breakdown is as follows:
17%
33%
50%Reg Requirements
Funding Interest Rate Gaps
Minimise Volatility of Margin
3.18 What Instruments are used for to replicate the portfolio?
Of those using replicating portfolios, a number of different instruments and strategies were disclosed including the use of caps and floors, synthetic deposits and money market instruments but we found the most common instruments are interest rate swaps (and in some case swaptions) used to match the cashflows of the profiled deposits.
Purpose of replicating portfolio
Instruments to replicate portfolio
3.19 What is the underlying time horizon for simulations to estimate the replication strategy?
This question focuses on the time period for analysis (e.g., a look-back period for historical data). Most respondents stated that 10–20 years was appropriate with some others using a shorter period.
Metrics, modelling and methodology
11%
70%
19%
Government Bonds
Interest Rate Swaps
Other

16 Enhanced Requirements for IRRBB Management Insights from EY European IRRBB Survey 2016 for banks
3.20 Are dynamic revenue scenarios analysed?
Only four participants confirmed that dynamic revenue scenarios are considered.
Time horizon
Durations of replicating portfolios
3.21 What is the average duration of the replication portfolios for the actively managed products?
As described above, there are only a very small number of respondents using replicating portfolios for products other than demand deposits, checking accounts and low interest savings accounts so we have focused the analysis on these products and combined the results.
We found very few respondents calculating average durations for these products of greater than five years, and most are three months to three years. We also found that the Non D-SIBs that took part rarely use this type of replicating process and where they do, average durations are very short.
3.22 For sight deposits with maturities <30 days, is contractual maturity considered?
Only one third of participants consider contractual maturity as part of their analysis for sight deposits <30 days.
3.23 How often are volume adjustments implemented in replication models?
Most respondents adjust the volumes in their replicating portfolios annually with a third preferring a monthly volume adjustment approach.
Volume adjustments calculations
Managed rate productsThe next set of questions focuses on the approach taken by participants to the modelling of managed rate products (i.e., products that do not automatically re-price with rates but where the banks have scope to decide what proportion of rate movements are passed-on to customers).
3.24 What factors are taken into account when determining the pass-through rates in relation to Managed Rate products?
Most respondents indicated they used either their corporate planning targets or a statistical approach using historical data to determine the pass-through rate factors on their managed products. A small number use a different approach.
0%
10%
20%
30%
40%
50%
60%
Less than 5 5 to 9 10 to 20 21 to 30
0%
10%
20%
30%
40%
50%
60%
70%
>5 yrs 4–5 yrs 3–4 yrs 2–3 yrs 1–2 yrs 3–12months
<3 months
G-SIB D-SIB Non D-SIB
0%
10%
20%
30%
40%
50%
60%
Ad-hoc Annual Monthly
Metrics, modelling and methodology

17Enhanced Requirements for IRRBB Management Insights from EY European IRRBB Survey 2016 for banks
Pass-through methodology
Prepayment methodology — all
Prepayment methodology — GSIBs
Prepayment methodology — DSIBs
Prepayment methodology — non D-SIBs
3.25 Where Managed rate products are subject to pass-through rates, are they the same or different across product sets?
The majority of respondents (72%) use a different approach across different product sets.
Fixed rate productsThe final product set for analysis is Fixed Rate products. The focus area here is the assessment of behaviourally adjusted duration for these products including the use of pre-payment assumptions.
3.26 How do you treat Fixed Rate maturity products with an element of customer optionality (e.g., Prepayment)?
Roughly half (52%) of participants use some form of behavioural assumptions for assessing pre-payments in mortgages. This number increases to over 70% of G-SIB respondents. A small number also calculate pre-payment curves for loans and deposits.
Amongst D-SIBs and non D-SIBs, the use of behavioural re-pricing assumptions is much lower with many preferring to use contractual or static payment curves, although surprisingly we noted that just under 50% of non D-SIBs did report using behavioural pre-payment curves for mortgages.
24%
8%
35%
18%
10%
6%
Statistical approach
Lagged passthrough
Cap/floor mechanism
Other
Corporate planning targets
Central bank vs. funding benchmark spread
0% 20% 40% 60% 80% 100%
Mortgates
Loans
Deposits
Hold static Contructual Behavioural N/A
0% 20% 40% 60% 80% 100%
Mortgates
Loans
Deposits
Hold static Contructual Behavioural N/A
Hold Static Contructual Behavioural N/A
0% 20% 40% 60% 80% 100%
Mortgates
Loans
Deposits
Hold static Contructual Behavioural N/A
0% 20% 40% 60% 80% 100%
Mortgates
Loans
Deposits
Metrics, modelling and methodology

18 Enhanced Requirements for IRRBB Management Insights from EY European IRRBB Survey 2016 for banks
We would expect supervisors to require banks with significant levels of pre-payments or volatility of prepayment rates under different scenarios to capture this as part of their IRRBB management.
3.27 Where adjustment to contractual maturities is applied to fixed-dated products with optionality, how are those adjustments calculated?
Only a small number of respondents use regression analysis with most preferring an analysis of historical cohorts to assess how they perform. Unsurprisingly smaller D-SIBs and Non D-SIBs more often use a qualitative approach with the G-SIBs preferring a statistical approach.
Behavioural adjustment methodology
Mortages
Loans
Deposits
3.28 Are prepayment curves for fixed-rate products static or dynamic?
Around 50% of respondents stated they have pre-payment curve calculations for these products with the majority using static curves, particularly against static rates (i.e., same rate scenario). Only one respondent indicated they use combination approach.
If we consider this in the context of the size and scope of the banks we can see that, unsurprisingly, smaller banks are more likely to use static prepayment curves particularly within the same interest rate scenario.
Static or dynamic curves — mortages
0% 20% 40% 60% 80% 100%
G-SIB
D-SIB
Non D-SIB
Regression analysis Historical cohort analysis Qualitative approach
68% 32% 0%
52% 44% 4%
Within sameinterest
rate forecast horizon
Across interest rate scenarios
Static Dynamic Combination
Within sameinterest
rate forecast horizon
Across interest rate scenarios
70% 26% 4%
65% 35%
Static Dynamic Combination
5%
Within sameinterest
rate forecast horizon
Across interest rate scenarios 47%
79% 21% 0%
47%
Static Dynamic Combination
0%
10%
20%
30%
40%
50%
60%
GSIB D-SIB Non D-SIB
Static Dynamic
With
in in
tere
st
rate
sce
nario
Acr
oss
inte
rest
ra
te s
cena
rios
With
in in
tere
st
rate
sce
nario
Acr
oss
inte
rest
ra
te s
cena
rios
With
in in
tere
st
rate
sce
nario
Acr
oss
inte
rest
ra
te s
cena
rios
Metrics, modelling and methodology

19Enhanced Requirements for IRRBB Management Insights from EY European IRRBB Survey 2016 for banks
Static or dynamic curves — loans Static or dynamic curves — deposits
GSIB D-SIB Non D-SIB
Static Dynamic
0%
10%
20%
30%
40%
50%
60%
With
in in
tere
st
rate
sce
nario
Acr
oss
inte
rest
ra
te s
cena
rios
With
in in
tere
st
rate
sce
nario
Acr
oss
inte
rest
ra
te s
cena
rios
With
in in
tere
st
rate
sce
nario
Acr
oss
inte
rest
ra
te s
cena
rios
GSIB D-SIB Non D-SIB
Static Dynamic
With
in In
tere
st
rate
sce
nario
Acr
oss
Inte
rest
ra
te s
cena
rios
With
in In
tere
st
rate
sce
nario
Acr
oss
Inte
rest
ra
te s
cena
rios
With
in In
tere
st
rate
sce
nario
Acr
oss
inte
rest
ra
te s
cena
rios
0%5%
10%15%20%25%30%35%40%45%
With
in in
tere
st
rate
sce
nario
Acr
oss
inte
rest
ra
te s
cena
rios
With
in in
tere
st
rate
sce
nario
Acr
oss
inte
rest
ra
te s
cena
rios
With
in in
tere
st
rate
sce
nario
Acr
oss
inte
rest
ra
te s
cena
rios
Metrics, modelling and methodology

20 Enhanced Requirements for IRRBB Management Insights from EY European IRRBB Survey 2016 for banks
Stress and scenario testing

21Enhanced Requirements for IRRBB Management Insights from EY European IRRBB Survey 2016 for banks
In the next section of the survey we consider stress and scenario testing for IRRBB including scenario design and governance.
4.1 Which area of the bank is responsible for producing baseline yield curve forecasts?
Overall the majority of banks reported that it was their economist who defines the scenarios. However for Non D-SIBs it is predominantly Treasury that defines the scenarios. One possible explanation for this is that for the larger banks, scenarios are driven by supervisory stress testing scenarios which are often interpreted within Group Economics.
Scenario design
Baseline yield curve calculation: G-SIBs
Baseline yield curve calculation: D-SIBs
4.2 How is the baseline yield curve forecast produced?
Very few banks reported using Monte Carlo simulations to derive the baseline yield curve with the majority using either Macro-economic parameters or market implied forwards.
Baseline yield curve calculation: non D-SIBs
4.3 On what frequency is the baseline yield curve forecast refreshed?
We found that most banks use either a monthly refresh of the base curve or refresh in line with their corporate planning cycles (usually quarterly) with some banks using a combination. Monthly refresh is common amongst G-SIBs and D-SIBs but rare for the Non D-SIBs who prefer to refresh in accordance with their planning cycle.
Frequency of curve refresh
Group economist
Risk management
Treasury
29%
24%
47%
0% 10% 20% 30% 40% 50% 60% 70%
Impliedforwards
Macroeconomicparameters
Monte carlo simulation
0% 10% 20% 30% 40% 50% 60% 70%
Impliedforwards
Macroeconomicparameters
Monte carlo simulation
0% 10% 20% 30% 40% 50% 60% 70%
Impliedforwards
Macroeconomicparameters
Monte carlo simulation
0% 10% 20% 30% 40% 50%
Annual
Half yearly
Corporate planning cycle
Monthly
Quarterly

22 Enhanced Requirements for IRRBB Management Insights from EY European IRRBB Survey 2016 for banks
Type of scenarios modelled
4.4 Does the determination of rates scenarios take into account basis risk? If so, what assumptions have been made about rates correlation?
Most banks (70%) do not consider basis risk to determine the scenarios. This was consistent across the different bank classifications.
4.5 What type of interest rate scenarios are modelled?
The chart below shows that a range of scenarios is modelled but with the most common being the parallel shift. We note that smaller banks use a smaller range of scenarios with almost all using the parallel shift whereas larger banks use a wider range.
We did note some differences here across jurisdictions with Germany, Switzerland and the UK using a wider range of scenarios typically than the other countries.
4.6 How is the magnitude of the interest rate shock determined?
4.7 How are IRRBB stress scenarios developed?
We noted a range of drivers here with the most commonly used across banks being those scenarios prescribed by supervisors (around 80% of banks included this). Reliance on supervisor prescribed scenarios increases for smaller banks with larger banks relying more heavily on their own analysis such as statistical/historical analysis.
Scenario drivers: G-SIB
Scenario drivers: D-SIB
Scenario drivers: non D-SIB
0%
25%
50%
75%
100%
125%
G-SIB D-SIB Non D-SIB
Parallel shifts Gradual shifts
Yield curve rotation shocks Key point shift
Short rate and long rate shocks
0% 20% 40% 60% 80%
Regulatory prescribed
Defined by board risk Co
Statistical approach
Recreation of historical events
Other
0% 20% 40% 60% 80% 100%
Regulatory prescribed
Defined by board risk Co
Statistical approach
Recreation of historical events
Other
0% 20% 40% 60% 80% 100%
Regulatory prescribed
Defined by board risk Co
Statistical approach
Recreation of historical events
Other
We did note some stark contrasts across jurisdictions with French banks far less reliant on supervisory prescribed scenarios and instead determining scenarios based on historical movements. In Germany all banks use a statistical approach as part of the process. Italy and the UK had the highest reliance on supervisory scenarios with Switzerland having the greatest range of scenarios.
4.8 Does the firm's IRRBB framework provide different rate scenarios for each currency curve?
Across the board most banks (64%) answered that they do not differentiate scenarios across different currencies. However for the G-SIBs most (54%) do track different scenarios per currency. We did not ask banks how many different currencies they were exposed to but we would expect the number of large banks with significant currency exposures modelling different currency scenarios to be high.
Stress and scenario testing

23Enhanced Requirements for IRRBB Management Insights from EY European IRRBB Survey 2016 for banks
4.9 Do you floor interest rates at zero or do they accommodate negative rate scenarios?
Across all banks, 73% model negative interest and do not floor their rates at zero. This is not surprising given the current rate position in continental Europe. Surprisingly only 29% of Italian banks surveyed modelled negative rates and only 67% of German banks. In the UK, 86% of banks model negative rates. In Switzerland only 50% of G-SIBs modelled negative rates.
4.10 Is IRRBB included in overall stress testing program or separately?
This question was designed to ascertain whether IRRBB was included in the group-wide stress testing framework and considered as part of the overall process or if it was part of a separate stress testing approach.
Around 74% responded to say that IRRBB does form part of their group-wide framework and this number was fairly consistent across bank sizes. In France only 55% of banks include IRRBB within their framework with 45% modelling IRRBB separately.
4.11 Are the yield curve forecasts that are used for stress testing in alignment with the curves used for Corporate Planning?
65% of banks do use the same yield curve forecasts per corporate planning with the remainder using different curves. This was consistent across banks of different sizes however if we exclude French banks from the calculation that number rises to 80%. Only 45% of French banks align the yield curve forecasts.
4.12 What assumptions does the IRRBB stress testing framework include?
We found that idiosyncratic assumptions and assumptions designed to stress current market conditions are, unsurprisingly, the most common with only the larger banks typically modelling changes in interest rate correlation assumptions or breakdown in key product assumptions. These types of assumptions are used extensively in our surveyed banks from Germany and Switzerland however.
Assumption types used
4.13 Is the stress scenario on the IRRBB measurement integrated within the general firm stress testing framework?
The purpose of this question was similar to 4.9 above but focused on the scenario itself to understand whether similar or aligned scenarios are used for IRRBB and other risks or whether independent scenarios are modelled for IRRBB.
70% of G-SIBs and D-SIBs responded that the IRRBB scenario itself is integrated within the firm’s stress testing framework versus only 27% of Non D-SIBs. Geographical location is significant here with only 31% of UK, French and Italian banks using integrated scenarios versus 94% for the other countries.
0%
25%
50%
75%
100%
G-SIB D-SIB Non D-SIB
Breakdown in key asset/liabassumptions
Change in key interest ratecorrelation assumptions
Changes to current market and macro conditions
Idiosyncractic scenarios thatrelated to individual businessmodel
Stress and scenario testing

24 Enhanced Requirements for IRRBB Management Insights from EY European IRRBB Survey 2016 for banks
Limits and capital framework

25Enhanced Requirements for IRRBB Management Insights from EY European IRRBB Survey 2016 for banks
Metrics with associated limits
5.2 Which of the following metrics is used to determine capital requirements for IRRBB?
We noted that amongst G-SIBs and D-SIBs the most common metric to be used for calculating capital is VaR whereas for Non D-SIBs, PV or EVE is more likely to be used, probably reflecting the relative volatility of the balance sheets.
This section of the survey is designed to understand if and how banks determine the quantum of capital to hold against IRRBB and what limits and triggers are monitored.
5.1 Which of the following metrics has formal limits set against it?
Although NII is modelled extensively by banks (as seen from previous sections) it was interesting to note that there are not always formal limits set against NII with PV approaches more commonly subject to limits even amongst the smaller banks. We suspect this is due to a large number of banks using the + /– 200bps parallel shock impact to Present Value for limit setting purposes.
Capital metrics
Capital metrics — by country
Again we have noted significant differences across jurisdictions and have therefore charted these below.
0%
25%
50%
75%
100%
G-SIB D-SIB Non D-SIB
NII Ear EVE VaR PV01/PVBP/PV200
NII Ear EVE VaR PV01/PVBP/PV200
0%
25%
50%
75%
G-SIB D-SIB Non D-SIB
France UK Italy Germany Switzerland Other
NII EaR EVE VaR PV01/PVBP/PV200
0%
25%
50%
75%
100%
125%

26 Enhanced Requirements for IRRBB Management Insights from EY European IRRBB Survey 2016 for banks
Risk elements — by country
Risk elements modelled for capital
5.3 When determining capital requirements for IRRBB, which risks do you consider?
As we would expect, larger G-SIB and D-SIB banks model a wider range of risks as part of their capital calculations with smaller Non D-SIBs capturing a lower number of risks. Duration Risk is the most commonly captured.
Most countries measure duration risk as part of their capital calculation. Only the UK and German banks surveyed modelled Basis and Asset Swap Spread Risk to any great extent. Only the UK models pipeline risk as this tends to be a lesser risk in continental Europe.
5.4 Are internal capital buffer adjustments considered where the results of stress testing highlight the potential for reduced NII/EVE (and therefore reduced capital generation capacity) under stress scenarios?
This is an important question as many banks have argue that capital buffers should not be adjusted on the basis that interest rate shocks have a detrimental effect on earnings. Instead they argue that capital should only be considered where earnings are projected to turn negative.
The banks survey were split with 55% stating they do adjust capital even if NII/EVE/PV does not turn negative. The balance was more in favour of not adjusting capital when looking at G-SIBs alone. 73% of French banks surveyed would not adjust capital buffers in this way, 86% of Italian banks and 88% of UK bank surveyed would. Swiss and German banks were more evenly split.
Limits and capital framework
0%
25%
50%
75%
100%
G-SIB D-SIB Non D-SIB
Duration Risk Asset Swap Spread Risk
Basis Risk Prepayment Risk Pipeline Risk
Structural Investment of NDLs
0%
25%
50%
75%
100%
125%
France UK Italy Germany Switzerland Other
Duration risk
Structural investment
of ...
Asset swap
spread risk
Prepaymentrisk
Pipelienerisk
Basis risk

27Enhanced Requirements for IRRBB Management Insights from EY European IRRBB Survey 2016 for banks
Data and systems

28 Enhanced Requirements for IRRBB Management Insights from EY European IRRBB Survey 2016 for banks
The final section of the survey is focused on the data and systems used by banks to monitor IRRBB.
6.1 How would you rate the firm's ability to capture product information from internal transaction systems that pertain to IRRBB characteristics?
G-SIB and D-SIB banks both rated themselves on average 3.4 in terms of their ability to capture key product information whereas Non D-SIB banks had an average rating of 3.8. This may well be due to smaller banks having simpler IT infrastructure and smaller product base.
Product capture rating
Tools used for IRRBB management: measurement
Tools used for IRRBB management: limits
G/L reconciliation capability
6.2 How would you rate the firm's ability to reconcile IRRBB data with the firm's General Ledger and Statutory Returns?
G-SIB banks surveyed highlighted some potential issues in relation to IRRBB reconciliation to G/L and statutory returns scoring themselves on average a whole point below D-SIBs and non D-SIBs.
6.3 Is data used for IRRBB reporting consistent with that used for corporate planning?
The pattern from above continues here with only 62% of GSIBs using data for IRRBB purposes which is consistent with corporate planning data. D-SIBs and Non D-SIBs manage 71% and 87% respectively.
It is possible that the scope and complexity of the G- and D-SIBs is the main driver for their ability to reconcile data to the ledger and corporate plans. However we see increasing pressure from supervisors for banks to demonstrate their IRRBB data is accurate and that base case scenarios align with internal planning data.
6.4 Please describe the technological infrastructure that is utilised for IRRBB
As anticipated G-SIBs and D-SIBs make more use of proprietary internally developed models with some banks using them for all aspects of their IRRBB monitoring and reporting. Non D-SIBs however only use vendor-supplied models for measuring IRRBB and introduce spreadsheet models for limit, monitoring, reporting and stress testing.
0% 20% 40% 60% 80% 100%
G-SIB
D-SIB
Non D-SIB
4 51 2 2
0% 20% 40% 60% 80% 100%
G-SIB
D-SIB
Non D-SIB
4 51 2 2
0% 20% 40% 60% 80% 100%
G-SIB
D-SIB
Non D-SIB
Other/combinationSpreadsheet Vendor solutionProprietary build
0% 20% 40% 60% 80% 100%
G-SIB
D-SIB
Non D-SIB
Other/combinationSpreadsheet Vendor solutionProprietary build
Data and systems

29Enhanced Requirements for IRRBB Management Insights from EY European IRRBB Survey 2016 for banks
Tools used for IRRBB management: reporting
Tools used for IRRBB management: stress testing
IRRBB modelling capability
6.5 How would you rate the capability of the IT systems used for IRRBB reporting to clearly model all transactions made by the institution, taking into account their IRRBB characteristics?
Despite the increased use of proprietary models, G-SIBs and D-SIBs rate themselves lower than Non D-SIBs on their ability to model IRRBB. However we must consider the increased complexity of products and systems for the larger banks.
6.6 Are the systems used to measure IRRBB capable of capturing the IRRBB characteristics of all products, allowing the disaggregation of the impact of individual IRRBB
70% of respondents stated they are able to capture all IRRBB characteristics of all products in their modelling. However only 46% of G-SIBs are versus 80% of D-SIBs and Non D-SIBs.
Geography matters here also with 85% of UK, German, Swiss and they are able to model all IRRBB characteristics versus just 44% of other countries.
6.7 Do IT systems and applications offer sufficient flexibility to accommodate a reasonable range of stress scenarios and new scenarios?
Finally we asked about banks’ IT capabilities in relation to modelling a range of stress scenarios. We found that across all banks between 60–70% responded that they can model a range of scenarios and this was fairly consistent across firm classification. Again German, Swiss and UK banks reported a higher percentage of 80% versus the other countries at 55%.
0% 20% 40% 60% 80% 100%
G-SIB
D-SIB
Non D-SIB
Other/combinationSpreadsheet Vendor solutionProprietary build
0% 20% 40% 60% 80% 100%
G-SIB
D-SIB
Non D-SIB
Other/combinationSpreadsheet Vendor solutionProprietary build
0% 20% 40% 60% 80% 100%
G-SIB
D-SIB
Non D-SIB
4 51 2 2
Data and systems

About EYEY is a global leader in assurance, tax, transaction and advisory services. The insights and quality services we deliver help build trust and confidence in the capital markets and in economies the world over. We develop outstanding leaders who team to deliver on our promises to all of our stakeholders. In so doing, we play a critical role in building a better working world for our people, for our clients and for our communities.
EY refers to the global organization, and may refer to one or more, of the member firms of Ernst & Young Global Limited, each of which is a separate legal entity. Ernst & Young Global Limited, a UK company limited by guarantee, does not provide services to clients. For more information about our organization, please visit ey.com.
Ernst & Young LLPThe UK firm Ernst & Young LLP is a limited liability partnership registered in England and Wales with registered number OC300001 and is a member firm of Ernst & Young Global Limited.
Ernst & Young LLP, 1 More London Place, London, SE1 2AF.
© 2017 Ernst & Young LLP. Published in the UK. All Rights Reserved.
ED None
EY-000019162.indd (UK) 01/17. Artwork by CSG London.
EY | Assurance | Tax | Transactions | AdvisoryInformation in this publication is intended to provide only a general outline of the subjects covered. It should neither be regarded as comprehensive nor sufficient for making decisions, nor should it be used in place of professional advice. Ernst & Young LLP accepts no responsibility for any loss arising from any action taken or not taken by anyone using this material.
ey.com/uk
EY Contacts
Sweden
Fabrice Martin + 46 8 5205 9502 [email protected]
Denmark
Lars Schwartz-Petersen + 45 252 93246 [email protected]
Germany
Dr. Martin Dörr + 49 711 9881 21870 [email protected]
Netherlands
Philippe Verstappen + 31 8 840 70818 [email protected]
Austria
Dr. Georg von Pfoestl + 43 1 21170 1342 [email protected]
UK
Tom Stephens + 44 20 7985 118 265 [email protected]
Switzerland
Pascal Schmid, CFA + 41 58 289 4288 [email protected]
Belgium
Dr. Frank De Jonghe + 32 2 774 95 13 [email protected]
Spain
Ignacio Medina Saez De + 34 915 727 579 ibarra [email protected]
France
Jean-Michel Bouhours + 33 1 469 35161 [email protected]
Italy
Emilio Maffi + 39 335 123 0177 [email protected]
Tom Stephens Treasury Advisory Lead
T: + 44 7985 118 265 E: [email protected]
Henrik Axelsen Banking Union Lead
T: + 44 7341 078 663 E: [email protected]
Yusuf Surroop Treasury Advisory
T: + 44 20 7951 7653 E: [email protected]