Embed Size (px)
Citation preview
Volume 59, Number 5, 2005 APPLIED SPECTROSCOPY 5750003-7028 / 05 / 5905-0575$2.00 / 0q 2005 Society for Applied Spectroscopy
submitted papers
Enhancement of Infrared Spectral Images for MaximizingChemical Information by Minimizing Baseline Interferences
DONGSHENG BU,* SCOTT W. HUFFMAN,† JOHN A. SEELENBINDER,‡ andCHRIS W. BROWN§Department of Chemistry, University of Rhode Island, Kingston, Rhode Island 02881
The popularity of spectral images in many areas of analysis hasgreatly increased during the last decade due to the development ofcharge-coupled device (CCD) and infrared sensitive cameras. Largeamounts of spatial information can be obtained in short periods oftime. The general goal in analytical chemistry is to convert spectralimages into chemical images, which show the spatial locations ofvarious chemical components. Self-modeling multivariate curve res-olution methods can be used to extract pure component spectrafrom the mixture spectra in images and produce chemical images.However, there is a difficulty in processing infrared spectral imagesdue to large pixel-to-pixel baseline variations. Herein, a method forminimizing baseline interferences using fast Fourier transform(FFT) filtering in both the spectral and spatial domains is discussed.The methodology is demonstrated on a microscopic sample of buttercontaminated with non-pathogenic E. coli and on a cross-sectionalsample of rabbit aorta containing plaque. The processing to reducebaseline effects improved the spatial resolution without compro-mising the spectral resolution.
Index Headings: Infrared; Infrared images; Chemical images; Mul-tivariate curve resolution; MCR; Imaging; Baseline variations;Baseline reductions.
INTRODUCTION
The emergence of charge-coupled device (CCD) andinfrared (IR) cameras as spectroscopic detectors hasgreatly expanded the potential for obtaining spatial im-ages as a function of wavelengths. These spectral imagesconsist of three-dimensional data cubes having two spa-tial (x, y) and one wavelength coordinates. Infrared spec-tral images are providing new insights into biomedicalresearch,1 disease,2 polymers,3 food,4 and forensic5 inves-tigations.
Generally, spectral images of real materials containspectral features for mixtures of chemical components.For some time, it has been our goal to convert spectralimages into chemical images, which show the distribu-tions of each chemical in the spatial domain, i.e., providea chemical picture. A number of self-modeling algo-
Received 28 July 2004; accepted 11 January 2005.* Present Address: CAMO Technologies, Woodbridge, NJ 07095.† Present Address: National Institutes of Health, Bethesda, MD.‡ Present Address: SensIR Technologies, Danbury, CT 06810-9931.§ Author to whom correspondence should be sent. E-mail: cbrown@
chm.uri.edu.
rithms have been developed for creating these chemicalmaps by extracting pure component spectra from mixturespectra.4,6–24 These algorithms are very effective when alarge number of spectra are available for processing. Inthe case of spectral images measured with a 64 3 64pixel camera, there are 4096 spectra of chemically het-erogeneous samples, which should be ample for usingself-modeling algorithms to obtain three or more purecomponent spectra and for generating chemical maps foras many components.
One major problem with extracting chemically relevantinformation from infrared spectroscopic images is thepixel-to-pixel baseline variations. At first, it seemed rea-sonable to use self-modeling methods to extract a base-line as a separate component and simply remove it fromall of the spectra. Since the shapes of baseline interfer-ences differ from pixel to pixel, it is not, however, thatsimple. These variations include curving up at the lowwavenumber end of the spectrum, curving up at the highend of the spectrum, being high in the middle and lowon both ends, or being low in the middle and high at bothends. Example of spectra exhibiting these effects areshown in Fig. 1; these spectra were from nearby pixelsin the same row of a spectral image. In our experience,the greatest variance in processing image spectra is oftenthe baseline. If baselines varied in a consistent manner,they could be systematically subtracted from the spectra.Unfortunately, many baseline features are not confined toone or two shapes, and as a consequence, we are left withtrying to find other mechanisms for reducing these inter-ferences.
One of the causes of the baseline variations is refrac-tive index changes across a chemically heterogeneoussample. The wavenumber dependence of the refractiveindex can cause band shape and baseline changes, espe-cially at the boundaries between two materials. Further-more, thickness variations and edge effects caused by un-avoidable imperfect sample preparation can lead to dif-fraction and scattering of the radiation. These changescan cause blurring and degradation of the spatial reso-lution. Therefore, in addition to interfering with the ex-traction of pure component spectra when applying self-modeling methods, large baseline variations degrade the

576 Volume 59, Number 5, 2005
FIG. 1. Infrared spectra from pixels in the same row of the image showing baseline variations.
fidelity of images produced from spectroscopic imagingexperiments.
The objective of the present investigation was to im-prove the quality of pure component spectra extractedfrom spectral images and to improve or maintain the ap-parent spatial resolution of chemical maps obtained fromthe spectral images. An additional important constraintwas that the spectral resolution must be retained duringpreprocessing. Herein, we discuss a simple method formaximizing the chemical information obtainable fromspectral images and simultaneously improving the fidelityof the images.
EXPERIMENTAL
Infrared spectral images were measured on a DigilabStingray FTS-6000 or Digilab Stingray FTS-7000 imag-ing spectrometer equipped with a Digilab UMA-500 in-frared microscope and a 64 3 64 MCT focal plane arraydetector (Digilab, Randolph, MA). All spectra were ob-tained by averaging 256 scans measured at 8 cm21 res-olution. Non-pathogenic E. coli (ATCC 25922) sampleswere cultured in our microbiology laboratory under con-trolled conditions and were measured with the infraredmicroscope. The rabbit aorta spectral images were mea-sured on the Stingray FTS-7000 LS (Large Scale) attach-ment, which gives a 1:1 image of the object. The totalfield of view was 1 3 1 mm and each pixel viewed a 17
3 17 mm image. These images were measured using theHarrick Fast IR (Harrick Scientific Corp., Ossining, NewYork), which is a 458 single bounce ZnSe imaging ATRattachment.25
Spectral images were initially displayed with WIN-IR-PRO software (Digilab). All of the preprocessing andself-modeling methodologies were performed with pro-grams written in MatLab Version 6 (The Math WorksInc., Natick, MA).
RESULTS AND DISCUSSION
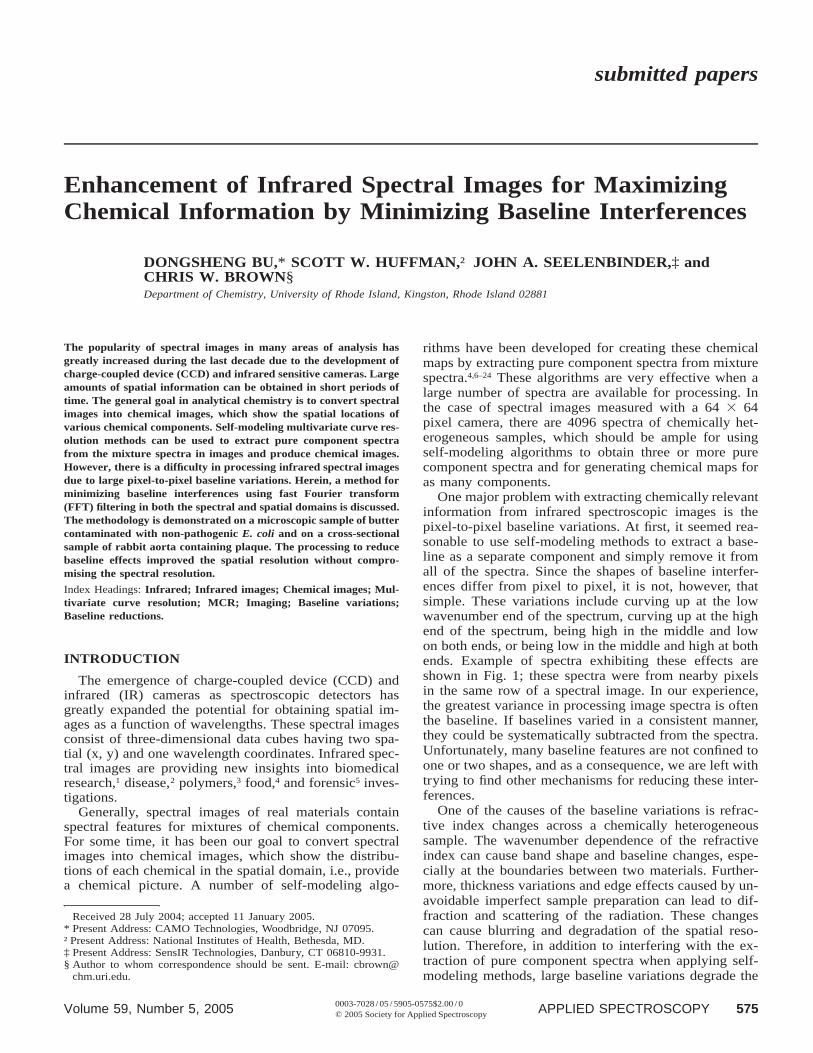
Baseline Reductions of Butter/Bacteria. A micro-scopic image of E. coli bacteria on a substrate of butteris shown in Fig. 2. The 400 3 400 mm field of view wascovered with butter and a small amount of bacteria wasadded on top of the butter in the lower right corner ofthe image. By visual inspection of the spectroscopic data,spectra of pure butter were easy to find; however, all ofthe spectra showing bacteria also exhibited bands corre-sponding to butter as shown in the spectrum on the bot-tom-right side of the figure.
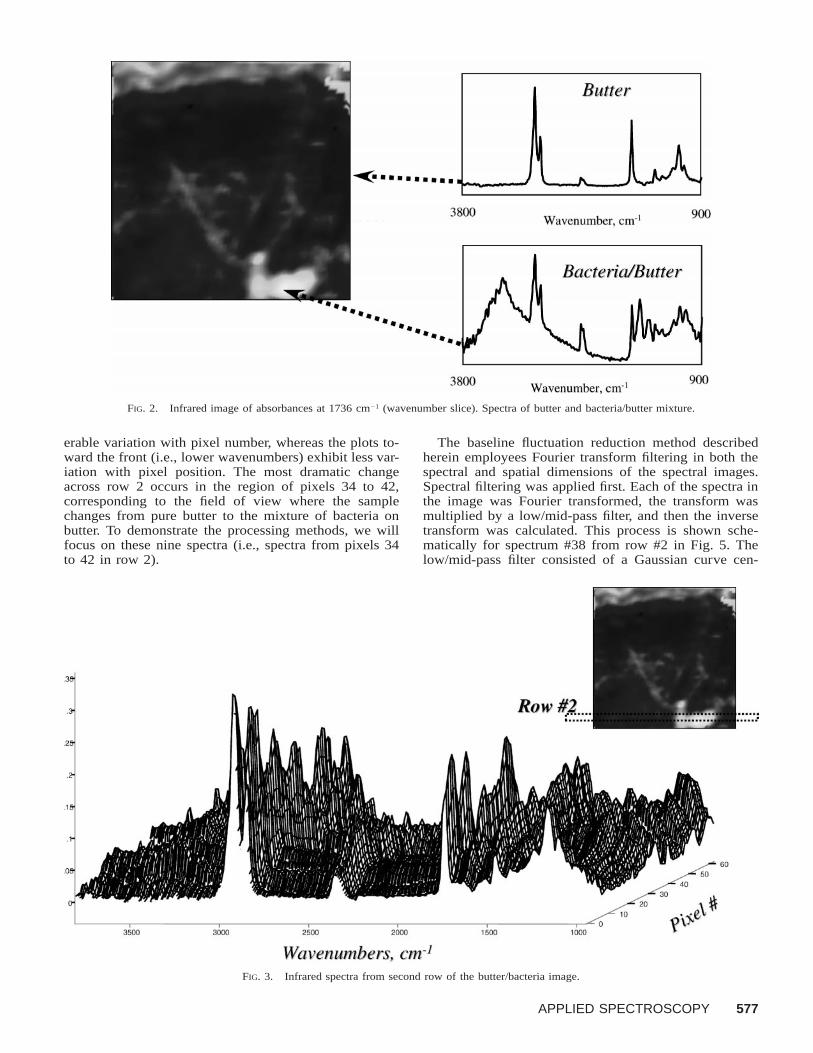
Sixty-four spectra from row #2 of the butter–bacteriaimage are shown in Fig. 3. Baseline variations across thisrow are much more evident in the plot of absorbance vs.pixel number at selected wavenumbers as shown in Fig.4. The last plot in Fig. 4 at 4000 cm21 (at the back ofthe three-dimensional perspective plot) exhibits consid-
APPLIED SPECTROSCOPY 577
FIG. 2. Infrared image of absorbances at 1736 cm21 (wavenumber slice). Spectra of butter and bacteria/butter mixture.
FIG. 3. Infrared spectra from second row of the butter/bacteria image.
erable variation with pixel number, whereas the plots to-ward the front (i.e., lower wavenumbers) exhibit less var-iation with pixel position. The most dramatic changeacross row 2 occurs in the region of pixels 34 to 42,corresponding to the field of view where the samplechanges from pure butter to the mixture of bacteria onbutter. To demonstrate the processing methods, we willfocus on these nine spectra (i.e., spectra from pixels 34to 42 in row 2).
The baseline fluctuation reduction method describedherein employees Fourier transform filtering in both thespectral and spatial dimensions of the spectral images.Spectral filtering was applied first. Each of the spectra inthe image was Fourier transformed, the transform wasmultiplied by a low/mid-pass filter, and then the inversetransform was calculated. This process is shown sche-matically for spectrum #38 from row #2 in Fig. 5. Thelow/mid-pass filter consisted of a Gaussian curve cen-

578 Volume 59, Number 5, 2005
FIG. 4. Spatial variation of absorbances across row #2 at selected wavenumbers between 900 and 4000 cm21.
FIG. 5. Spectral filtering at pixel #38 in row #2 using FFT and a low-to-mid-pass Gaussian filter centered at 1/8th the number of FT terms andhaving a standard deviation of 1/8th the number of terms.
tered at 1/8th of the number of terms in the transformwith a standard deviation of 1/8th of the number of trans-form terms. This mild filtering removed high-frequencynoise from the spectrum as well as a small amount oflow-frequency (broadband) baseline effects.
After spectral filtering each of the 4096 spectra, spatialfiltering was applied to the spectral image. In this case,
a two-dimensional fast Fourier transform (FFT) was ap-plied to the data at each spectral channel (i.e., at eachincremental wavenumber). For demonstration purposes,we show the effect in one-dimensional space by consid-ering only row #2 data at the spectral channel corre-sponding to 950 cm21, as shown in Fig. 6. There shouldnot be a lot of spatial variation at 950 cm21 for a two-
APPLIED SPECTROSCOPY 579
FIG. 6. Spatial filtering of absorbances at 950 cm21 across row #2 using FFT and a low-pass Gaussian filter centered at 0 and having a standarddeviation of 1/8th the number of terms (i.e., 8 for 64 pixels).
FIG. 7. Row #2 spectra from pixels #34 to 42 before and after filtering, and by flattening with a linear two-point baseline.
component system; however, there is relatively high fre-quency variation across this row. The 64-pixel spatial plotis Fourier transformed and multiplied by a half-Gaussianlow-pass filter centered at the first FT term and having astandard deviation of 1/8th the number of FT terms (astandard deviation of 8 was used for a row containing 64pixels). An inverse Fourier transform of the filtered rowis then calculated, producing a new spatial distribution.
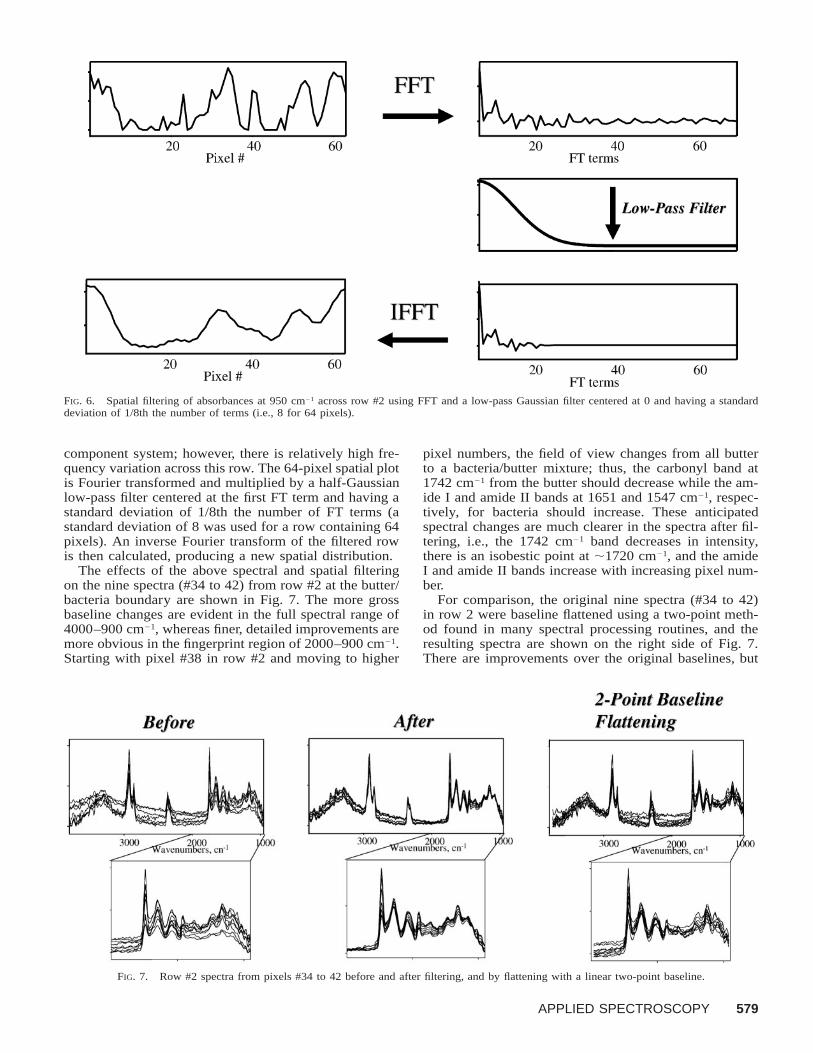
The effects of the above spectral and spatial filteringon the nine spectra (#34 to 42) from row #2 at the butter/bacteria boundary are shown in Fig. 7. The more grossbaseline changes are evident in the full spectral range of4000–900 cm21, whereas finer, detailed improvements aremore obvious in the fingerprint region of 2000–900 cm21.Starting with pixel #38 in row #2 and moving to higher
pixel numbers, the field of view changes from all butterto a bacteria/butter mixture; thus, the carbonyl band at1742 cm21 from the butter should decrease while the am-ide I and amide II bands at 1651 and 1547 cm21, respec-tively, for bacteria should increase. These anticipatedspectral changes are much clearer in the spectra after fil-tering, i.e., the 1742 cm21 band decreases in intensity,there is an isobestic point at ;1720 cm21, and the amideI and amide II bands increase with increasing pixel num-ber.
For comparison, the original nine spectra (#34 to 42)in row 2 were baseline flattened using a two-point meth-od found in many spectral processing routines, and theresulting spectra are shown on the right side of Fig. 7.There are improvements over the original baselines, but

580 Volume 59, Number 5, 2005
FIG. 8. Infrared images and self-modeling spectra of components before (on the left) and after (on the right) filtering. The images represent theconcentrations of the two components determined by the IPCA method.
they are not as good as the filtered spectra. Moreover,this two-point method assumes that the spectral baselineshould be flat for all of the spectra, and this may not bethe case (for example, see the discussion of the rabbitaorta plaque in the last section).
One of the major objectives of this research was tofind a method that would reduce baseline variations with-out reducing spatial or spectral resolutions. The next sec-tion on self-modeling will deal with the spatial resolution.We calculated band widths at half-heights (BWHH) be-fore and after filtering to determine any changes in spec-tral resolutions. For the bacteria/butter spectral image, themean value of BWHH for the carbonyl band at 1744cm21 from 240 spectra of butter in the center of the imagewas 23.75 6 1.87 cm21 before filtering and 23.25 6 0.31cm21 after filtering. The mean value of the BWHH wasslightly smaller after filtering, while the standard devia-tion was reduced by a factor of six.
Self-Modeling of Butter/Bacteria Filtered Images.Prior to filtering, self-modeling methods produced spectraand images that were mixtures of butter, bacteria, andbaselines. Since most of the field of view of the spectralimage shown in Fig. 2 is butter, the extracted pure butterspectrum corresponded well with the measured spectrumof pure butter; however, the bacteria spectrum alwayscontained a carbonyl band and the chemical image wasblurry, lacking distinct demarcation between the butter/bacteria boundary as shown in Fig. 2.
A self-modeling method referred to as interactive prin-cipal component analysis (IPCA) was used in this inves-tigation.7 This method is very similar to SIMPLISMA(simple-to-use interactive self-modeling mixture analy-sis), except that it starts with a principal component anal-ysis (PCA) of the spectral data rather than processing theraw spectra directly. Absorbances at the wavenumber ofthe spectral feature exhibiting the greatest relative changein the spectra are assigned as the relative concentrationsof one component. The spectral band at this frequency is
referred to as the 1st purity peak. The center of this peakis determined as that frequency among all of the fre-quencies in the spectra that has the maximum relativestandard deviation. In IPCA, the 1st purity peak is ob-tained from the principal components, whereas in SIM-PLISMA, it is determined from the spectra. In either case,the standard deviation of the absorbances at each fre-quency is divided by the average absorbance at that fre-quency. To avoid obtaining large relative standard devi-ations due to excessive noise at low absorbance regions(regions without bands), a small constant value indicativeof the noise level is added to the average value; we foundfrom numerous applications of the IPCA method that us-ing 3% of the maximum average absorbance in the spec-trum produced optimum results in all cases. After select-ing the 1st purity peak, the spectra are multiplied by aweighting function, which removes correlation with the1st purity peak from all of the principal components (orspectra in the case of SIMPLISMA). The 2nd purity peakis found again by finding the maximum relative standarddeviation in the remaining spectra. This processing iscontinued for all potential chemical components.
The interactive part of the IPCA method allows theuser to select the number of principal components andthe number of chemical components. More principalcomponents than chemical components can be used inthe processing. The number of principal components isselected as the number that accounts for 99.9% of thevariance of the data set, whereas the selection of the num-ber of chemical components will control the appearanceof the pure component spectra. If too few are selected,spectral features of two or more chemical componentsare combined. If too many are selected, redundant (orvery similar) pure component spectra are produced. Ba-sically, the user has some insight as to the appropriatenumber of pure components. Moreover, the user willquickly recognize that redundant spectra are generated.
The relative absorbance values obtained by the previ-

APPLIED SPECTROSCOPY 581
FIG. 9. Image of rabbit aorta obtained by plotting the area of the absorbance band centered at 1736 cm21. High values are white, whereas lowvalues of the area are black. All of the spectra exhibit strong water absorptions.
ously described self-modeling procedure are proportionalto concentrations of the components in the mixtures andare used as the first estimates for concentrations. Themethod of alternating least squares18 is then applied tothe data. In this method, the 4096 spectra in the absor-bance matrix, A, are written in terms of Beer’s law as
A 5 CK (1)
where C contains the estimated concentrations and K isthe absorptivity matrix. The 4096 spectra in A are re-gressed onto the concentrations to obtain the K matrix.Then A is regressed onto the new estimate of K to obtaina new estimate for C. This alternating least squares pro-cessing is continued until some convergence criteria ismet. We continue until the square root of the sum of allthe residuals in the relation
Residuals 5 A 2 CK (2)
is less that 0.0001.The effect of applying self-modeling to the bacteria/
butter images is demonstrated in Fig. 8. Prior to filtering,we could not obtain a spectrum of pure bacteria, i.e., thespectrum was that of a mixture of bacteria and butter. Ascan be seen from the figure, there were a number of neg-ative bands in the self-modeled spectrum of the bacteriadue to the over-removal of the butter spectrum. In addi-tion, there was a sloping baseline in this spectrum. As aconsequence, the image of the bacteria was not clear. Af-ter filtering, the self-modeling method provided a verygood spectrum of bacteria with little or no baseline ef-fects and no interference from butter. The image of bac-
teria after filtering clearly shows that the bacteria waslocated in the lower right corner of the field. Moreover,the image of butter after processing shows that butter wasequally distributed over the image field except for athicker film at the top of the image.
The problem of baseline interferences in self-modelingmixture analysis has been addressed recently by using acombination of conventional and second-derivative datain the SIMPLISMA method.17 In that approach, puritypeaks could be obtained from either conventional or sec-ond-derivative spectra depending upon the spectral bandwidths, and the baselines were extracted as a separatecomponent from the SIMPLISMA analysis. As men-tioned earlier in the present report, the pixel-to-pixel var-iations produce many different shaped baselines, whichcannot be accounted for by a single extracted baseline. Itseems reasonable that second-derivative spectra could beused effectively to characterize the distribution of chem-ical components, but not for removing baselines to pro-duce adequate pure component spectra from infraredspectral images.
Processing of the Rabbit Aorta Image. As an addi-tional example of the baseline improvement method, wedemonstrate its effect on infrared image data for a rabbitaorta containing plaque. This particular sample is a cross-section of the epithelial tissue of a rabbit aorta cut to lieflat. The size of the image is 1 3 1 mm and shows theinside of the aorta. This tissue has three basic regions:plaque consisting of lipid and cholesterol, protein, andwater bound to the tissue. An image of the aorta cross-section generated by plotting the band areas for the fatty

582 Volume 59, Number 5, 2005
FIG. 10. Spectra and corresponding chemical images obtained for the rabbit aorta cross-section after reducing the baseline and applying self-modeling IPCA to the image. White areas represent high concentrations and black areas represent low concentrations.
acid carbonyl band at 1736 cm21 is shown in Fig. 9. Aspectrum for one of the pixels in the white area exhibitsa carbonyl band at 1736 cm21. Most of the spectra atpixels in the white and light gray areas have stronglyvarying baselines. Spectra for pixels in the dark areaswere mainly of water and some showed small amountsof unidentifiable organic material. Strong contributionsfrom water were found over much of the image.
The resulting images, after reducing the baseline var-iations by the method discussed earlier and applying theself-modeling method, are shown in Fig. 10. After pro-cessing the spectra, three distinct spectra and images wereobtained for plaque, water, and protein. The images wereobtained by plotting the calculated concentrations for therespective pure components. The white areas representhigh concentration and the black low concentrations. Re-ducing the baseline interferences made it possible to sep-arate out the spectrum of water from the plaque and pro-tein spectra. Without this processing, the chemical infor-mation extracted for protein and plaque distributionsacross the tissue sample was masked by the strong spec-trum of water. It was impossible to obtain good spectraof the protein and plaque prior to applying the filtering
technique. It should be noted that the plaque spectrumhas a sloping baseline, which is associated with this lipidformation.
CONCLUSION
The difficulty in extracting component spectra frominfrared spectral images of mixtures derives from thelarge pixel-to-pixel baseline variations in an image. Asimple method of using FFT filtering in both the spectraland spatial domains minimizes the baseline effects andmakes it possible to use self-modeling methods to obtainreasonable component spectra and improved chemicalimage fidelity. The algorithm produces spectra and chem-ical images of the individual components. Spectral reso-lution based on half-band widths at half-heights was notaltered during the processing. The only input requiredother than the hyperspectra data is an estimate for thenumber of principal components and the number ofchemical components in the image field. The total pro-cessing time for a 64 3 64 pixel camera with ;800 datapoints per spectrum is under 2 min on a 2 GHz computer.

APPLIED SPECTROSCOPY 583
ACKNOWLEDGMENTS
This work was supported, in part, by the Cooperative State Research,Education and Extension Service, U.S. Department of Agriculture(NRICGP Grant No. 93-37201-9197), by the U.S. Department of De-fense Environmental Training Fellowship, and by the URI Partnershipfor Sensors and Surface Technology.
1. P. Colarusso, L. H. Kidder, I. W. Levin, J. C. Fraser, J. F. Arens,and E. N. Lewis, Appl. Spectrosc. 52, 106A (1998).
2. R. Mendelsohn, E. P. Paschalis, P. J. Sherman, and A. I. Boskey,Appl. Spectrosc. 54, 1183 (2000).
3. E.-M. Shin, T. Ribar, J. L. Koenig, and N. Wright, Appl. Spectrosc.55, 1573 (2001).
4. B. O. Budevska, S. T. Sum, and T. J. Jones, Appl. Spectrosc. 57,124 (2003).
5. S. W. Huffman, K. B. Lukasiewicz, and C. W. Brown, MicroscopyToday 11(3), 10 (2003).
6. W. H. Lawton and E. A. Sylvestre, Technometrics 13, 617 (1971).7. F. J. Knorr and J. H. Futrell, Anal. Chem. 51, 1236 (1979).8. E. R. Malinowski, Anal. Chim. Acta 134, 129 (1982).9. K. J. Schostack and E. R. Malinowski, Chemom. Intell. Lab. Syst.
6, 21 (1989).10. D. W. Osten and B. R. Kowalski, Anal. Chem. 56, 991 (1984).11. R. Tauler, B. R. Kowalski, and S. Fleming, Anal. Chem. 65, 2040
(1993).
12. B. Vandeginste, R. Essers, T. Bosman, I. Reijnen, and G. Kateman,Anal. Chem. 57, 971 (1985).
13. P. J. Gemperline, J. Chemom. 3, 549 (1989).14. W. Windig, J. L. Lippert, M. J. Robbins, K. R. Kresinske, J. P.
Twist, and A. P. Snyder, Chemom. Intell. Lab. Syst. 9, 7 (1990).15. W. Windig and J. Guilment, Anal. Chem. 62, 1425 (1991).16. J. Guilment, S. Markel, and W. Windig, App1. Spectrosc. 48, 320
(1994).17. W. Windig, B. Antalek, J. L. Lippert, Y. Batonneau, and C. Bre-
mard, Anal. Chem. 74, 1371 (2002).18. J. J. Andrew and T. M. Hancewicz, Appl. Spectrosc. 52, 797 (1998).19. V. Vacque, N. Dupuy, S. Sombret, J. P. Huvenne, and P. Legrand,
Appl. Spectrosc. 51, 407 (1997).20. C. W. Brown, D. Bu, N. P. Camacho, and R. Mendelsohn, Spectral
Imaging: Instrumentation, Applications, and Analysis, SPIE Tech-nical Publication 3920, (ISSN 1017–2661), pp. 118–128 (2000).
21. D. Bu and C. W. Brown, Appl. Spectrosc. 54, 1214 (2000).22. J. R. Schoonover, R. Marx, and S. L. Zhang, Appl. Spectrosc. 57,
154A (2003).23. L. Chen, W. Chew, and M. Garland, Appl. Spectrosc. 57, 491
(2003).24. E. Widjaja, N. Crane, T.-C. Chen, M. D. Morris, M. A. Ignelzi, and
B. R. McCreadie, Appl. Spectrosc. 57, 1353 (2003).25. E. M. Burka and R. Cubela, US Patent 6,141,100, Imaging ATR
Spectrometer (2000).