Embed Size (px)
Citation preview
ENHANCEMENT OF PERFORMANCE CHARACTERISTICS OF EPOXY
ADHESIVES THROUGH PARTICLE REINFORCEMENT
A THESIS SUBMITTED TO
THE GRADUATE SCHOOL OF NATURAL AND APPLIED SCIENCES
OF
MIDDLE EAST TECHNICAL UNIVERSITY
BY
HASAN YETGİN
IN PARTIAL FULFILLMENT OF THE REQUIREMENTS
FOR
THE DEGREE OF MASTER OF SCIENCE
IN
AEROSPACE ENGINEERING
DECEMBER 2019

Approval of the thesis:
ENHANCEMENT OF PERFORMANCE CHARACTERISTICS OF EPOXY
ADHESIVES THROUGH PARTICLE REINFORCEMENT
submitted by HASAN YETGİN in partial fulfillment of the requirements for the
degree of Master of Science in Aerospace Engineering Department, Middle East
Technical University by,
Prof. Dr. Halil Kalıpçılar Dean, Graduate School of Natural and Applied Sciences
Prof. Dr. İsmail H. Tuncer Head of Department, Aerospace Engineering
Assoc. Prof. Dr. Tuncay Yalçınkaya
Supervisor, Aerospace Engineering, METU
Assoc. Prof. Dr. Oral Cenk Aktaş
Co-Supervisor, Christian-Albert University
Examining Committee Members:
Prof. Dr. Altan Kayran
Department of Aerospace Engineering, METU
Assoc. Prof. Dr. Tuncay Yalçınkaya
Aerospace Engineering, METU
Assoc. Prof. Dr. Ercan Gürses
Department of Aerospace Engineering, METU
Assoc. Prof. Dr. Demirkan Çöker Department of Aerospace Engineering, METU
Assoc. Prof. Dr. Barış Sabuncuoğlu
Department of Mechanical Engineering, Hacettepe University
Date: 13.12.2019

iv
I hereby declare that all information in this document has been obtained and
presented in accordance with academic rules and ethical conduct. I also declare
that, as required by these rules and conduct, I have fully cited and referenced
all material and results that are not original to this work.
Name, Surname:
Signature:
Hasan Yetgin

v
ABSTRACT
ENHANCEMENT OF PERFORMANCE CHARACTERISTICS OF EPOXY
ADHESIVES THROUGH PARTICLE REINFORCEMENT
Yetgin, Hasan
Master of Science, Aerospace Engineering
Supervisor : Assoc. Prof. Dr. Tuncay Yalçınkaya
Co-Supervisor: Assoc. Prof. Dr. Oral Cenk Aktaş
December 2019, 66 pages
Epoxy adhesives are common bonding agents used to join dissimilar materials. They
are widely preferred in aerospace industry. But, their lack of performance at
extremities of service temperatures limits their use in practical applications. The aim
of this study is to improve the epoxy adhesives’ thermal properties through addition
of filler particles, i.e. boron nitride, aluminum oxide, titanium oxide and Au doped
titanium oxide. The last one has been developed specifically for this study to enhance
the drawbacks of titanium particles in thermal conductivity. In order to have regular
samples, a sample preparation method has been suggested. Then, the samples were
tested by Dynamic Mechanical Analysis (DMA), Differential Scanning Calorimetry
(DSC), Scanning Electron Microscopy (SEM), Thermal Conductivity Measurement,
Fourier Transform Infrared Spectroscopy (FTIR) and Single Lap Shear Test. The
results showed that adding filler materials had favorable influence on thermal and
mechanical performance. For the key parameters of thermal and mechanical
performance of adhesives, boron nitride particles had greatest influence on the
thermal conductivity. Moreover, Au doped and regular titanium dioxide particles had

vi
brilliant results in glass transition temperature. Adhesion strength was enhanced
mostly by aluminum dioxide particles. The result of scanning methods validated the
suggested sample preparation method. Finally, while Au doped titanium oxide
particles enhanced the glass transition temperature, the expected improvement on
thermal conductivity value has not been reached.
Keywords: Epoxy Reinforcement, Aerospace Industry, Particle Addition

vii
ÖZ
EPOKSİ BAZLI YAPIŞTIRICILARIN PARÇACIK KATKISI İLE PERFORMANSININ GELİŞTİRİLMESİ
Yetgin, Hasan
Yüksek Lisans, Havacılık ve Uzay Mühendisliği Tez Yöneticisi: Doç. Dr. Tuncay Yalçınkaya
Ortak Tez Yöneticisi: Doç. Dr. Oral Cenk Aktaş
Aralık 2019, 66 sayfa
Epoksi yapıştırıcılar benzer olmayan malzemelerin birbirine birleştirilmeleri için
genel olarak kullanılan bir bağlantı elemanıdır. Ancak servis sıcaklıklarının
sınırlarında yaşadıkları performans kayıpları kullanımlarını sınırlandırmaktadır. Bu
çalışmanın amacı epoksi yapıştırıcıların termal özelliklerinin bor nitrür, alüminyum
oksit, titanyum oksit ve altın kaplanmış titanyum oksit parçacıkları eklenerek
geliştirilmesidir. Titanyum oksit parçacıklarının termal iletkenlik üzerindeki negatif
etkilerinin giderilmesi için altın kaplı titanyum oksit parçacıkları özellikle
geliştirilmiştir. Nizami numuneler elde edilebilmesi için bir numune hazırlama
metodu da önerilmiştir. Sonrasında, numuneler DMA, DSC, Termal İletkenlik
Ölçümü, SEM, FTIR ve Kesme deneyi ile test edilmiştir. Sonuçlar parçacık
eklemenin termal ve mekanik özellikler üzerinde olumlu etkilere sahip olduğunu
göstermiştir. Termal ve mekanik performansın anahtar parametreleri için; bor nitrür
termal iletkenlik üzerine, altın kaplanmış titanyum oksit camsı geçiş sıcaklığı
açısından ve alüminyum oksit yapışma mukavemeti açısından en çok geliştirmeyi
göstermiştir. Görüntüleme yöntemleri ile de önerilen numune hazırlama metodu

viii
doğrulanmıştır. Son olarak, altın kaplanmış titanyum oksit parçacıkları camsı geçiş
sıcaklığını geliştirse de beklenenin termal iletkenlik değerine erişememiştir.
Anahtar Kelimeler: Epoksi Yapıştırıcı Güçlendirme, Havacılık Sanayi, Parçacık
Ekleme

ix
To whom lost in this way and lost his way

x
ACKNOWLEDGMENTS
First of all, I wish to express my genuine appreciation to my supervisor Assist. Prof.
Dr. Tuncay Yalçınkaya for his guidance, advice, patience and faith throughout this
work. His positive attitude and tolerance made me stand firm.
Also, I am grateful to my co-advisor Assoc. Prof. Dr. Oral Cenk Aktaş. His
mentorship and logistic support made this work possible. Mr. Salih Veziroğlu has
my gratitude for his help on laboratory work and precious comments on study.
I am thankful to laboratory staff from ROKETSAN for their support and allowance
for tests. Also, I want to thank Tuncay Tunç for his supportive behavior to me and
my work.
Grateful thanks go to my former fiancée and wife Fatoş Alev Yetgin for her support
and faith during this work.
My friends and colleagues Tevfik Ozan Fenercioğlu, Hasan Baran Özmen, Denizhan
Yerel, Ahmet Can Afatsun and Özkan Kahveci deserve grate gratitude. They always
stand by with me. Also, tired and valuable thanks go to my bachelor’s and master’s
fellow Burak Ogün Yavuz.
Lastly, I would like to thank to my father Mehmet, my mother Nurcan and my
brothers Ali and Oğuzhan for their endless support and love. I could not achieve any
of these without their support and belief in me.

xi
TABLE OF CONTENTS
ABSTRACT ................................................................................................................. v
ÖZ .......................................................................................................................... vii
ACKNOWLEDGEMENTS ......................................................................................... x
TABLE OF CONTENTS ........................................................................................... xi
LIST OF TABLES ................................................................................................... xiii
LIST OF FIGURES ................................................................................................. xiv
CHAPTERS
1. INTRODUCTION ................................................................................................ 1
2. LITERATURE SURVEY ..................................................................................... 7
2.1. Aim of the Study ............................................................................................. 19
3. TEST METHODS............................................................................................... 21
3.1. Dynamic Mechanical Analysis (DMA) ........................................................... 21
3.2. Differential Scanning Calorimetry (DSC) ....................................................... 23
3.3. Fourier Transform Infrared Spectrometer (FTIR) ........................................... 25
3.4. Thermal Conductivity (TC) ............................................................................. 26
3.5. Scanning Electron Microscope (SEM) ............................................................ 27
3.6. Single Lap Shear Test ...................................................................................... 28
4. MATERIALS AND PREPARATION METHODS ........................................... 31
4.1. Materials .......................................................................................................... 32
4.2. Sample Preparation Methods ........................................................................... 32
4.2.1. Molds/Adherends Preparation .................................................................. 33
4.2.2. Particles Preparation ................................................................................. 33

xii
4.2.3. Composite Adhesive Preparation ............................................................. 34
5. RESULTS AND DISCUSSION ........................................................................ 35
6. CONCLUSION .................................................................................................. 57
REFERENCES .......................................................................................................... 63

xiii
LIST OF TABLES
TABLES
Table 2-1 Mechanical Properties of hBN filled Epoxy ................................................ 9
Table 2-2 Test Specimens Composition .................................................................... 10
Table 2-3 Thermal Stability of Composite Adhesive ................................................ 12
Table 2-4 Test Specimen Matrix ................................................................................ 14
Table 2-5 Thermal Conductivity Values of TiO2 added Composite Adhesives ........ 16
Table 2-6 TGA Values for Thermal Stability ............................................................ 17
Table 2-7 Test Results of Samples ............................................................................. 17
Table 5-1 Glass Transition Values of All Samples .................................................... 40
Table 5-2 Thermal Conductivity Values (W/m K) of Samples at Different
Temperatures .............................................................................................................. 41
Table 5-3 Maximum Shear Stress at Breakage of Samples ....................................... 49

xiv
LIST OF FIGURES
FIGURES
Figure 1-1 Diagrammatic view of the de Havilland Comet and where structural
adhesives used, (A) Canopy structure, (B) Longitudinal stringers of fuselage (C)
Local doublers and reinforcements around windows (D,E,H,J,K) Spanwise stringers,
ailerons and flap structures, vertical stiffener flanges in wings (F) Wall stiffeners in
tail (G) Sealing in pressure dome (L) all stiffeners in pressure floor [1] .................... 3
Figure 1-2 Schematic view of the Airbus A380 and adhesive bonding used areas[4] 3
Figure 2-1 Thermal Conductivity Values with increasing hBN ratio [16]. ................. 8
Figure 2-2 DSC Results with varying hBN ratio[16] .................................................. 9
Figure 2-3 Tg Values from DSC Results with varying Al2O3 Content[25] .............. 11
Figure 2-4 Thermal Conductivity over Al2O3 Content[26] ...................................... 13
Figure 2-5 TiO2+Au and Epoxy Interaction .............................................................. 19
Figure 3-1 ARES G2 Rheometer (https://www.tainstruments.com/ares-g2/) ........... 22
Figure 3-2 DMA Sample ........................................................................................... 22
Figure 3-3 Example of DSC Plot ............................................................................... 24
Figure 3-4 TA Instruments Q200 (yorku.ca/tbaumgar/photo/album/ta-instruments-
dsc-q200) ................................................................................................................... 24
Figure 3-5 DSC Sample ............................................................................................. 25
Figure 3-6 Bruker Tensor 27 FTIR Spectrometer(http://triadsci.com/en/products/ftir-
ir-and-near-ir-spectroscopy/946/bruker-tensor-27-ftir-bruker-ftir-bruker-27/251160)
................................................................................................................................... 26
Figure 3-7 TA Instruments DTC-300 (https://www.tainstruments.com/dtc-300/) .... 27
Figure 3-8 Thermal Conductivity Sample ................................................................. 27
Figure 3-9 Carl Zeiss Supra 55(https://www.cecri.res.in/SAIF/carl.html) ................ 28
Figure 3-10 Instron 5500R......................................................................................... 29
Figure 3-11 Test Samples .......................................................................................... 29

xv
Figure 4-1 Bubbled and Regular Samples ................................................................. 32
Figure 4-2 Molds of a) Thermal Inductivity b) FT-IR c) DSC d) DMA Tests ......... 33
Figure 4-3 Example Schematic Presentation for the Sample Preparation ................. 34
Figure 5-1 a) hBN particle b) Al2O3 particle improvement on storage modulus ....... 36
Figure 5-2 Loss Factor of Samples ............................................................................ 37
Figure 5-3 a) Synergetic Mixture of hBN-Al2O3 b) TiO2 and TiO2+Au improvement
.................................................................................................................................... 38
Figure 5-4 Storage modulus over temperature for all samples .................................. 39
Figure 5-5 Thermal Conductive Pathways in Composite Adhesive Structure .......... 41
Figure 5-6 Reference FTIR Spectrum (http://what-when-how.com/wp-
content/uploads/2011/06/tmp17058_thumb1.png) .................................................... 42
Figure 5-7 FTIR Spectrum of Neat Epoxy ................................................................. 43
Figure 5-8 FTIR Spectra of Epoxy with hBN particles ............................................. 44
Figure 5-9 FTIR Spectra of Epoxy with Al2O3 .......................................................... 44
Figure 5-10 FTIR Spectra of Synergetic Mixtures of hBN and Al2O3 ...................... 45
Figure 5-11 FTIR Spectra of TiO2 and Au-doped TiO2 Particles .............................. 46
Figure 5-12 SEM Screening of 20% hBN.................................................................. 47
Figure 5-13 SEM Images of 20% Al2O3 ................................................................... 47
Figure 5-14 SEM Screening of Synergetic Mixture .................................................. 48
Figure 5-15 Single Lap Shear Test Setup .................................................................. 49
Figure 5-16 Example of Shear-Strain Curve .............................................................. 50
Figure 5-17 Fracture Surface of Neat Epoxy ............................................................. 51
Figure 5-18 Al2O3 Particles’ Effect on Shear Stress .................................................. 52
Figure 5-19 Fracture Surfaces of Al2O3 Samples ...................................................... 52
Figure 5-20 hBN Particles’ Effect on Shear Stress .................................................... 53
Figure 5-21 Fracture Surfaces of hBN Particles ........................................................ 53
Figure 5-22 The Synergetic Mixture’s Effect on Shear Stress .................................. 54
Figure 5-23 Fracture Surfaces of Synergetic Mixtures .............................................. 55
Figure 5-24 TiO2 Particles’ Effect on Shear Stress .................................................... 55
Figure 5-25 Fracture Surfaces of TiO2 Particles ........................................................ 56


1
CHAPTER 1
1. INTRODUCTION
The applications of the adhesives are constantly increasing in the aerospace industry.
Even though, the history of the adhesive bonding dates back to the ancient times as
structural reinforcement materials, the most important innovations were achieved in
19th century. In the beginning of 20th century, the Wright Brothers and their plane
led onto a new industry called aviation. This new industry has led to the foundation
of the aerospace industry and advanced material development programs.[1]
Moreover, they also strengthened their wooden plane by using some protein-based
adhesives. They reduced the usage of mechanical fasteners that are used to join parts
of the plane. Then, they made possible to construct the plane lighter, durable and
stronger [1]. With the help of their applications, adhesives were introduced to the
aviation industry. During two world wars, the aviation industry had an inevitable
evolution from wooden airplanes to metallic ones. But the requirements remained
the same, namely lighter, more durable and stronger planes. Moreover, more
complicated and sophisticated adhesives were synthesized to satisfy the emerging
requirements. After the World War II, a statement was made as structural adhesive
bonding is a better option in aviation industry. The most important advantages over
conventional connection methods such as bolting and/or riveting are summarized as
follows [2]:
• Joining dissimilar materials
• Reduction in weight
• Better fatigue performances
• Design flexibility
• Well stress distribution over joint

2
• Smooth external finish
• Bonding thin substrates
• Cost and time effective
• Sealing in joint area
• Increased strength
Bonding is also used to support riveted structures against shear loading conditions.
During the world wars, the development in aerospace companies were driven by
defense and military contracts. However, by the end of the world wars era, the
aerospace companies encountered financial problems due to lack of new contracts.
Hence, a new path has emerged for the aerospace industry: commercial airplane
programs. As a result of the commercial applications, new standards and
certifications were constructed to ensure the safety.
Moreover, initial applications of the adhesive bonding were limited because of these
performance validation and certification requirements of aerospace structures. This
limitation was resolved by the development of new testing techniques such as
dynamic mechanical analysis, differential scanning calorimetry, thermogravimetric
analysis and thermal mechanical analysis. These techniques are mainly used to
understand and characterize the behavior of adhesives under service. So, more
systematic classification can be performed, and the usage of adhesives can be
broadened in aerospace industry.
In 1949, the world’s first commercial airliner with jet engine, the de Havilland
Comet, was developed and manufactured. In the Figure 1-1, it can be seen at where
adhesives were used as a joining agent [3].
In the modern era, awareness about adhesives was raised, and adhesives become
stronger and found new areas of usage. In the Figure 1-2, a well-known airplane
Airbus A380 and its parts with adhesives can be seen [4].

3
Figure 1-1 Diagrammatic view of the de Havilland Comet and where structural adhesives used, (A) Canopy
structure, (B) Longitudinal stringers of fuselage (C) Local doublers and reinforcements around windows
(D,E,H,J,K) Spanwise stringers, ailerons and flap structures, vertical stiffener flanges in wings (F) Wall
stiffeners in tail (G) Sealing in pressure dome (L) all stiffeners in pressure floor [1]
Figure 1-2 Schematic view of the Airbus A380 and adhesive bonding used areas[4]

4
As the structural behavior of the adhesives was well studied and understood,
possible application opportunities for adhesives have been emerged. So, new
adhesives were developed for specific applications. Currently, one of the most
important research areas is the development of adhesives for electronic applications
in the aerospace industry, especially for space applications where environmental
conditions become predominant. Electronic applications can be listed as below [5]:
• Bonding of surface-mount components
• Wire tracking
• Potting and encapsulating electronic components
• Conformal coating of circuit boards
Adhesives are valuable for electronics because of their electrical and thermal
properties, agility and possibility for design flexibility. Conventionally, almost all
electronic applications involve joining of components with circuit boards via
soldering. However, soldering operation needs high temperatures (up to 400 °C to
melt) that can harm the components or circuit boards. Hence, another advantage of
adhesives over traditional joining methods is that they do not need high temperature
to cure in case of sensitive applications.
For the development of the application specific adhesives, two methods are
constructed:
• Chemical synthesis: adhesives are continuously evolving with advances in
material and chemical engineering in time. New compositions and
formulations are sampled to construct the best adhesive in every aspect.
• Development of composite adhesives: In some aerospace applications, epoxy
adhesives are not qualified to service under flight conditions. Then, there
occurs a necessity to improve epoxy adhesives. Another way to achieve that
goal is adding organic/inorganic particles into epoxy adhesive. By this
method, drawbacks of epoxy can be covered by particles’ strength. Then, this
constructs a stable and strong epoxy composite adhesive.

5
Composite adhesives are developed to be either electrically conductive or
nonconductive adhesives. For the first group, graphite, graphene and carbon
nanotube can be used as additives [6,7]. But, the breakdown strength is affected
adversely. It is the minimum voltage to cause spark breakdown across the sample
whose thickness is known. The breakdown strength is in terms of volt per unit
thickness. Since electrical conductivity is gained by the particles’ properties,
composite adhesive becomes electrically conductive and this can cause problems on
electrical components [8]. In the second group, aluminum oxide [9], zinc oxide [10],
boron nitride [11] and titanium oxide [12] are widely preferred as additives. Their
electrical resistivity values make them useful in most of the electrical applications.
In addition, their improvements on physical properties of neat epoxy are observed as
enhanced thermal conductivity and lowered coefficient of thermal expansion [13].
Chemical synthesis needs more sophisticated approach than developing composite
adhesives. It is more related to field of chemistry science rather. In addition, it
requires lots of time and money investment. However, both electronic and aerospace
industries prefer the cost effective solutions on their joint operations. On the other
hand, development of composite adhesives is a straightforward process to follow.
Pre-synthesized and produced commercial epoxy is a good agent to work with. Since
chemical synthesis is not the profession of mechanical, aerospace or material
engineers, developing composite adhesives method can be implemented by these
engineers easily. It can be said that this process is time and cost saving. Also, filler
materials are easy to find and affordable to buy. After all, the development of
composite adhesives is more appropriate method to use in products for aerospace
industry.
In this work, due to time and cost limitations, development of composite adhesives
method was used to produce composite adhesives with enhanced thermal and
mechanical properties. In order to achieve this goal, a literature survey was carried
out to understand the methodology and, its performance, limitations and test
methods. Then, findings gathered from survey were examined and evaluated. After

6
that, applicable test methods, particle materials and specifications were investigated.
Moreover, performance enhancements of composite adhesive structure were
collected from literature as well, and they were presented in Literature Survey
chapter. Then, necessary tests for the thermal and mechanical properties from
literature survey were described in the Test Methods chapter. In the Materials and
Preparation Methods chapter, selected particles, particles sizes and geometries were
mentioned. Also, sample preparation methods and the points where the attention
should be paid were described. Finally, all study outputs were discussed and
conclusion remarks were presented.

7
CHAPTER 2
2. LITERATURE SURVEY
The need for superior adhesives leads to various studies to focus on developing new
materials. On the other hand, strengthening of readily available adhesives is a
method on which anyone can work. In aerospace applications, all systems are
generally exposed to harsh thermal cycles in flight. Even if adhesives are not
expected to bear high stresses; they need to preserve their structural integrity over
thermal cycles. Therefore, enhanced thermal properties of adhesives are needed to be
achieved by producing composite adhesives.
Among additive particle candidates, hexagonal boron nitride (hBN) has the
comparably high thermal conductivity value as ~300 W/m.K. Also, it has a low
coefficient of thermal expansion value, low dielectric constant, high electrical
resistivity and stable crystal structure. Moreover, it has no side effect on neat
epoxy’s electrical properties [14,15].
Zhou et al. [16] used 0.5 um sized hBN and diglycidylether of bisphenol A
(DGEBA) type epoxy resin in their study. They firstly modified particles’ surface
with trimethoxysilane and added the filler material in different weight ratios to
epoxy resin (0-50 wt. %). Then, for the characterization, Fourier Transform infrared
spectrometer (FTIR), differential scanning calorimetry (DSC), thermogravimetric
analyzer (TGA), scanning electron microscope, hot disk thermal analyzer and
broadband dielectric spectrometer were used. Epoxy initially had a thermal
conductivity of 0.22 W/m K. It is stated that adding hBN increases the thermal
conductivity values up to 1.2-1.34 W/m K. In Figure 2-1, change in behavior of
thermal conductivity can be seen.

8
Figure 2-1 Thermal Conductivity Values with increasing hBN ratio [16].
Glass transition temperature (Tg) is a threshold for polymers such that mechanical
behavior of polymer is turned from glassy behavior to rubbery. In DSC test results;
there is a slight influence on the thermal stability behavior of the composite until
filler ratio of 40 wt%. Then, between filler ratios of 40 and 50 wt%, Tg values
decreased. Tg in polymers is affected by many factors like free volume and
molecular weight [17]. When Tg value is reached, structural integrity of composite
adhesive is broken. In Figure 2-2, DSC results of samples can be seen.
For the mechanical tests, samples were prepared in a glass mold. Then, tensile and
flexural measurements were performed according to ASTM D-638 and D-790. Also,
they measured the impact strength with pendulum impact tester according to ASTM
D-256. The effect of hBN filling can be seen in Table 2-1.
0 5 10 15 20 25 30 35 40 45 500
0.2
0.4
0.6
0.8
1
1.2
1.4
1.6
1.8
2
Temperature (°C)
Th
erm
al C
on
du
ctiv
ity
(W
/m.K
)
hBN treated with silane coupler
hBN untreated

9
Table 2-1 Mechanical Properties of hBN filled Epoxy
Mechanical Properties hBN Concentration (wt%)
0 20 30 40 50
Tensile Strength (MPa) 68.2 63.6 58.2 51.2 45.1
Tensile Modulus (GPa) 2.68 2.82 2.93 3.12 3.14
Flexural Strength (MPa) 112 108 95 86 81
Flexural Modulus (GPa) 2.71 2.79 2.88 3.05 3.07
Impact Strength (kJ/m2) 16.2 14.5 12.3 10.3 8.2
hBN particles have higher rigidity than epoxy matrix. So, as they are added, both
flexural and tensile modulus increased. With increasing hBN content, the viscosity
of composite structure began to increase quickly. Therefore, some gaps, interfacial
defects and poor wettability between particles and epoxy matrix might occur,
resulting in worsening of mechanical properties. Also, a decrease in the impact
strength is observed. The filler makes composite structure more viscous than neat
epoxy. Then, some voids or internal defects in composite structure may become
inevitable. The authors stated that these defects can also affect the mechanical
property of composite structure.
Figure 2-2 DSC Results with varying hBN ratio[16]

10
Ekrem et al. [18] used boron nitride and carbon nanotube as filler material. They
focused on thermal stability and adhesive strength of composite structure. The
DGEBA based epoxy was selected as epoxy matrix which was used in defense
industry. Boron nitride particles were produced by themselves. They used the arc
discharge method for production. Also, carbon nanotubes (Ø50x10-30 nm) were
purchased from the market. Adherends were chosen as AL2024-T3 sheets in size of
101.6x25.4x2 mm. The bonding length was 12.7±0.1 mm. Moreover, six cases were
prepared for characterization process. These cases are summarized in Table 2-2. For
the thermal analysis, DSC tests and TGA tests were conducted. Single lap strength
joint testing was conducted to determine adhesive strength as mechanical property.
Test was in accordance with ASTM D1002-10 standard.
Table 2-2 Test Specimens Composition
Case Carbon Nanotube wt% Boron Nitride wt% Epoxy wt%
1 0 0 100
2 0.3 0 99.7
3 0 0.5 99.5
4 0.1 0.5 99.4
5 0.3 0.5 99.2
6 0.5 0.5 99
It can be concluded from the results that filler materials had improving effect on
mechanical property of epoxy adhesive [18]. Nanoparticles and epoxy have an
intimate contact. Then, particles fill the pores in the epoxy structure and improve the
strength of bond. This mechanism is described by mechanical interlocking [19].
Their measurements showed that neat epoxy had approximately 10 MPa shear
strength. Case 3 had 13 MPa of shear strength which can be stated as slight increase.
On the other hand, case 5’s shear strength was 15 MPa. So, the synergetic effect of
these two fillers is more effective than single filler type. Slight increase can be
explained by agglomeration and/or wetting problem.
Improvement of the neat epoxy’s mechanical properties by using Al2O3 particles has
been studied well in recent years [20-24]. Al2O3 particles have high stiffness around

11
386 GPa which is way higher than most of epoxy adhesives. So, there is a huge
potential to have well stiffened composite adhesives [25]. Also, they have low
density and high dielectric strength which make Al2O3 an attractive candidate as
additive particle [26].
Jiang et al. [27] studied thermo-mechanical behaviors of reinforced epoxy resins.
They used 80 nm Al2O3 particles and DGEBA type epoxy resin. The Al2O3 weight
content is varied from 1 to 4%. In their study, Scanning Electron Microscope (SEM),
DSC, TGA, Dynamic Mechanical Analysis (DMA) and Thermal Mechanical
Analysis (TMA) were conducted.
In Figure 2-3, DSC results for all samples can be found. Therefore, it can be seen
that Tg values are raised from 170 °C to 181.8 °C by increasing weight ratio of Al2O3
to 2 wt.%. When filler materials are added into epoxy matrix, particles form bond
with polymer chains. Then, these bonds behave in a way to hold polymer chains and
particles together. So, glass transition temperatures are increased.
Figure 2-3 Tg Values from DSC Results with varying Al2O3 Content[25]
12
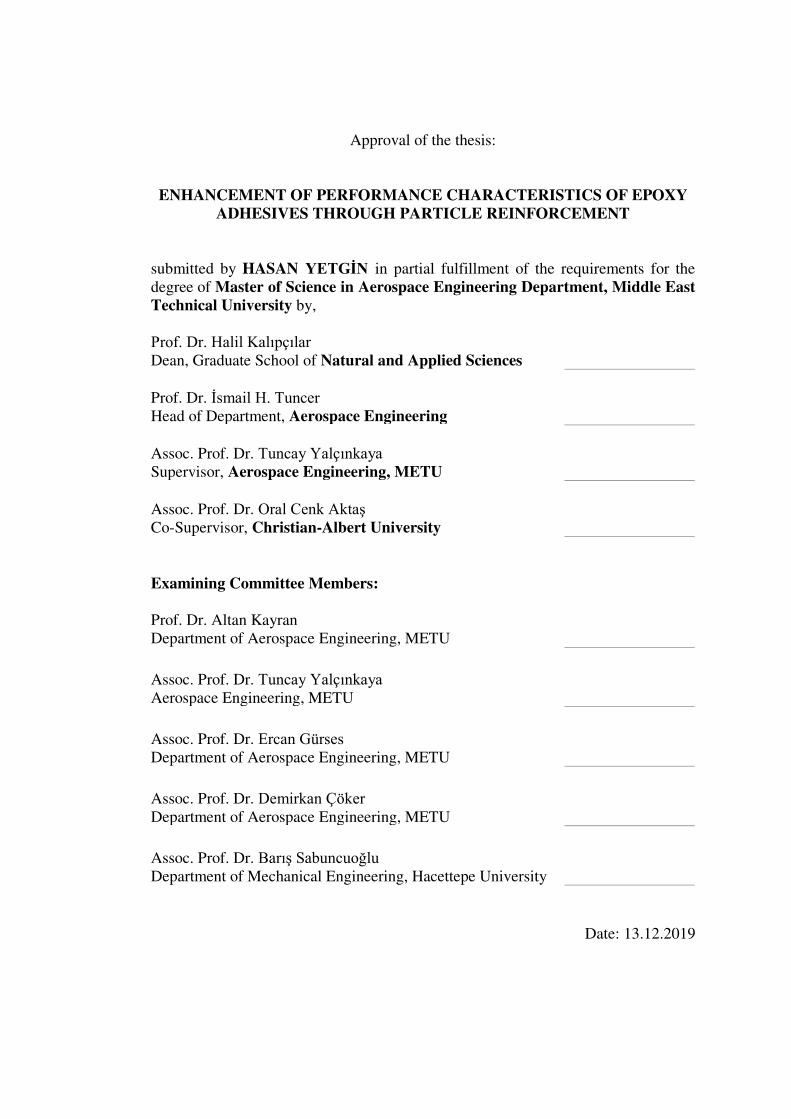
In TGA thermograms, thermal stability of the composite structure can be examined.
T5% values by adding Al2O3 are listed in Table 2-3. T5% is the temperature value
where composite structure lost 5% of its weight. In addition, char is the residue from
composite structure when it is heated up to 800°C. It can be clearly shown that with
particle addition, temperature values remain almost the same as the neat epoxy. So,
particle addition has no significant influence on thermal stability of neat epoxy resin.
Hence, Al2O3 can be approved as attractive candidate by these results.
Table 2-3 Thermal Stability of Composite Adhesive
Al2O3 Content (wt%) T5% (°C) Char (%) at 800°C
0 362.1 14.3
1 361.0 15.3
2 360.8 16.5
3 361.0 17.5
4 358.2 18.2
It can be seen from TMA results that there is a decreasing trend in coefficient of
thermal expansion (CTE) over increasing the Al2O3. In glassy region, CTE values
decreased from 79.8 to 75.5 x10⁻⁶ 1/°C. Moreover, storage modulus decreased from
1513 to 1378 MPa. On the contrary, in rubbery region, it increased from 37.7 to 41.4
MPa. Therefore, these composite adhesives have good heat resistance with increased
particle percentage [27]. In addition, Hu et al. [28] focused on production of Al2O3
particles which have promising synergy with epoxy adhesive for electronic
packaging. They produced 1.36 um sized Al2O3 particles. Also, they compared its
performance with aluminum nitride, silicon dioxide and diamond particles in the
literature. Composite adhesives with 58 and 70 wt% filler content were produced.
Result of samples with 60 wt% Al2O3 filler content was compared with their own
composite adhesives. For the characterization of composite, field emission scanning
electron microscope (FESEM) observations, TGA, thermal conductivity, dielectric

13
measurement and flexural strength measurements are done. In Figure 2-4, it can be
seen that the thermal conductivity value is increased from 7.15 to 13.46 W/m K over
58% to 70% Al2O3 content. The sample whose results were taken from literature had
the thermal conductivity of 4.3 W/m.K. The filler material prepared by Hu et al. had
brilliant effect on thermal conductivity compared with commercial Al2O3 particles.
Figure 2-4 Thermal Conductivity over Al2O3 Content[26]
Flexural strength tests showed that adding Al2O3 had constructive effects on flexural
strength. It is measured as 150.9 MPa for 58 wt% Al2O3 content. Then, for 70wt%
Al2O3 content, it is increased to 305 MPa. In addition, dielectric constant is also
raised from 6.4 to 7.6 kV/mm [29].
Zhai et al. [30] also used nano- Al2O3 as filler material to produce a composite
adhesive structure with better thermal, mechanical and multifunctional properties.
Their work focused on adhesion strength of epoxy adhesive. The nano- Al2O3
particles were in average size of 80nm diameter. Then, as an epoxy adhesive,
commercially available two component epoxy was selected. The adhesion strength
54 56 58 60 62 64 66 68 702
4
6
8
10
12
14
Al2O3 Content (vol%)
Th
erm
al C
on
du
ctiv
ity
(W
/m.K
)

14
was measured by pull-off adhesion test. Test method was in accordance with the
standards of ASTM D4541 and ISO 4624. Steel dollies in 20 mm diameters and steel
sheets in 100x40x1.7 mm were used as adherends. They prepared neat epoxy and
2wt% Al2O3 samples and three different steel sheets with different surface
roughness. So, they also tried to explain the relationship between adhesion strength
and surface treatment of adherends. Test results showed that nano- Al2O3 had
significant influence on adhesion. Adding 2 wt% nano-Al2O3 increased the neat
epoxy’s adhesion strength from 3.8 to 18.4 MPa. In addition, surface abraded with
150 grits silicon carbide paper had this best strength.
Bian et al. [14] studied the synergistic effects of the micro-BN and nano-Al2O3
added composites. As an epoxy resin, DGBEA type is selected. Micro-BN particles
are in ~10um size and nano-Al2O3 particles are in ~30nm size. In order to examine
the effects of filler arrangement, they prepared and labeled composite specimens as
BdAKx-y/z where Bd is modified BN, AK is modified Al2O3, x is total filler content
in wt. %, y/z represents Bd/AK proportion in total filler content. Their tested
composite specimens are shown in Table 2-4.
Table 2-4 Test Specimen Matrix
BdAKx-y/z
x 0 10 20 30
y N/A 0 1 2 3 4 0 1 2 3 4 0 1 2 3 4
z N/A 4 3 2 1 0 4 3 2 1 0 4 3 2 1 0
SEM, DSC, TGA and dielectric measurement are done for characterization. Tg value
of neat epoxy resin is measured as 133.22 °C. Then, for the same y/z ratio with
increasing x value, Tg values are in lowering trend. For Bd/AK10-3/1 to Bd/AK30-
3/1, Tg value is decreased to 126.75 °C. In addition, for 30 wt% filler content, there
is no distinctive behavior in changing of Tg value with different y/z ratios. This can
be explained by that there should be an interface compatibility problem between the

15
filler and matrix which is inevitable. Consequently, there occur tiny gaps and defects
that have effect on chemical behavior of composite adhesive. Thermal conductivity
values tend to increase with both x and y/z values. The neat epoxy’s thermal
conductivity value is measured as 0.169 W/m.K. Increase in y/z has greater
influence on thermal conductivity. For instance, samples with x value as 30 have
following thermal conductivity values over y/z values 0/4, 1/3, 2/2 and 3/1; 0.373,
0.542, 0.822 and 1.182 W/m.K. For the dielectric constant, filler materials have
positive effect on it. Since Al2O3 has better dielectric properties, increasing Al2O3
partition enhances dielectric constant more than BN particles. In their work, they did
not conduct tests to characterize mechanical properties.
Titanium oxide particles are characterized by good chemical stability, high chemical
resistance and high hardness [31]. In recent years, titanium oxide particles’ effects
on the properties of neat epoxy adhesive have been studied. These studies showed
that addition of titanium oxide particles increases the flexural strength, elastic
modulus and crack resistance [31,32]. In addition, significant improvements in
thermal and viscoelastic properties of the neat epoxy resin are seen in the literature
by addition of titanium oxide particles [33]. TiO2 particles have impressive reactivity
with epoxy matrix, so it can be expected that they have favorable influence on
mechanical properties of composite structure.
Sahu and Satapathy [34] held a study on microsized titanium oxide added epoxy
resin to enhance thermal conductivity of composite adhesive. Their work was
focused on microelectronic applications. Technological developments on
microelectronics lead to demands in faster and denser circuits. So, avoiding
overheating of the components was highly required. In their work, they also
proposed effective thermal conductivity correlation to eliminate testing procedure. In
addition, they calculated the effective thermal conductivity values by different
methods like Maxwell’s method and Lewis Nelson’s Method. As epoxy resin, they
used one of the commercially available DGEBA type epoxy. The neat epoxy had
thermal conductivity value of 0.363 W/m K. For the additive particle, 100 um sized

16
titanium oxide (TiO2) was procured for its moderate density which was 4.197 g/cc.
Moreover, particles had the thermal conductivity value of 11.6 W/m K which is
relatively high when compared to epoxy itself. They prepared 11 samples with
varying TiO2 from 0 to 25 vol%. Measured thermal conductivity values can be seen
in Table 2-5.
Table 2-5 Thermal Conductivity Values of TiO2 added Composite Adhesives
Filler Content (vol%) Measured Thermal Conductivity (W/m K)
0 0.363
2.5 0.364
5.0 0.398
7.5 0.417
10.0 0.469
12.5 0.520
15.0 0.581
17.5 0.632
20.0 1.108
22.5 1.117
25.0 1.120
Kumar et al. [35] focused on improvement of mechanical and thermal properties in
their study. They used one of the commercially available DGEBA type epoxy resin.
Also, 30-40 nm sized TiO2 with purity of 99.9% is selected as the additive particle
material. Three types of samples were prepared by ratios of 5, 10 and 15 wt%. In
order to observe changes in thermal properties, DMA and TGA tests were
conducted. Hence, up to 10 wt%, storage modulus is increased. But, at 15 wt%, it is
suddenly decreased. This decrease is due to the fact that by increasing the movement
of chains and molecular motion, storage modulus tends to decrease. Since, polymer
chains move instead of standing still and storing energy under deformation. In the
study, it was seen that agglomeration and density was increased at 15 wt%. Then,
agglomeration seemed suspicious reason for this drop in storage modulus. From
DMA results, in the glassy region, enhancement of 29% of storage modulus was
obtained at 10 wt%. In addition, thermograms from TGA tests showed that up to 10
wt% thermal stability was increased. But, at 15 wt%, it was dropped.

17
Table 2-6 TGA Values for Thermal Stability
Weight Loss
(%)
Decomposition Temperature (°C) Neat Epoxy 5 wt% 10 wt% 15 wt%
25 371 374 378 375
50 381 388 393 389
75 401 415 435 420
Tutunchi et al. [36] studied on adhesion strength of steel-glass/epoxy composite
joints. In their work, two-part structural acrylic adhesive and nano-TiO2 were
included. In addition, as usual, adhesive were selected among commercially
available ones. Nano-TiO2 particles were in size of 20 nm diameter. Composite
structure was prepared in 8 different types for 8 different composition of epoxy/filler
material. These compositions were listed as; 0, 0.5, 1.0, 1.5, 2.0, 2.5, 3.0 and 3.5
wt% ratio of nano-TiO2 to epoxy. Then, the samples were characterized by shear,
tensile and peel tests. Peel tests were prepared as T-peel (90°) and test was
conducted in accordance with standard of ASTM D1876-08. For tensile tests, tensile
butt joints were arranged and tested according to standard of ASTM D2095-96.
Then, single lap shear joints were assembled and test was managed in accordance
with standard of ASTM D1002-10. From tensile and shear test results, it could be
said that up to 3wt% adding TiO2 increased the adhesion strength. Summarized
results are tabulated in Table 2-7.
Table 2-7Test Results of Samples
Composition
(wt%)
Shear Strength
(MPa)
Tensile Strength
(MPa)
Peel Strength
(N/mm)
0 22.6 27.0 47.5
0.5 23.2 27.2 36.0
1.0 27.0 30.0 27.0
1.5 28.5 31.1 27.1
2.0 29.0 35.2 36.5
2.5 30.0 37.5 39.5
3.0 33.2 43.0 35.0
3.5 27.1 38.0 34.7
Improving the adhesion strength was highly affected by stress transfer between
epoxy matrix and particles. Enhancement in strengths can simply be explained

18
phenomenon. As mentioned before, these particles and epoxy matrix were in
intimate contact [19]. This contact made stress transfer efficiently onto joined
particles. Therefore, higher joint stresses were achieved. Weakening of strengths
after 3 wt% TiO2 could be explained that all particles filled gaps in epoxy matrix and
made intimate contact with epoxy. So, further added particles could not interact
effectively and made epoxy matrix poor. Also, viscosity of composite structure was
increased by adding particles which could lead to non-uniform distribution of TiO2
into epoxy matrix. Moreover, because of high viscosity, problems in degassing could
be occurred. Therefore, mechanical behavior of epoxy matrix was diluted.
Titanium oxide with Au-doped (TiO2+Au) was synthesized at the material
laboratory at Christian-Albert University. Hierarchical Au Needle Clusters
(HAuNCs) were accumulated on TiO2 particles by the photocatalytic reduction of
Au3+ ions. Then, TiO2 particles were plunged into a quartz cuvette filled with
aqueous HAuCl4 solution. Later, UV LED with wavelength of 365 nm irradiated the
quartz cuvette. After irradiation process, the particles were rinsed with deionized
water and dried with nitrogen [37]. There is no literature information about usage of
TiO2+Au as filler material in composite structure. Also, there is lack of mechanical
and thermal properties as expected. TiO2+Au particles and epoxy interaction is
illustrated in Figure 2-5. Since TiO2 particles have better reactivity with epoxy, OH
bonds are constructed between TiO2 particles and epoxy matrix which are illustrated
as green arrows. On the other hand, Au particles are not willing to construct bonds
with epoxy matrix which are illustrated as red arrows. Also, Au particles have poor
mechanical properties by contrast with their excellent thermal properties. With the
TiO2+Au and epoxy combination, mechanical properties of TiO2 and thermal
properties of Au are fused together to have enhanced filler material.

19
Figure 2-5 TiO2+Au and Epoxy Interaction
2.1. Aim of the Study
With the development in the fields of chemistry and material engineering, adhesives
take more places in the aerospace industry. In the aerospace industry, performance
criteria become more compelling. In this thesis, the development and
characterization of composite adhesives were conducted for a special case study.
In this case study, the research was focused on an application where adhesives are
used to join glass to metal and glass to glass parts. Also, relative positions of these
parts are important to fulfill operation requirements. For this assembly, service
temperature is determined to be between -30 to 55 C°. Used adhesive is a
commercially available epoxy adhesive, Loctite 9412. Its thermal properties are
insufficient to endure heat cycles. Therefore, structural integrity failed due to the
lack of heat conduction. As a result, assembly is no more operable. Then, it can be
seen that there should be more sophisticated adhesives to fulfill this industry’s needs.
Regarding this, development of composite adhesives is adopted way to enhance
thermal properties of commercially available epoxy resin by adding particles. Then,
from the literature, hBN, Al2O3 and TiO2 particles become prominent candidates as
filler particles. Moreover, Au-doped TiO2 particles are synthesized due to its
expected greater thermal properties for this study as filler particles. In order to

20
characterize the thermal properties of composite adhesive, following tests are
conducted in accordance with literature;
• Dynamic Mechanical Analysis (DMA)
• Differential Scanning Calorimetry (DSC)
• Scanning Electron Microscopy (SEM)
• Thermal Conductivity (TC)
• Fourier Transform Infrared Spectrometry (FTIR)
• Single Lap Shear Test

21
CHAPTER 3
3. TEST METHODS
Testing of the samples is the core of this study. In order to have meaningful results,
test devices and their working principles should be known well. Also, sample
dimensions have an influence on the test results. Therefore, there should not be
geometrical difference between samples. Hence, it can be said that test results vary
only with sample’s internal structure which is the aim of testing.
In this chapter, conducted tests necessary to characterize composite adhesive are
described. Used test devices and their working principles are also explained.
Moreover, the standards followed during tests and sample geometries are mentioned.
3.1. Dynamic Mechanical Analysis (DMA)
DMA is a widely used technique to characterize sample’s mechanical properties
over temperature, time, frequency, stress, atmosphere or combination of these
parameters. In DMA technique, sinusoidal small stress is applied to the sample.
Then, response of sample is read by the DMA device. Therefore, stiffness and
damping are measured. The stiffness is separated in two parts; storage modulus and
loss modulus. Since the excitation is in sinusoidal form, storage modulus (E’) is the
in-phase component of stiffness which is a measure of elastic response of material.
Also, it is related with the stored energy in polymer. The loss modulus (E”) is the out
of phase component which is a measure of viscous response. It is related with energy
dissipation as heat. These are reported as damping and modulus. Damping is the
energy dissipation of material in cyclic loading. It is also the ratio of loss to storage
modulus which is called as tanδ and equated by following equation;
𝑡𝑎𝑛𝛿 = E′E′′

22
ARES G2 Rheometer was used for DMA tests in torsion mode which is shown in
Figure 3-1. Samples were prepared in dimensions of 4 x 10 x 50 mm and heated
from 25 to 250 °C with 5 °C/min at frequency of 1 Hz. Tests are conducted in
accordance with ASTM D 7028 standard. The tolerance in the results is 8%. The
example of prepared samples can be seen in Figure 3-2.
Figure 3-1 ARES G2 Rheometer (https://www.tainstruments.com/ares-g2/)
Figure 3-2 DMA Sample

23
3.2. Differential Scanning Calorimetry (DSC)
The DSC is a well-known technique in thermal analysis. Simply, this device is used
to see how polymers’ thermal behavior changes when heat is applied. There are two
heating pans. The sample is placed in the one pan and the other one is left empty.
Later, the device heats the both pan with same heating rate. As expected, the pan
with sample is needed to be heated more. Then, it can be made that a plot of
difference in heat output over temperature. In addition, the device can detect the
phase transitions of the sample like glass transition, crystallization and melting. In
the plot, after a certain temperature, curve is shifted upward suddenly. This certain
temperature is named as glass transition temperature. In Figure 3-3, an example plot
of heat flow over temperature can be seen. The sudden change in curve is pointed on
the plot and the temperature where it occurs is the glass transition temperature. TA
Instruments Q200 model is used for DSC analysis seen in Figure 3-4. The test
environment is He or N2 atmosphere. Samples were prepared with the dimensions of
Ø10x10 mm which can be seen in Figure 3-5. Then, they were heated at rate of 10
°C/min. Gas is flowing at 25 mL/min. The tolerance in measurements is ±3 °C. The
tests were conducted in accordance with following standards;
• ASTM E 1269 – 01,
• ASTM E 1356 – 03,
• ASTM D 3418-03,
• ISO 11358,
• ASTM E793,
• ASTM E 698

24
Figure 3-3 Example of DSC Plot
Figure 3-4 TA Instruments Q200 (yorku.ca/tbaumgar/photo/album/ta-instruments-dsc-q200)
0 10 20 30 40 50 60 70-0.5
-0.45
-0.4
-0.35
-0.3
-0.25
-0.2
-0.15
-0.1
-0.05
0
Temperature (C)
Hea
t F
low
(W
/s)

25
Figure 3-5 DSC Sample
3.3. Fourier Transform Infrared Spectrometer (FTIR)
Fourier Transform Infrared Spectrometer (FTIR) is an analytical method which is
widely used in academic laboratories and industrial applications. It aims to
understand the internal structure of materials and composition of molecular
mixtures. Also, identification of bonds between organic/inorganic molecules is
intended in this method. FTIR spectroscopy uses radiation which is modulated and
mid-infrared to interrogate the sample. The radiation is absorbed by sample at
specific frequencies. Also, these frequency values are related to vibrational bond
energies of functional groups in the sample. Hence, the device measures the
absorbed partition of this radiation and plots transmittance versus wavelength as an
output. The bands where absorption occurs can be used to diagnose molecular
components and structures. Higher vibrational state is reached by molecules after
they absorb the radiation. The wavelength of light absorbed is a function of energy
absorption and unique for every molecule. Bruker Tensor 27 is used to perform this
measurement which can be seen in Figure 3-6. This device’s range of wavelength is
between 400 – 4000 cm-1 and resolution is 1 cm-1. In the range of 4000-1500 cm-1,
absorption is due to functional groups e.g., -OH, C=O, N-H etc. But, the region from
1500-400 cm-1 is where the material specific absorption bands are occurred. The

26
sample is the one used in DMA tests. The measurements were performed in
accordance with ASTM E1252 standard.
Figure 3-6 Bruker Tensor 27 FTIR Spectrometer(http://triadsci.com/en/products/ftir-ir-and-near-ir-
spectroscopy/946/bruker-tensor-27-ftir-bruker-ftir-bruker-27/251160)
3.4. Thermal Conductivity (TC)
Thermal conductivity is described as ability of materials to conduct heat through
itself. Thermal conductivity is one of the crucial properties for the materials under
service where high temperature gradients occur. The sample is placed and
compressed with a load between two plates in the device. The lower plate is also
connected to a heat flux transducer which is calibrated. When heat is transferred
from upper plate to lower plate, a temperature gradient is built across sample. This
temperature gradient and heat transfer are measured by the device. With the known
thickness, thermal conductivity can be calculated for the sample. TA Instruments
DTC-300 shown in Figure 3-7 is used. The sample has dimensions of Ø50x6 mm
which can be seen in Figure 3-8. The tests were conducted in accordance with
ASTM E1530 standard.

27
Figure 3-7 TA Instruments DTC-300 (https://www.tainstruments.com/dtc-300/)
Figure 3-8 Thermal Conductivity Sample
3.5. Scanning Electron Microscope (SEM)
Scanning electron microscope (SEM) is a type of microscope which is used to study
the surface of solid objects. It scans with a focused beam which has relatively low
energy over a surface to create an image of sample surface. Firstly, sample is frozen
into liquid nitrogen and broken into two pieces. Later, the image is taken from newly

28
formed broken surface. This image gives information about the sample’s inner
topography and composition. Carl Zeiss Supra 55 is used for the test, which can be
seen in Figure 3-9.
Figure 3-9 Carl Zeiss Supra 55(https://www.cecri.res.in/SAIF/carl.html)
3.6. Single Lap Shear Test
Single lap shear strength is a common property available in data sheet of the
adhesive. The single lap shear test is also named as thin lap shear test and conducted
to measure shear strength of the adhesive film. The test is applied to determine
adhesive strength, surface preparation parameters and environmental durability. It is
the most extensively method of displaying data on adhesively bonded joints. There
are lots of single lap joint shear tests. Test is performed using standard
tension/compression mechanical test machine (Instron 5500R) according to ASTM
D1002-10 standard which specifies lap shear test for metal to metal specimens. The

29
device can be seen in Figure 3-10. The pulling rate is 1.3mm/min. The adherends
have the dimension of 25.4x101.6x1.62 mm. Examples of test specimens can be seen
in Figure 3-11.
Figure 3-10 Instron 5500R
Figure 3-11 Test Samples


31
CHAPTER 4
4. MATERIALS AND PREPARATION METHODS
In the aerospace industry, demand for advanced adhesives is increasing. Both strict
requirements and scarcity of sophisticated adhesives cause obstacles to fulfill
performance requirements. So, development of advanced composite structures using
readily available materials become inevitable. These materials including epoxy resin
and filler particles can be purchased in large amounts and stocked easily. Therefore,
epoxy adhesive is selected due to its easy accessibility. On the other hand, filler
particles are the materials which are widely used in previously reported studies. In
addition, hBN particles were purchased from Nanografi which is a domestic firm.
Moreover, Al2O3 particles were from Sigma-Aldrich®. Exceptionally, Au doped
TiO2 particles were synthesized at the material laboratory. The aim of including
these particles is the great thermal properties of Au and their acceptable reactivity
with TiO2 particles.
Samples need a well-defined, labor intensive preparation method. For instance,
epoxy adhesives have high surface tension which prevents wetting sometimes. This
wetting problem results in gaps between particles and epoxy resin and thermal
conduction in the composite structure is interrupted. Therefore, adding particles can
harm the epoxy adhesive rather than enhancing it. Moreover, the epoxy adhesive is a
viscous fluid in most cases. By adding particles, viscosity is also increased. So,
pouring into molds becomes a challenging process. Consequently, air bubbles can be
trapped easily in this viscous composite structure. Bubbles can cause obstacle in
thermal conduction and weakness in mechanical strength. The bubbles in composite
structure can be seen in Figure 4-1. This bubbled sample is prepared without a
delicate procedure. The enhancement in properties demands also homogeneity in the
composite structure. In order to prevent defects and encourage interactions, detailed

32
sample preparation method is studied and described. In Figure 4-1, a sample without
this procedure and one with it can be seen. Therefore, how this method could
improve the sample’s quality can be seen easily.
Figure 4-1 Bubbled and Regular Samples
4.1. Materials
In this study, commercially available Loctite® EA 9412 Hysol was used. It is a two-
part epoxy adhesive with low viscosity. Moreover, its availability and wide usage
area in the company make it a strong candidate for epoxy resin in this study. As
additive particles, following materials are used; hBN (65-75 nm), Al2O3 (80 nm),
TiO2 (~100nm) and Au-doped TiO2 (~100nm). hBN and Al2O3 particles are
commonly used additive materials found in literature. TiO2 particles also occur in
literature as additive materials, but not commonly as former ones. Since Au-doped
TiO2 particles are product of a material laboratory, there is no literature knowledge
about usage of these particles as additive materials.
4.2. Sample Preparation Methods
Sample preparation has three minor steps which are preparation of molds,
preparation of particles and preparation of composite structure. Firstly, all molds and
adherends are washed with de-ionized water and wiped with dust dry cloth. Then,
for all cleaning and degassing steps, ultrasonic cleaner is used as a preliminary step
for preparation. The device is one of the Cole-Parmer® ultrasonic cleaners. Before
the processes, ultrasonic cleaner is checked and degassed. After ultrasonic cleaning,
oven is used for particle drying and curing the composite adhesive. Moreover,

33
vacuum oven is used in only vacuum mode for de-airing pre-mixture of epoxy resin
and particles. Also, supplementary tools are cleaned with de-ionized water, acetone
and alcohol. Then, they are visually controlled for any residuals which come from
previous samples.
4.2.1. Molds/Adherends Preparation
There are four molds and two adherends to prepare test samples. Firstly, they are
dismantled. Then, residue of adhesives on the molds from previous operations are
removed gently. All parts are cleaned in ultrasonic cleaner at acetone, ethanol and
de-ionized water filled beaker respectively for 20 min each. Afterwards, parts are
dried with nitrogen. Finally, all molds are assembled and ready for operation. In
Figure 4-2, used molds are illustrated. Molds are manufactured from Teflon material
to provide that cured composite adhesive can be removed from molds easily. In
addition, the adherends for single lap shear tests are manufactured from Al 2024-T3
in accordance with ASTM B-209 standard.
Figure 4-2 Molds of a) Thermal Inductivity b) FT-IR c) DSC d) DMA Tests
4.2.2. Particles Preparation
Humidity on particles is a possible cause for wetting problem between particles and
epoxy resin. So, particles are weighed and transferred to ceramic containers. Before
mixing, all particles are baked at 120 °C for 1 hour on the purpose of

34
dehumidification. After baking, ceramic containers are cooled to room temperature.
In order to prevent dust or other dirt particles, aluminum folio is used as lid.
4.2.3. Composite Adhesive Preparation
Part A of epoxy adhesive is transferred to Teflon beaker with attention not to cause
air bubbles in it. In the vacuum cabinet, adhesive can be spilled out while de-airing.
In order to prevent this, as a preliminary de-airing process, the beaker is de-aired in
ultrasonic cleaner for 20 min. Then, beaker is vacuumed in vacuum cabinet to 4.2
Torr for 1 hour to de-air completely. Afterwards, de-aired part A and baked particles
are mixed together until blend gets homogeneous. Later, mixture is de-aired in
ultrasonic cleaner for 20 min and vacuum cabinet for 1 hour as mentioned before.
Then, part B is added to blend and mixed to get homogeneous blend. By adding part
B, curing process is started and there is a need to operate faster. Final blend is de-
aired in ultrasonic cleaner for 2-5 min. Finally, blend is poured into molds. In order
to prevent air bubbles, pouring is done carefully, slowly and very close to bottom of
molds. The composite adhesive is cured in oven at 82 °C for 1 hour. The method is
illustrated in Figure 4-3 for hBN and Al2O3 particles.
Figure 4-3 Example Schematic Presentation for the Sample Preparation
.

35
CHAPTER 5
5. RESULTS AND DISCUSSION
Samples were prepared in accordance with an exclusive preparation method. Since
defects in samples affect test results dramatically, following this method is crucial to
produce homogenous and flawless samples. Also, samples were fit for related
international standards. By this way, comparison of the test results got from this
work and previous studies becomes simpler. In addition, all tests were conducted in
conformity with international standards. This also contributes the comparability and
reliability of study. The preliminary results of this work are reported and published
[38,39].
Composite adhesive’s mechanical properties over temperature were measured by
DMA tests, namely storage modulus and loss factor. The storage modulus can be
related with cross-links between epoxy resin and particles. Moreover, storage
modulus of samples can be seen in the following figures.
In Figure 5-1a, improvement effects of adding hBN over neat epoxy can be seen. For
the service temperatures less than 55 °C, up to 30 wt% ratio, hBN has no
constructive effect on mechanical properties of neat epoxy. On the contrary, 30 wt%
ratio of hBN improves the storage modulus but its contribution is less significant.
For 20wt% hBN content, storage modulus decreases for all temperature range. As
cross-linking increases, storage modulus is expected to increase. Therefore, the
decrease in storage modulus might be caused by poor interaction between particles
and epoxy. In the light of this information, additional action is necessary to make
improvements in mechanical properties. Moreover, in Figure 5-1b, Al2O3 particle’s
development in mechanical properties is shown. In service temperature range, there
is a downgrade in storage modulus for 10 wt%. But, after 40 °C, storage modulus
becomes higher than neat epoxy. For the 20 wt% ratio, an obvious improvement can
be seen thanks to favorable alignment of Al2O3 particles into composite adhesive.

36
Figure 5-1 a) hBN particle b) Al2O3 particle improvement on storage modulus

37
The loss factor (tan δ) of samples obtained from DMA can be seen in Figure 5-2.
The loss factor is described as ratio of loss modulus to storage modulus. The loss
modulus can be stated as the energy dissipation of polymer chain motion in
composite adhesive. Except 30wt% TiO2 and 20wt% hBN, addition of particles
shifts the peak position of loss factor. The loss factor also gives an assessment about
the composite’s damping effect.
Figure 5-2 Loss Factor of Samples
In Figure 5-3, effect of synergetic mixture of hBN and Al2O3 on neat epoxy is
considered. Also, effects of TiO2 and TiO2+Au can be seen. In Figure 5-3a, 22.5-7.5
wt% hBN-Al2O3 particle mix does not upgrade or downgrade the storage modulus.
In addition, 24-6 wt% hBN-Al2O3 particle mix has improvement in service
temperature. Its behavior during glass to rubber transition matches with neat epoxy.
Furthermore, in Figure 5-3b, adding TiO2 or Au doped TiO2 does not improve the
35 40 45 50 55 60 65 700
0.1
0.2
0.3
0.4
0.5
0.6
0.7
0.8
0.9
1
Temperature (C)
tan
(d)
Neat Epoxy
10% Al2O3
20% Al2O3
10% hBN
20% hBN
30% hBN
22.5-7.5%hBN-Al2O3
24-6%hBN-Al2O3
30% TiO2
30% TiO2+Au

38
mechanical properties. Likewise, it worsens the storage modulus in whole service
temperature range.
Figure 5-3 a) Synergetic Mixture of hBN-Al2O3 b) TiO2 and TiO2+Au improvement

39
Overall comparison of particle addition effects on storage modulus is shown in
Figure 5-4. The more favorable improvement is achieved by 24-6 wt% hBN-Al2O3
particle mix in the temperature range of 30 to 40 °C. After that region, 20 % Al2O3
ratio has better behavior of storage modulus.
Figure 5-4 Storage modulus over temperature for all samples
DSC tests were conducted to measure glass transition temperature (Tg) value of
polymers. In order to achieve this goal, adhesives are needed to be solid and still.
After Tg value is reached, adhesives behave like rubbery polymer which is
undesirable. In Table 5-1, Tg values of all samples can be found. Al2O3 enhances Tg
value faster than hBN. In the particle mix configuration, the mix with more Al2O3
has better value than other sample. TiO2 and Au doped TiO2 particles have the most
favorable improvement on Tg value.
35 40 45 50 55 60 65 700
1
2
3
4
5
6
7
8
9
10x 10
8
Temperature (C)
Sto
rag
e M
od
ulu
s (P
a)
Neat Epoxy
10% Al2O3
20% Al2O3
10% hBN
20% hBN
30% hBN
22.5-7.5%hBN-Al2O3
24-6%hBN-Al2O3
30% TiO2
30% TiO2+Au

40
Table 5-1 Glass Transition Values of All Samples
Samples Tg (°C)
Neat Epoxy 44.54
+10% h-BN 45.82
+20% h-BN 47.08
+30% h-BN 49.73
+10% Al2O3 47.73
+20% Al2O3 47.98
+22.5% h-BN+7.5% Al2O3 49.00
+24% hBN+ 6% Al2O3 47.04
+30% TiO2 51.55
+30% TiO2+Au 55.92
As can be seen in Figure 5-5, added particles form thermal conductive pathway to
enhance thermal conductivity of composite adhesive. Adding hBN shows the most
significant improvement on neat epoxy’s thermal conductivity. This is expected
since hBN platelets have relatively high thermal conductivity (~300 W/m.K).
Thermal conductivity values at different temperatures are briefed in Table 5-2. It can
be easily seen that thermal conduction is carried by hBN platelets mostly. The more
hBN it contains, the more heat it can transfer. When concentration of hBN increases,
platelets start to contact each other and form a favorable pathway to thermal
conduction. This mechanism also works for other type of particles except TiO2+Au.
The thermal conductivity values of synergetic mix of hBN and Al2O3 shows that
only hBN is not adequate to carry all the heat because of the wetting problem on the

41
platelets and gaps around platelets. Al2O3 has the geometry of sphere. Therefore, it is
expected to fill these gaps and make thermal conduction continue.
Figure 5-5 Thermal Conductive Pathways in Composite Adhesive Structure
As can be seen in Table 5-2, the sample with higher hBN content has more thermal
conductivity value than one with less hBN content. Moreover, TiO2+Au particles
have negative effect on thermal conductivity. As cause for this situation, it is
considered that precipitation of Au doped over TiO2 in the composite structure
affects adversely. So, there is a lack of thermal pathways that it should not exist.
Table 5-2 Thermal Conductivity Values (W/m K) of Samples at Different Temperatures
Temperature
Ratios -15 C° 0 C° 20 C° 50 C° 100 C°
Neat Epoxy - 0.18 0.17 0.18 0.19 0.19
hBN
10 wt% 0.282 0.271 0.244 0.254 0.257
20 wt% 0.32 0.327 0.295 0.31 0.319
30 wt% 0.374 0.384 0.359 0.371 0.386
Al2O3 10 wt% 0.21 0.207 0.213 0.215 0.213
20 wt% 0.227 0.231 0.22 0.222 0.219
hBN+Al2O3 22.5-7.5 wt% 0.35 0.347 0.342 0.349 0.352
24-6 wt% 0.334 0.338 0.328 0.339 0.343
TiO2 30 wt% 0.247 0.255 0.268 0.28 0.283
TiO2+Au 30 wt% 0.136 0.144 0.152 0.158 0.174

42
FTIR spectroscopy is used to analyze chemical composition of substance. Also,
characteristic molecules and specific bonds between molecules can be inferred for
samples. In the reference spectrum which can be seen in Figure 5-6, expected
absorbance of interatomic bonds is given corresponding to the wavenumber. By
comparison with this reference spectrum, spectra got from samples are examined. In
Figure 5-7, FTIR spectrum of neat epoxy can be found. From 3400 to 1500 cm-1, the
peaks are achieved by hydroxyl, amino groups, asymmetric/symmetric C-H (-CH2)
stretching vibrations and amide C=0 stretching. Then, they are expected to be seen in
spectra of all samples. But, theylir intensifies can be differ from sample to sample.
Fewer than 1500 cm-1 wavenumber, occurred peaks are said to be sample specific.
So, peaks at 1242, 1034, 826 and 700 cm-1 can be seen in Figure 5-7 as the specific
absorbance bands of neat epoxy. Also, methyl groups (-CH3) of epoxy are
characteristics of bending vibration at 1385 cm-1. The expectation from addition of
filler material is that the chemical structure of neat epoxy should not be affected
adversely.
Figure 5-6 Reference FTIR Spectrum (http://what-when-how.com/wp-
content/uploads/2011/06/tmp17058_thumb1.png)

43
Figure 5-7 FTIR Spectrum of Neat Epoxy
In Figure 5-8, FTIR Spectra of hBN added composite structures can be seen. From
4000 to 1500 cm-1, peaks show similarity with the neat epoxy. But, intensifies are
lowered by addition of hBN. At 1380 cm-1, there can be seen a peak for hBN
particles. This peak is the characteristics of B-N in-plane stretching vibration. Also,
peak at 805 cm-1 represents the out of plane bending vibration of B-N. In addition,
these peaks are said to be fingerprints of hBN particles.
In Figure 5-9, Epoxy composites with Al2O3 particles are examined by FTIR
Spectroscopy. Like composites with hBN, functional groups’ characteristic peaks are
seen in the range of 4000-1500 cm-1. Transmittance intensifies show similarity with
hBN and neat epoxy, as expected. At 731 and 610 cm-1, the characteristic peaks of
Al2O3 particles occur. In neat epoxy, there is also a small peak at 731 cm-1. So, for
the Al2O3 particles, characteristic is overlapped with neat epoxy.
50010001500200025003000350040000.65
0.7
0.75
0.8
0.85
0.9
0.95
1
Wavenumber(cm-1
)
Tra
nsm
itta
nce
(%
*1
00
)
Neat Epoxy

44
Figure 5-8 FTIR Spectra of Epoxy with hBN particles
Figure 5-9 FTIR Spectra of Epoxy with Al2O3
50010001500200025003000350040000.65
0.7
0.75
0.8
0.85
0.9
0.95
1
10% hBN
20% hBN
30% hBN
50010001500200025003000350040000.86
0.88
0.9
0.92
0.94
0.96
0.98
10% Al2O3
20% Al2O3

45
In Figure 5-10, FTIR Spectra of synergetic mixtures of hBN and Al2O3 particles are
shown. The peaks are common with other particles and neat epoxy for the range of
4000-1500 cm-1. Since mixtures consist of hBN and Al2O3 particles, characteristic
peaks of hBN and Al2O3 particles can be seen in these spectra. From 22.5-7.5 %
hBN-Al2O3 to 24-6 % hBN-Al2O3, intensifies are changed in favor of hBN particles’
characteristic peaks by increasing hBN content.
Figure 5-10 FTIR Spectra of Synergetic Mixtures of hBN and Al2O3
Epoxy composite with TiO2 and Au-doped TiO2 particles were also examined by
FTIR Spectroscopy, as illustrated in Figure 5-11. The broad band from 500 to 900
cm-1 is related to Ti-O-Ti and Ti-O-C stretching vibration. The characteristic peak of
neat epoxy is matched with TiO2 and Au-doped TiO2 at 700 cm-1 which is
responsible for neat epoxy’s OH groups. Therefore, in general, the coincidence of
peaks between TiO2 particles and neat epoxy can be seen clearly. In addition, Au
particles only modify the intensity of peaks. Since all particles are nonfunctional and
peaks show similarity with neat epoxy, it can be said that there is no modification in
epoxy resin’s chemical structure.
50010001500200025003000350040000.75
0.8
0.85
0.9
0.95
1
22.5-7.5% hBN-Al2O3
24-6% hBN-Al2O3

46
Figure 5-11 FTIR Spectra of TiO2 and Au-doped TiO2 Particles
With SEM screenings, morphological examination was conducted. The samples are
frozen into liquid nitrogen. Then, they are broken into two pieces by diamond cutter.
In addition, the cutting plane is needed to be flat and perpendicular to SEM plane.
Since this operation is held manually, there can be misalignment and poor surface
quality. Therefore, defects in screening and difficulty in identifying particles can
occur inevitably. In Figure 5-12, SEM screening of sample with 20% hBN is shown.
As seen, red arrows point the hBN particles. In addition, gaps in the samples can be
indicated by red circles in figure. In Figure 5-13, sample with 20% Al2O3 particles
topology is illustrated. Red circle in figure shows the Al2O3 particles and there is a
huge agglomeration. Also, red arrows indicate the gaps on the cutting plane.
Therefore, especially this agglomeration can worsen the performance of sample.
Moreover, in Figure 5-14, SEM screening of epoxy with 24-6% hBN-Al2O3 particles
is shown. Green arrows indicate the hBN particles and red arrows point the Al2O3
particles. In addition, red circles are where gaps occurred. Therefore, a local
50010001500200025003000350040000.7
0.75
0.8
0.85
0.9
0.95
1
30% TiO2
30% TiO2+Au

47
agglomeration of Al2O3 particles is observed. On the other hand, hBN particles are
distributed more evenly than hBN particles.
Figure 5-12 SEM Screening of 20% hBN
Finally, it can be said that a uniform distribution is hard to achieve in the composite
adhesive. Some local agglomeration and gaps are admitted to be inevitable. This
scanning process is aimed to see these agglomeration fields and gaps. Also, they
should be kept at minimum rate as possible. As a result of these images, mixing
process could be improved to distribute particles evenly.
Figure 5-13 SEM Images of 20% Al2O3

48
Figure 5-14 SEM Screening of Synergetic Mixture
Lastly, the single lap shear tests were conducted to determine adhesion strength. Test
setup can be seen in Figure 5-15. These tests give information about mechanical
properties of composite adhesive like DMA tests. Neat epoxy had the most ductile
behavior. Since the filler materials are stiffer than epoxy, the samples with particles
show less ductile behavior than neat epoxy. Moreover, the improvement in
maximum shear stress is expected by addition of filler materials due to their
relatively high stiffness values. In Table 5-3 given below, the maximum stress values
for each sample is presented. The hBN and Al2O3 particles had favorable effects on
maximum shear stress. On the contrary, the higher hBN and Al2O3 content decreased
it. Moreover, TiO2 particles affected the maximum shear stress adversely.
Shearing of adhesive joint includes two stages. First stage is the linear where
behavior is elastic and second one is the plastic stage where behavior is inelastic. In
Figure 5-16, an example of stress-strain curve is plotted. In the plot, point LL (linear
limit) is the where elastic stage ends, KN (knee point) is the knee point where plastic
stage becomes dominant and UL point is the ultimate stress point where breakage
occurs.

49
Table 5-3 Maximum Shear Stress at Breakage of Samples
Sample Maximum Stress
(MPa)
Neat Epoxy 18.97
+10% hBN 19.74
+20% hBN 19.31
+30% hBN 16.42
+10% Al2O3 20.86
+20% Al2O3 16.33
+22.5-7.5% hBN-Al2O3 17.45
+24-6% hBN-Al2O3 18.35
+30% TiO2 14.71
+30% Au-doped TiO2 18.36
Figure 5-15 Single Lap Shear Test Setup

50
Figure 5-16 Example of Shear-Strain Curve
Neat epoxy’s fracture surface is examined in Figure 5-17. There are three parts of
adhesive joint, two adherends and an adhesive film. For successful testing, adhesive
film is needed to be bonded with adherends. Also, fracture should occur in the
adhesive film. For the neat epoxy sample, areas marked with red curves are places
where bond between adhesive film and adherend is broken. Therefore, there can be a
defect in sample preparation process. Moreover, dirt or dust on the adherends
surfaces can affect the bonding between adherends and adhesive film adversely. In
Figure 5-18, neat epoxy’s stress-extension curve can be seen. All curves are divided
into three in accordance with example stress-strain in Figure 5-16. In addition, LL
and UL points of each curve are compared for performance enhancement. For the
neat epoxy, the elastic limit is measured as 10 MPa from that curve and the ultimate
stress point is 19 MPa.

51
Figure 5-17 Fracture Surface of Neat Epoxy
In Figure 5-18, shear stress over extension is plotted for neat epoxy and epoxy with
Al2O3 particles. For 10wt% Al2O3, the LL point is found as 13 MPa and UL point is
21 MPa. These values are 15 MPa and 16 MPa for 20wt% Al2O3, respectively. Since
addition of Al2O3 particles makes the composite adhesive stiffer, the UL point is
expected to increase. The adherends are glued together with epoxy part of composite
structure. Therefore, when there are particles in the interface area, lack of adhesion
may occur. For this examination, the fracture surfaces should be investigated, which
can be seen in Figure 5-19. Areas in red curves are where bonds between adherends
and adhesive film are broken. For sample with 20wt% Al2O3 particles, this area is
greater than the other sample. Therefore, underperformance of sample with 20wt%
Al2O3 particles at ultimate stress point can be explained. Moreover, due to adhesion
problem, the softening part of 20wt% Al2O3 content is limited and breakage
occurred.

52
Figure 5-18 Al2O3 Particles’ Effect on Shear Stress
Figure 5-19 Fracture Surfaces of Al2O3 Samples
Effects of hBN particles on shear stress can be inferred from Figure 5-20. The linear
limit points are 12 MPa for 10wt% hBN, 13 MPa for 20wt% hBN and 12 MPa for
30wt% hBN. In addition, the ultimate stress points are 20 MPa, 19 MPa and 16 MPa,
respectively. The composite adhesive is cured as thin film between adherends.
0 1 2 3 4 5 6 70
5
10
15
20
25
Extension (mm)
Sh
ear
Str
ess
(MP
a)
Neat Epoxy
10% Al2O3
20% Al2O3

53
Moreover, as hBN content increases, the possibility of placing hBN particles at
interface also increases. Therefore, decrease in UL point can be explained by
excessive particles in adhesive film. In addition, cross-linking is thought to occur
between epoxy resin and particles. When amount of particles increases too much,
agglomeration can occur. So, particles begin to contact with each other, and cross-
linking is inhibited. Therefore, it is suspected as possible reason for decrease in
elastic limit.
Figure 5-20 hBN Particles’ Effect on Shear Stress
Figure 5-21 Fracture Surfaces of hBN Particles
0 1 2 3 4 5 6 70
2
4
6
8
10
12
14
16
18
20
Extension (mm)
Sh
ear
Str
ess
(MP
a)
Neat Epoxy
10% hBN
20% hBN
30% hBN

54
In Figure 5-21, fracture surfaces of samples with hBN particles are shown. Enclosed
areas with red curves are where de-bonding between adherends and adhesive film.
As hBN content in composite adhesive increases, undesirable de-bonding areas
increased. Since composite adhesive is cured as thin film, more hBN can cause the
lack of bonding between adherends.
For the synergetic mixtures, shear stress-extension curves are shown in Figure 5-22.
12 MPa is the value of linear limit for epoxy with 22.5-7.5% hBN-Al2O3 particles. In
addition, ultimate stress point is measured as 17.5 MPa. These values are 14 MPa
and 18.3 MPa respectively for epoxy with 24-6% hBN- Al2O3 particles. From
results, improvement is mechanical behavior is seen as hBN content increases. Since
hBN has plate-like geometry which has extra area for interaction, the more cross-
links occur between epoxy resin and particles.
Figure 5-22 The Synergetic Mixture’s Effect on Shear Stress
Stress behavior of samples can also be investigated by fracture surfaces which are
shown in Figure 5-23. The de-bonding between adhesive film and adherends is much
more in sample with 22.5-7.5% hBN-Al2O3 particles than other synergetic mixture.
Since Al2O3 particles have higher stiffness than epoxy resin and hBN particles, the
improvement is expected as Al2O3 content increases. From fracture surfaces, de-
0 1 2 3 4 5 6 70
2
4
6
8
10
12
14
16
18
20
Extension (mm)
Sh
ear
Str
ess
(MP
a)
Neat Epoxy
22.5-7.5% hBN-Al2O3
24-6% hBN-Al2O3
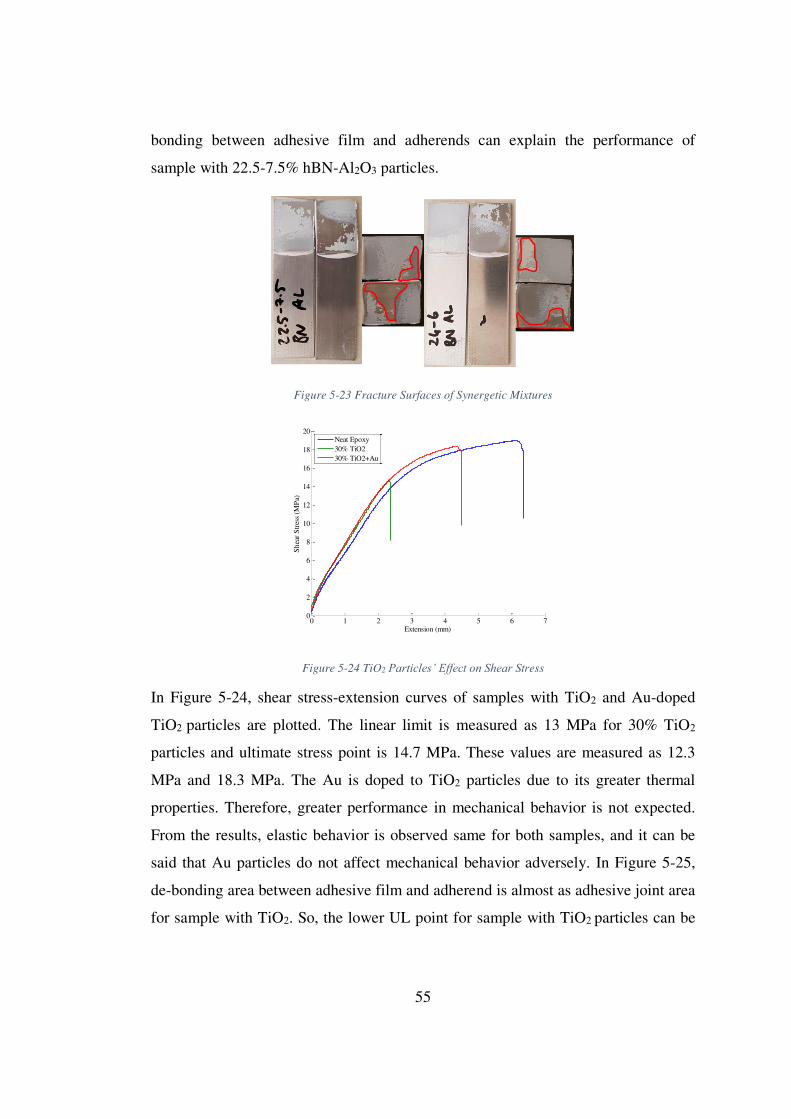
55
bonding between adhesive film and adherends can explain the performance of
sample with 22.5-7.5% hBN-Al2O3 particles.
Figure 5-23 Fracture Surfaces of Synergetic Mixtures
Figure 5-24 TiO2 Particles’ Effect on Shear Stress
In Figure 5-24, shear stress-extension curves of samples with TiO2 and Au-doped
TiO2 particles are plotted. The linear limit is measured as 13 MPa for 30% TiO2
particles and ultimate stress point is 14.7 MPa. These values are measured as 12.3
MPa and 18.3 MPa. The Au is doped to TiO2 particles due to its greater thermal
properties. Therefore, greater performance in mechanical behavior is not expected.
From the results, elastic behavior is observed same for both samples, and it can be
said that Au particles do not affect mechanical behavior adversely. In Figure 5-25,
de-bonding area between adhesive film and adherend is almost as adhesive joint area
for sample with TiO2. So, the lower UL point for sample with TiO2 particles can be
0 1 2 3 4 5 6 70
2
4
6
8
10
12
14
16
18
20
Extension (mm)
Sh
ear
Str
ess
(MP
a)
Neat Epoxy
30% TiO2
30% TiO2+Au

56
explained by excessive undesirable de-bonding area. The dust or dirt on adherend
surface can be an excuse for this underperformance. Moreover, possible
agglomeration of TiO2 particles in adhesive film can make this happen.
Figure 5-25 Fracture Surfaces of TiO2 Particles

57
CHAPTER 6
6. CONCLUSIONS
In this study, commercially available epoxy adhesive, Loctite 9412, was used as
epoxy matrix with the purpose of improving intrinsic properties by using filler
materials as reinforcers. Then, nano-hBN, nano-Al2O3, nano-TiO2 and nano-Au
doped TiO2 particles were used as filler materials. These particles were selected due
to their individually great thermal and mechanical properties compared with epoxy
adhesive. Thus, samples for each particle at different weight ratios were prepared.
For the Al2O3 particles, 30 wt% ratio could not be prepared due to flocculation
occurred while sample preparation. Also, hBN and Al2O3 particles were mixed to see
any synergetic effect on the enhancement of epoxy adhesive. All samples were
tested in order to determine thermal behavior by DMA, DSC and TC. Moreover,
their morphologies were examined by SEM and FTIR Spectra. Also, their adhesion
strengths were measured by Single Lap Shear Test. The preliminary work and test
results were presented and published in [38,39].
The overall performance evaluation of composite adhesive is divided into thermal
and mechanical behaviors, mainly. In order to determine the most favorable
composition, thermal and mechanical properties should be balanced. Results show
that adding particles have favorable influence on the thermal conductivity of
composite adhesive structure. Since hBN particles have nearly 300 W/m.K of
thermal conductivity, hBN particles have the most gain in thermal properties.
Moreover, addition of 10, 20 and 30 wt% of hBN increases the thermal conductivity
of neat epoxy from 0.18 W/m.K to 0.257, 0.319 and 0.386 W/m.K, respectively. For
the Al2O3 added composite structures, thermal conductivity values are changed from
0.18 to 0.217 and 0.219 W/m.K for 10 and 20 wt% ratio of Al2O3 particles
respectively. As expected, the synergetic mixture of hBN and Al2O3 particles also
enhance the thermal conductivity value. The Al2O3 content in the mixture determines
58
conductivity of the samples. With 7.5 wt% Al2O3 sample has the thermal
conductivity of 0.352 W/m.K while the one with 6 wt% has 0.343 W/m.K. Actually,
values can be said as close to each other. hBN particles transmit heat in plane and
Al2O3 particles transmit it omnidirectional. When these two particles interact, Al2O3
particles make heat transfer between hBN platelets easily possible. Therefore, the
thermal pathways are well-constructed when interaction increases. It is thought that
the difference between two samples can occur due to this phenomenon. Moreover,
TiO2 particles are known as additive material which enhances the thermal properties
of composite adhesive structure. Addition of 30 wt% TiO2 increases the thermal
conductivity from 0.18 to 0.283 W/m.K. TiO2 particles’ thermal conductivity value
is about 11.7 W/m.K, so this improvement is expected. On the other hand, Au doped
TiO2 particles worsen the composite adhesive structure’s thermal conductivity which
is 0.174 W/m.K. Au particles interacts with TiO2 particles but there is bonding
problem between epoxy matrix and Au particles. Because of that, there can be tiny
gaps in composite adhesive structure. These particles precipitate because of their
relatively high density which has poor influence on thermal pathways. Construction
of thermal pathways is the key for the enhanced thermal properties. hBN platelets’
thermal conductivity is over 1600 times great than neat epoxy, but their
enhancement is limited to 200 times of neat epoxy. hBN particles’ in plane heat
transfer describes the heat transfer ratio. Therefore, adding Al2O3 to hBN should
make possible construction of thermal pathways. If the optimal ratio between hBN
and Al2O3 is found, the better thermal performance might be achieved.
DMA results give information about mechanical properties over temperature. The
composite adhesive structures with hBN particles have poor mechanical properties
than thermal ones. In service temperatures which is -35 to 55 °C, storage moduli of
composite adhesive included 10 and 20 wt% hBN are lower than neat epoxy. For
example, at 40 C°, neat epoxy’s storage modulus is 0.87 GPa while 10 and 20 wt%
samples have 0.74 and 0.70 GPa, respectively. Only 30 wt% of hBN has slightly
improved behavior than neat epoxy. Al2O3 particles have better mechanical

59
properties. Their improvement can be seen in storage modulus results of composite
adhesive structure. 20 wt% Al2O3 particles added composite adhesives have greater
storage modulus value in whole service temperature range. For instance, at 40 °C,
composite adhesive has storage modulus of 0.92 GPa. On the other hand, before 45
°C, 10 wt% Al2O3 particles’ storage modulus is lower than neat epoxy, which is
value of 0.8 GPa. The synergetic mixture of 24 wt% hBN and 6 %wt Al2O3 has
better storage modulus before 45 °C and same behavior after that. At 40 °C, its
storage modulus is value of 0.91 GPa. In addition, the other synergetic mixture’s
storage modulus is matched with neat epoxy’s one in service temperature range. All
TiO2 included composite adhesives have poor storage modulus than neat epoxy. For
example, again at 40 °C, TiO2 added composite adhesive has storage modulus of
0.69 GPa and Au doped TiO2 added one has it of 0.67 GPa. In summary, Al2O3
particle added composite structure has the best storage modulus behavior. Al2O3
particles have great mechanical properties over temperature, so with the harmony
between particles and epoxy matrix, the composite adhesive structure’s mechanical
properties can be improved.
One of the determining specifications is the Tg value and it is determined from the
DSC results. It is highly effective on the service temperature. Moreover, it decides
whether an epoxy can be used or not. Neat epoxy’s Tg value is measured as 44.54
°C. hBN particles added composite structures have the values of 45.82, 47.08 and
49.73 °C for 10, 20 and 30 wt% ratios respectively. Moreover, Al2O3 included
adhesives’ Tg values are 47.73 and 47.98 °C for 10 and 20 wt% ratios accordingly.
The synergetic mixture of 22.5 wt% hBN and 7.5 wt% Al2O3 has the Tg value of
49.00 °C while the other synergetic mixture has the value of 47.04 °C. Finally, TiO2
derivatives have Tg values of 51.55 and 55.92 °C. The latter is the result for Au
doped TiO2. TiO2 particles have the most brilliant results among all samples. When
service temperature range is considered, Au doped TiO2 particle added composite
adhesives take the lead.

60
SEM images are valuable tools to figure out inner structure of the samples. It can be
easily seen whether agglomeration occurred or not. Also, they give information
about gap presence in epoxy matrix and at the edges of particles. Gaps are obstacles
to heat transfer through the composite adhesive. Same samples used in DMA tests
are used for SEM scanning. They are waited in liquid nitrogen for a while. Then,
they are broken into two pieces. But cutting process is held by an operator. Also, it is
a way difficult to have flat and perpendicular cutting plane by hand. In this study,
SEM images indicate that agglomeration problems cannot be avoided completely.
Also, some gaps are shown in SEM screenings. In addition, there is not observed
wetting problem at the edges of particles in broken faces. Moreover, FTIR spectra
can be counted as a tool for inner structure inspection. FTIR spectrum inspects the
atomic bonds in the composite adhesive. It shows presence of expected bonds
between particles and epoxy matrix in association with SEM images. Also, change in
chemical structure of epoxy matrix can be investigated by comparing spectra of neat
epoxy and other samples. In this study, FTIR spectrum is compared with the
reference spectrum and FTIR spectra of samples with filler particles showed
similarity with neat epoxy. Therefore, addition of filler material did not deform the
chemical structure of neat epoxy.
For the characterization, the appropriate mechanical tests should be conducted. The
single lap shear test is the one of most common characterization tests for adhesives.
While DMA results give information about mechanical properties over temperature,
single lap shear test shows purely mechanical properties. After shear tests, fracture
surfaces of samples are also investigated. Breakage of bond is needed in adhesive
film to investigate adhesive’s shear performance. For the samples used in this work,
breakage between adhesive film and adherends are observed. Therefore, samples can
have lack of shear performance and the results may be misleading. In addition,
possible reasons for having improper de-bonding can be dirt or dust on adherend
surface. Surface roughness can also be a suspect. Another possible reason for poor
bonding is the thickness of adhesive film. When the thickness is decreased, particles

61
can be placed on the adherend’s surface. Therefore, in these locations, bonding may
not be occurred. Moreover, from results, elastic limits are enhanced by addition of
filler materials. Improvement in elastic limit is mostly achieved by Al2O3 particles as
expected due to their high mechanical properties. Unlike the assumption, with
increasing Al2O3 particles, elastic limit is decreased. Since fracture surface of sample
with 20wt% Al2O3 particles had more area of de-bonding between adherends and
adhesive film, this weakening could be explained. Also, the highest ultimate stress
point was obtained by Al2O3 particles. For the other particles, performance of hBN
particles was decreased with increasing hBN particles. When the fracture surfaces
were investigated, unwanted de-bonding was also increased with increasing amount
of particles. For the case study, the displacement in joint is undesirable. Hence, the
samples with higher elastic limit are chosen. In this work, epoxy with 10wt% Al2O3
particles has the best configuration for mechanical performance.
After all, in this study, a delicate sample preparation method is expressed and
examined by the SEM and FTIR analysis. Also, developing a sophisticated adhesive
for aerospace applications is aimed. In order to achieve this goal, an epoxy resin is
enriched with different types of additive materials. The additive materials are
selected from the literature to confirm and improve findings. All prepared samples
are tested by DMA, DSC and Thermal Inductivity Measurement, so their thermal
behavior can be compared. Then, they are tested by single lap shear test to see their
mechanical behavior. From among all samples, hBN particles are mostly contributed
to thermal conductivity. In addition, Al2O3 particles have great influence on
adhesion strength. Results of Tg values imply that TiO2 derivatives show the
necessary enhancement to work in service temperature range. In this case study, it is
important that adhesive joint should preserve its structural integrity at extremity of
service temperature. Also, thermal conductivity of adhesive joint should be
improved to contribute structural integrity during heat cycles. Since there is no
significant static loads on adhesive joint, 30 wt% TiO2 shows better performance
even if its mechanical properties is not great as the other samples. With this study, it

62
is shown that an advanced adhesive can be developed by reinforcing the epoxy
adhesive by filler materials. For further applications, the composite adhesive with
Au doped TiO2 particles can be produced by eliminating the precipitation problem.
Then, expected thermal performance should be achieved.

63
REFERENCES
[1] Bishopp, J. (2005). Chapter 5 Aerospace: A pioneer in structural adhesive
bonding. In Handbook of Adhesives and Sealants (pp. 215–347). Elsevier.
https://doi.org/10.1016/s1874-5695(02)80006-9
[2] de Bruyne, N. A. (1987). Pioneering Times. Techne Inc., Princetown, NJ.
[3] Pate, K. D. (2002), Applications of adhesives in aerospace. In: M. Chaudhury,
&A. V. Pocius(Eds), Adhesion Science and Engineering (Chemistry and
Applications, Vol. 2, pp. 1128-1192), Elsevier, Amsterdam
[4] Katsiropoulos, C. V., Chamos, A. N., Tserpes, K. I., & Pantelakis, S. G. (2012).
Fracture toughness and shear behavior of composite bonded joints based on a novel
aerospace adhesive. Composites Part B: Engineering, 43(2), 240–248.
doi:10.1016/j.compositesb.2011.07.010
[5] James, L & Dale, S. (2011). Adhesives Technology for Electronic Applications.
Adhesives Technology for Electronic Applications. 10.1016/C2009-0-64364-6.
[6] R. Qian, J. Yu, C. Wu, X. Zhai, P. Jiang, Alumina-coated graphene sheet hybrids
for electrically insulating polymer composites with high thermal conductivity, RSC
Advances. 3 (2013) 17373.
[7] M. Shioya, Y. Kuroyanagi, M. Ryu, J. Morikawa, Analysis of the adhesive
properties of carbon nanotube- and graphene oxide nanoribbon-dispersed aliphatic
epoxy resins based on the Maxwell model, International Journal of Adhesives and
Adhesion. 84 (2018) 27–36.
[8] X. Huang, X. Qi, F. Boey, H. Zhang, Graphene-based composites, Chemical
Society Review. 41 (2012) 666–686.
[9] M. Hussain, A. Nakahira, K. Niihara, Mechanical property improvement of
carbon fiber reinforced epoxy composites by Al2O3 filler dispersion, Material
Letters 26 (1996) 185–191.
[10] Q. Mu, S. Feng, G. Diao, Thermal conductivity of silicone rubber filled with
ZnO, Polymer Composites 28 (2007) 125–130.
[11] Wattanakul, K., Manuspiya, H., & Yanumet, N. (2011). Thermal conductivity
and mechanical properties of BN-filled epoxy composite: effects of filler content,
mixing conditions, and BN agglomerate size. Journal of Composite Materials,
45(19), 1967–1980. https://doi.org/10.1177/0021998310393297
[12] Singh, S. K., Singh, S., Kumar, A., & Jain, A. (2017). Thermo-mechanical
behavior of TiO 2 dispersed epoxy composites. Engineering Fracture Mechanics,
184, 241–248. https://doi.org/10.1016/j.engfracmech.2017.09.005

64
[13] W. Jiao, Y. Liu, G. Qi, Studies on mechanical properties of epoxy composites
filled with the grafted particles PGMA/Al2O3, Composite Science Technology 69
(2009) 391–395.
[14] Bian, W., Yao, T., Chen, M., Zhang, C., Shao, T., & Yang, Y. (2018). The
synergistic effects of the micro-BN and nano-Al2O3 in micro-nano composites on
enhancing the thermal conductivity for insulating epoxy resin. Composites Science
and Technology, 168, 420–428. https://doi.org/10.1016/j.compscitech.2018.10.002
[15] K. Kim, M. Kim, Y. Hwang, J. Kim, Chemically modified boron nitride-epoxy
terminated dimethylsiloxane composite for improving the thermal conductivity,
Ceramics International 40 (2014) 2047–2056.
[16] Zhou, W., Zuo, J., Zhang, X., & Zhou, A. (2013). Thermal, electrical, and
mechanical properties of hexagonal boron nitride–reinforced epoxy composites.
Journal of Composite Materials, 48(20), 2517–2526.
https://doi.org/10.1177/0021998313499953
[17] Peng, W. Y., Huang, X. Y., & Yu, J. H. Electrical and thermophysical
properties of epoxy/aluminum nitride nanocomposites: Effects of nanoparticle
surface modification. Composites Part A 2010; 41: 1201–1209.
[18]Ekrem, M., Şahin, Ö. S., Karabulut, S. E., & Avcı, A. (2017). Thermal stability
and adhesive strength of boron nitride nano platelets and carbon nano tube modified
adhesives. Journal of Composite Materials, 52(11), 1557–1565.
doi:10.1177/0021998317726147
[19]Kim WS, Yun IH, Lee JJ, et al. Evaluation of mechanical interlock effect on
adhesion strength of polymer-metal interfaces using micro-patterned surface
topography. International Journal of Adhesives and Adhesion 2010; 30:408–417.
[20] Brown, G. M., & Ellyin, F. Assessing the predictive capability of two-phase
models for the mechanical behavior of alumina/epoxy nanocomposites. Journal of
Applied Polymer Science 2005;98:869–879.
[21] Brown, G. M., & Ellyin, F. Mechanical properties and multiscale
characterization of nanofiber-alumina/epoxy nanocomposites. J. Appl. Polym. Sci.
2011;119:1459–1468.
[22] Miyagawa, H., Mohanty, A., Drzal, L. T., & Misra, M. Effect of clay and
alumina-nanowhisker reinforcements on the mechanical properties of
nanocomposites from biobased epoxy: a comparative study. Industrial and
Engineering Chemistry Research 2004;43:7001–7009.
[23] Zhao, S., Schadler, L. S., Duncan, R., Hillborg, H., & Auletta, T. Mechanisms
leading to improved mechanical performance in nanoscale alumina filled epoxy.
Composite Science Technology 2008;68:2965–975.

65
[24] Wetzel, B., Rosso, P., Haupert, F., & Friedrich, K. Epoxy nanocomposites –
fracture and toughening mechanisms. Engineering Fracture Mechanics
2006;73:2375–2398.
[25] Johnsen, B. B. , Frømyr , T. R., Thorvaldsen, T., & Olsen, T. (2013) Preparation
and characterisation of epoxy/alumina polymer nanocomposites, Composite
Interfaces, 20:9, 721-740, DOI: 10.1080/15685543.2013.815603
[26] Song, B., Chen, W., Montgomery, S. T., & Forrestal, M. J. (2009), Mechanical
Response of an Alumina-filled Epoxy at Various Strain Rates. Journal of Composite
Materials, 43(14), 1519-1536. https://doi.org/10.1177/0021998308337741
[27] Jiang, W., Jin, F.-L., & Park, S.-J. (2012). Thermo-mechanical behaviors of
epoxy resins reinforced with nano-Al2O3 particles. Journal of Industrial and
Engineering Chemistry, 18(2), 594–596. https://doi.org/10.1016/j.jiec.2011.11.140
[28] Hu, Y., Du, G., & Chen, N. (2016). A novel approach for Al 2 O 3 /epoxy
composites with high strength and thermal conductivity. Composites Science and
Technology, 124, 36–43. https://doi.org/10.1016/j.compscitech.2016.01.010
[29] J.-W. Bae, W. Kim, S.-H. Cho, S.-H. Lee, The properties of AlN-filled epoxy
molding compounds by the effects of filler size distribution, Journal of Material
Science 35 (23) (2000) 5907e5913.
[30] Zhai, L., Ling, G., Li, J., & Wang, Y. (2006). The effect of nanoparticles on the
adhesion of epoxy adhesive. Materials Letters, 60(25-26), 3031–3033.
doi:10.1016/j.matlet.2006.02.038
[31] Stawarz, S., Witek, N., Kucharczyk, W., Bakar, M., & Stawarz, M. (2018)
Thermo-protective properties of polymer composites with nano-titanium dioxide.
International Journal of Mechanics and Materials Design.
https://doi.org/10.1007/s10999-018-9432-7
[32] Al-Ajaj, L. A., Abd, M. M., & Jaffer, H. I. (2013). Mechanical Properties of
Micro and Nano TiO2/Epoxy Composites, International Journal of Manufacturing
Material and Mechanical Engineering, 1, ISSN 2320-4060
[33] Merad, L., Benyoucef, B., Abadie, M. J. M., & Charles, J. P. (2011).
Characterization and Mechanical Properties of Epoxy Resin Reinforced with TiO2
Nanoparticles. Experimental Techniques, 38(1), 59-66. https.//doi.org/10.111/j.1747-
1567.2011.00797.x
[34] Sahu, M., & Satapathy, A. (2014). A Study on Microsized Titanium Oxide-
Filled Epoxy with Enhanced Heat Conductivity for Microelectronic Applications.
Particulate Science and Technology, 33(1), 109–112.
https://doi.org/10.1080/02726351.2014.941081

66
[35] Kumar, K., Ghosh, P. K., & Kumar, A. (2016). Improving mechanical and
thermal properties of TiO2-epoxy nanocomposite. Composites Part B: Engineering,
97, 353–360. https://doi.org/10.1016/j.compositesb.2016.04.080
[36] Tutunchi, A., Kamali, R., & Kianvash, A. (2014). Steel-Epoxy Composite
Joints Bonded with Nano-TiO2Reinforced Structural Acrylic Adhesive. The Journal
of Adhesion, 91(9), 663–676. doi:10.1080/00218464.2014.961187
[37] Veziroglu, S., Ghori, M. Z., Kamp, M., Kienle, L., Rubahn, H.-G., Strunskus,
T., & Aktas, O. C. (2018). Photocatalytic Growth of Hierarchical Au Needle
Clusters on Highly Active TiO2 Thin Film. Advanced Materials Interfaces, 5(15),
1800465. doi:10.1002/admi.201800465
[38] Yalçınkaya, T. (2019). Synthesis and Characterization of Epoxy/Boron Nitride Composite for Aerospace Applications. Journal of Aeronautics and Space
Technologies, 12(1), 87-94.
[39] Yetgin, H., Veziroglu, S., Aktas, O. C., & Yalcinkaya, T. (2019) High Thermal
Conductive Epoxy Composites with a Binary-Particles System of h-BN and Al2O3
nanoparticles. International Journal of Adhesion and Adhesives, 98,
doi:10.1016/j.ijadhadh.2019.102540