Embed Size (px)
Citation preview
Enhancing Biological GHG Mitigation in Canada:
Potentials, Priorities and Options
Final. December 29, 2010
Authors:
Karen Haugen-Kozyra, KHK Consulting
Milo Mihajlovich, Incremental Forest Technologies
Keith Driver, Leading Carbon Ltd.
Xiaomei Li, XY Green Carbon
Submitted to Kirk Andries
Chair, Management Operations Committee
CCEMC
Executive Summary
This report explores the opportunity for significant emission reductions to be achieved from biological systems and management - particularly agriculture, forestry, waste to energy and landscape level/large scale integrated management. While much attention has tended towards the theoretical potentials from biological management, and not always taking into account those reductions that are additional, or beyond business as usual, this study applies common carbon accounting principles, and identifies “constrained” or “achievable” mitigation potentials from biological management. This analysis covers the range of activities, categorized as major wedges, and sub-wedges, summarized as follows:
Carbon Sequestration – Agriculture soils and forestry sub-wedge opportunities.
GHG Reductions – Direct reductions from livestock, nitrogen management and other sub-
wedge opportunities.
Waste Management – Avoided methane emissions, methane capture and destruction,
biogas, indirect reductions through electricity and heat capture sub-wedges.
Materials Switching – Substituting biological products such as biofertilizer, biocomposites
and biomaterials.
Strategic Carbon Management – Landscape level or integrated large scale opportunities to
reduce emissions.
For each of the sub-wedges, the opportunity is analyzed in full. The mechanisms and methodology for mitigation are detailed, and the theoretical mitigation potential is counted. This theoretical potential is then distilled to a constrained potential, acknowledging the technical, market and policy factors that will govern uptake. The mitigation potentials applied to each sub-wedge use the most reliable accounting methods. Further, for each sub-wedge the constraints to realizing the theoretical potentials are estimated, and critical requirements for operationalizing the sub-wedge are also identified. Accounting criteria like leakage, permanence, real, quantifiable are taken into account, unless otherwise specified. The results of the analysis for each of the sub-wedges are further categorized by an assessment of key implementation considerations, and are summarized in Table 1. Ideally, those opportunities that rate at hi speed, high magnitude for reductions, are easily scaled and are at the market accumulation or diffusion stage are likely the most immediate opportunities. Table 1 Explanation of categorical analysis for sub-wedge implementation.
Speed of Sub-Wedge Development to Reach Potential
Less than 6 years 5
Between 6 and 10 years 3
Greater than 10 years 1
Magnitude of Potential Emission Reductions for
Greater than 5 Mt CO2e per year 5
Between 1 and 5 Mt CO2e per year 3

each Sub-Wedge Less than 1 Mt CO2e per year 1
Scalability of Emission Reductions from each Sub-Wedge
Contiguous and Scalable 5 Patchy and Scalable with Difficulty 3 Dispersed with Challenges for Scalability 1
Stage of Research and Development for activities in the Sub-Wedge
Diffusion 6
Market Accumulation 5
Commercialization 4
Market Demonstration 3
Product/Technology Design/Development 2
Applied Research and Development 1
Results The results of the analysis are summarized in the following tables and figures. Strategic carbon management is discussed in the report only in more broad terms. Table 2 below summarizes the theoretical and constrained mitigation potential for the major wedges and sub-wedge categories. The Canadian theoretical biological GHG mitigation potential is over 200 Mt CO2 e /yr. Applying the constrained potential, the more achievable estimates range from 52.91 to 65.65 Mt CO2 e /yr. In either case, over 53% of this potential is associated with waste management and utilization. The next largest is the carbon sequestration wedge with 20% of the total estimated mitigation potential. The GHG reduction and materials switching wedges share a similar potential of around 12%. Table 2. Summary of Canadian biologically-based GHG capture and reduction opportunities.
Wedge Sub-wedge Protocol in Place
Theoretical Potential
(Mt CO2e/yr)
Constrained Potential
(Mt CO2e/yr)
Carbon Sequestration
3.1.1 Afforestation/Reforestation no 0.6 0.2
3.1.2 Generic Increases in Forest Productivity no ~ 0.29
3.1.3 Carbon Storage in Forest Soils no ~ ~
3.1.4 Improved Forest Management no 0.075 0.075
3.1.5 Carbon Sequestration in Peatlands no <0.01 <0.01
3.1.6 Avoided Forest Conversion no ~ ~
3.1.7 Delayed Forest Harvesting* no 7.2 2.4
3.1.8 Agriculture Soil Carbon Sequestration 11.38 3.6 to 6.1
3.1.9 Wetlands Sequestration yes 10.14 2.0
3.1.10 Sludge Application to Agricultural lands yes 0.76 0.41
3.1.11 Soil Amendments no 5.3 2.7
SubTotal 35.76 11.26 - 13.77
GHG Reductions
3.2.1 Soil Nitrogen Management yes 2.72-4.54 0.25 - 1.36
3.2.2 Beef and Dairy Cattle - Reductions of CH4 & N2O yes 6.82 2.0 - 2.27
3.2.3 Reductions from Hog, Poultry and some yes 1.5 0.9 - 1.05

3
Wedge Sub-wedge Protocol in Place
Theoretical Potential
(Mt CO2e/yr)
Constrained Potential
(Mt CO2e/yr)
Dairy
3.2.4 Changes in Logging Slash Disposal no 13.4 3.0
SubTotal 24.4 - 26.26 6.15 - 7.68
Waste Management
3.3.1 Anaerobic digestion yes 4.5-6.2 2.2 - 3.1
3.3.2 Management of Solid Wastes yes 8.5-31.7 20
3.3.3 Biochar Production and Use no 52 - 86.5 7.6 -9.0
3.3.4 Biomass Combustion yes 5.1 1.5
SubTotal 70.1 - 129.5 31.3 - 33.6
Material Switching
3.4.1 Biofertilizers no 2.5 1.1
3.4.2 Building materials switching no 4.42 1.5
3.4.3 Bio-based materials no 79 - 88.0 1.6 - 8.0
SubTotal 85.92 – 94.92 4.2 - 10.6
Total 216.18 - 224.42 52.91 - 65.65
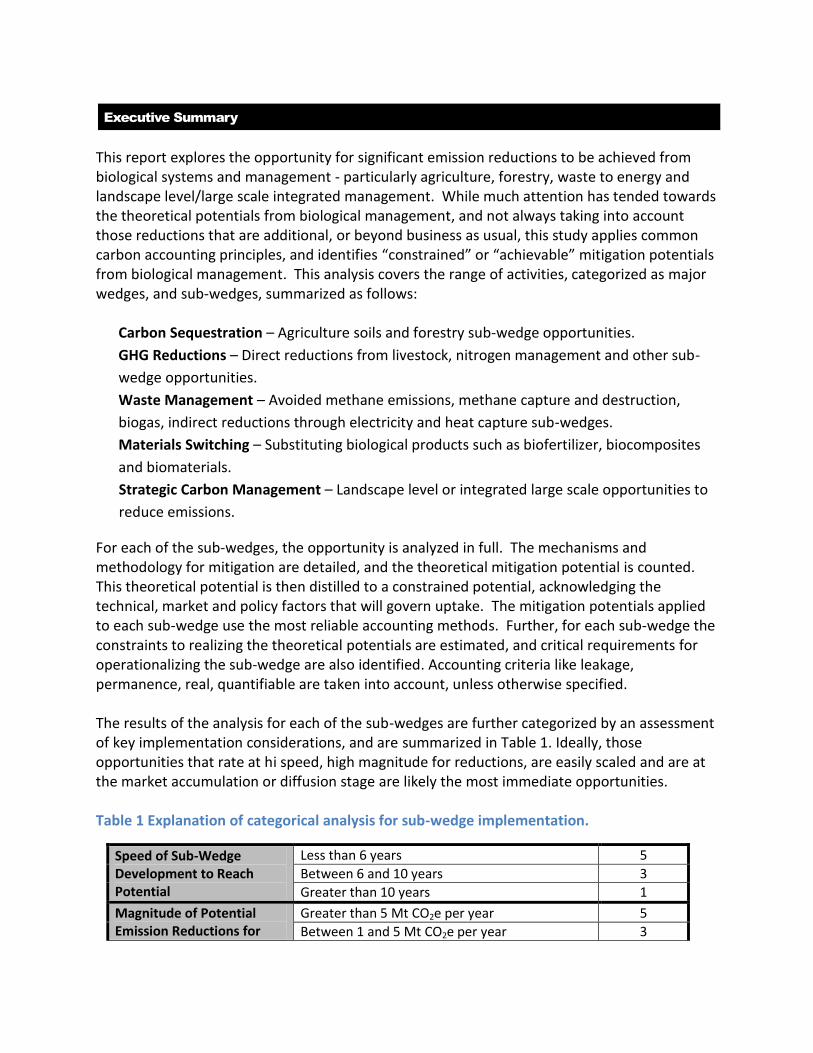
In the next series of figures the analysis for implement-ability of the wedges and sub-wedges is presented. Figure 1 illustrates that the carbon sequestration potentials of improved forest management and pulp paper sludge application are small but readily implemented. The carbon sequestration potential of agricultural soil and soil amendments is substantial and readily achieved. Afforestation – reforestation and delayed harvest have substantial carbon sequestration potentials but will require time and changes in paradigms to implement. Many of these sub-wedges have substantial environmental or social co-benefits that merit acknowledgement.
4
Figure 1 Summary of carbon sequestration wedge evaluation.
Figure 2 shows that the GHG reduction wedge has substantial potential to mitigate GHG emission but will likely be challenging to make operational, since scaling and complexity in measurement and accounting will be an issue.
Figure 2 Summary of GHG Reduction wedge evaluation.

5
Figure 3 shows all waste management sub-wedges have great potential to mitigate GHG emissions; however, more R&D may be needed to render biochar operational. This wedge generally has substantial environmental and social co-benefits which merit consideration in deciding on operational deployment. Furthermore an integrated waste management approach maybe an attractive solution.
Figure 3 Summary of waste management wedge evaluation.
Material switching (Figure 4) shows great potential for GHG mitigation with slight to moderate challenges to operational implementation.

6
Figure 4 Summary evaluation of materials switching wedge
Observations and recommendations are provided to support operationalizing each of the activities. These vary across each of the sub-wedges, which may include policy, research and development, project development, and market development supports.
Final prescriptive measures were suggested to achieve the identified mitigation potentials
through short- and long-term strategic plans that are both practical and measurable.
Key components of short-term strategic plans include addressing quantification tools and
enabling policy for large-scale opportunities currently constrained by operational or
quantification constraints. Furthermore a number of quantification protocols require revision
or development to more effectively enable mitigation.
A need to focus on enabling large-scale opportunities was indicated as a key part of the long-
term strategy. The enabling of large-scale opportunities requires significant changes to policy
and/or infrastructure, and may call for considerable effort and collaboration. Reassessments
and/or development of national biomass, bio-waste, and lifecycle analysis databases and
inventories will enable ease of accountability and further project development. Initiating
CCEMC-supported dialogue between project developers and land managers or policy

7
developers would foster collaborative effort towards common goals of greenhouse gas
mitigation which may otherwise be met with conflicts from established regulations. Finally, the
CCEMC may wish to provide clear priorities on CCEMC perspectives to foster continued
protocol development arising from the roadmap.

8
Table of Contents
Executive Summary………………………………………… .................................................. 1
Table of Contents………………………………………………. .............................................. 8
1.0 Introduction…………………………………………… ................................................ 12
2.0 Objectives and Structure of the Paper…….. ............................................... 15 2.1 Objectives and Structure of the Paper ........................................................................................... 15
2.1.1 Structure and Scope .................................................................................................................................... 15 2.2 Activities and Deliverables ............................................................................................................... 16
2.2.1 Structured Analysis of each Wedge ...................................................................................................... 17 2.2.2 Assessment Matrix for Scale, Magnitude and Research and Development (R&D) Ranking ........................................................................................................................................................................... 17
3.0 Wedge Mitigation Potentials and Analysis ................................................ 19 3.1 Carbon Sequestration ......................................................................................................................... 19
3.1.1 Afforestation/Reforestation .................................................................................................................... 20 3.1.2 Generic Increases in Forest Productivity ........................................................................................... 26 3.1.3 Carbon Storage in Forest Soils ............................................................................................................... 26 3.1.4 Improved Forest Management ............................................................................................................... 28 3.1.5 Carbon Sequestration in Peatlands ...................................................................................................... 33 3.1.6 Avoided Forest Conversion ..................................................................................................................... 36 3.1.7 Delayed Forest Harvesting ....................................................................................................................... 36 3.1.8 Agriculture Soil Carbon Sequestration .............................................................................................. 42 3.1.9 Wetlands Sequestration ........................................................................................................................... 50 3.1.10 Sludge Application to Agricultural lands........................................................................................ 56 3.1.11 Soil Amendments ...................................................................................................................................... 61
3.2 GHG Reductions .................................................................................................................................... 68 3.2.1 Soil Nitrogen Management ...................................................................................................................... 68 3.2.2 Beef and Dairy Cattle - Reductions of Methane and Nitrous Oxide......................................... 77 3.2.3 Reductions from Hog, Poultry and some Dairy Operations ....................................................... 83 3.2.4 Changes in Logging Slash Disposal ....................................................................................................... 88
3.3 Waste Management ............................................................................................................................ 91 3.3.1 Anaerobic Digestion - Agricultural biowaste, straw and plant biomass ............................... 91 3.3.2 Reductions in Emissions from the Management of Solid Wastes ............................................ 97 3.3.3 Biochar Production and Use ................................................................................................................. 103 3.3.4 Biomass Combustion ............................................................................................................................... 108
3.4 Material Switching ........................................................................................................................... 111 3.4.1 Biofertilizers ............................................................................................................................................... 111 3.4.2 Forest Sustainability – Building Material Switching .................................................................. 118 3.4.3 Bio-based materials ................................................................................................................................. 122
3.5 Strategic Carbon Management ...................................................................................................... 126 3.5.1 Landscape Scale Carbon Management ............................................................................................. 126 3.5.2 Integrated Waste Management Strategies ..................................................................................... 132

9
4.0 Summary and Recommendations……………. ............................................. 135
5.0 References……………………………………………….. .............................................. 142
List of Tables
Table 1 Explanation of categorical analysis for sub-wedge implementation. ................................ 1 Table 2. Summary of Canadian biologically-based GHG capture and reduction opportunities. ... 2 Table 3. Categorical assessment for speed, scale, magnitude and R&D. ..................................... 18 Table 4 Alberta case study of annual afforestation GHG mitigation potential. ............................ 22 Table 5 GHG mitigation potential arising from reforestation of natural disturbances. ................ 23 Table 6. Categorical evaluation of the afforestation-based mitigation opportunity ..................... 25 Table 7 Annual increase in carbon dioxide sequestration from improved forest management. ... 30 Table 8. Categorical evaluation of mitigation potential of Improved Forest Management .......... 32 Table 9. Peatland carbon fluxes-Western Canada (from Turetsky et al.) ..................................... 34 Table 10. Categorical Assessment of Peatland Management Mitigation Opportunity. ............... 36 Table 11. Effect of delaying harvest on carbon dioxide capture and storage by forests. ............. 38 Table 12 National estimate of impact of delaying conifer harvest ............................................... 39 Table 13. Cost per tonne of CO2e mitigation derived from delay harvest, AB case study........... 40 Table 14. Categorical assessment of GHG mitigation potential of delayed harvesting. .............. 40 Table 15. Tillage Practices Used to Prepare Land for Seeding and Summerfallow areas from
Statistics Canada, 1991-2006. ............................................................................................... 44 Table 16. Coefficients, acreages and Potential Tonnes of Carbon Sequestered across Canada
from Conservation Tillage Practices on an annual basis (2006 Census). ............................. 45 Table 17. Feasible adoption rates of No-Till on remaining eligible acres in Canada. .................. 47 Table 18. Categorical assessment of GHG mitigation potential of soil carbon sequestration
practices. ............................................................................................................................... 49 Table 19. Categorical Assessment of Wetlands ............................................................................ 55 Table 20. Categorical Assessment of Mill Sludge Application to Agricultural Lands. ............... 60 Table 21. Manure generated in the Canadian livestock industry that can be collected. ............... 64 Table 22. Summary of Assumptions and activities for the proposed practice baseline scenario . 65 Table 23. Categorical Assessment of Amendments to Soils ........................................................ 67 Table 24. Management Practices and Reduction Coefficients for the 3 Performance Levels of the
NERP Drier Soils of Canada................................................................................................. 71 Table 25. Management Practices and Reduction Coefficients for the 3 Performance Levels of the
NERP Moister Soils in Canada. ............................................................................................ 72 Table 26. Reductions for 2009 Year by Crop Basic NERP Mt CO2e........................................... 74 Table 27. Reductions for 2009 Year Crop by Intermediate/Advanced NERP Mt CO2e. ............. 74 Table 28. Categorical Assessment of NERP Implementation. ..................................................... 76 Table 29. Cattle Types on Farms-Canada (Statistics Canada 2010b) ........................................... 79 Table 30. Mitigation Potential of Beef Dairy Strategies. .............................................................. 80 Table 31. Categorical Assessment of Beef and Dairy Cattle Reduction Strategies. ..................... 82 Table 32. Swine Inventory of Canada ........................................................................................... 84 Table 33. Mitigation Potential of Swine. ...................................................................................... 85 Table 34. Categorical assessment of hog, poultry and some dairy reduction strategies. .............. 86 Table 35. Annual forest harvest in Canada, 2008. ........................................................................ 89
10
Table 36. Estimate of Current Annual Emissions from Burning Logging Slash.......................... 89 Table 37. Categorical Assessment of GHG mitigation potential of logging debris to fuel. ......... 90 Table 38. Collectable annual manure production and associated GHG emissions under current
management in Canada. ........................................................................................................ 92 Table 39. Summary of assumptions and activities for the proposed mitigation practices. ........... 94 Table 40. Categorical assessment of anaerobic digestion. ........................................................... 95 Table 41. Mitigation potential of solid wastes. ........................................................................... 101 Table 42. Mitigation Activity Constraints of Solid Wastes. ....................................................... 102 Table 43. Categorical Assessment of Solid Waste Strategies. .................................................... 102 Table 44. Categorical Assessment of Biochar. .......................................................................... 107 Table 45. Annual biomass production in three prairie provinces. .............................................. 108 Table 46. Categorical Assessment of Biomass Combustion. ..................................................... 111 Table 47. Canadian agricultural synthetic fertilizer market and GHG emissions from production
only (2009-2010) ................................................................................................................ 112 Table 48. Manure generated in the Canadian livestock industry that can be collected and
processed for bio-fertilizer production................................................................................ 115 Table 49. Bio-fertilizer potential from Canadian livestock manure and marginal land legume
production. .......................................................................................................................... 116 Table 50. Categorical Assessment of Biofertilizers. .................................................................. 117 Table 51. Categorical evaluation of forest products based material switching mitigation
opportunity. ......................................................................................................................... 121 Table 52. Petrochemicals that can be substituted. ...................................................................... 122 Table 53. Categorical evaluation of biomaterials. ...................................................................... 125 Table 54. Balance in radiative forcing between changes in albedo and carbon capture by
afforestation (from Betts, 2000) .......................................................................................... 127 Table 55. Total collectable wastes (municipal solid waste, municipal wastewater, and manure).
............................................................................................................................................. 135 Table 56 Summary of Canadian biologically based GHG capture and reduction opportunities. 136

11
List of Figures
Figure 1 Summary of carbon sequestration wedge evaluation. ...................................................... 4 Figure 2 Summary of GHG Reduction wedge evaluation. ............................................................. 4 Figure 3 Summary of waste management wedge evaluation. ......................................................... 5 Figure 4 Summary evaluation of materials switching wedge ......................................................... 6 Figure 5 Intergovernmental Panel on Climate Change (IPCC) 4th Assessment Report: The
economic potential of various sectors to contribute to climate change mitigation (estimated
in USD market prices per metric ton of carbon dioxide equivalents; percentages reflect
potential contribution of agriculture to offsetting the anthropogenic emissions at various
market prices, (Smith et al. 2007) ......................................................................................... 12 Figure 6: R&D Stages .................................................................................................................. 18 Figure 7. National Trends in Afforestation Plantings 1990 - 2002. .............................................. 21 Figure 8. Illustration of managed stand expectations and additional fibre volume. ..................... 29 Figure 9. Comparison of categorical evaluations of forest based GHG mitigation opportunities.42 Figure 10. SOC change with manure application at Rothamsted (adapted from Fend and Li
(2001))................................................................................................................................... 61 Figure 11. SOC change with manure application at Bretton (adapted from Feng and Li (2002)).
............................................................................................................................................... 62 Figure 12. SOC change with manure application at Rothamsted (adapted from Feng and Li
(2001))................................................................................................................................... 64 Figure 13. NIR Emission Factor ................................................................................................... 71 Figure 14. Biogas Potential of barley straw in comparison with beef cattle manure and silage in
laboratory incubation. Digested beef cattle manure from a commercial site used as an
inoculant. ............................................................................................................................... 97 Figure 15. Composition of solid waste by weight, generated by households ............................... 98 Figure 16. Illustration of the Nitrogen Cycle in agricultural soils. ............................................ 114 Figure 17. A conceptual view of integrated bioprocessing system for agriculture and municipal
wastes. ................................................................................................................................. 134 Figure 18 Summary of the carbon sequestration wedge ............................................................. 137 Figure 19 Summary of the GHG Reduction wedge .................................................................... 138 Figure 20 Summary of the Waste Management wedge .............................................................. 139 Figure 21 Summary of Materials Switching wedge ................................................................... 140
12
1.0 Introduction
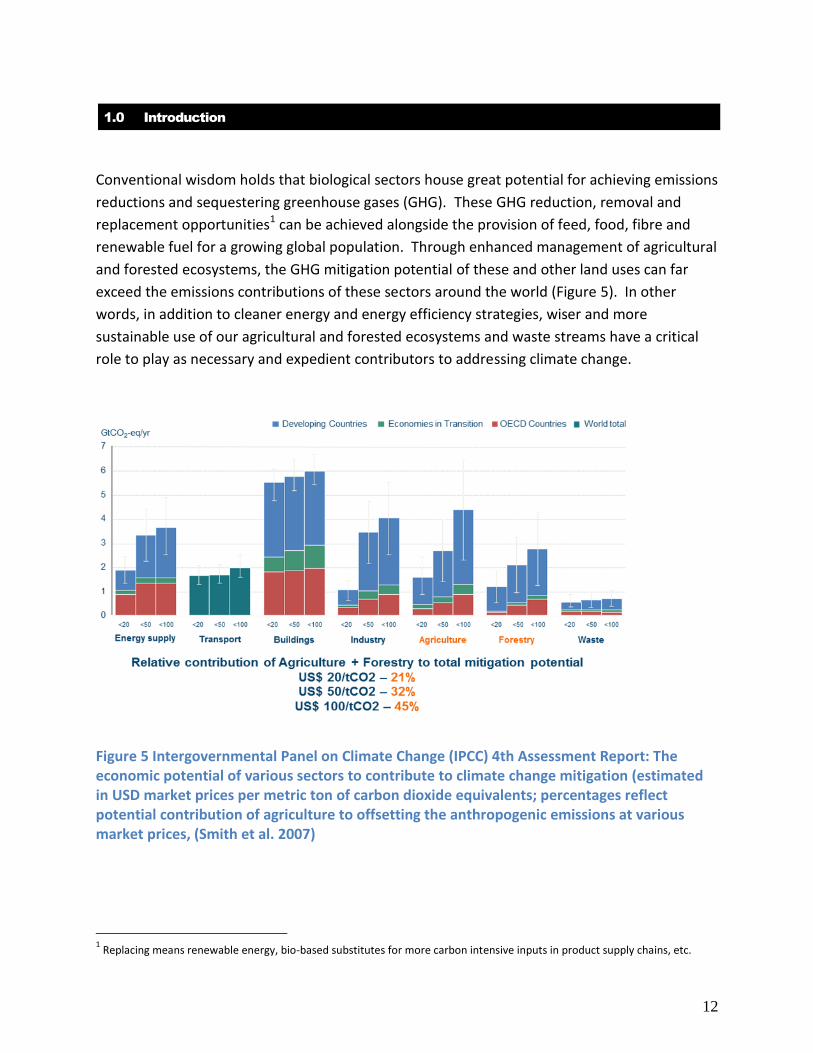
Conventional wisdom holds that biological sectors house great potential for achieving emissions
reductions and sequestering greenhouse gases (GHG). These GHG reduction, removal and
replacement opportunities1 can be achieved alongside the provision of feed, food, fibre and
renewable fuel for a growing global population. Through enhanced management of agricultural
and forested ecosystems, the GHG mitigation potential of these and other land uses can far
exceed the emissions contributions of these sectors around the world (Figure 5). In other
words, in addition to cleaner energy and energy efficiency strategies, wiser and more
sustainable use of our agricultural and forested ecosystems and waste streams have a critical
role to play as necessary and expedient contributors to addressing climate change.
Figure 5 Intergovernmental Panel on Climate Change (IPCC) 4th Assessment Report: The economic potential of various sectors to contribute to climate change mitigation (estimated in USD market prices per metric ton of carbon dioxide equivalents; percentages reflect potential contribution of agriculture to offsetting the anthropogenic emissions at various market prices, (Smith et al. 2007)
1 Replacing means renewable energy, bio-based substitutes for more carbon intensive inputs in product supply chains, etc.
13
In addition to the 2007 IPCC report, other reports have been compiled over the last few years
outlining the potential for emission reductions within these sectors, but the potential still
remains largely untapped.
In Canada, most analyses of biological GHG mitigation potential have tended to be theoretical:
Generic estimates made at a broad scale (e.g. National Greenhouse Gas Inventory level.)
Unconstrained by policy considerations, these reviews:
o Frequently ignore the impact of program start date requirements on slow to
develop projects like afforestation or improved forest management
o Do not fully address additionality when faced with general good management
practice initiated in response to factors other than climate change (e.g. soil
conservation, legally required sustainable forest management.)
o Downplayed or ignored broader effects (e.g. changes in albedo, impact of
climate change in contraindicating expected changes in GHG capture and
storage.)
This paper explores both the theoretical and the “constrained” or “achievable” GHG mitigation
potential of biological systems and management – particularly agriculture, forestry, waste to
energy and landscape level management. It directly addresses factors limiting operational
delivery of bio-capture and storage, including
1. Lack of enabling public policy or current public policy barriers (domestic and
international);
2. Limited understanding of the range of practices and technologies, with a clear
assessment of their potentials;
3. Lack of credible measurements of emission reductions associated with various practices
and technologies;
4. Confusion among the types of Carbon accounting standards (i.e. Carbon Offsets, Life
Cycle Assessments, Carbon Footprinting) for recognizing the environmental values
created;
5. The lack of a coherent and coordinated approach to address biological potentials.
These circumstances highlight the importance of a coordinated national approach for Canada,
since our country, and Alberta have been focused on resolving several of these concerns.
Canada has a natural advantage in mitigating its climate change impacts. Canada has 7% of the
world’s land area, 10% of the world’s forests and approximately 68 M ha of agricultural land,
with only 0.5% of the global population. According to BIOCAP (2006) every year, Canada’s

14
biosphere takes up and releases 10 to 20 times the CO2 produced by fossil fuel combustion.
Managing these resources better and taking advantage of Canada’s large natural ability to take
sunlight and capture carbon dioxide and use that to reduce, remove and replace emissions, can
enhance our biological potential to mitigate our impact and contribute to solutions. Canada is a
leader in quantification science for these sectors both at a National Emissions Inventory level,
and, for the last 6 or 7 years, in applying best practice guidance to codifying the science in
offset quantification protocols that define the tangible benefits from these sectors.
In addition, Canada has a certain political advantage in its ability to enhance biological
mitigation opportunities. The global consensus on policy approaches to better internalize and
manage carbon, is to place a price on it so emission of carbon is no longer ‘free’ and has a value
that can be incorporated into business, investment and corporate decisions. Canada is ahead
of the curve on this through (1) Alberta’s current and Saskatchewan’s imminent GHG regulatory
frameworks; (2) British Columbia’s Pacific Carbon Trust, (3) Ontario and Quebec’s commitment
to and action on the Western Climate Initiative’s cap and trade timelines and policies; and (4)
New Brunswick and Nova Scotia’s scoping of Voluntary Offset Fund initiatives. Most
jurisdictions in Canada have or will have a pricing policy that, given certain direction and
coordination, can also apply accompanying incentive and program measures that will enhance
biological management opportunities. The critical aspect will be credible measurements of
emission reductions, removals and replacements from these sectors in order to move forward.
To proceed, the Climate Change and Emissions Management Corporation (CCEMC)2 recognizes
there is a need for a summary document that broadly sketches the current potential of
biological opportunities in Canada for the purpose of starting a dialogue to develop a
coordinated national approach and associated Investment Road Map to address the above
concerns.
But, more importantly, the CCEMC recognizes that in order to strategically invest in this priority
area, they need to develop a deeper understanding to guide decisions to help ensure that
CCEMC project funds, and hopefully other sources of funding are allocated to the most
promising solutions to help Albertans and Canadians mitigate and adapt to climate change
impacts, now and in the future. It is for this reason that the CCEMC is initiating a Knowledge
Network on Biological GHG Management.
2 The Climate Change Emissions Management Corporation (CCEMC) is an independent Alberta-based not-for-profit corporation with a mandate to reduce greenhouse gas (GHG) emissions and adapt to climate change by supporting the discovery, development and deployment of clean technologies and biological GHG management.

15
2.0 Objectives and Structure of the Paper
This discussion paper is intended to provide a knowledge base of biological GHG mitigation
opportunities for Canada, using the best science and information available. This effort is
designed to be a precursor to the development of an Investment Road Map on how to
efficiently engage the biological sector in achieving the available greenhouse gas reductions. It
is anticipated that the Biological GHG Knowledge Network will coordinate ongoing work. This
network will be discussed and formalized at the event planned for late 2010. The
discussion paper will provide essential information to inform the development of the network,
a roadmap and its future program focus.
2.1 Objectives and Structure of the Paper
This paper is essentially a snapshot of where Canada is in terms of biologically-based mitigation
potential out to 2020, calculated on an annual emission reduction basis. The paper examines
the theoretical potential using the most reliable accounting methods, examines a number of
constraints for realizing that potential, and identifies what’s standing in the way of progress, as
well as that actions could be taken to enhance action and progress. Most of this information
was be derived from literature searches and the authors’ quantification estimates – but it
should be acknowledged that some of the barriers and gaps may be preliminary and a more
comprehensive assessment may need to be done by the Knowledge Network as they build the
roadmap.
2.1.1 Structure and Scope
The structure and scope of the paper focuses on major categories or ‘wedges’ of biological
mitigation. Some forms of biomass/waste to energy will be examined as they relate and
contribute to some of the major wedges (e.g. byproducts of biochar production or biogas
production)3. The CCEMC advised the authors to limit their focus on liquid biofuels, since this
wedge seems to be well understood. Therefore, the major Wedge opportunities that structure
this paper are:
1. Carbon Sequestration – includes agriculture soils and forestry sub-wedge opportunities;
3 Biofuel strategies and technologies will not be assessed as part of this study – this area has already been extensively studied.

16
2. GHG Reductions – includes direct reductions from livestock, nitrogen management and
other sub-wedge opportunities;
3. Waste Management – includes avoided methane emissions, methane capture and
destruction, biogas, indirect reductions through electricity and heat capture sub-wedges;
4. Materials Switching – includes substituting biological products such as biofertilizer,
biocomposites and biomaterials for more intensive carbon inputs such as steel, concrete
and conventional plastics and fibres;
5. Strategic Carbon Management – includes landscape level or integrated large-scale
opportunities to reduce emissions.
Generally speaking, the quantification of GHG mitigation potential for the mitigation strategies
presented in each wedge and sub-wedge opportunity use the standard accounting principles
outlined in Best Practice Guidance by the IPCC (2006), ISO GHG accounting standards 14064:1,
2 and 3 (CSA Standards 2009); Canada’s National Emissions Inventory Report 1990-2008
(Environment Canada 2010), as well as the World Resource Institute (WRI) - World Business
Council for Sustainable Development (WBCSD) GHG Protocol standards (Daviet and Raganathan
2005). Where deviations exist from current UNFCCC/Kyoto standards, they will be mentioned
in the report.
This means carbon policy criteria such as additionality, permanence, ensuring reductions are
measurable and verifiable, dealing with potential leakage effects and uncertainty, are taken
into account in the mitigation potentials. These factors will be addressed and discussed in the
assessment of each wedge and sub-wedge opportunity in the paper. In all cases, the net
impact of the major biological greenhouse gases – methane (CH4), nitrous oxide (N2O) and
carbon dioxide (CO2) is accounted for unless otherwise mentioned. The global warming
potentials used in this report are consistent with the Kyoto Protocol 2008-2012 accounting
period (CSA Standards 2009)4.
2.2 Activities and Deliverables
For each Wedge, an attempt was made to categorize and classify the literature, supporting
documentation and quantification methods for a baseline year that varied between 2006 and
2009. The availability of supporting data sources (Census, StatsCan surveys, and other relevant
4 GWP for nitrous oxide is 310, methane is 21 and carbon dioxide is 1.
17
reports) was more robust for this time frame, compared to earlier years. The data sources for
baseline and the mitigation opportunities are indicated in each wedge section (Section 3.2). In
most cases, the estimates for mitigation potential extend out to a consistent time frame (2020)
and are annualized into Mt CO2e/yr basis for comparison. In each Wedge section, the
quantification basis is described.
2.2.1 Structured Analysis of each Wedge
Each wedge lists the various sub-wedge opportunities or mitigation strategies as well as a
number of other systematic assessments. The format for each sub-wedge follows the following
structure:
Introduction
Mechanism and Methodology for Mitigation
o Description of mitigation mechanism for sub-wedge/supporting literature
o Quantification approach being applied; basis for quantification approach
o Discussion of the state of the science for carbon accounting/quantification in this
area
Quantification: Theoretical Mitigation Potential
o Baseline Assumptions and Data Sources
o Mitigation Assumptions and Activities
Constrained Potential: Market, Technical and Policy Overlay
o State of measurement, monitoring and verification
o Reversal mechanisms for permanence
o Assessment Matrix for Scale, Magnitude, Speed and R&D ranking
o Re-assessment of the Mitigation Potential taking into account these constraints
o Co-benefits/impacts
Operationalizing the Wedge
o Enabling tools – what would help operationalize – programs, policies,
investments, related to the above subwedge
o Recommendations on what to pursue or prioritize 1st, 2nd 3rd, etc.
2.2.2 Assessment Matrix for Scale, Magnitude and Research and Development (R&D) Ranking
To provide the reader with a relative understanding of some of the constraints around
implementing the Wedge or sub-wedge opportunity, the following assessment matrix is
applied (Table 3):

18
Table 3. Categorical assessment for speed, scale, magnitude and R&D.
Speed -Score Magnitude - Score Scalability - Score R&D
stage
< 6 yrs - 5 >5 Mt/yr - 5 Contiguous/ scalable - 5
See
below
6-10 yrs -3 1-5 Mt/yr - 3 Patchy/scalable w/difficulty - 3
> 10 yrs - 1 < 1 Mt/yr - 1 Dispersed/ challenges to scalability
- 1
If the opportunity/strategy can be implemented relatively quickly, it rates a score of 5 on
the Speed scale. If the mitigation potential is relatively high, within the Wedge category, it
rates a higher number on the Magnitude scale. If it can be scaled relatively easy then it
rates a higher score on the Scalability category. The R&D stage is also included and is
identified according to the CCEMC R&D chart, categorized by the following numeric
categories (Figure 7).
R&D Stage: 1 2 3 4 5 6
Figure 6: R&D Stages
This assessment sets the stage for the final category for each Sub-Wedge opportunity –
Operationalizing the Wedge.
19
3.0 Wedge Mitigation Potentials and Analysis
The following sections are organized according to major Wedge opportunities as outlined in
Section 2.1.1 above. Each Wedge is broken down into a series of sub-wedges based on the
most promising and quantitative estimates available. For some of these opportunities, case
studies are presented rather than Canada-wide coverage of mitigation potentials. The case
study approach is typically applied when a lack of consistent datasets across Canada exist (e.g.
Improved Forest Management estimates are based on Alberta’s quantitative yield-based timber
prediction system), or the wedge is a demand-driven and dependent on many market and
penetration factors (e.g. biomaterials).
3.1 Carbon Sequestration
Carbon sequestration by trees is the most intuitive and most challenging component of the
complex relationship between forests and climate change. Canada contains approximately 1/3
of the circumpolar boreal forest; which, in turn, constitutes 77 percent of Canada’s forest area
and 35 percent of Canada’s land area (Natural Resources Canada 2009). Boreal forest
productivity of native upland forest types ranges from approximately 1 m3/ha/yr (in NL,
northern ON, PQ, MB and SK) to approximately 3 m3/ha/yr in the central interior of British
Columbia (National Forestry Database 2010).
Forest carbon is stored in trees (and other woody plants), soil, peat, and dead woody material.
Each of these pools is considered and addressed in the Carbon Budget Model – Canadian Forest
Sector (CBM-CFS 3). Durability of storage depends on multiple factors, including the size and
nature of the storage medium, location (soil, air, standing, etc.) of the storage medium, and
local or regional climatic regime. To more completely address forest carbon capture and
storage a number of carbon capture and storage opportunities will be addressed individually;
these include afforestation/reforestation, generic increases in forest productivity mediated by
climate change, improved forest management, and storage in mineral soil and peatlands.
Early estimates of carbon capture and storage by forests were optimistic that forests would
handily meet Canada’s need for GHG emission mitigation; for example van Kooten et al (2009)
comment that “the Kyoto Protocol rules permit the use of forestry activities that create carbon
offset credits. These could obviate the need for lifestyle-changing reductions in fossil fuel use.”
Similarly, Brown et al (2002) found carbon sequestration in forests was likely the least costly
way for tropical countries to meet GHG mitigation objectives. Unfortunately, these potentials
were generalized into overly optimistic expectations.

20
3.1.1 Afforestation/Reforestation
Afforestation and reforestation, as defined under IPCC rules, offer a substantial opportunity for
carbon capture and storage. Afforestation can take a number of forms including:
Agro-forestry where trees are planted across a functioning agricultural landscape – this
form of afforestation is frequently integrated with pastoral agriculture;
Shelterbelt plantings where trees or shrubs are planted as buffers along agricultural
fields – this form of afforestation has been used extensively for soil conservation
purposes on the Canadian prairies;
Amenity plantings where trees and shrubs are planted for recreational, ornamental or
landscape purposes;
Production afforestation where afforestation is used to supply mill furnish to a wood
processing facility;
Short rotation intensive culture (SRIC) afforestation is a subset of production
afforestation, where highly productive woody crops are managed intensively to produce
extremely high yields of fibre on short time horizons. SRIC afforestation is particularly
useful when using higher value land for afforestation purposes.
Forest 2020
Natural Resources Canada (NRCAN) conducted a pilot project (Forest 2020) in 2005 – 2006 to
examine the potential of afforestation across Canada. This project provided an opportunity to
evaluate afforestation techniques, to predict yield of afforestation projects, to engage
landowners in afforestation, and to address a number of topical issues around afforestation.
NRCAN maintains a website where many of the Forest 2020 outcomes are available – much of
the data used in developing this section of the report were drawn from that website (Natural
Resources Canada 2008).
Forest 2020 quantified afforestation activity in Canada for the period 1990 through 2002;
Figure 7 taken from the Forest 2020 website shows the trend in afforestation activity in Canada
during this period.
21
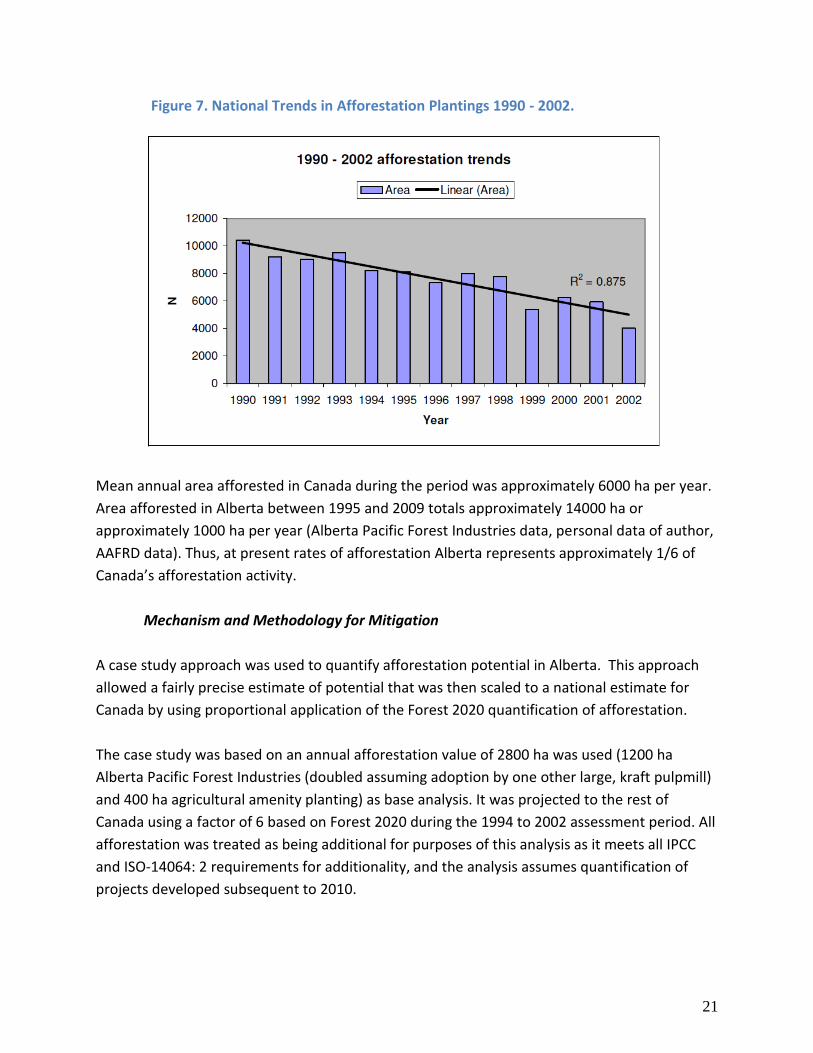
Figure 7. National Trends in Afforestation Plantings 1990 - 2002.
Mean annual area afforested in Canada during the period was approximately 6000 ha per year.
Area afforested in Alberta between 1995 and 2009 totals approximately 14000 ha or
approximately 1000 ha per year (Alberta Pacific Forest Industries data, personal data of author,
AAFRD data). Thus, at present rates of afforestation Alberta represents approximately 1/6 of
Canada’s afforestation activity.
Mechanism and Methodology for Mitigation
A case study approach was used to quantify afforestation potential in Alberta. This approach
allowed a fairly precise estimate of potential that was then scaled to a national estimate for
Canada by using proportional application of the Forest 2020 quantification of afforestation.
The case study was based on an annual afforestation value of 2800 ha was used (1200 ha
Alberta Pacific Forest Industries (doubled assuming adoption by one other large, kraft pulpmill)
and 400 ha agricultural amenity planting) as base analysis. It was projected to the rest of
Canada using a factor of 6 based on Forest 2020 during the 1994 to 2002 assessment period. All
afforestation was treated as being additional for purposes of this analysis as it meets all IPCC
and ISO-14064: 2 requirements for additionality, and the analysis assumes quantification of
projects developed subsequent to 2010.

22
Forest 2020 did not provide yield estimates; however, potential yields on afforested areas in
Alberta range from 1.5 m3/ha/yr (in amenity plantings) to approximately 8 m3/ha/yr (in SRIC
hybrid poplar plantings). For this evaluation a SRIC yield of 7.5 m3/ha/yr was used for hardwood
plantings (Anderson and Luckert 2007); for agricultural amenity plantings a yield of 1.5
m3/ha/yr softwood yield and a 4 m3/ha/yr hardwood yield were used (author, unpublished
data). By definition, afforestation has a de facto baseline of 0, as there is no forest present prior
to afforestation.
Table 4 Alberta case study of annual afforestation GHG mitigation potential.
Cultural
Practice
Area
(ha)
Yield
(m3/h
a/yr)
Total
Yield
(m3)
Densi
ty
(kg/m3)
Wood to
Carbon
Conversi
on
Expansio
n Factor
(from
CBMCFS-
3)
Root to
Shoot
Ratio
(from
CBMCFS-
3)
Abov
e
Groun
d
CO2e
(MT)
Below
Ground
CO2e
(MT)
Total
CO2e
(MT)
SRIC
Poplar 2800 7.5 21000 0.36 0.5 1.11 0.14 0.015 0.002
Amenity
Hardwood 200 4 800 0.36 0.5 1.11 0.14 0.001 0.000
Amenity
Softwood 200 1.5 300 0.4 0.5 0.09 0.12 0.000 0.000 0.018
For Canada, this translates into an annual carbon dioxide capture and storage rate of
approximately 0.1 Mt CO2e (multiplying the Alberta afforestation result by 6 to estimate
national potential – the multiplier (6) is based on the Forest 2020 afforestation census). Thus
over a decade afforestation could result in approximately 0.6 Mt of CO2e mitigation potential –
presuming a consistent rate of afforestation.
Post-Disturbance Reforestation
At present, Canadian forest management policy does not require reforestation of “natural”
disturbances – wildfire, insect-induced mortality and climatic mediated mortality. The usual
response to disturbance is to recalculate allowable harvest levels unless the forest company
actively reforests the disturbed area. While there is a dearth of data on disturbance
reforestation, a review of company and provincial forest management plans suggests that
reforestation of disturbed areas generally occurs on an ad hoc basis. To assure conservatism in
23
estimation, a factor of ½ of all naturally disturbed areas within the managed forest area was
assumed to be eligible for reforestation quantification.
Criteria for eligibility include:
No legislative requirement for reforestation, as disturbed areas are treated as if they are regenerating on “natural stand” yield curves.
No incentive funding is available to reforest disturbed areas.
Only disturbed areas within the “managed” forest area as described by the Canadian Council of Forest Ministers are eligible for quantification.
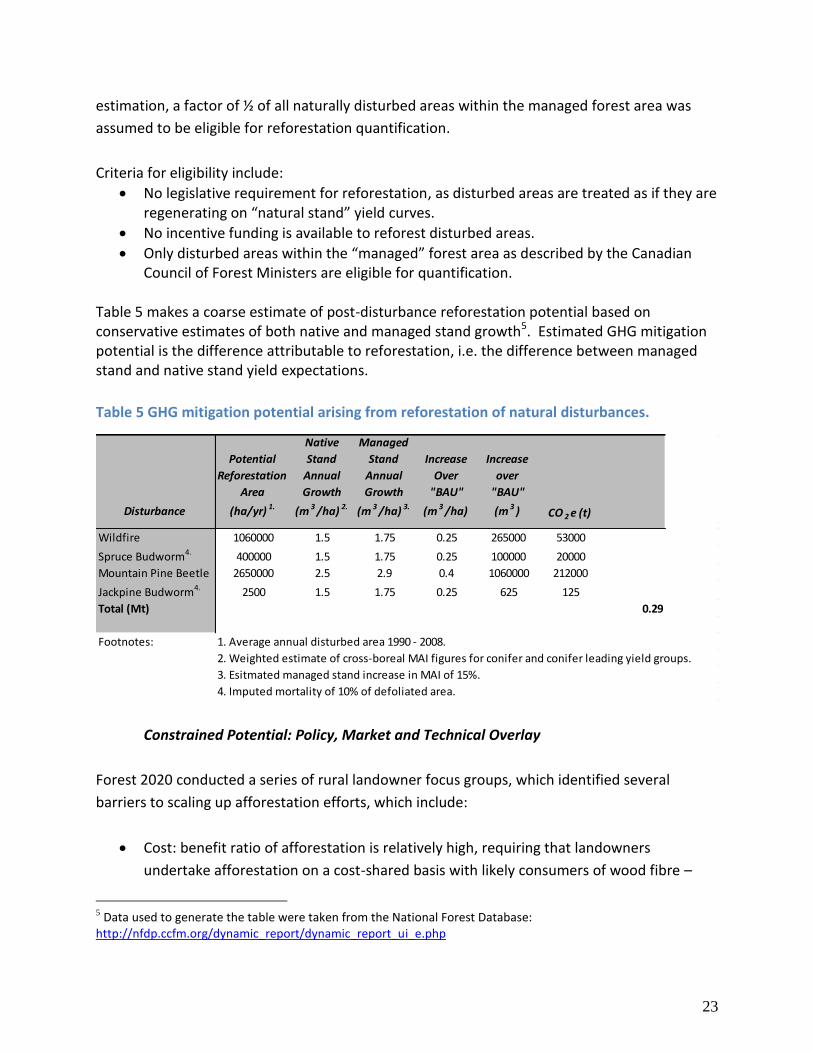
Table 5 makes a coarse estimate of post-disturbance reforestation potential based on conservative estimates of both native and managed stand growth5. Estimated GHG mitigation potential is the difference attributable to reforestation, i.e. the difference between managed stand and native stand yield expectations.
Table 5 GHG mitigation potential arising from reforestation of natural disturbances.
Disturbance
Potential
Reforestation
Area
(ha/yr) 1.
Native
Stand
Annual
Growth
(m 3 /ha) 2.
Managed
Stand
Annual
Growth
(m 3 /ha) 3.
Increase
Over
"BAU"
(m 3 /ha)
Increase
over
"BAU"
(m 3 ) CO 2 e (t)
Wildfire 1060000 1.5 1.75 0.25 265000 53000
Spruce Budworm4. 400000 1.5 1.75 0.25 100000 20000
Mountain Pine Beetle 2650000 2.5 2.9 0.4 1060000 212000
Jackpine Budworm4. 2500 1.5 1.75 0.25 625 125
Total (Mt) 0.29
Footnotes: 1. Average annual disturbed area 1990 - 2008.
2. Weighted estimate of cross-boreal MAI figures for conifer and conifer leading yield groups.
3. Esitmated managed stand increase in MAI of 15%.
4. Imputed mortality of 10% of defoliated area.
Constrained Potential: Policy, Market and Technical Overlay
Forest 2020 conducted a series of rural landowner focus groups, which identified several
barriers to scaling up afforestation efforts, which include:
Cost: benefit ratio of afforestation is relatively high, requiring that landowners
undertake afforestation on a cost-shared basis with likely consumers of wood fibre –
5 Data used to generate the table were taken from the National Forest Database:
http://nfdp.ccfm.org/dynamic_report/dynamic_report_ui_e.php
24
this is, in fact, the model used for SRIC hybrid poplar production in Alberta. Where a
cost-shared approach is not available landowners are unlikely to undertake
afforestation.
Opportunity costs are high. Afforestation effectively locks up land, preventing
production of high value annual crops. Landowners are reluctant to undertake
afforestation as it might prevent their capitalizing on a significant opportunity should
one arise.
Value of hybrid poplar varies with distance to mill and who harvests the trees, but is
likely to net landowners on the order of $10 per m3. Given a yield of 145 m3/ha
landowners will realize revenue of $1450 per ha over 20 years. Should they grow hay on
the same land for 20 years their revenue stream would likely be approximately
$150/ha/yr. This would give a future value of approximately $4500, which is
substantially greater than the revenue arising from afforestation while providing interim
income.
Landowners feel the technical skills and support needed to successfully implement
afforestation is lacking; to quote: “A wide variety of information needs were expressed,
and generally these have to do with growing, establishing, maintaining, and harvesting
trees. Infrastructure support would come in the form of appropriate technology
sourcing and leasing or renting of machinery through delivery agents.”
Landowners felt that to grow “good” trees there was a need to practice afforestation on
“good” land, upping the opportunity cost and need for interim financing substantially, as
growers are unlikely to be able to wait for harvest to receive income on high quality
sites.
Forest 2020 identified a break-even carbon price of $15-18 per tonne as being necessary
for afforestation investment to make economic sense in Alberta; this included an
average standing timber value of $10 per tonne or $7-8 per m3.
Disturbance reforestation requires empirical evaluation and quantification as wide-ranging assumptions were used to make the estimate given. These include:
Empirical quantification of area reforested under subsidy or legal requirement for each disturbance type.
More precise determination of growth potential as the estimates used are a simple average across the boreal forest.

25
A quantitative assessment of reforestation costs in both monetary and GHG terms to better estimate both practicality and mitigation potential.
At present, the only active afforestation program in Canada is found in Alberta. Therefore for
purposes of estimating the constrained potential current afforestation activity in Alberta was
treated as representing the constrained potential for afforestation. Disturbance reforestation is
episodic but it appears that reforestation of some of the mountain pine beetle denuded forest
lands is likely occur providing another 0.7 Mt of mitigation potential.
Table 6. Categorical evaluation of the afforestation-based mitigation opportunity
Afforestation Explanation/Deviation from criteria outlined in section 2.2.2
Speed 1 Time required to overcome economic barriers, then
stimulate landowner adoption
Magnitude 3 Realized outcome (approx 6Mt)
Scale 3 Many locations, contractors, suppliers therefore verification
will be challenging
R&D Stage 3 Know this will work, required significant economic incentives
and support
Total (of 21) 10
Operationalizing the Sub-Wedge
Changes to Canadian personal and corporate tax structures to facilitate investment in
afforestation.
Economic incentives to offset the opportunity cost of afforestation to farm income.
Technical support and training to facilitate adoption of afforestation as an operational
farming practice, building on Woodlot Extension programs and shelterbelt programs
across the country.
Clarity around ownership of increased standing wood volume on public lands that arises from private initiatives.
Development of prioritization and planning tools to guide reforestation efforts to disturbed areas with the greatest economic mitigation potential.
26
3.1.2 Generic Increases in Forest Productivity
There has been considerable investigation of the potential for increased atmospheric CO2 levels
to act as a “fertilizer” resulting in a passive enhancement in tree growth. In general, older
studies have tended toward greater optimism on the response of forests to increasing levels of
atmospheric CO2. For example, Pastor and Post (1988) suggested increases in forest growth
were a likely response to increased atmospheric CO2; while Calef (2010) contends: “Although
green-up and thus growing season seem to be starting earlier in the boreal forest (Hicke et al
2002), most studies conclude that net photosynthetic activity (carbon uptake by plants for
growth) is decreasing, which was termed ‘browning’ (Bunn and Goetz 2006; Bunn et al 2007;
Goetz et al 2005; Verbyla 2008). This browning is most pronounced in the warm and dry areas
of interior Alaska (Verbyla 2008) in July and August; it has been detected in the entire
circumpolar boreal forest and is in stark contrast to the greening observed in the tundra (Bunn
and Goetz 2006; Bunn et al 2007; Goetz et al 2005; Verbyla 2008) and has caused a stir in the
science community which had been in the belief that the vegetation at high latitudes was
getting greener with warming based on a landmark paper (Myneni et al 1997).”
Clearly, then, improvements in monitoring and modeling techniques suggest the boreal forest
is unlikely to respond to increasing levels of atmospheric CO2 as if it were an involuntary
fertilization effect.
3.1.3 Carbon Storage in Forest Soils
Soils, including forest soils, are large reservoirs of carbon; however, soil may function as a sink
or source of carbon depending on land management, agricultural practice, or forest
management system. Goodale et al (2002) contend soil organic carbon is the largest active sink
in Canadian forests, capturing approximately 0.08 Mt of carbon between 1990 and 1994.
Trumper et al (2009) consider boreal forest soil a substantial carbon reservoir: “Because of the
low temperatures, decomposition in boreal forests is slow. This leads, as in the tundra, to large
accumulations of carbon in the soil pool (116-343 t C per ha, Mahli et al, 1999; Amundson
2001)*…+ though recent studies suggest that these old-growth forests may indeed be carbon
sinks (Luyssaert et al 2008).” Bhatti et al (2002) compared empirical estimates of carbon
storage in boreal forest soils with two modeling approaches – storage values ranged from 10.2
to 14.6 kg/m2. Taking the most conservative value (10.2 kg/m2) gives a storage value of 102 t C
per ha in upland boreal forest soils in Canada.
27
Hendrickson (2003) suggests changes in forest soil organic carbon (SOC) in response to climate
change will likely be variable depending on changes in precipitation regime, and somewhat
stochastic at a finer scale depending on severe weather instigated disturbance. He speculates
that overall boreal forest SOC stock is likely to increase provided reforestation of cutover areas
is prompt and that minimal soil disruption occurs during the forest harvesting and renewal
cycle. Fleming et al (2006) found harvesting had little effect on SOC provided soil disturbance
was avoided during the harvest operation. In particular, Hendrickson singled out mechanical
site preparation for reforestation as a practice likely to induce negative flux in SOC. Kurz et al
2007 suggest that boreal SOC stocks may decline (i.e. function as net carbon sources) for
several decades due to temperature increase-mediated increases in soil aerobic respiration and
increased soil disturbance. Jones et al 2005 found that SOC levels in upland boreal soils are
likely to increase in the face of climate change. Euskirchen et al (2010) suggest climate change
will alter forest renewal and will likely result in increased carbon storage in upland forest soils.
Mechanism and Methodology for Mitigation
While there is not a consensus, the bulk of the literature suggests SOC will increase; however,
there is a dearth of information on the potential scale of this increase. In fact, there is little
information on the rate of carbon sequestration in boreal forest soils in Canada. In contrast,
Yurova and Landkriejer (2007) predict upland boreal forest soils in Sweden will sequester
carbon at 0.0103 kg/m2/yr. Similarly, there is little information on the extent of upland soils in
the Canadian boreal forest.
Given the size of the boreal forest upland SOC reservoir and our present inability to quantify
upland forest SOC stocks or fluxes it would be prudent to manage SOC to minimize loss. This
suggests minimizing anthropogenic soil disturbance at both the operational and landscape
levels.
For example, at the operational level forest mechanical site preparation is critical to successful
reforestation of many boreal site types, as it provides trees a measure of buffer from cold wet
soils. Unfortunately, mechanical site preparation results in negative SOC flux. In following
disturbance minimization strategy reforestation prescriptions would more accurately define the
bounds of cold, wet soils and then apply a more targeted mechanical site preparation
treatment. Recent advances in light detection and ranging (LiDAR) technology – specifically Wet
Areas Mapping (WAM) (Chicoine and Mihajlovich (2010)) provides the ability to identify areas
where mechanical site preparation is critical and more importantly to identify areas where it is
not required. Further, once these areas have been identified, targeted site preparation
28
techniques such as making individual planting micro-sites (mounding) will result in far less soil
disturbance and efflux of SOC.
At the landscape level, efforts like the on-going regional planning initiative in Alberta will result
in less cumulative footprint arising from industrial infrastructure and therefore less disturbance
and SOC efflux.
Operationalizing the Sub-Wedge
A clear and easily applied definition of upland boreal soils.
Determine the extent of upland soils in Canada’s boreal forest.
Use a previous soil or soil organic carbon inventory to set a baseline.
Develop an on-going SOC inventory to quantify changes.
3.1.4 Improved Forest Management
Forest management in Canada occurs primarily on public lands and is undertaken primarily by
private enterprises. Reforestation of lands harvested to supply forest products is generally a
legal requirement of forest tenure; i.e. forest products enterprises are required to reforest
lands they harvest as part of their tenure obligation. Thus most reforestation activity is not
“additional” in terms of GHG capture and storage. Furthermore, forest tenure takes two forms:
volume-based allocations of forest fibre and land-based tenure. Forest enterprises holding
land-based tenure are required to develop forest management plans that effectively define
reforestation expectations – in effect, defining “business as usual” (BAU) for purposes of
determining additionality for GHG quantification.
Forest management plans generally expect and plan for additional fibre volume over that found
in native forests. These “managed stand” expectations are generally predicated on:
Reducing (or eliminating) delays in reforestation – native forest stands are presumed to
have taken a period of time to establish. This “reforestation lag” is generally assumed to
be reduced or eliminated in managed forests.
Reforestation activities frequently utilize technologies or techniques, which are
expected to increase forest productivity. These include genetically improved planting
stock, physiologically conditioned seedlings, mechanical site preparation and
competition control or tending of planted trees.

29
Density management and uniform site occupancy are expected to result in more
uniform and more consistently rapid forest growth.
Thus managed stands generally show better growth than native forests –these managed stand
growth expectations must underpin any definition of additionality. Figure 9 is a “real world”
illustration of both managed stands expectations and growth that is additional to managed
stands expectations. In this illustration “NS” refers to native (fire origin) stand growth
expectations, “DFMP” refers to detailed forest management plan expectations, and “ARS”
refers to regeneration survey outcomes.
Figure 8. Illustration of managed stand expectations and additional fibre volume.
The area shaded green and yellow between the DFMP and ARS curves is truly additional; while
the area between the NS and DFMP curves shows substantial increases in volume, these are not
additional because the DFMP is effectively BAU for purposes of defining additionality. For the
area between ARS and DFMP to remain completely additional harvest levels must not be
increased to capture the additional volume. If the increase in volume production is added to
the harvest queue it must be discounted by a factor that represents storage in harvested wood
products.
Mechanism and Methodology for Mitigation
A case study approach using recent (2008 and 2009) provincial regeneration assessment
outcomes was used to broadly quantify the potential for improved forest management to
mitigate greenhouse gas emissions. Alberta is unique in having a regeneration assessment
30
method that links reforestation outcomes quantitatively to management planning expectations
– effectively, a built-in test for additionality. Thus, an empirical assessment of the mitigation
potential of improved forest management in Alberta could be undertaken easily.
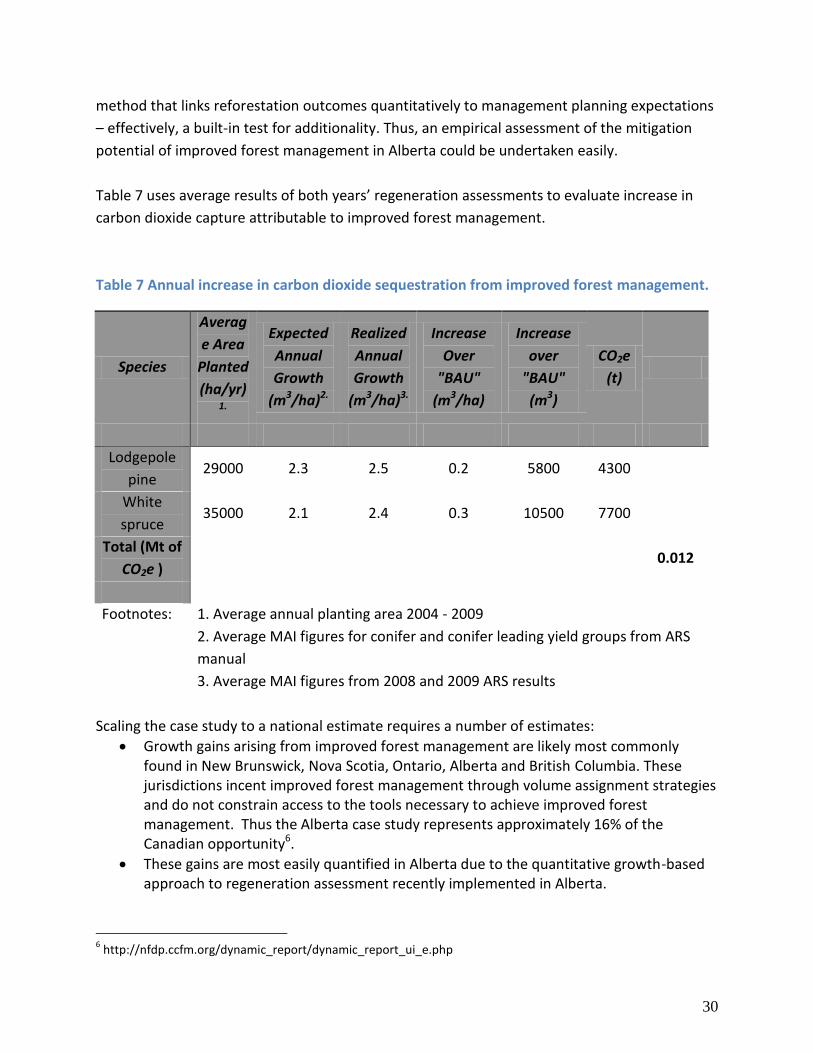
Table 7 uses average results of both years’ regeneration assessments to evaluate increase in
carbon dioxide capture attributable to improved forest management.
Table 7 Annual increase in carbon dioxide sequestration from improved forest management.
Species
Averag
e Area
Planted
(ha/yr)1.
Expected
Annual
Growth
(m3/ha)2.
Realized
Annual
Growth
(m3/ha)3.
Increase
Over
"BAU"
(m3/ha)
Increase
over
"BAU"
(m3)
CO2e
(t)
Lodgepole
pine 29000 2.3 2.5 0.2 5800 4300
White
spruce 35000 2.1 2.4 0.3 10500 7700
Total (Mt of
CO2e ) 0.012
Footnotes: 1. Average annual planting area 2004 - 2009
2. Average MAI figures for conifer and conifer leading yield groups from ARS
manual
3. Average MAI figures from 2008 and 2009 ARS results
Scaling the case study to a national estimate requires a number of estimates:
Growth gains arising from improved forest management are likely most commonly found in New Brunswick, Nova Scotia, Ontario, Alberta and British Columbia. These jurisdictions incent improved forest management through volume assignment strategies and do not constrain access to the tools necessary to achieve improved forest management. Thus the Alberta case study represents approximately 16% of the Canadian opportunity6.
These gains are most easily quantified in Alberta due to the quantitative growth-based approach to regeneration assessment recently implemented in Alberta.
6 http://nfdp.ccfm.org/dynamic_report/dynamic_report_ui_e.php

31
Forest growth varies widely across Canada; from a low of ~1 m3/ha/yr in NL, ON and QC to a high of more than 10 m3/ha/yr in intensively managed coastal forests. Quantification at a level of resolution that addressed these growth differences and their responses to improved forest management was beyond the scope of this document. In the interest of conservatism the Alberta numbers were simply scaled up to an area proportion basis.
Thus a conservative national estimate of the potential for improved forest management to mitigate GHG emissions is 0.012 Mt X 100/16 or 0.075 Mt CO2e per year.
Constrained Potential: Policy, Market and Technical Overlay
For improved forest management to provide GHG capture and sequestration a number of
critical changes to forest management expectations must be made:
Forest management planning must recognize carbon dioxide capture and storage as a
forest product. Effectively, this means management plans must recognize that increased
volume production may be assigned to either conventional forest products or GHG
capture and storage but not to both.
Silvicultural practices must be prescribed and deployed to attain both fibre and carbon
production objectives. While similar these objectives are not always the same – for
example, carbon management objectives might suggest longer rotation ages than fibre
management objectives.
Better quantification of GHG emissions associated with forest management and
particularly reforestation must occur. In particular, any differences in GHG emission
profile between what is needed to attain DFMP and ARS must be quantified and netted
from the ARS quantification. This must include fluxes in forest sinks as well as direct
project emissions.
Ownership of carbon (particularly “additional” carbon) stored in trees on public lands
must be re-examined. At present, carbon stored in trees on public lands is deemed to be
property of the Crown until such time as the tree is severed (Alberta Sustainable
Resource Development, 2010) effectively preventing forest managers from realizing any
gain from GHG sequestration for decades.

32
Alberta is the only province, at present, with a forest regeneration assessment system
that determine growth trajectory of young stands and contrasts these results with
management expectations. Other provinces would require development of a suite of
tools including juvenile growth models, baseline determination and
sampling/verification methods to adequately quantify carbon dioxide sequestration
attributable to improved forest management.
Substantial funding is required to implement improved forest management and at
present there is no financial benefit that accrues to increased carbon storage in standing
forests.
Table 8. Categorical evaluation of mitigation potential of Improved Forest Management
Improved
Forest
Management
Explanation/Deviation from criteria outlined in section
2.2.2
Speed 5 Activity in place until approx 2008, quantification method
already exists
Magnitud
e 1 Realized outcome (<1Mt)
Scale 3 Quantification outside AB must be developed
R&D Stage 6 Current operational practice
Total (of
21) 14
Operationalizing the Sub-Wedge
Include carbon dioxide capture and storage in the forest products mix when developing
detailed forest management plans.
Apply silvicultural treatments to increase carbon density at the cutblock or reforestation
project level.
Develop a more targeted approach to reforestation, including:
o Focused, site specific mechanical site preparation treatments.
o Use models and empirical assessment of older plantations to assess the role of
planting density from a carbon management perspective.

33
o Include “emission costs” in selection criteria for silvicultural treatments.
Extend use of CBM-CFS 3 to assist silviculturists in developing silviculture processes and
prescriptions.
Develop and include ex poste GHG quantification tools in silviculture assessment
processes.
3.1.5 Carbon Sequestration in Peatlands
Peat accumulating lowlands (peatlands) are recognized as large reservoirs of carbon storage in
the ecosystem. Peatlands cover approximately 3% of the Earth’s land surface and store
approximately one third of the world’s soil carbon (Vitt, 2006). Canada’s peatlands have been
estimated to contain up to 170,000 Mt of carbon (Vitt ibid). In Alberta up to 70% of soil carbon
is stored in peatlands (13,500 Mt in peatlands, 2300 Mt in lakes, 2700 Mt in forests, and 800 Mt
in grasslands).
Mechanism and Methodology for Mitigation
Despite the enormous scale of organic carbon storage in peatlands, they are recognized as large
reservoirs but only weak sinks due to variations in greenhouse gas emissions with variation in
water level. As peatlands dry they move from capturing carbon in plant material found below
the water surface, to emitting methane from semi-decomposed plant material exposed by the
retreating water (Vitt 2006). Furthermore, peatlands tend to accumulate carbon at relatively
low rates, which are driven by both slow growth rates of plants found in peatlands and
recurring fire disturbance of peatlands. For example, pristine peatlands in western Canada
sequester 194 kg/ha/yr of carbon in the absence of land management practices, however this
increases to 245 kg/ha/yr under present management regimes that exclude wildfire (Vitt 2006).
Turetsky et al (2002) conducted a regional cumulative effects analysis that encompasses
wildfire, anthropogenic disturbance, harvest and climate change impacts on peatland carbon
fluxes. They found a net increase in carbon storage in peatlands across western Canada of 4.8
Mt CO2e. Most erosion of peatland carbon storage was driven by fire and natural mineralization
processes; however, approximately 0.7 Mt/yr of loss were attributable to harvesting of peat
and to industrial development on peatlands. This analysis did not consider dispersed
disturbance of peatlands for forest harvesting and mineral/petroleum exploration purposes.
Table 9 taken from Turetsky et al 2002 provides regional peatland carbon flux baseline.

34
Table 9. Peatland carbon fluxes-Western Canada (from Turetsky et al.)
The scientific consensus around carbon storage in peatlands is that carbon storage is likely to
be adversely affected by climate mediated disturbance. Unfortunately, once disturbed,
peatlands take centuries to recover the pre-disturbance carbon storage levels, and peatlands
are likely to become net sources due to release of CH4 following disturbance. Vitt 2006 suggests
it takes approximately 500 years for peatlands to return to being weak sinks following
disturbance. The Oilsands Wetlands Working Group (2000) states that peatlands cannot be
replaced by reclamation efforts following disturbance as there are no techniques available, at
present, to replace bogs and fens on post-disturbance landscapes.
Constrained Potential: Policy, Market and Technical Overlay
In summary peatlands might best be viewed as vast carbon reservoirs at significant risk of
alteration through climate change or anthropogenic effects on the forest and tundra
landscapes. In particular disturbance may result in significant methane emissions as peatlands
become warmer – resulting in more rapid decomposition of organic materials currently
“stored” in peatlands. If this view is taken it would be prudent to manage peatlands and their
associated landscapes to minimize disturbance of peatlands and attempt to buffer them from
the effects of climate change. Turetsky et al 2002 shows the value of anthropogenic protection
in maintaining intact peatlands in the face of wildfire.
35
Operationalizing the Sub-Wedge
Vitt 2006 offers an array of guidelines for mitigating climatic and anthropogenic impacts on the
ability of peatlands to continue to function as a carbon sink. They are:
“Develop a long-range plan of corridors and reserves that includes predicted future
occurrences of peatlands. Since our future peatlands may only exist in a fully functional
condition north of 60° N latitude, we should begin now to incorporate a reserve system
that examines these northern sites.
“Restoration of wetlands after oil sands extraction may only be possible by examining
wetlands that currently exist under our future predicted climatic regime. Examination of
how these wetlands have initiated and continue to exist may provide valuable insights
into our wetland environments. For example, a key indicator species of rich fens is
Meesia triquetra. Examination of herbarium specimens and distribution maps of the
occurrence of M. triquetra in southern Saskatchewan and the Midwestern states may be
useful in developing landscapes for rich fen development under future climatic regimes.
• “Maintain our peatlands in as pristine condition as possible. Use of peatlands for
agriculture increases GWP (global warming potential) of fens and bogs substantially.
Whereas the GWP of pristine bogs is negative and of fens is only slightly positive (less
than 100 kg CO2e ha–1 yr–1), when peatlands are drained for pasture or tilled the GWP
increases to 4000 to 5000 kg CO2e equiv. ha–1 yr–1 for the former and more than
10,000 for the latter for fens.
• “Mitigation for indirect effects can be as follows:
Do not remove the actively growing top few centimeters of the ground layer
when grading access lines.
Keep the time from the end of peat harvesting activity to revegetation as short
as possible. In western Canada, develop a clear management plan for restoration
of cut over bogs back to fens.
Avoid nutrient inputs to peatlands during construction activities; these include
keeping to a minimum the introduction of mineral soil to peatland areas.
Adequate buffer zones should be maintained around peatland complexes.
Higher water tables from increased upland runoff after forest harvest or wildfire
increase nutrients and decrease acrotelms resulting in complete successional
turnover of keystone species and this may be as devastating for peatlands as
lowered water tables due to climate change. Buffer zones should be designed

36
relative to peatland size, runoff amount, and watershed extent in order to
protect small, sensitive peatlands as well as larger, less sensitive peatland
complexes.
Road construction engineering should endeavor to understand peatland
hydrology in order to avoid changes in water levels.”
Table 10. Categorical Assessment of Peatland Management Mitigation Opportunity.
Peatland
Management
Explanation/Deviation from criteria outlined in section
2.2.2
Speed 1 Indirect, preventative measures are the only methods
available
Magnitude 1 Realized outcome (<1Mt)
Scale 1 Large area but highly variable and difficult to quantify
R&D Stage 1 Basic Science only
Total (of 21) 4
3.1.6 Avoided Forest Conversion
Avoided forest conversion is commonly used to reduce GHG emissions from burning of tropical
forests in preparation for agricultural exploitation. This option is less commonly considered in
the Canadian context. In Alberta, forest tenure holders are expected to manage and harvest the
forest for commercial production; if they do not, their holdings are subject to being reallocation
by the Crown: “Alberta will cancel forestry tenure in areas outside protected areas where
forestry tenure holders have suspended timber harvesting solely to earn offset credits” (Alberta
Sustainable Resource Development 2010).
3.1.7 Delayed Forest Harvesting
Conversely, delayed harvesting is a sound carbon management strategy that is gaining
considerable support (Brown et al, op cit; Meng et al, 2003; Li et al, 2006; Hines et al, 2009;
Ryan et al, op cit; and (locally) Price et al, 1997), and that is likely to win regulatory acceptance.
Mechanism and Methodology for Mitigation

37
Effectively, delayed harvesting is analogous to improved forest management; harvest levels are
reduced by lengthening the rotation age. This has the effect of retaining carbon storage in older
trees, resulting in less erosion of carbon stocks when managing old forests. Li et al, op cit found
delayed harvesting a viable strategy for maintaining forest carbon stocks – which, as they point
out, is a critical consideration in IPCC-based forest carbon quantification. Price et al op cit found
that extended rotation age in combination with effective forest protection resulted in
substantial increases in carbon stocks, compared to natural disturbance dynamics or harvesting
to emulate natural disturbance (“business as usual”).
Delayed harvest has a number of appealing attributes:
It is primarily passive in nature, that is, benefit accrues to doing less and thus there is
less need to quantify a balance between carbon gain and carbon expenditures necessary
to achieve the outcome;
“Carbon benefits” accrue immediately similar to direct reduction of emissions as one is
protecting carbon stocks rather than increasing carbon scavenging from the
atmosphere;
Delayed harvesting is likely to increase species and structural diversity of forests, albeit
at the cost of potential leakage (Ryan et al, op cit).
Forest management planning has an impressive array of inventory and accounting tools
that would render quantification and verification of delayed harvest relatively
straightforward.
As with afforestation, delayed harvest has a substantial suite of environmental co-
benefits associated with it; including increased biodiversity, maintenance of habitat for
old growth dependent species, and public perception of conservation.
A case study approach was used to illustrate the potential of delayed forest harvesting as tool
for GHG mitigation. It illustrates the effect of delaying harvest 10, 20 or 30 years across an area
representing approximately 10% of Alberta’s forest landbase (Table 11). The table is drawn
from a detailed forest management plan but does not represent a revision of the timber supply
analysis. Thus it should be considered as an indication of the potential of delayed harvest rather
than a quantitative analysis.

38
Table 11. Effect of delaying harvest on carbon dioxide capture and storage by forests.
Deciduous - 80 year rotation, Conifer - 110 year rotation
AAC with Δ Rotation (yrs)
AAC Reduction (m3) with Δ
Rotation (yrs)
Current
AAC 10 20 30 10 20 30
Deciduous 2500000 2187500
164062
5
102539
1 312500 859375
147460
9
Coniferous 1500000 1363636
111570
2 811420 136364 384298 688580
Annual CO2 (Mt)
Deciduous 0.210 0.580 1.000
Coniferous 0.100 0.290 0.510
Total 0.310 0.870 1.510
Assumptions:
Based on 21000 km2
(10% of productive provincial forest land base.)
Deciduous density = 0.367
Coniferous density = 0.410
Carbon content in wood = 0.500
Canada has total productive forest area7 of 3,973,000 km2; thus the case study represents approximately 05% of the total productive forestland base. It is not possible to readily scale the case study to a national scale at a level of resolution similar to the case study. However, delayed softwood harvest can be scaled at a generic level. (Hardwood harvest is less easy to quantify, as there are substantial differences in managing aspen and other hardwood species.)
7 http://foretscanada.rncan.gc.ca/statsprofile/keyfacts/ca
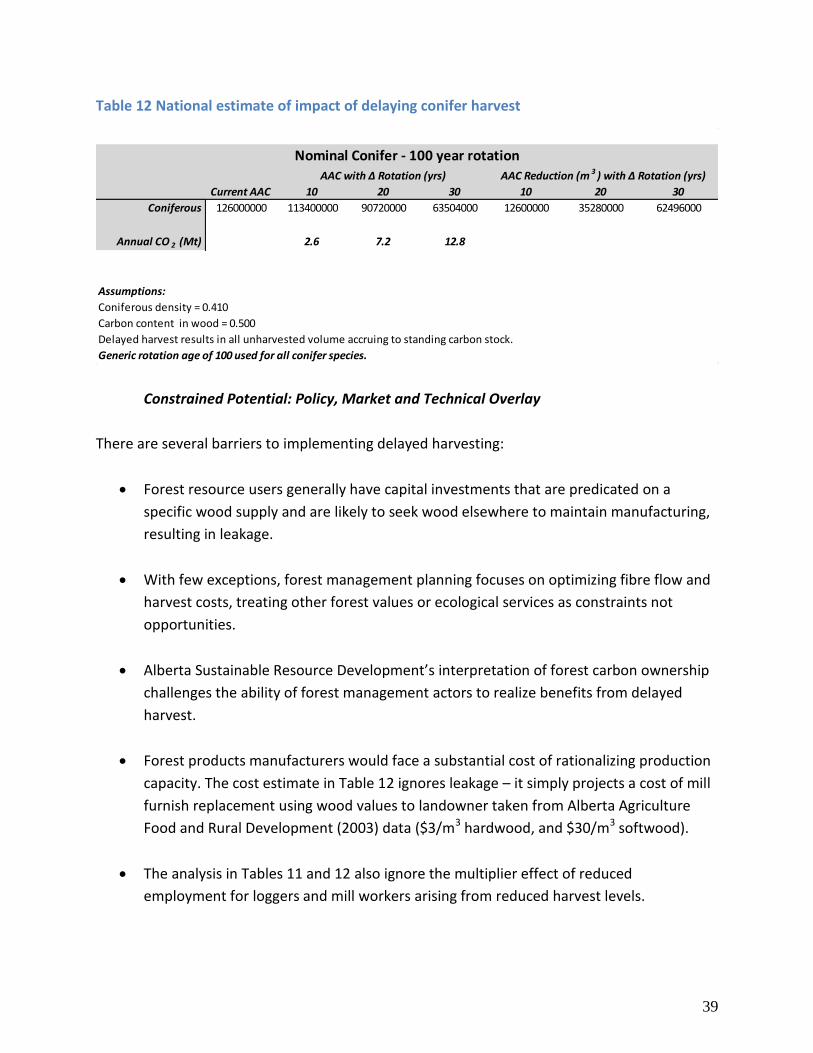
39
Table 12 National estimate of impact of delaying conifer harvest
Current AAC 10 20 30 10 20 30
Coniferous 126000000 113400000 90720000 63504000 12600000 35280000 62496000
Annual CO 2 (Mt) 2.6 7.2 12.8
Assumptions:
Coniferous density = 0.410
Carbon content in wood = 0.500
Delayed harvest results in all unharvested volume accruing to standing carbon stock.
Generic rotation age of 100 used for all conifer species.
Nominal Conifer - 100 year rotation
AAC with Δ Rotation (yrs) AAC Reduction (m 3 ) with Δ Rotation (yrs)
Constrained Potential: Policy, Market and Technical Overlay
There are several barriers to implementing delayed harvesting:
Forest resource users generally have capital investments that are predicated on a
specific wood supply and are likely to seek wood elsewhere to maintain manufacturing,
resulting in leakage.
With few exceptions, forest management planning focuses on optimizing fibre flow and
harvest costs, treating other forest values or ecological services as constraints not
opportunities.
Alberta Sustainable Resource Development’s interpretation of forest carbon ownership
challenges the ability of forest management actors to realize benefits from delayed
harvest.
Forest products manufacturers would face a substantial cost of rationalizing production
capacity. The cost estimate in Table 12 ignores leakage – it simply projects a cost of mill
furnish replacement using wood values to landowner taken from Alberta Agriculture
Food and Rural Development (2003) data ($3/m3 hardwood, and $30/m3 softwood).
The analysis in Tables 11 and 12 also ignore the multiplier effect of reduced
employment for loggers and mill workers arising from reduced harvest levels.
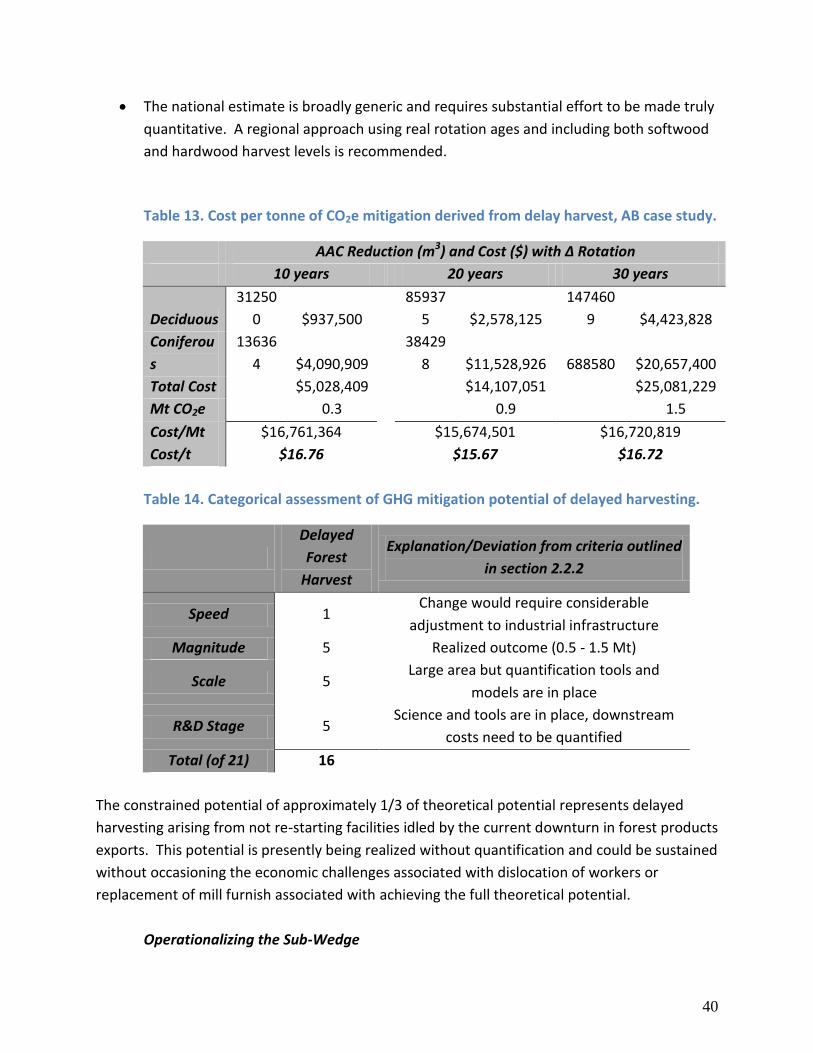
40
The national estimate is broadly generic and requires substantial effort to be made truly
quantitative. A regional approach using real rotation ages and including both softwood
and hardwood harvest levels is recommended.
Table 13. Cost per tonne of CO2e mitigation derived from delay harvest, AB case study.
AAC Reduction (m3) and Cost ($) with Δ Rotation
10 years 20 years 30 years
Deciduous
31250
0 $937,500
85937
5 $2,578,125
147460
9 $4,423,828
Coniferou
s
13636
4 $4,090,909
38429
8 $11,528,926 688580 $20,657,400
Total Cost $5,028,409 $14,107,051 $25,081,229
Mt CO2e 0.3 0.9 1.5
Cost/Mt $16,761,364 $15,674,501 $16,720,819
Cost/t $16.76 $15.67 $16.72
Table 14. Categorical assessment of GHG mitigation potential of delayed harvesting.
Delayed
Forest
Harvest
Explanation/Deviation from criteria outlined
in section 2.2.2
Speed 1 Change would require considerable
adjustment to industrial infrastructure
Magnitude 5 Realized outcome (0.5 - 1.5 Mt)
Scale 5 Large area but quantification tools and
models are in place
R&D Stage 5 Science and tools are in place, downstream
costs need to be quantified
Total (of 21) 16
The constrained potential of approximately 1/3 of theoretical potential represents delayed
harvesting arising from not re-starting facilities idled by the current downturn in forest products
exports. This potential is presently being realized without quantification and could be sustained
without occasioning the economic challenges associated with dislocation of workers or
replacement of mill furnish associated with achieving the full theoretical potential.
Operationalizing the Sub-Wedge
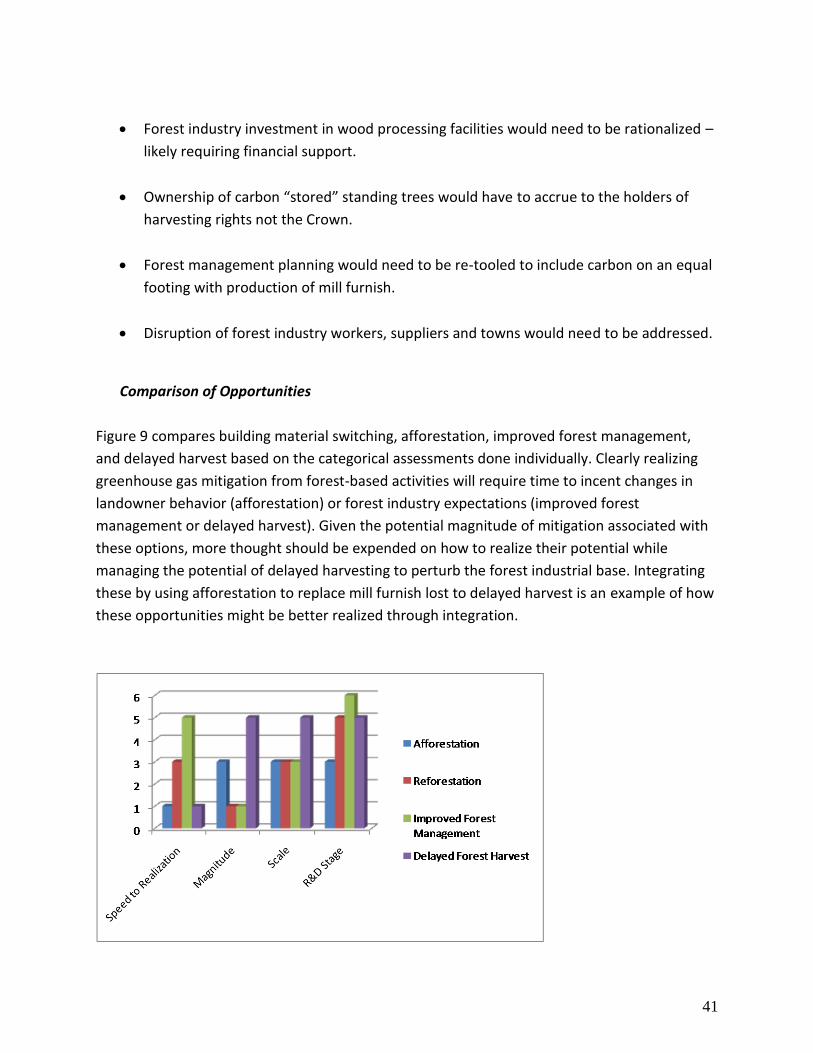
41
Forest industry investment in wood processing facilities would need to be rationalized –
likely requiring financial support.
Ownership of carbon “stored” standing trees would have to accrue to the holders of
harvesting rights not the Crown.
Forest management planning would need to be re-tooled to include carbon on an equal
footing with production of mill furnish.
Disruption of forest industry workers, suppliers and towns would need to be addressed.
Comparison of Opportunities
Figure 9 compares building material switching, afforestation, improved forest management,
and delayed harvest based on the categorical assessments done individually. Clearly realizing
greenhouse gas mitigation from forest-based activities will require time to incent changes in
landowner behavior (afforestation) or forest industry expectations (improved forest
management or delayed harvest). Given the potential magnitude of mitigation associated with
these options, more thought should be expended on how to realize their potential while
managing the potential of delayed harvesting to perturb the forest industrial base. Integrating
these by using afforestation to replace mill furnish lost to delayed harvest is an example of how
these opportunities might be better realized through integration.
42
Figure 9. Comparison of categorical evaluations of forest based GHG mitigation opportunities.
3.1.8 Agriculture Soil Carbon Sequestration
In 2008, the Agricultural sector in Canada was responsible for emissions of 62 Mt of CO2e (8.4%
of Canada’s anthropogenic emissions). Of this, 32 Mt of CO2e were emitted from agricultural
soils across Canada, with 17 Mt from direct emission sources, 3.8 Mt from pasture, range and
paddocks, and 10 Mt from indirect sources. Cropland covers approximately 48 million hectares
of the Canadian agricultural region. Cultivated agricultural land in Canada includes areas of field
crops, summerfallow, hayland and tame or seeded pasture. About 83% of Canada’s cropland is
in the interior plains of western Canada, made up of the Semiarid and Subhumid Prairies and
the Boreal Plains zones. There are roughly 2 dozen crops grown across Canada on over 100,000
farms. Crops like corn, wheat, barley and canola require more fertilizers to sustain their
production.
From a management perspective, 13 Mt were emitted from soils due to synthetic N fertilizer
application, 9.1 Mt from crop residue decomposition (related to yields) and 0.17 Mt from a
variety of other cropping management practices (summerfallow, conservation tillage, Irrigation
and cultivation of organic soils) (Environment Canada 2010). These emissions were partly offset
by the mitigating effects of increased soil carbon sequestration. In 1990, the management of
mineral soils amounted to a net CO2 removal of about 2 Mt. This net sink steadily increased to
about 12 Mt in 2008, through changes in management over time.
As stated in Lindwall and Sontaag (2010), the adoption trends of conservation tillage and other
closely associated practices show:
The rate of no-till seeding has increased from < 15% in all eco-zones in 1991, to 61% in the
brown and dark brown soil zones of the prairies, about 45% for black soils, 40% for gray
soils, and 26% in the mixed wood plains (southern Ontario /Quebec) as of 2006;
Similarly, the use of chemical fallow has increased from <5% to 13, 24, 41, and 52% in the
gray, black, dark brown, and brown soil zones, respectively, over the same time period.
The practice of reduced till, which is a transition between conventional tillage and no-till,
has remained fairly constant around 30% since 1991.

43
The amount of organic carbon sequestered in the mineral soils of Canada is a function of yield
(residue inputs) and decomposition rate of soil organic carbon (SOC). Cultivation and different
management practices can lead to either an increase or decrease in the rate of decomposition
and hence, organic carbon stocks in soils. This change in SOC results in either a CO2 emission or
removal in the atmosphere. Reducing fallow and switching to more continuous cropping
results in lower decomposition rates and increased residue inputs. Minimizing tillage to the
point where the seed is placed directly into the ground, preferably with concomitant fertilizer
placement beside the seedbed, decreases the rate of soil decomposition compared to higher
soil disturbance practices. Finally, perennial cropping is one of the best means of enhancing
GHG removals from the atmosphere and increasing soil carbon storage. This is due to the
longer growing season; deeper and more fibrous rooting systems that increase each year;
reduced soil disturbance; and higher plant biomass inputs per unit area of soil.
Mechanism and Methodology for Mitigation
The primary strategies with high confidence for sequestering more carbon in Canada’s soils
through altered management are:
Increasing the adoption of no-till and reduced till across Canadian farming regions
Converting more acres of summer and chem-fallowed land to continuous cropping
Converting more acres of marginal crop land to land under perennial forage.
Some studies have identified diversifying crop rotations as a means to increase soil carbon
sequestration. This is not included in this study since the science remains incomplete in this
area. Further, the measuring, monitoring and verification requirements are difficult to
implement given that choices of crops depend on annual decisions by growers, as influenced by
market, anticipated seasonal conditions, and other management and economic factors.
The quantification approaches used in the calculations in this sub-wedge are based on the
Alberta GHG quantification protocols for tillage system management, draft summerfallow
management and proposed conversion to perennial forage (Climate Change Central 2009). GHG
emissions are calculated using IPCC best practice guidance (IPCC 2006) and Canadian-based Tier
2 emission factors as set out in the National Emissions Inventory methodology (IPCC 2000, IPCC
2006)). In addition, analysis undertaken by Agriculture and Agri-food Canada’s Strategic Policy
Branch is also included in the quantification estimates (Gill and MacGregor 2010).
These protocols have been developed through a comprehensive scientific and technical review,
including both the federal and provincial governments, Canada’s leading academic experts in
soils, cropping and agronomic science as well as scientists from abroad (United States and
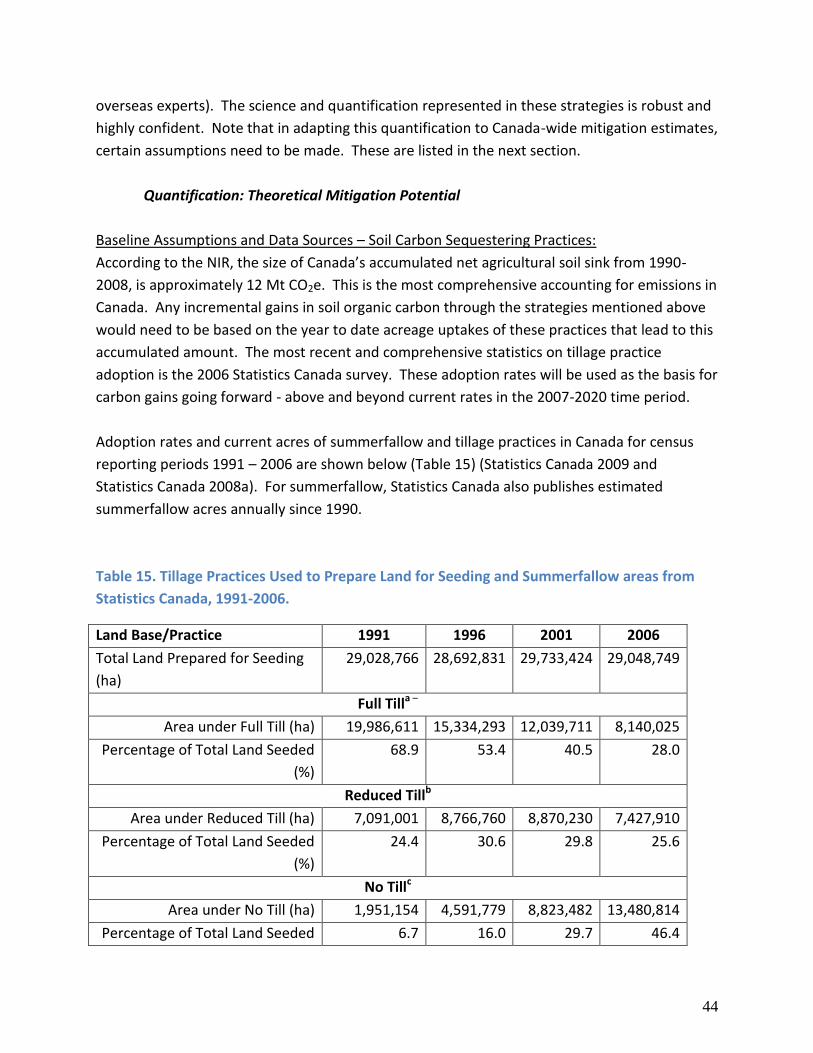
44
overseas experts). The science and quantification represented in these strategies is robust and
highly confident. Note that in adapting this quantification to Canada-wide mitigation estimates,
certain assumptions need to be made. These are listed in the next section.
Quantification: Theoretical Mitigation Potential
Baseline Assumptions and Data Sources – Soil Carbon Sequestering Practices:
According to the NIR, the size of Canada’s accumulated net agricultural soil sink from 1990-
2008, is approximately 12 Mt CO2e. This is the most comprehensive accounting for emissions in
Canada. Any incremental gains in soil organic carbon through the strategies mentioned above
would need to be based on the year to date acreage uptakes of these practices that lead to this
accumulated amount. The most recent and comprehensive statistics on tillage practice
adoption is the 2006 Statistics Canada survey. These adoption rates will be used as the basis for
carbon gains going forward - above and beyond current rates in the 2007-2020 time period.
Adoption rates and current acres of summerfallow and tillage practices in Canada for census
reporting periods 1991 – 2006 are shown below (Table 15) (Statistics Canada 2009 and
Statistics Canada 2008a). For summerfallow, Statistics Canada also publishes estimated
summerfallow acres annually since 1990.
Table 15. Tillage Practices Used to Prepare Land for Seeding and Summerfallow areas from
Statistics Canada, 1991-2006.
Land Base/Practice 1991 1996 2001 2006
Total Land Prepared for Seeding
(ha)
29,028,766 28,692,831 29,733,424 29,048,749
Full Tilla –
Area under Full Till (ha) 19,986,611 15,334,293 12,039,711 8,140,025
Percentage of Total Land Seeded
(%)
68.9 53.4 40.5 28.0
Reduced Tillb
Area under Reduced Till (ha) 7,091,001 8,766,760 8,870,230 7,427,910
Percentage of Total Land Seeded
(%)
24.4 30.6 29.8 25.6
No Tillc
Area under No Till (ha) 1,951,154 4,591,779 8,823,482 13,480,814
Percentage of Total Land Seeded 6.7 16.0 29.7 46.4
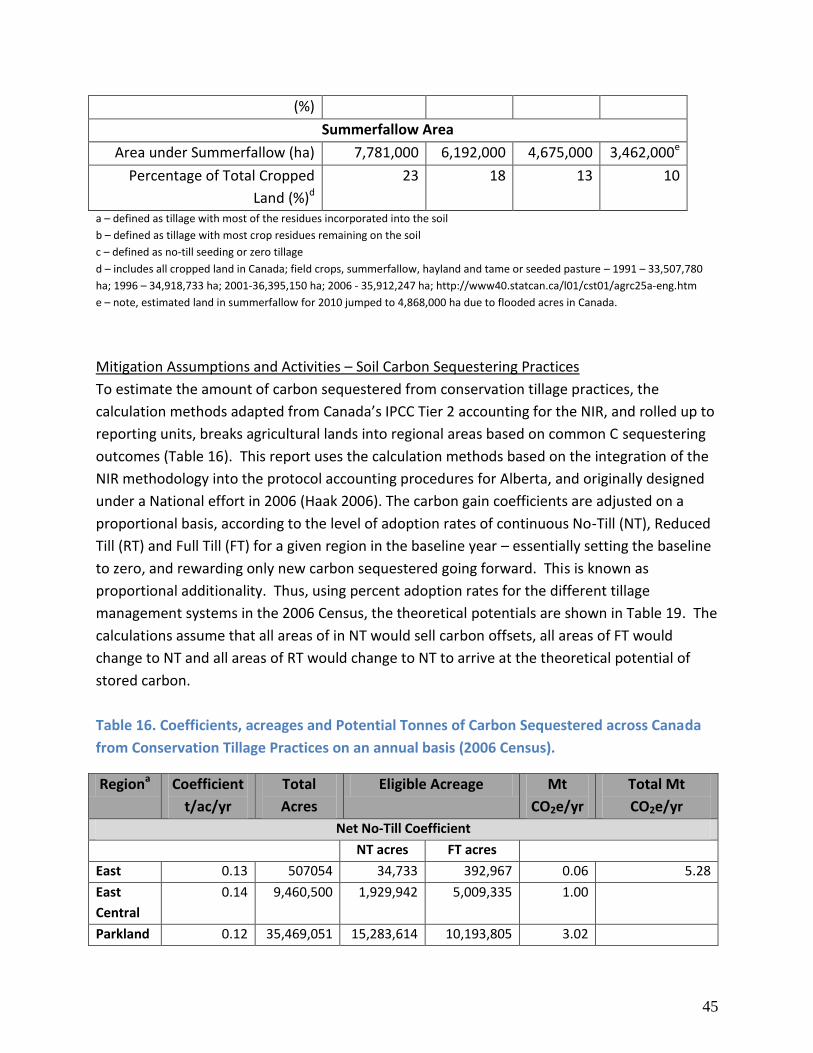
45
(%)
Summerfallow Area
Area under Summerfallow (ha) 7,781,000 6,192,000 4,675,000 3,462,000e
Percentage of Total Cropped
Land (%)d
23 18 13 10
a – defined as tillage with most of the residues incorporated into the soil
b – defined as tillage with most crop residues remaining on the soil
c – defined as no-till seeding or zero tillage
d – includes all cropped land in Canada; field crops, summerfallow, hayland and tame or seeded pasture – 1991 – 33,507,780
ha; 1996 – 34,918,733 ha; 2001-36,395,150 ha; 2006 - 35,912,247 ha; http://www40.statcan.ca/l01/cst01/agrc25a-eng.htm
e – note, estimated land in summerfallow for 2010 jumped to 4,868,000 ha due to flooded acres in Canada.
Mitigation Assumptions and Activities – Soil Carbon Sequestering Practices
To estimate the amount of carbon sequestered from conservation tillage practices, the
calculation methods adapted from Canada’s IPCC Tier 2 accounting for the NIR, and rolled up to
reporting units, breaks agricultural lands into regional areas based on common C sequestering
outcomes (Table 16). This report uses the calculation methods based on the integration of the
NIR methodology into the protocol accounting procedures for Alberta, and originally designed
under a National effort in 2006 (Haak 2006). The carbon gain coefficients are adjusted on a
proportional basis, according to the level of adoption rates of continuous No-Till (NT), Reduced
Till (RT) and Full Till (FT) for a given region in the baseline year – essentially setting the baseline
to zero, and rewarding only new carbon sequestered going forward. This is known as
proportional additionality. Thus, using percent adoption rates for the different tillage
management systems in the 2006 Census, the theoretical potentials are shown in Table 19. The
calculations assume that all areas of in NT would sell carbon offsets, all areas of FT would
change to NT and all areas of RT would change to NT to arrive at the theoretical potential of
stored carbon.
Table 16. Coefficients, acreages and Potential Tonnes of Carbon Sequestered across Canada
from Conservation Tillage Practices on an annual basis (2006 Census).
Regiona Coefficient
t/ac/yr
Total
Acres
Eligible Acreage Mt
CO2e/yr
Total Mt
CO2e/yr
Net No-Till Coefficient
NT acres FT acres
East 0.13 507054 34,733 392,967 0.06 5.28
East
Central
0.14 9,460,500 1,929,942 5,009,335 1.00
Parkland 0.12 35,469,051 15,283,614 10,193,805 3.02
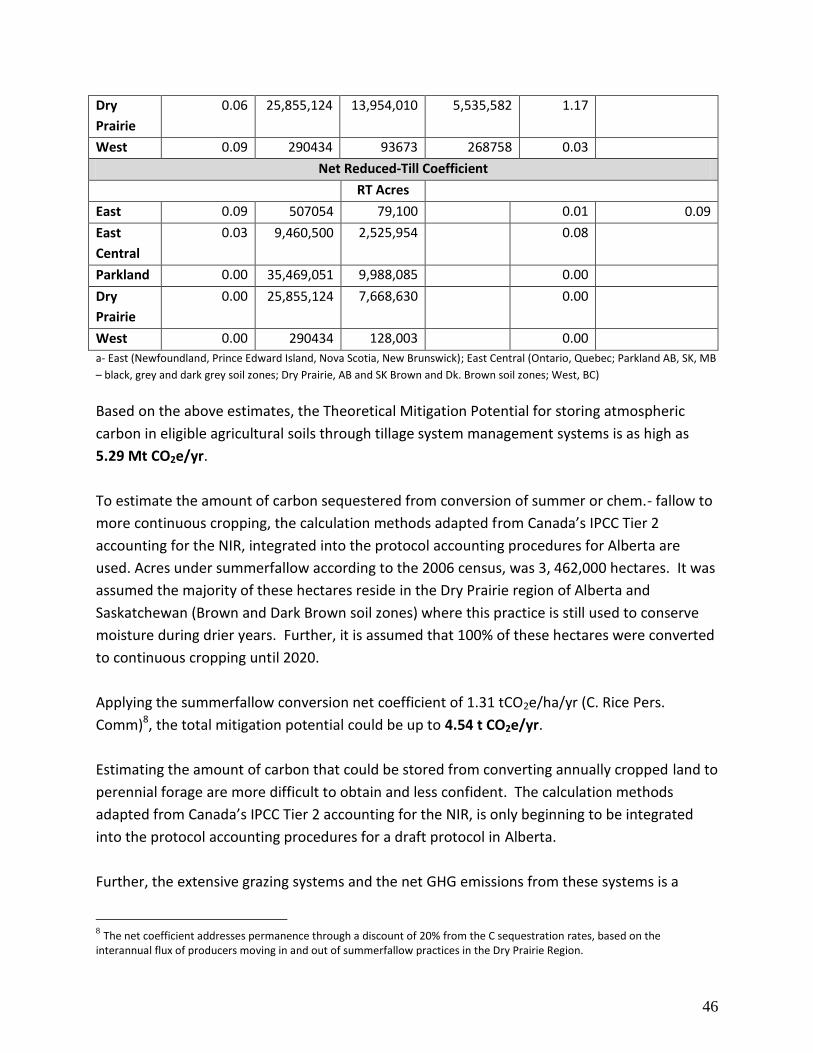
46
Dry
Prairie
0.06 25,855,124 13,954,010 5,535,582 1.17
West 0.09 290434 93673 268758 0.03
Net Reduced-Till Coefficient
RT Acres
East 0.09 507054 79,100 0.01 0.09
East
Central
0.03 9,460,500 2,525,954 0.08
Parkland 0.00 35,469,051 9,988,085 0.00
Dry
Prairie
0.00 25,855,124 7,668,630 0.00
West 0.00 290434 128,003 0.00
a- East (Newfoundland, Prince Edward Island, Nova Scotia, New Brunswick); East Central (Ontario, Quebec; Parkland AB, SK, MB
– black, grey and dark grey soil zones; Dry Prairie, AB and SK Brown and Dk. Brown soil zones; West, BC)
Based on the above estimates, the Theoretical Mitigation Potential for storing atmospheric
carbon in eligible agricultural soils through tillage system management systems is as high as
5.29 Mt CO2e/yr.
To estimate the amount of carbon sequestered from conversion of summer or chem.- fallow to
more continuous cropping, the calculation methods adapted from Canada’s IPCC Tier 2
accounting for the NIR, integrated into the protocol accounting procedures for Alberta are
used. Acres under summerfallow according to the 2006 census, was 3, 462,000 hectares. It was
assumed the majority of these hectares reside in the Dry Prairie region of Alberta and
Saskatchewan (Brown and Dark Brown soil zones) where this practice is still used to conserve
moisture during drier years. Further, it is assumed that 100% of these hectares were converted
to continuous cropping until 2020.
Applying the summerfallow conversion net coefficient of 1.31 tCO2e/ha/yr (C. Rice Pers.
Comm)8, the total mitigation potential could be up to 4.54 t CO2e/yr.
Estimating the amount of carbon that could be stored from converting annually cropped land to
perennial forage are more difficult to obtain and less confident. The calculation methods
adapted from Canada’s IPCC Tier 2 accounting for the NIR, is only beginning to be integrated
into the protocol accounting procedures for a draft protocol in Alberta.
Further, the extensive grazing systems and the net GHG emissions from these systems is a
8 The net coefficient addresses permanence through a discount of 20% from the C sequestration rates, based on the
interannual flux of producers moving in and out of summerfallow practices in the Dry Prairie Region.

47
major focus for improving Canada’s inventory methodology at this time. Thus, the net
coefficients at this stage are estimated on average at 2.0 t CO2e/ha /yr – but this would apply to
lands where forage is being produced for hay, without grazing animals (the science is still
developing on the livestock-pasture GHG interface). The land must be secured under a 20 year
contract that will guarantee it remains in perennial cover for the credit duration period (in part
addressing permanence – but a discount and buffer reserve will also be applied based on
historical program dropout rates). Further, the lands that can be targeted are those lands being
annually cropped that are on Class 4, 5, 6 and 7. This narrows the applicability of the eligible
acres even further. Taking this into account, the maximum area where this activity could take
place is likely only 1 million hectares across Canada (less than 3% of the annual seeded acres
in20069. Applying the yet to be vetted net coefficient less a 10% discount for future reversals
post 20 year contract expiration, is approximately 1.8 Mt CO2e annually.
Taken collectively, the theoretical potential of carbon storage from soil sequestering practices
can be up to 11.62 Mt CO2e/yr out to 2020. However, the reality of achieving these numbers
will be discussed in the next section.
Constrained Potential: Market, Policy and Technical Overlay
Obviously the maximum theoretical potential estimated above is reflective of what could be
achievable with widespread adoption of the practices. However, in reality there are numerous
constraints to achieving these potentials. Despite the rapid adoption rate of conservation
tillage, Lindwall and Sontaag (2010) point out that a number of constraints to adoption in some
regions and specific cropping systems are still present – these are related to social barriers, cost
and risk in areas with higher moisture conditions, specific soil constraints, and interactions with
other practices such as the need to incorporate manure on a regular basis, or specialty crops
that need higher disturbance preparation of the seed bed (i.e. potatoes, beans, etc). In a recent
analysis prepared by Agriculture and Agri-Food Canada’s Strategic Policy Branch, feasible
adoption rates of no till on remaining full till acres were decided by a group of experts, given
the current constraints to adoption (Table 17). Adjusting the total numbers calculated above
for conservation tillage (theoretical of 5.29 Mt CO2e/yr) by these constraints, gives a more
realistic range of 2.5 to 3.3 Mt CO2e/yr.
Table 17. Feasible adoption rates of No-Till on remaining eligible acres in Canada.
9 Based on extrapolation of estimates in Alberta to the rest of Canada.

48
Scenario AL SA MB ON QU
Baseline (2006) 48% 60% 22% 32% 10%
Low Adoption 50% 65% 25% 35% 12%
Medium
Adoption
60% 70% 30% 40% 18%
High Adoption 65% 75% 40% 45% 30%
Reductions in the area of fallowed land have occurred over the years because of the economic
need to keep arable land productive, along with diversified and extended crop rotations,
improved seeding and tilling methods which conserve moisture and proper use of herbicides.
However, it’s unrealistic to assume that 100% of this cultural practice will disappear on the
prairies, particularly with increasing droughts during growing seasons looming on the horizon.
The use of summer or chem fallowing stubbornly fluctuates between 10 to 20% of the acreage,
based on the cyclic nature of drier and moister cycles that seem to oscillate every 4 to 5 years.
Again, AAFC’s study estimated, based on expert judgment, that summerfallow would decline
out to 2017 by 17% (low adoption), 35% (medium adoption) and up to 54% (high adoption) due
to changing technologies on farm. This more realistic assessment adjusts the theoretical
potential of up to 4.54 tCO2e/yr to ranges of between 0.77 and 2.45 Mt of CO2e for the Dry
Prairie region of Canada.
Conversion to Perennial cover has a number of economic and technical constraints in play. Due
to a lack of complete scientific information on extensive grazing systems resulting in increased
GHG accounting complexity of methane emissions from the rumen dependent on varying
forage quality, and nitrous oxide (N2O) emissions from dung and urine patches in pastures,
animals are excluded in the eligibility of this type of land use conversion. Thus, eligible
conversions are those that convert land use from annual cropland to perennial crops for the
purposes of producing forage, hay or forage seed crops for sale or other uses. As a result,
estimated adoption rates for this land use change is not large since only a few farmers and
ranchers would be willing to commit to converting land to perennial crop uses where grazing is
not permitted. Further, having to sign a 20-year agreement for the land to remain in permanent
cover represents another level of constraint on the potential.
Based on past permanent cover programs run by the federal government over the last 20 to 25
years, only 20% of the program uptake dedicates acres to hay production – the rest of the

49
acreage is grazed. Therefore, a more realistic potential for this land use conversion changes
from the theoretical 1.81 to 0.36 Mt CO2e/yr.
Taking these more realistic numbers into account, the constrained potential for agricultural soil
carbon sequestration is likely in the range of 3.6 to 6.1 Mt CO2e/yr.
The measuring, monitoring and verification (MMV) procedures for these kinds of mitigation
activities are clearly laid out in the Alberta protocols. The data gathering to support mitigation
that is real, measurable and verifiable for these kinds of activities for the No-Till potential is
more streamlined and scalable, and has been demonstrated with over 4 Mt of no-till offsets
serialized to date in Alberta. However, the MMV for summerfallow, perennial forages and
NERP require establishment of project-level baselines, which are an average of data over 3
years and requires more evidence and justification to the verifier. It can be done but will
require significantly more data gathering, and justification to have viable reductions.
Table 18. Categorical assessment of GHG mitigation potential of soil carbon sequestration
practices.
No- Till Reduced
Summerfallow
Perennial
Cover
Explanation/Deviation
from criteria outlined
in section 2.2.2
Speed 5 3 3 Easily adopted
Magnitude 5 5 3 Big on large scale
Scale 5 3 1 Many sources, small
tonnes
R&D Stage 6 6 6
Total (of 21) 21 17 13
Conservation tillage is closely linked with a number of other beneficial crop and soil
management practices such as diverse crop rotations, reduced fallow, and more effective
weed, nutrient, moisture and crop residue management. A number of specific economic
benefits for growers associated with conservation tillage include reduced labor, reduced energy
consumption, improved crop yields, improved soil productivity, and higher fertilizer efficiency –
but these depend on the region and the cropping system. Environmental benefits associated
with conservation tillage include reduced soil erosion; reduced GHG emissions through
increased soil organic matter, and in some cases increased biodiversity and improved water
50
quality.
Challenges still remain – Canadian soils still have a large capacity for storing atmospheric
carbon on a go forward basis as a result of carbon sequestering management practices.
Saturation of soil sinks occurs slowly and over long periods of time (20 to 25 years), and
emerging research shows that sequestered carbon can move down the soil profile to be stored
in the layers below the A horizon (Chuck Rice, Kansas State University, personal
communication10), perhaps increasing carbon storage beyond previously modeled soil organic
carbon saturation curves. Further investigations into the science for carbon storage potential
and enhanced nitrous oxide reduction potentials can result in increased mitigation potentials
from this sector.
Operationalizing the Sub-Wedge
Extend carbon pricing policies at a national level so carbon offset markets can help fund
more sequestration activities
Invest research dollars into the livestock-pasture interface to measure the net GHG
impacts associated with extensive grazing systems
Develop further carbon sequestration mitigation options through applied research
Invest in developing independent, publicly housed land use monitoring and verification
GIS and remote sensing systems to reduce transaction costs of GHG projects
3.1.9 Wetlands Sequestration
The Canadian Prairie Pothole region covers 54 185 611 ha across Manitoba, Saskatchewan and
Alberta; of which 5.8% or 3 120 260 ha are wetlands. This wetland area is assumed to
represent half of the original wetlands that extend across the Prairie Pothole region (Badiou
pers. comm.). The original wetland extent consisted of 6 240 520 ha, with an estimated loss of
up to 70% (NRTEE 2002). Wetland drainage often is a result of agricultural conversion of land
(Watmough et al. 2002). Calculations made by Badiou (pers. comm.), and Badiou et al.
(submitted) indicate that wetland drainage leads to carbon dioxide emission rates of
326 t CO2e /ha of wetland drained per year. The restoration of wetlands increases primary
plant productivity and CH4 emissions while decreasing overall decomposition rates, and N2O
emissions, resulting in a net CO2 sequestration rate of 3.25 t CO2e /ha/yr (Badiou et al,
submitted).
10
Dr. Charles Rice, Kansas State University.
51
Wetland loss through drainage and agricultural conversion has been experienced in the United
States, which has had larger magnitudes of wetland loss to be reported to be at least 50% loss
since the 1700’s (Mitch and Gosselink 2000). Some areas in the United States have reported
losses of upwards of 80% of their wetlands. The global trend of wetland loss is a result of
human development. Organizations such as Ducks Unlimited, the Nature Conservancy Canada
and the Ramsar Convention on Wetlands have developed best practices and agreements aimed
at conserving wetlands through ‘wise use’, sustainable practices and, in some cases, restoration
and reclamation. Drained wetlands have been noted as sources of greenhouse gases in
numerous countries such as, Estonia (Kimmel et al. 2010), and the United States and Canada as
noted by Mitch and Gosselink (2000). Wetland restoration has also been noted to be a source
of soil carbon sequestration under flooded conditions in areas such as the mangrove wetlands
(Matsui et al. 2010), deltaic marshes (Miller and Fujii 2010), and papyrus wetlands (Saunders et
al. 2007). Freshwater mineral soil wetlands have consistently demonstrated the properties of
carbon sinks (Gleason et al. 2005, Beard-Haughn et al. (2006), Euliss et al. (2006), and as such
may act as a potential source of greenhouse gas mitigation.
Mechanisms and Methodology for Mitigation
Freshwater mineral soil wetlands have consistently been assessed as carbon sinks, there are
approximately 20 million ponds in North America, (Euliss et al. (2006)) of which the Prairie
Pothole wetlands have not been identified for their GHG sequestration potential. Recent
studies have begun to quantify fluctuations in greenhouse gases from these wetland systems
Pennock et al. (2010), and the draft Alberta Offset System protocol includes CO2, N2O and CH4
in its emission sequestration assessment, based off this literature (Alberta Environment 2010b).
Following the scientific literature and an intensive study of gas fluctuation within Prairie
Pothole wetlands, the Prairie Pothole region of Alberta was determined to have a net
sequestration rate of 3.25 t CO2e/ha/yr (Badiou et al. submitted), and it is this value with which
emission sequestration is to be calculated.
The Alberta Offset System draft quantification protocol for wetlands restoration (Alberta
Environment 2010b, Climate Check and Ducks Unlimited 2010) indicates that emissions
mitigation measures will be achieved through the restoration and re-creation of wetlands
within the Prairie Pothole region of Alberta. The protocol is not designed with the intention of
reducing emissions within a process, but instead creating an opportunity for carbon
sequestration through the restoration of wetlands. The accounting process stipulates that
Prairie Pothole wetlands reconstruction is restricted to the restoration of closed basin,
internally drained wetlands, and thus is geographically and ecologically restricted in its
applicability.
52
Wetland restoration to re-establish GHG mitigation potential will occur through the
construction of ‘earth plugs’ or dams, and ongoing basin, margin and associated upland
delineation, monitoring and management will be used to ensure that no burning, cultivation or
clearing occurs along the margins of the wetland, affecting nutrient cycles. Wetland restoration
in this form is considered a land use change with a net carbon sequestration gain. Wetland
restoration projects will achieve changed and sustained land use change through integration
with various actions and requirements that have been established by the policies under the
Alberta Water Act (similar policies may exist in other provinces).
Quantification: Theoretical Mitigation Potential
Baseline Assumptions and Data Sources – Wetlands Restoration:
The baseline assumption follows the current status of wetlands within the Prairie Pothole
region of Alberta. Carbon sequestration will be gained through the practice of restoring
wetlands that do not currently exist due to prior drainage. Wetland restoration will follow
historical imagery of peak hydrological periods and archival aerial photography records for
interpreting wetland features and presence on the landscape. As this protocol has been
created to restore degraded and drained wetlands, the procedures assume a zero-value as
baseline and quantify carbon sequestration with each wetland that is restored.
Mitigation Assumptions and Activities – Restoring Wetlands
The restoration of wetlands in the prairie pothole region, particularly in Alberta, has primarily
been the responsibility of Ducks Unlimited, with some involvement from Nature Conservancy
Canada and other habitat and conservation groups. Wetlands converted from agricultural lands
back to wetlands through this process will be credited as part of a 30 year conservation,
restoration or set-aside agreement and/or through a permanent conservation easement.
These sorts of agreements ensure that adequate wetland conversion and development
activities are performed, and that appropriate post-conversion management practices are
conducted to ensure the maintenance of these restored wetlands. Such management activities
will restrict the cultivation, clearing and burning of adjacent associated uplands and wetland
margins to ensure proper nutrient cycling within the wetlands.
Restoration of drained freshwater mineral wetlands in the Prairie Pothole region addresses
management changes to the wetland margin and basin areas of closed basins forming internally
drained areas that under normal conditions, were isolated from natural external drainage
systems. Wetland restoration will include addressing management of the margin and upland
areas to maintain consistent soil nutrient flux within the wetland basin. Within the wetland
53
itself, restoration will include the installation of an ‘earth plug’ designed to recreate the original
hydrological dynamics of the area, and encourage the natural water-collecting properties
through mitigation of anthropogenically-introduced drainage.
Within Alberta alone, there is great potential for offset crediting through this wetland
conversion protocol. Following the initial assumptions of Badiou (pers. comm.), half the
originally existing wetlands within the prairie pothole region have been drained or otherwise
converted into agricultural lands. With the implementation of this protocol, that half of total
original wetlands could conceivably be restored, resulting in a potential wetlands conversion of
up to 1 039 460 ha for the province of Alberta, and up to 3 120 260 ha across Manitoba,
Saskatchewan and Alberta. This wetland conversion potential provides the opportunity for
upwards of 10.14 Mt CO2e/yr of sequestration, using Badiou et al’s (submitted) net rate of 3.25
t/ha/yr of CO2e sequestration quoted in the draft wetland protocol.
Constrained Potential: Policy, Market and Technical Overlay
Given that wetlands continue to be drained or altered within the Prairie Pothole region, it
would be unrealistic to assume that 100% of the lost wetlands will be restored. The PHJV
(Prairie Habitat Joint Venture) has been conducting a wetland restoration and preservation
program for the purpose of sustaining waterfowl populations. The PHJV has developed a
wetland restoration target that they are seeking to achieve through such efforts as those
described in this document. This more practical approach is seeking to prevent further wetland
loss to preserve habitat, and focus on small basin wetland reclamation and restore 300,000
hectares of wetlands in each province of Manitoba, Saskatchewan and Alberta by 2026 (PHJV
2008). This compared against the total number of lost or degraded wetlands in the Prairie
Provinces: 3 120 260 ha. A more realistic and achievable potential would take into account the
habitat acreage of the PHJV, and double that amount for those landowners who would
undertake projects for carbon. As a result, a more realistic carbon sequestration potential for
the wetland restoration efforts in the prairies would be 1.95 CO2e/yr.
Canadian Prairie Pothole wetlands are potential carbon sinks upon restoration. This has been
established as a result of a Benchmark study undertaken for the last 5 years in the Prairie
Pothole Region. This comprehensive Canadian study, is also part of the Great Plains CO2
Partnership initiative coordinated by the US-based National Energy Technology Lab (NETL,
Department of Energy). The results of this study have been used to develop a series of
procedures for measurement, monitoring and verification for the submitted Alberta Offset
System quantification protocol for wetland restoration. The assessments of nutrient
54
fluctuation that exists in agricultural systems and for other types of wetlands, have been
codified to meet the requirements of the Draft Alberta Wetland protocol.
Upon provisions of accreditation and land tenure, wetland restoration proposals must indicate
a former wetland class (pre-drainage or -degradation) ranging from 3: seasonal ponds and
lakes, to 4: semi-permanent ponds and lakes, to 5: permanent ponds and lakes, and develop
and implement a plan to restore both the wetland and the surrounding margin and upland
areas. Measurement, monitoring and verification of wetland restoration and the resulting GHG
sequestration must follow Alberta Offset System and appropriate reclamation monitoring
techniques (e.g. those of Ducks Unlimited). Within those terms, emission reduction
quantification must be assessed on a per-hectare-of-restored-wetland basis.
Where challenges lie for development of this type of sequestration activity are in the reversal of
stored carbon through changes in weather patterns. Wetlands across the Prairie Provinces are
historically known for climate-related fluctuations of water levels and resulting changes in
nutrient flux dynamics. Prairie Pothole region wetlands, particularly those that are ephemeral
in nature, as in classes 3 and 4 will respond to changes in climatic patterns, drying out in
periods of drought, or draining, to much-reduced water levels. These changes will undoubtedly
have similar results to those of the anthropogenic drainage of wetlands for cultivation,
producing net carbon sources due to the increased rate of decomposition that results when
aquatic organic matter deposits become exposed to the atmosphere through drying.
Further risks of reversal from changes in land tenures may exist in the nature and permanence
of land tenures under 30-year conservation/restoration set-asides. Depending on the
intentions of the Alberta Offset System, or other similar carbon market registries, 30 years may
not be an acceptably long period of time for carbon offset registration. The protocol will likely
have to include a buffer reserve of credits to cover off future liabilities. Alternatively, the risk of
reversals from land tenures can be alleviated through the use of longer-term, or more
permanent land tenure structures such as conservation easements, which provide a legal
framework for land management tenures, and may more effectively prevent land conversion of
reclaimed wetlands in the future.
The development of wetlands has many environmental co-benefits associated with the
alterations of land use patterns and hydrological regime. The re-introduction of wetlands to
the agricultural landscape provides an important source of habitat in an otherwise marginal
land-use type. Since there has been a steady decline in the capacity of agricultural landscapes
to support wildlife over the past 20 years (from 1990), largely due to the increase of intense
agricultural activity and the loss of natural and semi-natural land cover types, like wetlands
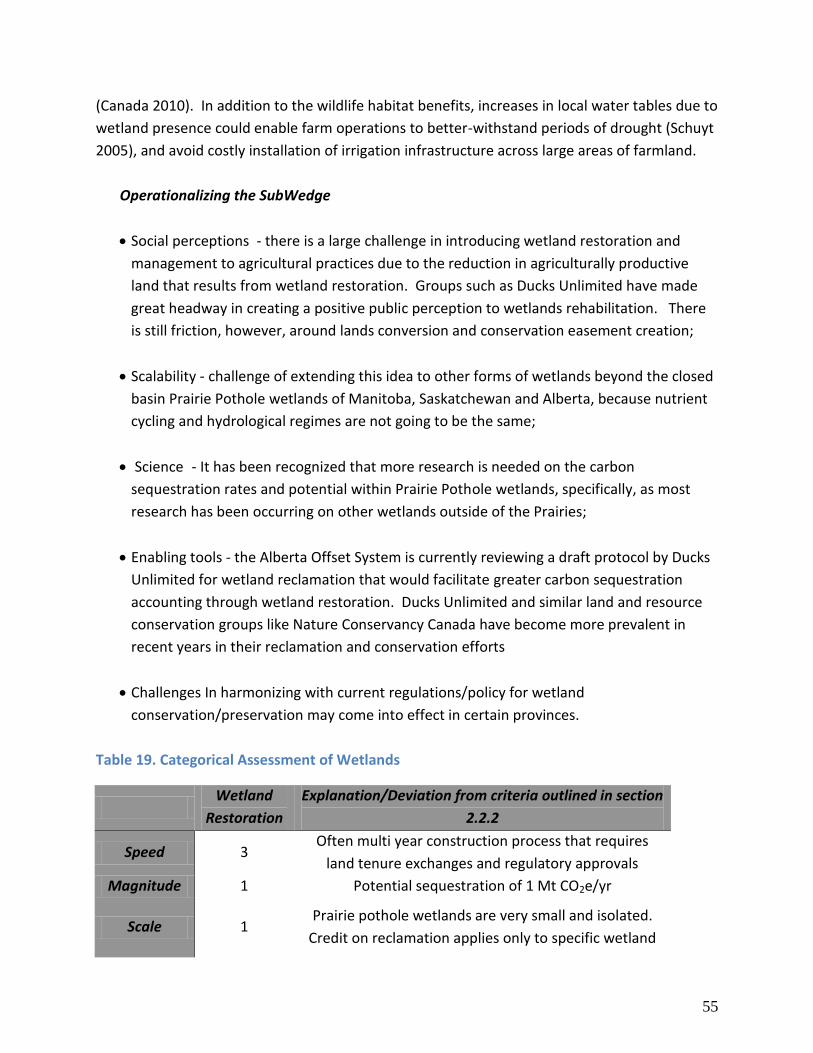
55
(Canada 2010). In addition to the wildlife habitat benefits, increases in local water tables due to
wetland presence could enable farm operations to better-withstand periods of drought (Schuyt
2005), and avoid costly installation of irrigation infrastructure across large areas of farmland.
Operationalizing the SubWedge
Social perceptions - there is a large challenge in introducing wetland restoration and
management to agricultural practices due to the reduction in agriculturally productive
land that results from wetland restoration. Groups such as Ducks Unlimited have made
great headway in creating a positive public perception to wetlands rehabilitation. There
is still friction, however, around lands conversion and conservation easement creation;
Scalability - challenge of extending this idea to other forms of wetlands beyond the closed
basin Prairie Pothole wetlands of Manitoba, Saskatchewan and Alberta, because nutrient
cycling and hydrological regimes are not going to be the same;
Science - It has been recognized that more research is needed on the carbon
sequestration rates and potential within Prairie Pothole wetlands, specifically, as most
research has been occurring on other wetlands outside of the Prairies;
Enabling tools - the Alberta Offset System is currently reviewing a draft protocol by Ducks
Unlimited for wetland reclamation that would facilitate greater carbon sequestration
accounting through wetland restoration. Ducks Unlimited and similar land and resource
conservation groups like Nature Conservancy Canada have become more prevalent in
recent years in their reclamation and conservation efforts
Challenges In harmonizing with current regulations/policy for wetland
conservation/preservation may come into effect in certain provinces.
Table 19. Categorical Assessment of Wetlands
Wetland
Restoration
Explanation/Deviation from criteria outlined in section
2.2.2
Speed 3 Often multi year construction process that requires
land tenure exchanges and regulatory approvals
Magnitude 1 Potential sequestration of 1 Mt CO2e/yr
Scale 1 Prairie pothole wetlands are very small and isolated.
Credit on reclamation applies only to specific wetland
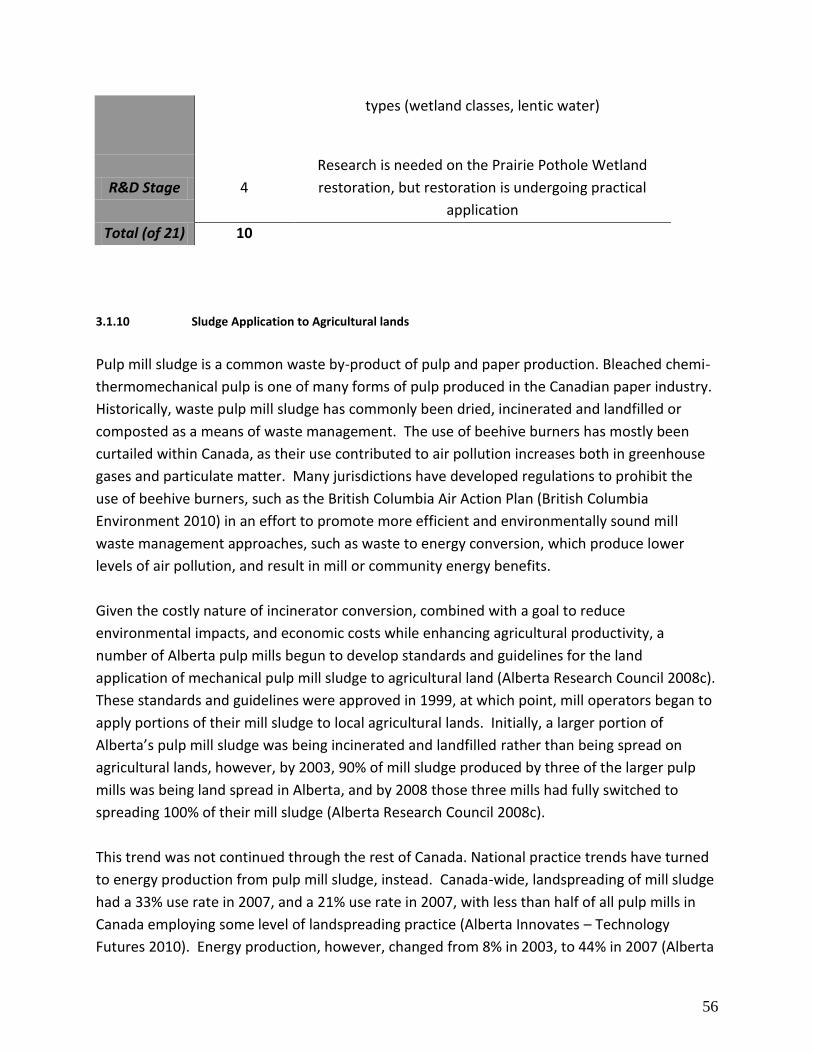
56
types (wetland classes, lentic water)
R&D Stage 4
Research is needed on the Prairie Pothole Wetland
restoration, but restoration is undergoing practical
application
Total (of 21) 10
3.1.10 Sludge Application to Agricultural lands
Pulp mill sludge is a common waste by-product of pulp and paper production. Bleached chemi-
thermomechanical pulp is one of many forms of pulp produced in the Canadian paper industry.
Historically, waste pulp mill sludge has commonly been dried, incinerated and landfilled or
composted as a means of waste management. The use of beehive burners has mostly been
curtailed within Canada, as their use contributed to air pollution increases both in greenhouse
gases and particulate matter. Many jurisdictions have developed regulations to prohibit the
use of beehive burners, such as the British Columbia Air Action Plan (British Columbia
Environment 2010) in an effort to promote more efficient and environmentally sound mill
waste management approaches, such as waste to energy conversion, which produce lower
levels of air pollution, and result in mill or community energy benefits.
Given the costly nature of incinerator conversion, combined with a goal to reduce
environmental impacts, and economic costs while enhancing agricultural productivity, a
number of Alberta pulp mills begun to develop standards and guidelines for the land
application of mechanical pulp mill sludge to agricultural land (Alberta Research Council 2008c).
These standards and guidelines were approved in 1999, at which point, mill operators began to
apply portions of their mill sludge to local agricultural lands. Initially, a larger portion of
Alberta’s pulp mill sludge was being incinerated and landfilled rather than being spread on
agricultural lands, however, by 2003, 90% of mill sludge produced by three of the larger pulp
mills was being land spread in Alberta, and by 2008 those three mills had fully switched to
spreading 100% of their mill sludge (Alberta Research Council 2008c).
This trend was not continued through the rest of Canada. National practice trends have turned
to energy production from pulp mill sludge, instead. Canada-wide, landspreading of mill sludge
had a 33% use rate in 2007, and a 21% use rate in 2007, with less than half of all pulp mills in
Canada employing some level of landspreading practice (Alberta Innovates – Technology
Futures 2010). Energy production, however, changed from 8% in 2003, to 44% in 2007 (Alberta

57
Research Council 2008c, AITF 2010). Landfilling, although still being used, had dropped from
29% in 2003 to 22% in 2007 (Alberta Research Council 2008c, AITF 2010). Landspreading is
often accompanied by extra costs, compared to alternative waste treatment practices like
biomass to energy or landfilling, due to the extra transportation and materials handling
required to achieve the end use. These costs may prove prohibitive to the average mill, as
compared to the comparatively inexpensive waste management alternatives like biomass to
energy, incineration and landfilling.
Landspreading of mechanical pulp sludge is a more environmentally responsible alternative to
sludge incineration and landfilling. The application of mill sludge provides soil benefits through
added nutrients and organic matter, as well as improving soil structure and water holding
capacity, increasing the initial below ground soil carbon reservoir, which thus increases the
above ground carbon reservoirs in crop growth (Technical Protocol Plan).
Worldwide, pulp mill sludge has been used and assessed for its fertilizer effects, and the cross-
benefit of waste management. A study in Chile indicated that pulp mill sludge from wastewater
treatment may have potential to act as a beneficial soil amendment for improving the biological
properties of volcanic soils (Gallardo et al. 2010). Studies in the USA have assessed the
influence of sludge application on tree plantations (e.g. Goodwin and Burrows 2006),
identifying positive effects on height growth, however also recognizing the prohibitive costs of
pulp sludge transportation and application. A greenhouse study in Iran (Torkashvand et al.
2010) further indicated the fertilizer and plant growth-enhancement effects of mill sludge on
acidic soils, noting improved shoot growth and nutrient uptake with sludge application.
Mechanisms and Methodology for Mitigation
Mill sludge application, as proposed by the Alberta Research Council (2008a) in the draft
quantification protocol submitted to the Alberta Offset System, seeks to decrease GHG
emissions through creating an alternative end-use for pulp mill sludge. Instead of being
incinerated or placed in a landfill, the application of pulp sludge to agricultural land increases
the above and below ground carbon reservoir and significantly increases crop yields and
residues on agricultural lands. While incineration and landfilling result in GHG off-gassing, soil
carbon reservoirs store and accumulate carbon rather than releasing greenhouse gases to the
atmosphere. Mill sludge application has the combined impact of improving soil carbon
reservoirs and reducing the need for fertilizer application, thus reducing the associated
emissions from fertilizer production, transportation and application.
58
The protocol takes a comparison approach to the measurement of mitigation effects, by using
actual measurements of control and treatment groups for comparisons, and to recognize an
increase in the soil carbon reservoir though the addition of mill sludge. Because soil type,
cropping practices, farm management and climatic conditions will all vary from farm to farm,
the baseline business as usual conditions must be measured specifically for each farm
quantifying emission reductions as a result of applying mill sludge. Project developers establish
a baseline condition through the maintenance of a control group that represents business as
usual factors in order to assess the efficacy of mill sludge application. Baseline measurements
will be collected prior to sludge application, and throughout the sludge treatment by using a
control group. Both CO2 and N2O are measured through this quantification approach, in an
effort to address soil carbon flux and changes to fertilizer use and application rates.
The protocol is intended to apply to all agricultural soils within Alberta, however more research
may be needed to quantify the effects of mill sludge application on soils where crop types other
than forage and grain crops have been planted. Research on land applications of mill sludge is
difficult to find within the scientific literature, suggesting that it is an under-studied area within
forest and agricultural practices.
Quantification: Theoretical Mitigation Potential
As previously mentioned, baselines are calculated through the use of both a pre-treatment
control and during-treatment samples of both the control and the treatment soils for changes
in soil carbon fluctuations. Since measuring soil organic carbon is challenging, and pre-
treatment soil conditions will vary with each practitioner, a discounting factor of 50% was
applied to the carbon values produced during quantification. Discount factors may be
decreased with the use of appropriate historical data and documentation could provide further
clarification on soil bulk density and soil carbon content variability within the treatment area(s).
Within Alberta, the 100% participation of three major mills: Alberta Newsprint Company, Slave
Lake Pulp and Millar Western will skew the baseline assessments. This challenge will not be
faced by the majority mills outside Alberta as practice uptake has declined from 2003 to 2007
(Alberta Research Council 2008c). Baseline quantifications will vary between jurisdiction not
only by current uptake of the landspreading practice, but also by current practice, as landfilling
and biomass to energy conversion etc. all have different cost and greenhouse gas production
values.
Landspreading of mechanical pulp mill sludge acts as an abatement technique, preventing the
loss of carbon to the atmosphere through the disposal of mill sludge in landfills. It further acts
59
as a sequestering activity by promoting improved soil carbon sequestration and retention both
through initial increases in soil carbon stocks, but also through the fertilizer effect of improved
plant and root growth. According to Alberta Innovates Technology Futures (2010),
approximately 0.267 t CO2e is released per tonne of sludge released from landfills every year.
Over the course of a six year crediting period, one tonne of landfilled sludge will release 1.6 t
CO2e. Had that sludge been used in a landspreading application on agricultural soils, 1.28 t
CO2e/ tonne sludge would be sequestered.
Constrained Potential: Market, Policy and Technical Overlay
Measurement, monitoring and verification of the increase in soil carbon reserves must be
conducted with the utmost care by trained and skilled soil professionals, as sampling plans in
ongoing research projects, and the chemical analysis required to effectively determine soil
carbon content require a particular level of understanding of soil science. The protocol
proposed by the Alberta Research Council (2008a) lays out a rigorous series of assessment
requirements, and will call for responsible reporting to ensure appropriate measurements have
occurred.
The risk of reversal must be addressed within any treatment involving landspreading for carbon
sequestration. Project proponents must acknowledge and address potential risks that could
result in the release of carbon associated with the applied mill sludge. Assumptions about soil
carbon volatilization suggest that losses will be of the same magnitude as the carbon
sequestration value of the practice change (McConkey et al. 2007). These assumptions then
require not only accounting for the impact of failing to store any new carbon from the current
year, but also the impact of losing carbon previously sequestered in the soil, likely due to a
change in management practice (Alberta Research Council 2008c). As a result of this
assumption, the risk of reversal for mill sludge landspreading is similar to the risk of reversal of
switching from No-Till practices to Full-Till (Alberta Research Council 2008c).
It must be acknowledged that the Alberta Offset System protocol, and all assessments of mill
sludge land applications reflect only mechanical pulp sludge. The majority of pulping processes
produce sludge, which is not suitable for land application due to high B, Na, metal compounds
or chlorinated compounds (Technical Protocol Plan). As a result of this, landspreading is limited
to a very specific subsection of pulp sludge, and testing will likely be required to assure
landowners of the safety of the sludge, and that landspreading will be beneficial to their
farming practices. As recognized by Gallardo et al. (2010), alternative mill sludge sources
beyond mechanical pulp (e.g. Kraft) contain metals and other compounds that could have
potentially hazardous phyto-toxicological effects.
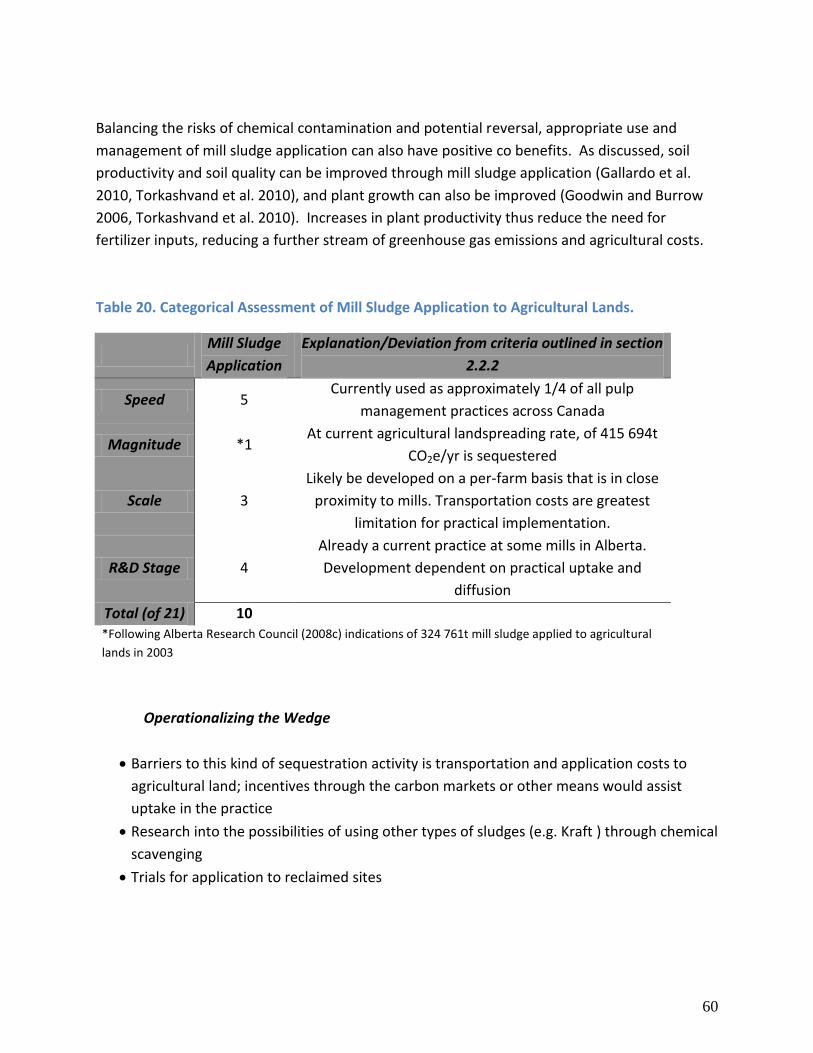
60
Balancing the risks of chemical contamination and potential reversal, appropriate use and
management of mill sludge application can also have positive co benefits. As discussed, soil
productivity and soil quality can be improved through mill sludge application (Gallardo et al.
2010, Torkashvand et al. 2010), and plant growth can also be improved (Goodwin and Burrow
2006, Torkashvand et al. 2010). Increases in plant productivity thus reduce the need for
fertilizer inputs, reducing a further stream of greenhouse gas emissions and agricultural costs.
Table 20. Categorical Assessment of Mill Sludge Application to Agricultural Lands.
Mill Sludge
Application
Explanation/Deviation from criteria outlined in section
2.2.2
Speed 5 Currently used as approximately 1/4 of all pulp
management practices across Canada
Magnitude *1 At current agricultural landspreading rate, of 415 694t
CO2e/yr is sequestered
Scale 3
Likely be developed on a per-farm basis that is in close
proximity to mills. Transportation costs are greatest
limitation for practical implementation.
R&D Stage 4
Already a current practice at some mills in Alberta.
Development dependent on practical uptake and
diffusion
Total (of 21) 10 *Following Alberta Research Council (2008c) indications of 324 761t mill sludge applied to agricultural
lands in 2003
Operationalizing the Wedge
Barriers to this kind of sequestration activity is transportation and application costs to
agricultural land; incentives through the carbon markets or other means would assist
uptake in the practice
Research into the possibilities of using other types of sludges (e.g. Kraft ) through chemical
scavenging
Trials for application to reclaimed sites
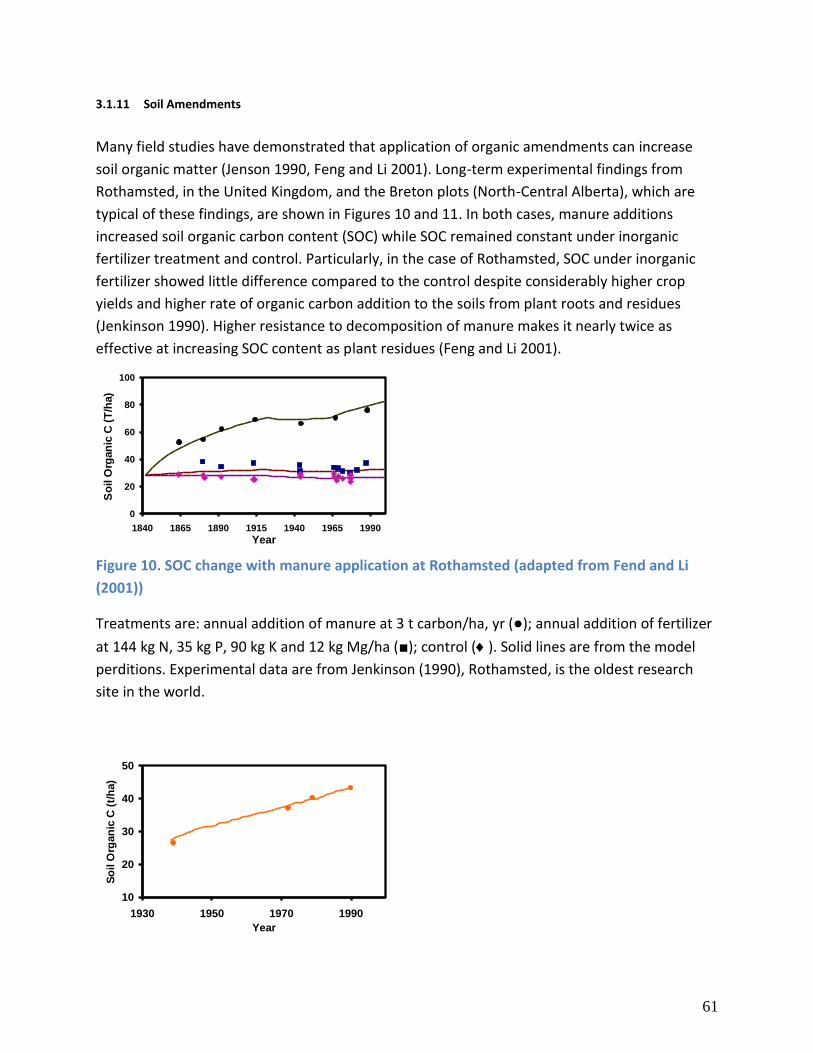
61
3.1.11 Soil Amendments
Many field studies have demonstrated that application of organic amendments can increase
soil organic matter (Jenson 1990, Feng and Li 2001). Long-term experimental findings from
Rothamsted, in the United Kingdom, and the Breton plots (North-Central Alberta), which are
typical of these findings, are shown in Figures 10 and 11. In both cases, manure additions
increased soil organic carbon content (SOC) while SOC remained constant under inorganic
fertilizer treatment and control. Particularly, in the case of Rothamsted, SOC under inorganic
fertilizer showed little difference compared to the control despite considerably higher crop
yields and higher rate of organic carbon addition to the soils from plant roots and residues
(Jenkinson 1990). Higher resistance to decomposition of manure makes it nearly twice as
effective at increasing SOC content as plant residues (Feng and Li 2001).
0
20
40
60
80
100
1840 1865 1890 1915 1940 1965 1990
Year
So
il O
rgan
ic C
(T
/ha)
Figure 10. SOC change with manure application at Rothamsted (adapted from Fend and Li
(2001))
Treatments are: annual addition of manure at 3 t carbon/ha, yr (●); annual addition of fertilizer
at 144 kg N, 35 kg P, 90 kg K and 12 kg Mg/ha (■); control (). Solid lines are from the model
perditions. Experimental data are from Jenkinson (1990), Rothamsted, is the oldest research
site in the world.
10
20
30
40
50
1930 1950 1970 1990
Year
So
il O
rgan
ic C
(t/
ha)
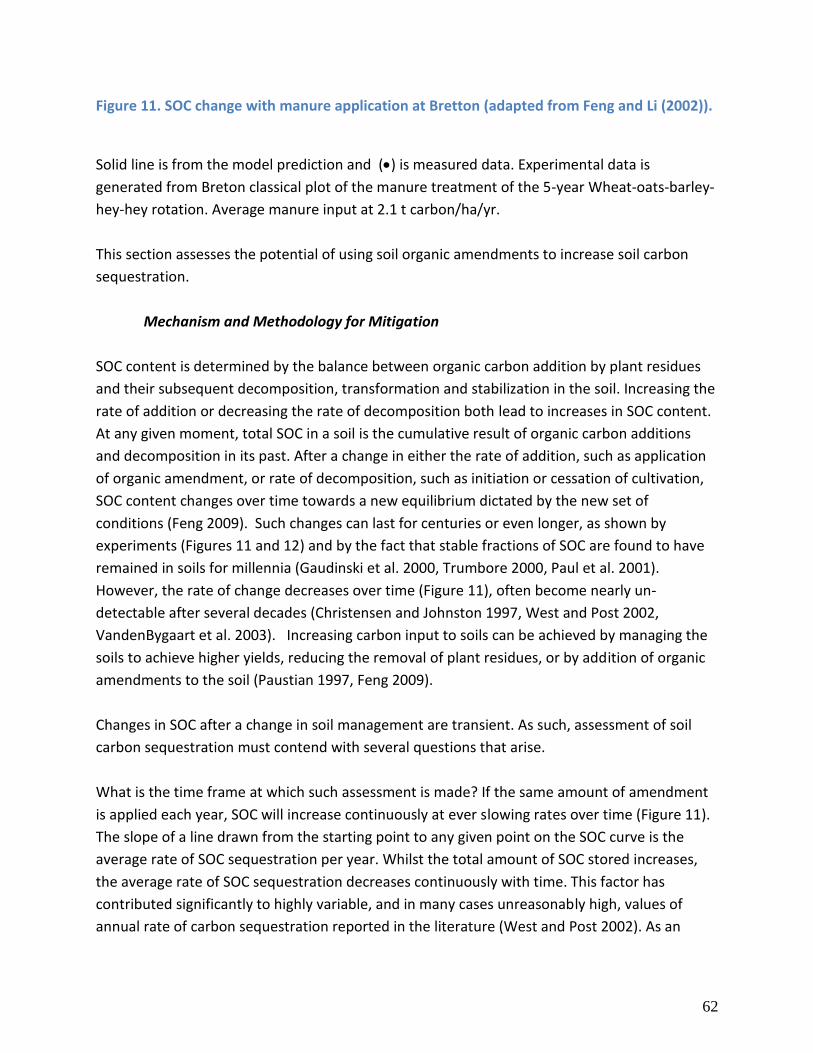
62
Figure 11. SOC change with manure application at Bretton (adapted from Feng and Li (2002)).
Solid line is from the model prediction and () is measured data. Experimental data is
generated from Breton classical plot of the manure treatment of the 5-year Wheat-oats-barley-
hey-hey rotation. Average manure input at 2.1 t carbon/ha/yr.
This section assesses the potential of using soil organic amendments to increase soil carbon
sequestration.
Mechanism and Methodology for Mitigation
SOC content is determined by the balance between organic carbon addition by plant residues
and their subsequent decomposition, transformation and stabilization in the soil. Increasing the
rate of addition or decreasing the rate of decomposition both lead to increases in SOC content.
At any given moment, total SOC in a soil is the cumulative result of organic carbon additions
and decomposition in its past. After a change in either the rate of addition, such as application
of organic amendment, or rate of decomposition, such as initiation or cessation of cultivation,
SOC content changes over time towards a new equilibrium dictated by the new set of
conditions (Feng 2009). Such changes can last for centuries or even longer, as shown by
experiments (Figures 11 and 12) and by the fact that stable fractions of SOC are found to have
remained in soils for millennia (Gaudinski et al. 2000, Trumbore 2000, Paul et al. 2001).
However, the rate of change decreases over time (Figure 11), often become nearly un-
detectable after several decades (Christensen and Johnston 1997, West and Post 2002,
VandenBygaart et al. 2003). Increasing carbon input to soils can be achieved by managing the
soils to achieve higher yields, reducing the removal of plant residues, or by addition of organic
amendments to the soil (Paustian 1997, Feng 2009).
Changes in SOC after a change in soil management are transient. As such, assessment of soil
carbon sequestration must contend with several questions that arise.
What is the time frame at which such assessment is made? If the same amount of amendment
is applied each year, SOC will increase continuously at ever slowing rates over time (Figure 11).
The slope of a line drawn from the starting point to any given point on the SOC curve is the
average rate of SOC sequestration per year. Whilst the total amount of SOC stored increases,
the average rate of SOC sequestration decreases continuously with time. This factor has
contributed significantly to highly variable, and in many cases unreasonably high, values of
annual rate of carbon sequestration reported in the literature (West and Post 2002). As an
63
assessment parameter, it can be argued that the large, short-term annual carbon sequestration
rates cannot be used to represent the potential for long-term carbon storage. Equilibrium
values of SOC, on the other hand, are nearly impossible to measure experimentally and
therefore, as an assessment parameter, are not verifiable. Even if one adopts a reasonable
operational compromise of 50 years, experimental validation can only be done against findings
in a few established long-term experimental sites. The only feasible assessment tool is using
SOC models
How will the ‘sequestered’ SOC be maintained? Continued addition of amendments is
necessary to maintain SOC at or above a level at which amount of carbon sequestration is
assessed. For example, consider the case shown in Figure 11. If carbon sequestration is
assessed after 50 years of continuous manure addition, SOC had increased to 62 t/ha from the
initial 28 t/ha, with a net carbon storage of 34 t/ha. The rate of manure application that is
required to maintain SOC at or above this level is considerably less than the 3 t/ha-yr of C used
in the first 50 years because continued application at this rate lead to much higher SOC levels.
In this particular case, it can be estimated that an application rate of 1.5 t/ha-yr of C would be
sufficient to maintain SOC at 62 t/ha after 50 years.
How penalties or credits should be assessed if the practice, which leads to SOC sequestration,
were reversed, discontinued, or changed? Figure 13 shows that SOC had reached 70 t/ha,
sequestering 42 t/ha of carbon after 75 years of continuous manure application and cropping. A
1 in 5 year fallow, during which no manure was applied, caused a stop of SOC increase but
maintained SOC at the 70 t/ha level. At the same site, Figure 12 shows that SOC decreased
when manure application stopped after 25 years, but at a slower rate than the initial SOC
increase. SOC remained 15 t/ha higher than control after more than a century, maintained in
part by higher productivity and crop residue input. Theoretically, SOC will continue to decrease
towards the equilibrium value—assumed to be that of the control. The process, however, could
take millennia. If improved soil management is adopted, SOC could be maintained above a
higher equilibrium.
Fortunately, these complex long-term changes in SOC can be predicted with reasonable
reliability with models that have been validated against existing long-term experimental
studies, the longest of which, the Rothamsted, has been maintained for more than 150 years.
The models, however, may differ in their predictions for time periods longer than that of the
available validation data sets, particularly in their predictions of equilibrium values.

64
Figure 12. SOC change with manure application at Rothamsted (adapted from Feng and Li
(2001)).
Treatments are: annual addition of manure at 3 t carbon/ha- yr (o); continued manure
application for 25 years (); control (). Solid lines are K-model Predictions. Experimental data
are from Jenkinson (1990).
Quantification: Theoretical Mitigation Potential
Collectable animal manure and legume biomass that can be produced on marginal lands of
Canada could be used as sources of soil amendments.
Manure:
Table 21 illustrates the total collectable manure from the Canadian livestock sector is 14 million
tonnes annually.
Table 21. Manure generated in the Canadian livestock industry that can be collected.
Animal Total animal1 Dry manure2,3 Total manure
year 2010 X 1000 head kg/head, day t/yr
Beef cow 7,359 3.5 9,401,250
Dairy cow 980 8.2 2,933,140
Hog 11,850 0.33 1,427,333
Poultry/egg 49,650 0.027 293,830
Total 14,055,553 1 Statistic Canada 2010 census; 2ASAE 2005; 3 average of 3% N content in manure was used (Alberta
biowaste inventory, to be published in 2011).
Biomass from alfalfa:

65
Canada has over 37 million hectares of marginal land (Milbrandt and Ocerend, 2009 with a
potential biomass yield of 2.6 t/ha. If one assumes that 15% of these lands can be used to
grow legumes (represented by alfalfa), it can produce 15 Mt of biomass annually.
Thus, materials potentially available as soil organic amendments annually in Canada may
include, as dry mass:
1. Manure: 14.1 Mt/yr
2. Alfalfa: 14.8 Mt/yr
Total: 28.9 Mt/yr with an average of 45% carbon content.
The theoretical mitigation potential assessment is based the following assumptions and
activities (Table 22) associated with the baseline and proposed practice.
Table 22. Summary of Assumptions and activities for the proposed practice baseline scenario
Baseline (no organic amendment addition)
Assumptions GHG emission/mitigation potential
Soil organic carbon remains constant with normal
practices
N/A
Mitigation Practice -Organic amendments
1. Materials (manure and legume biomass) go
through anaerobic digestion
2. Carbon content in both materials = 45%
3. For every unit C input it results in 0.22 unit C in
soil in a 50 period
4. Energy requirement of producing biofertilizer
pellets will be included in AD
5. Energy requirements of growing, harvesting,
transporting legume biomass will be included
in AD
6. Distribution of bio-fertilizer on land is only
activity resulting in GHG emissions
1. Manure offset: 2.7 CO2e Mt/yr
2. Alfalfa offset: 2.6 CO2e Mt/yr
3. Transportation emission: 0.028
Mt/yr
Total 5.3CO2 e Mt/yr
After the anaerobic digestion (AD) process, 50% of carbon and its related biomass will be
turned into biogas. Therefore, the total available biomass after AD will be 14.4 Mt/yr with 45%
carbon content.

66
Soil carbon sequestration is assessed at 50 years. Based on Jenkinson (1990) and Feng (2009), if
manure is applied at a constant rate over 50 years, then for every 1 unit of carbon added to the
soil, 0.22 unit will remain as increased SOC. Manure is nearly twice as effective at increasing
SOC as plant residue (Feng and Li 2001, Feng 2009a). The K-model predicts that digestate
resulting from treating plant biomass with AD is similar to animal manure with regard to soil
carbon sequestration. Digestate from treating manure with AD is 35% more effective than
manure with regard to soil carbon sequestration. However, unlike manure, stabilization
efficiency of digestate in soils lacks support from extensive experimental data. For simplicity,
digestates from manure and plant biomass are assumed to behave in a similar fashion as
manure. This is a conservative assumption for assessing soil carbon sequestration potential
from these materials.
For a total C input of 13 Mt/yr of AD processed organic materials to the soil, a total of 143 Mt
will be in the soil at 50 years, resulting in an average annual carbon sequestration rate of 1.4
Mt/yr of C, or 5.3 Mt CO2e/yr.
Under the proposed practice, carbon emission is 1.95 kg CO2e/t (Jesse and Neael, 2005) if AD
processed bio-fertilizer is distributed within a 100 km radius. This is 0.5% of the carbon
sequestration potential.
Constrained Potential: Market, Policy and Technical Overlay
Crop producers gradually recognize the value of organic amendments, but economics of
applying these amendments limit its application. A particular impediment is the fact that
unprocessed manure is generally wet, bulky, heavy, and with low nutrient concentration.
There are some issues that need to be resolved in assessing carbon sequestration with organic
amendments, particularly whether or not adding manure to soils is truly additional and beyond
business as usual. It may be argued that since the organic carbon in manure is fixed by plants
and is already primarily applied to land, the difference, at most, is where this carbon ends up
and there should be no net credit assigned to it – it’s simply a matter of moving the carbon
around on the landscape. To quantify the true mitigation potential of the activity, one would
need to take into account the carbon that is not being accrued in the soils that are no longer
receiving the manure – the difference would be the true incremental mitigation. The counter
argument is that, while it is true that sequestration potentials should only be assigned to “net
additional storage” of organic carbon, the current practice is to re-apply the manures within an
economic hauling distance of the livestock operation – this concentrates manure on land that is
saturated, with a greater rate of decomposition and little capacity for additional SOC

67
sequestration. However, research shows that degraded soils low in soil organic carbon have
higher potential for carbon sequestration than soils with high organic carbon contents (Nyborg
et al. 1998, Moulin et al. 2002). Thus, there could be substantial net carbon sequestration if
organic amendments are encouraged to be applied to low organic matter soils rather than
continuously being piled on soils already saturated with organic carbon and nutrients.
Table 23. Categorical Assessment of Amendments to Soils
Amendments
Explanation/Deviation from criteria described in
section 2.2.2
Speed 5 If a standard protocol is in place it can be quickly
implemented
Magnitude 5 It has a 5.4 Mt/yr potential
Scale 4 More education is required; proper government policy
will accelerate the market uptake
R&D Stage 6 At Market penetration stage
Total (of 21) 20
Co-benefits: The value of organic amendments will be considered along with bio-fertilizer. Once
these practices are recognized, it will promote the development for more comprehensive
products that will have balanced nutrient contents for targeted crop productions while enhance
nutrient use efficiency, particularly for nitrogen and soil carbon sequestration.
The major risk for this practice is that realization of the potentials will depend on the availability
of the materials. Further, there is a particular challenge for no-till practices – most nutrient
management regulations require incorporation of manure within 24 to 48 hours to minimize
odour. This practice conflicts with the no-till agriculture and may limit manure application to
marginal soils. Raw manure can have a similar impact but transportation cost will be a major
limiting factor since raw manure contains significant amount of water. In addition, weed seeds
and pathogen contamination will be a concern. Much of these risk factors can be addressed by
producing bio-fertilizer from AD processed materials. High capital costs of AD and bio-fertilizer
systems can be a significant challenge.
The estimation under the constrained condition is based on the assumptions of:
1) most collectable manure is available for this practice, once the quantification
protocol is in place, the market is ready;
2) growing biomass from marginal land may take time; and
68
3) the constrained potential is 50% of the theoretical potential, which is based on
collectable manure and biomass from marginal land only.
Operationalizing the Sub-Wedge
Requires incentive for applying organic amendments.
Invest in the development of a comprehensive dataset for manure application history
and current soil organic carbon levels in the province.
Develop a comprehensive, flexible, farm scale decision support model or tool that evaluates
economic and environmental benefits and risks of specific production systems ranging from
single crop production to integrated operations that may include soil management and crop
production, livestock production, biowaste management, bioenergy and biofertilizer
production. In particular, the this tool will be able to evaluate soil carbon sequestration and
reduction in greenhouse gas emissions from integrated soil management, crop production,
livestock production, and application of available biowaste management/utilization
technologies, e.g., bioenergy and bio-fertilizer production technologies.
Calculate regional nutrient budgets to identify manure sending and receiving zones for
balanced manure applications to land.
Need to develop a comprehensive quantification protocol.
3.2 GHG Reductions
3.2.1 Soil Nitrogen Management
From a management perspective, the National Emissions Inventory reports that 13 Mt were
emitted from soils due to synthetic N fertilizer application, 9.1 Mt from crop residue
decomposition (related to yields) and 0.17 Mt from a variety of other cropping management
practices (summerfallow, conservation tillage, Irrigation and cultivation of organic soils) in 2008
(Environment Canada 2010). These emissions were partly offset by the mitigating effects of
increased soil carbon sequestration. In 1990, the management of mineral soils amounted to a
net CO2 removal of about 2 Mt. This net sink steadily increased to about 12 Mt in 2008, through
changes in management over time.

69
In the environment, fertilizer-derived N, like any form of mineral N11 (or ‘free’ or ‘soluble’ N), is
subject to emission as N2O from nitrification or denitrification, subject to indirect losses
through leaching of nitrate, and/or volatilization of ammonia from the system, and re-
deposition on soils where it can further be converted to N2O.
For these reasons, simply decreasing the rate of N fertilizer may not result in a corresponding
decrease in emission of GHGs. That is, because mineral N tends to be mobile and subject to
many loss pathways (particularly when N is in the NO3- form in the soil), N application rate alone
may not be the best indicator of GHG emission reduction potential.
Using a comprehensive approach to N management, the likelihood of conditions that would
lead to both (1) excessive losses of fertilizer N through direct and indirect means, and (2)
improved N use efficiency, can be achieved, so that more than just rate reduction is the focus of
the mitigation activity. Further, since the dynamics of N2O from soils are typically characterized
by pulses of emissions, both when soil conditions are favorable, and at certain places in farmers
fields where moisture and dissolved carbon/nutrients collect, they are highly variable in both
space and time. Managing N2O emissions becomes a probability game, so mitigating the
likelihood of those conditions occurring is the best approach to reducing emissions.
Mechanism and Methodology for Mitigation
In the case of managing N2O emissions from Canadian soils, the primary strategies take into
account fertilizer practices that not only decrease the rate of fertilizer added, but also manage
the applied N to:
Optimize the crop response per unit of added N; and,
Minimize the opportunity for nitrate N to accumulate or persist in the soil where it is
potentially denitrified, and/or emitted directly or indirectly as N2O or lost to the
system through leaching.
These strategies have been bundled into a suite of precision-management practices12 that apply
the right source, at the right time, in the right place at the right rate (so called 4R’s). To be
effective, the practices across the 4R’s are designed to manage all sources of applied N to
minimize the opportunity for nitrate to accumulate and supply N at the time and rate that suits
the particular crop’s needs given tested residual soil N levels.
11
Mineral N refers to NH4+ (ammonium) or NO3- (nitrate) 12
Precision management in this context means varying degrees of temporal and spatial management of nitrogen according to soil tests, topographic position, crops grown and other circumstances (see reference document for more explanation).
70
The quantification approaches used in the calculations in this sub-wedge are based on the
Alberta GHG quantification protocol for nitrous oxide management. GHG emissions are
calculated using IPCC best practice guidance (Climate Change Central 2009, IPCC 2006) and
Canadian-based Tier 2 emission factors as set out in the National Emissions Inventory
methodology. In addition, analysis undertaken by Agriculture and Agri-food Canada’s Strategic
Policy Branch is also included in the quantification estimates (Gill and MacGregor 2010).
These protocols have been developed through a comprehensive scientific and technical review,
by both the federal and provincial governments, as well as the Canadian Fertilizer Institute.
Canada’s leading experts in soils, cropping and agronomic science as well as scientists from
abroad (United States and overseas experts) were consulted. The science and quantification
represented in these strategies is robust and highly confident. Note that in adapting this
quantification to Canada-wide mitigation estimates, certain assumptions need to be made.
These are listed in the next section.
Quantification: Theoretical Mitigation Potential
Baseline Assumptions and Data Sources – Soil Nitrogen Management:
To calculate the baseline acres and production levels, the 2009 crop reporting statistics from
Statistics Canada were used. To streamline the calculations, the 5 major crops, capturing 61%
of the production across the country were used in the analysis (Spring Wheat, Barley, Canola,
Corn and Soybeans; see attached reference material for more detail). It was assumed that
these productivity levels were held constant out to 2020. The 2009 year was used because of
less catastrophic events such as flooding or drought.
To calculate the amount of N2O emitted in the baseline year (2008 census), the NIR emission
factors were used (Figure 14). These factors, applied for the average tillage, texture,
topographic and irrigation adjustments per ecodistrict were used to calculate the baseline GHG
emission intensity (N2O emissions/per crop yield), including direct and indirect emissions, for
each of the 5 major crops listed above. The calculation method of the NIR takes into account all
forms of N inputs to the soil (fertilizer N, crop residue N, any organic N inputs, etc). So for each
ecodistrict, for each major crop, the NIR values for fertilizer application and 2009 crop areas
and yield data were used to calculate the emissions intensity and then averaged for each
province (see supporting reference materials for a summary of the analysis). This makes it very
consistent with the emissions inventory methodology.
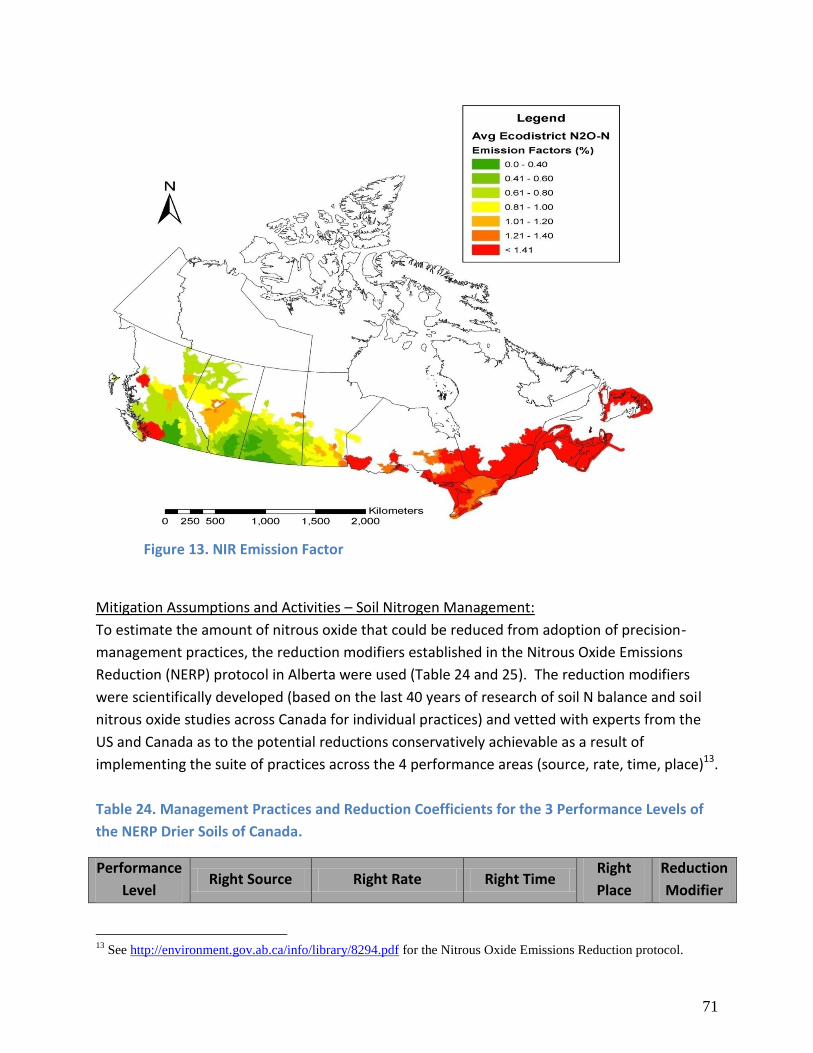
71
Figure 13. NIR Emission Factor
Mitigation Assumptions and Activities – Soil Nitrogen Management:
To estimate the amount of nitrous oxide that could be reduced from adoption of precision-
management practices, the reduction modifiers established in the Nitrous Oxide Emissions
Reduction (NERP) protocol in Alberta were used (Table 24 and 25). The reduction modifiers
were scientifically developed (based on the last 40 years of research of soil N balance and soil
nitrous oxide studies across Canada for individual practices) and vetted with experts from the
US and Canada as to the potential reductions conservatively achievable as a result of
implementing the suite of practices across the 4 performance areas (source, rate, time, place)13.
Table 24. Management Practices and Reduction Coefficients for the 3 Performance Levels of
the NERP Drier Soils of Canada.
Performance
Level Right Source Right Rate Right Time
Right
Place
Reduction
Modifier
13
See http://environment.gov.ab.ca/info/library/8294.pdf for the Nitrous Oxide Emissions Reduction protocol.
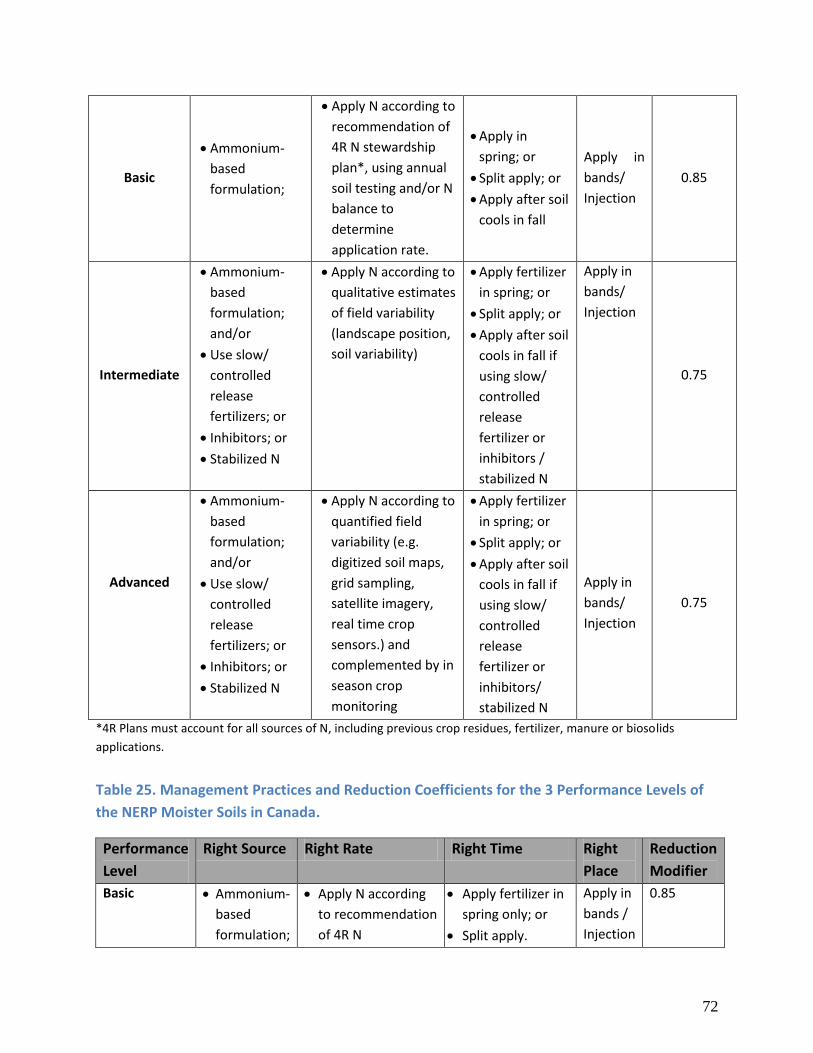
72
Basic
Ammonium-
based
formulation;
Apply N according to
recommendation of
4R N stewardship
plan*, using annual
soil testing and/or N
balance to
determine
application rate.
Apply in
spring; or
Split apply; or
Apply after soil
cools in fall
Apply in
bands/
Injection
0.85
Intermediate
Ammonium-
based
formulation;
and/or
Use slow/
controlled
release
fertilizers; or
Inhibitors; or
Stabilized N
Apply N according to
qualitative estimates
of field variability
(landscape position,
soil variability)
Apply fertilizer
in spring; or
Split apply; or
Apply after soil
cools in fall if
using slow/
controlled
release
fertilizer or
inhibitors /
stabilized N
Apply in
bands/
Injection
0.75
Advanced
Ammonium-
based
formulation;
and/or
Use slow/
controlled
release
fertilizers; or
Inhibitors; or
Stabilized N
Apply N according to
quantified field
variability (e.g.
digitized soil maps,
grid sampling,
satellite imagery,
real time crop
sensors.) and
complemented by in
season crop
monitoring
Apply fertilizer
in spring; or
Split apply; or
Apply after soil
cools in fall if
using slow/
controlled
release
fertilizer or
inhibitors/
stabilized N
Apply in
bands/
Injection
0.75
*4R Plans must account for all sources of N, including previous crop residues, fertilizer, manure or biosolids
applications.
Table 25. Management Practices and Reduction Coefficients for the 3 Performance Levels of
the NERP Moister Soils in Canada.
Performance
Level
Right Source Right Rate Right Time Right
Place
Reduction
Modifier
Basic Ammonium-
based
formulation;
Apply N according
to recommendation
of 4R N
Apply fertilizer in
spring only; or
Split apply.
Apply in
bands /
Injection
0.85

73
stewardship plan*,
using annual soil
testing** and/or N
balance to
determine
application rate.
Apply liquid or
solid manure in
spring; or
After soil cools in
fall
Intermediate Ammonium-
based
formulation
Apply N according
to 4R N
stewardship plan*,
modified by
qualitative
estimates of field
variability
(landscape position,
soil variability)
Apply fertilizer or
liquid manure in
spring only; or
Split apply.
Apply solid
manure in spring;
or
Apply after soil
cools in fall
Apply in
bands /
Injection
0.75
Advanced Ammonium-
based
formulation
; and/or
Use slow/
controlled
release
fertilizers;
or
Inhibitors;
or
Stabilized
nitrogen.
Apply N according
to 4R N
stewardship plan*,
modified by
quantified field
variability (e.g.
digitized soil maps,
grid sampling,
satellite imagery,
real time crop
sensors.), and
complemented by
in season crop
monitoring
Apply controlled
release fertilizer
or inhibitor/
stabilized
nitrogen
fertilizer; or
Apply liquid
manure in spring;
or
Split apply;
Apply solid
manure in spring;
or
Apply after soil
cools in fall.
Apply in
bands/
Injection
0.75***
*4R Plan must account for all sources of N, including previous crop residues, fertilizer, manure or biosolids
applications.
**where appropriate for the crop, and calibration data is available.
*** Rochette et al. 2008
The accounting methods applied in the NERP protocol identify two emission reduction
pathways:
1. Possible reduction of fertilizer rate as a result of implementing a ‘Basic’ or ‘Intermediate’
or ‘Advanced’ 4R Management Plan; and/or,
2. Applying the reduction modifier coefficient to emissions intensity of the crops produced.

74
For ease of calculation, the estimates for reducing N2O from agricultural soils in this paper will
just apply the reduction modifier, since assumptions about rate reductions of N application as a
result of implementing the performance levels would be prone to error. The results for the two
levels of potential emission reductions for the 5 major crops are shown below (Table 26 and
27). It was assumed that the NERP was applied across the entire acreage where the 5 major
crops are grown. It was also assumed that the 2009 reduction potential is consistent out to
202014.
Table 26. Reductions for 2009 Year by Crop Basic NERP Mt CO2e.
Reductions for 2009 Year By Crop - Basic
NERP Mt CO2e
Barley Canola Corn
Spring
Wheat Soybeans
Total Reductions
in 2009
Provinc
e Mt CO2e
NF 0.00 0.00 0.00 0.00 0.00 0.00
PE 0.01 0.00 0.00 0.00 0.00 0.01
NS 0.00 0.00 0.00 0.00 0.00 0.00
NB 0.00 0.00 0.00 0.00 0.00 0.00
PQ 0.03 0.00 0.17 0.01 0.01 0.23
ON 0.02 0.01 0.29 0.01 0.06 0.38
MB 0.06 0.12 0.01 0.18 0.00 0.37
SK 0.10 0.21 0.00 0.22 0.00 0.53
AB 0.17 0.19 0.00 0.22 0.00 0.58
BC 0.00 0.00 0.00 0.00 0.00 0.01
Canada 0.51 0.81 0.30 1.05 0.05 2.72
Table 27. Reductions for 2009 Year Crop by Intermediate/Advanced NERP Mt CO2e.
Reductions for 2009 Year By Crop –
Intermediate/Advanced NERP Mt CO2e
Barley Canola Corn
Spring
Wheat Soybeans
Total Reductions
in 2009
Provinc Mt CO2e
14
To calculate one year of baseline data emissions is a laborious undertaking and assumptions would need to be made regarding the increase or decrease in fertilizers, yields etc. For this reason the 2009 results are assumed to be indicative of the theoretical potential in this paper.

75
e
NF 0.00 0.00 0.00 0.00 0.00 0.00
PE 0.01 0.00 0.00 0.00 0.00 0.02
NS 0.00 0.00 0.00 0.00 0.00 0.00
NB 0.00 0.00 0.00 0.00 0.00 0.01
PQ 0.05 0.00 0.29 0.02 0.02 0.38
ON 0.03 0.01 0.48 0.01 0.10 0.64
MB 0.10 0.21 0.02 0.29 0.00 0.61
SK 0.16 0.34 0.00 0.37 0.00 0.88
AB 0.29 0.32 0.00 0.36 0.00 0.97
BC 0.01 0.01 0.00 0.00 0.00 0.02
Canada 0.85 1.34 0.51 1.75 0.09 4.54
In total, for 61% of the crops grown in Canada, the potential for nitrous oxide reductions
through changes in precision management practices varies from between 2.72 to 4.54 Mt
CO2e/yr. This could be even more if rates of fertilizer reduction decrease per hectare as a
result of more variable application considerations.
Constrained Potential: Policy, Market and Technical Overlay
In the case of Soil Nitrogen Management practices, adoption of variable rate technologies (GPS
based precision application) is not mainstream in cropping systems today. While most growers
have monitors on their equipment for real-time yield detection during harvesting and other
productivity indices, the adoption to in-field GPS application of fertilizer applications is lagging
behind. The cost-benefit productivity ratios need to be demonstrated to growers, and this
technology will likely need to be provided in a mixture of (1) service-driven, on the ground
consultancy; (2) private sector technical assistance to those growers who want to tackle this
themselves, and (3) traditional extension agencies who are dwindling in capacity and their
ability to keep up to evolving technology.
Part of the evolution in this space is that private sector companies are filling the void left by
government agencies who provided traditional extension. The benefits will need to be reliably
and consistently demonstrated by the private sector agencies because this technology is
expensive. However, the level of implementation is flexible enough that the precision GPS
based application is an option. Thus, at the Basic level of implementation, field variability is
not the over-riding factor so adoption rates could be as high as 50%. For Intermediate level of
application, qualitative assessments for field variability are allowed, so this could be as high as
50% also. To move to the highest level of precision application, a significant cost hurdle is

76
encountered –this is the full-on GPS and variable rate technologies for fertilizer application.
and Agriculture and Agri-Food Canada, through expert judgment, assessed that Low, Medium
and High Adoption rates for Canada are in the order of 5% (low); 11% (medium) and 20%.
Applying these constraints, the more realistic estimates are:
Basic Level Implementation – 1.36 Mt CO2e/yr
Intermediate– 1.36 Mt CO2e/yr (non-additive)
Advanced - ranges from 0.23 to 1 Mt CO2e/yr,
The measuring, monitoring and verification (MMV) procedures for these kinds of mitigation
activities are clearly laid out in the Alberta protocols. The data gathering to support mitigation
that is real, measurable and verifiable for these kinds of activities for the NERP require
establishment of project-level baselines, which are an average of data over 3 years and requires
more evidence and justification to the verifier. It can be done but will require significantly
more data gathering, and justification to support viable and verifiable reductions.
Table 28. Categorical Assessment of NERP Implementation.
Basic Level
Intermediate/
Advanced Level
Explanation/Deviation from Criteria
described in Section 2.2.2
Speed 3 1 Basic easilty adpoted
Magnitude 3 3 Big on large scale
Scale 1 1 Many sources, small tonnes
R&D Stage 6 6 Technology Available
Total (of 21) 13 11
Numerous co-benefits are realized from managing N inputs more sustainably. Optimizing N
applications according to the right source at the right rate, time and place means less
volatilization of ammonia gas, and less leaching of nitrates through the soil profile. Further,
run-off events have minimal impact with incorporated fertilizers. Improved water and soil
quality result in the lowland and upland areas, leading to better agro-ecosystem health overall.
Operationalizing the Sub-Wedge
Invest in research to measure integrated BMP impacts on GHGs through the 4R
management system, across a variety of soils-cropping systems
77
Invest in research to measure performance of ‘next generation’ fertilizers like time-release
coated fertilizers (e.g Environmentally Smart Nitrogen, Thiofertilizers)
Invest in demonstration of variable rate technologies on-farm; precision application of
fertilizers, pesticides
Invest in research to measure net GHG impacts from precision application systems in
various soils-cropping systems
Invest in building the measurement tools of tomorrow - integrated measuring, monitoring
and verification systems through the use of remote sensing, optical satellite sensors, GIS
databases and biogeochemical process models for direct farm measurement
3.2.2 Beef and Dairy Cattle - Reductions of Methane and Nitrous Oxide
In 2008, the Agricultural sector in Canada was responsible for emissions of 62 Mt of CO2e (8.4%
of Canada’s anthropogenic emissions), with enteric methane emissions from ruminant livestock
making up roughly 22 Mt of CO2e annually (approximately 19 Mt from beef cattle and 3 Mt
from dairy (IPCC 2000, IPCC 2006, Atlantic Dairy and Forage Institute 2008, Environment
Canada 2010)). Numerous studies have demonstrated that enteric methane reductions in cattle
can be achieved through the use of various nutritional and genetic /cattle management
strategies. There are approximately 83,000 beef producers across Canada, managing over 13
million head, with dairy operators managing 982,000 head (Gill and MacGregor 2010).
Therefore small reductions in emissions associated with each animal can lead to significant
reductions overall. Many of the strategies designed to reduce enteric fermentation also reduce
manure production, leading to further reduction potentials in GHGs. From the period of 1981
to 2006, GHG emissions /kg head has decreased from 16.4 to 10.4 kg CO2e in the beef sector –
a clear trend towards increased efficiency in management (Statistics Canada 2010a).
Dairy cattle emissions in 2008 were approximately 3 Mt from enteric fermentation and an
additional 1.5 Mt from manure-based emissions. Dairy cattle are supply-side managed in
Canada through a dairy-quota system. Trends in dairy populations over the inventory
accounting period declined by 28% (1990-2008), causing a decline in emissions overall. The
average dairy cow produces more milk today than in 1990, consumes more feed and also emits
more GHGs. However, Dyer et al. (2008), found that from the period of 1981 to 2001, the GHG
emissions per kilogram of milk produced decreased by 35%, from 1.22 kg CO2e kg-1 milk to 0.91
kg CO2e kg-1 milk.
In Australia, agriculture accounts for 16% of that country’s total GHG emissions, with livestock
(mainly ruminants) accounting for two-thirds of agriculture emissions, whereas in New Zealand

78
agriculture represents 49.4% of all New Zealand’s emissions with CH4 (66.4%) and N2O (33.6%)
making up the majority of the emissions. Thus many governments throughout the world are
actively researching and implementing strategies to reduce GHG emissions from ruminants.
Canada is blessed with some of the world’s best experts in ruminant nutrition and management
(especially in Alberta), as well as a sizeable beef and dairy herd with which to make
improvements.
Mechanism and Methodology for Mitigation
The primary strategies with high confidence for reducing enteric methane emissions, and
associated manure emissions from beef cattle are:
Adding specified edible oils to the diet (providing alternate electron acceptors, or
suppressing methanogenic rumen microbes);
Modifying the diet with additives that suppress methanogenic rumen microbes (adding
halogenated methane analogues, beta-antagonists or ionophores) causing cattle to
convert more of their feed into meat or milk;
Selecting for more genetically efficient cattle (based on markers for low residual feed
intake (RFI) - a technology that emerged in Canada first);
Managing the production chain to shorten cattle lifespans – reducing maintenance diets in
their feeding stages where animals idle on roughage, producing unnecessary methane and
manure (with associated CH4 and N2O emissions).
The basis for emission reductions in the dairy sector, with high confidence, include the
following strategies:
Increasing milk productivity through better genetics or husbandry to achieve equal milk
with less feed
Modifying the diet with higher quality feed or supplements (edible oils, ionophores or
distillers grains) to decrease enteric methane per unit feed
Increasing heifer replacement rate so there are fewer non-productive cows
Season of spreading — avoid storing manure in warm months where methane emissions
can be higher
The quantification approaches used in the calculations in this sub-wedge are based on the
Alberta GHG quantification protocols for beef and dairy management (Dyer et al. 2008, Vergé
et al. 2008). GHG emissions are calculated within cattle category and feeding period (e.g.,
nursing calves, calves grazing summer, fall and stockpiled pasture, calves on backgrounding diet
in the feedlot, yearling grazing pasture, yearlings on a finishing diet; lactating cattle, etc) using
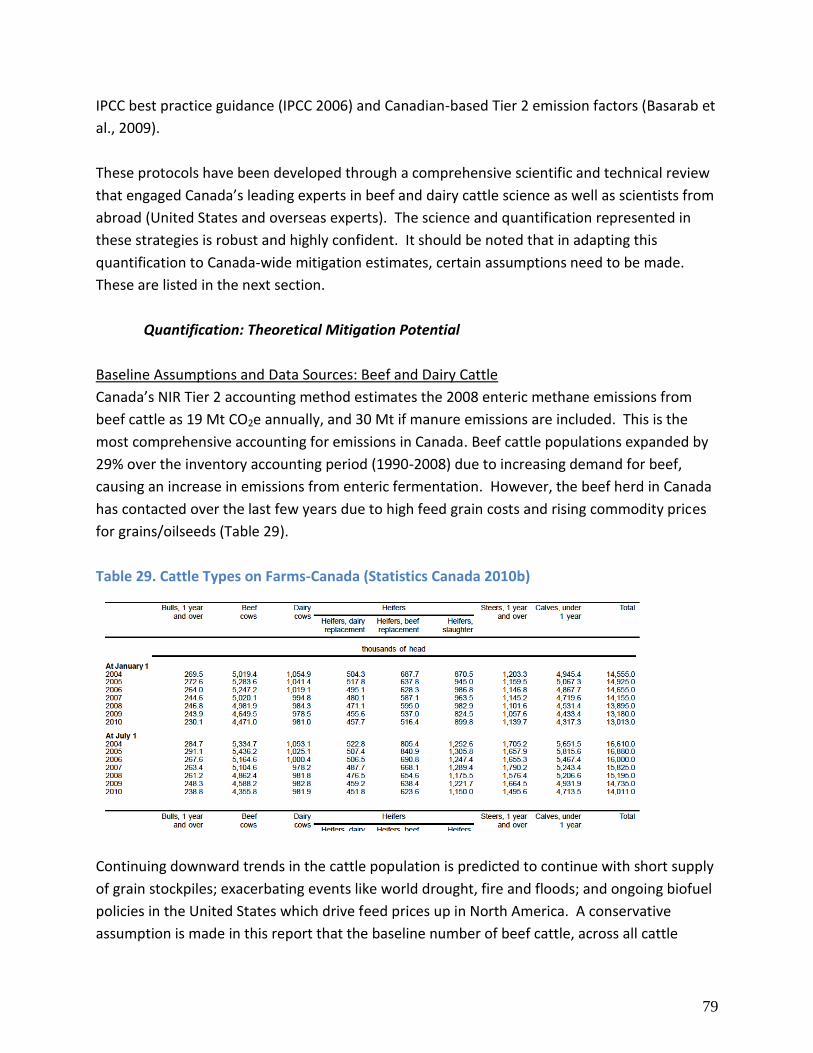
79
IPCC best practice guidance (IPCC 2006) and Canadian-based Tier 2 emission factors (Basarab et
al., 2009).
These protocols have been developed through a comprehensive scientific and technical review
that engaged Canada’s leading experts in beef and dairy cattle science as well as scientists from
abroad (United States and overseas experts). The science and quantification represented in
these strategies is robust and highly confident. It should be noted that in adapting this
quantification to Canada-wide mitigation estimates, certain assumptions need to be made.
These are listed in the next section.
Quantification: Theoretical Mitigation Potential
Baseline Assumptions and Data Sources: Beef and Dairy Cattle
Canada’s NIR Tier 2 accounting method estimates the 2008 enteric methane emissions from
beef cattle as 19 Mt CO2e annually, and 30 Mt if manure emissions are included. This is the
most comprehensive accounting for emissions in Canada. Beef cattle populations expanded by
29% over the inventory accounting period (1990-2008) due to increasing demand for beef,
causing an increase in emissions from enteric fermentation. However, the beef herd in Canada
has contacted over the last few years due to high feed grain costs and rising commodity prices
for grains/oilseeds (Table 29).
Table 29. Cattle Types on Farms-Canada (Statistics Canada 2010b)
Continuing downward trends in the cattle population is predicted to continue with short supply
of grain stockpiles; exacerbating events like world drought, fire and floods; and ongoing biofuel
policies in the United States which drive feed prices up in North America. A conservative
assumption is made in this report that the baseline number of beef cattle, across all cattle

80
types, will hold relatively constant over the estimation period of 2007 to 2020, at 14 million
head.
For the purposes of this report, it is safe to assume that supply-side managed dairy cattle
populations will not increase and conservative to assume that they remain constant at
approximately 980,000 head from 2007 to 2020.
Mitigation Assumptions and Activities: Beef and Dairy Cattle
Most of the mitigation strategies listed above are efficiency gains in meat or milk production,
expressed on emissions level per product output basis (with the exception of emissions from
manure management). This means that between the baseline and mitigation activities, the
compared functional unit for estimating mitigation potential is measured in tonnes of CO2e per
kg of beef or fat corrected milk. Thus, a consideration for calculating the theoretical mitigation
potential in absolute terms, across the entire beef/dairy herd will depend on whether or not
animal populations increase. We are assuming the herds do not increase from now until 2020
based on previous justifications. Note that in Table 30 below, efforts have been made to
quantify the mitigation potential for those cattle types that apply to the mitigation strategy.
Table 30. Mitigation Potential of Beef Dairy Strategies.
Mitigation Activitya Enteric Fermentation
Mitigation Potential
Nitrous Oxide/Manure
Methane Potential
Adding Edible Oils in
range of 4 to 6% of DM
in the feedlot dietb
Up to a 20% decrease in
methane per head; Up to 0.59
Mt CO2e annually
-
Reducing Age at
Harvestc
Reducing lifecycle by 3 months
results in up to 0.7 tonnes
CO2e/head; up to 3.71 Mt CO2e
reduced annually
Less manure excretion
results in up to 0.25 tonnes
CO2e /head; up to 1 Mt
reduced annually
Selecting for Improved
Feed Utilization
Efficiency (RFI
markers)d
Less methane and manure excreted by Low RFI bred cattle;
Up to 0.035 Mt reduced annually with 10% of Canada’s bulls
selected for low RFI
Milk productivity
Higher quality
feed/additives
Manure mgmt
Heifer replacement
Up to 1.5 tonnes CO2e/head; up to 1.49 Mt annually

81
rate
Total: Up to 6.82 Mt CO2e/yr a - Quantification based on methodologies within Alberta-based protocols
b – Based on feeding edible oils in confined operations; number of head based on July 1 2010 slaughter heifers and Steers 1
year and over in Table X.
c – Based on number of head on July 1, 2010, Table X – slaughter steers (over 1 year); slaughter heifers and 50% of the Calves
under 1 year could be harvested 3 months earlier.
d – Based on a case study where 4 low RFI bulls on a 100 cow-calf herd reduced 24 tonnes CO2e annually; to extrapolate to
Canada, the assumption that 10% of the Canadian seed stock (bulls) is selected for low RFI; a cow to bull breeding ratio of 25:1,
resulting in a progeny of 50% steers, 33% heifers, and 17% replacement heifers that are genetically more efficient.
Based on the above estimates, the Theoretical Mitigation Potential for reducing emissions from
beef and dairy Cattle could be as high as 6.82 Mt CO2e annually across Canada.
Constrained Potential: Market, Policy and Technical Overlay
There are a number of constraints to achieving high potentials in beef and dairy GHG
mitigation. In beef, not all breeds and types of cattle will be able to shorten their lifespans
since cattle differ in how quickly they fill out their frames. Some types need more time to reach
market quality (as indicated by the size of the striploin steak). Further, the current test for
selecting for more genetically efficient cattle is based on phenotypic selection of more efficient
seedstock/bulls. The investment to test the bulls for lower residual feed intake is in the $100 to
$150 range and may deter cow-calf operators from engaging in the technology, particularly
when beef margins are so low. A blood test is under development at the University of Alberta
but is unavailable at this time. Further, feeding cattle ionophores, beta-antagonists or
halogenated methane analogues may not fit into the economics of the feedlot or dairy
operation, depending on the size. Some of these compounds need to be cycled in the feed for
dairy since rumen microbes can habituate and the additives become ineffective for a short
time. Lastly, feeding edible oils only becomes economical at about half the price of oil on the
market today. The benefits of feeding edible oils to beef not only include reduced methane
emissions, there are increases in conjugated linolenic and linoleic fatty acids in the meat
(omega 3 and 6 essential oils in human diets), resulting in a product called high CLA beef.
Unfortunately this market is taking time to develop because of relatively high demand of oils
and oilseeds for other purposes.
In dairy, Dyer et al. (2008) reported that efficiency gains made in the dairy sector are stabilizing,
and further activities to increase milk production efficiency will have increasing marginal costs
of adoption. The dairy cattle population in Canada from 1981 to 2001 dropped by 57%, made
possible by increasing milk per cow, resulting in a 49% decrease in GHGs per litre of milk in that
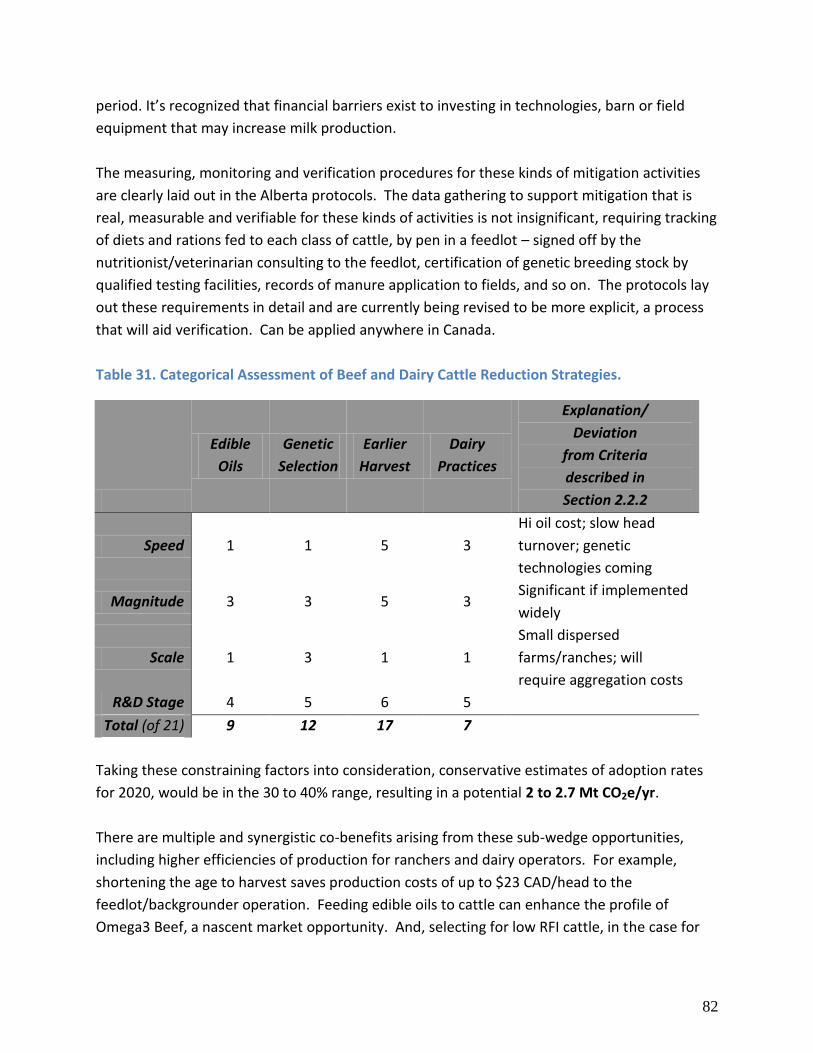
82
period. It’s recognized that financial barriers exist to investing in technologies, barn or field
equipment that may increase milk production.
The measuring, monitoring and verification procedures for these kinds of mitigation activities
are clearly laid out in the Alberta protocols. The data gathering to support mitigation that is
real, measurable and verifiable for these kinds of activities is not insignificant, requiring tracking
of diets and rations fed to each class of cattle, by pen in a feedlot – signed off by the
nutritionist/veterinarian consulting to the feedlot, certification of genetic breeding stock by
qualified testing facilities, records of manure application to fields, and so on. The protocols lay
out these requirements in detail and are currently being revised to be more explicit, a process
that will aid verification. Can be applied anywhere in Canada.
Table 31. Categorical Assessment of Beef and Dairy Cattle Reduction Strategies.
Edible
Oils
Genetic
Selection
Earlier
Harvest
Dairy
Practices
Explanation/
Deviation
from Criteria
described in
Section 2.2.2
Speed 1 1 5 3
Hi oil cost; slow head
turnover; genetic
technologies coming
Magnitude 3 3 5 3 Significant if implemented
widely
Scale 1 3 1 1
Small dispersed
farms/ranches; will
require aggregation costs
R&D Stage 4 5 6 5
Total (of 21) 9 12 17 7
Taking these constraining factors into consideration, conservative estimates of adoption rates
for 2020, would be in the 30 to 40% range, resulting in a potential 2 to 2.7 Mt CO2e/yr.
There are multiple and synergistic co-benefits arising from these sub-wedge opportunities,
including higher efficiencies of production for ranchers and dairy operators. For example,
shortening the age to harvest saves production costs of up to $23 CAD/head to the
feedlot/backgrounder operation. Feeding edible oils to cattle can enhance the profile of
Omega3 Beef, a nascent market opportunity. And, selecting for low RFI cattle, in the case for

83
the 100 head cow-calf herd, can save the operation up to $2200 in production costs (Atlantic
Dairy and Forage Institute 2008). In addition, savings in manure production means lower
impact of other nutrients on the environment. As noted by (Basarab et al. 2009), multiple co-
benefits exist to these practices – (1) identify management to improve the efficiency of feed
and energy utilization without adversely affecting production and profitability; (2) reduce the
environmental impacts of beef/dairy production; (3) take advantage of the carbon credit
market; (4) to differentiate ‘green’ products on the basis of an improved carbon footprint, and
healthier product.
Operationalizing the Sub-Wedge
See summary at the end of Section 3.2.3
3.2.3 Reductions from Hog, Poultry and some Dairy Operations
Greenhouse gas emissions from swine production systems in Canada totaled 2.9 Mt CO2e in
2008 (Vergé et al. 2009, Environment Canada 2010). Other livestock production systems (non-
beef and dairy) reached 2.2 Mt CO2e for the same time period, for an overall total of 5.1 Mt
CO2e/yr. Although a small proportion of overall emissions arise from these production systems,
many opportunities exist to reduce emissions. Shortened manure storage periods, more
frequent application at the right time of year, improved management of protein in non-
ruminant diets and increasing feed conversion efficiency of livestock are examples of strategies
that will reduce GHG emissions in Canada.
For the hog sector, Verge et al. (2009) found that over the period 1981 to 2001, the growth of
the swine population led to an increase in GHG emissions from the pork industry by 54%. The
main GHG was CH4, representing about 40% of the total in 2001. Nitrous oxide and fossil CO2
both accounted for about 30%. Increases in more efficient management practices caused the
GHG emission intensity of the Canadian swine industry to decrease from 2.99 to 2.31 kg of CO2e
per kg of live market animal during the same period.
Mechanism and Methodology for Mitigation
The primary strategies with high confidence for reducing greenhouse gas emissions, and
associated manure emissions from swine are:
Reduce Nitrogen (N) content of the feed (measured as protein) is and/or increase feed
efficiency so that the amount of manure and N content excreted by pigs is decreased;

84
Reduce the Volatile Solids (Vs) content of the excreted manure through diet re-
formulation;
Empty manure storages in the spring to remove Volatile Solids and avoid methane
emissions;
Spread manure in the spring rather than fall to reduce nitrous oxide emissions from soils.
The quantification approaches used in the calculations for swine reduction strategies are based
on the Alberta Swine GHG quantification protocol and analysis conducted by the Strategic
Policy Branch in Agriculture and Agri-Food Canada (Vergé et al. 2009, Gill and MacGreggor
2010). GHG emissions using IPCC best practice guidance (IPCC 2006), and Canadian-based Tier 2
emission factors. The calculated tonnes per head shown below are taken from an ARD report
completed in 2008; based on an analytical 600 sow farrow to finish operation complex (Vergé
et al. 2009).
These protocols have been developed through a comprehensive scientific and technical review
that engaged Canada’s leading experts in beef and dairy cattle science as well as scientists from
abroad (United States and overseas experts). The science and quantification represented in
these strategies is robust and highly confident. It should be noted that, in adapting this
quantification to Canada-wide mitigation estimates, certain assumptions need to be made.
These are listed in the next section.
Quantification: Theoretical Mitigation Potential
Baseline Assumptions and Data Sources: Reductions from Hog, Poultry and Some Dairy
Canada’s NIR Tier 2 accounting method estimates the 2008 emissions for swine to be 2.9 Mt.
Currently, the swine population in Canada is 11.835 million head (Table 34 below) (Statistics
Canada 2010c). Since the third quarter of 2005, Canadian hog and pig inventories are down 3.3
million head or 22%. The most recent data shows 4,430 farms in eastern provinces, down about
56% from the number of farms reporting in 1997. In western provinces, there are about 2,605
farms reporting pig inventories, compared to 10,160 farms in 1997, a 75% decline. The trend of
reductions in Canadian hog numbers will be difficult to reverse in the next few years given
expectations for high feed prices and a strong Canadian currency ) National Hog Farmer 2010).
For the purposes of this calculation, it is conservative to assume that the hog inventory in
Canada will remain stable from the 2007 to 2020 time period.
Table 32. Swine Inventory of Canada

85
Mitigation Assumptions and Activities: Reductions from Hog, Poultry and Some Dairy
Most of the mitigation strategies listed above are efficiency gains in pork production, expressed
on emissions level per product output basis (with the exception of emissions from manure
management). This means that between the baseline and mitigation activities, the compared
functional unit for estimating mitigation potential is measured in tonnes of CO2e per kg of pork
produced. The Alberta protocol calculates the tonnes of CO2e per kg of pork per pig class, but
for the purposes of this calculation, a tonne per head amount has been rolled up from the 600-
sow farrow-to-finish base case in Central Alberta15. Quantification estimates below for feed
efficiency and manure management utilize the head count of 11.835 million head as of January
2010 (Table 33).
Table 33. Mitigation Potential of Swine.
Mitigation Activitya Mitigation Potentiald
10% increase in feed conversion
efficiencyb
0.013t/hog; up to 0.15 Mt of CO2e reduced
annually
Switch from fall emptying to spring
and fall emptying and manure
application
0.036t/hog; up to 0.43 Mt of CO2e reduced
annually
Reduce protein intake by 15%;
balance with free amino acids in
swine; 10% reduction of protein in
diets of dairy cows and 15%
reduction of protein in poultry
diets.c
With 60% adoption; up to 0.92 Mt CO2e reduced
annually from 2007-2017
Total: Up to 1.5 Mt CO2e/yr a – Quantification based on Alberta Offset Pork Protocol, unless otherwise indicated
b – Assumed to be achieved through improved genetics, ration balancing/manipulation, improved feeder designs to minimize
waste feed
c – For swine, it’s assumed that phytase is also added to the diet to manage Phosphorous impact; estimates taken from Gill and
Macgregor, 2010
15
This is a coarser approach than taken for beef and dairy, where applicable animal classes were used in the calculations.
86
d – Note for these calculations, considerations of animal class or exports of animal class (ie, weaners, feeders) were not taken
into account, resulting in a possible overestimation of potential.
Constrained Potential: Market, Policy and Technical Overlay
There are a number of constraints to achieving the full potential listed above. The economic
benefits of hog production are often threatened by the volatility in oil seed and grain prices. For
producers prescribing to a least cost ration formulation, this market volatility may limit the
producers’ ability to follow a ration formula to reduce related GHG emissions. Further, reducing
protein content of diets may be perceived as too risky to hog, dairy or poultry producers,
jeopardizing production gains and possibly fertility rates. Also, balancing the protein content
with supplemental amino acids is likely not economic for most operations.
Although the manure strategies mentioned above do not require large capital investments,
multiple annual applications of manure require time, labour, and scheduling that may not fit
into the operational aspects of the hog farms in question. This limits the likelihood of
producers adopting this strategy. However, the likelihood of this adoption is dependent on cost
factors, weather, equipment and perceived risk by producers. In 2003, one company in Alberta
was able to contract over 150 hog operations to re-schedule their emptying and spreading of
manure to capitalize on pre-compliance carbon credit activities. It’s been demonstrated that if
it makes sense for producers to engage, they will engage. However, the likelihood of this
adoption is dependent on cost factors, weather, equipment and perceived risk by producers.
The measuring, monitoring and verification procedures for these kinds of mitigation activities
are clearly laid out in the Alberta protocols. The data gathering to support mitigation that is
real, measurable and verifiable for these kinds of activities is not insignificant, requiring tracking
of diets and rations fed to each class of animal or by animal type in their groupings, typically
signed off by the nutritionist/veterinarian consulting to the animal operation. Aggregation of
farms will need to occur in order to increase viability and implementation. The modeling done
by Agriculture and Agri-Food Canada on reducing protein content of rations, can be
implemented under the requirements and procedures of the livestock protocols to track diets
fed to animals, as well as records of manure application to fields, and so on. The protocols lay
out these requirements in detail and are currently being revised to be more explicit, a process
that will aid verification. These can be applied anywhere in Canada.
Table 34. Categorical assessment of hog, poultry and some dairy reduction strategies.
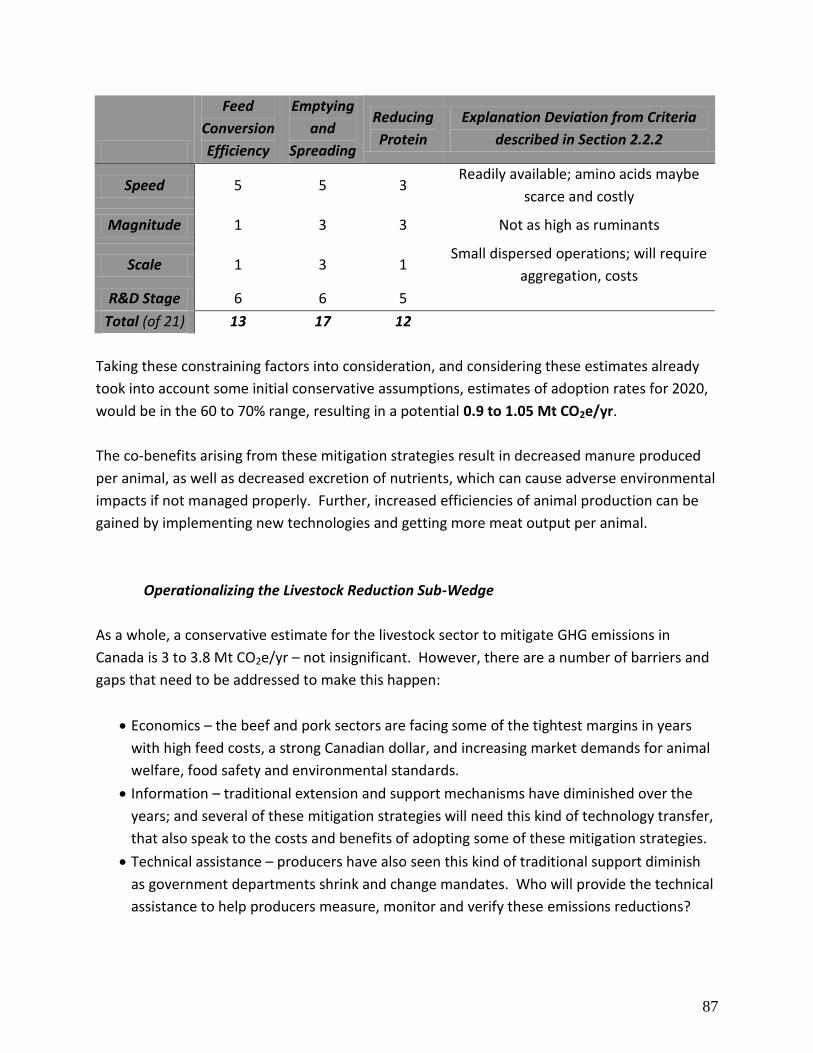
87
Feed
Conversion
Efficiency
Emptying
and
Spreading
Reducing
Protein
Explanation Deviation from Criteria
described in Section 2.2.2
Speed 5 5 3 Readily available; amino acids maybe
scarce and costly
Magnitude 1 3 3 Not as high as ruminants
Scale 1 3 1 Small dispersed operations; will require
aggregation, costs
R&D Stage 6 6 5
Total (of 21) 13 17 12
Taking these constraining factors into consideration, and considering these estimates already
took into account some initial conservative assumptions, estimates of adoption rates for 2020,
would be in the 60 to 70% range, resulting in a potential 0.9 to 1.05 Mt CO2e/yr.
The co-benefits arising from these mitigation strategies result in decreased manure produced
per animal, as well as decreased excretion of nutrients, which can cause adverse environmental
impacts if not managed properly. Further, increased efficiencies of animal production can be
gained by implementing new technologies and getting more meat output per animal.
Operationalizing the Livestock Reduction Sub-Wedge
As a whole, a conservative estimate for the livestock sector to mitigate GHG emissions in
Canada is 3 to 3.8 Mt CO2e/yr – not insignificant. However, there are a number of barriers and
gaps that need to be addressed to make this happen:
Economics – the beef and pork sectors are facing some of the tightest margins in years
with high feed costs, a strong Canadian dollar, and increasing market demands for animal
welfare, food safety and environmental standards.
Information – traditional extension and support mechanisms have diminished over the
years; and several of these mitigation strategies will need this kind of technology transfer,
that also speak to the costs and benefits of adopting some of these mitigation strategies.
Technical assistance – producers have also seen this kind of traditional support diminish
as government departments shrink and change mandates. Who will provide the technical
assistance to help producers measure, monitor and verify these emissions reductions?
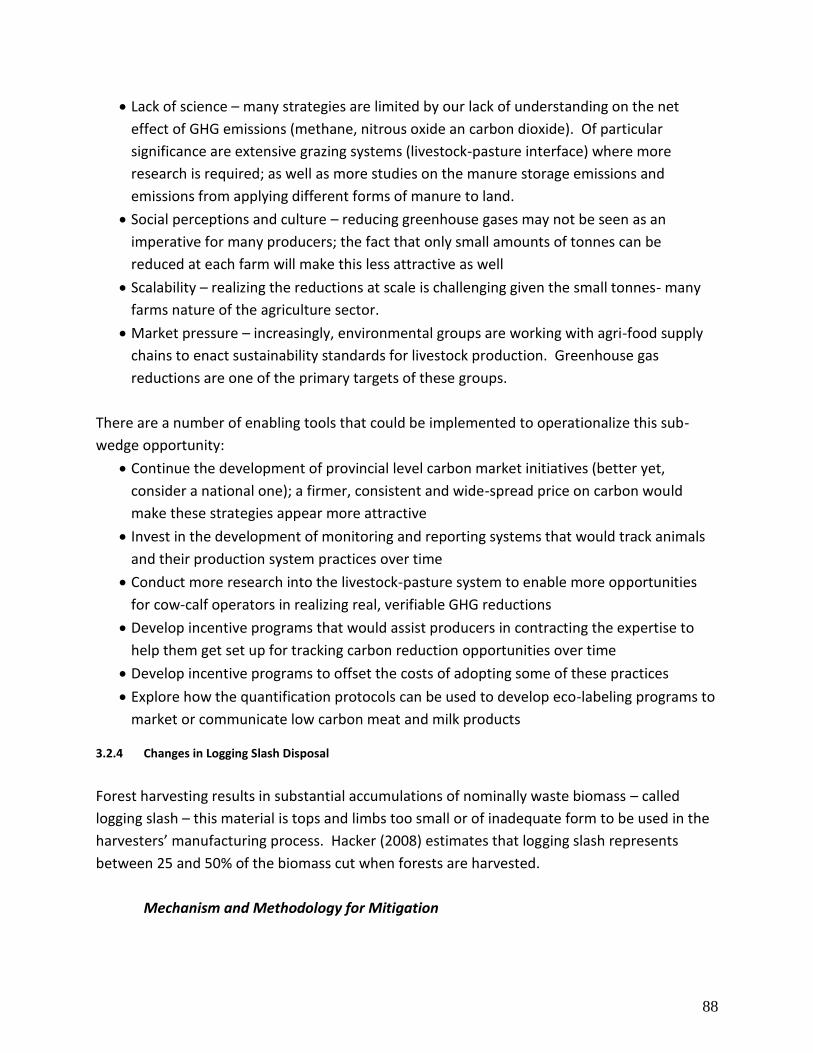
88
Lack of science – many strategies are limited by our lack of understanding on the net
effect of GHG emissions (methane, nitrous oxide an carbon dioxide). Of particular
significance are extensive grazing systems (livestock-pasture interface) where more
research is required; as well as more studies on the manure storage emissions and
emissions from applying different forms of manure to land.
Social perceptions and culture – reducing greenhouse gases may not be seen as an
imperative for many producers; the fact that only small amounts of tonnes can be
reduced at each farm will make this less attractive as well
Scalability – realizing the reductions at scale is challenging given the small tonnes- many
farms nature of the agriculture sector.
Market pressure – increasingly, environmental groups are working with agri-food supply
chains to enact sustainability standards for livestock production. Greenhouse gas
reductions are one of the primary targets of these groups.
There are a number of enabling tools that could be implemented to operationalize this sub-
wedge opportunity:
Continue the development of provincial level carbon market initiatives (better yet,
consider a national one); a firmer, consistent and wide-spread price on carbon would
make these strategies appear more attractive
Invest in the development of monitoring and reporting systems that would track animals
and their production system practices over time
Conduct more research into the livestock-pasture system to enable more opportunities
for cow-calf operators in realizing real, verifiable GHG reductions
Develop incentive programs that would assist producers in contracting the expertise to
help them get set up for tracking carbon reduction opportunities over time
Develop incentive programs to offset the costs of adopting some of these practices
Explore how the quantification protocols can be used to develop eco-labeling programs to
market or communicate low carbon meat and milk products
3.2.4 Changes in Logging Slash Disposal
Forest harvesting results in substantial accumulations of nominally waste biomass – called
logging slash – this material is tops and limbs too small or of inadequate form to be used in the
harvesters’ manufacturing process. Hacker (2008) estimates that logging slash represents
between 25 and 50% of the biomass cut when forests are harvested.
Mechanism and Methodology for Mitigation

89
At present, a small proportion of logging slash is gathered and shipped to cogeneration or
biofuel use facilities. In Alberta, only one forest enterprise actively scavenges logging slash for
use in cogeneration – representing approximately 7% of the total harvest. Another forest
enterprise is examining the potential of scavenging logging slash for cogeneration. This mirrors
the situation across Canada where logging slash is either piled and burned (most of the country)
or left to decay in-situ (southern British Columbia coast.) When piled and burned logging slash
tends not to burn completely due to accumulated soil, snow, green limbs and foliage, and other
contaminants in the pile. This results in an emission of 950 g CO2, 0.05 g CH4 and 0.02 g N2O
per kg of wood burned (National Inventory Report, Annex 8); giving a total CO2e equivalent
emission of 957 g CO2e per kg of fuel burned.
Forest harvest level in Canada is summarized in Table 35, (Natural Resources Canada – State of
Canada’s Forests – 2009.
Table 35. Annual forest harvest in Canada, 2008.
Annual harvest vs. supply
deemed sustainable*
Million cubic
metres 2008
Percentage change
from previous year
Percentage change over
previous 10 years**
Softwood supply 190 -0.4 0.7
Hardwood supply 60 -0.3 -0.2
Softwood harvest 114 -13.2 -2.2
Hardwood harvest 22 -13.4 -3.3
* Includes all land types (provincial, territorial, federal and private)
** Average 1998–2008
Source: National Forestry Database
Conservatively applying Hacker’s lower estimate (25%) of proportion of logging slash gives
potential slash values of 28.5 million m3 of softwood slash and 5.5 million m3 of hardwood
slash, totaling 34 million m3 of slash. (D. Wilkinson, Executive Director, Forest Business Branch
identified an average slash value of 25% of harvest at the Alberta Forest Growth Organization
conference in October 2010 – which supports use of Hacker’s lower bound.) Table 36 provides
a conservative estimate of current emissions from logging slash disposal.
Table 36. Estimate of Current Annual Emissions from Burning Logging Slash.
m3 Tonnes CO2e
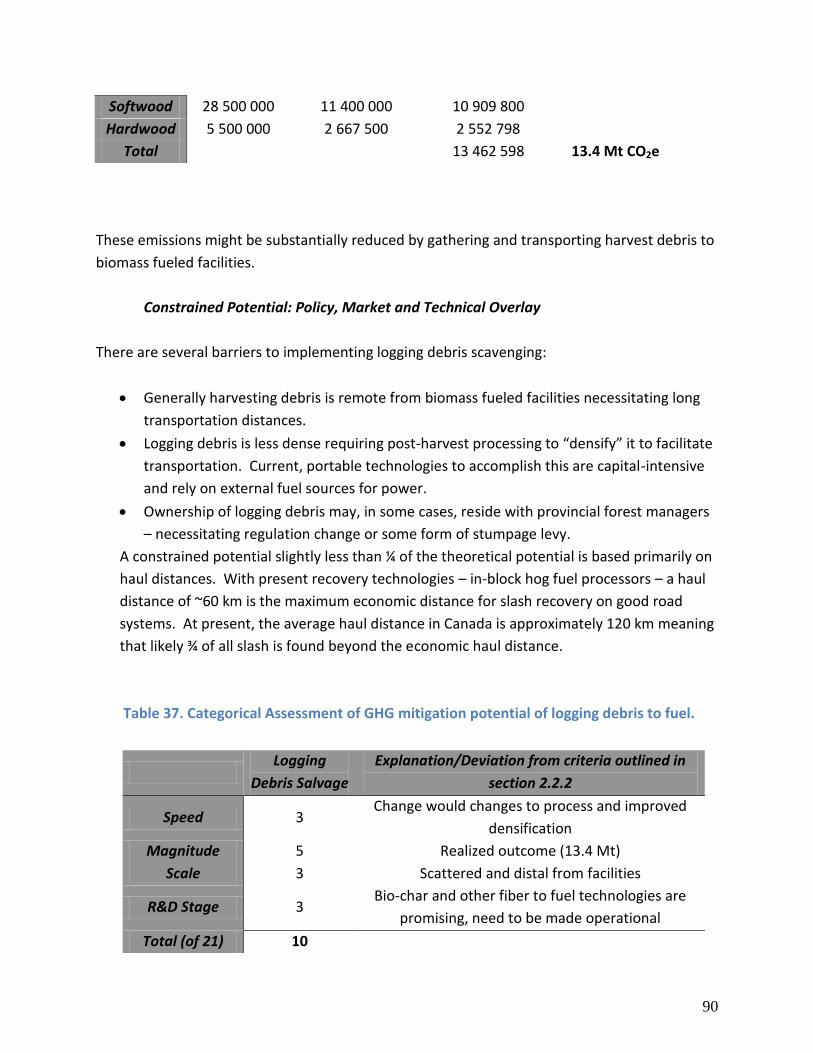
90
These emissions might be substantially reduced by gathering and transporting harvest debris to
biomass fueled facilities.
Constrained Potential: Policy, Market and Technical Overlay
There are several barriers to implementing logging debris scavenging:
Generally harvesting debris is remote from biomass fueled facilities necessitating long
transportation distances.
Logging debris is less dense requiring post-harvest processing to “densify” it to facilitate
transportation. Current, portable technologies to accomplish this are capital-intensive
and rely on external fuel sources for power.
Ownership of logging debris may, in some cases, reside with provincial forest managers
– necessitating regulation change or some form of stumpage levy.
A constrained potential slightly less than ¼ of the theoretical potential is based primarily on
haul distances. With present recovery technologies – in-block hog fuel processors – a haul
distance of ~60 km is the maximum economic distance for slash recovery on good road
systems. At present, the average haul distance in Canada is approximately 120 km meaning
that likely ¾ of all slash is found beyond the economic haul distance.
Table 37. Categorical Assessment of GHG mitigation potential of logging debris to fuel.
Softwood 28 500 000 11 400 000 10 909 800
Hardwood 5 500 000 2 667 500 2 552 798
Total 13 462 598 13.4 Mt CO2e
Logging
Debris Salvage
Explanation/Deviation from criteria outlined in
section 2.2.2
Speed 3 Change would changes to process and improved
densification
Magnitude 5 Realized outcome (13.4 Mt)
Scale 3 Scattered and distal from facilities
R&D Stage 3 Bio-char and other fiber to fuel technologies are
promising, need to be made operational
Total (of 21) 10
91
Operationalizing the Sub-Wedge
Need to develop (or operationalize) self-fueled densification technology.
Ownership of logging debris in volume-based tenures requires clarification.
Infrastructure to use this level of biofuel would need to be put in place.
3.3 Waste Management
3.3.1 Anaerobic Digestion - Agricultural biowaste, straw and plant biomass
Anaerobic digestion (AD) is one of the most promising treatment options, for managing
livestock biowaste, mainly manure, and other agricultural biowastes and biomass including
dead livestock and straw. It is capable of handling both solid organic wastes, such as cattle
manure, and wastes that are too wet for composting or combustion/gasification. The
technology has been proven to be viable for the cold Canadian winters. The technology
processes biowastes, including manure, straw, and other on/non-farm organic wastes as
diverse as from animal carcasses, slaughter house wastes to suspended organics in waste water
to produce biogas (60% CH4 +40% CO2) which can be used directly for heat and electrical energy
generation or, after processing, used as fuel replacement for natural gas.
At the same time, the AD process concentrates nutrients in the un-digested residue, called
digestate, which can be further processed into bio-fertilizer or a soil organic amendment. AD
technology provides the opportunity to recycle nutrients in bio-fertilizer that is compact, has
lower weight and higher nutrient concentration, and therefore has higher value and can be
applied more economically than raw manure and plant biomass. The resistance of organic
carbon in processed bio-fertilizer means little of the soil carbon sequestration potential of
manure and plant biomass is lost in the AD process. Other benefits of AD process include odor
reduction and elimination of pathogens, particularly for processing dead livestock carcasses,
the disposal of which has become a significant cost to the producers (Pell 1997, Eckford and
Gao 2009).
A major component of agricultural biowaste is livestock manure. Current livestock manure
management practices contribute to a significant portion of GHG emission (12%) by the
Canadian agricultural sector (NIR 1990-2008, Statistic Canada 2010). Over 75% of the manure
can be collected and processed to offset GHG emissions. Table 40 shows amounts of collectable
manure produced annually. Particularly for hog manure, it emits over 2 t CO2e/t.

92
Table 38. Collectable annual manure production and associated GHG emissions under current
management in Canada.
Canada has 36.4 Mha of croplands, of which more than 85% (32 Mha) are on the Canadian
Prairies (Sokhansanj et al. 2006). Cereal crop production on the prairies produces an estimated
average of 37 Mt/yr of straw. Assuming on average 1 t/ha is left in the field for protection
against wind and water erosion, and 5 kg/day-head is needed for cattle bedding and feeding
when it is required, an average of 15 Mt/yr (range 2.3—27.6 Mt/yr) of cereal straw could
potentially be available for processing for the three Prairie Provinces (Sokhansanj et al. 2006).
Municipal wastewater treatment systems frequently utilize AD processes to reduce organic
solids in wastewater. However, existing facilities do not maximize the utilization of biogas
generated from the treatment process and much of the nitrogen in wastewater is lost to the
atmosphere through de-nitrification. There is an opportunity to improve the current practice,
by fully utilizing the biogas being produced and by capturing and recycling plant nutrients, to
achieve significant offset of GHG emissions, as well as eliminate pathogens (Pang et.al 2009).
This section assesses the opportunity of using AD technology to process these agricultural
biowastes, as well as available cereal straw and other plant biomass.
Mechanism and Method for Mitigation
The mechanisms to reduce GHG emission associated with biowaste include 1) reduction of
retention time in storage under current system, 2) displacement of electricity and fossil fuel
with bioenergy, 3) displacement of inorganic fertilizer and improvement of fertilizer efficiency
(biofertilizer – Section 3.4; Biomaterials), and 4) enhancement of soil carbon sequestration (soil
organic amendment, Section 3.3.1 above). Under the Alberta GHG offset system there are
three protocols available for quantifying this mitigation potential:
Anaerobic decomposition of agricultural materials,

93
Anaerobic treatment of wastewater,
Agricultural N2O emission reduction.
However, these protocols do not address reduction of retention time of waste onsite and in
storage to reduce GHG emission, displacement of inorganic fertilizer, and soil carbon
sequestration.
Quantification: Theoretical Mitigation Potential
Livestock waste (manure and dead livestock): The total collectable manure potentially available
for AD processes is 13.8 Mt/yr (Table 38). For this amount, GHG emission under the baseline
condition of 425 kg CO2e/t,yr (NIR 1990-2008) gives a total emission rate of 6.3 Mt CO2e/yr.
By adopting AD technology, much of the current emissions could be avoided because of the
minimal retention time both onsite and in storage. If treated by AD and bio-fertilizer
technologies, the 13.8 Mt/yr of collectable manure could generate 9.1 TWh of renewable
energy (Monreal et. al 2010), offsetting 1.8 Mt CO2e/yr of GHG emission.
MacGregor (2010) projected, based on the Agricultural Anaerobic Digestion Calculation
Spreadsheet (AADCS) developed by Ontario Ministry of Agriculture, Food and Rural Affairs
(OMAFRA), and based on German experience, that under high levels of adoption, where AD
systems can process manure generated from three major categories of livestock: dairy cattle,
beef cattle and hog; a total of 1.4 Mt CO2e /yr GHG emission offset could be reached, close to
the 1.3 Mt CO2e/yr estimated above for renewable energy generation.
Cereal Crop Straw:
The three Prairie Provinces, which account for more than 85% of Canada’s arable crop land,
produces, on average, 15 Mt/yr of “surplus” straw from cereal crops that is potentially available
for industrial utilization without negatively impacting soil quality or livestock requirements
(range 27.6—2.3 Mt/yr based on 9 years of data, Sokhansanj et al. 2006). This material is
suitable for AD processes (Appendix 1). If this material is processed through AD technology it
will result in 9.9 TWh/yr electricity and offset GHG emission of 2 MtCO2e/yr using the same
emission factor.
Wastewater: Total solids, primarily organic, in municipal wastewater potentially available for
AD process is 2.2Mt (Statistics Canada 2009, Edmonton Gold Bar Wastewater Treatment Plant).
GHG emission rate under the current handling system is 27.8 kg CO2e/per capita/ yr,
contributing to a national total of 0.94 Mt CO2e/yr (NIR 1990-2008). According to the Eco-
Efficiency Centre fact sheet of Dalhousie University (2008), the Canadian food and beverage
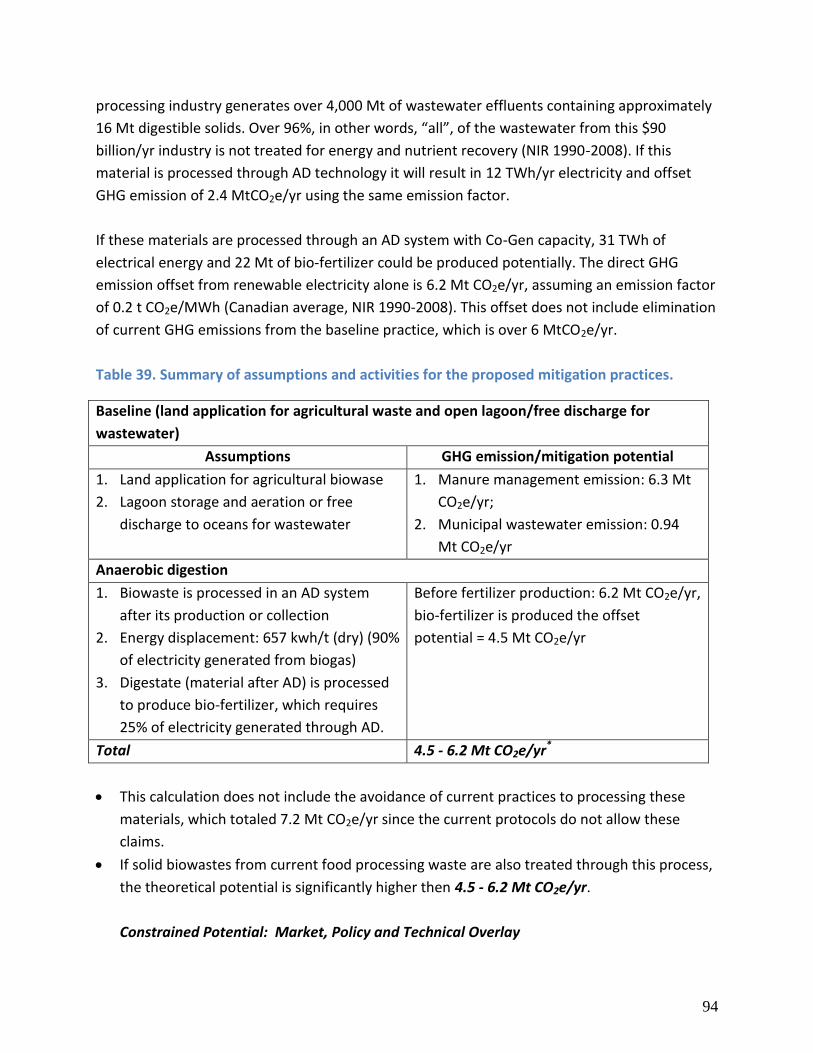
94
processing industry generates over 4,000 Mt of wastewater effluents containing approximately
16 Mt digestible solids. Over 96%, in other words, “all”, of the wastewater from this $90
billion/yr industry is not treated for energy and nutrient recovery (NIR 1990-2008). If this
material is processed through AD technology it will result in 12 TWh/yr electricity and offset
GHG emission of 2.4 MtCO2e/yr using the same emission factor.
If these materials are processed through an AD system with Co-Gen capacity, 31 TWh of
electrical energy and 22 Mt of bio-fertilizer could be produced potentially. The direct GHG
emission offset from renewable electricity alone is 6.2 Mt CO2e/yr, assuming an emission factor
of 0.2 t CO2e/MWh (Canadian average, NIR 1990-2008). This offset does not include elimination
of current GHG emissions from the baseline practice, which is over 6 MtCO2e/yr.
Table 39. Summary of assumptions and activities for the proposed mitigation practices.
Baseline (land application for agricultural waste and open lagoon/free discharge for
wastewater)
Assumptions GHG emission/mitigation potential
1. Land application for agricultural biowase
2. Lagoon storage and aeration or free
discharge to oceans for wastewater
1. Manure management emission: 6.3 Mt
CO2e/yr;
2. Municipal wastewater emission: 0.94
Mt CO2e/yr
Anaerobic digestion
1. Biowaste is processed in an AD system
after its production or collection
2. Energy displacement: 657 kwh/t (dry) (90%
of electricity generated from biogas)
3. Digestate (material after AD) is processed
to produce bio-fertilizer, which requires
25% of electricity generated through AD.
Before fertilizer production: 6.2 Mt CO2e/yr,
bio-fertilizer is produced the offset
potential = 4.5 Mt CO2e/yr
Total 4.5 - 6.2 Mt CO2e/yr*
This calculation does not include the avoidance of current practices to processing these
materials, which totaled 7.2 Mt CO2e/yr since the current protocols do not allow these
claims.
If solid biowastes from current food processing waste are also treated through this process,
the theoretical potential is significantly higher then 4.5 - 6.2 Mt CO2e/yr.
Constrained Potential: Market, Policy and Technical Overlay

95
Current market: current manure management practices are not fully realizing manure’s
economic value. In most areas with concentrated livestock operations, as well as in areas
surrounding many urban centers, soil nutrient contents have reached levels much higher that
what is needed for optimum crop production. Manure continues to be applied on these lands
because it is not economical to transport and apply them further down the road. Government
regulations limit manure application in excess of nutrient limits – hindering expansion of the
industry.
The livestock industry requires innovative technologies to help managing its waste to maintain
it’s social license to operate in an increasingly competitive global market. Anaerobic digestion
combined with bio-fertilizer production is one of the most promising technologies to address
this issue, but it requires proper policy incentives to kick-start the industry and help it reaching
critical mass.
Capital cost of $3500-$6000/kw is a significant barrier for the adoption of AD technology. This
barrier cannot be expected to be reduced significantly until the AD industry has reached its
critical mass. MacGregor (2010) suggested that governments could provide the right economic
environment for commercial uptake of AD technology through financial incentives and through
development of institutions such as a carbon market, or feed-in-tariffs. Ontario and Alberta
governments are taking the lead in this direction.
In the meantime, technical enhancements that improve efficiency, efficient technologies for
recovery of nutrients to be blended with the bio-fertilizer or sold alone, and developing
markets and uses for by-products including bio-fertilizer and heat energy will enhance
economics of AD technology and its uptake.
Table 40. Categorical assessment of anaerobic digestion.
Waste-AD
Explanation/Deviation from criteria described in
section 2.2.2
Speed 4 Can be quickly implemented if incentive to use by-
products is in place
Magnitude 5 It has a 5.0 Mt/yr potential
Scale 3 Capital cost impairs market uptake
R&D Stage 4 At the commercialization stage, requires R&D to reduce
production costs and increase by-product value
Total (of 21) 16
96
Co-benefits: Please see bio-fertilizer and organic amendment sections. In addition the co-
benefits of this waste management practice will eliminate the potential pathogens associated
with these wastes, particularly from dead livestock and municipal wastewater.
Risks: Major risks for AD technology include unplanned releases of biogas and improper
management of digestate. Uncertainty in the availability of biomass, such as cereal crop straw,
is an important risk factor. Industrial facilities require a steady supply of feedstock. Available
plant biomass, however, varies widely from year to year depending on climate, market
conditions, changes in cultivation practice, and phases of crop rotation. Willingness of
producers to sell straws is also not certain. One survey found only 1 in 4 famers are willing to
consider selling straw.
The estimation of constrained potential is based on availability of materials and predicted AD
uptake by MacGregor (2010):
1. 40% of collectable manure (MacGregor, 2010), 60% of biowaste from wastewater
(CCME, 2009) and less than 30% of straw can be processed through AD; and
2. while applying AD for processing these wastes additional 15% of energy can be
recovered by using co-substrates, such as biowaste from food processing solid
wastes.
Operationalizing the Sub-Wedge
Revise current AD protocols to include upstream and downstream management for
calculating avoided emissions.
Provide estimates of GHG reductions under AD management and improve the ability to
compare multiple scenarios in a C footprint context, as well as provide estimates of
economic impacts on producers.
Invest in training program at colleges or institution for training AD operators.
Invest in colleges or institutions to produce a national inventory of biowaste regarding its
size, geological distribution and energy/nutrient potential.
Require incentives for applying organic amendments and quantification protocol for GHG
emission offsets or feed-in tariff program.
Require incentive for applying bio-fertilizer, as well as quantification protocol for GHG
emission offsets.

97
Figure 14. Biogas Potential of barley straw in comparison with beef cattle manure and silage
in laboratory incubation. Digested beef cattle manure from a commercial site used as an
inoculant.
3.3.2 Reductions in Emissions from the Management of Solid Wastes
The disposal of the organic portion of solid waste in landfills under anaerobic conditions allows
naturally occurring microbes to break down the organic constituents of the waste to form the
greenhouse gases methane and carbon dioxide. The composition of the landfill gas is
approximately 50% methane (CH4) and 50% carbon dioxide (CO2). The net emissions footprint
from the disposal of this waste is 20 MT annually, according to the latest published National
Inventory for Canada (1990 to 2008) (Environment Canada 2010).
For the purposes of this section, solid wastes include municipal solid waste (MSW) composed of
a mixture of organic and inorganic materials from a variety of industrial, institutional,
residential and commercial facilities. According to the most recent published survey from
Environment Canada, approximately 27.3 million tonnes of waste were disposed of in 2006, up
8% from 2004 (Statistics Canada 2008b). From the same survey, approximately 7.7 million
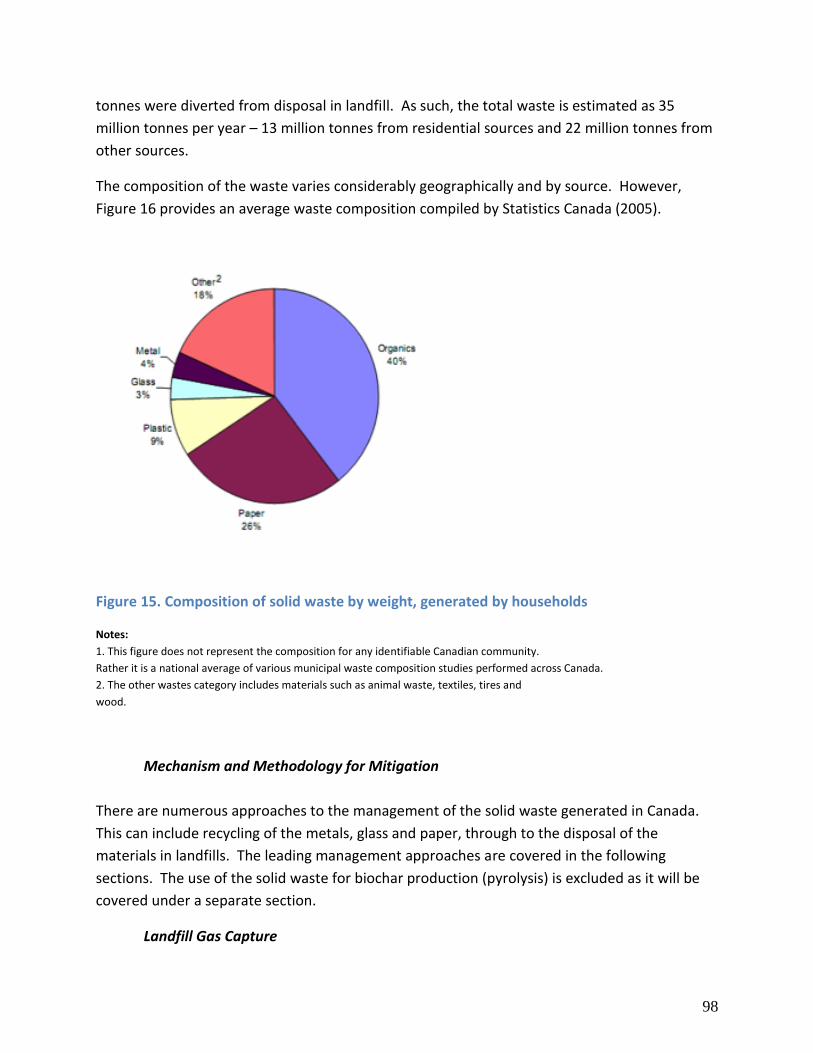
98
tonnes were diverted from disposal in landfill. As such, the total waste is estimated as 35
million tonnes per year – 13 million tonnes from residential sources and 22 million tonnes from
other sources.
The composition of the waste varies considerably geographically and by source. However,
Figure 16 provides an average waste composition compiled by Statistics Canada (2005).
Figure 15. Composition of solid waste by weight, generated by households
Notes:
1. This figure does not represent the composition for any identifiable Canadian community.
Rather it is a national average of various municipal waste composition studies performed across Canada.
2. The other wastes category includes materials such as animal waste, textiles, tires and
wood.
Mechanism and Methodology for Mitigation
There are numerous approaches to the management of the solid waste generated in Canada.
This can include recycling of the metals, glass and paper, through to the disposal of the
materials in landfills. The leading management approaches are covered in the following
sections. The use of the solid waste for biochar production (pyrolysis) is excluded as it will be
covered under a separate section.
Landfill Gas Capture
99
Landfill gas capture with flaring or utilization, referred to in the following section as “LFG
Capture”, consists of the installation of a piping network through the landfill connected to a
pump that creates a suction to capture landfill gas and hence reducing the amount of gas that
escapes into the atmosphere. GHG reductions are realized through the destruction of the
methane in the landfill gas and the displacement of grid electricity or fossil fuel derived heat.
There were 51 sites (Canada’s Action on Climate Change 2010) with active LFG Capture projects
as of the latest national inventory. Others have subsequently come online (i.e. City of Regina),
but the biennial survey results for 2009 are not yet available or could not be found. The
facilities achieved emission reductions estimated as part of the national inventory as being 6.9
Mt CO2e in 2007.
Aerobic Landfill Bioreactors
Alternatively, landfills can be operated under aerobic conditions through the injection of air
into the landfill and the regulation of the moisture content. These projects are referred to as
Aerobic Landfill Bioreactors, and have been implemented in other jurisdictions (US and Israel).
These projects reduce the methane generation capacity of the waste in landfill to 85% of their
existing potential, more quickly than does landfill gas. However, these projects do not have the
opportunity to generate electricity or heat as co-benefits. Further, there are no active Landfill
Bioreactor projects in Canada with multiple in the planning stage.
Composting
Diverting the organic component of the solid waste stream for composting avoids the potential
for methane emissions from the material were it placed in a landfill. The material is converted
aerobically to carbon dioxide using any number of approaches. This can include highly
mechanized in-vessel approaches as well as open windrow. Nutrients contained in the finished
compost can then be returned to the land. This provides additional benefits.
In 2006, data was compiled by Statistics Canada on composting in Canada (Statistics Canada
2006). According to that study, composting accounted for approximately 2.0 Mt of waste
diverted from landfill each year. This represented an increase of approximately 32% relative to
2002. Sixty-five percent of the composted material comes from residential sources, with the
remainder coming from other sources. Composting accounts for 26% of the total waste
material diverted from landfill.
Anaerobic Digestion
100
The organic component of the solid waste can also be diverted for anaerobic digestion. These
materials may be digested on their own, or in combination with manures. The methane
produced through the digestion process can either be combusted for heat and/or electricity,
run through a fuel cell, or sold as a biogas. Nutrients contained in the digestate and any liquid
byproducts can then be returned to the land.
There is not much data on potential and existing anaerobic digestion of solid wastes. Most of
the content is focused on digestion of sludges and manures. The only facility known to the
authors that is solely purposed for municipal waste is operated by The City of Edmonton.
Incineration and Related Thermal Treatments
The solid waste (inorganics and organics) material can also be incinerated or thermally treated
to convert the waste to energy. There are a number of technologies for this including some
older incinerators, plasma-based conversion technologies and the use of refuse derived fuels.
The latter two of these technologies can be used to produce heat and/or electricity
There is little recent data available on incineration. The most updated information found from
Statistics Canada, stated that in 2000, there were 21 incinerators in operation in Canada,
processing 1.1 Mt of material.
Each of the project types, with the exception of pure incineration of waste, has a quantification
protocol under the Alberta Offset System (Climate Change Central 2009). Further, there are
quantification protocols available under the Clean Development Mechanism (exception is
incineration and related) and Climate Action Reserve (Compost, Co-Digestion, Landfill Gas). The
science and quantification represented in these protocols is robust and highly confident.
Quantification: Theoretical Mitigation Potential
Baseline Assumptions and Data Sources: Solid Wastes
Landfill gas systems have typical capture efficiencies of 75% for the period that they are
operational (USEPA 2010a) and may only be economic in larger landfills. The LFG systems are
not operated over the full time-scale that the waste is in place, as they cannot be implemented
in the operating section of the landfill and become inefficient in the tail end of the operation.
The potential for aerobic bioreactor projects is considerable as the reduction in emissions
extends forward over time. By reducing the methane potential of the material in the landfill,
the annual emissions of LFG are greatly reduced on a go-forward basis. However, the material
may produce methane once in landfill, prior to the initiation of the aerobic treatment process.
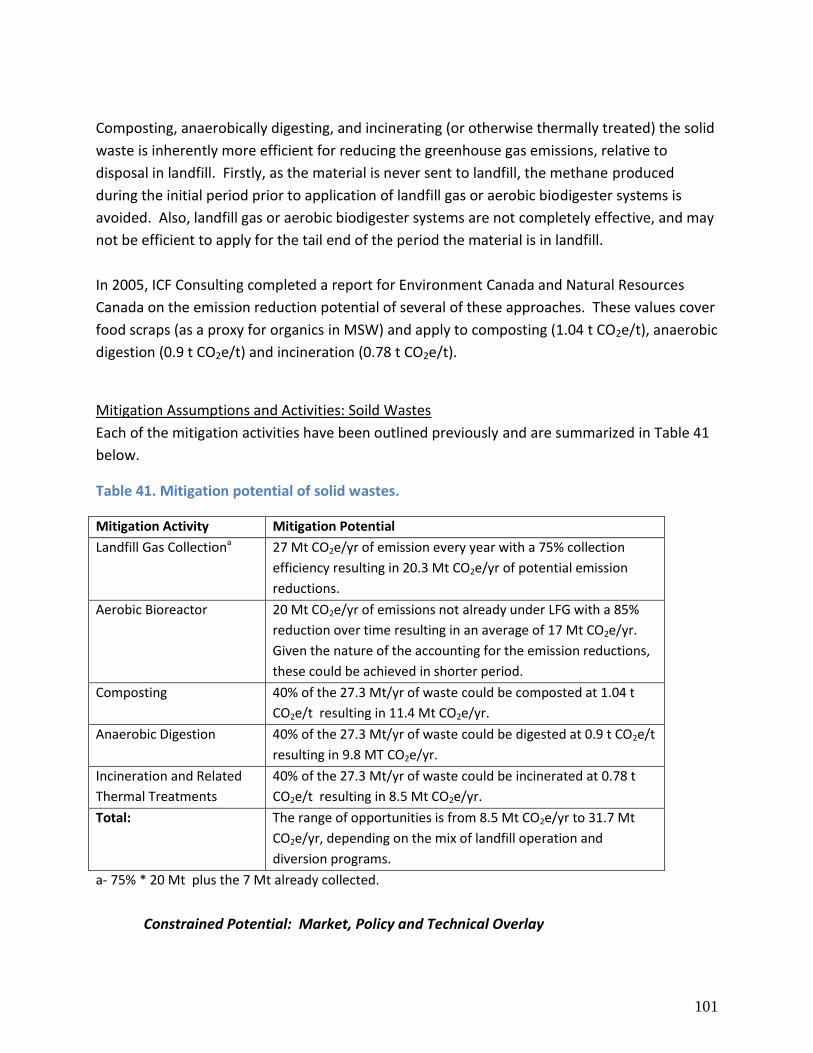
101
Composting, anaerobically digesting, and incinerating (or otherwise thermally treated) the solid
waste is inherently more efficient for reducing the greenhouse gas emissions, relative to
disposal in landfill. Firstly, as the material is never sent to landfill, the methane produced
during the initial period prior to application of landfill gas or aerobic biodigester systems is
avoided. Also, landfill gas or aerobic biodigester systems are not completely effective, and may
not be efficient to apply for the tail end of the period the material is in landfill.
In 2005, ICF Consulting completed a report for Environment Canada and Natural Resources
Canada on the emission reduction potential of several of these approaches. These values cover
food scraps (as a proxy for organics in MSW) and apply to composting (1.04 t CO2e/t), anaerobic
digestion (0.9 t CO2e/t) and incineration (0.78 t CO2e/t).
Mitigation Assumptions and Activities: Soild Wastes
Each of the mitigation activities have been outlined previously and are summarized in Table 41
below.
Table 41. Mitigation potential of solid wastes.
Mitigation Activity Mitigation Potential
Landfill Gas Collectiona 27 Mt CO2e/yr of emission every year with a 75% collection
efficiency resulting in 20.3 Mt CO2e/yr of potential emission
reductions.
Aerobic Bioreactor 20 Mt CO2e/yr of emissions not already under LFG with a 85%
reduction over time resulting in an average of 17 Mt CO2e/yr.
Given the nature of the accounting for the emission reductions,
these could be achieved in shorter period.
Composting 40% of the 27.3 Mt/yr of waste could be composted at 1.04 t
CO2e/t resulting in 11.4 Mt CO2e/yr.
Anaerobic Digestion 40% of the 27.3 Mt/yr of waste could be digested at 0.9 t CO2e/t
resulting in 9.8 MT CO2e/yr.
Incineration and Related
Thermal Treatments
40% of the 27.3 Mt/yr of waste could be incinerated at 0.78 t
CO2e/t resulting in 8.5 Mt CO2e/yr.
Total: The range of opportunities is from 8.5 Mt CO2e/yr to 31.7 Mt
CO2e/yr, depending on the mix of landfill operation and
diversion programs.
a- 75% * 20 Mt plus the 7 Mt already collected.
Constrained Potential: Market, Policy and Technical Overlay

102
There are a number of potential constraints on the implementation on any of these
technologies. Each of these constraints are summarized in Table 42 relative to each of the
mitigation activities:
Table 42. Mitigation Activity Constraints of Solid Wastes.
Mitigation Activity Constraints
Landfill Gas Collection Technical issues associated with application at certain
configurations of sites and small sites.
Not applicable to open cells in landfills.
Aerobic Bioreactor As of yet unproven technology.
Uncertain fit with LFG capture legislation.
No other economic returns.
Composting Odor issues remain a concern
Shift to source separated organics is on-going and not as
effective in some settings
Anaerobic Digestion Economic challenges relative to other options
Incineration and Related
Thermal Treatments
Public perception is poor as air emissions issues remain
prevalent without extensive controls for existing technologies.
New technologies continue to undergo commercialization.
Table 43. Categorical Assessment of Solid Waste Strategies.
Landfill
Gas
Aerobic
Bioreact
or
Composti
ng
Anaerobi
c
Digester
Incinerati
on and
other
Thermal
Explanation/ Deviation from
Criteria in Section 2.2.2
Speed 5 3 5 3 1
Permitting issues, project
economics and public
perception may limit speed
Magnitud
e 5 3 3 3 3
Magnitude of all but LFG
constrained by regulatory,
market or other issues.
Scale 3 3 3 3 3
The generation and disposal
of waste is widely dispersed.
Small sites are prevalent.

103
R&D
Stage 5 4 5 5 5
Only bioreactors have not
been tried in Canada.
Total (of
21) 18 13 16 14 12
Taking these constraining factors into consideration and acknowledging that multiple uses of
the same feedstock are not possible, the resulting potential are estimated for each mitigation
activity. For LFG and aerobic bioreactors, this will likely account for approximately 50% of the
emissions from the waste in place or approximately 13 Mt/yr. This would represent a doubling
of the current emission reductions from these activities.
For composting and anaerobic digestion, a similar doubling of activity is likely to approximately
5 Mt/yr. This is most likely with some additional policy implementation to support diversion of
organics from landfills. Incineration emission reductions are likely to remain largely flat with
limited growth from the emerging thermal conversion technologies. The potential is suggested
to be up to 2 Mt/yr, representing almost a doubling of activity.
Operationalizing the Sub-Wedge
To assist in operationalizing this sub-wedge:
Recognize benefit from landfill diversion relative to landfilling of organics through
policies and other means (i.e. elevated tipping fees).
Support development of markets for end products from compost and anaerobic
digestors.
Complementary programs to support electricity production from landfill gas, anaerobic
digestion and thermal treatments (i.e. RPS or FIT programs).
Support municipal project development through agencies such as the Federation of
Canadian Municipalities.
Acknowledge the equivalency of alternatives to LFG for meeting passive landfill gas
emission reductions.
3.3.3 Biochar Production and Use
Biochar is produced through the pyrolysis of organic feedstocks in the absence of oxygen.
Biochar production may employ a variety of different processes and approaches. Slow pyrolysis
is characterized by lower temperatures over longer residence times. These characteristics
104
support the optimization of biochar production. Fast pyrolysis is characterized by higher
temperatures which allow for shorter residence times. This process optimizes energy
production, primarily in the form of bio-oil production. Flash pyrolysis, is a mid-point between
slow and fast pyrolysis in that it produces, under pressure, higher yields of biochar with higher
temperatures and shorter residence times. Gasification produces the smallest volume of
biochar while maximizing gas production. Lastly, hydrothermal conversion is the newest of
these processes, converting a wet feedstock to a less stable char – but with a higher biochar
yield.
The potential feedstocks for biochar include forestry and agriculture crops and residues,
municipal solid wastes (organic component), livestock wastes, and other sources of organics.
The feedstocks are then processed with heat in the absence of oxygen for a sufficient period as
to render a significant portion of the carbon in the material stabilized as a solid biochar (which
has a mean residence time in soils on the order of 1,000 to 10,000 years)
The biochar can then be used as an additional tool in agriculture and/or land management. For
example, biochar may be applied to agricultural soils, where it improves soil quality; it may be
used as a product for turfgrass establishment; it can be substitute for peat or coconut shells in
horticultural applications; it may be used in land restoration; or it may be used as a means of
mitigating water pollution. In each situation, biochar containing stabilized carbon is nearly
permanently sequestering the carbon therein. In some cases, the biochar may be stored
permanently as fill in mining operations or similar applications to traditional carbon capture
and storage (CCS) techniques. The use of biochar as a solid biofuel would not be considered as
applicable to these project types, as there is no sequestration of the carbon.
During the pyrolysis process, various energy-rich gas and liquid streams may be produced.
These energy streams may be used to offset the use of fossil fuels, to produce electricity or
used parasitically within the pyrolysis process.
Mechanism and Methodology for Mitigation
Under business as usual, the feedstocks for biochar would otherwise be burned or decompose.
Disposing of the feedstocks releases carbon dioxide and black carbon (BC). Decomposition can
result in either the releasing either carbon dioxide (if decomposition occurs under aerobic
conditions), methane (if decomposition occurs under anaerobic conditions), or nitrous oxides
under fluctuating conditions (aerobic / anaerobic). The process and production of biochar
stabilizes these organic sources such that decomposition happens over thousands of years, not
a few years, and avoids these emissions.
105
Production and use of biochar offers great potential for greenhouse gas emission reductions
and the removal of carbon dioxide from the atmosphere through carbon capture and
sequestration, and renewable energy production. The mechanisms for achieving emission
reductions from the production or use of biochar extend across the project lifecycle.
There are no approved quantification protocols available for biochar projects in North America.
However, there is currently an initiative (Biochar Protocol Development 2010) for the
development of a protocol under the Voluntary Carbon Standard and Alberta Offset System.
The science and quantification approaches under this protocol initiative draw on aspects of
existing protocols and current best practice.
Quantification: Theoretical Mitigation Potential
Baseline Assumptions and Data Sources: Biochar
The BIOCAP Canada Foundation estimated the potential agriculture and forestry feedstock in
Canada for use in biochar (BIOCAP Canada Foundation 2003) as approximately 60 million
tonnes per year. This is said to represent approximately 40% of the total biomass harvest.
However there would be other uses for this feedstock for use in bioproducts, digestors and
composting operations.
Assuming no land-use change and no related change in the management of forest/agricultural
systems, all of the carbon (45% to 50% by mass (Bioenergy Feedstock Information Network
2005)) in these feedstocks is available for sequestration. Further, an assumption of 80%
feedstock use efficiency would be applied to account for wastage in processing.
In addition, there is the potential to use solid waste feedstocks. According to the most recent
published survey from Environment Canada, approximately 27.3 million tonnes of waste were
disposed of in 2006, up 8% from 2004 (Statistics Canada 2008b). From the same survey,
approximately 7.7 million tonnes were diverted from disposal in landfill. As such, the total
waste is estimated as 35 million tonnes per year – 13 million tonnes from residential sources
and 22 million tonnes from other sources.
The composition of the waste varies considerably geographically and by source. However,
Figure X provides an average waste composition compiled by Statistics Canada (2005). This
reports organics as 40% of the waste, by mass.

106
The conversion of the feedstock to biochar ranges in efficiency from 20 to 30%, on a mass basis,
depending on the pyrolysis technology, feedstock, temperature and residency time (Amonette
and Joseph 2009, Woolf et al. 2010).
Mitigation Assumptions and Activities: Biochar
Assuming all available feedstock is converted to biochar, the calculation of the emission
reduction potential would include the diversion of the organic wastes from landfill and the
sequestration of the carbon in the biochar. The benefits from reduced fertilizer use and
increased crop production, as may occur, are excluded.
To calculate the benefit from diverting the organics from landfill, the emission reduction
potential would be similar to that within the compost, anaerobic digestion and incineration.
The emission reduction potentials are 1.04 t CO2e/t (composting), 0.9 t CO2e/t (anaerobic
digestion) and 0.78 t CO2e/t (incineration) (ICF Consulting 2005). Given the thermal nature of
the conversion of biomass to biochar, applying the factor for incineration appears most
appropriate.
As such, the emission reductions from conversion of the solid waste would be calculated as
follows:
Mass of Solid Waste: 27.3 Mt/yr
Percent Organic: 40%
Emission Reduction Factor: 0.78 t CO2e per tonne
Emission Reduction: 8.5 Mt CO2e/yr
The emission benefit for the conversion of the biomass to biochar would be calculated as
follows:
Mass of Biomass: 27.3 Mt/ yr (* 40%) + 60 Mt/yr = 70.9 Mt/yr
Conversion Factor: 20% to 30%
Carbon to CO2e: 44/12
Emission Reduction: 52 to 78 Mt CO2e
As such, the total theoretical emission reduction potential is between 60.5 and 86.5 Mt CO2e
year. These values are consistent with the potential for Alberta summarized by Alberta
Innovates Technology Futures (Anyia et al. 2010).
Constrained Potential: Market, Policy and Technical Overlay
There are a wide range of constraints on the development of biochar, discussed below:

107
1. Markets for Biochar. There are limited markets for biochar as a soil amendment or for
other uses. The benefits for producers have not yet been demonstrated broadly across
the range of chars and applications. The economics of biochar projects must assign
some value for the resulting biochar. Alternatively, projects will optimize for energy
production, which will decrease biochar production.
2. Financing for Projects. There are few industrial scale biochar projects in operation. The
returns include waste handling fees, energy produced and the biochar. Carbon credits
are not yet a reality for these projects – without a protocol. Each of these value
mechanisms have significant uncertainties (consistency of feedstock, energy production,
char quality/market).
3. Availability of and Competition for Feedstocks: The distribution of feedstocks is spread
across Canada and varies season-to-season with the core agricultural production. As
such, there will be difficulty in optimizing use of the feedstock at a scale that would
cover all available feedstocks. Further, a portion of the feedstock is currently being
recycling nutrients through incorporation directly to land, composting and anaerobic
digestion, creating competition for the feedstock.
4. Lack of consistent standards to determine biochar quality. Chars differ in their stability
and longevity in soils. Standardization needs to occur, and testing of the stability of
chars in soils in Canada.
Table 44. Categorical Assessment of Biochar.
Biochar Explanation/Deviation from criteria outlined in section
2.2.2
Speed 5 Numerous projects awaiting financing. Largely pending
connection with grids and markets for biochar.
Magnitude 5 Significant opportunity based largely on sequestration of
carbon in biochar.
Scale 3 Projects will have to be distributed among project sites
R&D Stage 3
Range of technologies being developed across the project
scales and feedstocks. No large scale implementation
projects
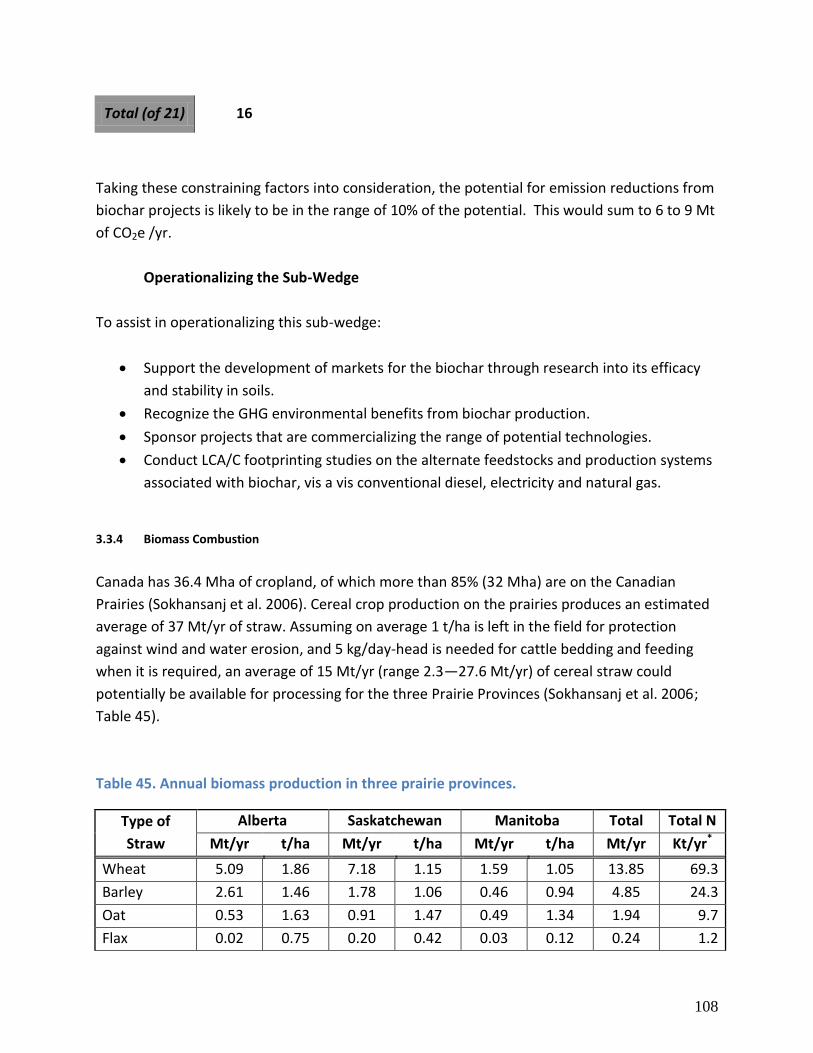
108
Total (of 21) 16
Taking these constraining factors into consideration, the potential for emission reductions from
biochar projects is likely to be in the range of 10% of the potential. This would sum to 6 to 9 Mt
of CO2e /yr.
Operationalizing the Sub-Wedge
To assist in operationalizing this sub-wedge:
Support the development of markets for the biochar through research into its efficacy
and stability in soils.
Recognize the GHG environmental benefits from biochar production.
Sponsor projects that are commercializing the range of potential technologies.
Conduct LCA/C footprinting studies on the alternate feedstocks and production systems
associated with biochar, vis a vis conventional diesel, electricity and natural gas.
3.3.4 Biomass Combustion
Canada has 36.4 Mha of cropland, of which more than 85% (32 Mha) are on the Canadian
Prairies (Sokhansanj et al. 2006). Cereal crop production on the prairies produces an estimated
average of 37 Mt/yr of straw. Assuming on average 1 t/ha is left in the field for protection
against wind and water erosion, and 5 kg/day-head is needed for cattle bedding and feeding
when it is required, an average of 15 Mt/yr (range 2.3—27.6 Mt/yr) of cereal straw could
potentially be available for processing for the three Prairie Provinces (Sokhansanj et al. 2006;
Table 45).
Table 45. Annual biomass production in three prairie provinces.
Type of
Straw
Alberta Saskatchewan Manitoba Total Total N
Mt/yr t/ha Mt/yr t/ha Mt/yr t/ha Mt/yr Kt/yr*
Wheat 5.09 1.86 7.18 1.15 1.59 1.05 13.85 69.3
Barley 2.61 1.46 1.78 1.06 0.46 0.94 4.85 24.3
Oat 0.53 1.63 0.91 1.47 0.49 1.34 1.94 9.7
Flax 0.02 0.75 0.20 0.42 0.03 0.12 0.24 1.2

109
Total 8.78 1.81 9.75 1.09 2.40 0.92 20.93 105
Total
Available 5.57 7.94 1.51 15.02 75 *N content of straws vary considerably with crop, fertilizer, soil and climate. Reported values are generally between 0.4% and
0.9%, with significant overlap among different crop species. An average value of 0.5% is used here, considered to be somewhat
conservative.
This section assesses carbon emission implications of two biomass management options, AD+biofertilizer and direct
combustion.
Mechanism and Methods for Mitigation
The option of using AD and bio-fertilizer technologies is discussed in Organic Amendments and
Waste Management sections. Anaerobic digestion of straw produces biogas, which could be
used to produce electrical power or used as a fuel replacement for natural gas. Digestate
produced by AD has a high concentration of nutrients and can be processed into bio-fertilizer.
Storage of stable organic carbon resulting from bio-fertilizer application leads to further GHG
emission offset by soil carbon sequestration. This has been previously discussed.
Another option is to use available straw from cereal crops directly as source of green energy,
including direct combustion for power generation and processing through gasification
technologies. Combustion of straw generates green power and offsets GHG emissions. Most of
the nitrogen and sulfur in the straw, and a large portion of phosphorus, however, are lost to the
atmosphere, generating air pollution by SOx and NOx. These are not considered in this
assessment.
In contrast to fossil fuel products, biomass fuels including straw can be highly variable in terms
of moisture content, heating value, and availability. In particular, heating value of biomass is
greatly influenced by moisture content. The assessment below is therefore performed at two
assumed moisture contents, 45% for wet and 15% for dry straws. Both AD and direct
combustion require harvesting and transportation of straw to localized facilities. Emissions
from these activities make up a small fraction of the total emission, smaller than the
uncertainties in the conversion coefficients used in the assessment. As such they are not
included in the assessment. The main activities considered in this section are:
Anaerobic decomposition of agricultural materials,
Diversion of biomass to energy from biomass combustion facility
Quantification: Theoretical Mitigation Potential

110
Anaerobic Digestion and BioFertilizers:
An average of 15 Mt/yr of straw could produce 9.9 TWh of electrical power with AD technology,
resulting in a mitigation potential of 2.0 Mt CO2e/yr. The resulting bio-fertilizer contains 3.75
Mt of organic carbon and 75,000 t of nitrogen. Displacing 75,000 t of chemical fertilizer results
in 0.2 Mt CO2e/yr of emission offsets for fertilizer production alone. Lower N2O emission from
bio-fertilizer compared to chemical fertilizer could lead to further reductions. The IPCC Tier 1
emission factor for N2O is 1% of fertilizer N applied. The N2O emission from bio-fertilizer is
lower than chemical fertilizer. Assuming 50% reduction, replacing 75,000 t of inorganic N
results in a reduction of 0.39 Mt CO2e/yr. Application of organic fertilizer, assuming similar
efficiency as manure, leads to soil carbon sequestration of 3.03 Mt CO2e/yr.
Direct combustion:
Energy value of biomass, including straw, is strongly influenced by moisture content. Heating
value of straw as fuel is negatively related to its moisture content. Average efficiency of
electrical energy generation in Canada, using “wood and others” as fuel, is 34% (OEE, 2010).
Assuming 15% water, 15 Mt of straw could be converted to 27.7 TWh of electrical energy,
offsetting GHG emissions by 5.55 Mt CO2e/yr. At 45% water content, the electrical generation is
25.5 TWh, with an emission offset of 5.1 Mt CO2e/yr. Higher values of emission offset could be
achieved if the waste heat from power generation could be utilized. This potential is not
included in the assessment.
Comparison:
Total GHG emission offset potential for the AD+bio-fertilizer option is 5.5 Mt CO2e/yr,
compared to 5.1-5.6 Mt CO2e/yr for direct combustion. Overall, there is little difference in
carbon emission offsets of the two options. Economics, other environmental considerations,
such as SOx and NOx emissions, and availability of other input stocks could be the driving
variables for selection between these two options.
Constrained Potential: Market, Policy and Technical Overlay
Current market:
AD option is discussed in Waste Management and Organic Amendment sections. For both
options, capital cost could be a major barrier. Proven technologies exist for both options.
A reliable, low-cost, long-term supply of biomass fuel is essential to the successful operation of
biomass energy facilities. Governments can provide the right economic environment for
development of biomass energy industry through financial incentives and through development
of institutions such as a carbon market.
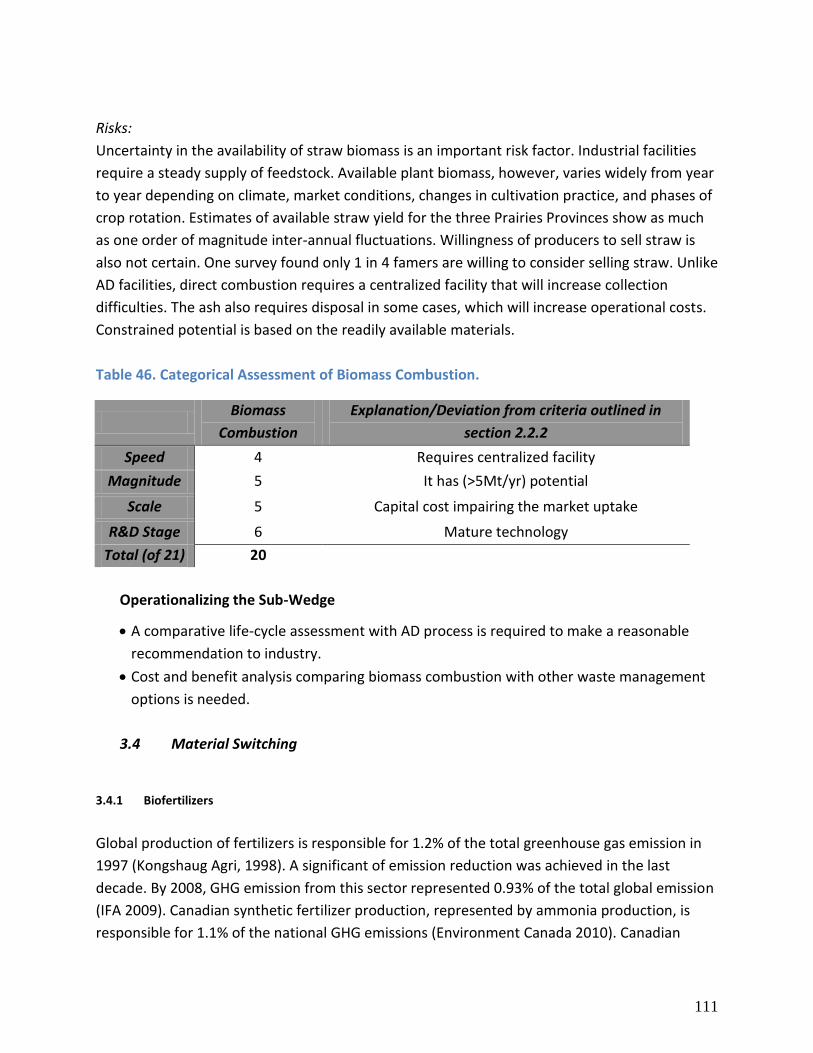
111
Risks:
Uncertainty in the availability of straw biomass is an important risk factor. Industrial facilities
require a steady supply of feedstock. Available plant biomass, however, varies widely from year
to year depending on climate, market conditions, changes in cultivation practice, and phases of
crop rotation. Estimates of available straw yield for the three Prairies Provinces show as much
as one order of magnitude inter-annual fluctuations. Willingness of producers to sell straw is
also not certain. One survey found only 1 in 4 famers are willing to consider selling straw. Unlike
AD facilities, direct combustion requires a centralized facility that will increase collection
difficulties. The ash also requires disposal in some cases, which will increase operational costs.
Constrained potential is based on the readily available materials.
Table 46. Categorical Assessment of Biomass Combustion.
Biomass
Combustion
Explanation/Deviation from criteria outlined in
section 2.2.2
Speed 4 Requires centralized facility
Magnitude 5 It has (>5Mt/yr) potential
Scale 5 Capital cost impairing the market uptake
R&D Stage 6 Mature technology
Total (of 21) 20
Operationalizing the Sub-Wedge
A comparative life-cycle assessment with AD process is required to make a reasonable
recommendation to industry.
Cost and benefit analysis comparing biomass combustion with other waste management
options is needed.
3.4 Material Switching
3.4.1 Biofertilizers
Global production of fertilizers is responsible for 1.2% of the total greenhouse gas emission in
1997 (Kongshaug Agri, 1998). A significant of emission reduction was achieved in the last
decade. By 2008, GHG emission from this sector represented 0.93% of the total global emission
(IFA 2009). Canadian synthetic fertilizer production, represented by ammonia production, is
responsible for 1.1% of the national GHG emissions (Environment Canada 2010). Canadian

112
agricultural fertilizer market size and GHG emissions in the period between June 2009 and July
2010 are summarized in Table 47.
Table 47. Canadian agricultural synthetic fertilizer market and GHG emissions from
production only (2009-2010)
Fertilizer
Market Emission factor1 GHG
t/yr t CO2e/t nutrient t CO2e
N 1,900,000 2.67 5,073,000
P 625,000 0.15 94,000
K 260,000 0.33 86,000
Total 2,785,000 5,253,000 1 GHG emission factor is based on estimates form the International Fertilizer Industry Association 2009.
While synthetic nitrogen fertilizer represents 68% of total Canadian fertilizer usage, it
contributes over 97% of GHG emissions from this sector. Therefore discussions in this section
will focus on the GHG emission implications of switching from synthetic nitrogen fertilizer to
bio-fertilizer, defined as plant nutrients, particularly nitrogen, phosphorus and potassium of
biological origin, either in organic form or loosely absorbed by organic materials. When applied
to soils, these plant nutrients will be slowly released to the soil environment for plant growth.
Mechanism and Methods for Mitigation
The overall level of agricultural greenhouse gas emission will likely continue to rise for the
foreseeable future as agricultural production expands to keep pace with growing food, feed,
fiber and bioenergy demands. This is evident in the jump in Canadian synthetic nitrogen
fertilizer consumption from 1.2 Mt to 1.9 Mt from 1990 to 2008. Increasing efficiencies in
energy and fertilizer inputs is critical for keeping overall emissions as low as possible and for
reducing the level of emissions per unit of agricultural output. Efficient and responsible
production, distribution and use of fertilizers are central to achieving these goals. Many good
agricultural practices, that increase productivity, can also moderate agricultural GHG emissions
and have other sustainable development benefits, including greater food security, poverty
alleviation, and conservation of soil and water resources. Proper management and application
of bio-fertilizer, which is a product from reusing biomaterials and biowastes, can be one of the
strategies for keeping agricultural GHG emissions low. Its benefits include reducing the need for
chemical fertilizers, improving soil quality and productivity, and reducing energy intensity of
tillage and other soil management practices.

113
Figure 17 illustrates the nitrogen cycle in agriculture. A major source of nitrogen supply is
through industrial fixation, which is an energy intensive process as indicated in Table 44.
Conventional agricultural practices focus on using synthetic nitrogen fertilizer for crop
production. Livestock operation concentrates nutrients at feedlot operation areas primarily in
the form of manure. The value of animal manure as a source of plant nutrients and in improving
soil quality is generally recognized. However, because of its high moisture content, low nutrient
concentration, low density and large volume, the cost of manure application per unit of plant-
required nutrient is relatively high, limiting direct land application of manure to 10—80 km
radius from the source, depending on cropping systems, land productivity and properties of
manure, particularly the nutrient value (Araji and Stodick 1990).
This creates large scale imbalances in nutrient distribution: a one-direction nutrient flow
towards urban centers and concentrated livestock operations in the forms of feeds and food
stuffs, often over long distances, creates local nutrient excess in the forms of manures and
other waste products, and associated environmental problems. In areas where crop products
are exported, depletion in soil nutrient reserves must be compensated with fertilizer. Attention
has largely been concentrated on the two ends of this nutrient imbalance: synthetic fertilizer
and crop production on the one hand and nutrient excess and environmental degradation on
the other.
Relatively little has been done with regard to rebalancing the nutrient distribution by creating
nutrient flows in the other direction. The long-term implications of this imbalance in nutrient
distribution will be felt more for nutrients that rely on finite, non-renewable natural resources,
such as phosphorus. The re-balancing of nutrient distribution requires developing conditions
and products, and enabling policies (e.g. bio-fertilizers) which can be transported and
distributed economically over long distances.
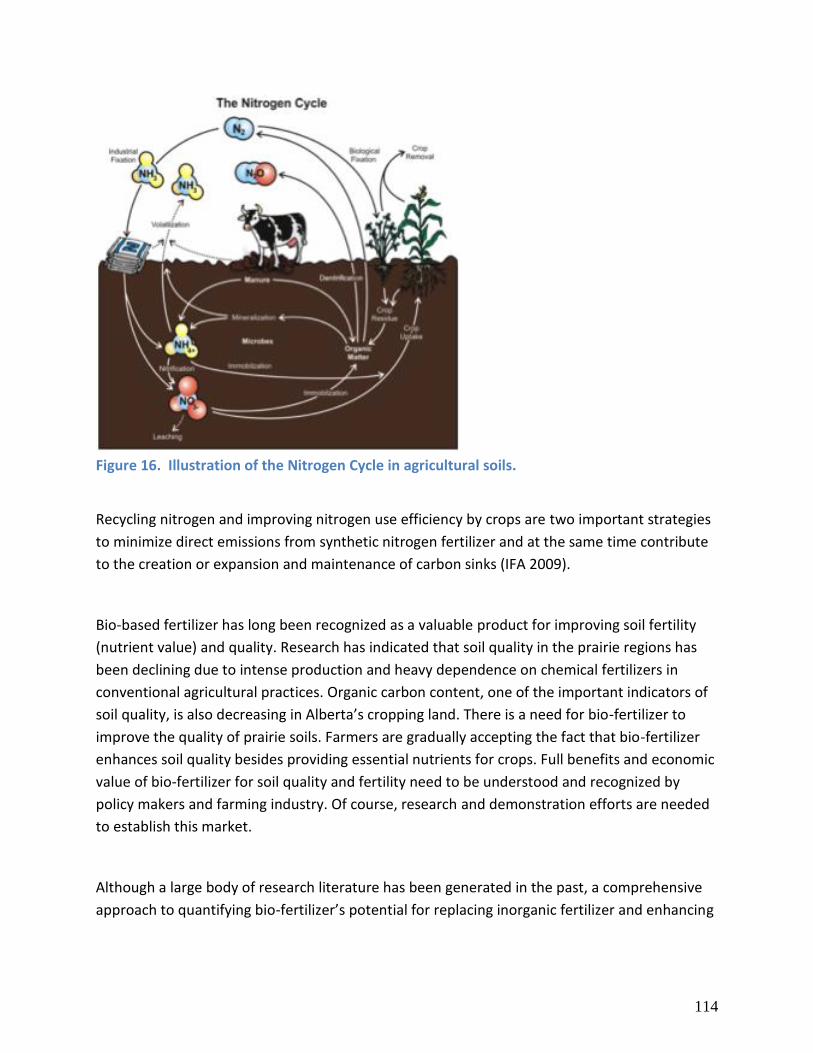
114
Figure 16. Illustration of the Nitrogen Cycle in agricultural soils.
Recycling nitrogen and improving nitrogen use efficiency by crops are two important strategies
to minimize direct emissions from synthetic nitrogen fertilizer and at the same time contribute
to the creation or expansion and maintenance of carbon sinks (IFA 2009).
Bio-based fertilizer has long been recognized as a valuable product for improving soil fertility
(nutrient value) and quality. Research has indicated that soil quality in the prairie regions has
been declining due to intense production and heavy dependence on chemical fertilizers in
conventional agricultural practices. Organic carbon content, one of the important indicators of
soil quality, is also decreasing in Alberta’s cropping land. There is a need for bio-fertilizer to
improve the quality of prairie soils. Farmers are gradually accepting the fact that bio-fertilizer
enhances soil quality besides providing essential nutrients for crops. Full benefits and economic
value of bio-fertilizer for soil quality and fertility need to be understood and recognized by
policy makers and farming industry. Of course, research and demonstration efforts are needed
to establish this market.
Although a large body of research literature has been generated in the past, a comprehensive
approach to quantifying bio-fertilizer’s potential for replacing inorganic fertilizer and enhancing
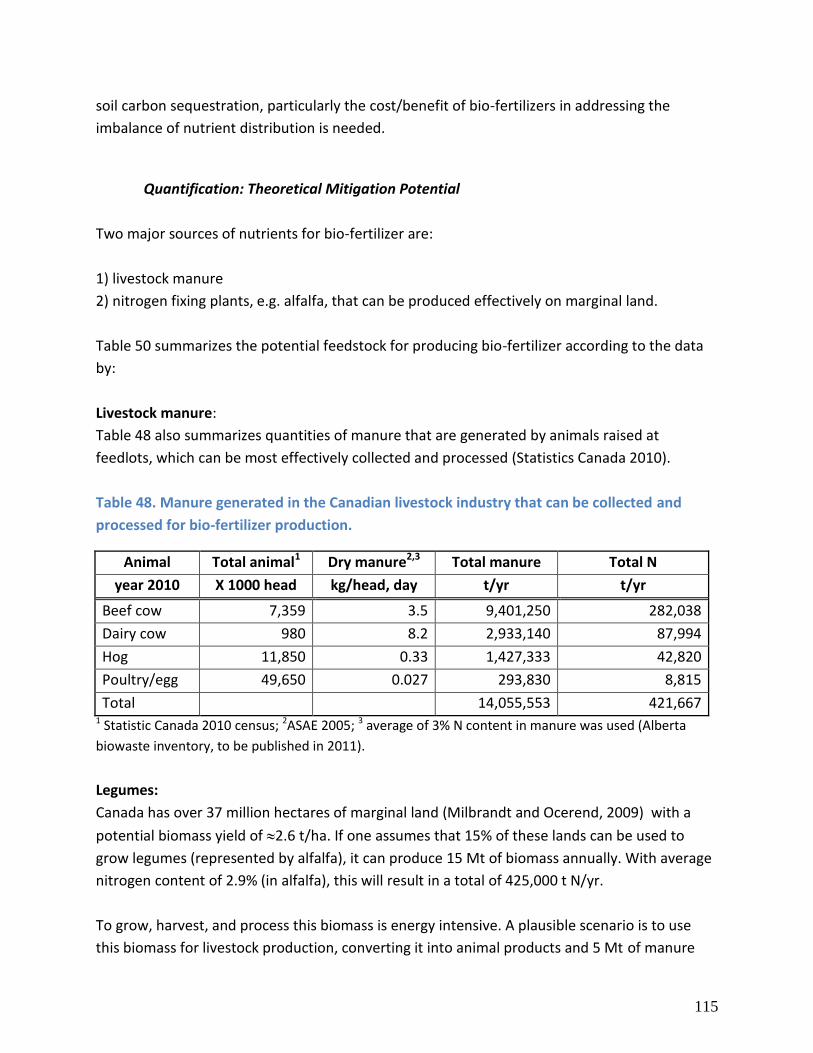
115
soil carbon sequestration, particularly the cost/benefit of bio-fertilizers in addressing the
imbalance of nutrient distribution is needed.
Quantification: Theoretical Mitigation Potential
Two major sources of nutrients for bio-fertilizer are:
1) livestock manure
2) nitrogen fixing plants, e.g. alfalfa, that can be produced effectively on marginal land.
Table 50 summarizes the potential feedstock for producing bio-fertilizer according to the data
by:
Livestock manure:
Table 48 also summarizes quantities of manure that are generated by animals raised at
feedlots, which can be most effectively collected and processed (Statistics Canada 2010).
Table 48. Manure generated in the Canadian livestock industry that can be collected and
processed for bio-fertilizer production.
Animal Total animal1 Dry manure2,3 Total manure Total N
year 2010 X 1000 head kg/head, day t/yr t/yr
Beef cow 7,359 3.5 9,401,250 282,038
Dairy cow 980 8.2 2,933,140 87,994
Hog 11,850 0.33 1,427,333 42,820
Poultry/egg 49,650 0.027 293,830 8,815
Total 14,055,553 421,667 1 Statistic Canada 2010 census; 2ASAE 2005; 3 average of 3% N content in manure was used (Alberta
biowaste inventory, to be published in 2011).
Legumes:
Canada has over 37 million hectares of marginal land (Milbrandt and Ocerend, 2009) with a
potential biomass yield of 2.6 t/ha. If one assumes that 15% of these lands can be used to
grow legumes (represented by alfalfa), it can produce 15 Mt of biomass annually. With average
nitrogen content of 2.9% (in alfalfa), this will result in a total of 425,000 t N/yr.
To grow, harvest, and process this biomass is energy intensive. A plausible scenario is to use
this biomass for livestock production, converting it into animal products and 5 Mt of manure
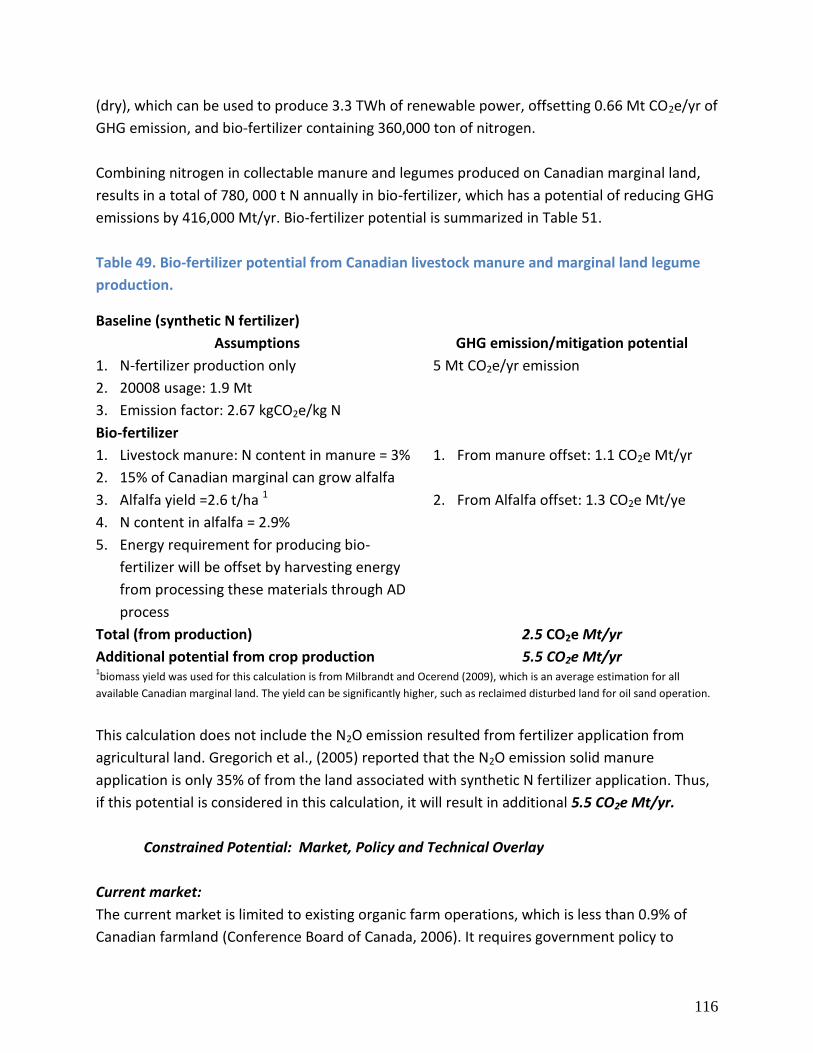
116
(dry), which can be used to produce 3.3 TWh of renewable power, offsetting 0.66 Mt CO2e/yr of
GHG emission, and bio-fertilizer containing 360,000 ton of nitrogen.
Combining nitrogen in collectable manure and legumes produced on Canadian marginal land,
results in a total of 780, 000 t N annually in bio-fertilizer, which has a potential of reducing GHG
emissions by 416,000 Mt/yr. Bio-fertilizer potential is summarized in Table 51.
Table 49. Bio-fertilizer potential from Canadian livestock manure and marginal land legume
production.
Baseline (synthetic N fertilizer)
Assumptions GHG emission/mitigation potential
1. N-fertilizer production only
2. 20008 usage: 1.9 Mt
3. Emission factor: 2.67 kgCO2e/kg N
5 Mt CO2e/yr emission
Bio-fertilizer
1. Livestock manure: N content in manure = 3%
2. 15% of Canadian marginal can grow alfalfa
3. Alfalfa yield =2.6 t/ha 1
4. N content in alfalfa = 2.9%
5. Energy requirement for producing bio-
fertilizer will be offset by harvesting energy
from processing these materials through AD
process
1. From manure offset: 1.1 CO2e Mt/yr
2. From Alfalfa offset: 1.3 CO2e Mt/ye
Total (from production) 2.5 CO2e Mt/yr
Additional potential from crop production 5.5 CO2e Mt/yr 1biomass yield was used for this calculation is from Milbrandt and Ocerend (2009), which is an average estimation for all
available Canadian marginal land. The yield can be significantly higher, such as reclaimed disturbed land for oil sand operation.
This calculation does not include the N2O emission resulted from fertilizer application from
agricultural land. Gregorich et al., (2005) reported that the N2O emission solid manure
application is only 35% of from the land associated with synthetic N fertilizer application. Thus,
if this potential is considered in this calculation, it will result in additional 5.5 CO2e Mt/yr.
Constrained Potential: Market, Policy and Technical Overlay
Current market:
The current market is limited to existing organic farm operations, which is less than 0.9% of
Canadian farmland (Conference Board of Canada, 2006). It requires government policy to

117
promote the switch. This potential market can be expended if municipal organic waste is
processed through either compost technology or anaerobic digestion.
Risks:
Major risk for this switch is that it will depend on the process used. It may require extra energy
to produce/process the raw materials (both manure and legume). If biogas technology is used
to process these materials, a net gain of energy will be produced, In addition, this technology
provides a platform for concentrating nutrients in bio-fertilizer products. (please refer to the
waste management section). One may argue that the manure is already used as a fertilizer
source through land application. Regulatory constraints around concentrated livestock
operations limit producer’s ability to fully utilize manure’s nutrient value since they are
concentrated to the limited area. Constrained potential is based on the assumption of that less
than 50% of theoretical potential will be realized when the quantification protocol is in place.
Table 50. Categorical Assessment of Biofertilizers.
Bio-fertilizer Explanation/Deviation from criteria outlined in section
2.2.2
Speed 5 Many field research sites have been operated
Magnitude 3 It has 2.5Mt/yr potential
Scale 3 There is no incentive to make the switch and requires
quantification procedures
R&D Stage 4 Requires commercial demonstration
Total (of 21) 15
Co-benefits:
Increasing soil fertility: Bio-based fertilizer contains balanced micronutrients required
for plant growth besides nitrogen, phosphorus and potassium.
Improving soil structure: The organic matter, in humus form, provides basic binding
agent for soil aggregates, which are basic elements that build an ideal soil structure;
organic matter also provides a substrate for growth and functioning of soil
microorganisms.
Reducing nutrient loss: Over 50% of nitrogen and phosphorus in bio-fertilizer are in
organic forms. These nutrients are released during the mineralization process, a
microbe-regulated process. Although reliable data are not currently available in the

118
literature, researchers are generally in agreement that the nutrient use efficiency of
plants grown with bio-fertilizer is greater than that of plants grown with chemical
fertilizers.
Increasing soil organic matter: While the soil organic matter has been recognized as a
carbon sink, it also improves soil quality through resistance to soil erosion, increased soil
buffering capacity, which in turn increases the soil’s capability to resist chemical
contamination or ability de-contaminate, increased soil water infiltration and retention,
therefore can enhance crop production.
Operationalizing the Sub-Wedge
May require incentives for switching to bio-fertilizer
Develop a comprehensive quantification protocol
Requires a demonstration site for growing legume on marginal lands for proven carbon
benefits
Regional nutrient balances to determine sending and receiving zones of nutrients and
biofertilizers
3.4.2 Forest Sustainability – Building Material Switching
The primary forest-based material switching opportunity is to replace non-renewable material
such as plastics, metal or cement with wood products. Material switching is contingent on
recognizing carbon storage in harvested wood products (HWP) contrary to International Panel
on Climate Change (IPCC) protocol. Furthermore, forest product based material switching must
be based on other uses besides wood products in single-family residential construction, which
is already effectively saturated with wood products use (McKeever et al, 2006). Canada is a
large net exporter of forest products – 80% of Canada’s production is exported to the United
States (Dufour, 2002) – therefore any baselines or quantification of material switching should
be based on the United States market if they are to achieve a meaningful level of greenhouse
gas reduction.
Quantification of storage in harvested wood products is a crucial first step in determining the
GHG mitigation potential of using forest products to displace non-renewable building materials.
Skog (2008) estimated that storage in HWP in the United States of America represented an
annual removal of 110 to 161 Mt of CO2e from the atmosphere – representing 17 to 25% of
carbon removals from forests. Skog ibid, Skog and Nicholson (2000) and Ryan et al (2010)
suggest that storage in HWP accrue at the point of end use, not at the point of production. They
further make the case that carbon storage in HWP should only be acceptable when a country’s

119
carbon stock balance in forests is increasing. (See the section on forest management for carbon
storage.) Chen et al (2008) used FORCARB-ON (a provincial forest carbon model for Ontario) to
predict an increase in storage in HWP (primarily as sawn lumber, veneer and composites) of 4.4
Mt/year of CO2e between 2001 and 2100. At present, no projections of storage in HWP have
been made for Alberta or for Canada as a whole. Appendix 1 presents an overview of storage in
HWP.
Mechanism and Methods for Mitigation
Forest products based material switching depends on the production and deployment of wood-
based materials, resulting in less greenhouse gas emission than production and deployment of
alternative building materials. To quantify material switching, a displacement or expansion
factor is necessary to determine the difference in emission profile between forest products.
(See Appendix 1 for a detailed review of expansion and displacement factors from the
literature.) For purposes of this analysis the modal displacement factor of 2 was used. A
displacement factor of 2 means each tonne of forest products used in building construction will
displace 2 tonnes of CO2e in emissions associated with “conventional” building products
(generally concrete and/or steel).
At present, adoption of forest products to replace concrete and steel is hampered by a number
of factors, including regulation, cost of materials, and cost of installation. Regulatory constraints
are primarily fire codes and structural requirements. These constraints limit use of wood in
taller (greater than three story) buildings and in locations with high fire spread potential.
McKeever et al, ibid address both regulatory concerns by identifying a specific structure well-
suited to material switching with wood: low rise, non-residential construction. They identified
an annual potential for 4.9 billion board foot equivalent switch to wood within current building
codes, and a potential for 8.6 billion board foot equivalent switch to wood with changes to
building codes, in construction of low rise non-residential buildings. Envisioned changes to
building codes included: increasing area and height limits through addition of automatic fire
protection sprinklers, use of firewalls to subdivide large buildings, and provision for substantial
frontage to the building to enable easy firefighting access. In a more recent paper (2008)
McKeever showed a modest 770 million board feet (fbm) of 29% increase in wood use in non-
residential buildings. This increase was mostly attributable to increased construction as wood
use increased from 9.2% to 11% of total construction.
Considerable effort has been devoted to examining the potential of material switching using
wood products. Sathre and O’Connor (2008) reviewed 48 papers (from Canada, UK and
Scandinavia) that examined use of wood products to displace non-renewable materials. The

120
potential of wood products to replace other material was assessed in a meta-analysis (drawn
from 20 of the papers) that found displacement factors ranging from -2.3 to 15.0, with most
falling between 1.0 and 3.0 and an average displacement factor of 2.0. Valsta et al (2008) linked
forest management and material switching to examine two case studies using life-cycle
analyses, finding displacement factors of 1.3 and 2.0 for multi-story apartment buildings. Heath
et al (2010) used an encompassing full life-cycle analysis of forest management and forest
products in mitigating greenhouse gas emissions to estimate 7.2 Mt CO2e of avoided emissions
in 2004-2005 attributable to use of wood as a building material.
Quantification: Theoretical Mitigation Potential
Quantification combines information about the magnitude of individual opportunities
(displacement factors) with information about scale to estimate overall magnitude of the
opportunity. Unfortunately, there is a dearth of information about scale – McKeever (2008 ibid)
and McKeever et al (2006 ibid) are the only references that quantitatively assess scale of the
opportunity. These papers suggest a theoretical opportunity of 7 (2008) to 8.6 billion fbm and a
current opportunity (constrained by building current building codes) of 4.9 billion fbm. No
similar data for the Canadian construction market exists. Given that 80% of Canada’s lumber
production is sold in the United States the American opportunity was “calibrated” to Canadian
product flow:
Canadian proportion of US lumber market = 9.4/34.5 billion fbm = 0.2724
Current building codes 4.9 billion board feet = 11.564 million m3
Revised building codes 7.0 billion board feet = 16.520 million m3
Realized use (2008 data) = 3.4 billion board feet = 8.0 million m3
Canadian wood product proportion = 3.15 million m3 (current regulation)
= 4.50 million m3 (revised regulations)
= 2.19 million m3 (realized to determine net)
GHG displacement per m3 = 0.75 tonnes (Eriksson et al 2007)
Theoretical potential emission reductions = 4.14 Mt CO2e reduction (2.5 Mt net)
Current potential emission reductions = 2.35 Mt CO2e reduction (0.7 Mt net)
Or
GHG displacement factor = 2 (Sathre and O’Connor 2008, Ryan et al 2010)
Wood mass = 4.63 – 8.12 million tonnes

121
Theoretical potential emission reductions = 4.42 Mt CO2e reduction (2.8 Mt net)
Current potential emission reductions = 2.52 Mt CO2e Mt reduction (0.9 Mt net)
Constrained Potential: Market, Policy and Technical Overlay
A number of potentially critical barriers to material switching must be addressed:
Determine where in the value chain ownership of material switching mitigation value
accrues. Skog (2008) suggests only countries with rising forest carbon inventories would
be able to include storage in HWP in their reporting inventory; he includes storage in
imported HWP in the United States inventory, as do Ryan et al (2010).
The need for building code changes to align with the International Building Code to
facilitate material switching and its quantification (McKeever et al, 2006).
Business case evaluation of material switching must be undertaken to determine if
material switching is cost effective. This evaluation should include any revenues or
values arising from GHG emission mitigation outcomes
Achieving success in material switching will take a considerable length of time.
The constrained potential of approximately 1/3 of theoretical potential represents the
amount of material switching that might take place in Canada or is currently taking place in
the United States. This pessimistic view is taken pending trade negotiations with the United
States over ownership of GHG mitigation potential associated with use of forest products.
The US has clearly taken the position that mitigation potential associated with product
deployment resides with the user of harvested wood products not with the producer. Until
this has been resolved it would be optimistic to expect to accrue that mitigation potential to
Canada.
Table 51. Categorical evaluation of forest products based material switching
mitigation opportunity.
Building
Material
Switching
Explanation/Deviation from criteria outlined in
section 2.2.2
Speed 3 Time requiremd to amend regulation, challenges
with ownership (user vs. producer)

122
Magnitude 3 Realized outcome (approx 1 - 1.25 Mt)
Scale 3 Many locations, contractors, suppliers, therefore
verification will be challenging
R&D Stage 5 Know this will work. Cost:Benefit assessment and
incenting market change required.
Total (of 21) 14
Operationalizing the Sub-Wedge
Clarification that carbon storage in HWP is mitigation.
Establish that “ownership” of mitigation/sequestration resides with producers not
consumers of HWP.
Change building code(s) for low-rise non-residential buildings in United States to align
with International Building Code Standards.
3.4.3 Bio-based materials
For the purposes of this section, the substitutions with bio-based is considered to include the
substitution of bio-based materials for petrochemicals and the alternative use of residual
agricultural fibres in other materials. A summary of the variety of options available for Canada
is summarized in a joint Pollution Probe and BIOCAP Canada Foundation report (2004)
Petrochemicals that can be substituted are summarized in the following table taken from a
WWF report (WWF Denmark 2009).
Table 52. Petrochemicals that can be substituted.
Reference Biochemical Bio-based Chemical
Maximum
Potential
Substitution
HDPE (high density polyethylene) PHA
(plyhydroxyalkaonates) 100%
PTT (polytrimethylene terephtalate),
Nylon 6
PTT from 1,3 propanediol 100%
PET (polyethylene terephtalate); PS
(polystyrene)
PLA (poly lactic acid) 100%
Ethyl lactate Ethyl lactate 100%
Ethylene Ethylene 100%

123
Maleic anhydride Succinic acid 85%
Adipic acid Adipic acid 100%
Acetic acid Acetic acid 25%
n-butanol n-butanol 90%
The report discusses the pathways for achieving these substitutions. The key feedstocks are
categorized as starch, hemicelluloses, cellulose, lignin, bio-oil and protein. From the analysis,
the report suggests a global emission reduction potential of between 87 and 116 Mt/yr by
2020.
The alternative uses of agricultural fibres extend across a wide and expanding range of
applications. These applications are grouped as follows where numerous specific
fibre/application combinations are possible (BioProducts Canada and Industry Canada 2004).
Textiles (including industrial textiles)
Building and construction materials (including insulation)
Composites (including automotive and aerospace)
Reclamation/horticulture
Papers and coatings
Packaging and consumer products
Biofuel production and use are not included as part of this analysis, as per the limitation to the
overall scope of work.
Mechanism and Methodology for Mitigation
In all cases, the carbon in the feedstock is sequestered in the materials through period of use
(and re-use) of the material. This differs from biofuels, where the carbon is returned to the
atmosphere upon combustion. However, for some materials, this carbon could then be
released upon aerobic or anaerobic decomposition of the material upon disposal. This may
apply to the materials and or the waste materials created during manufacturing of the
bioproducts themselves.
In addition, there can be indirect GHG emission impacts from the use of bioproducts. There
may be decreasing emissions associated with the fossil fuels previously used as feedstocks for
petrochemicals. However, there may be increased net emissions from land-use change and/or
increased use of fertilizers to increase yield.

124
There are currently no quantification protocols that specifically target emission reductions from
biomaterial substitutions. The forestry protocols that address harvested wood products
represent the closest approximation to how bio-material substitutions could be handled. Given
the processing involved, it is likely that individual life cycle assessments would be required to
estimate emission reduction potentials.
Quantification: Theoretical Mitigation Potential
Baseline Assumptions and Data Sources: Biomaterials
The Bioproducts Roadmap (BioProducts Canada and Industry Canada 2004) reports that the
entire petrochemical/biochemical market is estimated at 30 million kg/yr. A USDA report on
bio-based products (USDA 2008) suggested that in 2008, US market penetration for bio-based
products could reach 20% by 2020, up from the current estimate of approximately 5%.
The potential feedstock in Canada for use in bioproducts was estimated by the BIOCAP Canada
Foundation (Wood and Layzell 2003) as approximately 60 million tonnes from both agriculture
and forestry. This is said to represent approximately 40% of the total biomass harvest.
Assuming no land-use change and no related change in the management of forest/agricultural
systems, all of the carbon (45% to 50% by mass (Bioenergy Feedstock Information Network
2005)) in these feedstocks is available for sequestration. Further, an assumption of 80%
feedstock use efficiency would be applied to account for wastage in processing.
Mitigation Assumptions and Activities:
For petrochemicals from biomaterial feedstocks, it is assumed that the net GHG benefit would
be neutral as the carbon would be available to return to the atmosphere within in a short
period. This does not account for the indirect benefits from the avoided processing of the fossil
fuel feedstocks, and the detriments from land use change and changing cropping practices (i.e.
fertilizer). Given the lack of available information, this appears reasonable.
The sequestration of carbon from within the available biomass used for bio-material
substitution is calculated as follows:
Feedstock: 60 million tonnes per year
Use Efficiency: 80%
% Carbon: 45% - 50%
Carbon to CO2e: 44/12
Total Sequestration: 79 to 88 Mt CO2e/yr

125
Full lifecycle GHG assessments need to be completed for each set of bioproducts to get a better
sense of the emission reduction potential.
Constrained Potential: Market, Policy and Technical Overlay
There are a number of potential constraints on the use of biomaterials. Each of these
constraints, highlighted in the Innovation Roadmap report (BioProducts Canada and Industry
Canada 2004), are summarized in the following table relative to each of the mitigation
activities:
Availability of Feedstocks: The distribution of feedstocks is spread across Canada and varies
season-to-season with the core agricultural production. As such, there will be difficulty in
optimizing use of the feedstock at a scale that would cover all available feedstocks
Market Uptake: Two key factors are identified in limiting market uptake: public demand and
lack of clear standards in some sectors. The lack of public demand is suggested to be a result of
insufficient market awareness.
Speed of Innovation: It will take significant innovation to increase demand for the biomaterials.
This will require financing, supporting policy, government support, and linking/networking
services.
Table 53. Categorical evaluation of biomaterials.
Biomaterial
Used in
Petrochemicals
Biomaterial
Used in Other
Materials
Explanation/Deviation from criteria outlined in
section 2.2.2
Speed 5 5 Already seeing numerous research and product
development activities
Magnitude 1 5 Significant opportunity depending on how
sequestration of carbon in biomaterials is handled.
Scale 3 1
Petrochemicals are scalable with difficulty given
limited number of producers. Biomaterial
production is likely to be fragmented and dispersed
across locations where feedstock is available
126
R&D Stage 4 2 Range of R&D stages across the variety of products.
Scores given are indicative.
Total (of
21) 13 13
Taking these constraining factors into consideration, the potential for emission reductions from
the use of biomaterial in other materials is likely to be closer to 10% to 20% of the potential.
This would sum to 8 to 16 Mt of CO2e/yr.
Operationalizing the Sub-Wedge
To assist in operationalizing this sub-wedge, the existing Roadmap suggests the following47 :
Improved coordination among market participants.
Technology development and innovation.
Government support of research and development.
Increased focus on awareness and market development.
Development of case studies with full GHG lifecycle profiles.
Support development and access to international markets.
3.5 Strategic Carbon Management
3.5.1 Landscape Scale Carbon Management
Forest management in Canada is currently evolving from simply sustaining fibre flow to wood
processing facilities to one of managing ecosystems for a wide array of ecosystem functions and
services; wherein wood supply to mills is only one of a stream of ecological services. The forest
industry is struggling to adapt to the demands this new management paradigm places on it
during a time of unprecedentedly low prices. The forest industry and forest regulators must
recognize that the emerging ecosystem services management paradigm is ideally suited to
participating in the carbon economy.
In particular, forest carbon management will require forest managers to integrate several of the
sub-wedges discussed in the Sequestration and Bio-fuels sections with broader, landscape-scale
ecosystem components. Included in these broader scale components are changes in albedo and
forest disturbance regime. Both albedo and forest disturbance regime are likely to be highly
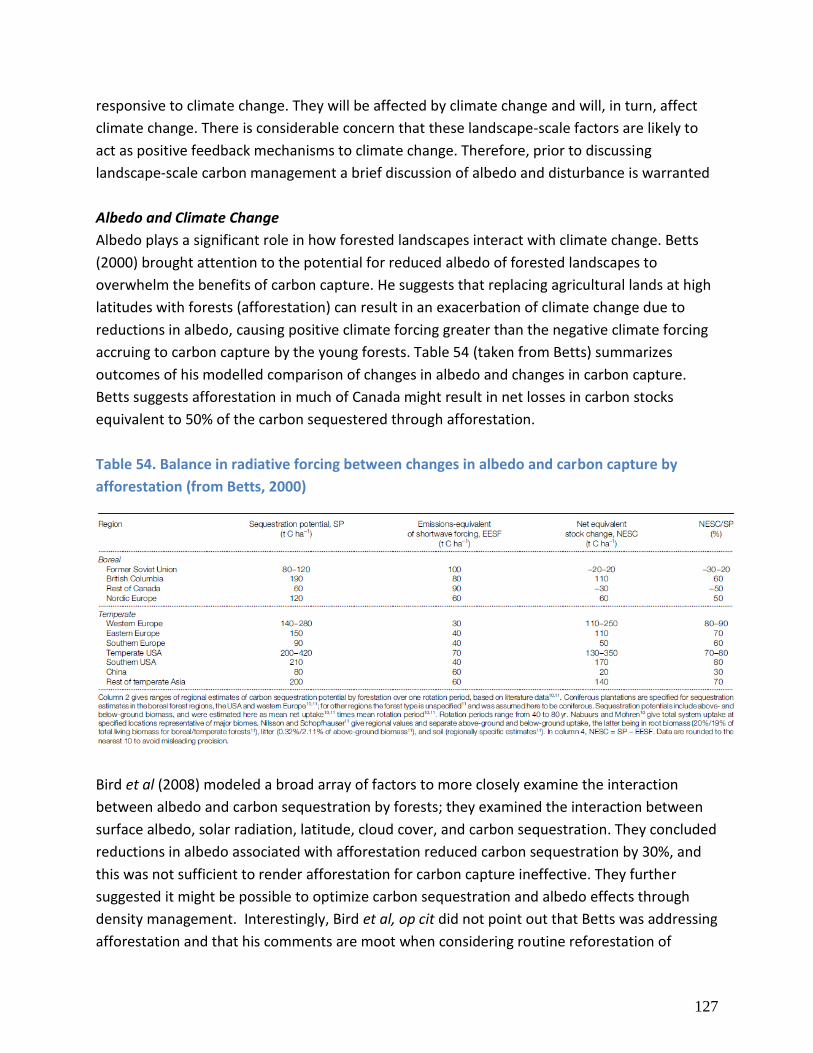
127
responsive to climate change. They will be affected by climate change and will, in turn, affect
climate change. There is considerable concern that these landscape-scale factors are likely to
act as positive feedback mechanisms to climate change. Therefore, prior to discussing
landscape-scale carbon management a brief discussion of albedo and disturbance is warranted
Albedo and Climate Change
Albedo plays a significant role in how forested landscapes interact with climate change. Betts
(2000) brought attention to the potential for reduced albedo of forested landscapes to
overwhelm the benefits of carbon capture. He suggests that replacing agricultural lands at high
latitudes with forests (afforestation) can result in an exacerbation of climate change due to
reductions in albedo, causing positive climate forcing greater than the negative climate forcing
accruing to carbon capture by the young forests. Table 54 (taken from Betts) summarizes
outcomes of his modelled comparison of changes in albedo and changes in carbon capture.
Betts suggests afforestation in much of Canada might result in net losses in carbon stocks
equivalent to 50% of the carbon sequestered through afforestation.
Table 54. Balance in radiative forcing between changes in albedo and carbon capture by
afforestation (from Betts, 2000)
Bird et al (2008) modeled a broad array of factors to more closely examine the interaction
between albedo and carbon sequestration by forests; they examined the interaction between
surface albedo, solar radiation, latitude, cloud cover, and carbon sequestration. They concluded
reductions in albedo associated with afforestation reduced carbon sequestration by 30%, and
this was not sufficient to render afforestation for carbon capture ineffective. They further
suggested it might be possible to optimize carbon sequestration and albedo effects through
density management. Interestingly, Bird et al, op cit did not point out that Betts was addressing
afforestation and that his comments are moot when considering routine reforestation of

128
harvested forests. Using the Siberian BioClimatic Model, Tchebakova et al (2010) found albedo
played a critical role in climate change. Their modeling outcomes suggested that changes in
albedo due to forest advance onto the tundra is likely to result in increased climatic forcing;
whilst increases in albedo arising from steppe advancement into current forest landscapes is
likely to result in decreased climatic forcing. They did not attempt to quantify a net balance in
albedo effects on climatic forcing. Thompson et al (2009) make a sensible case that albedo and
carbon capture need to both be considered in modeling expected climate change lest the
potential of carbon-capture to mitigate climate change be overestimated. Chapin et al (2010)
speculate that albedo in Alaska’s boreal forest is likely to decline despite a change toward
deciduous composition, due to a shorter winter season resulting in a reduction in duration of
snow cover.
Forest disturbance regime
Changes in Wildfire: The largest effect of climate change in northern forests might be changes
in the disturbance regime. Flannigan et al (2005) identify several fire severity factors likely to
increase with climate change: more severe fire weather, more area burned, more ignitions, and
a longer fire season. These factors are likely to increase area burned by 74% (Canadian General
Climatic Model (GCM)) to 118% (Hadley GCM) by the end of the 21st century. Wotton et al
(2010) arrive at a similar range of increase in fire occurrence (75% (Canadian GCM) to 140%
(Hadley GCM)). This magnitude of increase coupled with the potential for large forest fires to
release substantial quantities of GHGs (mostly CO2, but also CH4, long-chain hydrocarbons, and
carbon particulates) suggests changes in disturbance are likely to substantially change forest
carbon fluxes. Amiro et al (2001) found that Canadian wildfires released an average of 27Mt of
carbon (99 Mt CO2e) annually between 1959 and 1999; in severe fire years this may exceed 100
Mt of carbon (370 Mt CO2e). Large, severe wildfires are likely to generate positive climatic
forcing through sustained release of carbon dioxide from decomposition of fire-killed trees not
salvaged for commercial use and through reductions in albedo due to darkening of the soil
surface by char. (It might be argued that winter albedo values will increase for a period due to
loss of canopy shading with a resultant increase in snow exposure.)
Johnstone et al (2010) speculate that while climate change (in Alaska) may increase
susceptibility to forest fire disturbance at the stand level, it may in fact reduce fire susceptibility
at the landscape level. They contend climate change may stimulate a change to a more
deciduous dominated landscape which is generally more resistant to ignition than the current
conifer dominated landscape.

129
Changes in Forest Insects: Kurz et al (2008) modelled the recent (and on-going) mountain pine
beetle (MPB) outbreak in British Columbia applying the CBM-CFS 3 to project changes in carbon
flux across 374,000 km2 of forest using a range of outbreak induced mortality values. The
authors acknowledge that salvage harvest would result in carbon storage in harvested wood
products and in emission offset opportunities arising from biomass to energy, but did not
address this in their modelling. Their results should thus be considered changes in carbon stock,
not releases to the atmosphere. They found the study area changed from a small net sink prior
to the outbreak to a large net source of carbon, with an average release of carbon (from stock)
of 36 g/m2/year (990 Mt CO2e total over the modeled area) over the 20-year course of the
outbreak. Using the more conservative British Columbia Ministry of Forests estimate of a total
outbreak area of 84,000 km2, a total emission value of 250 Mt CO2e is estimated. British
Columbia Ministry of Forests, Mines and Lands data shows that approximately 113.6 Mt of
wood fibre was salvaged for use in sawmills and pulpmills during the first 5 years of the
outbreak. Suitability of mountain pine beetle killed wood for use in mills diminishes with time,
so these data should be extrapolated with caution. Treating this value as 2/3 of total salvage to
conventional forest products, using a mill efficiency of 270 board feet per m3 and assuming ½
the sawmill “waste” goes to paper and the other half goes to waste, the following estimate of
storage in HWP can be estimated:
Raw CO2 = 113.6mm m3 X 0.40 density X 50% carbon X 44/16 carbon to CO2
X 3/2
= 125 mm tonnes
Net CO2 Storage = (125 mm tonnes X (270/424) X .75) +
(125 mm tonnes X 0.5 X (154/424)*0.07)
= 60 Mt + 3 Mt
=63 Mt
In addition, a total of 400,000 tonnes per year of MPB-killed trees are being salvaged for use as
biomass-to-energy fuels via wood pellets. Assuming 80% energy efficiency in harvesting and
processing and a project life of 10 years before dead wood becomes unsuitable for conversion
to pellets; this translates into a total biomass-to-energy conversion of:
Biomass-to-energy conversion = 1,000,000 X 0.8 X 10
= 8 Mt
Total reduction in CO2e = 71 Mt or between 7 and 28%
This gives a net predicted CO2e emission of between 180 and 990 Mt.

130
Kurz et al 2008 identify numerous potential insect disturbances that should be considered
when modeling forest carbon interactions – these include outbreaks of spruce beetle, eastern
spruce budworm, and forest tent caterpillar.
Net effect of changes in forest disturbance: Kurz et al (2008) examined the potential for
increases in boreal forest ecosystem productivity to offset carbon losses arising from increased
disturbance. They used the CBM-CFS-3 to determine levels of change in forest growth needed
to offset carbon release from stocks arising from wildfire (using estimates from Flannigan et al
op cit) and other disturbances (particularly insect outbreaks). The authors modelled carbon
removals from stock (i.e. they did not include storage in HWP or biomass-to-energy). Under
these conditions the authors found sustained, substantial increases to forest growth over broad
areas were necessary to offset increased removals of carbon from stock due to disturbance.
Erosion of forest landbase: Urbanization, industrial development for mineral or petroleum
extraction, and land clearing for agriculture all contribute to decreases in forest land-base
across Canada. The 2008 National Inventory Report (Environment Canada 2010) shows a net
global warming potential of 19 Mt CO2e due to conversion of forest lands. This is down from 27
Mt CO2e arising from forest land conversion in 1990.
Implications of broader scale factors: Effective models and monitoring programs support
examining the interaction of forests and climate change (Kurz et al, 2007; Ryan et al, 2010; Li et
al, 2006; and Calef 2010). Calef (2010) predicts substantial releases of carbon dioxide from the
boreal forest due to warming, which has led to an earlier arrival of spring thaw and thus has
extended the growing season by 2-4 days from 1988 to 2000. Longer growing seasons lead to
warmer soils which translate into increased amounts of formerly locked-up soil carbon available
for decomposition and release. “Satellite data suggest an extensive decline in forest
productivity (browning) in the circumpolar boreal forest which is in sharp contrast to the
greening observed in tundra areas.”
Kurz et al (2007) modeled landscape-scale boreal forest response to climate change and arrived
at a similar conclusion: “This study indicates that boreal forest C stocks may decline as a result
of climate change because it would be difficult for enhanced growth to offset C losses resulting
from anticipated increases in disturbances.”
Calef’s arguments are all the more compelling because they are empirical. More recent
arguments by Euskirchen et al (2010) suggest positive changes in boreal forest energy flux will
likely arise from effects of climate change on the boreal forest: “Research generally suggests
that the net effect of a warming climate is a positive regional feedback to warming…. Fewer

131
negative feedbacks have been identified, and they may not be large enough to counterbalance
the large positive feedbacks.”
Integration of effects
From the foregoing discussion it becomes apparent that Canada’s forests are an important
factor in climate change. The abundance of evidence suggests their role will likely depend on
impacts of climate change, with a strong likelihood that increases in extent and severity of
disturbance may well tip the balance toward forests acting as carbon sources. In face of this
prudence dictates a proactive, quantitative assessment would be of great value. Canada is
fortunate in having detailed forest inventory information and an internationally recognized
forest carbon scenario tool in the Carbon Budget Model – Canadian Forest Sector 3. These
combine to provide an opportunity to integrate activity specific changes in GHG mitigation with
landscape-scale estimates of climate change effects on forest carbon budgets. It is strongly
suggested that empirical validation of the predictive capabilities of the CBM-CFS 3 be
undertaken expeditiously as forest managers urgently need the ability to accurately scenario
GHG mitigation strategies and climate change effects as part of the forest management
planning process. Further, there is a great need for tools to integrate forest growth and
inventory, soil organic carbon and peatlands quantitatively and seamlessly into the carbon
realm.
Interim management strategies
In the absence of strong quantitative guidance forest managers should act on common sense
principles articulated by several of the references cited in this review. For example, Kurz et al
2007 provides a good starting point for a holistic assessment of boreal carbon balance and flux.
Metsaranta and Kurz (2010) used the CBM-CFS 3 to examine a wide array of potential
interactions between climate change and forest management regimes depending on how
anticipated effects of climate change on forests are realized. They suggest a number of prudent
strategies, including:
Evaluation of mitigation opportunities against a forward looking baseline derived from
realistic estimates of the influence of climate change on disturbance regimes and
albedo;
Increase or maintain forest area (using afforestation if necessary);
Increase stand-level carbon density through silvicultural treatments and process
improvement;
Increase landscape-level carbon density through increasing rotation length (i.e. delayed
harvesting);
132
Reduce or eliminate slash burning;
Increase carbon storage in forest products.
Soil organic carbon maintenance strategies should be added to these. They include:
Minimize soil surface disruption when harvesting or reforesting;
Minimize soil surface warming by maintaining or rapidly re-establishing forest cover;
Eliminate slash burning.
Vitt (2006) recommends that peatlands should be maintained as sinks, wherever possible:
Do not remove the actively growing top few centimeters of the ground layer when
grading access lines;
Keep the time between the end of peat harvesting activity and revegetation as short as
possible. In western Canada, develop a clear management plan for restoration of cut
over bogs back to fens;
Avoid nutrient inputs to peatlands during construction activities. This includes
minimizing the introduction of mineral soil to peatland areas;
Adequate buffer zones should be maintained around peatland complexes;
Buffer zones should be designed relative to peatland size, runoff amount, and
watershed extent in order to protect small, sensitive peatlands as well as larger, less
sensitive peatland complexes;
Road construction engineering should endeavor to understand peatland hydrology in
order to avoid changes in water levels.
Albedo is difficult to manage directly but its effects might be minimized by:
Reforesting harvested or burned-over forests promptly to minimize the effect of char on
albedo;
Managing reforestation density to maintain or increase “sky view” of snow;
Using species mixtures for reforestation to increase albedo of young to middle aged
forest stands.
3.5.2 Integrated Waste Management Strategies
Waste management has become increasingly important due to climate change concerns and
increased public pressure to protect and sustain our environment. Much of what we do with
our wastes, from household waste to animal waste to food processing waste, need to be
changed to meet our goal of sustainability. In particular, consumption habits of the average
Canadian, often referred to as the “throw away society”, resulted in Canada being ranked the
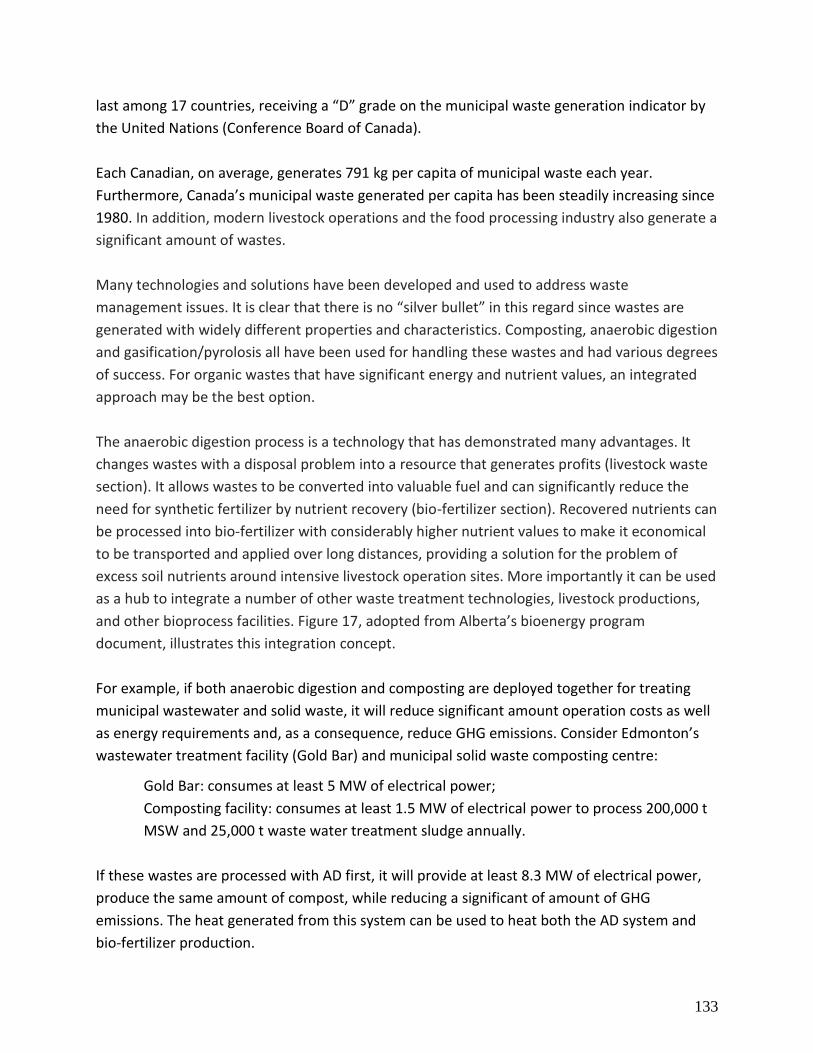
133
last among 17 countries, receiving a “D” grade on the municipal waste generation indicator by
the United Nations (Conference Board of Canada).
Each Canadian, on average, generates 791 kg per capita of municipal waste each year.
Furthermore, Canada’s municipal waste generated per capita has been steadily increasing since
1980. In addition, modern livestock operations and the food processing industry also generate a
significant amount of wastes.
Many technologies and solutions have been developed and used to address waste
management issues. It is clear that there is no “silver bullet” in this regard since wastes are
generated with widely different properties and characteristics. Composting, anaerobic digestion
and gasification/pyrolosis all have been used for handling these wastes and had various degrees
of success. For organic wastes that have significant energy and nutrient values, an integrated
approach may be the best option.
The anaerobic digestion process is a technology that has demonstrated many advantages. It
changes wastes with a disposal problem into a resource that generates profits (livestock waste
section). It allows wastes to be converted into valuable fuel and can significantly reduce the
need for synthetic fertilizer by nutrient recovery (bio-fertilizer section). Recovered nutrients can
be processed into bio-fertilizer with considerably higher nutrient values to make it economical
to be transported and applied over long distances, providing a solution for the problem of
excess soil nutrients around intensive livestock operation sites. More importantly it can be used
as a hub to integrate a number of other waste treatment technologies, livestock productions,
and other bioprocess facilities. Figure 17, adopted from Alberta’s bioenergy program
document, illustrates this integration concept.
For example, if both anaerobic digestion and composting are deployed together for treating
municipal wastewater and solid waste, it will reduce significant amount operation costs as well
as energy requirements and, as a consequence, reduce GHG emissions. Consider Edmonton’s
wastewater treatment facility (Gold Bar) and municipal solid waste composting centre:
Gold Bar: consumes at least 5 MW of electrical power;
Composting facility: consumes at least 1.5 MW of electrical power to process 200,000 t
MSW and 25,000 t waste water treatment sludge annually.
If these wastes are processed with AD first, it will provide at least 8.3 MW of electrical power,
produce the same amount of compost, while reducing a significant of amount of GHG
emissions. The heat generated from this system can be used to heat both the AD system and
bio-fertilizer production.
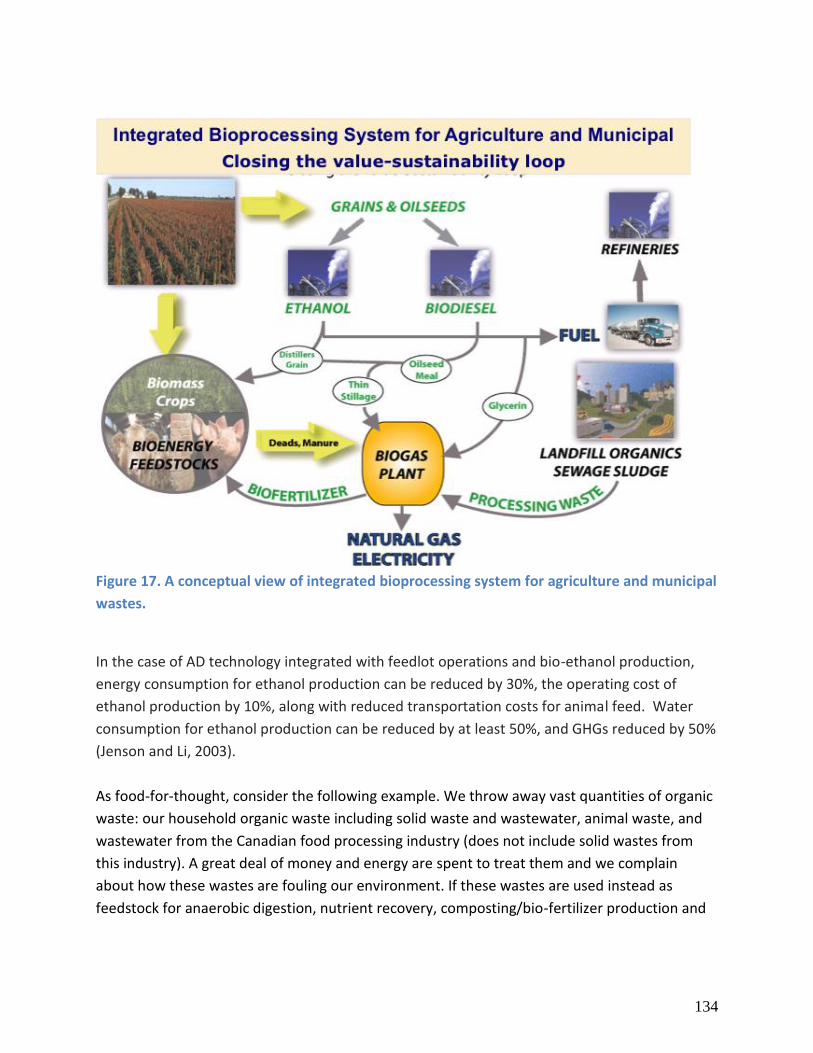
134
Figure 17. A conceptual view of integrated bioprocessing system for agriculture and municipal
wastes.
In the case of AD technology integrated with feedlot operations and bio-ethanol production,
energy consumption for ethanol production can be reduced by 30%, the operating cost of
ethanol production by 10%, along with reduced transportation costs for animal feed. Water
consumption for ethanol production can be reduced by at least 50%, and GHGs reduced by 50%
(Jenson and Li, 2003).
As food-for-thought, consider the following example. We throw away vast quantities of organic
waste: our household organic waste including solid waste and wastewater, animal waste, and
wastewater from the Canadian food processing industry (does not include solid wastes from
this industry). A great deal of money and energy are spent to treat them and we complain
about how these wastes are fouling our environment. If these wastes are used instead as
feedstock for anaerobic digestion, nutrient recovery, composting/bio-fertilizer production and
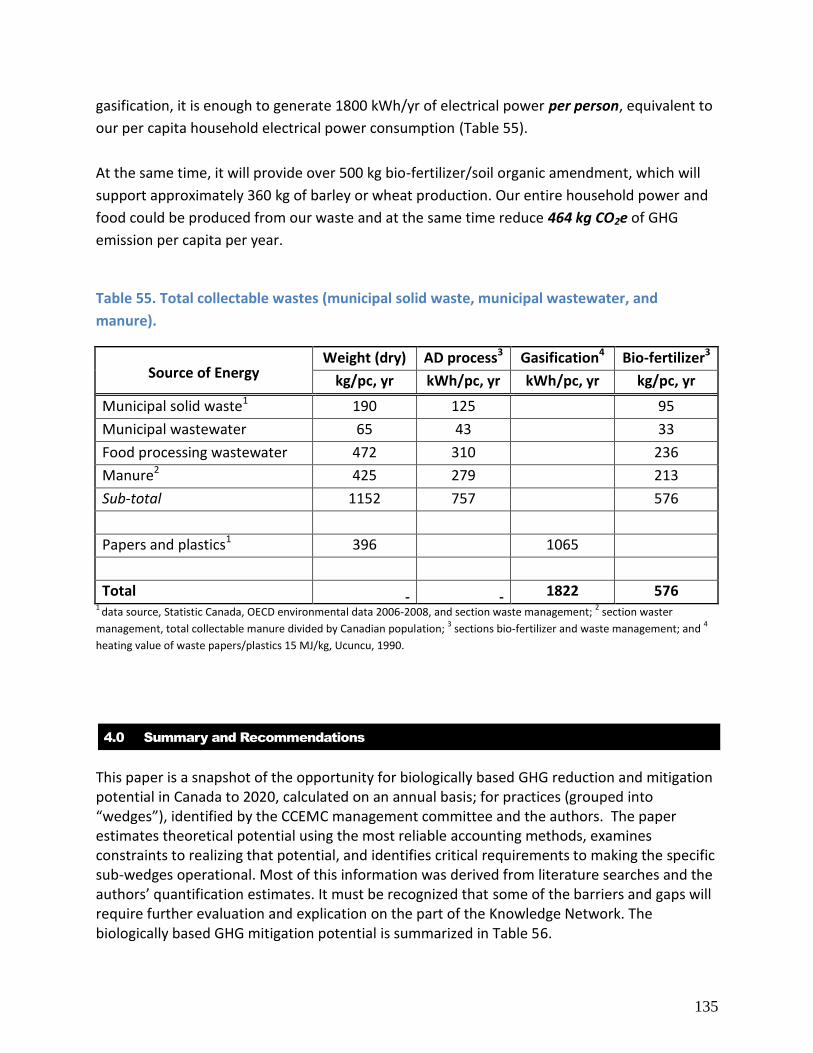
135
gasification, it is enough to generate 1800 kWh/yr of electrical power per person, equivalent to
our per capita household electrical power consumption (Table 55).
At the same time, it will provide over 500 kg bio-fertilizer/soil organic amendment, which will
support approximately 360 kg of barley or wheat production. Our entire household power and
food could be produced from our waste and at the same time reduce 464 kg CO2e of GHG
emission per capita per year.
Table 55. Total collectable wastes (municipal solid waste, municipal wastewater, and
manure).
Source of Energy Weight (dry) AD process3 Gasification4 Bio-fertilizer3
kg/pc, yr kWh/pc, yr kWh/pc, yr kg/pc, yr
Municipal solid waste1 190 125 95
Municipal wastewater 65 43 33
Food processing wastewater 472 310 236
Manure2 425 279 213
Sub-total 1152 757 576
Papers and plastics1 396 1065
Total 1822 576 1
data source, Statistic Canada, OECD environmental data 2006-2008, and section waste management; 2 section waster
management, total collectable manure divided by Canadian population; 3 sections bio-fertilizer and waste management; and
4
heating value of waste papers/plastics 15 MJ/kg, Ucuncu, 1990.
4.0 Summary and Recommendations
This paper is a snapshot of the opportunity for biologically based GHG reduction and mitigation potential in Canada to 2020, calculated on an annual basis; for practices (grouped into “wedges”), identified by the CCEMC management committee and the authors. The paper estimates theoretical potential using the most reliable accounting methods, examines constraints to realizing that potential, and identifies critical requirements to making the specific sub-wedges operational. Most of this information was derived from literature searches and the authors’ quantification estimates. It must be recognized that some of the barriers and gaps will require further evaluation and explication on the part of the Knowledge Network. The biologically based GHG mitigation potential is summarized in Table 56.

136
Table 56 Summary of Canadian biologically based GHG capture and reduction opportunities.
Wedge Sub-wedge Protocol in Place
Theoretical Potential
(Mt CO2e/yr)
Constrained Potential
(Mt CO2e/yr)
Carbon Sequestration
3.1.1 Afforestation/Reforestation no 0.6 0.2
3.1.2 Generic Increases in Forest Productivity no ~ 0.29
3.1.3 Carbon Storage in Forest Soils no ~ ?
3.1.4 Improved Forest Management no 0.075 0.075
3.1.5 Carbon Sequestration in Peatlands no <0.01 <0.01
3.1.6 Avoided Forest Conversion no ~ ~
3.1.7 Delayed Forest Harvesting* no 7.2 2.4
3.1.8 Agriculture Soil Carbon Sequestration 11.38 3.6 to 6.1
3.1.9 Wetlands Sequestration yes 10.14 2.0
3.1.10 Sludge Application to Agricultural lands yes 0.76 0.41
3.1.11 Soil Amendments no 5.3 2.7
SubTotal 35.76 11.26 - 13.77
GHG Reductions
3.2.1 Soil Nitrogen Management yes 2.72-4.54 0.25 - 1.36
3.2.2 Beef and Dairy Cattle - Reductions of CH4 & N2O yes 6.82 2.0 - 2.27
3.2.3 Reductions from Hog, Poultry and some Dairy yes 1.5 0.9 - 1.05
3.2.4 Changes in Logging Slash Disposal no 13.4 3.0
SubTotal 24.4 - 26.26 6.15 - 7.68
Waste Management
3.3.1 Anaerobic digestion yes 4.5-6.2 2.2 - 3.1
3.3.2 Management of Solid Wastes yes 8.5-31.7 20
3.3.3 Biochar Production and Use no 52 - 86.5 7.6 -9.0
3.3.4 Biomass Combustion yes 5.1 1.5
SubTotal 70.1 - 129.5 31.3 - 33.6
Material Switching
3.4.1 Biofertilizers no 2.5 1.1
3.4.2 Building materials switching no 4.42 1.5
3.4.3 Bio-based materials no 79 - 88.0 1.6 - 8.0
SubTotal 85.92 – 94.92 4.2 - 10.6
Total 216.18 - 224.42 52.91 - 65.65
The Canadian theoretical biological GHG mitigation potential is over 200 Mt CO2 e /yr. Applying the constrained potential, the more achievable estimates range from 52.91 to 65.65 Mt CO2 e /yr. In either case, over 53% of this potential is associated with waste management and
137
utilization. The next largest is the carbon sequestration wedge with 20% of the total estimated mitigation potential. The GHG reduction and materials switching wedges share a similar potential of around 12%. Figures 18 to 21 summarize the implement-ability assessment of each wedge.
Figure 18 illustrates that the carbon sequestration potentials of improved forest management and pulp paper sludge application are small but readily implemented. The carbon sequestration potential of agricultural soil and soil amendments is substantial and readily achieved. Afforestation – reforestation and delayed harvesting have substantial carbon sequestration potentials but will require time and changes in paradigms to implement. Many of these sub-wedges have substantial environmental or social co-benefits that merit acknowledgement.
Figure 18 Summary of the carbon sequestration wedge
Figure 19, the GHG reduction wedge shows identified sub-wedges have substantial potential to mitigate GHG emission but will likely be challenging to make operational.
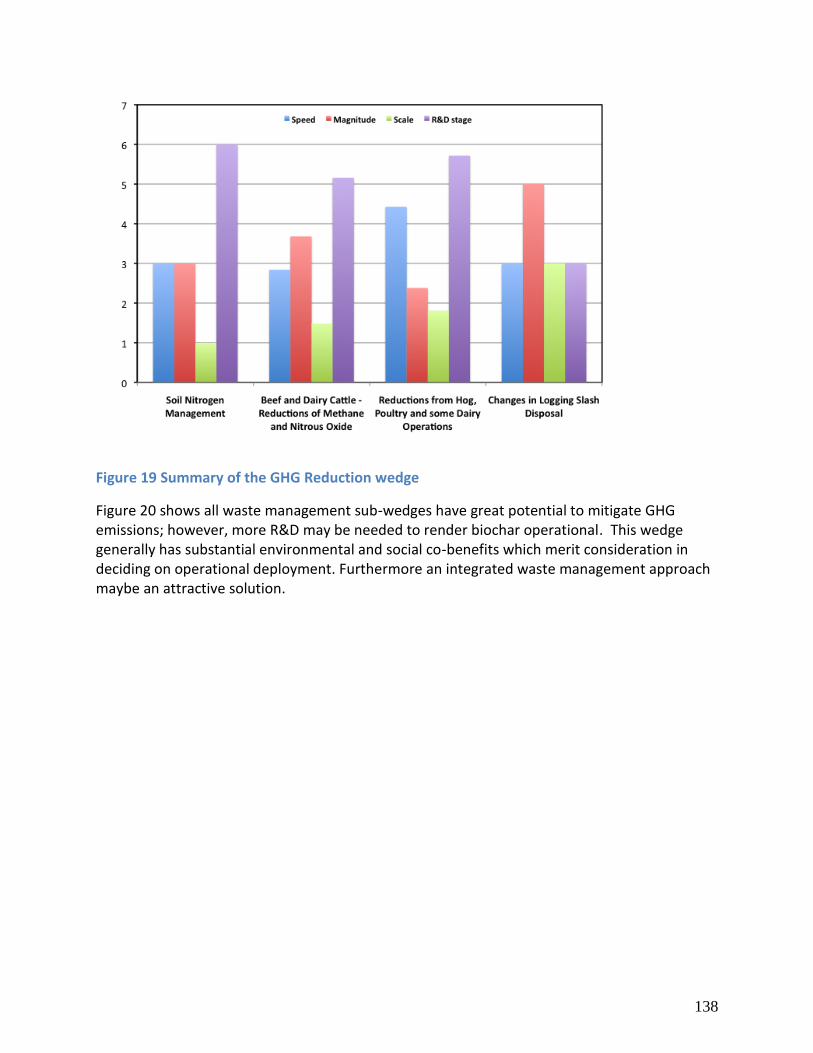
138
Figure 19 Summary of the GHG Reduction wedge
Figure 20 shows all waste management sub-wedges have great potential to mitigate GHG emissions; however, more R&D may be needed to render biochar operational. This wedge generally has substantial environmental and social co-benefits which merit consideration in deciding on operational deployment. Furthermore an integrated waste management approach maybe an attractive solution.
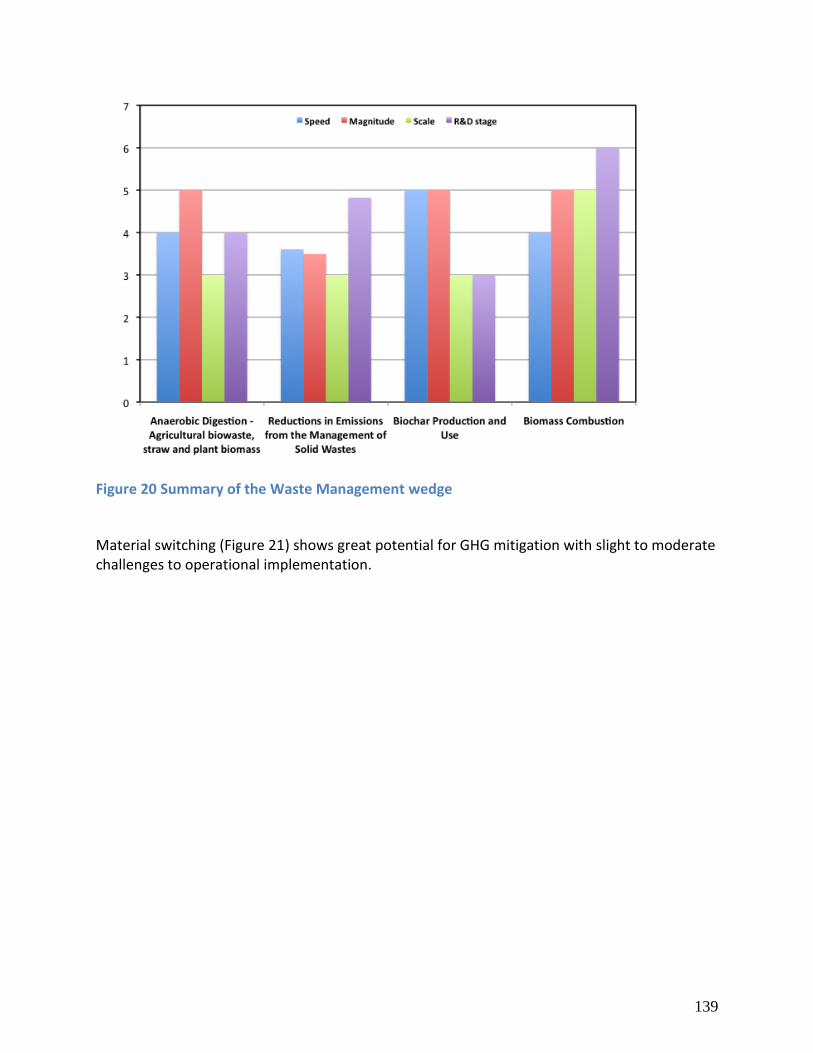
139
Figure 20 Summary of the Waste Management wedge
Material switching (Figure 21) shows great potential for GHG mitigation with slight to moderate challenges to operational implementation.

140
Figure 21 Summary of Materials Switching wedge
To achieve the mitigation potentials identified CCEMC should develop practical and measurable short- and long-term strategic plans. The short-term strategic plan should address:
Quantification tools and enabling policy for large-scale opportunities currently constrained by operational or quantification constraints. These include: bio-fertilizers, building material switching, and biochar, changes in logging slash disposal.
Several quantification protocols require revision or development, including: material switching, biochar production, soil amendments, anaerobic digestion, improved forest management, and integrated waste management.
The long-term strategy should focus on enabling large-scale opportunities, which require significant changes in policy or infrastructure. These include the waste management wedge and delayed forest harvesting. To better enable these opportunities CCEMC should consider supporting:
Refining the precision of, and improving access to, the current national biomass inventory.
Developing a national bio-waste inventory will assist industries and investors in selecting waste management strategies and technologies. The inventory should include bio-waste physical, chemical and biological properties, locations, and quantities.
Developing a national life-cycle analysis database for greenhouse gas mitigation options and opportunities. For example, most current wastewater treatment facilities in Canada
141
require significant amount energy to operation and therefore the associated GHG emissions are significant suggesting a need for adoption of new technologies to realize mitigation options.
Initiating a dialogue between project developers and provincial forest land managers around the ownership of incremental carbon stored in trees on provincial forest lands.
CCEMC might want to consider supporting developers in seeking incentives or policy changes to enable new technologies or novel applications of existing technologies. For example, making biochar generation portable might result in a synergy between reduced open burning of logging debris and biochar as GHG mitigation tool.
CCEMC might want to provide all current and emergent climate registries in Canada a clear set of priorities from CCEMC’s perspective to foster development of protocols arising from the roadmap.
142
5.0 References
Alberta Agriculture and Rural Development 2003 Private Woodlot Enterprises
http://www1.agric.gov.ab.ca/$department/deptdocs.nsf/all/agdex7610 Last Accessed 1 Dec.
2010
Alberta Environment 2010 Alberta Offset System Draft Quantification Protocol for Wetlands
Restoration Draft version 1.0, 15 October 2010
http://carbonoffsetsolutions.climatechangecentral.com/files/microsites/OffsetProtocols/Proto
colReviewProcess/s_Restoration_Protocol_FINAL_POST__Oct15_10_.pdf
Alberta Environment 2010 b Draft Quantification Protocol for Wetland Restoration v. 1.0
http://carbonoffsetsolutions.climatechangecentral.com/files/microsites/OffsetProtocols/Proto
colReviewProcess/s_Restoration_Protocol_FINAL_POST__Oct15_10_.pdf Last Accessed 1 Dec.
2010
Alberta Innovates – Technology Futures (by B. Drozdowski and R. Faught) 2010 Biological
Management – Sequestration and Reduction Potential from Mechanical Pulp Mill Sludge.
Prepared for Karen Haugen-Kozyra. 23 pp.
Alberta Research Council 2008a DRAFT Quantification protocol for mechanical pulp sludge
utilization projects related to agricultural application
http://carbonoffsetsolutions.climatechangecentral.com/files/microsites/OffsetProtocols/Proto
colReviewProcess/5thCycleProtocolDevelopment/Sludge%20Ag%20Application%20Protocol%2
0Draft%20PreReview.pdf
Alberta Research Council 2008b Draft Technical Protocol Plan
http://carbonoffsetsolutions.climatechangecentral.com/files/microsites/OffsetProtocols/Proto
colReviewProcess/5thCycleProtocolDevelopment/TPP%20Sludge%20Application%20Agriculture
Alberta Research Council 2008c Supplemental Information and Technical Background
Document for the Quantification protocol for mechanical sludge utilization projects related to
agricultural land application. Prepared by B. Drozdowski.

143
Alberta Research Council 2009 Technical Protocol Plan: Agriculture Sludge Utilization Alberta
Guidance for Protocol Development
http://carbonoffsetsolutions.climatechangecentral.com/files/microsites/OffsetProtocols/Proto
colReviewProcess/5thCycleProtocolDevelopment/TPP%20Sludge%20Application%20Agriculture
.pdf Last Accessed 1 December 2010.
Alberta Sustainable Resource Development. 2010. Forest Bio-fibre, carbon and carbon
sequestration benefits.
http://www.srd.alberta.ca/ManagingPrograms/ForestManagement/ForestBusiness/documents
/ForestBiofibreCarbonSequestionBenefitsApr2010.pdf Last Accessed 1 Dec. 2010
Alberta Sustainable Resource Development. 2010. Forest Bio-fibre, carbon and carbon
sequestration benefits.
American Society of Agricultural Engineers (ASAE) 2005. Manure production and characteristics.
ASAE, D384.2, March 2005.
Amiro, B.D., J.B. Todd, B.M. Wotton, K.A. Logan, M.D. Flannigan, B.J. Stocks, J.A. Mason, D.L.
Martell, and K.G. Hirsch. 2001. Direct carbon emissions from Canadian forest fires, 1959 –
1999. Can. J. for. Res. 31: 512 – 525.
Amiro, B.D., J.B. Todd, B.M. Wotton, K.A. Logan, M.D. Flannigan, B.J. Stocks, J.A. Mason, D.L.
Martell, and K.G. Hirsch. 2001. Direct carbon emissions from Canadian forest fires, 1959 –
1999. Can. J. for. Res. 31: 512 – 525.
Amonette, J. E., and Joseph, S. 2009. Characteristics of biochar: Micro-chemical properties.
Chapter 3 in (J. Lehmann and S. Joseph, eds.) Biochar for Environmental Management: Science
and Technology. Earthscan, London, UK and Sterling, VA.
Anderson, J.A. and M. K. Luckert. 2007. Can hybrid poplar save industrial forestry in Canada? A financial analysis in Alberta and policy considerations. The Forestry Chronicle 83: 92 – 104. Anyia, A., R. Gibson and S. Wang. 2010 ‘Biochar – A Potential Technology to Sequester Carbon and Sustainably Improve Agricultural and Horticultural Productivity in Alberta’. Alberta Innovates Technology Futures. Araji, A. A. and L. D. Stodick, 1990. The economic potential of feedlot wastes utilization in agricultural production. Biological Wastes 32:111-124.
144
Atlantic Dairy and Forage Institute 2008 Technical Protocol Plan for the certification of a greenhouse gas protocol and calculator for the Canadian dairy industry. http://carbonoffsetsolutions.climatechangecentral.com/files/microsites/OffsetProtocols/ProtocolReviewProcess/SubmittedDraftProtocols/GHGReductionProtocol/ADFI_TPP_Alberta_Environment_Post.pdf Last Accessed 1 Dec. 2010 Badiou pers comm. Pascal Badiou, Ducks Unlimited, slides e-mailed to Karen 5 November 2010 Badiou, P., McDougal, R., Pennock, D., and Clark, B., 2010. Greenhouse gas emissions and carbon sequestration potential in restored wetlands of the Canadian prairie pothole region. Submitted to the Journal of Wetlands Ecology and Management Basarab, J., V. Baron, and Okine, E. 2009 Internal Alberta Agriculture and Rural Development reports. Alberta Agriculture and Rural Development, Agriculture and Agri-Food Canada, and the University of Alberta. Beard-Haughn A., Joengbloed, F., Akkerman, J, Uijl, A., deJong, E., Yates, T., and Pennock, D. 2006. The effects of erosional and management history on soil organic carbon stores in ephemeral wetlands of hummocky agricultural landscapes. Geoderma. 135: 296-306. Betts, R.A. 2000. Offset of the potential carbon sink from boreal forestation by decreases in surface albedo. Nature 408: 187 – 190. Bhatti, J.S., M.J. Apps, and C. Tarnocai. 2002. Estimates of soil organic carbon stocks in central Canada using three different approaches. Canadian Journal of Forest Research 32: 805–812. BIOCAP Canada Foundation. 2003. ‘Canadian Biomass Inventory: Feedstocks for a Bio-Based Economy’. Prepared for Industry Canada. Biochar Protocol Development 2010 Bringing Biochar to the Carbon Market www.biocharprotocol.org Last Accessed 1 Dec. 2010 Bioenergy Feedstock Information Network 2005 Bioenergy Conversion Factors Reference from US Government website: http://bioenergy.ornl.gov/papers/misc/energy_conv.html, last accessed 1 Dec. 2010. BioProducts Canada and Industry Canada. 2004. ‘Innovation Roadmap on Bio-based Feedstocks, Fuels and Industrial Products: Capturing Canada’s Natural Advantage’. ISBN 0-662-36411-2. Website: http://www.ic.gc.ca/eic/site/trm-crt.nsf/vwapj/biobased-biomasse_eng.pdf/$FILE/biobased-biomasse_eng.pdf, last visited November 18, 2010 Bird, D.N., M. Kunda, A. Mayer, B. Schlamadinger, L. Canella, and M. Johnston. 2008. Incorporating changes in albedo in estimating the climate mitigation benefits of land use change projects. Biogeosciences Discuss. 5 1511 – 1543.
145
British Columbia Environment 2010 British Columbia Air Action Plan: Beyond Beehive Burners http://www.bcairsmart.ca/industry/beehiveburners.html Last Accessed 1 Dec. 2010 Brown, S., I.R. Swingland, R. Hanbury-Tenison, G.T. Prance, and N. Myers. 2002. Changes in the use and management of forests for abating carbon emissions: challenges and issues under the Kyoto protocol. Phil. Trans. R. Soc. Lond. 360: 1593 – 1605. Calef, M.P. 2010. Recent Climate Change Impacts on the Boreal Forest of Alaska. Geography Compass 4/2: 67–80. Canada 2010 Federal, Provincial and Territorial Governments of Canada. 2010. Canadian Biodiversity: Ecosystem Status and Trends 2010. Canadian Council of Resource Ministers. Ottawa ON. 146p. (www.biodivcanada.ca/ecosystems GEI 60 C3 C33 2010) Canada’s Action on Climate Change 2010 Methane to Markets partnership http://www.climatechange.gc.ca/default.asp?lang=En&n=14A84E23-1 Last Accessed 1 Dec. 2010 CCME, 2009. The biosolids emissions assessment model. http://www.ccme.ca/BEAM CSA Standards (Canadian Standards Association) 2009 Greenhouse Gas Standards CAN/CSA-ISO 14064 information. http://www.csa.ca/cm/ca/en/iso14064-greenhouse-gases Last Accessed 1 Dec. 2010 Chapin III, F.S., A.D. McGuire, R.W. Ruess, T.N. Hollingsworth, M.C. Mack, J.F. Johnstone, E.S. Kasischke, E.S. Euskirchen, J.B. Jones, M.T. Jorgenson, K. Kielland, G.P. Kofinas, M.R. Turetsky, J. Yarie, A.H. Lloyd, and D.L. Taylor. 2010. Resilience of Alaska’s boreal forest to climatic change. Can. J. For. Res. 40: 1360 – 1370. Chicoine, D.D. and M.M. Mihajlovich. 2010. Wet areas mapping for forest site preparation. AFEX LiDAR Symposium, Grande Prairie, AB. Chen, J., S.J. Columbo, M.T. Ter-Mikaelian, and L.S. Heath. 2008. Future carbon storage in harvested wood products from Ontario’s crown forests. Canadian Journal of Forest Research 38: 1947 – 1958. Christensen, B.T., A.E. Johnston. 1997. Soil organic matter and soil quality—lessons learned from long-term experiments at Askov and Rothamsted. pp. 399-433 In E.G. Gregorich and M.R. Carter (eds) Soil quality for crop productivity and ecosystem health. Developments in Soil Science: 25. Elsevier, New York.
146
Climate Change Central 2009 Approved Alberta Protocols: Guidance Documents and Approved Quantification Protocols http://carbonoffsetsolutions.climatechangecentral.com/offset-protocols/approved-alberta-protocols Last Accessed 1 Dec. 2010 Climate Check 2009 Decision Paper for Nitrous Oxide Emission Reduction Protocol http://carbonoffsetsolutions.climatechangecentral.com/files/microsites/OffsetProtocols/ABProtocolDevelopmentWorkshops/NitrousOxideReduction09/NERP_Webinar_Discussion_Paper_July_09.pdf Last accessed 1 Dec. 2010 Climate Check and Ducks Unlimited 2010 Wetlands Restoration Protocol Protocol Review Presentation 4 Nov. 2010 http://carbonoffsetsolutions.climatechangecentral.com/files/microsites/OffsetProtocols/ProtocolReviewProcess/n_Protocol-Second_Review_Presentation_Nov4th.pdf Last Accessed 1 Dec. 2010 Daviet, F. and Ranganathan, J. 2005. Greenhouse Gas Protocol: The GHG Protocol for Project Accounting World Business Council for Sustainable Development (WBCSD) via World Resources Institute http://www.wri.org/publication/greenhouse-gas-protocol-ghg-protocol-project-accounting Last Accessed 1 Dec. 2010 Dufour, D. 2000. The lumber industry crucial contribution to Canada’s Prosperity. Statistics Canada Research Paper. Catalogue no. 31F0027XIE — No. 01 Dyer, J.A., Vergé, X.P.C., Desjardins, R.L., and Worth, D. 2008. Long-term trends in the GHG emissions from the Canadian dairy industry. Can. J. of Soil Sci. 88 (5): 629-639. Eckford, R. and T.J. Gao, 2009. Development of a preliminary database of digestate chemistry, heavy metal and pathogen content to assist in Alberta regulation compliance. P 132. Report to Alberta Energy BCMDP program. http://www.energy.alberta.ca/BioEnergy/pdfs/HeavyMetalReport.pdf Last Accessed 1 Dec. 2010 Eco-Efficiency Centre, 2008. Eco-Efficiency for food processing industry Fact-sheet. Dalhousie University. http://eco-efficiency.management.dal.ca/Files/Business_Fact_Sheets/food_processing_fs.pdf Last Accessed 1 Dec. 2010 Environment Canada 2010 National Emissions Inventory Report 1990-2008: Greenhouse gas sources and sinks in Canada. http://www.ec.gc.ca/Publications/default.asp?lang=En&xml=492D914C-2EAB-47AB-A045-C62B2CDACC29 Catalogue no. En81-4/2008E-PDF. Last Accessed 1 Dec. 2010

147
Eriksson, E., A.R. Gillespie, L. Gustavsson, O. Langval, M. Olsson, R. Sathre, and J. Stendahl. 2007. Integrated analysis of forest management and substituted wood products. Canadian Journal of Forest Research 37: 671 – 681. Eulliss Jr., N.H., Gleason, R.A., Olness, A., McDougal, R.L., Murkin, H.R., Robarts, R.D., Bourbonniere, R.A., and Warner, B.G. 2006 North American prairie wetlands are important non-forested land-based carbon storage sites. Science of the Total Environment. 361: 179-188 Euskirchen, E.S. , A.D. McGuire, F.S. Chapin III, and T.S. Rupp. 2010. The changing effects of Alaska’s boreal forests on the climate system. Can. J. For. Res. 40: 1336–1346. Favoino, E. and D. Hogg, 2008, The potential role of compost in reducing greenhouse gases. Waste Manag Res 26: 61-69. Feng, Y. and X. Li, 2001. An analytical model of soil organic carbon dynamics base on a simple “hockey stick” function. Soil Science, 266:432-440. Feng, Y. and X. Li, 2002. A tool to determine long-term sustainable manure application rate for Alberta soils. Final report to Canada Alberta Beef Industry Development Fund (CABIDF), p60 Feng, Y. 2009a. Fundamental considerations in soil organic carbon dynamics: A new theoretical framework. Soil Science 174:467-481. Feng, Y. 2009b. K-model—A continuous model of soil organic carbon dynamics: Theory. Soil Science 174:482-493. Feng Y. 2009c. K-model—A continuous model of soil organic carbon dynamics: Parameterization and application. Soil Science 174:494-507. Flannigan, M.D., B.D. Amiro, K.A. Logan, B.J. Stocks, and B.M. Wotton. 2005. Forest fires and climate change in the 21st century. Mitigation and Adaptation Strategies for Global Change. Flannigan, M.D., B.D. Amiro, K.A. Logan, B.J. Stocks, and B.M. Wotton. 2005. Forest fires and climate change in the 21st century. Mitigation and Adaptation Strategies for Global Change. Fleming, R.L., M.F. Laporte, G.D. Hogan, and P.W. Hazlett. 2006. Effects of harvesting and soil disturbance on soil CO2 efflux from a jack pine forest. Can. J. For. Res. 36: 589–600 Gallardo, F., C. Bravo, G. Briceno, and M.C. Diez. 2010 Use of sludge from kraft mill wastewater treatment as improver of volcanic soils: effect on soil biological parameters. R.C. Suelo Nutr. Veg. 10 (1): 48-61. Gaudinski, J.B., S.E. Trombore, E.A. Davidson and S.H. Zheng. 2000. Soil carbon cycling in a temperate forest: radiocarbon based estimates of residence times, sequestration rates and partitioning of fluxes. Biogeochemistry 51:33-69.

148
Gill, R. and MacGregor, B. 2010. GHG Abatement Cost Curves for the Agriculture Sector: Potential to Reduce Emissions; Presentation to Global Research Alliance (see supplemental reference material). http://www.oecd.org/dataoecd/51/27/45677327.pdf Gleason, R.A., Euliss, Jr.N.H., McDougal, R.L., Kermes, K.E., and Steadman, E.N. 2005. Potential of restored prairie wetlands in the glaciated North American prairie to sequester atmospheric carbon. Plains CO2 Reduction (PCOR) Partnership Goodale, C.L., M.J. Apps, R.A. Birdsey, C.B. Field, L.S. Heath, R.A. Houghton, J.C. Jenkins, G.H. Kohlmaier, W. Kurz, S. Liu, G-J. Nabour, S. Nilsson, and A.Z. Shvidenko. 2002. Forest carbon sinks in the northern hemisphere. Ecological Applications, 12: 891–899. Goodwin, E.J. and A.M. Burrow 2006 Effects of application of mill-generated primary sludge and boiler ash on loblolly pine survival and growth. In Connor, K.F. ed. 2006. Proceedings of the 13th biennial southern silvicultural research conference. Gen. Tech. Rep. SRS-92 Asheville, NC: US Department of Agriculture, Forest Service, Southern Research Station, 640 p. Haak, D. 2006 Draft Tillage System Default Coefficient Protocol Developed by the Soil Management Technical Working Group, National Offset Quantification Team; see http://carbonoffsetsolutions.climatechangecentral.com/files/microsites/OffsetProtocols/ProtocolReviewProcess/1stCycleProtocolReview/Tillage/14_No_Till_Default_Protocol_SMTWG_Oct2006_mod.pdf Last Accessed 1 Dec. 2010 Heath, L.S., V. Maltby, R. Miner, K. E. Skog, J.E. Smith, J. Unwin, and B. Upton. 2010. Greenhouse gas and carbon profile of the US forest products industry value chain. Environmental Science and Technology 2010, 44, 3999–4005. Hendrickson, O. 2003. Influences of global change on carbon sequestration by agricultural and forest soils. Environmental Reviews 11: 161–192. Hines, S.J., L.S. Heath, and R.A. Birdsey. 2009. An Annotated Bibliography of Scientific Literature on Managing Forests for Carbon Benefits. General Technical Report NRS-57. USDA Forest Service. ICF Consulting 2005 for Environment Canada and Natural Resources Canada. 2005. ‘Determination of the Impact of Waste Management Activities on Greenhouse Gas Emissions: 2005 Update Final Report’. Contract No. K2216-04-0006. Website: http://www.nrcan-rncan.gc.ca/mms-smm/busi-indu/rad-rad/pdf/icf-finr-eng.pdf, last accessed November 18, 2010. IFA. 2009. Fertilizers, climate change and enhancing agricultural productivity sustainably. First edition. http://www.fertilizer.org/ifa/Home-Page/LIBRARY/Publication-
149
database.html/Fertilizers-Climate-Change-and-Enhancing-Agricultural-Productivity-Sustainably.html Last Accessed 1 Dec. 2010 IPCC, Intergovernmental Panel on Climate Change. 2000. Good practice guidelines and uncertainty management in national greenhouse gas inventories. OECD/ODCE, Paris, France. Intergovernmental Panel on Climate Change (IPCC) 2006 IPCC, Intergovernmental Panel on Climate Change. 2006. http://www.ipcc-nggip.iges.or.jp/public/2006gl/index.html. Accessed November 13, 2010. IPCC 2006b. Guidelines for National Greenhouse Gas Inventories, Chapter 10: Emissions from livestock and manure management. Published on the website: http://www.ipcc-nggip.iges.or.jp/public/2006gl/pdf/4_Volume4/V4_10_Ch10_Livestock.pdf. Last Accessed 1 Dec. 2010 Izaurralde, R.C., W.B. McGill, J.A. Robertson, N.G. Juma and J.J. Thurston. 2001. Carbon Blanca of the Breton classical plots over half a century. SSSAJ 65:431-441. Jenkinson, D.S., 1990. The turnover of organic carbon and nitrogen in soil. Philosophical Transactions of the Royal Society of London B329, 361-368. Jenson, E. and X. Li, 2003. A technical feasibility study of coupling ethanol production with biogas production/utilization. Report to Industry Research Assistant Program (IRAP) and Highland Feeders. Jesse, R. and D. Neabel, 2005. Integrated Manure Utilization System life-cycle value assessment, IMUS LCVA, Final Report. p56.(http://corporate.pembina.org/pub/208 Last Accessed 1 Dec. 2010). Johnstone, J.F., F.S. Chapin III, T.N. Hollingsworth, M.G. Mack, V. Romanovsky, and M. Turetsky. 2010. Fire, climate change and forest resilience in interior Alaska. Canadian Journal of Forest Research 40: 1302 – 1313. Jones, C., C. McConnell, K. Coleman, P. Cox, P. Falloon, D. D. Jenkinson, and D. Powlson. 2005. Global climate change and soil carbon stocks; predictions from two contrasting models for the turnover of organic carbon in soil. Global Change Biology 11, 154–166 Kimmel, K., Kull, A., Salm, J.O., and Mander, U. 2010 The status, conservation and sustainable use of Estonian wetlands. Wetlands Ecology and Management. 18 (4) 375-395 van Kooten, G.C., S. Laaksonen-Craig, and Y. Wang. 2009. A meta-regression analysis of forest carbon offset costs. Canadian Journal of Forest Research. 39: 2153–2167.

150
Kongshaug, G. and H. Agri, (amended T. K. Jenssen and H. Agri), 1998. Energy consumption and greenhouse gas emissions in fertilizer production. Presented at the IFA Technical Conference in Marrakesh in 1998. Kurz, W., G. Stinson and G. Rampley. 2007. Could increased boreal forest ecosystem productivity offset increased carbon losses from increased disturbances? Phil. Trans. R. Soc. B 363, 2261–2269. Kurz, W.A., C.C. Dymond, G. Stinson, G.J. Rampley, W.T. Neilson, A.L. Carroll, T. Ebata, and L. Safranyik. 2008. Mountain pine beetle and forest carbon feedback to climate change. Nature 452: 987 – 990. Li, C., J. Liu, H. Barclay and H. Hans. 2006. Combined forest management effects on landscape carbon stock changes in west-central Canada. Biocap Synthesis Paper. http://www.biocap.ca/images/pdfs/Li_C%20-%20FINAL%20Report.pdf Last Accessed 1 Dec. 2010 Lindwall, W. and Sontaag, B. 2010. Landscapes Transformed: The History of Conservation Tillage and Direct Seeding. Knowledge Impact Society. c/o Johnson-Shoyama Graduate School of Public Policy. University of Saskatchewan. www.kis.usask.ca MacGregor, B. 2010. GHG Abatement Cost Curve for the Agriculture Sector: Potential to Reduce Emissions. Page 40. Matsui, N., Suekuni, J., Nogami, M., Havanond, S., and Salikul, P. 2010 Mangrove rehabilitation dynamics and soil organic carbon changes as a result of full hydraulic restoration and re-grading of a previously intensively managed shrimp pond. Wetlands Ecology and Management. 18 (2) 233-242 McKeever, D.B. 2008. Wood products used in the construction of low-rise non-residential buildings in the United States, 2008. USDA Forest Products Laboratory. McKeever, D. B.; C. Adair and J. O’Connor. 2006. Wood products used in the construction of low-rise nonresidential buildings in the United States, 2003. APA–The Engineered Wood Association, Tacoma, WA. 68 p. McConkey, B., D. Angers, M. Bentham, M. Boehm, T. Brierley, D. Cerkowniak, C. Liang, P. Collas, H. de Gooijer, R. Desjardins, S. Gameda, B. Grant, T. Huffman, J. Hutchinson, L. Hill, P. Krug, C. Monreal, T. Martin, G. Patterson, P. Rochette, W. Smith, B, VandenBygaart, X. Vergé, and D. Worth. 2007. Canadian agricultural greenhouse gas monitoring and reporting system (CanAG-MARS): Methodology and greenhouse gas estimates for agricultural land in the LULUCF sector for NIR 2006, 138 pp.

151
Meng, F-R., C.P-A. Bourque, S.P. Oldford, D.E. Swift and H.C. Smith. 2003. Combining carbon sequestration objectives with timber management planning. Mitigation and Adaptation Strategies for Global Change 8: 371 – 403. Metsaranta, J.M. and W.A. Kurz. 2010. Forests and carbon: positive feedback to climate change or opportunity for mitigation? Alberta Forest Growth Organization Conference, Edmonton, October 2010. Miller R.L., and Fujii, R. 2010 Plant community, primary productivity, and environmental conditions following wetland re-establishment in the Sacramento-San Joaquin Delta, California. Wetlands Ecology and Management. 18 (1) 1-16 Mitch, W.J. and J.G. Gosselink, Wetlands (3rd Ed.), New York: John Wiley and Sons, Inc. 2000. NRTEE (National Roundtable on the Environment and the Economy.) 2002 A wetlands indicator for Canada – Final Report, Ottawa Ontario: Delaney and Associates. April 2002 28 p. Moulin A., P. McCaughey, D. McCartney, M. Entz, S. Bittman, W. Nuttall. 2002. Soil carbon sequestration in pastureland and rotation. Proceedings of the 3rd Manitoba Agronomists Conference. Monreal, C. M., J. Barclay, X. Li, A. Crolla, N. Patni, C. Kinsley. 2010. Bioenergy through the anaerobic digestion of agricultural residues in Canada: I. Biogas and energy yield (submitted to Biomass and Bioenergy). National Forestry Database 2010 Wood Supply – National Tables http://nfdp.ccfm.org/supply/national_e.php Last Accessed 1 Dec. 2010 National Hog Farmer 2010. Hog Numbers in Canada Continue Their Decline. Oct 29, 2010 1:20 PM; http://nationalhogfarmer.com/marketing/price-discovery/hog-numbers-continue-decline-1029/ Last Accessed 1 Dec. 2010 Natural Resources Canada 2008 Forest 2020 PDA Initiative http://cfs.nrcan.gc.ca/subsite/afforestation/forest2020pda Last Accessed 1 Dec. 2010 Natural Resources Canada 2009 The Atlas of Canada: The Boreal Forest http://atlas.nrcan.gc.ca/site/english/learningresources/theme_modules/borealforest/index.html Last Accessed 1 Dec. 2010 Nyborg, M., Molina-Ayala, M., Solberg, E.D., Izaurralde. R.C., Malhi, S.S., and Janzen, H.H. 1998. Carbon storage in grassland soils as related to N and S fertilizer. Adv. Soil Sci. Pages 421-432 in R. Lal, J. Kimble, R. Follett, and B. A. Stewart ed., Management of carbon sequestration in soil. Adv. Soil Sci. CRC Press, Inc., Boca Raton, FL.

152
Oilsands Wetlands Working Group 2000 Guideline for wetland establishment on reclaimed oil sands leases. N. Chymko (ed.) Report # ESD/LM/00-1 Alberta Environment, Environmental Service ISBN 0-7785-1042-5, Publication No. T/517 Available at http://www.environment.gov.ab.ca/info/library/6854.pdf Last Accessed 1 Dec. 2010 Pang X.L. et al. Emergence of novel genetic variants of norovirus prevails epidemic years of gastroenteritis outbreaks in Alberta from 2000 – 2008 related to wastewater, personal communication, 2009. Parton, W.J., D.S. Schimel, C.V. Cole, and D.S. Ojima, 1987. Analysis of factors controlling soil organic-matter levels in great-plains grasslands. Soil Science Society of America Journal 51, 1173-1179. Pastor, J. and W.M. Post. 1988. Response of northern forests to CO2 induced climate change. Nature. 334(7): 55 – 58. Paul, E.A., H.P. Collins, S.W. Leavitt. 2001. Dynamics of resistant soil carbon of Midwestern agricultural soils measured by naturally occurring 14C abundance. Geoderma 104:239-256. Paustian, K., H.P. Collins and E.A. Paul. 1997. Management controls on soil carbon. pp. 15-49 In E.A. Paul, K. Paustian, E.E. Elliott and C.V. Cole (eds) Soil organic matter in temperate agroecosystems: Long-term experiments in North America. CRC Press, Boca Raton. Pell A.N. 1997. Manure and microbes: public and animal health problem? Journal of Dairy Science. 80: 2673-81. Pennock, D., Yates, T., Bedard-Haughn, A., Phipps, K., Farrell, R., and McDougal, R. 2010. Landscape controls on N2O and CH4 emission sfrom freshwater mineral soil wetlands of the Canadian Prairie Pothole region. Geoderma. 155: 308-319 Pollution Probe and BIOCAP Canada Foundation. 2004. ‘Primer on Bioproducts’. ISBN 0-919764-57-6. Website: http://www.pollutionprobe.org/Reports/bioprimer(en).pdf, last accessed November 18, 2010. Prairie Habitat Joint Venture 2010 Website http://phjv.ca/programs.html Last Accessed 1 December 2010 Prairie Habitat Joint Venture 2008 Implementation Plan 2007 – 2012. Report of the Prairie Habitat Joint Venture. Environment Canada, Edmonton, AB. 34 pp. (Revised May 2009) http://phjv.ca/pdf/PHJV%20Implementation%20Plan%20090506-lowres.pdf Price, D.T., D.H. Halliwell, M.J. Apps, W.A. Kurz, and S.R. Curry. 1997. Comprehensive assessment of carbon stocks and fluxes in a Boreal Cordilleran forest management unit. Can. J. For. Res. 27: 2005 – 2016.
153
Price, D.T., D.H. Halliwell, M.J. Apps, W.A. Kurz, and S.R. Curry. 1997. Comprehensive assessment of carbon stocks and fluxes in a Boreal Cordilleran forest management unit. Can. J. For. Res. 27: 2005 – 2016. Rochette, P., D.E. Worth, E.C. Huffman, J.A. Brierley, B.G. McConkey, Jingyi Yang, J.J. Hutchinson, R.L. Desjardins, R. Lemke, and S. Gameda. 2008. Estimation of N2O emissions from agricultural soils in Canada. II. 1990-2005 Inventory. Can. J. Soil Sci. 88: 655-669. Ryan, M.G., M.E. Harmon, R.A. Birdsey, C.P. Giardina, L.S. Heath, R.A. Houghton, R.B Jackson, D.C. McKinley, J.F. Morrison, B.C. Murray, D.E. Pataki and K.E. Skog. 2010. A synthesis of the science on forests and carbon for U.S. forest. Issues in Ecology, Ecological Society of America. Sathre, R. and J. O’Connor. 2008. A Synthesis of Research on Wood Products and Greenhouse Gas Impacts. Vancouver, B.C. FPInnovations – Forintek Division. 74 p. (Technical report TR-19). Saunders, M.J., Jones M.B., and Kansiime, F. 2007 Carbon and water cycles in tropical papyrus wetlands. Wetlands Ecology and Management 15 (6) 489-498 Schuyt, K.D. 2005. Economic consequences of wetland degradation for local populations in Africa. Ecological Economics 53 (2) 177-190. Skog, K.E. 2008. Sequestration of carbon in harvested wood products for the United States. Wood Products Journal 6: 56 -72. Skog, K.E. and G.A. Nicholson. 2000. Carbon sequestration in wood and paper products. Chapter 5: USDA Forest Service General Technical Report RMRS-GTR-59. Smith, P., D. Martino, Z. Cai, D. Gwary, H. Janzen, P. Kumar, B. McCarl, S. Ogle, F. O’Mara, C. Rice, B. Scholes, O. Sirotenko, 2007: Agriculture. In Climate Change 2007: Mitigation. Contribution of Working Group III to the Fourth Assessment Report of the Intergovernmental Panel on Climate Change [B. Metz, O.R. Davidson, P.R. Bosch, R. Dave, L.A. Meyer (eds)], Cambridge University Press, Cambridge, United Kingdom and New York, NY, USA. Sokhansanj, S., S. Mani, M. Stumborg, R. Samson and J. Fenton, 2006. Production and distribution of cereal straw on the Canadian Prairies. Canadian Biosystems Engineering 48:3.39—3.46. Statistics Canada. 2005. “Human Activity and the Environment. Feature Article: Solid Waste in Canada”. Catalogue no. 16-201-XIE. Website: http://www.statcan.gc.ca/pub/16-201-x/16-201-x2005000-eng.pdf, Last Accessed 1 Dec. 2010. Statistics Canada 2006. “Waste Management Industry Survey: Business and Government Sectors”. Catalogue no. 16F0023X. Website:

154
http://www.statcan.gc.ca/pub/16f0023x/16f0023x2006001-eng.pdf, last accessed November 17, 2010. Statistics Canada 2008a Land use, tenure and land management practices: tillage practices used to prepare land for seeding. http://www.statcan.gc.ca/pub/95-629-x/2007000/4182415-eng.htm#tillage Last Accessed 1 Dec. 2010 Statistics Canada 2008b Disposal of waste – by province and territory (2004 – 2006) http://www.statcan.gc.ca/pub/16f0023x/2006001/5212386-eng.htm, Last Accessed 1 Dec. 2010. Statistics Canada 2009 Census of Agriculture Tillage practices used to prepare land for seeding, Canada and provinces, Census years 1991 to 2006 http://www.statcan.gc.ca/pub/95-632-x/2007000/t/4129758-eng.htm#0 Last Accessed 1 December 2010 Statistics Canada 2010 Crop Statistics: Field Crop Reporting Series, http://www.statcan.gc.ca/pub/21f0003g/2009000/crops-cultures-eng.htm Last Accessed 1 December 2010 Statistics Canada 2010a Cattle Statistics, Census of Agriculture http://www.statcan.gc.ca/bsolc/olc-cel/olc-cel?catno=23-012-X&lang=eng Last Accessed 1 Dec. 2010 Statistics Canada 2010b Census of Agriculture, Cattle Statistics http://www.statcan.gc.ca/bsolc/olc-cel/olc-cel?catno=23-012-X&lang=eng Last Accessed 1 Dec. 2010 Statistics Canada 2010c Hog Statistics, Census of Agriculture. http://www.statcan.gc.ca/cgi-bin/af-fdr.cgi?l=eng&loc=http://www.statcan.gc.ca/pub/23-010-x/23-010-x2010004-eng.pdf&t=Hog%20Statistics or http://www.statcan.gc.ca/pub/23-010-x/23-010-x2010004-eng.pdf Last Accessed 1 Dec. 2010 Tcherbakova, N.M., E.I. Parfenova, and A.J. Soja. 2010. Potential effects of albedo feedbacks due to land cover change in Siberia under current IPCC climate change scenarios. Geophysical Research Abstracts 12 Abstract available at: http://meetingorganizer.copernicus.org/EGU2010/EGU2010-6211.pdf Thompson, M., D. Adams, and K.N. Johnson. 2009. The albedo effect and forest carbon offset design. Journal of Forestry December 2009: 425 – 431. Torkashvand, A.M., N. Haghighat, and V. Shadparvar. 2010. Effect of paper mill lime sludge as an acid soil amendment. Scientific Research and Essays 5(11) 1302
155
Trumbore. S. 2000. Age of soil organic matter and soil respiration: Radiocarbon constraints on belowground C dynamics. Ecological Applications, 10:399-411. Trumper, K., M. Bertzky, B. Dickson, G. van der Heijden, M. Jenkins, and P. Manning. 2009. The Natural Fix? The role of ecosystems in climate mitigation. A UNEP rapid response assessment. United Nations Environment Programme, UNEPWCMC, Cambridge, UK Turestsky, M., K. Wiedner, L. Halsey, and D. Vitt. 2002. Current disturbance and the diminishing peatland carbon sink. Geophysical Research Letters. 29:11 21-1 – 21-4. Ucuncu, A. 1990. Energy recovery from mixed paper waste. A report to Sunshares, Department of Civil and Environmental Engineering, Duke University. USDA (United States Department of Agriculture) 2008. U.S. Biobased Products Market Potential and Projections Through 2025. Now, also a book by Williamson, M.A. 2010 ISBN 978-1-60741-033-1 USEPA (United States Environmental Protection Agency). 2010a ‘Emissions Factors & AP 42, Compilation of Air Pollutant Emission Factors: 5th Edition’ 1995 (updated to 2009).. AP 42. Website: http://www.epa.gov/ttnchie1/ap42/, last accessed November 17, 2010 USEPA (United States Environmental Protection Agency) 2010b Climate Change - Waste Frequently Asked Questions http://www.epa.gov/climatechange/wycd/waste/calculators/WARM_faq.html#g Last Accessed 1 Dec. 2010 Valsta, L., B. Lypkie, J. Perez-Garcia, K. Pingoud, J. Pohola, and B. Solberg. 2008. Using forests and wood products to mitigate climate change. In: F. Bravo et al (eds.), Managing Forest Ecosystems: The Challenge of Climate Change, Springer Science + Business Media B.V. 2008 VandenBygaart, E.G. Gregorich and D.A. Angers. 2003. Influence of agricultural management on soil organic carbon: a compendium and assessment of Canadian studies. Canadian Journal of Soil Science 83:363-380. Vergé, X.P.C., Dyer, J.A., Desjardins, R.L., and Worth, D. 2008. Greenhouse gas emissions from the Canadian Beef Industry. Agricultural Systems. 98 (2): 126-134. Vergé, X.P.C., Dyer, J.A., Desjardins, R.L., and Worth, D. 2009. Greenhouse gas emissions from the Canadian pork industry. Livestock Science 121(1): 92-101. Vitt, D.H. 2006. Peatlands: Canada’s past and future carbon legacy. Climate Change and Managed Ecosystems (pp. 201-216)
156
Watmough, M., Ingstrup, D., Duncan, D., and Schinke, H. 2002 PHJV Habitat Monitoring Program. Phase 1: Recent Habitat Trends. Edmonton Alberta: Canadian Wildlife Service; February 2002. West, T.O. and W.M. Post. 2002. Soil organic carbon sequestration rates by tillage and crop rotation: a global data analysis. Soil Science Society of America Journal 66:1930-1946. Wood S.M. and D.B. Layzell. 2003. ‘Canadian Biomass Inventory: Feedstocks for a Bio-Based Economy’. BIOCAP Canada Foundation, Kingston, ON. Prepared for Industry Canada. Contract #5006125 http://www.biocap.ca/images/pdfs/BIOCAP_Biomass_Inventory.pdf Last Accessed 1 Dec. 2010 Woolf, D., J. E. Amonette, F. A. Street-Perrott, J. Lehmann, and S. Joseph. 2010. ‘Sustainable biochar to mitigate global climate change’ Nature Comm. 1:56 (article is OPEN ACCESS online at www.nature.com/naturecommunications) WWF (World Wildlife Fund) Denmark. 2009. ‘GHG Emission Reductions with Industrial Biotechnology: Assessing the Opportunities’. Website: http://assets.panda.org/downloads/wwf_biotech_technical_report.pdf, last visited November 18 2010 Wotton, B.M., C.A. Nock, and M.D. Flannigan. 2010. Forest fire occurrence and climate change in Canada. International Journal of Wildland Fire 19: 253 – 271. Wotton, B.M., C.A. Nock, and M.D. Flannigan. 2010. Forest fire occurrence and climate change in Canada. International Journal of Wildland Fire 19: 253 – 271. Yarie, A.H. Lloyd, and D.L. Taylor. 2010. Resilience of Alaska’s boreal forest to climatic change. Canadian Journal of Forest Research 40: 1360 – 1370. Yurova, A.Y. and H. Lankriejer. 2007. Carbon storage in the organic layers of boreal forest soils under various moisture conditions: A model study for Northern Sweden sites. Ecological Modelling, 204: 475 – 484.