Embed Size (px)
Citation preview

1
Enhancing comparability of data on estimated budgetary support
and tax expenditures for fossil
fuels
final report
Frans Oosterhuis (IVM), Helen Ding (BIO), Laurent Franckx (VITO), Paolo Razzini
(IEEP), and Member State experts

Enhancing comparability of data on estimated budgetary support and tax expenditures for fossil fuels
August 2014 2
Table of Contents
Table of Contents .............................................................................................. 2 Preface and acknowledgements ........................................................................... 6 Note ................................................................................................................ 6 Summary ......................................................................................................... 7 1. Introduction .................................................................................................10
1.1 Policy context ..........................................................................................10 1.2 Existing work on (fossil) energy subsidy estimates and assessments ..............10 1.3 Objective and scope of the present study ....................................................11 1.4 Structure of this report .............................................................................12
2. Methodology ................................................................................................14 2.1 Categorization .........................................................................................14 2.2 Developing common baselines, benchmarks and measurement methods .........18 2.3 Direct budgetary support...........................................................................20 2.4 Tax expenditures......................................................................................22 2.5 Data gathering and analysis .....................................................................40
3. Results ........................................................................................................41 3.1 Direct budgetary support...........................................................................41 3.2 Tax expenditures......................................................................................44
4. Conclusions ..................................................................................................48 References.......................................................................................................49 Annex A Member State reports ...........................................................................53 Austria ............................................................................................................54
Direct budgetary support to consumers/users ...................................................54 Direct budgetary support to producers .............................................................54 Tax expenditures ...........................................................................................56
Belgium ...........................................................................................................60 Direct budgetary support to consumers/users ...................................................60 Direct budgetary support to producers .............................................................61 Tax expenditures ...........................................................................................61
Bulgaria ..........................................................................................................66 Direct budgetary support to consumers/users ...................................................66 Direct budgetary support to producers .............................................................67 Tax expenditures ...........................................................................................70
Croatia ............................................................................................................73 Brief introduction on the Croatian fossil fuel market ...........................................73 Direct budgetary support to consumers/users ...................................................74 Direct budgetary support to producers .............................................................74 Tax expenditures ...........................................................................................74
Cyprus ............................................................................................................77 Direct budgetary support to consumers/users ...................................................77 Direct budgetary support to producers .............................................................77 Tax expenditures ...........................................................................................78
Czech Republic .................................................................................................81 Direct budgetary support to consumers/users ...................................................81 Direct budgetary support to producers .............................................................81 Tax expenditures ...........................................................................................81
Denmark .........................................................................................................84 Direct budgetary support to consumers/users ...................................................84 Direct budgetary support to producers .............................................................84 Tax expenditures ...........................................................................................84

Enhancing comparability of data on estimated budgetary support and tax expenditures for fossil fuels
August 2014 3
Estonia ............................................................................................................88 Direct budgetary support to consumers/users ...................................................88 Direct budgetary support to producers .............................................................89 Tax expenditures ...........................................................................................90
Finland ............................................................................................................93 Direct budgetary support to consumers/users ...................................................93 Direct budgetary support to producers .............................................................93 Tax expenditures ...........................................................................................93
France .............................................................................................................96 Direct budgetary support to consumers/users ...................................................96 Direct budgetary support to producers .............................................................98 Tax expenditures ...........................................................................................99
Germany ....................................................................................................... 102 Direct budgetary support to consumers/users ................................................. 102 Direct budgetary support to producers ........................................................... 103 Tax expenditures ......................................................................................... 105
Greece .......................................................................................................... 109 Direct budgetary support to consumers/users ................................................. 109 Direct budgetary support to producers ........................................................... 113 Tax expenditures ......................................................................................... 116
Hungary ........................................................................................................ 120 Direct budgetary support to consumers/users ................................................. 120 Direct budgetary support to producers ........................................................... 121 Tax expenditures ......................................................................................... 126
Ireland .......................................................................................................... 134 Direct budgetary support to consumers/users ................................................. 134 Direct budgetary support to producers ........................................................... 137 Tax expenditures ......................................................................................... 140
Italy .............................................................................................................. 149 Direct budgetary support to consumers/users ................................................. 149 Direct budgetary support to producers ........................................................... 151 Tax expenditures ......................................................................................... 159
Latvia ........................................................................................................... 167 Direct budgetary support to consumers/users ................................................. 167 Direct budgetary support to producers ........................................................... 167 Tax expenditures ......................................................................................... 168
Lithuania ....................................................................................................... 173 Direct budgetary support to consumers/users ................................................. 173 Direct budgetary support to producers ........................................................... 173 Tax expenditures ......................................................................................... 174
Luxembourg .................................................................................................. 178 Direct budgetary support to consumers/users ................................................. 178 Direct budgetary support to producers ........................................................... 178 Tax expenditures ......................................................................................... 178
Malta ............................................................................................................ 182 Direct budgetary support to consumers/users ................................................. 182 Direct budgetary support to producers ........................................................... 185 Tax expenditures ......................................................................................... 187
The Netherlands ............................................................................................. 192 Direct budgetary support to consumers/users ................................................. 192 Direct budgetary support to producers ........................................................... 192 Tax expenditures ......................................................................................... 193
Poland ........................................................................................................... 195 Direct budgetary support to consumers/users ................................................. 195 Direct budgetary support to producers ........................................................... 196

Enhancing comparability of data on estimated budgetary support and tax expenditures for fossil fuels
August 2014 4
Tax expenditures ......................................................................................... 200 Portugal ........................................................................................................ 202
Direct budgetary support to consumers/users ................................................. 202 Direct budgetary support to producers ........................................................... 202 Tax expenditures ......................................................................................... 202
Romania ........................................................................................................ 206 Direct budgetary support to consumers/users ................................................. 206 Direct budgetary support to producers ........................................................... 206 Tax expenditures ......................................................................................... 207
Slovakia ........................................................................................................ 209 Direct budgetary support to consumers/users ................................................. 209 Direct budgetary support to producers ........................................................... 210 Tax expenditures ......................................................................................... 211
Slovenia ........................................................................................................ 215 Direct budgetary support to consumers/users ................................................. 215 Direct budgetary support to producers ........................................................... 215 Tax expenditures ......................................................................................... 216
Spain ............................................................................................................ 218 Direct budgetary support to consumers/users ................................................. 218 Direct budgetary support to producers ........................................................... 219 Tax expenditures ......................................................................................... 226
Sweden ......................................................................................................... 233 Direct budgetary support to consumers/users ................................................. 233 Direct budgetary support to producers ........................................................... 233 Tax expenditures ......................................................................................... 233
United Kingdom .............................................................................................. 236 Direct budgetary support to consumers/users ................................................. 236 Direct budgetary support to producers ........................................................... 236 Tax expenditures ......................................................................................... 238
Annex B: List of Member State experts.............................................................. 246 Annex C: Share of fossil fuels in electricity production by Member State ................ 247

Enhancing comparability of data on estimated budgetary support and tax expenditures for fossil fuels
August 2014 5

Enhancing comparability of data on estimated budgetary support and tax expenditures for fossil fuels
August 2014 6
Preface and acknowledgements This report presents the results of a study for DG Environment of the European
Commission, carried out under contract # 070307/2013/666574/EU/ENV.F1. The
study was led by the Institute for Environmental Studies (IVM), VU University
Amsterdam. The other participating institutes were VITO, the Institute for European
Environmental Policy (IEEP) and BIO Intelligence Service.
The authors would like to thank:
Małgorzata Kicia and Manfred Rosenstock of DG Environment for their useful
guidance and comments;
the International Energy Agency for enabling us to work with detailed figures
from the Extended World Energy Balances;
the Member State experts (Martina Aleksic, Raluca Alexandru, Andra
Blumberga, Viktorija Bobinaite, Jonathan Cauchi, Andrea Illes, Bettina
Kretschmer, Caroline Lemeire, Keti Medarova-Bergstrom, Britt Marie Kutser,
Leonardo Mazza, Fabio Menten, Hans Michiels, Andreas Mitsios, Daniela Russi,
Raphael Sauter, Martina Solska, Adrian Tan, Pierre-Alexis Duvernois, Sirini
Withana and Lidia Wisniewska) for their data gathering and processing;
Tim Breemersch (TM Leuven) for reviewing the draft Member State reports;
Eric Drissen and Herman Vollebergh (PBL), Patrick ten Brink (IEEP) and
Sébastien Soleille and Shailendra Mudgal (BIO) for providing valuable
information and suggestions.
Note The calculations underlying this report are partly based on IEA material from IEA
Extended World Energy Balances (EWEB) © OECD/IEA 2014, modified by or on behalf
of PBL Netherlands Environmental Assessment Agency.

Enhancing comparability of data on estimated budgetary support and tax expenditures for fossil fuels
August 2014 7
Summary Phasing out subsidies to producers and users of fossil fuels is increasingly seen as an
attractive policy option for climate change mitigation and resource efficiency. A major
obstacle to this seemingly obvious strategy is the lack of agreement on the definition
of a fossil fuel subsidy and on a common methodology to measure or estimate the
levels of financial support from public budgets benefitting fossil fuel production and
use.
The present study aims at developing a harmonized approach to the identification and
quantification of government support to fossil fuels and by applying this approach to
all 28 EU Member States. This could improve the comparability of estimated levels of
support between Member States and enable measurement of progress in phasing out
fossil fuel subsidies. Compared to the existing databases, the information reported on
in this study also covers a slightly wider range of support types, for instance by
including subsidies to fossil fuel infrastructure such as pipelines. Furthermore, the
country coverage is extended to the EU’s 28th Member State, Croatia. Data are
reported for 2010 or 2011 and compared with the situation 5 to 10 years earlier. The
estimated support levels include support to fossil fuel based electricity (by multiplying
the total support to electricity by the share of fossil fuels in each Member State’s
electricity generation fuel mix).
The study focuses on budgetary support (in OECD terms ‘direct transfer of funds’) and
tax expenditures (‘tax revenue foregone’). Both types of support can accrue to
producers as well as to consumers. Budgetary support to producers includes not only
financial transfers (e.g. to coal mining), but also R&D subsidies as well as public
investment in infrastructure (to the extent that it is considered state aid under EU
rules). Tax expenditures benefitting producers include for instance reduced rates in
royalties and corporate taxes. Support to energy users is mostly provided by means of
tax expenditures. Reduced tax rates or preferential tax provisions can benefit specific
sectors (e.g. aviation, shipping, agriculture, energy intensive industry), specific fuels
(e.g. diesel, LNG) or households.
In estimating support levels, the ‘transfer measurement’ approach is used, in which
the transfer of public money to those benefiting from the support is estimated using
budget data and other statistical information. Determining the magnitude of direct
budgetary support is usually relatively straightforward, since government budget
amounts are generally available at sufficiently disaggregated level (though in some
cases subsidy schemes extend beyond the fossil fuels sector and the share of the
sector had to be estimated). Tax expenditures, however, are not systematically
reported by all Member States. Moreover, tax expenditures require a benchmark in
order to be able to estimate subsidy amounts.
The definition of an appropriate common benchmark is one of the most complicated
and contentious issues in measuring levels of tax expenditure. The scientific literature
on this topic does not provide any widely agreed solution to the problem. The present
study takes a pragmatic approach, in which benchmarks are used that follow directly
from existing or proposed policies at EU or national level. For excise taxes and other
specific taxes on energy use, the proposed rates in the Commission’s 2011 proposal
for amending the Energy Taxation Directive are used as the main benchmark. For tax
expenditures in the Value Added Tax, the benchmark is the standard VAT rate as
applicable in the respective Member State.

Enhancing comparability of data on estimated budgetary support and tax expenditures for fossil fuels
August 2014 8
The results of this first attempt to estimate fossil fuel support levels in the EU using a
common approach can be summarized as follows:
Direct budgetary support to energy users is rather limited in the EU. The
total amount in all Member States together probably does not exceed EUR 1
billion per year. The largest single items identified are the tax reimbursements
for energy intensive industries in Austria and Germany, and the Fuel Allowance
in Ireland. Several Member States do not provide any budgetary support to
energy users at all. There is no clear trend observable in the level of this type
of support.
Direct support to producers (including public infrastructure) is also limited
(total annual EU wide amount probably less than EUR 5 billion). Several
Member States do not apply any schemes at all. The main support schemes are
for coal production (in Germany and Poland) and the Italian ‘CIP 6/92’
mechanism (mainly benefitting cogeneration). Subsidies to coal production are
decreasing, and should be terminated by 2018. Some countries provide support
to the development of natural gas infrastructure. The amounts of specific public
R&D support to fossil fuels are generally small (in most Member States no
more than a few million EUR per year; only in France more than EUR 100
million).
Tax expenditures in excise taxes are substantial when using the benchmark
of the tax rates as proposed in the new Energy Tax Directive proposal.
For most Member States, the estimated support levels are between EUR 100
mln and several billions of euros per year, with an EU wide total of almost EUR
28 billion. The amounts differ widely between Member States, both in absolute
and relative (per GJ and per tonne CO2 emissions) terms. In general the
amounts of support show a decreasing trend over time. Apparently, Member
States are reducing the gap between their energy tax systems and the system
as proposed by the Commission, by increasing rates and/or by abolishing
exemptions.
Calculations were also made using an alternative benchmark for excise tax
expenditures: the highest prevailing rate per unit of energy1 in the
Member State in each of the three main categories (transport, heating /
process fuel use, and electricity). This benchmark leads to much higher
estimated amounts (more than EUR 10 billion per year in several Member
States; more than EUR 200 billion in the entire EU). This is mainly due to the
existence of large differences in tax rates between different fuels (e.g. petrol
and other motor fuels) and different user types (e.g. small and large electricity
users), as well as to the fact that the excise tax exemptions for international
aviation and shipping are also included in these estimates. Rather than being
‘realistic’ estimates of fossil fuel support levels, the figures should mainly be
seen as indications for the impact that the choice of a benchmark can have on
such estimates, as well as for the fact that the fiscal treatment of energy
consumption differs widely between fuels and between energy users in most
Member States.
VAT reductions for fossil fuels and/or fossil fuel based electricity are applied
in a minority of Member States. The total amounts involved are particularly
significant in the UK (over EUR 4 billion per year) and Italy (over EUR 1 billion
per year). Overall, there is an upward trend in the level of subsidization. Since
VAT is an ad valorem tax, support levels tend to become higher as energy
prices are increasing. In addition, a number of countries have increased their
1 Calculations using the benchmark ‘highest rate per unit of CO2 emitted’ led to
broadly similar results.

Enhancing comparability of data on estimated budgetary support and tax expenditures for fossil fuels
August 2014 9
standard VAT rate in recent years while keeping the reduced rate at the same
level, again leading to higher amounts of tax expenditure.
Tax expenditures in the corporate income tax and royalty schemes differ
by Member State and interact with eachother. There is no obvious benchmark.
Therefore direct international comparisons are not meaningful. Only for two
countries (Germany and the UK) estimates of significant amounts of support by
way of royalty reductions are available (around EUR 350 million per year in
each of them).

Enhancing comparability of data on estimated budgetary support and tax expenditures for fossil fuels
August 2014 10
1. Introduction
1.1 Policy context
Among the various levers that can help to bring about a transition towards a low-
carbon economy, energy prices that reflect the full social costs of energy (throughout
the supply chain) play a key role. Subsidies for environmentally-harmful energy
carriers distort energy prices and are therefore a major obstacle to achieving
environmental goals. Reforming such subsidies can provide incentives for energy
conservation and for the use of renewable energy carriers, and thus contribute to the
overall goal of resource efficiency. Moreover, it may help alleviate public budget
deficits and in some cases (where the subsidy mainly benefits high income groups)
even lead to a more equal income and wealth distribution.
The call for phasing out fossil-fuel subsidies has gained momentum on the political
level over the last years. Pledges on subsidy reform have been made at high-level
events such as the G20 meeting in Pittsburgh (September 2009), the 10th Conference
of Parties to the Convention on Biodiversity (Nagoya, October 2010) and the Rio+20
conference (Rio de Janeiro, June 2012).
The EU’s 2011 Roadmap for a Resource Efficient Europe, one of the so-called “flagship
initiatives” of the ‘Europe 2020 strategy’ sets the following milestone concerning
environmentally harmful subsidies (EHS): “By 2020 EHS will be phased out, with due regard to the impact on people in need”
2. Similarly, in the Environment Action
Programme for 2013-2020, agreed in 2012, the sixth priority objective is to get prices
right, highlighting the need to reform environmentally harmful subsidies and to apply the polluter pays principle more systematically.
3
Previous studies on EHS for DG Environment
4 have emphasized the importance of
transparency and the availability of reliable data as a precondition for successful
subsidy reform. The present study is intended to contribute to this by developing a
harmonized approach to the identification and quantification of government support to
fossil fuels and by applying this approach to all 28 EU Member States.
1.2 Existing work on (fossil) energy subsidy estimates and assessments
Recent estimates of the amount of subsidies to fossil fuels arrive at global amounts
between almost USD 500 billion and more than 1 trillion per year.5 Non-OECD
countries account for the largest share of total energy subsidies paid out globally,
most of it in form of user subsidies.6
At the EU level, initial surveys of energy subsidies were done in the early 2000s.7 A
major step forward was taken in 2012 when the OECD presented a report on the
estimated budgetary support and tax expenditures in all of its Member States, which
was updated in 2013.8 A complementary study was done by IVM and others, using the
2 European Commission (2011).
3 European Commission (2012).
4 Valsecchi et al. (2007, 2009). Withana et al. (2012).
5 IMF (2013), Worldwatch Institute (2013).
6 UNEP (2008).
7 See e.g. Oosterhuis (2001), EEA (2004).
8 OECD (2013a).

Enhancing comparability of data on estimated budgetary support and tax expenditures for fossil fuels
August 2014 11
OECD methodology, to cover the EU Member States that are not OECD members.9 BIO
has also led a recent EU study10 focusing on modelling macroeconomic effects of
phasing out fossil fuel subsidies in EU Member States by 2020, along with an in-depth
qualitative assessment of five subsidies, or sets of subsidies in seven selected
European countries.11 DG Energy has recently commissioned a study on energy costs
and subsidies in the EU, which is being carried out by a consortium led by Ecofys.
Despite this progress, the comparability of the information collected for the different
Member States remains limited, mainly due to the fact that there is no consensus on
the definition of an energy subsidy and on the criteria that should be applied to include
a specific scheme in an inventory of subsidies and tax expenditures. Moreover, the
quantification of subsidy amounts involved is not straightforward: there are issues of
benchmark selection, measurement methods, and data availability.
1.3 Objective and scope of the present study
DG ENV would like to improve the comparability of data on fossil fuel subsidies across
EU Member States. This would make it possible to obtain better measures of progress
towards the objective of phasing out EHS and to create a ‘scoreboard’ on fossil fuel
support across Member States.12 It would also allow the adding up of national figures
on total amounts of support and on specific components, as well as statistical analyses
and the calculation of relative figures (e.g. fossil fuel subsidy amounts as percentages
of GDP, per capita, per unit of final energy use etc.). Meaningful comparisons between
Member States would then become possible, for example between the level of support
provided to fossil fuels in comparison to renewable energy sources.
This work takes place in a highly politically sensitive setting. The current lack of
uniform fossil fuel subsidy reporting can in part be explained by different views among
Member States on the need for reform and its scope, and different preferences for
specific reform options. A harmonized approach would need to take these sensitivities
into account, while at the same time being methodologically sound and free of
subjective judgments and biases.
The overall objective of this study is to produce a more comprehensive picture of
subsidies to fossil fuels in the EU-28, a database that provides more comparable data
across the Member States. This is done by:
taking a consistent approach across all MS by harmonising the coverage of
certain types of tax expenditures and budgetary expenditures;
9 Oosterhuis et al. (2013).
10 BIO et al. (2013).
11 A different approach was taken recently by NERA (2014). This study aims at
presenting a comprehensive picture of all tax and subsidy flows from and to the
different energy sectors (both fossil and renewables). In this way the problem of
selecting benchmarks for tax expenditures is circumvented, but the results are less
suitable for an analysis of specific (dis)incentives for certain fuels and sectors and of
possible reform options. 12 One should be careful, however, when interpreting such ‘scores’. For example, if a
Member State would terminate certain energy tax breaks for particular groups, but at
the same time reduce the general energy tax rate. the amount of subsidy measured
would be reduced whereas the average tax burden on energy might have remained
the same or even decreased.

Enhancing comparability of data on estimated budgetary support and tax expenditures for fossil fuels
August 2014 12
expanding coverage of the database by indirect subsidies to fossil fuels such as
for example financing infrastructure for fossil fuels (for example pipelines,
storage facilities);
expanding the database by covering subsidies in Croatia.
The study thus focuses on budgetary support and tax expenditures. In terms of the
OECD taxonomy of subsidies (see Table 1.1), these come under the headings ‘Direct
transfer of funds’ and ‘Tax revenue foregone’. Support can be absolute (grants) or
relative (tax preferences). The study covers subsidies to energy producers as well as
to energy users (or consumers). It focuses on measures at (national) MS level, but
schemes at lower levels of governance are included when relevant. EU subsidies (e.g.
within the framework of the ‘Connecting Europe Facility’ and the Structural Funds13)
are outside the scope of the present study.
In order to enable an intertemporal comparison, data are reported for two separate
years: the most recent year for which sufficient data are available (for most Member
States 2010 or 2011) and a single year in the period 2000-2005 (depending on data
availability).
1.4 Structure of this report
Chapter 2 presents the methodology that was developed and discusses the various
issues that were considered and choices that were made. In chapter 3, the results for
all 28 Member States are summarized. Chapter 4 discusses the outcomes and draws
some conclusions. Annex A contains detailed results for each Member State. The Excel
files with the calculations for each Member State are available upon request from the
authors or from DG ENV.
13 Financing from the Structural Funds usually has to be complemented by financing
from the Member State itself. Such co-financing is included if it can be considered as
budgetary support (e.g. grants to private operators) or as tax expenditures. Direct
investments by governments (in public companies or in public-private arrangements)
are only considered as subsidies under the scope of this study if they are reported as
state aid by the European Commission.

13
Table 1.1 The OECD’s matrix of government-support categories
Statutory or Formal Incidence (to whom and what a transfer is first given)
Production Direct consumption
Output returns Enterprise income
Cost of intermediate
inputs
Costs of Production Factors
Labour Land and natural
resources
Capital Knowledge Unit cost of consumption
Household or enterprise
income
Tran
sfe
r M
ech
anis
m (
ho
w a
tra
nsf
er
is c
reat
ed
)
Direct transfer of funds
Output bounty or deficiency
payment
Operating grant Input-price subsidy
Wage subsidy Grant or subsidised loan
linked to acquisition of
land
Grant or subsidised loan linked to acqui-
sition of machinery
R&D carried out by a govern-
ment institution
Unit subsidy Govern-ment-subsidized life-line electricity
rate
Tax revenue foregone
Production tax credit
Reduced rate of income tax
Reduction in excise tax on
input
Reduction in social charges (payroll taxes)
Property-tax reduction or exemption
Invest-ment tax credit
Tax credit for private R&D
VAT or excise-tax concession
on fuel
Tax reduction related to
energy purchases that exceed a given
share of income
Other government revenue foregone
Under-pricing of a government
good or service
Under-pricing of access to
government land or natural
resources; reduction in
resource royalty or extraction tax
Government transfer of intellectual
property right
Under-pricing of access to a
natural resource harvested by a final consumer (e.g., standing
trees)
Transfer of risk to the government
Government buffer stock
Third-party liability limit for
producers
Provision of security (e.g.,
military protection of supply lines)
Assumption of occupational health and
accident liabilities
Credit guarantee linked to
acquisition of land
Credit guarantee
linked to capital (e.g., loan guarantee)
Price-triggered subsidy
Means-tested cold-weather
grant
Induced transfers
Import tariff or export subsidy
Monopoly concession
Monopsony concession;
export restriction
Wage control Land-use control in
favour of a particular use
Credit control (sector-specific)
Stronger than standard IPR protection
Regulated price; cross subsidy
Mandated life-line electricity
rate
14
2. Methodology
2.1 Categorization
Fossil fuel support measures can be categorized in different ways. A first distinction is
between producer and consumer subsidies, i.e. subsidies of which the (primary) recipients are energy producers and energy users, respectively.
14 The main types of
producer subsidies applied in Europe are listed below, together with an indication on
whether or not they are included in the scope of this study:
1. Direct support to primary producers. In the EU, these subsidies are
nowadays mainly restricted to coal mining in a few MS, and are being phased
out by 2018, driven by EU State Aid rules. These direct producer subsidies are
included in the present study.
2. Support for restructuring, social plans etc. in former mining
areas. Since such subsidies do not in any way favour the production of fossil
fuels, it has been agreed to leave these outside the scope of the present study.
3. R&D subsidies to the fossil fuels industry: these can lead to
increases in fossil fuel use (e.g. if used for the development of improved drilling
technology), but also to higher energy efficiency (better combustion
technology) or lower GHG emissions (CCS technology). They may therefore
either be environmentally harmful or environmentally beneficial. R&D subsidies
are inlcuded in the present study to the extent that data on specific amounts
for fossil fuels were available.
4. Public investment in energy infrastructure. As indicated above,
such investments (in public companies or in public-private arrangements) are
not to be considered as subsidies within the framework of this study, unless
they can be considered as budgetary support (e.g. grants to private operators)
or as tax expenditures. More implicit types of investment support (e.g. when a
government accepts lower rates of profitability or lower levels of efficiency than
a private investor would do) bring along serious measurement problems and
are not quantified. In order to evaluate whether public funding for
infrastructure should be considered a subsidy if the user has to pay for its use,
the research team has used the criteria applied by the Commission (see
Section 0 for a more detailed discussion).
A specific issue are “dual use” subsidies, i.e. subsidies for infrastructure that
could be used both by fossil fuels and for instance biofuels. Since most of the
existing infrastructure is focused on fossil fuels, subsidies for such
infrastructure are regarded as fossil fuel subsidy support (see section 0).
5. Fiscal incentives for oil and gas exploration and exploitation (e.g.
reduced rates in royalties and corporate taxes) are included in the analysis, but
mainly in a descriptive way due to the complications related to the choice of
appropriate benchmarks (see Sections 0 and 0).
14 The term ‘consumer’ in this respect does not only refer to households, but to all
users of energy, including business and institutions. Obviously, there are borderline
cases, for instance if the subsidy goes to a sector that transforms one type of energy
into another (e.g. refineries, power plants). Please also note that a ‘producer subsidy’
can influence consumer behaviour (if it leads to lower prices) and vice versa.

Enhancing comparability of data on estimated budgetary support and tax expenditures for fossil fuels
August 2014 15
6. Tax reductions and exemptions for energy that is used in the
transformation of energy (e.g. electricity production, refineries, gas
pumping). Such subsidies are often provided because the government does not
want to tax energy twice (i.e. in two stages of the energy chain/cascade).
These tax exemptions are therefore not included. On the other hand, support
to electricity that is produced from fossil fuels is included in the scope of this
study.15
Consumer subsidies can be categorized according to the conditions or criteria for eligibility. There are, for instance, subsidies that benefit specific sectors
16 or specific
fuels, and subsidies to households (sometimes limited to low-income households).
Some MS, such as France, Greece and Italy, also provide fossil fuel tax preferences to
specific regions.
It should be noted that consumer subsidies are commonly given as tax expenditures
(see section 0), and that the measurement of tax expenditures is related to the issue
of benchmark selection – this is further elaborated below.
Table 2.1 gives a preliminary overview of subsidies to sectors, fuels and households
and the extent to which they are covered by previous reports (OECD, 2013a and
Oosterhuis et al., 2013). The table reveals that some kinds of support (such as excise
tax exemptions for commercial aviation, and differences in tax rates between petrol
and diesel) are reported for only a small minority of MS.
15 Although in principle, for reasons of consistency, the same should have been done
for fossil fuel based district heating and other types of (collective) heat supply, this
was not feasible due to lack of data. 16 The use of reduced excise tax rates (or exemptions) for particular sectors, such as
rail, inland shipping or agriculture, may to a certain extent be justified by the lower
level of negative externalities that the use of fuels in these sectors causes in
comparison with road transport (e.g. accidents, congestion). It is then questionable
whether the differentiation should be seen as a fossil fuel subsidy, or if the higher rate
for road transport fuels is a way of internalising these externalities. This is related to
the issue of benchmark setting, discussed below in section 0.

16
Table 2.1 Categories of energy support identified in the OECD (2013a) and IVM (2013) reports
(X = reported: € = reported and quantified; - = not reported; -! = not reported, but known to exist)
Tax exemptions and reductions
Specific sectors Specific fuels Households
Member State
Co
mm
erc
ial a
viat
ion
(d
om
est
ic)
Co
mm
erc
ial s
hip
pin
g (d
om
est
ic)
Pu
blic
tra
nsp
ort
; rai
lway
s;
taxi
s
Larg
e e
ne
rgy
use
rs;
en
erg
y in
ten
sive
ind
ust
ry
Agr
icu
ltu
re (
incl
.
ho
rtic
ult
ure
)
CH
P a
nd
dis
tric
t h
eati
ng
Oth
er
sect
ors
Dif
fere
nce
bet
we
en
d
iese
l an
d p
etro
l
Exem
pti
on
or
red
uct
ion
for
e.g
. LP
G, L
NG
Ene
rgy
and
exc
ise
tax
es
Val
ue
Ad
de
d T
ax (
VA
T)
Austria X X € € € € - -! - - -
Belgium -! X €/X €/X € - € -! - € X
Bulgaria -! - - - € - - -! - € -
Croatia
Cyprus -! - - - € - - -! - X -
Czech Republic X X X - X X X -! € € -
Denmark X X X - - € - € - - -
Estonia X - - X €/X € €/X -! - € X
Finland X € - € € € €/X € X € -
France € € € - € € € -! € € €/X
Germany € X € € € X € -! € X -
Greece -! € - - € - € -! - X X
Hungary -! - € - € - - -! - - €
Ireland -! - - - - - - -! - - X
Italy -! € € X € - - -! € X X
Latvia € € € € € -! € € €

Enhancing comparability of data on estimated budgetary support and tax expenditures for fossil fuels
August 2014 17
Tax exemptions and reductions
Specific sectors Specific fuels Households
Member State
Co
mm
erc
ial a
viat
ion
(d
om
est
ic)
Co
mm
erc
ial s
hip
pin
g (d
om
est
ic)
Pu
blic
tra
nsp
ort
; rai
lway
s;
taxi
s
Larg
e e
ne
rgy
use
rs;
en
erg
y in
ten
sive
ind
ust
ry
Agr
icu
ltu
re (
incl
.
ho
rtic
ult
ure
)
CH
P a
nd
dis
tric
t h
eati
ng
Oth
er
sect
ors
Dif
fere
nce
bet
we
en
d
iese
l an
d p
etro
l
Exem
pti
on
or
red
uct
ion
for
e.g
. LP
G, L
NG
Ene
rgy
and
exc
ise
tax
es
Val
ue
Ad
de
d T
ax (
VA
T)
Lithuania X - X - € - € -! X X €
Luxembourg - - - - € - - -! - € X
Malta X X - - - - - -! - - X
Netherlands X -! - -! € - € -! - € -
Poland X X X X € X X X X -
Portugal -! € X - €/X € € -! X € X
Romania X X € - € - - -! - X -
Slovakia -! € € X € € € -! € € -
Slovenia € € X - € € € -! € - -
Spain € X X - € - € -! - - -
Sweden € € € € € € € € € - -
United Kingdom - - - - X - - - - - €

18
2.2 Developing common baselines, benchmarks and measurement methods
Quantifying or estimating amounts of fossil fuel subsidies can be done in various ways. Different methods can produce widely different outcomes. Koplow
17 makes a
distinction between the ‘price gap’ and the ‘transfer measurement’ approach.
In the ‘price gap’ approach, the difference between domestic and world market
energy prices is taken as a proxy for the impact of subsidies (and other policies). This
method is used, for instance, by the IEA in data gathering for the World Energy Outlook and the online fossil fuel subsidy database.
18
The ‘price gap’ approach reveals both direct and indirect (general equilibrium) impacts
of support, but does not capture subsidies that do not change prices. Moreover, it is
unable to single out the impact of individual subsidy schemes. Finally, its relevance
may be questioned since in most EU countries internal energy prices are generally
above world market prices, due to (among others) taxation.
In principle, one might consider ‘tax subsidies’
19 as the IMF (2013) has done. If the
objective is to identify distortions, this seems to be the correct benchmark. However,
finding the right data within the limits of the budget allocated to the study to estimate
this kind of support was not feasible. It was therefore agreed not to use the ‘price gap’
approach. Instead, the ‘transfer measurement’ approach is used, in which the
transfer of public money to those benefiting from the subsidy is estimated using
budget data and other statistical information.
Determining the magnitude of direct budgetary support is usually relatively
straightforward, since government budget amounts are generally available at
sufficiently disaggregated level (though in some cases subsidy schemes extend
beyond the fossil fuels sector and the share of the sector had to be estimated).
Tax expenditures20 (see section 0), however, which make up the main part of fossil
fuel support in EU countries, are not systematically reported by all Member States.21
Moreover, tax expenditures require a benchmark in order to be able to estimate
subsidy amounts.
The issue of benchmark selection raises several intricate questions. For example, if a
country has a differentiated rate structure in its energy taxes (decreasing with the
17 Koplow, D. (2009).
18 See http://www.worldenergyoutlook.org/resources/energysubsidies/methodology/.
19 This is, subsidies because taxes are below their efficient level: the level that would
maximize social welfare, taking into account externalities and objectives concerning
public finance. 20 One possible definition of tax expenditures is: “provisions of tax law, regulation or
practices that reduce or postpone revenue for a comparatively narrow population of
taxpayers relative to a benchmark tax”. Alternative definitions will be discussed in
more detail in Chapter 0. 21 According to the European Commission’s report ‘Tax reforms in EU Member States
2013’, only 2/3 of the Member States regularly report on or assess their system of tax
expenditures. Moreover, there is a lack of agreement on the definition of tax
expenditures and on benchmarks. See
http://ec.europa.eu/economy_finance/publications/european_economy/2013/pdf/ee5_
en.pdf.

Enhancing comparability of data on estimated budgetary support and tax expenditures for fossil fuels
August 2014 19
amount of energy used), should the benchmark be the highest rate applied? And how
should differences in excise tax rates between different fuels be treated, for instance
between petrol and diesel? Furthermore, should a benchmark be set at the Member
State level, or should a common EU benchmark for each type of support be applied?
What if tax expenditures in one category are used to compensate for the lack of
environmental incentives in other categories of the tax system? For instance, reduced
circulation or purchase taxes for “environmentally friendly” cars could be used to
compensate for the lack of distance based road charging. Similar considerations apply
to public transport subsidies. Reducing these subsidies could then lead to an increase
in the incentives for environmentally undesirable behaviour.
One could argue that if member states report figures on tax expenditures, this means
they have effectively chosen a benchmark, and these figures should be used.
However, this leaves the question open what the benchmark should be if the member
state does not report tax expenditures, or what the comparison point should be if
different member states use different benchmarks. It was therefore agreed not to use
this approach.
For excise taxes and other specific taxes on energy use, the proposed rates in the
Commission’s 2011 proposal for amending the Energy Taxation Directive
(COM(2011)169) can be seen as a ‘natural’ benchmark. This benchmark is used in the
common methodology developed in the present study. For illustrative purposes, the
results of an analysis with an alternative benchmark are also presented. This
benchmark is the highest tax level (per unit of energy and per unit of CO2 emissions)
in the respective Member State in each of the three main categories (transport,
process/heating, electricity) as it was in the year under consideration. For further
discussion on the issue of benchmarks we refer to section 0
For tax expenditures in the Value Added Tax, the standard VAT rate would be a
‘natural’ benchmark, since this is the rate at which consumption is taxed in principle
(reduced rates and exemptions being exceptions to the rule). The standard VAT rate
as prevailing in the Member State in the year under consideration is therefore taken
as the benchmark in the present study. The VAT benchmark issue is discussed in more
detail in section 0.
There are several additional methodological issues at stake in subsidy quantification.
For example, if a subsidy leads to higher corporate profits, the receiving firm may
have to pay a higher amount of corporate tax, thus reducing the net amount of public budget expenditure.
22 On the other hand, reduced excise tax rates also lead to
reduced VAT revenues, since VAT is calculated on the price including excise tax.
Theoretically, methodologies such as the ‘Marginal Effective Tax Rate’ approach would
take such interactions and indirect effects into account, but they require modelling and
are data-intensive. This would be beyond the scope of the common approach to be
developed (although it might be an area for further potential improvement of the
methodology). We will therefore stick to ‘first order’ subsidy estimates (which, in the
case of tax reductions, means: difference in rate multiplied by amount consumed).
This gives reasonable approximations of the magnitude of the amounts of support
involved.
22 For this and other arguments, see e.g. McKenzie et al. (2011).

Enhancing comparability of data on estimated budgetary support and tax expenditures for fossil fuels
August 2014 20
2.3 Direct budgetary support
2.3.1 Introduction
In its review of budgetary support and tax expenditures for fossil fuels in its member
states, the OECD (2011) has concluded that the data on direct budgetary expenditures
constitute a relatively small part of the inventory of transfers. According to the OECD,
these direct transfers are concentrated for the most part in three areas:
i. support for energy purchases by low-income households;
ii. government expenditure on research, development and demonstration
projects, both through government laboratories and through grants to non-
governmental bodies; and
iii. transfers to help redeploy resources in declining fossil-fuel industries, namely
coal.
The OECD has pointed out that “(d)ata on direct budgetary support are relatively easy
to collect and interpret: the data are usually provided in government budget
documents, and there is little need to refer to a hypothetical benchmark – unlike the
case for tax expenditures.”
Therefore, the methodological issues related to direct budgetary support are limited to
the following points:
Should public investment in energy infrastructure be included as subsidies if
the users have to pay for access to the infrastructure? As discussed in Section
0, it was agreed that the research team would consider these investments if
they are “state aid” according to the criteria used by the Commission.
How should we evaluate subsidies for dual use infrastructure, this is
infrastructure that can be used both fossil fuels and some categories of
renewable such as biogas?
Under what conditions should measures for direct price support count as direct
budgetary support?
These issues will be discussed in the next three sections.
2.3.2 Criteria for the evaluation of state aid
The question that needs to be answered here is: under what conditions does the Commission consider State Aid to be present
23?
State Aid is defined as follows under EU Law (Article 107 (1) TFEU): “any aid granted
by a Member State or through State resources in any form whatsoever which distorts
or threatens to distort competition by favouring certain undertakings or the production
of certain goods, shall, in so far as it affects trade between Member States, be
incompatible with the common market”.
The evaluation of an individual support measure thus requires a discussion of the
following cumulative criteria:
23 This is independent from the question whether the State Aid under consideration is
compatible with the internal market on the basis of Article 107(3)(c) TFEU. Whether or
not State Aid is deemed incompatible with the Treaty is not relevant for the purposes
of the current study.

Enhancing comparability of data on estimated budgetary support and tax expenditures for fossil fuels
August 2014 21
Aid granted by a Member State or through State resources: here the
Commission evaluates whether the aid is considered to be granted from State
resources within the meaning of Article 107 (1) TFEU.
Favouring certain undertakings or the production of certain goods: here the
Commission evaluates whether (a) an advantage has been conferred (including
whether under normal market conditions, the beneficiary would have to bear
those costs from the own means) and (b) whether this advantage has a
selective nature.
Distortion of competition and affectation of trade between Member States: here
the Commission evaluates whether the trading conditions will be affected
across the European Economic Area (EEA) between the Contracting Parties to
the EEA Agreement. This includes an evaluation of the impact on potential
competition, and an evaluation of upstream and downstream market
conditions.
In the context of the current study, we have used the State Aid Register from DG
Competition to identify individual measures:
http://ec.europa.eu/competition/state_aid/register/
State aid cases were identified (for every MS and starting in 2000) where fossil fuel
based sectors are the beneficiary. The following sectors were covered :
B.05 Mining of coal and lignite
B.06 Extraction of crude petroleum and natural gas
C.19 Manufacture of coke and refined petroleum products
D.35 Electricity, gas, steam and air conditioning supply
F.42 - Civil engineering
G.46.71 Wholesale of solid, liquid and gaseous fuels and related products
G.47.3 Retail sale of automotive fuel in specialised stores
H.49.5 - Transport via pipeline The register also includes unnotified
24 state aid.
2.3.2 Subsidies for dual use infrastructure
As noted above in section 0, subsidies to infrastructure that can be used for fossil fuels
(such as gas pipelines) are not necessarily 100% fossil fuel subsidies, since the
infrastructure could in some cases also be used for renewables. For example, gas
pipelines for natural gas can in principle also be used for biogas, with certain modifications
25. In the foreseeable future, however, the share of biogas in total gas
supply is likely to remain small. The targets for two of the most advanced MS
(Germany and the Netherlands) for 2020 amount to 7% and 2% of total gas consumption, respectively, and these targets are unlikely to be met
26. Likewise, the EU
target for the share of biofuels in transport is 10% in 2020, implying that in the near
future the infrastructure for transport fuels will still be mainly used for conventional oil
products. We can therefore safely attribute at least 90% of the estimated amount of
subsidies for gas and oil infrastructure to fossil fuels.
2.3.4 Price support
One could argue that guaranteed prices for fossil fuels fall under the header “Induced
transfers” in the OECD classification, and are therefore outside the scope of the
current study. However, price guarantees are sometimes implemented through a
24 For instance, because it falls below the de minimis thresholds.
25 See, for instance, Weidenaar (2011).
26 See van Foreest (2012).

Enhancing comparability of data on estimated budgetary support and tax expenditures for fossil fuels
August 2014 22
scheme where public money is used to purchase energy products at a guaranteed
price, which also falls under the header “direct budgetary support”.
The OECD (2013b) discusses a few such schemes (the Coal Pennies in Hungary and
the Operating Aid to Coal Producers in Spain). Similar schemes have existed in
Germany and in Poland but these have been phased out.
The main conceptual issue is the following:
If the price support is funded directly by the general budget of the government,
then the amount of funding should be used as an indicator of the subsidy (if it
can be identified of course).
In some cases, the price support is funded through earmarked contributions
from users or other economic actors. As long as these contributions are
independent from the actual consumption of the products that receive price
support, they should count as subsidies.
2.4 Tax expenditures
2.4.1 Introduction
Definition
We first make at an attempt at defining the concept of “tax expenditures” and
elaborate on some general issues that go beyond the specific topic of tax expenditures
for fossil fuels.
The OECD (2010a) uses the definition of Anderson: tax expenditures
27 are “provisions
of tax law, regulation or practices that reduce or postpone revenue for a comparatively
narrow population of taxpayers relative to a benchmark tax” (Anderson, 2008).
According to the OECD (2010a) tax expenditures may take a number of different
forms:
allowances: amounts deducted from the benchmark to arrive at the tax base;
exemptions: amounts excluded from the tax base;
rate relief: a reduced rate of tax applied to a class of taxpayers or taxable
transactions;
tax deferral: a delay in paying tax;
credits: amounts deducted from tax liability.
However, even after a brief survey of the literature, the large number of alternative
conceptual definitions is striking. For instance, Bratić (2006) defines them as “all those
items in existing tax forms that mean a loss of central government budgetary revenue
because they reduce either the tax base or the tax due.” Määttä (2012) refers to at
least two different definitions: (a) financial benefits provided through the tax system;
(b) deviations from the benchmark tax system. Jacobsen et al. (2010) use the
following definition: “The term tax expenditure refers to provisions in the tax code that
give favourable tax treatment for an activity or a group of taxpayers.”
It is therefore not surprising that, in a survey of the literature, Bratić (2006)
concludes: “There is no single and all-encompassing definition of tax expenditures.
27 Tax expenditures are also known as tax reliefs, tax subsidies and tax aids (OECD
2010).

Enhancing comparability of data on estimated budgetary support and tax expenditures for fossil fuels
August 2014 23
The different authors who deal with these topics agree on this. Most of them tailor the
definition and the scope of tax expenditures to the particular systems they are
researching. The particular features of a given tax system determine the kinds,
manner and scope of tax expenditures.”
Nevertheless, the OECD (2010b) has argued that all definitions of tax expenditures
share implicitly or explicitly a certain number of elements: a special tax concession
qualifies as tax expenditure if
it implies a reduction of tax revenue (tax liability);
it results in deviations from a benchmark tax structure;
it targets a particular group of taxpayers or economic activity;
it could be replaced by direct spending.
Things become even fuzzier once one attempts to move to operational definitions. The
OECD (2010a) acknowledges that there are several issues with the practical
identification of individual measures. For instance: which tax expenditures are part of
the benchmark and which ones are an exception to it? What is actually the “basic tax
structure”? Which elements of the tax system are structural and which ones not?
In the rest of this section, we shall explore the following issues:
a) what are the different approaches to the definition of the benchmark tax
system?;
b) for a given benchmark, what are the possible methods for quantifying tax
expenditures?;
c) given the difficulties on finding common approaches, is it possible to have
meaningful international comparisons?;
d) what is the approach followed in the current study?
Definition of the benchmark
From the discussion above, it is clear that the definition of the benchmark is crucial in
the identification of tax expenditures. As put by Määttä (2012), a central question is
indeed “whether e.g. certain tax allowance represents a deviation from a benchmark
tax – and thereby tax expenditure – or is considered a general feature of the tax
system in that particular country.”
Craig and Allan (2001) mention three broad approaches which may be identified when defining a benchmark
28. First, a conceptual approach uses a ‘normal’ tax system based
on a theoretical concept of income, consumption, or value-added (depending on the
tax) modified to address data limitations or technical problems in implementing the
concept. Second, a reference law approach uses for the most part a country’s own tax
laws as a basis to define the benchmark, isolating special concessions judged as tax
expenditures. Finally, an expenditure subsidy approach refers only to those
concessions that are clearly analogous to an expenditure subsidy.
As an example of a conceptual approach, Määttä (2012) reminds us that tax policy has
three guiding principles (efficiency, equal treatment of equals, and simplicity) which
may be regarded, in principle, as cornerstones of the benchmark tax system (see also
Jacobsen et al. (2010)):
Efficiency refers to the preservation of incentives for individuals and businesses
to make decisions on the basis of productivity rather than for pure tax benefit.
28 These are also discussed in OECD (2013a).

Enhancing comparability of data on estimated budgetary support and tax expenditures for fossil fuels
August 2014 24
Violating the equal treatment gives taxpayers incentives to seek low-taxed
sources of income or buy untaxed products for tax rather than economic
reasons.
Simplicity contributes to higher transparency, and is easier to comply with (and
thus also to administer and enforce).
However, because these three basic principles often conflict, Määttä (2012) argues
that it is impossible to find any agreement about what should and should not be
included in the benchmark tax system starting from first principles. Moreover (as
discussed for instance in Jacobsen et al. (2010)) the information that is needed to
define the “theoretical” benchmark is not always available. As a result, “the
benchmark tax system usually is a combination of elements from the theoretical
abstract and the actual tax system. (...) The concern is that under this approach the
norm cannot be defined rigorously enough to ensure that the identification of tax
expenditures leads to an objective and reliable outcome.” (Jacobsen et al. 2010)
Therefore, Kraan (2004) concludes that the problem of disagreement in the choice of
a benchmark tax…
“…is rooted in different views of the normative tax base. The normative tax
base is the monetary sum in the hands of private households to which the tax
ought to be applied, for instance: income, value added, profit, sales… [T]he
definition of the normative tax base is a very political exercise. For this reason,
attempts in the past to define tax expenditures in terms of the normative tax
base…have not been very successful. They have led to neither international nor
domestic agreement about the concept of tax expenditure. Thus an alternative
definition of a tax expenditure abstracts from the normative tax base. The
definition uses rather the more neutral yardstick of the “benchmark tax”. Tax
expenditures in this sense are deviations from the benchmark tax. The
benchmark has no normative significance. Deviations from it in order to arrive
at the normative tax base may be perfectly appropriate.”
Thus , instead of starting from first principles, one can list the constitutive elements of
the benchmark. For instance, Kraan (2004) includes following elements in the
definition of the benchmark “the rate structure, accounting conventions, the
deductibility of compulsory payments, provisions to facilitate administration, and
provisions relating to international fiscal obligations”.
According to Kraan’s definition, the existence of differentiated rates does not in itself
imply the existence of tax expenditures: they can be part of the benchmark. According
to OECD (2010b), virtually all benchmark definitions recognize elements to address
taxpayer’s ability to pay and contain provisions to address vertical equity. Therefore,
benchmark systems typically admit progressive tax rate schedules, basic/standard
deductions, zero-rate bands, and deductions for expenses in earning income, perhaps
subject to a cap. Note that this reasoning is based on the concept of vertical equity,
which can also be considered as a first principle. Thus, even in “pragmatic”
approaches, it is impossible to completely avoid normative decisions.
Even then, this approach is far from clear-cut in practice. For instance, the OECD
considers all provisions that may have an impact on the neutrality and horizontal
equity of a tax system or whose objectives could be achieved by alternative public
expenditure policies as tax expenditures.(OECD 2010b). But none of these criteria can
easily be operationalized, and, again, they all involve some value judgements.
It is therefore not surprising that benchmark systems vary from country to country. As
the OECD (2010a) put it:
Enhancing comparability of data on estimated budgetary support and tax expenditures for fossil fuels
August 2014 25
“(s)ome countries have very elaborately specified benchmarks, while others
have only implicit definitions of tax expenditures from which their benchmark
systems are inferred (...) A country with a very general benchmark could
consider many provisions of the actual law to be tax expenditures. In another
country, a more elaborate benchmark might include some of those same kinds
of provisions, which therefore would not be considered tax expenditures.”
Taking into account the discussion above, one easily understands that the most
important criticism against the concept of tax expenditures is focused on the concept
of a benchmark tax system (see Jacobsen et al. 2010). According to Jacobsen et al.,
some object that the concept does not have a sufficiently rigorous formal basis and is
more or less a result of a series of subjective, pragmatic choices. In later sections of
this chapter, we shall attempt to derive appropriate benchmarks for several taxes, and
our analysis will confirm the difficulty of finding firm grounds for the proposed
benchmarks.
Measuring tax expenditures
Even if it were possible to find broad agreement on the definition of the appropriate
benchmarks, measuring tax expenditures would still remain far from obvious.
Indeed, as the OECD (2010a) points out: “(s)ince tax expenditures are not actual
outlays, the amounts “spent” are notional; that is, they are based on assumptions and
estimates as to how taxpayers would behave under particular conditions.”
The literature usually list three different approaches to estimate the cost of tax
expenditures (see e.g. Burman (2003), Jacobsen et al. (2010) and OECD (2010a)):
Revenue foregone: The cost of a tax allowance is the product of tax rate and
the observed amount of the allowance. This is a static estimate of the loss of
tax revenue. and does not take account of behavioural responses. This method
is the easiest to use, but is not based on realistic behavioural assumptions.
Revenue gain: the amount by which tax revenue is reduced as a consequence
of the introduction of a tax expenditure, taking into account behavioural
changes and the effects on revenues from other taxes as a consequence of the
introduction.
Outlay equivalence: the direct expenditure that would be required in pre-tax
terms, to grant the same after-tax gain for the taxpayers as the tax
expenditure. As emphasized by Jacobsen et al., this approach takes into
account the fact that regular transfers are sometimes estimated gross of the
tax paid by the recipient, whereas tax transfers are by definition net of tax.
This can create the impression that the tax expenditure is a cheaper way to get
the same amount of cash into the hands of the recipient than the regular
expenditure.
There are also other issues with the measurement of tax expenditures which we will
address when discussing individual tax types in detail. For instance: should one use
present value calculations when evaluating accelerated depreciation? Or how should
we isolate the effects of tax expenditures that interact with other features of the tax
system (that may fall under the competence of a different political subdivision)? As we
shall see, none of these questions has clear answers.
Comparability
As we have seen above, there are several reasons why benchmarks vary over
countries. Määttä (2012) lists the following criteria according to which the benchmark
may differ between countries and over time:
Enhancing comparability of data on estimated budgetary support and tax expenditures for fossil fuels
August 2014 26
the definition of the tax base or the tax-paying unit,
whether it is adjusted for inflation,
what degree of integration between corporate and individual taxation is
considered the norm,
which accounting period is appropriate,
whether a realization or accruals basis is used for assessment, and
how tax sanctions are assessed.
The OECD (2010a) acknowledges that “comparisons from one country to another are
potentially vulnerable to benchmark issues, such as the identification of provisions as
structural measures of the ability to pay tax.”
The question remains how to cope with these difficulties. Some authors propose to
give up any attempt at international comparisons. For instance, according to Jacobsen
et al. (2010) “a comparison of the number and amount of tax expenditures can be
rather misleading. A general definition tends to generate a lot of tax expenditures,
while a more narrow definition can lead to less or almost no tax expenditures at all. In
between there are systems based on various concepts that differ along several
dimensions.”
In a study for the World Bank, Brixi et al. (2004) go even a step further: “We do not
provide international comparisons of the magnitude of tax expenditures, in part
because countries use different benchmark tax systems and data are not comparable.
Moreover, there is no agreement on the definition of the benchmark tax system and,
consequently, on which provisions are considered tax expenditures and which are
benchmark provisions.”
While we sympathize with these viewpoints, we also think that they go too far. The
relevant question is not whether comparisons are possible, but what type of
comparisons are meaningful in the light of the questions that are being asked. This is
the approach we propose for this study, and which we explain in more detail in the
next subsection.
Approach taken in this study
It is our viewpoint that despite the impossibility to define generally accepted
benchmarks, international comparisons are still possible as long as one acknowledges
that there is no single indicator that can provide an answer to all questions and for all
categories of tax expenditures.
As we shall see below, tax expenditures for fossil fuels can be grouped into three
broad categories:
Some tax expenditures (personal income taxes and social contributions) pose
very deep methodological challenges in principle. However, in the context of
this study, these methodological issues are not relevant because, to the best of
our knowledge, their magnitude compared to other categories of tax
expenditures favouring fossil fuels is negligible.
For royalty concessions, no meaningful international comparisons are possible,
because both royalties payments and exemptions need to be evaluated as a
whole, and need to be related to the corporate income tax. The only relevant
criterion is the impact on the total marginal tax rate of the firm, but it has been
agreed with the Commission services that such calculations would fall outside
the scope of the project. The same consideration applies to the corporate
income tax. Thus, within the scope of the project, we will report country
specific provisions on the royalty regime, and we shall group the figures on

Enhancing comparability of data on estimated budgetary support and tax expenditures for fossil fuels
August 2014 27
royalties and on corporate income taxes. However, the net effect of these
provisions will not be estimated.
VAT and excise taxes confront us with deep methodological issues concerning
the choice of the benchmark. Due to the lack of consensus on the appropriate
benchmark, it is not clear whether it is possible to develop a methodology for
meaningful arithmetic operations on tax expenditures from different countries.
It is, however, possible to report estimated tax revenues and tax expenditures
for different definitions of the benchmark. This would allow the reader to
evaluate how different benchmark affect international comparison. In order to
obtain figures that do not depend on the size of the economy, we need to
relate the absolute figures to meaningful denominators. In this study the estimates of support are presented
29:
Per unit of energy, as in OECD (2013b);
Per unit of CO2.
Thus, acknowledging that no single solution exists for the issue of international
comparisons, we have made calculations using a limited number of benchmarks,
stressing that alternative benchmark definitions may lead to radically different results.
In what follows, we will explain in more detail how we have applied these principles to,
respectively: excise taxes, VAT, personal income taxation and social contribution,
corporate income taxation and royalty payments.
2.4.2 Excise taxes
General context
Excise taxes are subject to legal provisions at the European level. DG TAXUD defines excise taxes as:
30
indirect taxes on the consumption or the use of certain products. In contrast to
Value Added Tax (VAT), they are mainly specific taxes, i.e. expressed as a
monetary amount per quantity of the product.
EU legislation on this issue can be divided into three main categories (DG TAXUD):
The structure of the tax to be applied to a particular group of products. The
structure of taxation means the definition of the product categories, the way in
which the excise duty is calculated, the scope of possible exemptions, etc.
The minimum rates of duty that Member States have to respect for each type
of product. Above those minimum rates, Member States can freely fix their own
rate levels.
General provisions that apply across the product categories. These provisions
concern in particular the production, storage and movement between Member
States of excise products, and are not relevant for the purposes of our study.
For energy products, the most relevant piece of legislation is Directive 2003/96/EC
restructuring the Community framework for the taxation of energy products and
29 The advantages and limitations of each denominator are discussed in detail in
Section 0. 30
http://ec.europa.eu/taxation_customs/taxation/excise_duties/gen_overview/index_en
.htm

Enhancing comparability of data on estimated budgetary support and tax expenditures for fossil fuels
August 2014 28
electricity. The Directive widens the scope of the EU's minimum rate system for
energy products, previously limited to mineral oils, to all energy products including coal, natural gas and electricity
31.
We should also mention that, on 13 April 2011, the European Commission presented
its proposal to overhaul the rules on the taxation of energy products in the European
Union. The new rules aim to take into account both their CO2 emissions and energy
content. Existing energy taxes would be split into two components that, taken together, would determine the overall rate at which a product is taxed
32.
Conceptual issues
In the case of excise taxation, economic theory provides a clear normative
benchmark:
In order not to distort the choice of inputs by firms, intermediate goods should
be untaxed, except in order to correct for externalities.
Excise taxes on consumption fulfil a dual role:
On the one hand, excise taxes are usually levied on substances that are
either harmful to others (for instance, fossil fuels) or to the consumers
themselves (such as tobacco products and alcohol)– therefore, they
have a clear “regulatory” dimension;
On the other hand, excise taxes are levied on goods with a very
inelastic demand: as optimal tax theory requires, these goods should be
taxed heavily. However, because goods with a very inelastic demand
tend to be necessities, distributional concerns could lead to lower rates
than those based on efficiency considerations alone.
Economic theory thus justifies why VAT is (in principle) only levied on final
consumption while excise taxes can be levied on business that use polluting goods as
input in production (OECD, 2013a). The question remains open whether this
normative benchmark is generally accepted and applied in practice.
Määttä (2012) reports that Norway, for instance, applies a benchmark that is based on
the theory of optimal taxation, and explicitly splits the benchmark between fiscal and
environmental excise duties:
For fiscal excise duties the exemption of taxes on production is part of
benchmark and the environmental taxes are in line with external costs. In
Norway, tax expenditures related to environmental taxes are calculated by
deviations from the reference rate that normally is set in accordance with the
estimated external costs. Areas that are exempted from taxes subject to other
significant measures, e.g. quotas, are not normally treated as tax
expenditures.
Other countries take a slightly less rigorous approach. According to Määttä (2012)
Denmark does not consider environmental taxes as tax expenditures if they differ
from the external costs. However, carbon taxes in sectors covered by the Emissions
Trading Scheme are regarded as tax sanction.
31
http://ec.europa.eu/taxation_customs/taxation/excise_duties/energy_products/legisla
tion/index_en.htm 32
http://ec.europa.eu/taxation_customs/taxation/excise_duties/energy_products/legisla
tion/index_en.htm

Enhancing comparability of data on estimated budgetary support and tax expenditures for fossil fuels
August 2014 29
In reality, it will never be possible to design a regulatory excise tax that is perfectly
correlated with the harm caused by the product. Kraan (2004) gives the following
example:
If an excise is levied on a harmful product (for example, pure alcohol), no
exceptions for less harmful products are necessary. In practice excises are
almost never levied on the harmful ingredient per se. The normative tax base
will then deviate from the benchmark.
Thus, any excise system, even if it is designed with an explicit regulatory dimension,
will contain pragmatic choices leading to differentiated rates. It remains open whether
such pragmatic deviations from an ideal benchmark should be considered tax
expenditures.
Actually, even at the theoretical level, there is no agreement on whether excise duties
should be interpreted as merely fiscal taxes or as regulatory taxes as well. To illustrate
how this affects the discussion on the appropriate benchmark, let us consider the old
example of leaded versus unleaded gasoline, which is discussed in both Kraan (2004)
and Määttä (2012):
Even if excise taxes play a regulatory role, the benchmark is not well-defined:
is the lower tax rate of unleaded petrol tax an expenditure or is the higher tax
rate of leaded petrol a tax sanction?
However, some hold the view that excise taxes are not regulatory taxes at all.
Kraan (2004) argues that, under this framework, “a special provision for a less
harmful product is not part of the definition of the normative tax base but an
exception to it.”
In practice, countries introduce excise taxes in a largely ad hoc manner without
explicit normative framework (see also OECD 2013a). However, even then, the line
between conceptual and practical issues is blurred. For instance, “(a)ccording to some,
a meaningful definition of a benchmark tax is only possible if the tax is sufficiently
broad in range. However, excise duties are narrow-based, selective taxes in contrast
to the income taxes and value added tax.” (Määttä, 2012). Some would thus argue
that the concept on tax expenditures does not make sense in the context of excise
taxes.
Two other example of discussions where normative issues are mixed with pragmatic
ones are mentioned in OECD (2013b):
It is common that “fuel used by producers in primary sectors (agriculture,
fishing, forestry and mining) is exempted when used in vehicles not operated
on publicly financed roads, on the basis that at least part of the tax serves as a
means for recovering the cost of building and maintaining those roads or to
internalise costs associated with road use (e.g. accidents and noise).” This
exemption follows the logic that excise taxes levied on vehicle fuels are
(implicitly) partially earmarked for road funding. This is clearly a normative
issue; and not one that fits within the economic theory of optimal taxation. The
OECD (2013b) thus concludes: “The intent of the tax may affect whether or not
the country in question considers a particular exemption to be a tax
expenditure or not.” (emphasis added).
In most OECD countries, and across the EU, industries engaged in the
upgrading or transformation of energy from one form to another enjoy the
“manufacturer privilege” – “a provision of the tax code which deems that fossil
fuel used in the production of final energy products cannot be taxed”. In the
view of the OECD, “(i)f the subsequent consumption of the energy products
resulting from this type of energy transformation process is subject to taxation
(e.g. in the case of an electricity tax at the point of distribution), it might be

Enhancing comparability of data on estimated budgetary support and tax expenditures for fossil fuels
August 2014 30
logical to exempt from tax the fuel inputs (e.g. natural gas) that are
transformed into energy outputs (e.g. electricity) in order to avoid double
taxation”. At the inception meeting, the Commission services have agreed that
“manufacturer privilege” falls outside the scope of this study.
According to Määttä, these difficulties are reflected in a lack of consensus on the
appropriate benchmark. The OECD (2013b) has concluded that few reports “ attempt
to estimate tax expenditures in respect of excise taxes (which, although significant,
may in part be because of conceptual difficulties in defining an appropriate benchmark
system for a tax that is applied to a specific commodity).”
This issue becomes particularly relevant once one moves from national assessments to
international comparisons without using a common benchmark. As the OECD (2013b)
has argued: “A country that applies high rates of taxation to fossil-fuel end products
within the context of a highly differentiated excise-tax system may thus have higher
measured support to fossil fuels than a country with lower but uniform excise-tax
rates, even if the tax system of the former country has higher taxes than the latter
country on each type of fuel.”
We will illustrate this with the excise tax structure that actually exists in the EU, and
we will also propose a pragmatic solution.
Implementation
The Excise Duty Tables published by DG TAXUD33 confirm that that, in several EU
countries, excise taxes are highly differentiated according to the energy source that is
being taxed and according to the applications (heating, transport etc). There is no
evidence that the differentiation reflects differences in external costs according to the
fuel or to the application, and this raises the question whether these differences
should be considered “tax expenditures” or not.
One possible approach is to assume that “broad” differences (e.g. according to fuel
types and “broad” applications such as industry, heating, propelling etc) reflect the
“benchmark” system and that “tax expenditures” refer to exemptions within those
broad categories. Thus, one could argue that the lower taxation of diesel for domestic
heating than for transport is part of the benchmark, and only start refer to “tax
expenditures” if some categories of households benefit from lower rates (or from a
lower tax base).
However, the definition of what constitute “broad” categories is largely an arbitrary
one. The OECD (2013b) for instance differentiates in theory between three main
categories of tax expenditures:
those related to specific groups of consumers, such as some government
entities or low-income earners;
those related to specific tax bases, such a lower tax rate (or exemption) on
diesel relative to gasoline (petrol);
those related to how the fuels are used, diesel use on highways versus diesel
used in primary industries.
33
http://ec.europa.eu/taxation_customs/taxation/excise_duties/energy_products/rates/i
ndex_en.htm

Enhancing comparability of data on estimated budgetary support and tax expenditures for fossil fuels
August 2014 31
However, in practice, the differential taxation of diesel and gasoline in Belgium has for
instance not been reported as tax expenditure in OECD (2013b), which shows that
there is no clear-cut practical application of these criteria.
Even if one would agree on the definition of the categories, this leaves open the
question of the benchmark rate. We have shown above that we are not even remotely
close to a consensus on this point.
Still, the discussion above has also shown that (even qualitative) comparisons
between countries are not possible without using benchmarks that are at least broadly
similar (even though they do not need to be identical). We have also argued that it is
simply impossible to avoid at least some value judgements, even if one does not wish
to refer to theoretical considerations of optimal taxation. The question is not whether
one wants to use normative benchmarks. The real choices we will have to confront is
whether these normative benchmarks should have rigorous foundations, and whether
we think that there is one unique meaningful benchmark.
Taking into account that it is impossible to find a generally acceptable benchmark for
excise taxes, it is debatable whether it is possible to define meaningful arithmetic
operations (such as taking averages) on tax expenditures from different countries
unless one would take one common benchmark across the EU. Such a single common
benchmark has the disadvantage that it does not acknowledge that differences in tax
structures and rates reflect choices made by sovereign countries, which reflect the
preferences of the policy under consideration.
As an alternative, one could define several possible benchmarks for each country, and
report estimated tax revenues and tax expenditures for these different definitions of
the benchmark using some common denominator. This would allow a qualitative
comparison between countries under different possible benchmarks, without making a
final value judgement on the benchmark that is the most appropriate. However,
absolute figures on tax receipts and expenditures depend on the size of each
economy, and cannot be meaningfully compared either. Therefore, both tax revenues
and tax expenditures need to be defined in comparison to some meaningful common
denominator. We discuss all these issues below.
One value judgement that should be broadly acceptable is that excise taxes should be,
to some degree, related to the externalities they supposedly correct. We therefore first
discuss an approach where the benchmarks are defined as a function of external
costs. Next, we elaborate on the approaches that can be taken if one prefers not to
follow this approach. Finally, we consider the different options for common
denominators.
Benchmarks related to external costs
When using external costs as reference point, one has to face the following
complications:
If the excise taxes on a certain fuel in a certain application are lower than the
external costs, then we could argue that this constitutes an implicit subsidy
(whether or not the excise is levied on consumption or on intermediate
products). However, it could well be that the externality is also internalised
through command-and-control measures such as emission standards. Actually,
if a sector is included in the ETS (and if one accepts the assumption that the
ETS prices correctly reflect the social cost of carbon), then any excise tax on its
energy inputs could be considered as an over-internalisation (abstracting from
other external effects than climate impacts). Independently of the thorny issue

Enhancing comparability of data on estimated budgetary support and tax expenditures for fossil fuels
August 2014 32
of whether ETS prices are indeed “correct”, excise taxes cannot be considered
independently from ETS prices. Also, some countries also levy taxes on energy
consumption (expressed in kWh, not in units of the fuel used) or on CO2
emissions. These levies should be converted to taxes on fuel consumption and
added to the relevant excise rates to obtain the total “tax”.
In the case of excise taxes on consumption, there is also a public finance
component, and the taxes can thus higher than the external costs. Can we
then conclude that there is no subsidy from a normative point of view? Let us
for instance suppose that (a) both diesel and gasoline are taxed at a rate that
is higher than their marginal external costs; (b) the external cost of diesel is
higher than the external cost of gasoline; and (c) the unit tax on gasoline is
higher than on diesel. Although this example is purely hypothetical, it does
illustrate a point: the consumption of both gasoline and diesel will be reduced
beyond the optimal level, what can say we about the relative shares of diesel
and gasoline from a normative point of view?
Thus, if we would take a “pragmatic” normative approach, we see that we should take
not only the complete tax structure into account, but also all other environmental
regulations (including other market based instruments). As such a comprehensive
approach is not feasible, an alternative approach is to report three different figures
which reflect three different concepts of “tax expenditure”:
If the marginal external costs are higher than the excise tax rate, then the
difference is a subsidy.
If the excise tax rate on fuel A is higher than its marginal external costs, but is
still lower than the excise rate on other fuel with lower (or equal) external costs
than good A, then fuel A can still be considered to be subsidised. The unit
subsidy is then assumed to be equal to the difference between the two excise
rates (although this is not true from a welfare point of view).
The comparison above could also be made to the same good in different
applications. This would allow us to cope with the difference in excise rates for
fuels used in heating versus transport, or between excise rates in inland
shipping versus road, for instance. The unit subsidy is then again assumed to
be the difference between the two excise rates (again, under the caveat that
this is not true from a welfare point of view).
The question remains open whether, for this purpose of this evaluation, we should add
ETS prices (correctly converted to the fuel under consideration) and other energy
taxes to the excise rate. Here as well, a pragmatic approach seems appropriate, where
we would report both the “restricted” and the “extended” excise rate.
A key feature of this approach is that it remains agnostic on the question whether the
“public finance” component of the excise tax is fulfilled correctly: we take here that
the rates and the differentiation of the rates across products reflect differences in
political preferences across MS.
This approach would reconcile to some extent the need to avoid normative statements
on the rationale behind the subsidies, while still differentiating according to some
broadly comparable categories.
Benchmarks unrelated to external costs
If one does not wish to use external costs as a guideline to define the benchmark,
then the number of possible benchmarks becomes very large indeed.
Some key choices are:

Enhancing comparability of data on estimated budgetary support and tax expenditures for fossil fuels
August 2014 33
Any benchmark should refer to some set of “observed” tax rates. The question
remains whether this should be the highest observation in this set, the lowest, or
some “central” value (average or median)?
Do we define separate benchmarks for each country, or do we use common
benchmarks across the EU?
Do we define separate benchmarks for each fuel:
If no, we need a common denominator for all fuels (see further below).
If yes, do we use one single benchmark for each fuel, or do we define additional
subcategories? Possible subcategories could include for instance the use to which the
fuel is put (see above).
As a pragmatic approach for the present study, it was decided that for excise taxes
and other specific taxes on energy use, the proposed rates in the Commission’s 2011
proposal for amending the Energy Taxation Directive (COM(2011)169) will be used.
For illustrative purposes, the results of an analysis with an alternative benchmark are
also presented. This benchmark is the highest tax level (per unit of energy and per
unit of CO2 emissions) in the respective Member State in each of the three main
categories (transport, process/heating, electricity) as it was in the year under
consideration.
The choice of a common denominator
The use of a common denominator is key if one wants to compare taxes and subsidies
across fuels. Indeed, even though the tax base for an excise always refers to a
physical quantity, this variable is not the same for all fuels: sometimes it is the
volume, sometimes it is the weight, and in some cases it is the actual energy
consumption. Thus, even within a country, comparisons between the tax treatment of
different fuels require the use of a common denominator.
We will consider the following common denominators:
Per unit of energy, as in “Taxing energy use” (OECD 2013b). The advantage of
this approach is that it expresses the taxes and the subsidies relative to the
units that are relevant for the users. The main drawback is that it does not give
any indication to what extent the tax expenditures distorts the market in favour
of the most polluting fuels.
Per unit of CO2, as in “Taxing energy use” (OECD 2013b). The use of such
common denominators illustrates how the excise expressed per unit of CO2
varies across fuels and across their application. Thus, if the benchmark to use
are the CO2 emissions, then it is clear that some applications (such as heating)
and fuels are subject to much lower tariffs than others. The drawback is that
this indicator does not provide any information on other externalities (such as
local air pollution) and is not expressed in a unit that is relevant for the user.
We have also considered reporting these figures per EUR of external damages. One
advantage of this denominator is that it considers all external costs of fossil fuel use,
not just CO2 emissions. The main drawback of this approach is that external costs do
not only depend on fossil fuel use, but also on other parameters (for instance, in the
case of transport on the location of the source) that cannot be taken into consideration
in nationwide studies, implying that the monetary values used are just very gross
approximations. Even more important is that, in the case of industrial emissions, it is
not possible to trace pollutants measured at the stack level back to the fuels that were
used in the process or for combustion. We have therefore dropped this criterion.
One final note: in several OECD countries, some sort of support is provided to poor
households. This support can take the form of a lump sum grant, but also of reduced

Enhancing comparability of data on estimated budgetary support and tax expenditures for fossil fuels
August 2014 34
tariffs on energy use (such as the Social Tariff for Natural Gas in Belgium). As the
tariff also includes the excise paid, one could argue that the share of the excise in the
total tariff reduction corresponds to a tax expenditure rather than direct budgetary
support. This is a complication that we will not further consider. This type of support
will thus always be labelled as “direct budgetary support”.
2.4.3 Value added tax
Context
The OECD (2013b) refers to value added taxes (VAT) as taxes “which are intended to
be broad-based taxes on final consumption representing a percentage of the value of
the good or service sold.” Different rates of VAT apply in different EU member states.
Directive 2006/112/EC requires Member States to apply a standard rate of VAT
(Article 96). The lowest standard rate of VAT throughout the EU is 15% (Article 97),
although member states can apply reduced rates of VAT to certain goods and services
(Article 98).
Definition of the benchmark
For VAT, there is no normative benchmark comparable to the one discussed for excise
taxes. However, as VAT are based on the values of the goods or services, they are
only very indirectly related to any externalities caused by the production or the
consumption of these goods. They are therefore not well suited for regulatory
purposes. This also implies that, from an optimal tax theory viewpoint, intermediate
inputs should be exempt from any VAT (however, see the discussion below).
Therefore, benchmarks are usually defined compared to the “standard VAT rate”,
without references to external costs.
The VAT Directive (2006/112/EC) sets a standard rate of (currently) at least 15% (art.
96-97). Member States may apply one or two reduced rates of at least 5% (art. 98-
99). The supplies to which a reduced rate may be applied (after consultation of the
VAT Committee) include natural gas, electricity and district heating (art. 102). There
are also some country specific provisions on the use of a reduced rate for energy
products (e.g. LPG in Cyprus, art. 104a).
For the purpose of international comparisons, we have considered the following
possibilities for the definition of the benchmark:
Use the minimum EU standard rate of 15%, even when the standard rate in the
country is higher. Thus, if the standard rate in the country is 20%, then a
measure that would reduce the effective VAT rate for some products to 8%,
only 7 percentage points would count as a tax expenditure, even if the
difference with the standard rate is 12 percentage points. Note that only
Luxembourg applies this minimum standard rate of 15%.
Use the country specific standard rate. Since standard rates differ between
member States, this approach limits the comparability of levels of support
across countries. An advantage of this approach is that it acknowledges that
the standard rates reflects the political preferences of each country. This is in
line with the approach used by, for instance, Määttä (2012).
Use the highest standard rate that is currently applied in the EU (27%, in
Hungary), which would imply that all rates (except in Hungary) are tax
expenditures.
Use some “mid-point” standard rate (for instance, 20%). The choice of the
“midpoint” is of course arbitrary.

Enhancing comparability of data on estimated budgetary support and tax expenditures for fossil fuels
August 2014 35
It was agreed that the standard VAT rate as prevailing in the Member State in the
year under consideration would be taken as the benchmark in the present study.
A fundamental feature of VAT is it (and therefore also a reduced VAT rate) is only
effective for final consumption: VAT paid on energy as an intermediate input can be
claimed back by companies, and a reduced rate therefore makes no difference for
them. This is in line with the prescription of optimal tax theory that intermediate
products should not be taxed unless in order to correct for externalities (and excise
taxes are better suited for this purpose than ad valorem taxes).
However, there are exceptions to this rule: companies supplying goods and services
that are exempted from VAT (such as medical and financial services) cannot recoup
VAT paid on their inputs. Therefore, differentiated VAT rates will affect their input mix (to which a special ‘flat rate’ scheme may apply
34). In order to avoid these
complications, we will restrict the discussion of reduced VAT to final consumption by households, which account for the main part of the subsidy.
35
2.4.4 Social contribution and personal income taxes
Conceptual issues
The concept of tax expenditures was first applied to personal income taxes and is
attributed to Stanley S. Surrey. Surrey defines tax expenditures as follows (quoted in
Burman (2003)):
The tax expenditure concept posits that an income tax is composed of two
distinct elements. The first element consists of structural provisions necessary
to implement a normal income tax, such as the definition of net income, the
specification of accounting rules, the determination of the entities subject to
tax, the determination of the rate schedule and exemption levels, and the
application of the tax to international transactions. The second element
consists of the special preferences found in every income tax. These provisions,
often called tax incentives or tax subsidies, are departures from the normal tax
structure and are designed to favor a particular industry, activity, or class or
persons. They take many forms, such as permanent exclusions from income,
deductions, deferrals of tax liabilities, credits against tax, or special rates.
Whatever their form, these departures from the normative tax structure
represent government spending for favored activities or groups, effected
through the tax system rather than through direct grants, loans, or other forms
of government assistance.
There are several problems with this definition. Burman (2003) and Määttä (2012)
point out that there is not even a consensus on how to characterize the “normal
34 As stipulated in the VAT Directive 2006/12, Title XII, Chapter 2.
35 Final energy consumption by households in the EU is about twice the final energy
consumption by the services sector (273 and 143 Mtoe respectively in 2011, according
to Eurostat). A non-negligible part of the services provided by the services sector is
exempted from VAT (e.g. financial and medical services; education). However, the
exact size of VAT-exempt goods and services cannot be estimated since the sectors as
distinguished in the National Accounts do not match the boundaries between VAT-
exempt and non-VAT-exempt goods and services. The only thing that can be said is
that calculating the tax expenditure of a reduced VAT rate on energy for households
only implies a significant underestimation of the total tax expenditure, but that it is
unlikely that the total amount is more than 50% higher.

Enhancing comparability of data on estimated budgetary support and tax expenditures for fossil fuels
August 2014 36
income tax.” The literature often refers to the so-called Schantz-Haig-Simons (SHS)
economic income concept, which defines one period’s income as consumption plus the
change in net wealth during the period. Because this concept is too abstract for
immediate application, the benchmark tax system used in practice is a combination of
elements from the theoretical benchmark and the actual tax system.
Examples of practical problems are:
There is no consensus on how to treat imputed income (such as the imputed
rent on a owner-occupied house), in-work deductions or what kind of expenses
constitutes cost of earned income.
Accelerating deductions and deferring taxable income are both mechanisms to
reduce taxes by taking advantage of the time value of money. However, in
practice, they are not always treated symmetrically in inventories of tax
expenditures - only accelerated depreciation is usually accounted as tax
expenditure.
We refer to Burman (2003) and Määttä (2012) for more details on these intricate
issues.
Implementation
However, for the purposes of this study, it is very unlikely that these discussions will
matter in practice. The OECD (2013a) has only identified a very limited number of tax
expenditures that fall within this category:
Reduced social contributions (Exemption or Deferral of Social Contributions in
Poland), but these have been phased out.
Miners' Bonus in Germany: this has been phased out since 2008
Exemption or Deferral of Taxes and Fines in Poland: in this case, state aid
covered unpaid income taxes and fines in the coal mining sector.
None of these examples pose specific problems in terms of international comparability.
One specific problem raised by the OECD (2013a) is “support provided through
provisions of the income-tax system of many countries that encourages employers to
provide employees with fuel credit cards for buying motor fuels used in company-
owned automobiles”. The OECD has not included these expenditures in the inventory
due to a lack of available data.
2.4.5 Corporate income tax
Conceptual issues
As explained by Valenduc in Brixi et al. (2004) the determination of the benchmark for
corporate income tax should be based on a correct understanding of the nature of
corporations:
Incorporated enterprises (…) are not “final economic agents” but act only as an
intermediary. Any income earned by a corporation is ultimately attributed to
workers, executives, lenders, or shareholders.(…).
Income distributed by corporations consists mainly of wages, interest, and
dividends. Profit also can be retained in the corporation and not distributed.
It should be noted that if the personal income tax system had a tax base
corresponding perfectly to comprehensive income, no corporate income tax
would be needed. Under such a system, wages, interest, and dividends would
be included in personal income, as would retained profits, because retained
profits would result in unrealized capital gain for the shareholder.
Hence, argues Valenduc, the following guidelines for the benchmark tax base:
Enhancing comparability of data on estimated budgetary support and tax expenditures for fossil fuels
August 2014 37
Any income earned by corporations that is not included in the personal income
tax base (such as retained earnings) must be included in the corporate income
tax base.
Corporate income tax also has a withholding function: it is easier to subject
dividends to tax where they are attributed than where they are received, as
there are more shareholders than corporations. As a consequence, any
subsequent taxation could result in double taxation.
Here as well, the practical applications of these principles raises questions for which no
clear-cut answers exist. Valenduc gives, inter alia, the following examples:
The withholding argument would justify a tax base before deduction of interest.
In practice, this has never been implemented.
The tax base should be subject to a single tax rate. Income redistribution and
progressivity are to take place between households, not between corporations.
Therefore, argues Valenduc, any tax rate reduction depending on the size of
the company or the type of activity has to be considered a tax expenditure.
One of the most contentious issues is how to deal with depreciation. As argued by
Valenduc, any accelerated depreciation resulting in a depreciation rate higher than
economic depreciation on a replacement basis must be considered a tax expenditure.
However, according to Määttä (2012):
There is no agreement on a quantitative measure of true depreciation,
In some countries accelerated depreciation is not even regarded as tax
expenditure: these countries justify including accelerated depreciation as part
of the benchmark either because of its general applicability or because of the
absence of robust information about true economic depreciation to use as a
benchmark.
Määttä (2012) concludes that “the absence of a single accepted methodology for
defining the benchmark for the corporate income tax has led to considerable
differences between countries as to what elements are considered to be in the
benchmark.”
Implementation
For practical purposes, the discussion here can be limited to the issue of accelerated
depreciation (the interaction between royalty payments and corporate taxation will be
discussed in Section 2.4.6): from OECD (2013a) and Oosterhuis et al. (2013), these
are the only schemes affecting corporate taxation that are relevant for the
measurement of fossil fuel subsidies in the EU (there are other issues that are relevant
in some non-EU OECD countries, but these are not relevant for the purposes of this
study).
In the absence of convincing arguments in favour of an alternative, the existing tax
schedule of each individual country will be taken as the relevant benchmark.
The main methodological question then is whether one should use the nominal cash
flow approach or the present value approach for the estimation of the corresponding
tax expenditure (OECD 2013a):
The nominal cash flow approach measures the extent to which taxes in a
particular year are higher or lower as a result of the accelerated allowance than
they would have been in its absence.
The present value approach measures the discounted value of the time series
of annual cash-flow tax expenditures, normally estimated from the time at
which the asset is purchased.

Enhancing comparability of data on estimated budgetary support and tax expenditures for fossil fuels
August 2014 38
Conceptually, the present value approach is the right approach, unless one can
assume that the assets benefitting from accelerated depreciation are in some sort of
steady state. Indeed, if the age of the assets that enjoy accelerated depreciations is
correlated (which seems very likely if the measure was targeted at some specific
industry), then the nominal cash flow approach can completely bias our estimates. For
instance, if the assets under consideration are sufficiently old, our current
observations may include only negative tax expenditures, even though the benefitting
firms have enjoyed a net tax credit on a present value basis.
The main limitation of the net present value approach is that it depends on data (the
expected longevity of the assets and the expected profits before depreciation over the
entire life-cycle) that may not be available.
A specific issue is the following. In the UK gas and oil sector, it is impossible for
companies to deduct interest costs and other financing charges. At the same time,
these companies enjoy an immediate write-off of both capital and exploration-and-
development expenditures. This issue is similar to the problem with royalties we will
discuss in Section 2.4.6: there is a combination of favourable tax treatments with
unfavourable ones, and it is not clear on prior grounds which effect dominates.
Given the complications discussed above, it was decided not to attempt to develop a
common method to estimate amounts involved in corporate income tax facilities.
Available national estimates for such types of support will be reported as such.
2.4.6 Royalties
Conceptual issues
The issue of royalties is arguably the most conceptually intricate. The OECD (2013a)
defines royalties as follows:
Royalty – In energy, a term used to describe either the regular payments made
by the lessees of subsoil assets to the owners of the assets.
In the view of the OECD, lower royalty rates on less productive or more costly fields
may be “tax expenditures” in that they represent a concession relative to standard
rates. However, the OECD also acknowledges that “lower royalties may be rough ways
of taking into account higher costs and lower margins in systems that otherwise would
over-tax (and therefore potentially render uneconomic) economically marginal
projects (which generate little or no economic rent).”
It is worthwhile further exploring this concept.
In the context we consider here, the owner is usually the government. Therefore, an
important conceptual issue is whether royalties should be considered as “market
prices” or as “taxes”.
To understand this, let us briefly summarize the arguments made by McKenzie and
Mintz (2011):
Royalties cannot be considered as market prices for the extraction of resources,
because they are imposed unilaterally by governments. Therefore, they are
conceptually closer to taxes than to market prices. This also means that

Enhancing comparability of data on estimated budgetary support and tax expenditures for fossil fuels
August 2014 39
reduced rates compared to the standard rate cannot be considered to be deviations from a “correct” market price in any sense
36.
Economically, the correct tax base for a royalty is the economic rent from
extracting the resource. If the royalty equals the rent, then the producer will
not be able to make supernormal profits by extracting resources from
government owned assets, but the government will not distort the incentives
for the extractions of the resource either.
In practice, it is not possible to estimate the economic rent perfectly, and
governments use royalty systems that are proxies to the “ideal” system. For
instance, royalties are sometimes levied on the value of production rather than
on the value of the rent. If average costs of extraction are increasing, this
implies that the government actually “taxes” an amount that is higher than the
value of the rent (and, it reduces the incentives for extracting the resource).
Therefore, governments introduce provisions that correct (partly) for this, such
as reduced royalties for small wells (in order to correct for the fact that these
face higher average fixed costs than large wells). Thus, argue McKenzie and
Mintz, the point here is that these reduced rates are not a subsidy for the small
wells at all; they are an (imperfect) attempt to correct for the fact that real-
world royalties use a tax base that is imperfectly correlated with the correct
economic base – note that this is in line with the argument by the OECD.
Finally, if royalties are considered as taxes (rather than as prices), they cannot
be isolated from the provisions regarding corporate income tax. For instance,
reduced royalty rates will lead to higher corporate income taxes, and the
government will still be able to capture (part of) the rent.
The OECD concludes that resource royalty concessions are not indicative of the overall
level of royalties in a country. They provide the following example:
a country could increase resource royalty rates across the board, while
simultaneously introducing a special credit to reflect cost increases in a
particular subsector. Assuming the credit were reported as a royalty concession
(...), it would be included in the inventory of support even though the two
changes together resulted in an increase in the overall level of royalties.
Let us illustrate these issues with Ireland. The Irish government does not levy any
royalties, nor does it participate in projects. Does this mean that all rents go to the
producers? No, because the upstream oil and gas sector in Ireland attracts a specific
corporate income-tax rate of 25%, as compared to the 12.5% rate that applies to
most other sectors. Thus, the absence of royalty payments is (imperfectly)
compensated for by a significantly higher corporate income-tax. Moreover, Iris law
allows for full deductions for exploration, development, and field abandonment costs in
the year in which they are incurred. This provision can then be interpreted as an
attempt to compensate firms for the imperfect correlation between corporate profits
and economic rents. Indeed, this full deduction implies a post-tax decrease of several categories of fixed costs
37 .
36 Based on the general literature on tax expenditures, one could also add: as royalty
payments are not very widespread, it does not make much sense to talk about
benchmark rates – benchmark rates are only meaningful if they are applied to a broad
tax basis, such as the case with income taxation and VAT, for instance. 37 Starting in January 2007, licenses are now also subject to a Petroleum Resource
Rent Tax (PRRT) as provided for in the 2008 Finance Act. The PRRT is a progressive
tax on the profits from oil and gas extraction. It is not clear to what extent the tax
base for the PRRT actually corresponds to the concept of economic rent.

Enhancing comparability of data on estimated budgetary support and tax expenditures for fossil fuels
August 2014 40
A second example: in The Netherlands, profits from production of hydrocarbons are
subject to a 25.5% corporation tax (Vennootschapsbelasting) rate and royalty
payments (Winstaandeel) at a 50% rate. These payments are, however, reduced by a
cost uplift that allows for an extra 10% of the costs to be deducted from the income
for royalty purposes. Again, we see an attempt to find approximations to the economic
rent as a tax base.
Implementation
This is clearly a case where “apparent” subsidies are not necessarily subsidies
according to any economically meaningful criterion. Unless we have tools to compare
the actual tax bill to a tax system where the economic rents from resource extraction
are used a tax basis, we cannot quantify the “subsidy” component of reduced royalty
rates (or even evaluate whether the royalty scheme as a whole, and in interaction
with general corporate taxation, leads to lower tax rates). We will therefore report the
existing provisions, but not quantify them (any available national estimates for this
type of support will be reported as such). Moreover, any discussions should be
integrated in the broader context of corporate income taxation.
2.5 Data gathering and analysis
The common methodology as described above was applied by Member State experts
to each of the 28 EU Member States (their names are in Annex B). They used common
templates for calculations and reporting. Common data sources were also used
(among others the IEA’s (Extended) World Energy Balances), supplemented by
national sources of information. Where necessary, information gaps were filled by
contacting officials in national administrations. Given the limited time available (only 4
or 5 working days per Member State) it was not always possible to obtain all
necessary data and some information gaps are still remaining.
For Croatia, an additional description was made of the energy market, prices, taxes
and support mechanisms, similar to the information that was already available for the
other 27 MS in the OECD (2013a) and IVM (2013) reports.
Checks on the accuracy and reliability of the information were made by the authors of
the present report and by experts at TM Leuven and PBL.

Enhancing comparability of data on estimated budgetary support and tax expenditures for fossil fuels
August 2014 41
3. Results In this chapter the levels of support by Member State are brought together and
summarized. More detailed information per Member State can be found in Annex A.
Estimated support to electricity was ‘translated’ into support to fossil fuels by
multiplying it by the share of fossil fuels in electricity production for each specific
Member State and year (see Annex C).
3.1 Direct budgetary support
Table 3.1 summarizes the amounts of direct budgetary support to energy users
(including final consumers as well as business using energy as an input). This type of
support is rather limited in the EU: direct support to energy consumers is mainly given
by means of tax expenditures. The total amount of direct support in all Member States
together probably does not exceed EUR 1 billion per year. Several Member States do
not provide any budgetary support to energy users at all. There is no clear trend
observable in the level of this type of support.

Enhancing comparability of data on estimated budgetary support and tax expenditures for fossil fuels
August 2014 42
Table 3.1: Direct budgetary support to consumers/users by member State (mln €)
Member
State Type of support
Amount of
support (years
2000-2005)
Amount of
support (most
recent year)
year amount year amount
Austria Energy-Tax Refund to
Energy-Intensive Industries 2005 329 2011 329
Belgium Social tariff for electricity
and natural gas consumers 2002 unknown 2010 unknown
Bulgaria n.a.
Croatia n.a.
Cyprus Price regulation 2000 0 2011 unknown
Czech
Republic n.a.
Denmark n.a.
Estonia Compensation for increased
excise duty on diesel 2005 0.3 2011 unknown
Finland n.a.
France
Financial aid for electricity 2014 32
Special solidarity rate
(natural gas) 2014 94
Germany Peak Equalisation Scheme 2005 240 2011 170
Greece
Social Residential Tariff
(electricity) 2000 0 2011 unknown
Program "Energy Efficiency
at Household Buildings”
(nat. gas)
2000 0 2011 unknown
Hungary Natural gas and district
heating cost subsidies 2005 306 2011 > 81
Ireland
Fuel allowance 2002 47 2011 178
Electricity allowance 2002 25 2011 71
Gas allowance 2002 1 2011 5
Italy Transport fuel subsidy
Basilicata region 2002 n.a. 2011 49
Latvia n.a.
Lithuania n.a.
Luxembourg n.a.
Malta Eco-reduction and Energy
benefit 2011 15
Netherlands n.a.
Poland In-kind benefits for coal
miners 2004 unknown 2012 3
Portugal n.a.
Romania Fuel subsidies for railways 2011 16
Slovakia Feed-in tariff for domestic
lignite 2005 unknown 2011 unknown
Slovenia Support for CHP plants 2004 unknown 2012 18
Spain Aid scheme for coal workers 2010 3
Sweden n.a.
United
Kingdom n.a.

Enhancing comparability of data on estimated budgetary support and tax expenditures for fossil fuels
August 2014 43
Table 3.2 shows that direct support to producers (including public infrastructure) is
also limited. Several MS do not apply any schemes at all. The main support schemes
are for coal production (in Germany and Poland) and the Italian ‘CIP 6/92’ mechanism
(mainly benefitting cogeneration). Subsidies to coal production are decreasing, and
should be terminated by 2018. Some countries provide support to the development of
natural gas infrastructure. Specific public R&D support to fossil fuels is given in several
MS, but the amounts are generally limited.
Table 3.2: Direct budgetary support to producers by member State (mln €)
Member
State Type of support
Amount of
support (years
2000-2005)
Amount of
support
(most recent
year)
year amount year amount
Austria R&D support 2000 0.5 2011 1
Belgium n.a.
Bulgaria R&D support 2012 < 0.1
Infrastructure 2011 < 0.4
Croatia n.a.
Cyprus n.a.
Czech
Republic n.a.
Denmark R&D support 2000 2 2010 4
Estonia n.a.
Finland n.a.
France R&D support 2000 39 2011 117
Germany Support to coal mining 2000 3756 2011 1349
R&D support 2000 9 2010 26
Greece
Subsidy for Suppliers of
Fuels to Remote Areas 2005 6 2011 7
Support for gas supply
companies
2001 88 2011 156
R&D support 2001 0.6 2011 0.7
Hungary Support to coal mining 2005 61 2011 23
R&D support 2005 0.5 2011 0.6
Ireland Public Service Support Levy 2005 62 2011 92
R&D support 2005 42 2011 68
Italy
CIP 6/92 Subsidy
Mechanism (‘assimilated
sources’)
2002 3380 2012 2199
Compensation for small
islands and minor electric
companies
2002 unknown 2011 70
State aid for coal mining 2002 12 2010 39
R&D support 2002 16 2011 39
Infrastructure 2002 0 2011 8.5
Latvia n.a.
Lithuania n.a.
Luxembourg n.a.
Malta n.a.

Enhancing comparability of data on estimated budgetary support and tax expenditures for fossil fuels
August 2014 44
Netherlands R&D support 2000 9 2011 9
Poland Support for coal mining 2004 3531 2012 260
R&D support 2004 n.a. 2012 0.6
Portugal R&D support 2005 0.2 2011 0.1
Romania
State aid for coal mining 2001 unknown 2011 84
R&D support 2007 < 7
infrastructure 2011 1
Slovakia
Grants for raising
accessibility of lignite
reserves
2005 unknown 2011 unknown
R&D support 2005 0 2011 0.7
Slovenia Support for domestic coal
usage 2004 unknown 2012 8
Spain
Preferential dispatch for
domestic coal power
stations
2002 n.a. 2011 400
R&D support 2002 3 2011 0
State aid for gas grid
extension 2002 n.a. 2011 4
Sweden R&D support 2004 0.1 2010 0
United
Kingdom
Coal operating aid scheme 2000 66 2011 0
R&D support 2000 7 2011 53
3.2 Tax expenditures
3.2.1 Excise taxes
Table 3.3 shows the calculated support levels using the benchmark of the excise tax
rates as proposed in the new Energy Tax Directive proposal.38 For most Member
States, this benchmark leads to substantial estimated support levels (between 100
mln and several billions of euros per year). Differences between member States are
also substantial; not only in absolute amounts, but also on a per GJ or per tonne CO2
basis. Generally speaking, however, the amounts of support show a decreasing trend
over time: only three Member States (Croatia, France and Slovakia) had a higher
support level in the most recent year than in year of observation in the previous
decade. Apparently, Member States are reducing the gap between their energy tax
systems and the system as proposed by the Commission, by increasing rates and/or
by abolishing exemptions.
38 This means that, for instance, fuels for international aviation and marine bunkers
are still supposed to remain untaxed in the benchmark situation.

Enhancing comparability of data on estimated budgetary support and tax expenditures for fossil fuels
August 2014 45
Table 3.3: Tax expenditures (excise taxes) by Member State; benchmark: rates as
proposed in new Energy Tax Directive proposal
Member
State
Year in period 2000-2005 Most recent year
Total
(mln
€)
€ per
GJ
€ per
tonne of
CO2
emissions
Total
(mln
€)
€ per
GJ
€ per
tonne of
CO2
emissions
Austria 637 0.78 11.91 57 0.07 1.05
Belgium 2012 1.17 16.59 1202 0.68 10.16
Bulgaria 808 2.20 19.04 496 1.62 13.23
Croatia 274 1.08 13.92 333 1.09 13.24
Cyprus 174 2.51 25.37 113 1.53 14.91
Czech
Republic 1318 1.51 18.44 436 0.68 8.02
Denmark 872 1.60 17.95 742 1.47 16.45
Estonia 769 4.60 59.57 420 6.51 71.57
Finland 553 0.70 9.02 296 0.39 5.56
France 5559 1.08 16.90 5610 0.94 16.16
Germany 2531 0.32 3.50 871 0.11 1.28
Greece 2173 2.52 18.22 1471 2.10 13.20
Hungary 616 0.88 12.67 262 0.45 6.30
Ireland 332 0.68 8.33 107 0.24 2.85
Italy 3319 0.62 8.23 1983 0.40 5.24
Latvia 246 1.99 27.17 136 1.14 15.68
Lithuania 357 2.91 42.09 208 1.44 20.71
Luxembourg 318 1.93 25.56 190 1.35 17.40
Malta 6 0.14 1.97 1 0.01 0.12
Netherlands 1489 0.56 7.38 424 0.17 2.21
Poland 3204 2.06 28.14 2128 1.25 17.40
Portugal 580 0.95 11.84 287 0.53 5.33
Romania 1279 1.85 24.45 614 0.94 12.04
Slovakia 1216 2.15 38.03 1251 2.19 37.70
Slovenia 734 1.50 17.08 678 1.40 16.20
Spain 4477 1.21 15.83 3632 0.99 12.86
Sweden 406 0.37 8.47 155 0.15 3.37
United
Kingdom 4411 0.73 9.44 3704 0.63 7.72
Table 3.4 shows the results when the ‘highest rate in category’ benchmark is used (to
recall: the three categories are transport; heating and process fuel use; and
electricity). This leads to very high amounts of estimated support levels, up to tens of
billions of euros per year. Obviously, the highest levels are found in MS with high tax
rates for specific subcategories (such as petrol in the transport category, or household
consumption in the electricity category), since these high rates are the benchmark for
all other fuels in the category (e.g. diesel in the transport category or heavy industry
in the electricity category). Fuels for international aviation and navigation (bunkers)
account for a large part of the total support (under the previous benchmark, the new
ETD proposal, these fuels were still assumed to be exempted from tax; their
exemption was therefore not counted as support in the estimates presented in Table
3.3).

Enhancing comparability of data on estimated budgetary support and tax expenditures for fossil fuels
August 2014 46
Rather than being ‘realistic’ estimates of fossil fuel support levels, the figures in Table
3.4 should mainly be seen as indications for the impact that the choice of a benchmark
can have on such estimates, as well as for the fact that the fiscal treatment of energy
consumption differs widely between fuels and between energy users in most Member
States.
Table 3.4: Tax expenditures (excise taxes) by Member State; benchmark: highest rate per unit of energy consumption
39 in category
Member
State
Year in period 2000-2005 Most recent year
Total (mln €)
€ per
GJ
€ per
tonne of
CO2
emissions
Total (mln €)
€ per
GJ
€ per
tonne of
CO2
emissions
Austria 1358 1.66 25.42 1764 2.09 32.56
Belgium 7856 4.56 64.78 10,006 5,66 84,60
Bulgaria 669 1.83 15.77 582 1.90 15.50
Croatia 1102 4.35 55.94 1240 4.06 49.33
Cyprus 248 3.58 36.19 316 4.26 41.50
Czech
Republic 5484 6.28 76.73 4514 7.01 83.15
Denmark 37,145 68.08 764.87 3472 6.89 76.92
Estonia 1003 6.00 77.67 360 5.57 61.24
Finland 3912 4.98 63.77 2337 3.05 43.93
France 23,515 4.58 71.50 19,226 3.21 55.39
Germany 19,260 2.41 26.61 21,993 2.88 32.40
Greece 3154 3.66 26.45 5505 7.86 49.38
Hungary 4650 6.68 95.62 3602 6.20 86.61
Ireland 1093 2.25 27.43 1307 2.91 34.69
Italy 34,524 6.49 85.60 32,215 6.56 85.09
Latvia 480 3.88 52.93 371 3.09 42.64
Lithuania 439 3.59 51.82 794 5.50 79.16
Luxembourg 529 3.22 42.53 422 3.00 38.66
Malta 348 7.78 109.19 817 11.84 164.20
Netherlands 21,064 7.96 104.39 30,420 11.95 158.80
Poland 21,987 6.98 76.38 22,324 7.19 79.04
Portugal 7056 11.52 144.03 6275 11.51 116.54
Romania 1390 2.01 26.58 3075 4.82 60.28
Slovakia 5471 9.67 171.18 6602 11.53 198.93
Slovenia 658 1.34 15.29 1517 3.14 36.24
Spain 29,568 7.98 104.53 14,152 3.84 50.09
Sweden 4279 3.94 89.39 5439 5.10 118.16
United
Kingdom 19,735 3.26 42.25 23,187 3.95 48.33
3.2.2 Value added tax
As Table 3.5 shows, VAT reductions for fossil fuels and/or fossil fuel based electricity
are applied in a minority of Member States. The total amounts involved are
particularly significant in the UK and Italy. Some MS (Estonia and Hungary)
terminated VAT reduction schemes for energy between the observation years,
39 Figures for the benchmark “highest rate per unit of CO2 emissions” are the same for
most Member States; only in the cases of Estonia, Finland, Germany, Hungary,
Slovakia and Spain there are small differences. See Annex A.
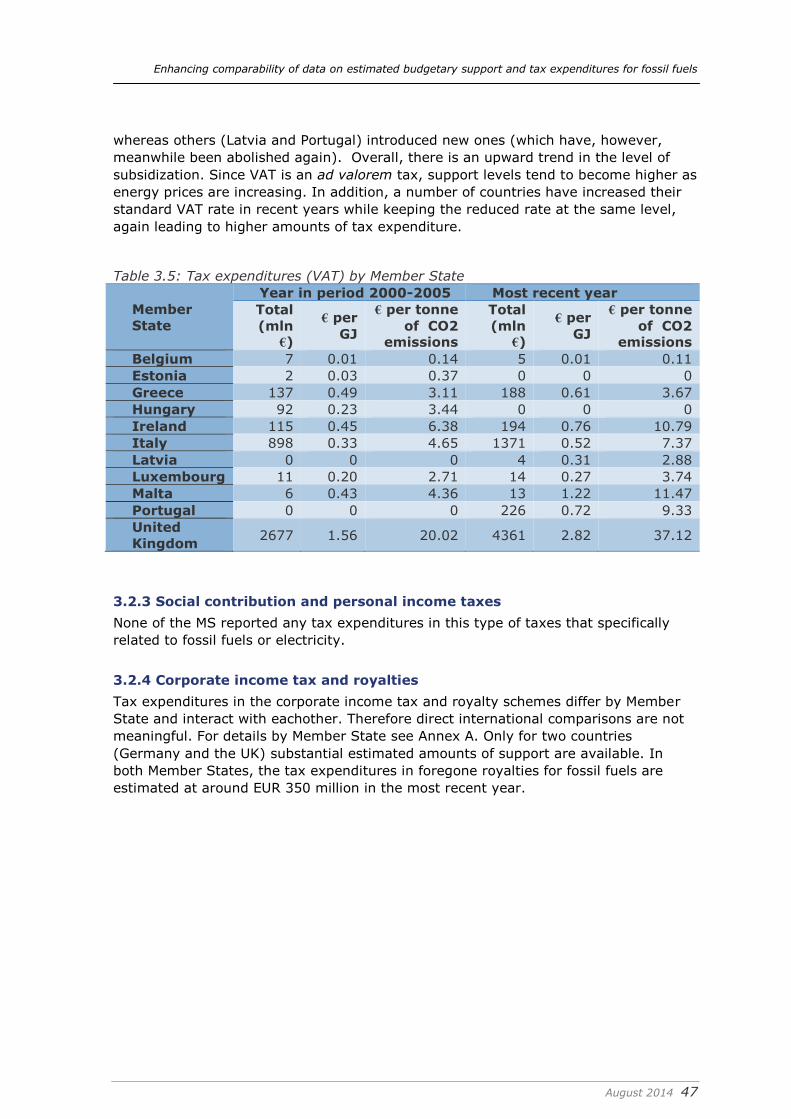
Enhancing comparability of data on estimated budgetary support and tax expenditures for fossil fuels
August 2014 47
whereas others (Latvia and Portugal) introduced new ones (which have, however,
meanwhile been abolished again). Overall, there is an upward trend in the level of
subsidization. Since VAT is an ad valorem tax, support levels tend to become higher as
energy prices are increasing. In addition, a number of countries have increased their
standard VAT rate in recent years while keeping the reduced rate at the same level,
again leading to higher amounts of tax expenditure.
Table 3.5: Tax expenditures (VAT) by Member State
Member
State
Year in period 2000-2005 Most recent year
Total
(mln €)
€ per
GJ
€ per tonne
of CO2
emissions
Total
(mln €)
€ per
GJ
€ per tonne
of CO2
emissions
Belgium 7 0.01 0.14 5 0.01 0.11
Estonia 2 0.03 0.37 0 0 0
Greece 137 0.49 3.11 188 0.61 3.67
Hungary 92 0.23 3.44 0 0 0
Ireland 115 0.45 6.38 194 0.76 10.79
Italy 898 0.33 4.65 1371 0.52 7.37
Latvia 0 0 0 4 0.31 2.88
Luxembourg 11 0.20 2.71 14 0.27 3.74
Malta 6 0.43 4.36 13 1.22 11.47
Portugal 0 0 0 226 0.72 9.33
United
Kingdom 2677 1.56 20.02 4361 2.82 37.12
3.2.3 Social contribution and personal income taxes
None of the MS reported any tax expenditures in this type of taxes that specifically
related to fossil fuels or electricity.
3.2.4 Corporate income tax and royalties
Tax expenditures in the corporate income tax and royalty schemes differ by Member
State and interact with eachother. Therefore direct international comparisons are not
meaningful. For details by Member State see Annex A. Only for two countries
(Germany and the UK) substantial estimated amounts of support are available. In
both Member States, the tax expenditures in foregone royalties for fossil fuels are
estimated at around EUR 350 million in the most recent year.

Enhancing comparability of data on estimated budgetary support and tax expenditures for fossil fuels
August 2014 48
4. Conclusions
The present study aimed at achieving a higher degree of harmonization in identifying
and quantifying subsidies (budgetary support and tax expenditures) for fossil fuels in
the EU-28. Clearly, with the limited time and resources available this objective could
only to a certain extent be achieved, given the substantial number of methodological
complications and the limitations due to insufficient data availability, consistency and
reliability. The results presented should therefore be mainly seen as a first finger
exercise with the approach and not as the final answer to the question “how much
financial support is given to fossil fuels in Europe?”.
Nevertheless, some general observations can be distilled from the compilation of
Member State figures:
Direct budgetary support to fossil fuel use/consumption is very limited in the
EU-28 and does not show a clear trend.
Direct budgetary support to fossil fuel production (including infrastructure such
as pipelines) is also limited. The largest amounts of support are for coal; these
show a downward trend and should be phased out by 2018. Significant
amounts of support for natural gas infrastructure are identified in a few MS.
R&D subsidies from the public budget occur in several MS but the amounts are
generally small.
Estimates of tax expenditures in excises and other energy taxes are very
sensitive to the choice of the benchmark. Using the EU minimum tax rates as
proposed by the Commission in 2011 (without exemptions except for
international air and marine transport) as the benchmark, substantial amounts
of tax expenditure are calculated for almost all MS, with large variations
between them. Overall, there is a clear trend towards a lower level of support
in these tax expenditures, due to increasing tax rates and fewer exemptions.
Reduced VAT rates for fossil fuels and/or fossil fuel based electricity are applied
in a minority of Member States. The total amounts involved are particularly
significant in the UK and Italy. Overall, there is an upward trend in the level of
support, which can be explained by increasing energy prices and recent
increases in the standard VAT rates (while keeping reduced rates at the same
level).
None of the MS reported any tax expenditures in social contributions and
income taxes that specifically related to fossil fuels or electricity.
Tax expenditures in the corporate income tax and royalty schemes differ by
Member State and interact with eachother. Therefore direct international
comparisons are not meaningful.

Enhancing comparability of data on estimated budgetary support and tax expenditures for fossil fuels
August 2014 49
References BIO in association with Cambridge Econometrics (UK), LEI - Wageningen UR (NL) and
the Institute of Social Ecology (AT) (2013), Modelling of Milestones for achieving
Resource Efficiency: Phasing out Environmentally Harmful Subsidies, Final Report
for the European Commission DG Environment, July 2013.
Bratić, V. (2006), Tax Expenditures: A Theoretical Review. Financial Theory and
Practice 30 (2), 113-127 (2006)
Brixi, H.P., C.M.A. Valenduc, and Z.L. Swift (eds) (2004), Tax Expenditures—Shedding
Light on Government Spending through the Tax System. Lessons from Developed
and Transition Economies. The World Bank.
Burman, L.E. (2003), Is the Tax Expenditure Concept Still Relevant? National Tax
Journal 613-27 (September 2003)
Burniaux, J. and J. Chateau (2011), “Mitigation Potential of Removing Fossil Fuel
Subsidies: A General Equilibrium Assessment”, OECD Economics Department
Working Papers, No. 853, OECD Publishing.
http://dx.doi.org/10.1787/5kgdx1jr2plp-en
Chris, Charles C., and P. Wooders (2011), Subsidies to Liquid Transport Fuels: A
comparative review of estimates, Research report for the Global Subsidies
Initiative (GSI) of the International Institute for Sustainable Development (IISD),
Geneva, Switzerland
Coady D., Gillingham R., Ossowski R., Piotrowski J., Tareq S., and Tyson J. (2010),
Petroleum Product Subsidies: Costly, Inequitable, and Rising, IMF STAFF
POSITION NOTE, February 25, 2010, SPN/10/05
COUNCIL DIRECTIVE 2006/112/EC of 28 November 2006 on the common system of
value added tax
Craig, J. & Allan, W. (2001). Fiscal Transparency. Tax Expenditures, and Budget
Process: an International Perspective. IMF Working Paper.
Davie, Bruce (1994). Tax Expenditures in the Federal Excise Tax System. National Tax
Journal 47 No. 1, 39-62.
Davis L.W. (2013), The economic cost of global fuel subsidies, Working Paper 19736,
http://www.nber.org/papers/w19736
EEA (2004), Energy subsidies in the European Union: A brief overview, European
Environment Agency, Copenhagen.
European Commission (2011), Roadmap to a Resource Efficient Europe. COM(2011)
571,
http://eurlex.europa.eu/LexUriServ/LexUriServ.do?uri=COM:2011:0571:FIN:EN:P
DF .
European Commission (2012), Living Well, Within the Limits of our Planet: Proposal
for a general Union Environment Action Programme, COM(2012) 710 final,
Brussels 29.11.2012.
European Commission, DG ECFIN, Taxation Reforms Database,
http://ec.europa.eu/economy_finance/db_indicators/taxation_reforms_database/i
ndex_en.htm.

Enhancing comparability of data on estimated budgetary support and tax expenditures for fossil fuels
August 2014 50
European Commission (2014), VAT Rates Applied in the Member States of the
European Union
Gerasimchuk, I. (2013), Mapping Options for a Voluntary Peer Review of Fossil-Fuel
Subsidy Reform within the G-20, Research report for the Global Subsidies
Initiative (GSI) of the International Institute for Sustainable Development (IISD),
Geneva, Switzerland
Global Subsidies Initiative (2010), Policy Brief, Defining Fossil-Fuel Subsidies for the
G-20: Which Approach is Best?
IEA, OECD and World Bank Joint Report (2010), The scope of fossil-fuel subsidies in
2009 and a roadmap for phasing out fossil fuel subsidies, report prepared for the
November 2010 G-20 summit meeting in Seoul, Republic of Korea.
IEA Energy subsidies database, http://www.iea.org/subsidy/index.html.
IMF (2013), Energy Subsidy Reform: Lessons and Implications. Washington DC:
International Monetary Fund, January 28, 2013.
International Energy Agency, Fossil-fuel subsidies – methodology and assumptions,
http://www.worldenergyoutlook.org/resources/energysubsidies/methodology/.
Jacobsen M.R., Gebauer A., Mellbye K., Pukander F., Kari S., Olsen S. Lindvall L.
(2010), Tax Expenditures in the Nordic Countries. A report from a Nordic working
group, presented at the Nordic Tax Economist meeting in Oslo, June 2009
Jennifer Ellis J. (2010), The Effects of Fossil-Fuel Subsidy Reform: A review of
modelling and empirical studies, for the Global Subsidies Initiative (GSI) of the
International Institute for Sustainable Development (IISD), Geneva, Switzerland
Kitson L. Wooders P. and Moerenhout T. (2011), Subsidies and External Costs in
Electric Power Generation: A comparative review of estimates, Research report for
the Global Subsidies Initiative (GSI) of the International Institute for Sustainable
Development (IISD), Geneva, Switzerland
Koplow, D. (2009), Measuring Energy Subsidies Using the Price-Gap Approach: What
does it leave out?
http://www.iisd.org/pdf/2009/bali_2_copenhagen_ff_subsidies_pricegap.pdf.
Koplow, D., Lin C., Jung A. and Thöne M. and Lontoh L. (2010), Mapping the
Characteristics of Producer Subsidies: A review of pilot country studies, Research
report for the Global Subsidies Initiative (GSI) of the International Institute for
Sustainable Development (IISD), Geneva, Switzerland
Kraan, D-J (2004), “Off-budget and Tax Expenditures,” OECD Journal on Budgeting,
vol. 4, no. 1, OECD, Paris, pp. 121-42.
Martini, R. (2012), “Fuel Tax Concessions in the Fisheries Sector”, OECD Food,
Agriculture and Fisheries Papers, No. 56, OECD
Publishing.http://dx.doi.org/10.1787/5k9bdccqft30-en
Määttä K. (2012) Economic and Legal General Report in: Yearbook for Nordic Tax
Research 2012: Tax Expenditures http://www.djoef-
forlag.dk/sites/ntj/files/2012/2012_1.pdf
McKenzie, Kenneth J. and Mintz, Jack, The Myths and Facts of Fossil Fuel Subsidies: A
Critique of Existing Studies (October 4, 2011). SPP Research Paper No. 11-14.
Available at SSRN: http://ssrn.com/abstract=1940535
NERA (2014), Energy Taxation and Subsidies in Europe: A Report on Government
Revenues, Subsidies and Support Measures for Fossil Fuels and Renewables in the
Enhancing comparability of data on estimated budgetary support and tax expenditures for fossil fuels
August 2014 51
EU and Norway. Report for the International Association of Oil and Gas Producers.
NERA Economic Consulting, London, May 2014.
OECD (2010a), Tax Expenditures in OECD Countries.
OECD (2010b). Choosing a Broad Base – Low Rate Approach to Taxation. OECD Tax
Policy Studies No. 19. OECD.
OECD (2013a), Inventory of Estimated Budgetary Support and Tax Expenditures for
Fossil Fuels. DOI:10.1787/9789264187610-en.
OECD (2013b), Taxing Energy Use: A Graphical Analysis, OECD Publishing.
http://dx.doi.org/10.1787/9789264183933-en
Oosterhuis, F.H. (2001), Energy subsidies in the European Union. IVM publication W-
01/21. Institute for Environmental Studies (IVM), Vrije Universiteit, Amsterdam.
Oosterhuis, F., Alexandru, R. Blumberga, A., Bobinaite, V., Cauchi, J., Nikolova, N.,
and Papyrakis, E. (2013), Budgetary support and tax expenditures for fossil fuels
An inventory for six non-OECD EU countries. Institute for Environmental Studies
(IVM), VU University Amsterdam, Final Report, 15 January 2013. Available from:
http://ec.europa.eu/environment/enveco/taxation/pdf/fossil_fuels.pdf.
Steenblik, R., A global survey of potentially environmentally harmful subsidies. In:
Frans Oosterhuis and Patrick ten Brink (forthcoming, 2014), Paying the Polluter.
Environmentally Harmful Subsidies and their Reform. Cheltenham, UK and
Northampton, MA, USA: Edward Elgar Publishing.
UNEP (2008), Reforming Energy Subsidies. Opportunities to Contribute to the Climate
Change Agenda, Geneva: United Nations Environment Programme.
Vagliasindi M; (2012), Implementing Energy Subsidy Reforms. An Overview of the Key
Issues, The World Bank, Policy Research Working Paper 6122
Valsecchi, C., P. ten Brink, M. Fergusson, S. Bassi, I. Skinner, M. Pallemaerts, A.Best,
D. Blobel, M. Berglund, A. Markandya, A. Sgobbi, C. Longo and F. Oosterhuis
(2007). Reforming environmentally harmful subsidies. A Report to the European
Commission’s DG Environment. Institute for European Environmental Policy, March
2007. http://ec.europa.eu/environment/enveco/others/pdf/ehs_report.pdf.
Valsecchi C., P. ten Brink, S. Bassi, S. Withana, M. Lewis, A. Best, F. Oosterhuis, C.
Dias Soares, H. Rogers-Ganter, and T. Kaphengst (2009), Environmentally
Harmful Subsidies: Identification and Assessment. Final report for the European
Commission’s DG Environment, November 2009.
http://ec.europa.eu/environment/enveco/taxation/pdf/Harmful%20Subsidies%20
Report.pdf.
van Essen H., Nelissen D., Smit M., van Grinsven A., Aarnink S., Breemersch T.,
Martino A., Rosa C., Parolin R., and Harmsen J. (2012), An inventory of measures
for internalizing external costs in transport, for the European Commission DG
MOVE http://ec.europa.eu/transport/themes/sustainable/studies/doc/2012-11-
inventory-measures-internalising-external-costs.pdf
van Foreest, F. (2012), Perspectives for Biogas in Europe. Oxford Institute for Energy
Studies, NG 70, December 2012.
Weidenaar, T.D. (2011), Dutch gas distribution grid goes green: decision support tool
for local biogas utilization. In: International Gas Union Research Conference,
IGCR, 19-21 October 2011, Seoul, Korea.
Withana, S., ten Brink, P., Franckx, L., Hirschnitz-Garbers, M., Mayeres, I.,
Oosterhuis, F., and Porsch, L. (2012). Study supporting the phasing out of
environmentally harmful subsidies. A report by the Institute for European

Enhancing comparability of data on estimated budgetary support and tax expenditures for fossil fuels
August 2014 52
Environmental Policy (IEEP), Institute for Environmental Studies – Vrije
Universiteit (IVM), Ecologic Institute and VITO for the European Commission – DG
Environment. Final Report. Brussels.
http://ec.europa.eu/environment/enveco/taxation/index.htm#phasing_out
Worldwatch Institute (2013), ‘Fossil Fuel and Renewable Energy Subsidies on the
Rise’, http://www.worldwatch.org/fossil-fuel-and-renewable-energy-subsidies-rise.

Enhancing comparability of data on estimated budgetary support and tax expenditures for fossil fuels
August 2014 53
Annex A Member State reports

Enhancing comparability of data on estimated budgetary support and tax expenditures for fossil fuels
August 2014 54
Austria
Reporting years: 2000 and 2011
Direct budgetary support to consumers/users
Name of the scheme and
short description
Energy-Tax Refund to Energy-Intensive Industries
(Energieabgabenvergütungsgesetz)
Introduced in 1996 to provide partial refunds to
energy-intensive processes in line with the Directive
2003/96/EC. The scheme has seen several changes
over time and was extended to cover all businesses,
including in the services sector. Since 2011 not
applicable to the services sector anymore but only to
those industries producing physical goods.
Final beneficiary Certain energy consuming businesses
Direct beneficiary Certain energy consuming businesses
Variability
Objectives To prevent a decrease in competitiveness for energy-
intensive industries
Conditionality for
eligibility
See below under “magnitude”
Conditionality for
magnitude of subsidy
The magnitude of the refund is calculated as: energy
taxes paid minus 0.5% of the net production value
minus €400 own amount retained. Against this
calculation a further calculation steps ensures that
businesses pay at least the minimum energy-tax
rates stipulated by Directive 2003/96/EC.
Source of funding Federal budget
Fuel Electricity; natural gas; coal; mineral oil (different
grades of heating oil) and LPG
Total amount 2005: € 64+36+229=329 mln
2011: € 70+46+213=329 mln
These are from OECD (2013) and cover: coal,
petroleum, natural gas (not electricity). Numbers
split above in that order.
Information sources OECD (2013); WKO (2013)
Direct budgetary support to producers
Direct budgetary support to primary producers
N.a.

Enhancing comparability of data on estimated budgetary support and tax expenditures for fossil fuels
August 2014 55
Direct budgetary support for R&D purposes
Name of the scheme and
short description
No specific scheme – IEA estimates presented
Final beneficiary
Direct beneficiary
Aid category
Variability
Objectives According to the 2007 IEA country review for Austria, priorities
for public energy R&D are energy efficiency and renewables,
both of which receive roughly one-third of available public
funding (IEA, 2007).
Conditionality for eligibility
Conditionality for
magnitude of subsidy
Source of funding IEA figures below refer to government R&D, not clear whether
this includes lower level government funding or only federal
level.
Fuel Oil, gas and coal as well as CCS reported below.
Total amount The following are for Government R&D in million EUR
(nominal). Sum of categories “oil and gas” and “coal” and
separate figures reported for “CO2 capture and storage”.
Oil, gas and coal:
2000: € 0.45 mln
2010: € 0.34 mln; 2011: € 0.59 mln (two years reported due
to fluctuation)
CO2 capture and storage:
2000: € 0 mln
2011: € 0.52 mln
These figures seem very low and indeed figures from OECD
(2013) give a different picture, reporting an amount of €2.7
million spending on fossil fuels in 2008, or 3.8% of the total
public expenditure for R&D in the energy sector. In the same
year, OMV AG, the biggest energy supplier in Austria, reported
spending of about €140 million from its own funds on R&D.
Information sources IEA (2007) Energy policies of IEA countries – Austria, 2007
Review,
http://www.iea.org/publications/freepublications/publication/a
ustria2007.pdf [accessed: 09/04/2014].
IEA (2014) IEA Energy Technology RD&D Statistics, DOI:
10.1787/enetech-data-en [accessed: 09/04/2014].

Enhancing comparability of data on estimated budgetary support and tax expenditures for fossil fuels
August 2014 56
Public investments in energy infrastructure
N.a.
Tax expenditures
Excises and other specific taxes on energy use
Name of the tax scheme
and short description
Austrian energy taxation encompasses several relevant
legislative acts that regulate the level of taxation as well
as exemptions depending on the energy products. These
are the:
Mineralölsteuergesetz (mineral oil tax law)
Elektrizitätsabgabegesetz (electricity tax law)
Erdgasabgabegesetz (natural gas tax law)
Another important piece of legislation setting out the
energy tax refund to energy-intensive industries is the
Energieabgabenvergütungsgesetz, as introduced above
under “direct budgetary support to consumers”.
A tax on coal exists since 2004, introduced through the
Budgetbegleitgesetz 2003, BGBl I 2003/71, bringing
Austrian legislation in line with Directive 2003/96.
Summary of fuels and
use(r)s to which reduced
rates or exemptions
applied in the reporting
years
The details of tax rates for each sub-category are reported
in the Excel template.
Tax exemptions or reductions include the following (as
per §4, 7, 8 Mineralölsteuergesetz):
Exemption for transport fuels used for domestic
aviation and navigation in certain cases;
Refund of duty for gas oil used for agricultural
purposes;
Refund of duty for gas oil used for the carriage of
goods and passengers by rail;
Refund of duty for gas oil used in combined heat and
power generation (in these three cases a refund of
0.299EUR/l applies)
Assumptions:
Austria applies different tax rates for some fuels
depending o the sulphur content. As no information
available on the consumption of fuels per sulphur content
we assume a 50-50 split and use hence the arithmetic
average of the two tax rates in these cases.
Amount calculated
(benchmark: highest
total per unit of
energy
per unit of CO2

Enhancing comparability of data on estimated budgetary support and tax expenditures for fossil fuels
August 2014 57
excise per unit of energy
consumption)
2000: € 1 358
mln
2011: € 1 764
mln
2000: € 1.66 /
GJ
2011: € 2.09 /
GJ
2000: € 25.42 / ton
2011: € 32.56 / ton
Amount calculated
(benchmark: highest
excise per unit of CO2
emissions)
Total per unit of
energy
per unit of CO2
2000: € 1 358
mln
2011: € 1 764
mln
2000: € 1.66 /
GJ
2011: € 2.09 /
GJ
2000: € 25.42 / ton
2011: € 32.56 / ton
Amount calculated
(benchmark: proposal
new energy taxation
directive)
Total per unit of
energy
per unit of CO2
2000: € 637 mln
2011: € 57 mln
2000: € 0.78 /
GJ
2011: € 0.07 /
GJ
2000: € 11.91 / ton
2011: € 1.05 / ton
Information sources See excel template in particular the sheets containing
background data for details. Sources for main data:
Tax rates: DG TAXUD Excise Duty Tables (March
2000 edition) were used as the main source for
2000 tax rates, and DG TAXUD tables (January
2011 edition) for the 2011 rates. This was
supplemented with some national sources were
more detailed information was needed (see excel
spread sheet for details) in addition to a tax rates
over time overview received from the Austrian
Ministry for Finances upon request.
Tax bases (ie consumption across the different
energy carriers) for both years: Data was taken
from the “IEA Energy Statistics of OECD countries”
series. For some sub-categories use was made of
the Gesamtenergiebilanz Österreich (1970 bis
2012)40
Conversion factors into GJ: in most cases we used
those sourced for Belgium, but supplemented /
cross-checked witn Austrian sources in some cases
(this is indicated in the relevant sheet in the excel
file)
Conversion factors to CO2: combination of three
sources, as indicated in the exel file.
40 Available at:
http://www.statistik.at/web_de/statistiken/energie_und_umwelt/energie/energiebilanz
en/index.html

Enhancing comparability of data on estimated budgetary support and tax expenditures for fossil fuels
August 2014 58
Miscellaneous:
Tax exemption for LPG used in public transport (OECD, 2013): This could not
be quantified given the IEA Energy Statistics (and neither the Extended World
Energy Balances) single out fuel consumption in public transport. Amount
according to OECD (2013):
o 2005: € 4 mln
o 2011: € 4 mln
According to OECD (2013), he Austrian “Stability Law” of 2012 stipulates that
the energy-tax exemption from LPG used in public transport, the energy-tax
relief for diesel fuel used in railways and the rebates to diesel used in
agriculture will all expire at the end of 2012.
Value Added Tax
Not applicable, as no tax expenditures of this kind existed in the reporting years (i.e.
all energy supplies were taxed at the standard rate).
Tax expenditures in social contributions and personal income taxes
N.a.
Tax expenditures in corporate income taxes
N.a.
Tax expenditures in royalties
The current royalty system on oil and gas extraction in Austria is regulated through
the Section 69 of the Mineralrohstoffgesetz, The taxation for oil and gas extraction
activities is calculated using the value and quantity of a specific fuel imported to
Austria in a given year, as recorded in official statistics. This is the basis for the
calculation of a price per ton or TJ and the level of the price determines at which rate
the tonne of oil or gas extracted is taxed.
For example if the international prices of oil is high, a higher taxation will be applied.
On the other hand, if the international price of hydrocarbons is low, a lower tax rate
will apply for domestically extracted oil and gas.
The levy is therefore flexible. The taxation of oil extracted domestically ranges from
2% to 14% and for natural gas extracted domestically varies from 7% to 19% (as
indicated in the table below)
Crude Oil Natural Gas
Price (€/ton) Tax rate Price (€/TJ) Tax rate
< 75 2% < 1500 7%
75 - 400 2 - 14% 1500 - 7500 7 - 19%
> 400 14% > 7500 19%

Enhancing comparability of data on estimated budgetary support and tax expenditures for fossil fuels
August 2014 59
Sources:
Austrian Mining Law, Bundesrecht konsolidiert: Gesamte Rechtsvorschrift für
Mineralrohstoffgesetz, Bundeskanzleramt Rechtsinformationwssystem, URL:
http://www.ris.bka.gv.at/GeltendeFassung.wxe?Abfrage=Bundesnormen&Gesetzesnu
mmer=10008040&ShowPrintPreview=True [27/05/2014]
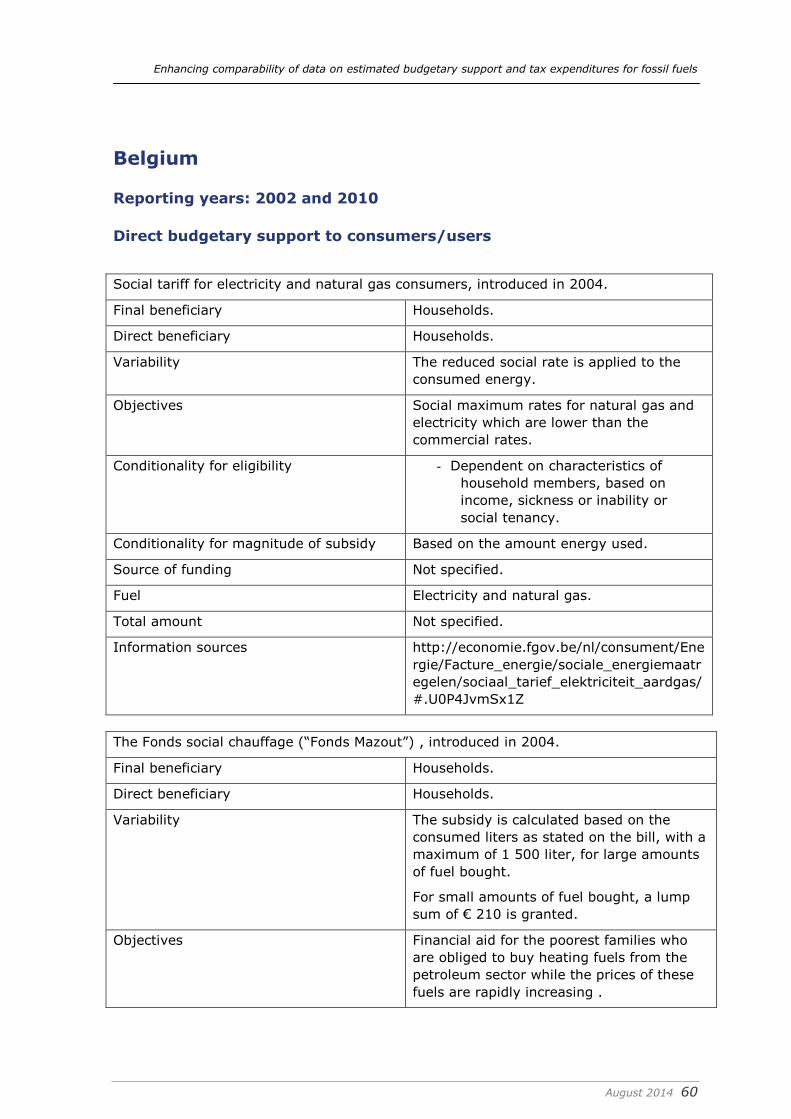
Enhancing comparability of data on estimated budgetary support and tax expenditures for fossil fuels
August 2014 60
Belgium
Reporting years: 2002 and 2010
Direct budgetary support to consumers/users
Social tariff for electricity and natural gas consumers, introduced in 2004.
Final beneficiary Households.
Direct beneficiary Households.
Variability The reduced social rate is applied to the
consumed energy.
Objectives Social maximum rates for natural gas and
electricity which are lower than the
commercial rates.
Conditionality for eligibility - Dependent on characteristics of
household members, based on
income, sickness or inability or
social tenancy.
Conditionality for magnitude of subsidy Based on the amount energy used.
Source of funding Not specified.
Fuel Electricity and natural gas.
Total amount Not specified.
Information sources http://economie.fgov.be/nl/consument/Ene
rgie/Facture_energie/sociale_energiemaatr
egelen/sociaal_tarief_elektriciteit_aardgas/
#.U0P4JvmSx1Z
The Fonds social chauffage (“Fonds Mazout”) , introduced in 2004.
Final beneficiary Households.
Direct beneficiary Households.
Variability The subsidy is calculated based on the
consumed liters as stated on the bill, with a
maximum of 1 500 liter, for large amounts
of fuel bought.
For small amounts of fuel bought, a lump
sum of € 210 is granted.
Objectives Financial aid for the poorest families who
are obliged to buy heating fuels from the
petroleum sector while the prices of these
fuels are rapidly increasing .

Enhancing comparability of data on estimated budgetary support and tax expenditures for fossil fuels
August 2014 61
Conditionality for eligibility - Dependent on characteristics of
household members, based on
income, indebtedness or sickness or
inability insurance reimbursment
- The beneficiary is required to prove
that he/she belongs to one of the
eligible categories, he/she uses one
of the eligible fuels and that this fuel
is delivered on the address of the
beneficiary
- The subsidy is limited to 300 € and
maximum 1 500 liter fuel.
Conditionality for magnitude of subsidy Based on the amount of fuel bought.
Source of funding End users contribute to this fund based on
their actual consumption of oil products
intended for heating.
Fuel Diesel, kerosene, propane gas.
Total amount Not specified.
Information sources http://www.verwarmingsfonds.be/index.asp
Direct budgetary support to producers
Direct budgetary support to primary producers
N.a.
Direct budgetary support for R&D purposes
According to the IEA Database, Belgium spent 1.886 million EUR on government R&D
for fossil fuels in 2007, but the modalities of these expenditures are not reported. No
information is provided for the reporting years.
Public investments in energy infrastructure
N.a.
Tax expenditures
Excises and other specific taxes on energy use
The current basic legislation governing excise taxes in Belgium is the Wet van 22 december 2009
betreffende de algemene regeling inzake accijnzen (Belgian Official Journal 31 december 2009).
The current implementation for energy taxation follows from the Programmawet van 27 december
2004 (Hoofdstuk XVIII van Titel XI – Financiën) (Belgian Official Journal 31 december 2004). For
each year, the actual excise rates can be obtained from the freely available “Fiscaal memento”.
Summary of fuels and use(r)s to
which reduced rates or
The excise tariffs for energy products are differentiated
according to:
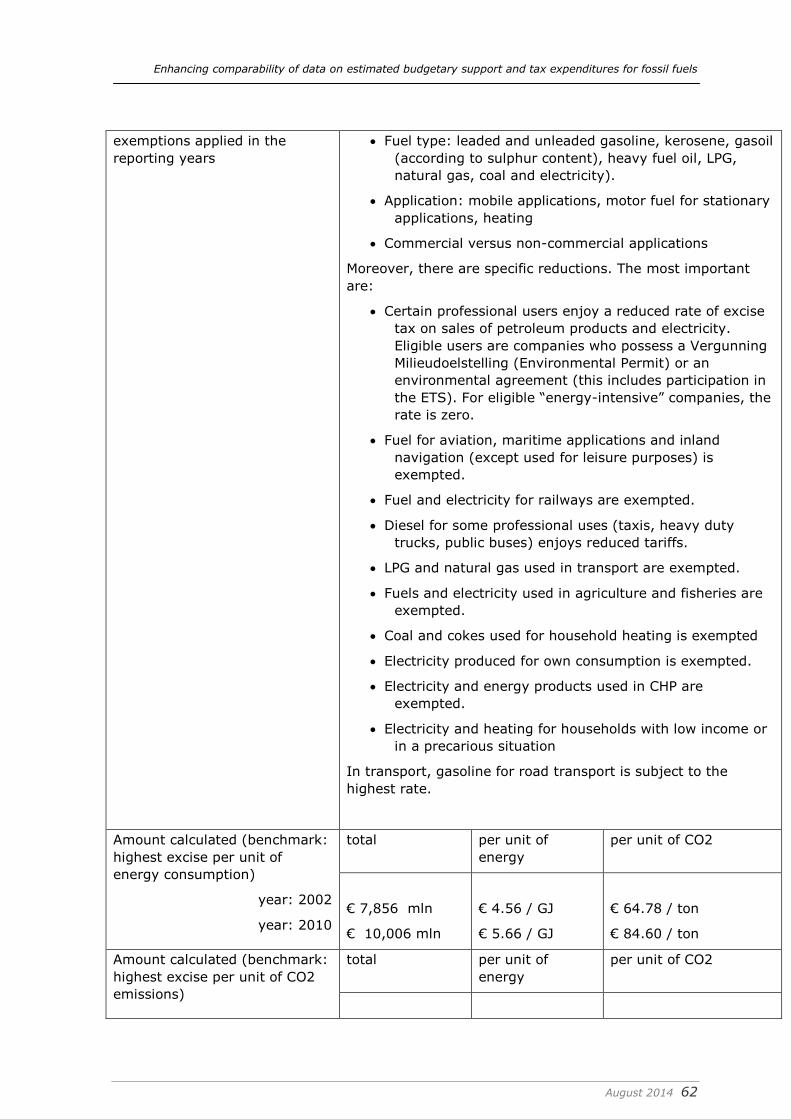
Enhancing comparability of data on estimated budgetary support and tax expenditures for fossil fuels
August 2014 62
exemptions applied in the
reporting years
Fuel type: leaded and unleaded gasoline, kerosene, gasoil
(according to sulphur content), heavy fuel oil, LPG,
natural gas, coal and electricity).
Application: mobile applications, motor fuel for stationary
applications, heating
Commercial versus non-commercial applications
Moreover, there are specific reductions. The most important
are:
Certain professional users enjoy a reduced rate of excise
tax on sales of petroleum products and electricity.
Eligible users are companies who possess a Vergunning
Milieudoelstelling (Environmental Permit) or an
environmental agreement (this includes participation in
the ETS). For eligible “energy-intensive” companies, the
rate is zero.
Fuel for aviation, maritime applications and inland
navigation (except used for leisure purposes) is
exempted.
Fuel and electricity for railways are exempted.
Diesel for some professional uses (taxis, heavy duty
trucks, public buses) enjoys reduced tariffs.
LPG and natural gas used in transport are exempted.
Fuels and electricity used in agriculture and fisheries are
exempted.
Coal and cokes used for household heating is exempted
Electricity produced for own consumption is exempted.
Electricity and energy products used in CHP are
exempted.
Electricity and heating for households with low income or
in a precarious situation
In transport, gasoline for road transport is subject to the
highest rate.
Amount calculated (benchmark:
highest excise per unit of
energy consumption)
year: 2002
year: 2010
total per unit of
energy
per unit of CO2
€ 7,856 mln
€ 10,006 mln
€ 4.56 / GJ
€ 5.66 / GJ
€ 64.78 / ton
€ 84.60 / ton
Amount calculated (benchmark:
highest excise per unit of CO2
emissions)
total per unit of
energy
per unit of CO2

Enhancing comparability of data on estimated budgetary support and tax expenditures for fossil fuels
August 2014 63
year: 2002
year: 2010
€ 7,856 mln
€ 10,006 mln
€ 4.56 / GJ
€ 5.66 / GJ
€ 64.78/ ton
€ 84.60 / ton
Amount calculated (benchmark:
proposal new energy taxation
directive)
year: 2002
year: 2010
total per unit of
energy
per unit of CO2
€ 2,012 mln
€ 1,202 mln
€ 1.17 / GJ
€ 0.68/ GJ
€ 16.59/ ton
€ 10.16/ ton
Information sources For information sources: see excel documents.
IEA - Energy prices and taxes (1st Quarter 2013)
Belgostat
Eurostat
Fiscaal memento 2002 & 2010
Assumptions: no estimations are available for the energy
consumption that is untaxed due to participation in the ETS
(source: Belgian Ministry of Finance)

Enhancing comparability of data on estimated budgetary support and tax expenditures for fossil fuels
August 2014 64
Value Added Tax
Categories of energy supply to which a
reduced VAT rate was applied in one
or both of the reporting years
Coal used by households
Standard rate 2002: 21%
2010: 21%
Reduced rate 2002: 12% for coal (res.)
2010: 12% for coal (res.)
Amount of support calculated
(refer to Excel file)
2002: EUR 6.70 mln
2010: EUR 4.95 mln
Information sources For sources: see excel documents for
details
IEA - Energy prices and taxes (1st
Quarter 2013)
Belgostat
Eurostat
Fiscaal memento 2002 & 2010
Assumptions:
- Price for kerosene: based on
internet for a
- Prices for cokes could not be
found on-line, and as the
amount is negligibly small in
total energy consumption, this
category will not be included
Tax expenditures in social contributions and personal income taxes
N.a.
Tax expenditures in corporate income taxes
N.a.

Enhancing comparability of data on estimated budgetary support and tax expenditures for fossil fuels
August 2014 65
Tax expenditures in royalties
To the best of our knowledge, the Belgian tax legislation does not contain specific
provisions on royalty regimes for the extraction of natural resources.

Enhancing comparability of data on estimated budgetary support and tax expenditures for fossil fuels
August 2014 66
Bulgaria
Reporting years:
Direct budgetary support to consumers - -
Direct budgetary support for primary producers 2007 2010
Direct budgetary support for R&D purposes 2011 2012
Public investments in energy infrastructure 2011 2014
Excises and other specific taxes on energy use 2007 2011
The variations in the reporting years are related to the lack of systematic reporting in
Bulgaria (non-OECD country) on the different subsidies. The information presented is
mainly based on national sources, which provide fairly limited information on the type
and size of the subsidies. This has led to several limitations of the findings – firstly,
the data could not be presented for the same years and secondly, in some cases the
information is available for the entire energy sector and it is not possible to determine
the precise share of support for fossil fuels. This might compromise the usability of
data for comparative purposes but provides a broad picture about the situation in
Bulgaria keeping in mind the limitations of the information that is publicly and
systematically available on this matter.
Direct budgetary support to consumers/users
Name of the
scheme and short
description
Targetted aid for heating
Final beneficiary Low income individuals and families
Direct beneficiary Low income individuals and families
Variability Eligible for aid are individuals and families whose average
monthly income for the six months preceding the month of
application for the aid is lower than the differentiated minimum
income for heating. Differentiated minimum income is defined
as the individual coefficient (K) of the person or family is
multiplied by the guaranteed minimum income (GMI) (which is
currently 65 BGN or appr. €33 a month). Individual coefficients
are determined according to age and social status. The monthly
aid is the difference between the differentiated minimum income
and the income of individuals/families from the previous month.
Objectives Social objectives
Conditionality for
eligibility
Eligible for aid are individuals and families:
Whose monthly income is lower than the differentiated
minimum income;
Own only one apartment and it is not bigger than: One-
bedroom apartment for 1 person, two-bedroom
apartment for a family of two and three, three-bedroom
apartment for a family of four and so on;
Do not own any real estate or other property, which can
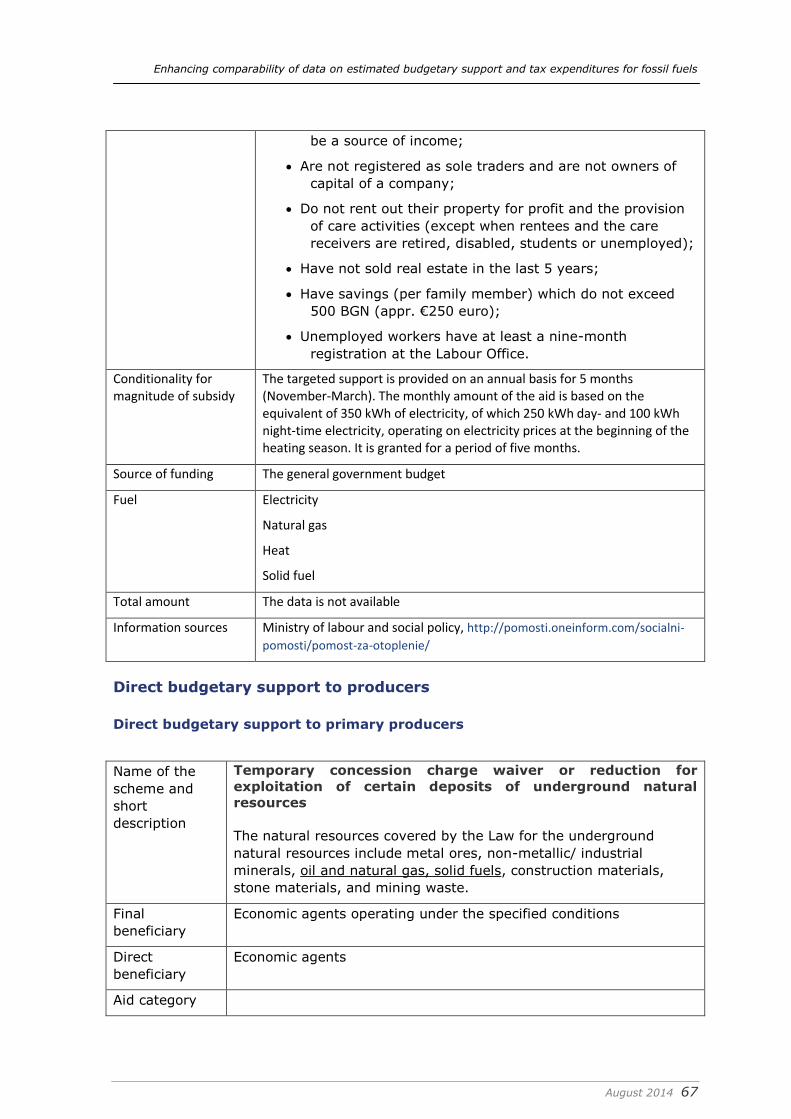
Enhancing comparability of data on estimated budgetary support and tax expenditures for fossil fuels
August 2014 67
be a source of income;
Are not registered as sole traders and are not owners of
capital of a company;
Do not rent out their property for profit and the provision
of care activities (except when rentees and the care
receivers are retired, disabled, students or unemployed);
Have not sold real estate in the last 5 years;
Have savings (per family member) which do not exceed
500 BGN (appr. €250 euro);
Unemployed workers have at least a nine-month
registration at the Labour Office.
Conditionality for magnitude of subsidy
The targeted support is provided on an annual basis for 5 months (November-March). The monthly amount of the aid is based on the equivalent of 350 kWh of electricity, of which 250 kWh day- and 100 kWh night-time electricity, operating on electricity prices at the beginning of the heating season. It is granted for a period of five months.
Source of funding The general government budget
Fuel Electricity
Natural gas
Heat
Solid fuel
Total amount The data is not available
Information sources Ministry of labour and social policy, http://pomosti.oneinform.com/socialni-
pomosti/pomost-za-otoplenie/
Direct budgetary support to producers
Direct budgetary support to primary producers
Name of the
scheme and
short
description
Temporary concession charge waiver or reduction for
exploitation of certain deposits of underground natural
resources
The natural resources covered by the Law for the underground
natural resources include metal ores, non-metallic/ industrial
minerals, oil and natural gas, solid fuels, construction materials,
stone materials, and mining waste.
Final
beneficiary
Economic agents operating under the specified conditions
Direct
beneficiary
Economic agents
Aid category

Enhancing comparability of data on estimated budgetary support and tax expenditures for fossil fuels
August 2014 68
Variability A waiver or a reduction of up to 50% of the concession charge can
be granted to the concessionaire for a maximum period of five
years.
Objectives To stimulate the exploitation of certain deposits of underground
natural resources in areas with unfavourable conditions or in areas
with long-term unemployment
Conditionality
for eligibility
Exploitation of deposits of underground natural resources with
unfavourable mining and geological, technological and
economic characteristics; and
Restoration of mining in deposits in regions with long-term
unemployment where mining had previously ceased
Conditionality
for magnitude
of subsidy
Source of
funding
Fuel Oil and natural gas, solid fuels
Total amount No data are available for this measure
Information
sources
Law for the underground natural resources (1999),
www.mi.government.bg/bg/library/zakon-za-podzemnite-bogatstva-
321-c25-m258-2.html
Direct budgetary support for R&D purposes
Name of the scheme
and short description
Budgetary spending for R&D for the production,
storage, distribution and use of energy
Final beneficiary
Direct beneficiary
Aid category
Variability
Objectives
Conditionality for
eligibility
Conditionality for
magnitude of subsidy
Source of funding State government
Fuel
Total amount 2011: 1 502 000 leva (appr. €770 256)

Enhancing comparability of data on estimated budgetary support and tax expenditures for fossil fuels
August 2014 69
2012: 273 000 leva (appr. €140 000)
Based on the available information it is not possible to
determine the specific share of support for fossil fuels.
Information sources National Statistical Institute, Bulgaria
Budgetary spending for R&D in 2011 and 2012 – www.nsi.bg
Public investments in energy infrastructure
Name of the
scheme and
short
description
Programme 14 "Effective functioning of the energy
companies, infrastructure and markets"
Final beneficiary
Direct
beneficiary
Aid category
Objectives The aim is to accelerate the implementation of priority
energy infrastructure projects related to the development of
appropriate national, regional and trans-continental energy
infrastructure.
Conditionality
for eligibility
Conditionality
for magnitude
of subsidy
Source of
funding
Fuel
Total amount 2011: 808 988 BGN (appr. € 414 865)
2014: 40 885 100 BGN (appr. €20 966 718)
Based on the available information it is not possible to
determine the specific share of support for fossil fuels.
Information
sources
Budget of the Ministry of Economy, Energy and Tourism,
2011 by programs
Budget of the Ministry of Economy for 2014 by programs

Enhancing comparability of data on estimated budgetary support and tax expenditures for fossil fuels
August 2014 70
Tax expenditures
Excises and other specific taxes on energy use
Name of the tax scheme
and short description
(1) Excise tax rebate for motor fuels used in
agriculture
(2) Zero excise duty on electricity for domestic
use
(3) Zero excise duty on coal and coke on sale to
households
(4) Zero rate of excise duty on natural gas used
as motor fuel and heating fuel
(5) Zero rate of excise duty on LPG used for
heating
Summary of fuels and
use(r)s to which reduced
rates or exemptions
applied in the reporting
years
(1): A report by the Institute for Market Economics
(2009) states that Bulgaria applies an excise tax return on
motor fuels (e.g. gasoil (50 BGN 1000 liters), kerosene
(50 BGN per 1,000 liters, natural gas (0 BGN per
gigajoule)) used in the processing of agricultural land by
farmers who qualify for financial assistance granted by the
Law to support farmers. The financial support is provided
in the form of preferential rates and reimbursement of the
difference. In 2010, this preferential treatment was
discontinued. 2008: 62.5mln BGN (€32mln)
In 2011, Bulgaria notified the European Commission that
the government wants to put in place a measure which
aims to assist registered primary agricultural producers by
applying a reduced excise duty on gasoil. The measure
plans to provide beneficiaries with fuel vouchers in the
period 2012-2013. The estimated number of beneficiaries
is over 1 000 and the maximum budget for the scheme
which runs until 31 December 2013 is 140 million BGN.
Reportedly, the scheme has been delayed and will remain
active until 31 December 2014.
(2): The excise rate for electricity for domestic use is 0
BGN per MWh. Beneficiaries of the incentive include
persons, which have obtained a license under the Energy
Act and sell electricity to consumers.
(3): The excise rate for coal and coke upon sale to
individuals other than sole proprietors is 0 BGN for
gigajoule. The tax incentive has a social objective.
(4): Changes to the Excise Duties and Tax Warehouses
Act in 2012 stipulate natural gas used for household
heating is exempted from the excise duty. Excise duty of

Enhancing comparability of data on estimated budgetary support and tax expenditures for fossil fuels
August 2014 71
0.10 BGN per gigajoule is applied to natural gas for
business use; excise duty of 0.85 BGN per gigajoule is
applied to natural gas used as motor fuel.
(5): LPG used for heating is taxed at a zero rate.
Amount calculated
(benchmark: highest
excise per unit of energy
consumption)
total per unit of
energy
per unit of CO2
2007: € 669 mln
2011: € 582 mln
2007: € 1.83 /
GJ
2011: € 1.90 /
GJ
2007: € 15.77 / ton
2011: € 15.50 / ton
Amount calculated
(benchmark: highest
excise per unit of CO2
emissions)
total per unit of
energy
per unit of CO2
2007: € 669 mln
2011: € 582 mln
2007: € 1.83 /
GJ
2011: € 1.90 /
GJ
2007: € 15.77 / ton
2011: € 15.50 / ton
Amount calculated
(benchmark: proposal
new energy taxation
directive)
total per unit of
energy
per unit of CO2
2007: € 808 mln
2011: € 496 mln
2000: € 2.20 /
GJ
2011: € 1.62 /
GJ
2000: € 19.04 / ton
2011: € 13.23 / ton
Information sources Institute for Market Economics (2009 and 2012)
2013 IVM report
KPMG news, Bulgaria
Excise Duties and tax and Warehouses Act;
Report on tax expenditure 2010-2011 - Ministry of
Finance;
EC, Excise duty tables, part II – Energy and energy
products, 2014
International Energy Agency 2009 country statistics on
coal and coke,
www.iea.org/stats/coaldata.asp?COUNTRY_CODE=BG
Value Added Tax
Not applicable.
Tax expenditures in social contributions and personal income taxes
Not applicable.
The following documents were reviewed:
Enhancing comparability of data on estimated budgetary support and tax expenditures for fossil fuels
August 2014 72
• Law on personal income tax; and
• ‘Tax preferences and preferential tax regimes in Bulgaria – overview’ a report
by the Tax Directorate at the Ministry of Finance, Bulgaria.
Tax expenditures in corporate income taxes
Not applicable.
The following documents were reviewed:
• Law on personal income tax; and
• ‘Tax preferences and preferential tax regimes in Bulgaria – overview’ a report
by the Tax Directorate at the Ministry of Finance, Bulgaria.
Tax expenditures in royalties
In Bulgaria, the corporate income tax is 10%. The tax rate is applied in a uniform
manner to all taxable persons, regardless of the economic region or sector they are
operating in and regardless of the operations carried out. There are no special
preferences and /or regimes related to the extraction of fossil fuels.
The state however provides for temporary concession charge waiver or 50% reduction
for exploitation of certain deposits of underground natural resources (including, among
others, oil, natural gas and solid fuel) – see above.

Enhancing comparability of data on estimated budgetary support and tax expenditures for fossil fuels
August 2014 73
Croatia
Reporting years: 2003 and 2012
Brief introduction on the Croatian fossil fuel market
Energy resources and market structure
In 2012 fossil fuels accounted for 78% of Croatia’s total primary energy supply
(TPES). Liquid fuels made the largest share (36.7%), followed by natural gas (27.8%)
and hydro power (12.4%). Electricity makes 7.5% of supply, coal and coke 7.8%, fuel
wood 5.7%, renewables 1.6% and heat 0.5%. Electricity is generated mainly form
liquid fuels (58.2%), gaseous fuels (16.2%) and hydro power (15.9%). Small amounts
of electricity were produced from coal (7.6%), renewables (1.3%) and solid biomass (0.8%).
41
Croatia exports mainly crude oil (36.4% of total exported energy products) and
petroleum products (24.7%), followed by natural gas (16.9%) and electricity (12.2%).
When it comes to import of energy, the biggest share of import is attributed to the
petroleum products (73.4%), natural gas (9.7%), biomass (9.4%) and electricity
(6.4%). Energy self-supply is the relation between the total primary energy production
and the total primary energy supply. In 2012, it stood at 48.4% and is in decline since 2010 when it stood at 55.5%.
42
The oil market in Croatia is relatively small when compared to the regional or global oil
market. However, liquid fuels still play a very important role in total energy use in
Croatia (43.5% share in final energy consumption). Croatia produces less than 20% of
its own crude oil demands, while the most oil is transported by Adriatic oil pipeline.
Until the beginning of 2014 the highest possible retail prices of petroleum products
were dictated by the Ministry of Economy to ensure higher competitiveness in the
Croatian oil market. On the 20th February 2014 the petroleum product market was
liberalized allowing free forming of retail prices.
While completely dependent on imported crude oil and petroleum products, Croatia
produces significant amount of natural gas (39% of total primary energy production)
and electricity from hydropower (26%). Natural gas is produced from 17 on-shore and
9 off-shore gas fields meeting 68% of total domestic demand for natural gas. More
than half of total natural gas production is gained from Adriatic seabed. Main producer
and importer is INA Industrija nafte d.d, acting as the key market player. Natural gas
transportation is a regulated energy activity which performs as a public service and
represents the primary activity of the company PLINACRO Zagreb, the owner and
operator of the gas transport system.
The installed electricity generating capacities in the Republic of Croatia include hydro
and thermal power plants, which are owned by the HEP Group (around 95% of
generation capacity). Within these installed electricity generating capacities, there are
a certain number of industrial power plants and a few privately owned renewable
energy source power plants. In the period from 2013 and 2020, Croatia will shut down
1100 MW in thermal power plant due to the building's old and unsatisfactory condition.
41 Source: Annual Energy Report – Energy in Croatia 2012, Ministry of Economy
42 Source: Annual Energy Report – Energy in Croatia 2012, Ministry of Economy

Enhancing comparability of data on estimated budgetary support and tax expenditures for fossil fuels
August 2014 74
The plan is to build additional 2400 MW by 2020. The share of renewables is planned
to stay at 35% until 2020.
Prices, taxes and support mechanisms
The national regulator, Croatian Energy Regulatory Agency (HERA), encourages
competition in the energy market. The Croatian electricity market was opened for
companies with the First Energy Package in 2001 and then for households in
2008.Electricity prices are set by the electricity distributors, and all consumers can
choose their electricity supplier.
Since 2001, generation, transmission and distribution are legally separated as
independent activities. The Croatian energy markets operator HROTE was established
in 2005 as a limited liability company. HROTE performs the activities of organising the
electricity and gas market as a public service under the supervision of HERA. In
addition, HROTE plays a key role in the support mechanisms for incentivising the
production of electricity from renewable sources and cogeneration, and the production
of bio-fuels for transport. A full VAT (25% since March 2012.) and excise duty are
levied on all fossil-fuel products. Finally, Croatia began to take part in European
Emissions Trading Scheme since 1 January 2013 for all generation plants with input power larger than 20 MWth.
Direct budgetary support to consumers/users
N.a.
Direct budgetary support to producers
Direct budgetary support to primary producers
N.a.
Direct budgetary support for R&D purposes
N.a.
Public investments in energy infrastructure
N.a.
Please note: as most fossil fuels distributors and producers are state-owned and the
infrastructure is built by these subjects, there is no direct impact on the state budget.
The cost of investments is amortised by those subjects. Thus, no scheme exists to
quantify the expenditures for such investments.
Tax expenditures
Note: The Croatian excise tax system defines excise tax expenditures for different fuel
types and their applications (transport, heating for businesses, heating for
households).
Tax subsidies for natural gas exist when used in transport, households and some
industrial processes.
Source: Ministry of Finance - Tax Administration

Enhancing comparability of data on estimated budgetary support and tax expenditures for fossil fuels
August 2014 75
Excises and other specific taxes on energy use
Excise Tax Rates Changes are reported in legal_def_rates data sheets in
Excel table
Summary of fuels and
use(r)s to which reduced
rates or exemptions
applied in the reporting
years
Exemptions applied: electricity used in households as well
as combined heat and power generation in a single
process (cogeneration), used for official needs of
diplomatic missions and consular offices, . Excise duty
shall not be levied on electricity obtained from the use of
renewable sources of energy and where used by the
producer for own purposes (wind, wave, tide or
geothermal sources, solar energy and biomass), and
electricity used for production of electricity and
maintaining the capabilty to produce electricity.
Amount calculated
(benchmark: highest
excise per unit of energy
consumption)
total per unit of
energy
per unit of CO2
2003: € 1102
mln
2012: € 1240
mln
2003: € 4.35 /
GJ
2012: € 4.06 /
GJ
2003: € 55.94 / ton
2012: € 49.33 / ton
Amount calculated
(benchmark: highest
excise per unit of CO2
emissions)
total per unit of
energy
per unit of CO2
2003: € 1102
mln
2012: € 1240
mln
2003: € 4.35 /
GJ
2012: € 4.06 /
GJ
2003: € 55.94 / ton
2012: € 49.33 / ton
Amount calculated
(benchmark: proposal
new energy taxation
directive)
total per unit of
energy
per unit of CO2
2003: € 274 mln
2012: € 333 mln
2003: € 1.08 /
GJ
2012: € 1.09 /
GJ
2003: € 13.92 / ton
2012: € 13.24 / ton
Information sources Excel documents: tax_exp_Croatia_2003 and
tax_exp_Croatia_2012
Value Added Tax
N.a.
Note: The Croatian VAT system does not provide any reduced VAT tax rates for fossil
fuels.
Source: Ministry of Finance - Tax Administration, Croatian VAT Law and Bylaw

Enhancing comparability of data on estimated budgetary support and tax expenditures for fossil fuels
August 2014 76
Tax expenditures in social contributions and personal income taxes
N.a.
Note: Croatian State Aid Register does not include any tax exemptions for fossil fuel
consumers.
Source: Croatian Competition Agency – State Aid Register
Tax expenditures in corporate income taxes
N.a.
Note: Croatian State Aid Register does not include any tax exemptions for fossil fuel
producers.
Source: Croatian Competition Agency – State Aid Register
Tax expenditures in royalties
The fee amount that the Government charges is set by the specific regulation on
extrapolation of mineral resources. This fee consists of the fixed charge, which is
determined by surface of the area under concession, and a variable charge, which is
determined by the amount of minerals extrapolated. However, no other specific
aspects of taxation regime or similar conditions apply to the system (e.g. specific tax
provisions, accelerated depreciation, etc.).
Source: Ministry of Finance - Tax Administration

Enhancing comparability of data on estimated budgetary support and tax expenditures for fossil fuels
August 2014 77
Cyprus
Reporting years: 2001 and 2011
Direct budgetary support to consumers/users
Domestic Special Tariff for Specific Categories of Vulnerable Customers (Code
08) - A reduced electricity charge of EUR 0.21 per kWh is is applied to families with
more than 4 children and low-income families.
Final beneficiary The potential beneficiaries include:
- Families with more than 4 children
- Low income families. As of 2013, new categories were
added, namely families that receive care allowance for
quadriplegic persons and families that receive care
allowance for paraplegic persons.
Direct beneficiary The reduced charge is provided directly by energy companies.
In Cyprus, the generation and provision of electricity is
dominated by the state-owned Electricity Authority of Cyprus
(EAC). The Decision No. 01/2010, taken by the Cyprus Energy
Regulatory Authority (CERA) allows EAC to recover the loss of
revenue derived by the scheme. The recovery of costs is
implemented by charging €0,00134 per kWh consumed on all
electricity bills.As of 2013, this charge was increased to
€0,00134 per kWh, due to the addition of new categories of
eligible categories (see above).
Variability The reduced charge is fixed (0.21 EUR per KWh)
Objectives The objective is to support vulnerable social groups of
consumers.
Conditionality for
eligibility
The beneficiaries should belong to one of the following
categories:
- Multi-member or five-member families which fulfil
predefined income criteria
- Recipients of public assistance
As of 2013, eligible categories also include families that
receive care allowance for quadriplegic persons and families
that receive care allowance for paraplegic persons.
Conditionality for
magnitude of subsidy
The reduced rate is fixed.

Enhancing comparability of data on estimated budgetary support and tax expenditures for fossil fuels
August 2014 78
Source of funding Funding derives from:
- Energy companies (in Cyprus electricity is provided solely by
EAC)
- Contributions provided by end-users
Fuel The subsidy is provided only on electricity.
Total amount 2001 € 0 mln (the scheme started in 2010)
2011 (no available information)
Information sources Electricity Authority of Cyprus- Public Service Obligations
(P.S.O.) – Domestic Special Tariff for Specific Categories of
Vulnerable Customers (Code 08)
Law 230/2010,
http://www.cera.org.cy/main/data/articles/kdp230_2010.pdf
IVM (2013), Budgetary support and tax expenditures for fossil
fuels. An inventory for six non-OECD EU countries
ec.europa.eu/environment/enveco/taxation/pdf/fossil_fuels.pdf
Direct budgetary support to producers
Direct budgetary support for primary producers
N.a.
Direct budgetary support for R&D purposes
N.a.
Public investments in energy infrastructure
N.a.
Tax expenditures
Excises and other specific taxes on energy use
In Cyprus excise taxes are charged on all fuels, except electricity (see the Excel
file for more details). Certain exemptions apply (see below).
Summary of fuels and use(r)s to which
reduced rates or exemptions applied in
the reporting years
The following excise tax refunds and
exemptions are applied in Cyprus:
1- Reduced excise tax on motor
fuels used in agriculture
2- Exemption from excise duty on
motor fuels used in agriculture

Enhancing comparability of data on estimated budgetary support and tax expenditures for fossil fuels
August 2014 79
3- Reduced excise tax on fuels
used for heating purposes
4- Exemption from excise tax on
fuels used in international and
EU commercial aviation.
5- Exemption from excise tax on
fuels used in navigation
(including commercial fishing) in
EU waters.
6- Exemption from excise tax on
fuels used for the generation of
electricity.
7- Exemption from excise tax on
energy products used in the
production of cemen
Amount calculated (benchmark:
highest excise per unit of energy
consumption)
year: 2004
year: 2011
total per unit of
energy
per unit of
CO2
€ 248 mln
€ 316 mln
€ 3.58 / GJ
€ 4.26 / GJ
€ 36.19 /
ton
€ 41.50 /
ton
Amount calculated (benchmark:
highest excise per unit of CO2
emissions)
year: 2004
year: 2011
total per unit of
energy
per unit of
CO2
€ 248 mln
€ 316 mln
€ 3.58 / GJ
€ 4.26 / GJ
€ 36.19 /
ton
€ 41.50 /
ton
Amount calculated (benchmark:
proposal new energy taxation
directive)
year: 2004
year: 2011
total per unit of
energy
per unit of
CO2
€ 174 mln
€ 113 mln
€ 2.51 / GJ
€ 1.53 / GJ
€ 25.37 /
ton
€ 14.91 /
ton
Information sources All calculations are based on
simulations in the Excel file.
Value Added Tax
Categories of energy
supply to which a
reduced VAT rate was
applied in one or both of
the reporting years
No fuels are eligible for a reduced VAT in Cyprus

Enhancing comparability of data on estimated budgetary support and tax expenditures for fossil fuels
August 2014 80
Standard rate 2004: 15%
2011: 15%
Reduced rate Not applicable
Amount of support
calculated
Not applicable
Information sources Ministry of Finance,
http://www.mof.gov.cy/mof/VAT/VAT.nsf/All/0368B9A1A06
36E33C22572970022C562?OpenDocument
Tax expenditures in social contributions and personal income taxes
N.a.
Tax expenditures in corporate income taxes
N.a.
Tax expenditures in royalties
No information was found.

Enhancing comparability of data on estimated budgetary support and tax expenditures for fossil fuels
August 2014 81
Czech Republic
Reporting years: 2001 and 2011
Direct budgetary support to consumers/users
N.a.
Direct budgetary support to producers
N.a.
Direct budgetary support to primary producers
N.a.
Direct budgetary support for R&D purposes
According to the IEA database, there was no expenditure on R&D in the two reporting
years. Nevertheless R&D in fossil fuels was supported between 2001 and 2011. For
example in 2003 approximately €3,5 million was provided for R&D in this area
whereas in 2010 the support reached €1.8 million.
The exact type of this R&D and the organisations involved are unknown.
Public investments in energy infrastructure
No relevant state aids were found for the reporting years
Tax expenditures
Excises and other specific taxes on energy use
In Czech Republic excise taxes are charged on gasoline, diesel, kerosene, LPG,
natural gas, fuel oil, coal and electricity (see the Excel file for details). In 2001,
coal and natural gas were not subject to excise taxes.
Summary of fuels and
use(r)s to which reduced
rates or exemptions applied
in the reporting years
The following excise tax refunds and exemptions
apply in Czech Republic:
1. Exemptions on mineral oils used for
purposes other than as motor fuel and
heating fuel
2. Exemptions on certain electricity uses.
3. Exemptions on certain uses of solid fuels.
4. Exemptions on certain uses of gas.
5. Reimbursement of excise duty of gas
oil when it is duly proven that the gas oil
has been used for heating purposes.
6. Reduced rate on diesel blend comprising
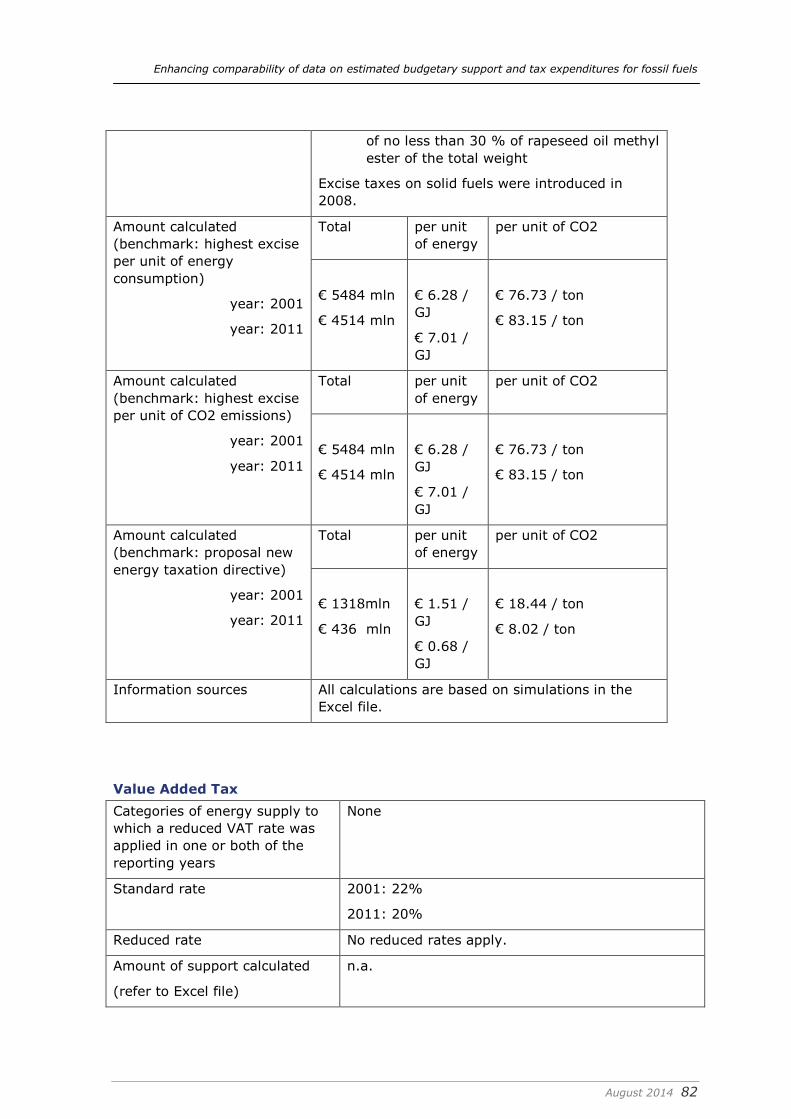
Enhancing comparability of data on estimated budgetary support and tax expenditures for fossil fuels
August 2014 82
of no less than 30 % of rapeseed oil methyl
ester of the total weight
Excise taxes on solid fuels were introduced in
2008.
Amount calculated
(benchmark: highest excise
per unit of energy
consumption)
year: 2001
year: 2011
Total per unit
of energy
per unit of CO2
€ 5484 mln
€ 4514 mln
€ 6.28 /
GJ
€ 7.01 /
GJ
€ 76.73 / ton
€ 83.15 / ton
Amount calculated
(benchmark: highest excise
per unit of CO2 emissions)
year: 2001
year: 2011
Total per unit
of energy
per unit of CO2
€ 5484 mln
€ 4514 mln
€ 6.28 /
GJ
€ 7.01 /
GJ
€ 76.73 / ton
€ 83.15 / ton
Amount calculated
(benchmark: proposal new
energy taxation directive)
year: 2001
year: 2011
Total per unit
of energy
per unit of CO2
€ 1318mln
€ 436 mln
€ 1.51 /
GJ
€ 0.68 /
GJ
€ 18.44 / ton
€ 8.02 / ton
Information sources All calculations are based on simulations in the
Excel file.
Value Added Tax
Categories of energy supply to
which a reduced VAT rate was
applied in one or both of the
reporting years
None
Standard rate 2001: 22%
2011: 20%
Reduced rate No reduced rates apply.
Amount of support calculated
(refer to Excel file)
n.a.

Enhancing comparability of data on estimated budgetary support and tax expenditures for fossil fuels
August 2014 83
Information sources https://circabc.europa.eu/sd/a/5d907b3b-52ee-
4808-9de5-
8e2b2647ac0f/EDT%202011%20Jan%20Energy.pdf
Tax expenditures in social contributions and personal income taxes
N.a.
Tax expenditures in corporate income taxes
N.a.
Tax expenditures in royalties
An obligation exists for mining companies to pay royalties to the Regional Mining
Authorities. The royalties shall not exceed 10% of the market price of the extracted
minerals. A share of 75% of the collected revenue is transferred to municipalities
which are located in the territory where the respective mines are located. The other
25% is transferred to the state budget.
Source: OECD (2013), Inventory of Estimated Budgetary Support and Tax Expenditures for Fossil Fuels 2013, http://www.keepeek.com/Digital-Asset-Management/oecd/environment/inventory-of-estimated-budgetary-support-and-tax-expenditures-for-fossil-fuels-2013_9789264187610-en#page134
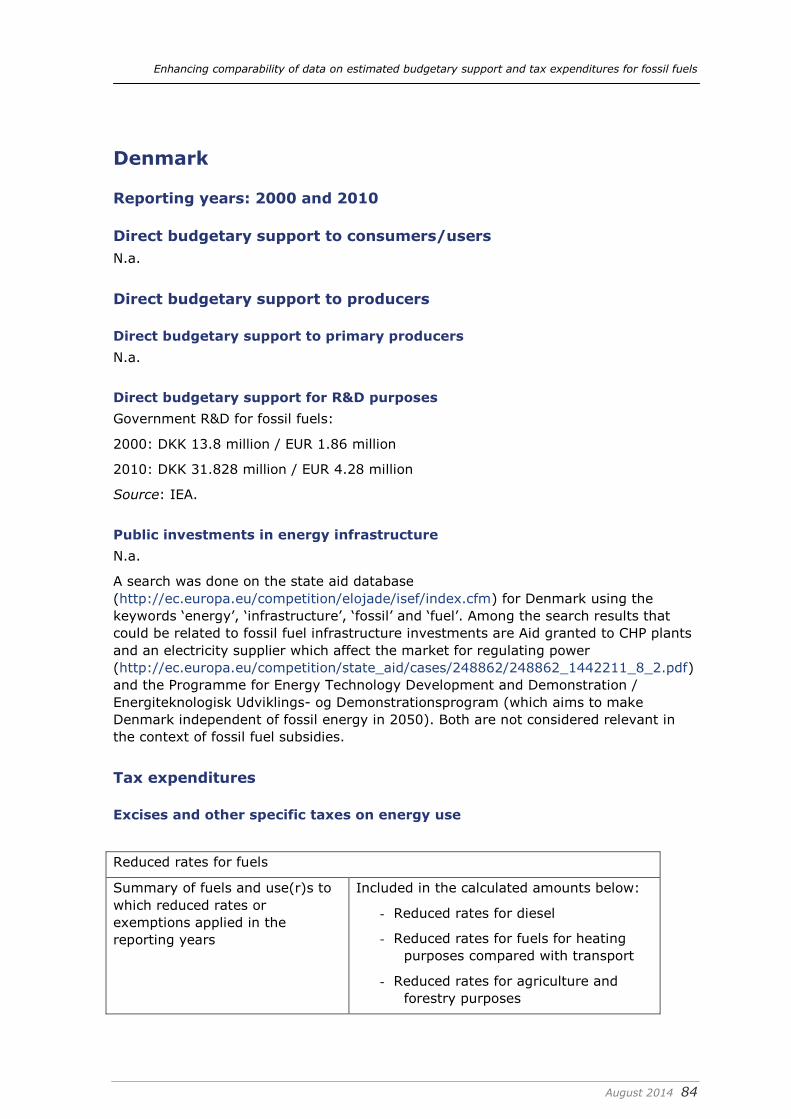
Enhancing comparability of data on estimated budgetary support and tax expenditures for fossil fuels
August 2014 84
Denmark
Reporting years: 2000 and 2010
Direct budgetary support to consumers/users
N.a.
Direct budgetary support to producers
Direct budgetary support to primary producers
N.a.
Direct budgetary support for R&D purposes
Government R&D for fossil fuels:
2000: DKK 13.8 million / EUR 1.86 million
2010: DKK 31.828 million / EUR 4.28 million
Source: IEA.
Public investments in energy infrastructure
N.a.
A search was done on the state aid database
(http://ec.europa.eu/competition/elojade/isef/index.cfm) for Denmark using the
keywords ‘energy’, ‘infrastructure’, ‘fossil’ and ‘fuel’. Among the search results that
could be related to fossil fuel infrastructure investments are Aid granted to CHP plants
and an electricity supplier which affect the market for regulating power
(http://ec.europa.eu/competition/state_aid/cases/248862/248862_1442211_8_2.pdf)
and the Programme for Energy Technology Development and Demonstration /
Energiteknologisk Udviklings- og Demonstrationsprogram (which aims to make
Denmark independent of fossil energy in 2050). Both are not considered relevant in
the context of fossil fuel subsidies.
Tax expenditures
Excises and other specific taxes on energy use
Reduced rates for fuels
Summary of fuels and use(r)s to
which reduced rates or
exemptions applied in the
reporting years
Included in the calculated amounts below:
- Reduced rates for diesel
- Reduced rates for fuels for heating
purposes compared with transport
- Reduced rates for agriculture and
forestry purposes

Enhancing comparability of data on estimated budgetary support and tax expenditures for fossil fuels
August 2014 85
- Reduced rates for railways and public
transport
Not included in the calculations (described
above):
- Reduced rates for CHP plants
Amount calculated (benchmark:
highest excise per unit of energy
consumption)
year: 2000
year: 2010
total per unit of
energy
per unit of
CO2
€ 37,145
mln
€ 3,472 mln
€ 68.08 /
GJ
€ 6.89/ GJ
€ 764.87/ ton
€ 76.92 / ton
Amount calculated (benchmark:
highest excise per unit of CO2
emissions)
year: 2000
year: 2010
total per unit of
energy
per unit of
CO2
€ 37,145
mln
€ 3,472 mln
€ 68.08 /
GJ
€ 6.89 / GJ
€ 764.87 / ton
€ 76.92/ ton
Amount calculated (benchmark:
proposal new energy taxation
directive)
year: 2000
year: 2010
total per unit of
energy
per unit of
CO2
€ 872 mln
€ 742 mln
€ 1.60 / GJ
€ 1.47 / GJ
€ 17.95/ ton
€ 16.45 / ton
Information sources Assumptions made in the calculation:
- Assuming that heavy fuel, diesel and
kerosene are exempt from energy
duties for air and ship traffic
Source of information:
Eurostat:
- Gas - domestic consumers - bi-annual
prices - old methodology until 2007
[nrg_pc_202_h]
- Gas prices for domestic consumers,
from 2007 onwards - bi-annual data
[nrg_pc_202]
- Electricity - domestic consumers - bi-
annual prices - old methodology
until 2007 [nrg_pc_204_h]
- Electricity prices components for
domestic consumers, from 2007
onwards - annual data
[nrg_pc_204_c]
Danish Energy Agency (2012)
Energistatistik 2012.
http://www.ens.dk/info/tal-kort/statistik-

Enhancing comparability of data on estimated budgetary support and tax expenditures for fossil fuels
August 2014 86
nogletal/arlig-energistatistik
Danish Oil Industry Association (EOF)
http://www.eof.dk/Priser-og-Forbrug
IEA (2013) Energy Statistics of OECD
Countries.
DG TAXUD (2000) Excise duty tables.
(Incorporates all amendments received up
to 27 November 2000)
DG TAXUD (2010) Excise duty tables. Part
II – Energy products and Electricity (July
2010)DG TAXUD (2011) Excise duty tables.
Part II - Energy products and electricity.
European Commission. (Shows the situation
as at 1 July 2011)
Value Added Tax
Categories of energy supply to which a
reduced VAT rate was applied in one
or both of the reporting years
None
Standard rate 2000: 25%
2010: 25%
Reduced rate No reduced rates apply.
Amount of support calculated
(refer to Excel file)
n.a.
Information sources Assumptions made in calculation:
- No prices for gasoline and LPG
could be found for heating use,
so transport prices were used.
Sources of information:
Eurostat:
- Gas - domestic consumers - bi-
annual prices - old methodology
until 2007 [nrg_pc_202_h]
- Gas prices for domestic
consumers, from 2007 onwards
- bi-annual data [nrg_pc_202]
- Electricity - domestic consumers -
bi-annual prices - old
methodology until 2007
[nrg_pc_204_h]

Enhancing comparability of data on estimated budgetary support and tax expenditures for fossil fuels
August 2014 87
- Electricity prices components for
domestic consumers, from 2007
onwards - annual data
[nrg_pc_204_c]
Danish Energy Agency (2012)
Energistatistik 2012.
http://www.ens.dk/info/tal-
kort/statistik-nogletal/arlig-
energistatistik
Danish Oil Industry Association (EOF)
http://www.eof.dk/Priser-og-Forbrug
KPMG (2009) VAT in Denmark – a short
guide.
Tax expenditures in social contributions and personal income taxes
N.a.
Tax expenditures in corporate income taxes
N.a.
Tax expenditures in royalties
Income derived from oil and gas production is subject to various taxes and fees:
corporate income tax, a hydrocarbon tax (a specific tax on income derived from oil
and gas production), royalties and compensatory payments and profit sharing. The
25% corporate tax is deductible from the hydrocarbon tax base, for which the tax rate
is 52%. In addition to this, the oil pipeline tariff and compensatory fee can be offset
against the hydrocarbon tax, but not against the corporate tax base.
Reference:
OECD (2013) Inventory of Estimated Budgetary Support and Tax Expenditures for
Fossil Fuels 2013.

Enhancing comparability of data on estimated budgetary support and tax expenditures for fossil fuels
August 2014 88
Estonia
Reporting years: 2005 and 2011
Direct budgetary support to consumers/users
Name of the
scheme and short
description
Compensation for Farmers and Fishers for an Increased
Excise Duty on Diesel (data for 2005)
In 2005, the fuel excise-tax rate on diesel used in agriculture
and on board fishing vessels was increased from EUR 26.8 to
44.1 per 1 000 litres. In order to compensate farmers and
fishermen for this increase, the government decided to grant
compensatory payments to farmers (in 2005) and fishermen (in
2005 and 2006).
In the period between 2004 and 2011, marked diesel was used
as fuel in rail transport of passengers and goods, water cargo,
fishing vessels, stationary engines and for heating and in
combined production of heat and electricity. In the same period,
marked light heating oil was used as fuel in rail transport of
passengers and goods, water cargo, fishing vessels, stationary
engines, tractors and other machinery used in agriculture,
forestry and construction, machines and vehicles that do not use
public roads and in combined production of heat and electricity.
Final beneficiary The final beneficiaries are farmers and fishermen who have
received single area payments in the year 2005.
The amount of the grant is calculated based on the consumption
of the special purpose diesel.
Direct beneficiary Same as above.
Aid category State aid.
Variability The part of excise duty is compensated if it corresponds to 125
litre for every hectare of the agricultural area that is considered
eligible in terms of the single area payments in 2005. If the data
in the database of the Tax and Customs Board differs (is less)
from the data stated in the compensation application, it shall be
the basis for calculating the compensation rate.
Those farmers that were recipients of the single area payments,
as stipulated by the EU Common Agricultural Policy, were
eligible for the compensatory payment amounting to EUR
0.0173 per litre of diesel used. A maximum of 125 litres could
be claimed on each hectare of arable land.
In 2005 up to 0.017 EUR per liter of the purchased special
purpose diesel (diesel fuel marked with a fiscal marker) was
reimbursed.
If the recoverable amount exceeds the total duty amount of

Enhancing comparability of data on estimated budgetary support and tax expenditures for fossil fuels
August 2014 89
funds allocated from the state budget, it is reduced in proportion
to the benefit of applicants, following the principle of equal
treatment of applicants.
Objectives The objective is to compensate the increase of the excise duty
increase for the farmers and fishermen.
Conditionality for
eligibility
Those farmers that were recipients of the single area payments,
as stipulated by the European Union’s Common Agricultural
Policy, were eligible for the compensatory payment amounting
to EUR 0.0173 per litre of diesel used. A maximum of 125 litres
could be claimed on each hectare of arable land.
Conditionality for
magnitude of
subsidy
The magnitude of the subsidy is determined based on the actual
consumption of the special purpose diesel.
Source of funding The support is funded from the state budget in accordance with
the Minister of the Agriculture decree no 88, as of 08 August
2006 “Requirements and the order regarding the partial
compensation of the excise of the special purpose diesel for the
agriculturalists” .The support is paid out by Agricultural
Registers and Information Centre (the government agency
working in the area of administration of the Ministry of
Agriculture).
Fuel Special purpose diesel (diesel fuel marked with a fiscal marker)
Total amount 2005: € 0.306 mln
2011: no data estimates readily available in government
publications provided by the Ministry of the Agriculture and the
Ministry of Finance
Information
sources
Sources: Ministerial Regulations No. 88 (08.08.2006), Nr 98
(28.09.2005), and No. 34 (20.03.2006); PRIA (2005, 2006).
Direct budgetary support to producers
Direct budgetary support to primary producers
N.a.
Direct budgetary support for R&D purposes
According to the IEA database43, there has been no direct budgetary support for fossil
fuel R&D purposes for the years 2005 and 2011 in Estonia.
Public investments in energy infrastructure
N.a.
43 http://www.iea.org/statistics/RDDonlinedataservice/

Enhancing comparability of data on estimated budgetary support and tax expenditures for fossil fuels
August 2014 90
Tax expenditures
Excises and other specific taxes on energy use
Name of the
tax scheme
and short
description
Excise-duty taxation
In the period between 2005 and 2011 there has been
changes regarding the excise-duty payments.
Since 2009, natural gas used for the purpose of
operating natural gas networks is exempt from the
excise duty normally levied on natural gas.
From 1 January 2008 electricity is taxed with excise
duty.
As of 2011 oil shale used for heat production is subject
to excise-duty payments.
Summary of
fuels and
use(r)s to
which reduced
rates or
exemptions
applied in the
reporting years
An exemption from the excise-duty payments is applied to
fuels used by commercial or state-owned aircrafts.
Fuels (including natural gas) used for production of non-energy
products are exempt from the excise-duty payments. Such
uses include, e.g. production of glues, paints or in cleaning
production equipment.
Since 2007 both diesel fuel and light heating oil used by
domestic fishing boats are granted an excise-duty exemption.
There is a limit imposed on the amount of fuel to which the
exemption is applied, it is based on the amount of fish caught
or the capacity of the boat’s engine.
Liquid fuels and natural gas that are absolutely essential for
conducting certain mineralogical processes have been exempt
from the fuel excise duty since 2005 and 2008 respectively.
Oil shale used for heat production in district heating was not
subject to excise-duty payments in the period between 2005
and 2010.
Shale-derived fuel oil used for heat production in district
heating had been benefiting from a tax exemption until the end
of 2007, when that excise-duty exemption was abolished.
Shale-derived fuels and solid fuels used by households as
heating fuels are all exempt from the fuel-excise duty.
Although the law stipulates that solid fuels are exempt from
the fuel-excise duty, this exemption does not apply to peat, as
it is not encompassed by the fuel excise duty. Since shale-
derived fuel oil is not used by households for heating purposes,
the measure fully pertains to coal.
Those fuels that are used in stationary engines and vehicles
that are used in warehouses (i.e. vehicles that are not allowed

Enhancing comparability of data on estimated budgetary support and tax expenditures for fossil fuels
August 2014 91
to drive on public roads) are exempt from the fuel excise duty.
Since 2009, natural gas used for the purpose of operating
natural gas networks is exempt from the excise duty normally
levied on natural gas.
Since 1997, a reduced rate of the fuel excise duty is applied to
special uses of diesel fuel and light heating oil, for the purpose
of which both diesel and light heating oil are marked with a
special fiscal marker.
In the period between 2004 and 2011, marked diesel was used
as fuel in rail transport of passengers and goods, water cargo,
fishing vessels, stationary engines and for heating and in
combined production of heat and electricity.
From 01 January 2008 electricity is taxed with excise duty.
For detailed information regarding the tax rates, see the Excel
files.
Amount
calculated
(benchmark:
highest excise
per unit of
energy
consumption)
total per unit of energy per unit of CO2
2005: € 1003 mln
2011: € 360 mln
2005: € 6.00 / GJ
2011: € 5.57 / GJ
2005: € 77,67 / ton
2011: € 61.24 / ton
Amount
calculated
(benchmark:
highest excise
per unit of CO2
emissions)
total per unit of energy per unit of CO2
2005: € 1063 mln
2011: € 520 mln
2005: € 6.37/ GJ
2011: € 8.05 / GJ
2005: € 82.34 / ton
2011: € 88.51 / ton
Amount
calculated
(benchmark:
proposal new
energy
taxation
directive)
total per unit of energy per unit of CO2
2005: € 769 mln
2011: € 420 mln
2005: € 4.60 / GJ
2011: € 6.51 / GJ
2005: € 59.57 / ton
2011: € 71.57 / ton
Information
sources
Alcohol, Tobacco, Fuel and Electricity Excise Duty Act
Excise Duty on Marked Fuel, Explanatory Memorandum of the
2010 State Budget, Explanatory Memorandum of the 2011
State Budget
http://www.indexmundi.com/facts/estonia/co2-emissions

Enhancing comparability of data on estimated budgetary support and tax expenditures for fossil fuels
August 2014 92
http://www.ebrd.com/downloads/about/sustainability/cef.pdf
http://www.oecd-ilibrary.org/energy/data/iea-world-energy-
statistics-and-balances/extended-world-energy-balances_data-
00513-en (data report for Estonia)
Value Added Tax
Categories of energy supply to
which a reduced VAT rate was
applied in one or both of the
reporting years
In the period between the beginning of 2000 and
July 2007, a reduced rate of VAT of 5% was applied
to heating fuels consumed by households,
churches, hospitals, local-government buildings and
state-financed organisations. The same reduced
rate over the same period was also applied to peat,
coal and firewood sold to households.
Standard rate 2005: 18%
2011: 20%
Reduced rate 2005: 5%
Only one reduced rate was used for the
abovementioned categories.
Amount of support calculated
Total per unit of
energy
per unit of
CO2
2005:
2011:
€ 2.02 mln
N.A.
€ 0.03 / GJ
N.A.
€ 0.37 / ton
N.A.
Information sources Estonian Value Added Tax Act §15
Tax expenditures in social contributions and personal income taxes
N.a.
Tax expenditures in corporate income taxes
N.a.
Tax expenditures in royalties
N.a.

Enhancing comparability of data on estimated budgetary support and tax expenditures for fossil fuels
August 2014 93
Finland
Reporting years: 2002 and 2012
Direct budgetary support to consumers/users
N.a.
Direct budgetary support to producers
Direct budgetary support to primary producers
N.a.
Direct budgetary support for R&D purposes
According to the IEA Database, Finland spent 5.258 million EUR on government R&D
for fossil fuels in 2002, and 8.383 million EUR in 2011 (no information is available for
2012). The modalities of these expenditures are not reported.
Public investments in energy infrastructure
The electricity cables between Åland island and mainland Finland benefit from state
support, but we have not identified specific quantitative information.
Tax expenditures
Excises and other specific taxes on energy use
There are 4 relevant acts governing excises on fuel consumption in Finland:
Law on excise duty on liquid fuels – see
http://www.finlex.fi/sv/laki/ajantasa/1994/19941472 and
Law on excise duty on electricity and certain fuels – see
http://www.finlex.fi/sv/laki/ajantasa/1996/19961260
Law amending the Law on Excise Duty on Liquid Fuels– see
http://www.finlex.fi/sv/laki/alkup/1998/19980509 and
http://www.finlex.fi/sv/laki/alkup/1998/19980510
Act for refund of excise duty on certain energy products used in agriculture – see
http://www.finlex.fi/sv/laki/ajantasa/2006/20060603
Summary of fuels and
use(r)s to which reduced
rates or exemptions applied
in the reporting years
Excise duties in Finland are differentiated according
to the following criteria:
Fuel type: gasoline, diesel, peat, LPG, coal, fuel
oil, natural gas
Application: higher rates apply to transport
applications than to heating applications
Excises paid for professional use in agriculture

Enhancing comparability of data on estimated budgetary support and tax expenditures for fossil fuels
August 2014 94
are subject to refunds
Reduced rates apply to fossil fuels used in
combined electricity and heat production
LPG and fuel for commercial aviation and
shipping are untaxed
In cases where the excise duties paid by a
company during the accounting period for
electricity, coal, natural gas, and other
products that exceed 0.5 per cent of the
company’s value added during the accounting
period, the company is entitled to apply, on
the exceeding amount, for a refund of 85 per
cent of the amount of the excise duties paid
for the products or the excise duties
contained in their acquisition price. Only the
part exceeding 50 000 euros of the thus
calculated tax refund is repaid (source: TEU).
This refund is paid based on the information
from the previous fiscal year. In 2012, the
refund amounted to 71 millions EUR. In 2002,
it was 3.1 million EUR
The pronounced decrease in tax expenditures
between 2002 and 2012 can be attributed mainly to
the very sharp increase in excises levied on coal.
Amount calculated
(benchmark: highest excise
per unit of energy
consumption)
year: 2002
year: 2012
total per unit of
energy
per unit of CO2
€ 3912 mln
€ 2337 mln
€ 4.98 / GJ
€ 3.05 / GJ
€ 63.77/ ton
€ 43.93 / ton
Amount calculated
(benchmark: highest excise
per unit of CO2 emissions)
year: 2002
year: 2012
total per unit of
energy
per unit of CO2
€ 3910 mln
€ 2184 mln
€ 4.98/ GJ
€ 2.85 / GJ
€ 63.74/ ton
€ 41.04/ ton
Amount calculated
(benchmark: proposal new
energy taxation directive)
year: 2002
year: 2012
total per unit of
energy
per unit of CO2
€ 553 mln
€ 296 mln
€ 0.70/ GJ
€ 0.39/ GJ
€ 9.02/ ton
€ 5.56/ ton
Information sources http://www.finlex.fi/sv/laki/alkup/1998/19980509
http://www.finlex.fi/sv/laki/alkup/1998/19980510
http://www.finlex.fi/sv/laki/ajantasa/1994/19941472

Enhancing comparability of data on estimated budgetary support and tax expenditures for fossil fuels
August 2014 95
http://www.finlex.fi/sv/laki/ajantasa/1996/19961260
http://www.finlex.fi/sv/laki/ajantasa/2006/20060603
https://www.iea.org/co2highlights/co2highlights.pdf
Taxing Energy Use
e-mail correspondence with Finish tax administration
Value Added Tax
There are no reduced rates for fossil fuels or electricity.
Tax expenditures in social contributions and personal income taxes
N.a.
Tax expenditures in corporate income taxes
N.a.
Tax expenditures in royalties
To the best of our knowledge, the Finnish tax legislation does not contain specific
provisions on royalty regimes for the extraction of natural resources.

Enhancing comparability of data on estimated budgetary support and tax expenditures for fossil fuels
August 2014 96
France
Reporting years: 2000 and 2011
Direct budgetary support to consumers/users
Financial aid for electricity supply (« Aide financière pour la fourniture de
l'électricité : tarif social électricité. Mise à jour le 19.11.2013 - Direction de
l'information légale et administrative »also called « Le tarif de première
nécessité (TPN) ») This is a governmental budgetary support for residential electricity
consumption for low-income households. This measure has been put in place in 2005,
hence this benefit was not yet in place in the first reporting year.
Final beneficiary - Households
Direct beneficiary - Households receive reimbursement of (part of) their energy
bill
Variability - The reimbursement varies from 71 to 140€ depending on
the amount of people living in a household and according
to the total energy usage (3kVa, 6kVa or 9kVa and over)
Objectives Financial aid for low income households
Conditionality for
eligibility
There exist 3 different eligibility conditions:
- Households that receive state funded healthcare
(“couverture maladie universelle complémentaire (CMU-
C)”).
- People who are eligible for state aid for healthcare
(“l'assurance complémentaire santé (ACS)”)
- For people earning less than 2,175€ per year and per fiscal
person living in France and less than 2,420.78€ of
reference fiscal income in the overseas departments.
Conditionality for
magnitude of
subsidy
Amount of electricity bill reduction
3 kVa 6 kVa 9 kVa and more
One person 71 € 87 € 94 €
2 to 4 people 88 € 109 € 117 €
More than 5 people 106 € 131 € 140 €
Source of funding - By a tax levied on electricity producers for the contribution
to public services ("la contribution au service public de
l’électricité (CSPE)”)
Fuel Subsidy restricted to residential electricity users.
Total amount Prevision for 2014: € 327 mln, of which € 32 mln can be
attributed to fossil fuels (9.8% share in electricity production)
(No other data regarding this budgetary support was found in

Enhancing comparability of data on estimated budgetary support and tax expenditures for fossil fuels
August 2014 97
course of the project)
Information
sources
http://vosdroits.service-public.fr/particuliers/F10580.xhtml
http://www.developpement-durable.gouv.fr/Le-tarif-de-premiere-
necessite-TPN.html
legal references:
Décret n°2004-325 du 8 avril 2004 relatif à la tarification spéciale
de l'électricité comme produit de première nécessité
Arrêté du 20 juillet 2012 relatif aux tarifs réglementés de vente
de l'électricité
Arrêté du 23 décembre 2010 portant modification de la tarification
spéciale de l'électricité comme produit de première nécessité
The special solidarity rate (« Le tarif spécial de solidarité (TSS) »). This is a
budgetary support scheme for low income households, put in place in 2008.
Final beneficiary - Households
Direct beneficiary - Households
Variability
Range of consumption
Deduction or
global payment
relative to
home ‘s
composition in
€/year taxes
included
Individual Collective
0-1000
kWh/year
[cooking]
1000-
6000
kWh/year
[hot
water]
> 6000
kWh/year
[heating]
[heating]
One single person 22 € 67 € 94 € 72 €
One adult with
one child
A couple w/o child
or with one child
One adult with
two children or
more
29 € 90 € 124 € 95 €
A couple with two
children or more
37 € 112 € 156 € 119 €
Objectives Financial aid for low income households
Conditionality for
eligibility There exist 4 different eligibility conditions:
- Households that receive state funded healthcare
(“couverture maladie universelle complémentaire (CMU-
C)”).
- People who are eligible for state aid for healthcare
(“l'assurance complémentaire santé (ACS)”)

Enhancing comparability of data on estimated budgetary support and tax expenditures for fossil fuels
August 2014 98
- For people earning less than 2175€ per year and per fiscal
person living in France and less than 2420,78€ in the
overseas departments
- Households who receive a lump sum grant or a
reimbursement of (part of) their energy bill.
The TSS is also available for residents of social housing.
Conditionality for
magnitude of subsidy - The amount of people living in a given household
- Fuel use: for heating, boilers or cooking
- Depends on whether it concernes an individual house of
a collective heating system
Source of funding - This budgetary support is funded by a tax paid by gas
suppliers for this support scheme ( “la contribution au
tarif spécial de solidarité (CTSS)”)
Fuel Natural gas
Total amount Prevision for 2014: € 94 mln (No other data regarding this
budgetary support was found in course of the project)
Information sources http://www.developpement-durable.gouv.fr/Le-tarif-special-
de-solidarite-TSS.html
Direct budgetary support to producers
Direct budgetary support to primary producers
N.a.
Direct budgetary support for R&D purposes
Fiscal credit for research purposes (“Crédit impôt recherche”)
Final beneficiary Electricity producers44
Direct
beneficiary
Electricity producers
Aid category Budgetary support
Variability - 30% of R&D expenseses for spendings up to 100million
euros
- 5% of R&D spending for costs over 100 million euros
Objectives Support for innovation and technological advance
Conditionality for
eligibility
- Any industrial or commercial company, or agricultural
producer
Conditionality for
magnitude of
subsidy
The magnitude of the subsidy is determined as a percentage
of the total R&D spending.
44 It is to be noted that the French Electricity Mix is mainly composed by Nuclear and
Hydro power (>90%)

Enhancing comparability of data on estimated budgetary support and tax expenditures for fossil fuels
August 2014 99
Source of
funding
Federal government
Fuel Electricity
Total amount 2002: € 57 mln45
2005 : € 134 mln 46
These are the only budgetary support found in course of the
project. It is to be noted that this support is destined to
electricity producers in general (see previous footnote).
Information
sources
http://media.education.gouv.fr/file/14/2/7142.pdf
http://media.enseignementsup-
recherche.gouv.fr/file/42/2/20422.pdf
In the IEA Data Services47, the total RD&D budget for fossil fuels is reported to
represent € 39 million in 2000 and € 117 million (nominal prices) in 2011. No
information on the sources (Federal or Regional governments) and on the beneficiaries
of this funding is available.
Public investments in energy infrastructure
The State Aid Register of the European Commission was consulted and no cases of
public investments in energy infrastructure were found for the years 2000 and 2011
for France.
Tax expenditures
Excises and other specific taxes on energy use
The main excise tax on energy in France is the TICPE (Taxe Intérieure de
Consommation sur les Produits Energétiques). It can be seen from legislation that the
excise tax rates on fossil fuels will increase in the years between 2014 and 2016.
Except for the tax on Superéthanol E 85 which will decrease from 12.4€/hl to 7.96€/hl
in 2016.
Summary of fuels and use(r)s to
which reduced rates or exemptions
applied in the reporting years
The main exemptions are for Jet fuel, Butane
and Propane and reduced rates apply to Gas Oil
for heating and Process uses and heavy fuel oil,
though some exemptions could not be reported
in the estimations below, including:
- Road transportation of goods and
Public Road Transportation
- Public Transportation and Garbage
collection using LPG or CNG
45 €53 mln for “electric and electronic industries” and 4 for “hydrocarbons and energy
production” 46 €123 mln for “electric and electronic industries” and 11 for “hydrocarbons and
energy production” 47 http://www.iea.org/statistics/RDDonlinedataservice/

Enhancing comparability of data on estimated budgetary support and tax expenditures for fossil fuels
August 2014 100
- Taxi Drivers
- Certain merchants located in small
towns (less than 3000 habitants);
- Co-generation
- Activities of the Ministry of Defence
- Local Administrations
- Stationary Engines.
Amount calculated (benchmark:
highest excise per unit of energy
consumption)
2000
2011
Total: per unit of
energy
per unit of
CO2
€ 23,515 mln
€ 19,226 mln
€ 4.58/ GJ
€ 3.21 / GJ
€ 71.50 /ton
€ 55.39 /ton
Amount calculated (benchmark:
highest excise per unit of CO2
emissions)
2000
2011
total per unit of
energy
per unit of
CO2
€23,515 mln
€ 19,226 mln
€ 4.58 / GJ
€ 3.21 / GJ
€ 71.5017
/ton
€ 55.39/ ton
Amount calculated (benchmark:
proposal new energy taxation
directive)
2000
2011
total per unit of
energy
per unit of
CO2
€ 5,559 mln
€ 5,610 mln
€ 1.08 / GJ
€ 0.94/ GJ
€ 16.90 / ton
€ 16.16/ ton
Information sources http://ec.europa.eu/taxation_customs/resource
s/documents/taxation/excise_duties/energy_pr
oducts/rates/excise_duties-
part_ii_energy_products_en.pdf
https://circabc.europa.eu/sd/a/a163d5b0-
c043-47c1-8361-
b7a83c6447ba/EDT%202000%20Nov%20-
%20REF_1010.pdf
http://www.developpement-
durable.gouv.fr/La-fiscalite-des-
produits,11221.html
http://www.developpement-
durable.gouv.fr/Prix-de-vente-moyens-
des,10724.html
Value Added Tax
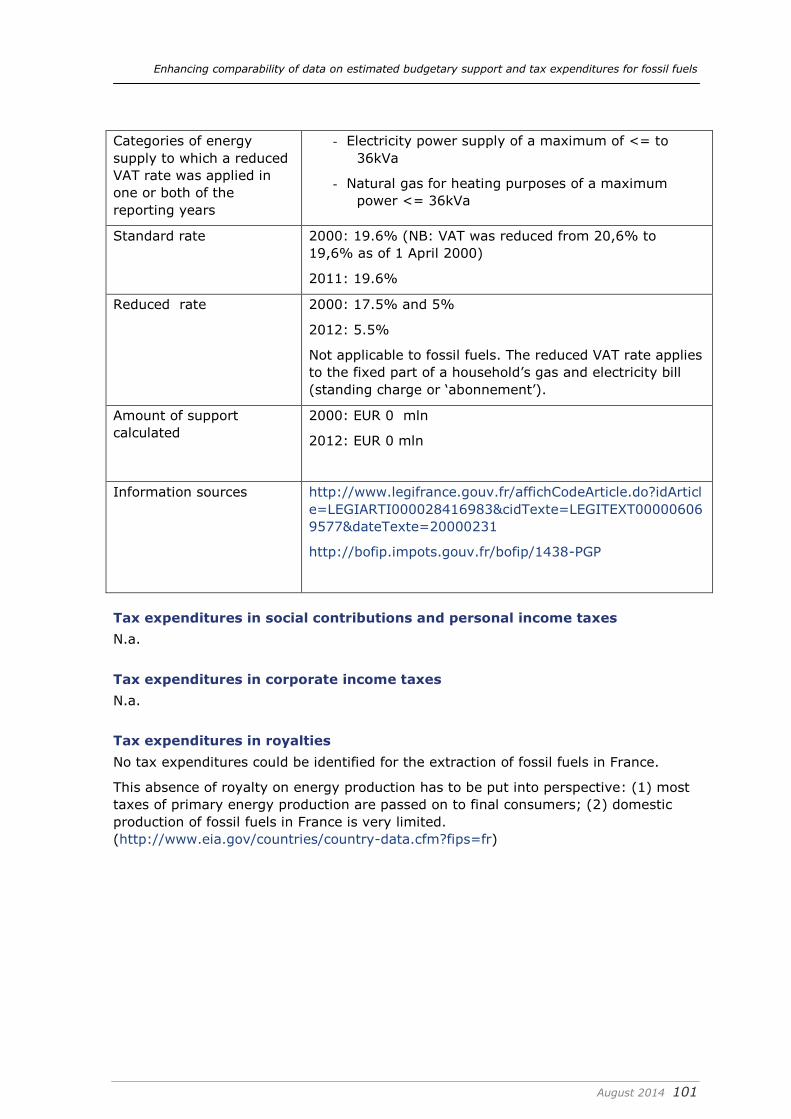
Enhancing comparability of data on estimated budgetary support and tax expenditures for fossil fuels
August 2014 101
Categories of energy
supply to which a reduced
VAT rate was applied in
one or both of the
reporting years
- Electricity power supply of a maximum of <= to
36kVa
- Natural gas for heating purposes of a maximum
power <= 36kVa
Standard rate 2000: 19.6% (NB: VAT was reduced from 20,6% to
19,6% as of 1 April 2000)
2011: 19.6%
Reduced rate 2000: 17.5% and 5%
2012: 5.5%
Not applicable to fossil fuels. The reduced VAT rate applies
to the fixed part of a household’s gas and electricity bill
(standing charge or ‘abonnement’).
Amount of support
calculated
2000: EUR 0 mln
2012: EUR 0 mln
Information sources http://www.legifrance.gouv.fr/affichCodeArticle.do?idArticl
e=LEGIARTI000028416983&cidTexte=LEGITEXT00000606
9577&dateTexte=20000231
http://bofip.impots.gouv.fr/bofip/1438-PGP
Tax expenditures in social contributions and personal income taxes
N.a.
Tax expenditures in corporate income taxes
N.a.
Tax expenditures in royalties
No tax expenditures could be identified for the extraction of fossil fuels in France.
This absence of royalty on energy production has to be put into perspective: (1) most
taxes of primary energy production are passed on to final consumers; (2) domestic
production of fossil fuels in France is very limited.
(http://www.eia.gov/countries/country-data.cfm?fips=fr)

Enhancing comparability of data on estimated budgetary support and tax expenditures for fossil fuels
August 2014 102
Germany
Reporting years: 2000 and 2011
Direct budgetary support to consumers/users
Name of the scheme
and short description
Energiesteuerbegünstigung für Unternehmen des
Produzierenden Gewerbes in Sonderfällen (Spitzenausgleich) (§
55 EnergieStG) (Peak Equalisation Scheme)
With the 1999 ecotax Germany introduced reductions to
pension contributions for manufacturing companies as a
compensation for higher energy costs. For those companies
where these reductions are not sufficient to compensate for the
higher tax burden from electricity tax and increased energy tax
on heating fuels, the peak equalization scheme provides an
additional refund on their energy tax bill.
Final beneficiary Certain energy consuming companies
Direct beneficiary Certain energy consuming companies
Variability For those companies where the additional tax burden is higher
than the reduction in pension contributions, 95% (until 2010;
90% as of 2011) of this difference is refunded.
Objectives Avoiding disadvantages for German manufacturing companies
in international competition
Conditionality for
eligibility
See “variability”. Conditional upon introduction of energy and
environmental management systems as of 2013.
Conditionality for
magnitude of
subsidy
As above.
Source of funding Federal budget.
Fuel Tax burden relates to electricity tax and energy tax on heating
fuels.
Total amount Tax expenditure related to measure:
2005: € 240 mln (not clear when introduced – no earlier data
found)
2011: € 170 mln
Information sources BMF (2007); BMF (2013); OECD (2013)
All other schemes identified for Germany take the form of tax reductions, exemptions
etc, so included under excise tax expenditures below.

Enhancing comparability of data on estimated budgetary support and tax expenditures for fossil fuels
August 2014 103
Direct budgetary support to producers
Direct budgetary support to primary producers
Name of the
scheme and
short
description
Zuschüsse für den Absatz
deutscher Steinkohle zur
Verstromung, zum Absatz an
die Stahlindustrie sowie zum
Ausgleich von Belastungen
infolge von
Kapazitätsanpassungen
(Combined Aids in North
Rhine-Westphalia)
Bergmannsprämie
(Miners' Bonus)
Classified as production subsidy in
OECD (2013)
Final
beneficiary
Steel industry Coal mining industry
Direct
beneficiary
Hard coal industry Miners
Aid category Income support Income support (via an income-tax
deduction)
Variability Lump sum grant that is
reduced in case of higher
world market prices for hard
coal
Lump sum payment per complete
shift underground
Objectives Socially acceptable end of
subsidised hard coal
extraction in Germany
Recognising the special nature of
the miner’s profession. Making
wages in the mining industry more
attractive. Boosting hard-coal
production in Germany.
Conditionality
for eligibility
N/A N/A
Conditionality
for magnitude
of subsidy
Subsidy may be reduced in
case of higher than expected
world market prices
Depending on numbers of
underground shifts completed by
the miner.
Source of
funding
Federal government and
state government (NRW)
Federal government
Fuel Hard coal Coal
Total amount 2000: 3712 million EUR
2011: 1349 million EUR
2000: 44 million EUR
2008: 1 million EUR (after that
phased out)
Information
sources
BMF (2001) 18. Subventionsbericht, Bericht der Bundesregierung
über die Entwicklung der Finanzhilfen des Bundes und der
Steuervergünstigungen für die Jahre 1999 – 2002.
Bundesministerium der Finanzen.
BMF (2013) 24. Subventionsbericht, Bericht der Bundesregierung

Enhancing comparability of data on estimated budgetary support and tax expenditures for fossil fuels
August 2014 104
über die Entwicklung der Finanzhilfen des Bundes und der
Steuervergünstigungen für die Jahre 2011 – 2014.
Bundesministerium der Finanzen.
OECD (2013) Inventory of estimated budgetary support and tax
expenditures for fossil fuels 2013. OECD Publishing,
http://dx.doi.org/10.1787/9789264187610-en [accessed:
09/04/2014].
Direct budgetary support for R&D purposes
Name of the
scheme and
short
description
No specific scheme – IEA estimates presented
Final
beneficiary
Direct
beneficiary
Aid category
Variability
Objectives According to the 2007 IEA country review for Germany, the main goal of R&D
spending is to increase the efficiency of coal- and gas-fired power plants as
more than 30% of Germany’s power stations, representing around 40 GW
installed capacity, must be replaced by 2020. Development of carbon capture
and storage technology is also mentioned as a priority research area (IEA,
2007).
Conditionality
for eligibility
Conditionality
for
magnitude of
subsidy
Source of
funding
IEA figures below refer to government R&D, not clear whether this includes
lower level government funding or only federal level.
Fuel Oil, gas and coal as well as CCS reported below.
Total amount The following are for Government R&D in million EUR (nominal). Sum of
categories “oil and gas” and “coal” and separate figures reported for “CO2
capture and storage”.
Oil, gas and coal:
2000: € 9.15 mln
2009: € 19.12 mln; 2010: € 13.66 mln (two years reported due to fluctuation)
(2011 not available)

Enhancing comparability of data on estimated budgetary support and tax expenditures for fossil fuels
August 2014 105
CO2 capture and storage:
2000: € 0 mln
2010: € 12.82 mln; 2011: € 5.50 mln
Information
sources
IEA (2007) Energy policies of IEA countries – Germany, 2007 Review,
http://www.iea.org/publications/freepublications/publication/germany2007.pdf
[accessed: 09/04/2014].
IEA (2014) IEA Energy Technology RD&D Statistics, DOI: 10.1787/enetech-
data-en [accessed: 09/04/2014].
Public investments in energy infrastructure
No information found for Germany.
Tax expenditures
Excises and other specific taxes on energy use
Name of the tax scheme
and short description
Energy taxation for Germany is set out in the
Energiesteuergesetz (energy tax law), in place since 2006.
It replaced the former mineral oil taxation law
(Mineralölsteuergesetz) to bring German energy taxation
in line with Directive 2003/96/EC.
Summary of fuels and
use(r)s to which reduced
rates or exemptions
applied in the reporting
years
The Energiesteuergesetz extended the scope of energy
taxation in Germany to coal, coke and lubricants, for
which zero rates applied previously (hence also in our
reference year 2000).
The details of tax rates for each (sub)category are
reported in the Excel template:
LPG and natural gas used as transport fuels;
Fuels used in domestic aviation and domestic
navigation;
Energy carriers used in certain industrial processes,
manufacturing enterprises and agriculture and
forestry to ensure international competitiveness;
Others mentioned below under “miscellaneous”
heading
Amount calculated
(benchmark: highest
excise per unit of energy
consumption)
total per unit of
energy
per unit of CO2
2000: € 19,260
mln
2011: € 21,993
mln
2000: € 2.41 /
GJ
2011: € 2.88 /
GJ
2000: € 26.61 / ton
2011: € 32.40 / ton

Enhancing comparability of data on estimated budgetary support and tax expenditures for fossil fuels
August 2014 106
Amount calculated
(benchmark: highest
excise per unit of CO2
emissions)
Total per unit of
energy
per unit of CO2
2000: € 19,260
mln
2011: € 21,537
mln
2000: € 2.41 /
GJ
2011: € 2.82 /
GJ
2000: € 26.61 / ton
2011: € 31.73 / ton
Amount calculated
(benchmark: proposal
new energy taxation
directive)
Total per unit of
energy
per unit of CO2
2000: € 2,531
mln
2011: € 871 mln
2000: € 0.32 /
GJ
2011: € 0.11 /
GJ
2000: € 3.50 / ton
2011: € 1.28 / ton
Information sources See excel template in particular the sheets containing
background data for details. Sources for main data:
Tax rates: For 2011, rates were taken from
Statistisches Bundesamt (2013), Finanzen und
Steuern: Energiesteuer, Fachserie 14, Reihe 9.348.
As this series is only available on the internet until
2006, DG TAXUD Excise Duty Tables (March 2000
edition) were used as the main source for 2000 tax
rates, supplemented with some national sources
were more detailed information was needed (see
excel spread sheet for details)
Tax bases (ie consumption across the different
energy carriers) for both years: Data was taken
from the OECD/IEA Extended World Energy
Balances
Conversion factors into GJ for both years: Taken
from “Conversion calculator AG Energiebilanzen”49
(this did not contain conversion factors for all
energy carriers covered, in which cases we used
those sourced for Belgium – this is indicated in the
relevant sheet in the excel file)
Conversion factors to CO2 for both years: UNFCCC
National Inventory Report 2013, pp740ff 50
48
https://www.destatis.de/DE/Publikationen/Thematisch/FinanzenSteuern/Steuern/Verb
rauchsteuer/Energiesteuer2140930127004.pdf;jsessionid=D86574B34B65D04C0DB12
503F8D90345.cae1?__blob=publicationFile 49 http://www.ag-
energiebilanzen.de/DE/energieeinheitenumrechner/energieeinheitenumrechner.html 50
http://unfccc.int/files/national_reports/annex_i_ghg_inventories/national_inventories_
submissions/application/zip/deu-2013-nir-15may.zip

Enhancing comparability of data on estimated budgetary support and tax expenditures for fossil fuels
August 2014 107
Miscellaneous:
These include tax reduction sub-categories for which no data on tax bases are
available from IEA EWEB; therefore these are not considered in above estimates and
reported separately hereunder.
Name of the tax scheme and short
description
Amount tax
expenditure
Sources
Tax reduction for diesel in the agricultural
sector (Art. 57 of EnergieStG) (special
rules apply to biodiesel).
(Steuerbegünstigungen für Betriebe der
Land-und Forstwirtschaft - Agrardiesel)
2000: € 235 mln
2011: € 460 mln
Energiesteuergesetz;
BMF (2001); BMF
(2013)
Tax reduction for transport within area of
sea harbours (§ 3a EnergieStG)
(Energiesteuerbegünstigung von
Arbeitsmaschinen und Fahrzeugen, die
ausschließlich dem Güterumschlag in
Seehäfen dienen)
2000: -
2011: € 25 mln
BMF (2001); BMF
(2013)
Tax reduction for public transport (§ 56
EnergieStG)
(Steuerbegünstigung für den öffentlichen
Personennahverkehr)
For 2011, national data have been
sourced and are hence included above,
nevertheless reported here for
comparison purposes.
2000: € 41 mln
2011: € 67 mln
BMF (2001); BMF
(2013)
Tax reduction on electricity used in
electrified rail and bus transport (§ 9 Abs.
2 Nr. 2 StromStG)
(Stromsteuerbegünstigung für den
Fahrbetrieb im Schienenbahnverkehr und
den Verkehr mit Oberleitungsomnibussen)
2000: € 102 mln
2011: € 120 mln
BMF (2001); BMF
(2013)
Value Added Tax
Not applicable, as no tax expenditures of this kind existed in the reporting years (i.e.
all energy supplies were taxed at the standard rate).
Tax expenditures in social contributions and personal income taxes
N.a.
Tax expenditures in corporate income taxes
N.a.
Tax expenditures in royalties
Reductions in royalty rates for coal mines in Germany
As set out in OECD (2013), federal guidelines set royalty rates for hard coal at 10% of
the market value of its production. This can therefore be considered the benchmark
for royalty rates. The Länder are free to deviate from these guidelines and in fact
North-Rhine Westphalia, accounting for 90% of hard coal production, sets royalty

Enhancing comparability of data on estimated budgetary support and tax expenditures for fossil fuels
August 2014 108
rates at 0%. Against the 10% baseline, OECD (2013) calculates tax expenditures
from reduced royalties on hard coal extraction at:
151 millions EUR in 2005; and
153 millions EUR in 2011 (the latest year available)51.
A similar approach is followed for tax expenditures from reduced royalties on
lignite extraction, for which again a federal guideline of 10% is set. Based on this
tax expenditures are estimated to be (OECD, 2013):
201 millions EUR in 2005; and
199 millions EUR in 2008 (the latest year available).
References
BMF (2013) 24. Subventionsbericht, Bericht der Bundesregierung über die Entwicklung
der Finanzhilfen des Bundes und der Steuervergünstigungen für die Jahre 2011 –
2014. Bundesministerium der Finanzen.
BMF (2001) 18. Subventionsbericht, Bericht der Bundesregierung über die Entwicklung
der Finanzhilfen des Bundes und der Steuervergünstigungen für die Jahre 1999 –
2002. Bundesministerium der Finanzen.
IEA (2007) Energy policies of IEA countries – Germany, 2007 Review,
http://www.iea.org/publications/freepublications/publication/germany2007.pdf
[accessed: 09/04/2014].
IEA (2014) IEA Energy Technology RD&D Statistics, DOI: 10.1787/enetech-data-en
[accessed: 09/04/2014].
Energiesteuergesetz (EnergieStG), "Energiesteuergesetz vom 15. Juli 2006 (BGBl. I S.
1534; 2008 I S. 660, 1007), das zuletzt durch Artikel 1 des Gesetzes vom 5.
Dezember 2012 (BGBl. I S. 2436, 2725; 2013 I 488) geändert worden ist",
http://www.gesetze-im-internet.de/bundesrecht/energiestg/gesamt.pdf [accessed:
09/04/2014].
OECD (2013) Inventory of estimated budgetary support and tax expenditures for fossil
fuels 2013. OECD Publishing, http://dx.doi.org/10.1787/9789264187610-en
[accessed: 09/04/2014].
Stromsteuergesetz (StromStG), "Stromsteuergesetz vom 24. März 1999 (BGBl. I S.
378; 2000 I S. 147), das zuletzt durch Artikel 2 des Gesetzes vom 5. Dezember 2012
(BGBl. I S. 2436, 2725) geändert worden ist" http://www.gesetze-im-
internet.de/bundesrecht/stromstg/gesamt.pdf [accessed: 09/04/2014].
51 OECD (2012) note that these are conservative values for two reasons: a low
benchmark (in some instances sub-national royalty rates amount up to 40%) and the
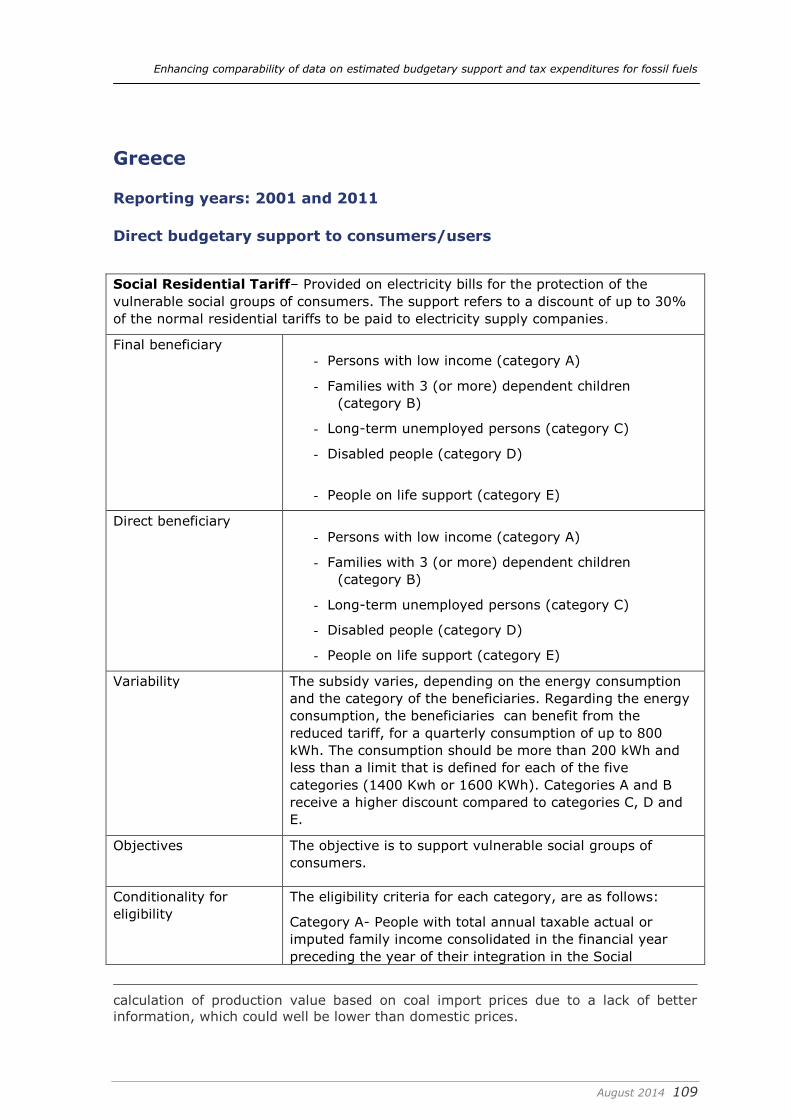
Enhancing comparability of data on estimated budgetary support and tax expenditures for fossil fuels
August 2014 109
Greece
Reporting years: 2001 and 2011
Direct budgetary support to consumers/users
Social Residential Tariff– Provided on electricity bills for the protection of the
vulnerable social groups of consumers. The support refers to a discount of up to 30%
of the normal residential tariffs to be paid to electricity supply companies.
Final beneficiary - Persons with low income (category A)
- Families with 3 (or more) dependent children
(category B)
- Long-term unemployed persons (category C)
- Disabled people (category D)
- People on life support (category E)
Direct beneficiary - Persons with low income (category A)
- Families with 3 (or more) dependent children
(category B)
- Long-term unemployed persons (category C)
- Disabled people (category D)
- People on life support (category E)
Variability The subsidy varies, depending on the energy consumption
and the category of the beneficiaries. Regarding the energy
consumption, the beneficiaries can benefit from the
reduced tariff, for a quarterly consumption of up to 800
kWh. The consumption should be more than 200 kWh and
less than a limit that is defined for each of the five
categories (1400 Kwh or 1600 KWh). Categories A and B
receive a higher discount compared to categories C, D and
E.
Objectives
The objective is to support vulnerable social groups of
consumers.
Conditionality for
eligibility
The eligibility criteria for each category, are as follows:
Category A- People with total annual taxable actual or
imputed family income consolidated in the financial year
preceding the year of their integration in the Social
calculation of production value based on coal import prices due to a lack of better
information, which could well be lower than domestic prices.

Enhancing comparability of data on estimated budgetary support and tax expenditures for fossil fuels
August 2014 110
Residential Tariff and lower than the amount of 12,000
euros, not including the foreseen income reductions. This
limit is increased by 50% if the beneficiary lives
permanently in an island with population under 3,100
people. In addition the limit is further increased by €3,000
for each child referring to the first two children as defined
by the Income Tax Code.
Category B - Parents with three children, as derived from
their tax statement consolidated in the year preceding the
year of their application and with annual taxable actual or
imputed family income lower than 23,500 euros, not
including the foreseen income reductions.
Category C- Unemployed on the 30th of November of the
year preceding the year of their application for a continuous
unemployment period of 6 months with annual total actual
or imputed family income lower than the amount of €12,000
consolidated in the year preceding to the year of their
integration. This limit is increased by 50% for cases which
the beneficiary lives permanently in an island with
population under 3,100 people. This limit is further
increased by €3,000 per child referring to the first two
dependent children, as defined by the Income Tax Code.
Employment income included in the above mentioned tax
statement prior to the unemployment period, is not taken
into consideration.
Category D - People with handicap of more than sixty seven
per cent (67%) or people who have dependent members
with handicap of more than 67% as derived from their
consolidated tax statement in the year preceding the year of
their application and with annual taxable actual or imputed
family income lower than the amount limit of Category B,
not including the foreseen income reductions.
Category E - People in need of medical life-support
equipment that is provided at home and is essential for
maintaining the patient’s life or person who has a
dependent family member in need of power consuming life-
support equipment, with annual taxable actual or imputed
family income lower than €30,000, not including the
foreseen income reductions.
Conditionality for
magnitude of subsidy
Magnitude of subsidy depends on the energy consumption
and the category of the beneficiaries. Regarding the energy
consumption, the beneficiaries can benefit from the reduced
tariff, for a quarterly consumption of up to 800 kWh. The
consumption should be more than 200 kWh and less than a
limit that is defined for each of the five categories (1400
Kwh or 1600 KWh). Categories A and B receive a higher
discount compared to categories C, D and E.
Source of funding The general government budget.
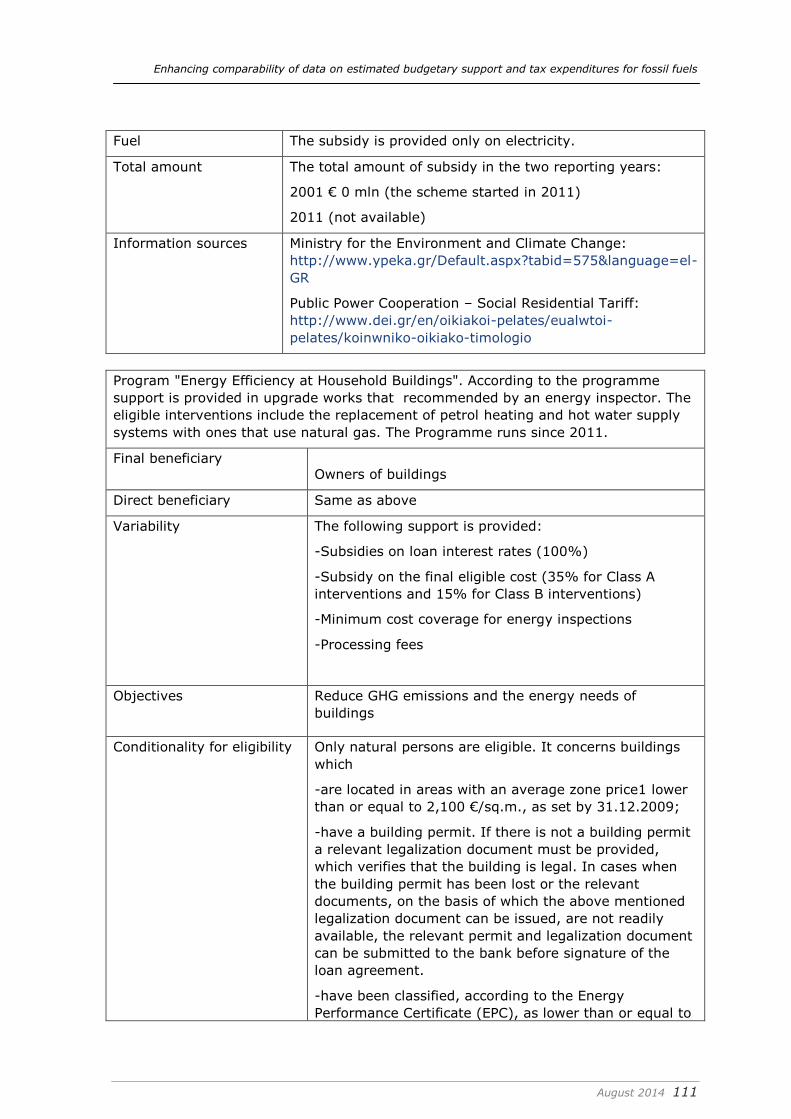
Enhancing comparability of data on estimated budgetary support and tax expenditures for fossil fuels
August 2014 111
Fuel The subsidy is provided only on electricity.
Total amount The total amount of subsidy in the two reporting years:
2001 € 0 mln (the scheme started in 2011)
2011 (not available)
Information sources Ministry for the Environment and Climate Change:
http://www.ypeka.gr/Default.aspx?tabid=575&language=el-
GR
Public Power Cooperation – Social Residential Tariff:
http://www.dei.gr/en/oikiakoi-pelates/eualwtoi-
pelates/koinwniko-oikiako-timologio
Program "Energy Efficiency at Household Buildings". According to the programme
support is provided in upgrade works that recommended by an energy inspector. The
eligible interventions include the replacement of petrol heating and hot water supply
systems with ones that use natural gas. The Programme runs since 2011.
Final beneficiary Owners of buildings
Direct beneficiary Same as above
Variability The following support is provided:
-Subsidies on loan interest rates (100%)
-Subsidy on the final eligible cost (35% for Class A
interventions and 15% for Class Β interventions)
-Minimum cost coverage for energy inspections
-Processing fees
Objectives
Reduce GHG emissions and the energy needs of
buildings
Conditionality for eligibility Only natural persons are eligible. It concerns buildings
which
-are located in areas with an average zone price1 lower
than or equal to 2,100 €/sq.m., as set by 31.12.2009;
-have a building permit. If there is not a building permit
a relevant legalization document must be provided,
which verifies that the building is legal. In cases when
the building permit has been lost or the relevant
documents, on the basis of which the above mentioned
legalization document can be issued, are not readily
available, the relevant permit and legalization document
can be submitted to the bank before signature of the
loan agreement.
-have been classified, according to the Energy
Performance Certificate (EPC), as lower than or equal to

Enhancing comparability of data on estimated budgetary support and tax expenditures for fossil fuels
August 2014 112
class D;
-have not been marked for demolition
Conditionality for
magnitude of subsidy
The subsidy on the final cost of interventions related to
the installation of natural gas heating system, varies
between EUR 5,000 and EUR 11,000, depending on the
type and capacity of the system.
Source of funding State budget, co-financed by EU funds
Fuel Natural gas
Total amount The scheme started in 2011 and was not in place in
2001. The total budget of the programme is EUR 796
million. The programme will run until the budget has
been spent.
Information sources Ministry of the Environment, Energy and Climate
Change, http://exoikonomisi.ypeka.gr/Default.aspx
Subsidy of suppliers of fuels to remote areas - The subsidy is provided to
companies that supply oil to islands, areas close to boarders and other remote areas.
A decision of the Ministry of Development, defines the characteristics of geographic
regions according to their needs of adequate supply of petroleum products. The funds
derive from a Special Account opened in the Bank of Greece called “Account for
Funding Petroleum Supply Companies for the Transportation of Fuels in Problematic
Areas of the Country".
Final
beneficiary
Residents and businesses located in remote areas.
Direct
beneficiary
Licence holders granted for the supply of fuels in problematic areas.
Variability A levy rate of 1.2 % is charged in the price (before taxes) of
petroleum products supplied by: a) Holders of licences for the supply
of petroleum products b) petrol stations c) fuel supply cooperatives or
consortia and d) large final customers who purchase fuels directly from
refineries, excluding fuels used in armed forces, aviation, domestic and
international navigation.
The size of subsidy by region, by product and by beneficiary, as well as
the process of allocating the funds is defined by the Ministry of Finance
Objectives To ensure the adequate supply of fuels in remote areas.
Conditionality
for eligibility
To be eligible, the beneficiary shall be located in a remote area as
defined by the Ministry of Development.
Conditionality
for
magnitude of
subsidy
Same as above.

Enhancing comparability of data on estimated budgetary support and tax expenditures for fossil fuels
August 2014 113
Source of
funding
Petrol companies and large final consumers (See section on variability)
Fuel The subsidy covers petroleum products
Total amount The table below show the amount of subsidy, between 2005 and 2011.
Support Element 20
05
20
06
20
07
20
08
20
09
20
10
201
1p
Subsidy for Suppliers of
Fuels to Remote Areas 6 6 6 7 4 7 7
Information
sources
OECD-IEA, Fossil fuel subsidies and other support,
http://www.oecd.org/site/tadffss/
Law 3054/2002, on the organisation of the oil market and other
provisions,
http://portal.tee.gr/portal/page/portal/SCIENTIFIC_WORK/GR_ENERG
EIAS/nomothesia/greekLaws/%CD-3054-2002.pdf
Direct budgetary support to producers
Direct budgetary support to primary producers
N.a.
Direct budgetary support for R&D purposes
According to the IEA database, the total expenditures spent on R&D in the two
reporting years are as follows:
2001: € 0.638 mln
2011: € 0.716 mln
The exact type of this R&D and the organisations involved are unknown.
Public investments in energy infrastructure
Support provided through the Operational Programme for Energy and
Development 2007-2013 and the Development Law to:
-increase the penetration of natural gas into new regions with the expansion of
distribution networks in the regions of Central Greece, Eastern Macedonia & Thrace
and Central Macedonia
-expand the transmission system of natural gas and increase its capacity and stability
-connect the national transmission system with Italy
-connect islands with the National Interconnected Transmission System to meet their
needs of electricity
- construction of Extra High Voltage (EHV) for a stable and smooth supply of
electricity.

Enhancing comparability of data on estimated budgetary support and tax expenditures for fossil fuels
August 2014 114
Final beneficiary Energy supply companies and investors
Direct beneficiary Energy supply companies and investors
Aid category Direct subsidies on investments, exemption from
taxes and wage subsidies
Objectives Increase the use of natural gas and at the same
time decrease the use of petroleum. The subsidy
also aims at increasing energy supply security,
particularly in remote areas.
Conditionality for eligibility All entities are eligible for funding. An additional
subsidy of 10% is granted on medium-size
enterprises. The subsidy increases at 20% for small
and micro enterprises.
Conditionality for magnitude of
subsidy
The magnitude of subsidy depends on the
geographical zone where the investments is taking
place.
Source of funding Government budget, co-financed by EU funds
Fuel Natural gas, electricity and renewable energy
sources
Total amount No information available
Information sources Centre for Renewable Energy Sources and Energy
Saving (CRES) - Sources of Funding & Financial
Incentives for Energy Investments, available at:
http://www.cres.gr/kape/epixeiriseis_ependites.htm
Greek gas (EPA) – state aid provided in 2001
Final beneficiary Gas Supply Companies (EPA)
Direct beneficiary See above
Aid category Direct grant
Tax base reduction
Objectives To provide financial aid to compensate
the cost of the development of Gas
Provision Companies (EPA) in three
cities:
1. maximum 2.2 billion drachmas in
Thessaloniki (approximately
€6.5 million, accounting for 15%
of the total cost),
2. maximum 4.9 billion drachmas in
Thessaly (approximately €14.4
million, accounting for 70% of
the total cost), and

Enhancing comparability of data on estimated budgetary support and tax expenditures for fossil fuels
August 2014 115
3. maximum 22.9 billion drachmas
in Attica (approximately € 67.4
million, accounting for 43% of
the total cost).
Conditionality for eligibility Not applicable
Conditionality for magnitude of subsidy Any modification of the aid scheme has
to be notified to the European
Commission.
Source of funding State government (national resources)
Fuel Natural gas
Total amount Maximum GRD 30 billion (EUR 88.2
million) for grants, not quantifiable for
tax benefits
Information sources http://ec.europa.eu/competition/state_
aid/cases/139448/139448_1153859_18
_2.pdf
http://eur-lex.europa.eu/legal-
content/EN/TXT/?uri=uriserv:OJ.C_.20
01.333.01.0006.01.ENG
Aid in favour of the gas supply companies in Anatoliki Makedonia Thraki, Kentriki
Makedonia and Sterea Ellada) – state aid provided in 2011
Final beneficiary The beneficiaries of the aid are three
gas supply companies, EPA Anatoliki
Makedonia Thraki AE, EPA Kentriki
Makedonia AE and EPA Sterea Ellada AE
(EPA) which are to be established by
the public gas corporation of Greece,
DEPA AE.
Direct beneficiary See above
Aid category Direct grant
Objectives The measure aims to promote the
economic development of the regions of
Anatoliki Makedonia Thraki, Kentriki
Makedonia and Sterea Ellada, by
providing regional investment aid for
three investment projects consisting in
the development of natural gas
distribution networks in these areas.
Conditionality for eligibility Eligible expenditures are calculated
exclusively on the basis of investment
costs incurred during the four-year
investment period, and only concern

Enhancing comparability of data on estimated budgetary support and tax expenditures for fossil fuels
August 2014 116
new assets.
Eligible expenditures include the
following:
(a) network costs, which include the
costs of work for the construction of
medium-pressure distribution systems
(MPDS) and low-pressure distribution
systems (LPDS) and meter regulator
(M/R) stations;
(b) connection costs, which include the
costs of work for the connection of the
distribution system to the meters
installed at customers’ premises.
Conditionality for magnitude of subsidy Any modification of the aid scheme has
to be notified to the European
Commission.
Source of funding The aid is granted by the Greek
Ministry of the Environment, Energy
and Climate Change and the Greek
Ministry of Regional Development and
Competitiveness
Fuel Natural gas
Total amount Total eligible amount - € 155.9 million
Information sources http://ec.europa.eu/competition/state_
aid/cases/139448/139448_1153859_18
_2.pdf
http://eur-lex.europa.eu/legal-
content/EN/TXT/?uri=uriserv:OJ.C_.20
01.333.01.0006.01.ENG
Tax expenditures
Excises and other specific taxes on energy use
In Greece excise taxes are charged on all fuels, except natural gas (see the Excel
file for more details). Certain exemptions apply (see below).
Summary of fuels and use(r)s to which
reduced rates or exemptions applied in
the reporting years
1. Exemption from excise tax on
fuels used in navigation
(including commercial fishing) in
EU waters.
2. Exemption from excise tax on
fuels used to supply commercial
aviation.

Enhancing comparability of data on estimated budgetary support and tax expenditures for fossil fuels
August 2014 117
3. Taxes are not charged on fuels
consumed in facilities where
they are produced.
4. Exemption from excise duty on
diesel used exclusively as
insulation in electrical
transformers.
5. Refund of excise tax amounting to
125 Euros per 1000 l on diesel
used by industry and
commercial enterprises in
stationary motors, in machines
and mechanical equipment and
vehicles which are not intended
for use in public roads.
6. Refund of excise tax amounting to
125 Euros per 1000 l on diesel
used in hotels.
7. Refund of excise tax amounting to
125 Euros per 1000 l on diesel
used in public and private
hospitals and charities.
8. Exemption from excise tax on
aromatic hydrocarbons and
mixtures (benzene, xylene,
toluene) used by the industry as
raw materials.
9. Exemption from excise tax on
diesel, kerosene, white spirit
and other light fuels used by
industry solely as a raw material
for the production their
products.
10. Reduced excise tax amounting
to 299 Euros per 1000 l on
gasoline used in agriculture and
forestry.
11. Reduced excise tax amounting
to 0.29 Euros per tonne on LPG
and methane used in
agriculture.
12. Natural gas is exempted from
excise taxes.
13. Reduced excise tax amounting
to 21 Euros per 1000 l on
kerosene used in heating

Enhancing comparability of data on estimated budgetary support and tax expenditures for fossil fuels
August 2014 118
14. Reduced excise tax amounting
to 21 Euros per 1000 l on diesel
used in heating during the
winter season.
15. Exemption from excise tax on
coal, lignite and coke used for
the generation of electricity.
16. Exemption from excise tax on
coal, lignite and coke used in
mineral processing.
Amount calculated (benchmark:
highest excise per unit of energy
consumption)
year: 2001
year: 2011
total per unit of
energy
per unit of
CO2
€ 3154 mln
€ 5505 mln
€ 3.66 / GJ
€ 7.86 / GJ
€ 26.45 /
ton
€ 49.38 /
ton
Amount calculated (benchmark:
highest excise per unit of CO2
emissions)
year: 2001
year: 2011
Total per unit of
energy
per unit of
CO2
€ 3154
mln
€ 5505 mln
€ 3.66 / GJ
€ 7.86 / GJ
€ 26.45 /
ton
€ 49.38 /
ton
Amount calculated (benchmark:
proposal new energy taxation
directive)
year: 2001
year: 2011
Total per unit of
energy
per unit of
CO2
€ 2173 mln
€ 1471 mln
€ 2.52 / GJ
€ 2.10 / GJ
€ 18.22 /
ton
€13.20 /
ton
Information sources All calculations are based on
simulations in the Excel file.
Value Added Tax
Categories of energy supply to
which a reduced VAT rate was
applied in one or both of the
reporting years
Electricity and natural gas. Reduced VAT on these
fuels were applied both in 2001 and 2011.
Standard rate 2001: 18%
2011: 23%

Enhancing comparability of data on estimated budgetary support and tax expenditures for fossil fuels
August 2014 119
Reduced rate 2001: 9%
2011: 13%
Amount of support calculated
2001: EUR 137 mln
2011: EUR 188 mln
Information sources Tax Institute,
http://www.forin.gr/articles/article/4455/suntelestes-
f-p-a-agathwn-kai-uphresiwn
Tax expenditures in social contributions and personal income taxes
N.a.
Tax expenditures in corporate income taxes
N.a.
Tax expenditures in royalties
N.a.

Enhancing comparability of data on estimated budgetary support and tax expenditures for fossil fuels
August 2014 120
Hungary
Reporting years: 2005 and 2011
Direct budgetary support to consumers/users
Name of the
scheme and
short
description
Natural gas and district heating cost subsidies
From 2003 until 2006 a natural gas cost subsidy system was in place
which was based on subjective rights (alanyi jogon járó gázár-
támogatási rendszer), i.e. all household consumers were eligible for
the subsidy. In October 2005, a district heating cost subsidy for
retired people (nyugdíjasok távhőszolgáltatási témogatása) was
introduced and was in place until the end of 2006. In 2006, the
district heating cost subsidy was extended by including large families
(nagycsaládosoknak nyújtott távhő – és gázár támogatás). This
system changed in 2007 when the subsidy was no longer given to all
household consumers but was based on social aspects (szociális
alapú gázár támogatás), i.e. low-income households could only
receive the support. This support system was in place until
September 2011. Since this date the so-called household
maintenance cost subsidy (lakásfenntartási támogatás) is restricted
to heat only., i.e. various types of fuel use for heating are
supported..
Final
beneficiary
Households
Direct
beneficiary
Households
Variability In the first system (2003-2006) the natural gas cost subsidy was
differentiated between two users: (i) residential consumers and (ii)
consumers who generated heat for residential use. The subsidy then
was determined by the amount consumed (per m3). For instance, in
2005 subsidies were the followings: 52
Residential consumers
a) 0-1500 m3/year: HUF 16.25 (€ 0.065)
b) 1500-3000 m3/year: HUF 11.22 (€ 0.044)
Heat generated for residential use
a) < 20m3/h: HUF 13.29 (€ 0.053)
b) 20-100 m3/h: HUF 16.86 (€ 0.067)
c) 100-500 m3/h: HUF 14.65 (€ 0.058)
d) > 500 m3/h: HUF18.6 (€ 0.074)
52 Euro figures were calculated based on the 2005 average exchange rate (1€=248.05
HUF).

Enhancing comparability of data on estimated budgetary support and tax expenditures for fossil fuels
August 2014 121
District heating cost subsidy was determined on a monthly basis and
it was HUF 2000/month for retired people in 2005.
In 2007, the subsidy changed to a social based system and income
categories were introduced in order to determine the amount of the
support. The subsidy for natural gas was indicated in HUF/MJ and
HUF/m3 and for district heating in HUF/GJ.
Objectives Financial help. Since 2007, support is only given to low-income
households.
Conditionality
for eligibility
Until 2007 all household consumers were eligible for the subsidy.
Since 2007, only those households are eligible for the subsidy where
the monthly net income per one consumption unit does not exceed
the minimum pension multiplied by 3.5. This conditionality changed
at the end of 2011 but it is not detailed here as the reporting years
are 2005 and 2011.
Conditionality
for
magnitude of
subsidy
In the period of 2007-2011, four income categories were established
which were linked to different amounts of the subsidy. In addition,
natural gas consumption limits were also established. For instance in
2007 the maximum consumption of natural gas was determined at
102 000 MJ and 170 000 MJ for large families.
Source of
funding
The founding source of the subsidy is mainly the mining royalty that
is collected by the government. In cases where the collected amount
was not enough (and this was very common) the government had to
complement the amount.
Fuel First it was linked to natural gas, and then when district heating was
introduced other sources were included. Nevertheless, it should be
noted that in Hungary district heating makes an extensive use of
natural gas.
Total amount 2005: HUF 76 billion (€ 306 mln) (Energiaklub, 2009)
2011: HUF 20 billion (€ 81 mln) (only until September) (OECD,
2013)
Information
sources
OECD (2013) Inventory of Estimated Budgetary Support and Tax
Expenditures for Fossil Fuels
Energiaklub (2009) Ösztönzött pazarlás - Lakossági energiaárak
éllami témogatasa 2003-2009, URL:
http://energiaklub.hu/sites/default/files/energiaarak_allami_tamogat
asa_0906.pdf
Direct budgetary support to producers
Direct budgetary support to primary producers
Name of the
scheme and
Coal penny (szénfillér rendszer)
The scheme is a direct support system for coal production in

Enhancing comparability of data on estimated budgetary support and tax expenditures for fossil fuels
August 2014 122
short description Hungary and it is in operation since 2006. It consists of a levy
which is paid by the final electricity consumers and in 2011 it
changed to HUF 0.19 (€ 0.0006) per kWh from HUF 0.23 (€
0.0008) per kWh. The scheme subsidises the unprofitable last
active underground mine Márkushegy which provides lignite for
the Oroszlányi power plant. As the mine is expected to be closed
in 2014 it is expected that the Coal penny will be abolished after
this date.
Final beneficiary Márkushegy underground mine
Direct
beneficiary
Vértesi Erőmű Zrt (Vertesi Power Plant Ltd) – operator of the
mine and the Oroszlanyi power plant
Aid category Direct support
Variability The subsidy is in the form of a HUF 0.19 (€ 0.0006) levy to be
paid by the final consumers per kWh.
Objectives The objective of the support scheme is to support coal mining of
the unprofitable Markushegy mine which provides lignite for the
Oroszlanyi power plant.
Conditionality for
eligibility
Only the Márkushegy underground mine is eligible for the
support.
Conditionality for
magnitude of
subsidy
The subsidy is fixed at HUF 0.19 (€ 0.0006) per kWh.
Source of
funding
The support is paid by final consumers per kWh of coal
generated electricity.
Fuel Coal – lignite
Total amount 2005: HUF 11 billion (€ 44 mln) (OECD, 2013) (even though the
direct support system has been created in 2006 the Vertesi
Power Plant Ltd has been receiving support before this date too)
2011: HUF 7 billion (€ 25 mln) (OECD, 2013)
Information
sources
IEA/OECD (2007) Energy policies of IEA countries – Hungary,
2006 Review
IEA (2011) Energy policies of IEA countries – Hungary, 2011
Review
OECD (2013) Inventory of Estimated Budgetary Support and
Tax Expenditures for Fossil Fuels
NOL (2012) Ezermilliárd Vértesi-fillér URL:
http://nol.hu/gazdasag/20120815-ezermilliard_vertesi-filler-
1325581 [Accessed: 24/03/2014]
Hungarian Government (2011) A Kormány szénfillérből kívánja
támogatni a Vértesi Erőművet URL:
http://www.kormany.hu/hu/miniszterelnokseg/hirek/a-
kormany-szenfillerbol-kivanja-tamogatni-a-vertesi-eromuvet
[Accessed: 24/03/2014}

Enhancing comparability of data on estimated budgetary support and tax expenditures for fossil fuels
August 2014 123
Name of the
scheme and
short
description
N92/2005 State aid to the coal industry (2004-2010) and
NN3/2008 State Aid for coal industry (2007-2010) (Állami
támogatás N 92/2005 – Magyarország A magyar széniparra
vonatkozó szerkezetátalakítási terv 2004–2010 és NN 3 /
2008 (ex N 776/2007) sz. állami támogatás – Magyarország
A szénipar részére nyújtott állami támogatás (2007-2010))
In 2005, the European Commission authorised the State-aid to coal
production in the Márkushegy underground coal mine. The total
amount of the state aid was HUF 64.3 billion (€259 million)
between 2004 and 2010.
Final
beneficiary
Márkushegy Undeground coal mine53
Direct
beneficiary
Vértesi Erőmű Zrt. - Vertesi Power Plant Ltd.
Aid category Direct support
Objectives The support intends to cover the price difference between the coal
production costs of the Márkushegyi underground mine and the
selling price of coal purchased by the Oroszlányi power plant. A
decreasing yearly aid was applied which aimed to force the
company to adapt to changes, for instance increase its capacity to
co-fire biomass.
Conditionality
for eligibility
Only the Márkushegy underground mine is eligible for the support.
Conditionality
for
magnitude of
subsidy
The magnitude of the subsidy is determined by the amount of the
collected coal penny.
Source of
funding
The source of the support is the coal penny detailed above.
Fuel Coal
Total amount 2005: HUF 10,775 million (€43.4 million) (EC, 2008) (The state aid
was in total HUF 64.3 billion (€259 million) over the period of 2004-
53 The mine will be closed in 2014 for which the Commission has authorised a HUF
42,247 million (approximately €140 million) State Aid in 2013, the SA.33861 State
aid to facilitate the closure of uncompetitive coal mines. This state aid will be provided
until 2018.
(http://ec.europa.eu/competition/elojade/isef/case_details.cfm?proc_code=3_SA_338
61)

Enhancing comparability of data on estimated budgetary support and tax expenditures for fossil fuels
August 2014 124
2010. The support was degressive as it declined from HUF 12 billion
(€47 million)54 in 2004 to HUF 0.7 billion (2.5 million)55 in 2010.)
2011: n.a.
Information
sources
EC (n.d.) State Aid Registry - NN3/2008 Aid for coal industry
(2007-2010), URL:
http://ec.europa.eu/competition/elojade/isef/case_details.cfm?proc
_code=3_NN3_2008 [Accessed:24/03/2014]
EC (n.d.) State Aid Registry - N92/2005 State aid to the coal
industry URL:
http://ec.europa.eu/competition/elojade/isef/case_details.cfm?proc
_code=3_N92_2005 [Accessed:24/03/2014]
EC (2005) Állami támogatás N 92/2005 – Magyarország A magyar
széniparra vonatkozó szerkezetátalakítási terv 2004–2010,
Brüsszel, 22.6.2005 URL:
http://ec.europa.eu/competition/state_aid/cases/198451/198451_5
20560_19_2.pdf
EC (2008) NN 3 / 2008 (ex N 776/2007) sz. állami támogatás –
Magyarország A szénipar részére nyújtott állami támogatás (2007-
2010), Brüsszel, 29.9.2008 URL:
http://ec.europa.eu/competition/state_aid/cases/223801/223801_8
96791_28_2.pdf
IEA/OECD (2007) Energy policies of IEA countries – Hungary, 2006
Review
IEA (2011) Energy policies of IEA countries – Hungary, 2011
Review
Name of the
scheme and
short
description
Support for mine decommissioning
The Hungarian Government provides direct support for the
decommissioning of certain state-owned coal mines. For instance,
in 2003 the Lencsehegyi coal mine received a HUF 583 million (€2.3
million)56 support for its closure.
Final
beneficiary
Coal mines
Direct
beneficiary
Coal mines
Aid category Budgetary transfers
Variability It is assumed based on the above example of the support for the
Lencsehegyi coal mine that the mine decommissioning support is
given as a lump sum.
Objectives The objective of the budgetary transfers is to help in the closure of
54 Euro figures were calculated based on the 2004 average exchange rate (1€=251.68
HUF) 55 Euro figures were calculated based on the 2010 average exchange rate (1€=275.41
HUF) 56 Euro figures were calculated based on the 2003 average exchange rate (1€=253.51
HUF).
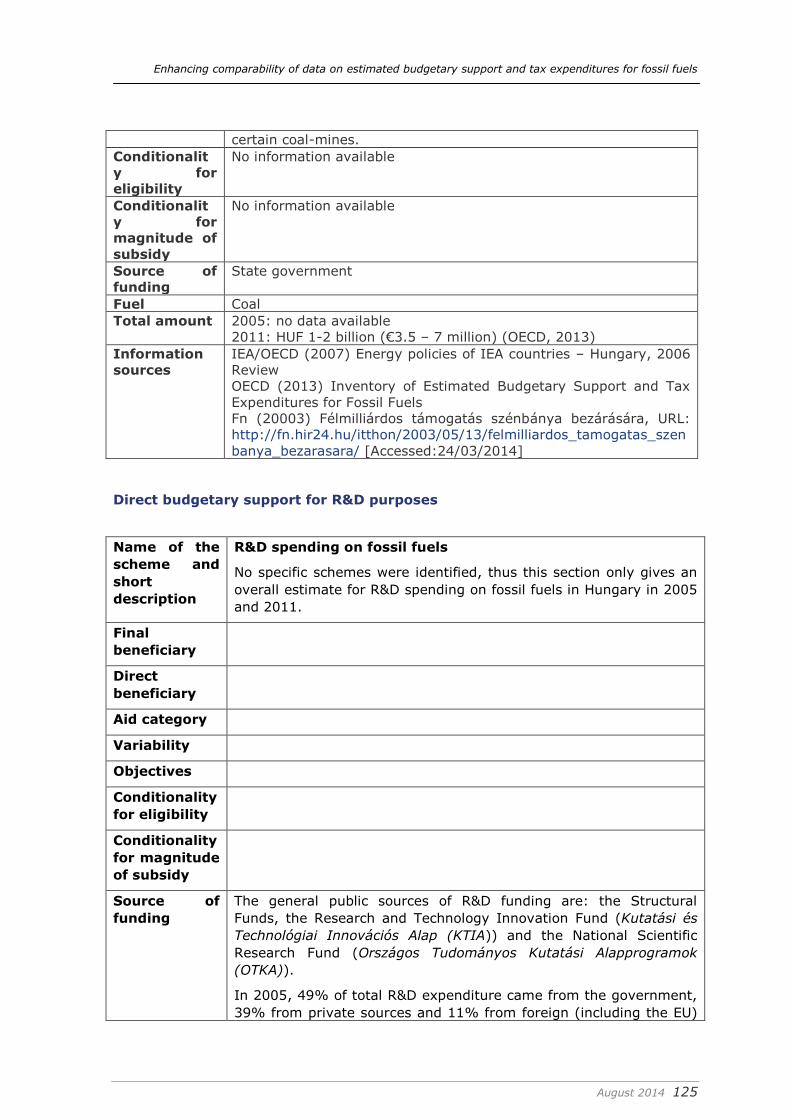
Enhancing comparability of data on estimated budgetary support and tax expenditures for fossil fuels
August 2014 125
certain coal-mines.
Conditionalit
y for
eligibility
No information available
Conditionalit
y for
magnitude of
subsidy
No information available
Source of
funding
State government
Fuel Coal
Total amount 2005: no data available
2011: HUF 1-2 billion (€3.5 – 7 million) (OECD, 2013)
Information
sources
IEA/OECD (2007) Energy policies of IEA countries – Hungary, 2006
Review
OECD (2013) Inventory of Estimated Budgetary Support and Tax
Expenditures for Fossil Fuels
Fn (20003) Félmilliárdos támogatás szénbánya bezárására, URL:
http://fn.hir24.hu/itthon/2003/05/13/felmilliardos_tamogatas_szen
banya_bezarasara/ [Accessed:24/03/2014]
Direct budgetary support for R&D purposes
Name of the
scheme and
short
description
R&D spending on fossil fuels
No specific schemes were identified, thus this section only gives an
overall estimate for R&D spending on fossil fuels in Hungary in 2005
and 2011.
Final
beneficiary
Direct
beneficiary
Aid category
Variability
Objectives
Conditionality
for eligibility
Conditionality
for magnitude
of subsidy
Source of
funding
The general public sources of R&D funding are: the Structural
Funds, the Research and Technology Innovation Fund (Kutatási és
Technológiai Innovációs Alap (KTIA)) and the National Scientific
Research Fund (Országos Tudományos Kutatási Alapprogramok
(OTKA)).
In 2005, 49% of total R&D expenditure came from the government,
39% from private sources and 11% from foreign (including the EU)

Enhancing comparability of data on estimated budgetary support and tax expenditures for fossil fuels
August 2014 126
sources. In 2011, these numbers were 39%, 47% and 13%,
respectively.
Fuel
Total amount Government R&D spending on fossil fuels (oil and gas and coal):
2005: EUR 0.45 million (IEA, 2014)
2011: EUR 0.612 million (IEA, 2014)
Information
sources
IEA (2011) Energy policies of IEA countries – Hungary, 2011 Review
IEA (2014) IEA Energy Technology RD&D Statistics, DOI:
10.1787/enetech-data-en [Accessed: 26/03/2014]
National Innovation Agency (2014) A kutatás, fejlesztés és innováció
(KFI) forrásai URL: http://www.nih.gov.hu/strategiaalkotas/kfi-
forrasai [Accessed:25/03/2014]
KSH (2013) Financial resources of research and development, URL:
http://www.ksh.hu/docs/hun/xstadat/xstadat_eves/i_ohk004a.html
[Accessed: 25/03/2014]
Public investments in energy infrastructure
N.a. The State Aid Register was checked and nothing was found for 2005 or 2011.
In 2007, state aid was granted to the Matrai Power Plant to set up a new unit for the
production of electricity based on domestically mined lignite (see:
http://ec.europa.eu/competition/state_aid/cases/218164/218164_724620_8_1.pdf)
but as 2007 is no a reporting year this is not indicated here.
Tax expenditures
Excises and other specific taxes on energy use
Name of the
tax scheme
and short
description
Excise tax on transport and heating fuels and energy tax on
natural gas, coal and coke and electricity
An excise tax is applied to gasoline, kerosene, gas oil / diesel, LPG
and heavy fuel oils (biofuels are also covered). Excise tax rates are
published every year by the National Tax and Customs
Administration of Hungary (Nemzeti Adó és Vámhivatal) and the
legal base of the excise duty is indicated in the CXXVII. Law of 2003
on excise duty and special excise rules for the marketing of products
(2003. évi CXXVII. Törvény a jövedéki adóról és a jövedéki
termékek forgalmazásának különös szabályairól). The national
legislation differentiates between the different uses of the fuels and
applies different rates.
An energy tax is applied to natural gas, coal and coke and
electricity. The energy tax was introduced after the EU accession in
2004 and first only applied to natural gas and electricity. Coal and
coke was exempted until the end of 2009 but since then a rate also

Enhancing comparability of data on estimated budgetary support and tax expenditures for fossil fuels
August 2014 127
applies to these sources. The legal base of the energy tax is in
LXXXVIII. Law of 2003 on energy tax (2003. évi LXXXVIII. Törvény
az energiaadóról).
Summary of
fuels and
use(r)s to
which reduced
rates or
exemptions
applied in the
reporting years
The following reduced rates are applied:
Excise duties levied on diesel used by rail are fully refunded.
Diesel used by domestic shipping is exempt.
Diesel used in the agriculture sector has a reduced tax rate
(around 80 per cent can get refunded).
Since 2011 part of the excise tax on diesel use for
commercial/professional purposes (lorries and buses) is
refunded.
Excise duties levied on aviation fuel used by domestic
airplanes are fully refunded.
There is a special tax exemption for diesel use by foreign
military staying in Hungary.
LPG used for heating purposes is exempt.
The residential use of natural gas (for heating purposes), coal
and coke and electricity is exempt.
Before 2009 no rates applied to coal and coke.
Amount
calculated
(benchmark:
highest excise
per unit of
energy
consumption)
total per unit of energy per unit of CO2
2005: € 4650
mln
2011: € 3602
mln
2005: € 6.68 / GJ
2011: € 6.20 / GJ
2005: € 95.62 / ton
2011: € 86.61 / ton
Amount
calculated
(benchmark:
highest excise
per unit of CO2
emissions)
total per unit of energy per unit of CO2
2005: € 4596
mln
2011: € 3525
mln
2005: € 6.60 / GJ
2011: € 6.07/ GJ
2005: € 94.51 / ton
2011: € 84.76 / ton
Amount
calculated
(benchmark:
proposal new
energy
taxation
directive)
total per unit of energy per unit of CO2
2005: € 616
mln
2011: € 262
mln
2005: € 0.88/ GJ
2011: € 0.45 / GJ
2005: € 12.67 / ton
2011: € 6.30 / ton
Information Sources of information – Excise tax rates

Enhancing comparability of data on estimated budgetary support and tax expenditures for fossil fuels
August 2014 128
sources National legislation:
CXXVII. Law of 2003 on excise duty and special excise rules
for the marketing of products (2003. évi CXXVII. Törvény a
jövedéki adóról és a jövedéki termékek forgalmazásának
különös szabályairól) URL:
http://net.jogtar.hu/jr/gen/hjegy_doc.cgi?docid=A0300127.T
V [Accessed: 11/03/2014]
LXXXVIII. Law of 2003 on energy tax (2003. évi LXXXVIII.
Törvény az energiaadóról) URL:
http://net.jogtar.hu/jr/gen/getdoc2.cgi?dbnum=1&docid=A0
300088.TV [Accessed: 11/03/2014]
341/2007. (December 15th) Government Regulation on terms
and conditions of excise tax rebate of diesel used in
agriculture (341/2007. (XII. 15.) Korm. Rendelet a
mezőgazdaságban felhasznált gázolaj utáni jövedékiadó-
visszatérítés feltételeiről és szabályairól) URL:
http://net.jogtar.hu/jr/gen/hjegy_doc.cgi?docid=A0700341.
KOR [Accessed: 11/03/2014]
National Tax and Customs Administration of Hungary (2013) Excise
Tax Codes by the National Tax and Customs Administration of
Hungary URL:
http://www.nav.gov.hu/nav/ado/jovedeki_ado/tajekoztatok_inform
aciok/fajtakodok_jogcimkodok/jovedeki_ado_fajtakodok.html
EC DG TAXUD (2005) Excise duty tables, Part II – Energy products
and electricity, Ref 1.020, January 2005
EC DG TAXUD (2011) Excise duty tables, Part II – Energy products
and electricity, Ref 1032, January 2011
Sources of information – Energy balances
IEA (2013) Energy statistics of OECD countries, 2013 Edition, ISBN
978-92-64-20298-6
IEA (2007) Energy statistics of OECD countries 2004-2005, 2007
Eidition
Sources of information - National conversion factors and emission
factors
KVV (2008) Klímapolitika: Az üvegházhatású gázok kibocsátás
csökkentésének energetikai vonatkozásai, URL:
http://klima.kvvm.hu/documents/14/NES_energetika.pdf
213/2006. (X. 27.) Korm. Rendelet az üvegházhatású gázok
kibocsátási egységeinek kereskedelméről szóló 2005. évi XV.
törvény végrehajtásának egyes szabályairól, URL:
http://klima.kvvm.hu/documents/41/213_2006_kr.pdf
[Accessed: 11/03/2014]
IEA (2013) Energy balances of OECD countries, 2013 Eiditon,
ISBN 978-92-64-20300-6
Belgian conversion factors from excel spreadsheet:

Enhancing comparability of data on estimated budgetary support and tax expenditures for fossil fuels
August 2014 129
tax_exp_Bel_2009
Assumptions made in the calculations
Belgian conversion factors were used for gasoline, diesel, LPG,
kerosene and electricity. (National conversion factors could
not be found for electricity and kerosene. In addition,
Hungarian conversion factors for heavy fuel oil, gasoline,
diesel and LPG were identical with the provided Belgian
ones.)
For coal and coke products Hungarian conversion factors were
used.
No emission factors could be found for sub-bitumen coal
products thus the emission factor for bitumen coal products
were used.
In 2011, there were different tax rates for gas oil used on
roads and used for commercial purposes (lorries and buses)
nevertheless no energy statistics could be accessed on the
share of these uses. It was therefore assumed that the share
is 50-50 per cent.
Different excise tax rates exist for LPG used on roads and for
LPG used for other motoric use. As no energy statistics could
be found on the share of these two uses it was assumed that
the share is 50 - 50 per cent.
Final consumption of gas oil by the agriculture sector in the
energy statistics is not differentiated between use for heating
purposes and transport purposes. It was assumed that all
final consumption was linked to heating purposes.
In Hungary three different excise tax rates apply to heavy oil
fuels based on their sulphur content and quality. In 2013,
OECD estimated that the low sulphur content heavy fuel oil is
more widely used (80 per cent of the heavy fuel oil
consumption). It was therefore assumed that 80 per cent of
consumption is for low sulphur content heavy fuel oils, 20
per cent for high sulphur content heavy fuel oils and there is
no consumption of the low quality heavy fuel oil which has
the highest excise tax rate.
Even though separate excise tax rates apply to leaded and
unleaded gasoline as leaded gasoline has been phased out
from Hungary since 2002 leaded gasoline was excluded from
the scope of the calculations.

Enhancing comparability of data on estimated budgetary support and tax expenditures for fossil fuels
August 2014 130
Value Added Tax
Categories of energy
supply to which a
reduced VAT rate
was applied in one or
both of the reporting
years
In 2011, a reduced VAT rate of 5 per cent was applied for
district heating. 57 For all other energy sources the standard
VAT was applied.
In 2005, for coal and coke use a reduced VAT rate of 15 per
cent was applied. In addition, the use of natural gas and LPG
for heating purposes also had a reduced VAT rate of 15 per
cent.
Standard rate 2005: 25%
2011: 25%
Reduced rate 2005: 15% for coal and coke and LPG and natural gas for
heating purposes
2011: 5% for district heating
Amount of support
calculated
(refer to Excel file)
total per unit of
energy
per unit of CO2
2005: € 92.16 mln
2011: € 0 mln
2005: € 0.23 /
GJ
2011: € 0 / GJ
2005: € 3.44 / ton
2011: € 0 / ton
Information sources Sources of information – VAT
National legislation
CXXVII. Law of 2007 on VAT (2007. évi CXXVII.
Törvény az általános forgalmi adóról) URL:
http://net.jogtar.hu/jr/gen/hjegy_doc.cgi?docid=A070
0127.TV [Accessed: 11/03/2014]
LXXIV. Law of 1992 on VAT (1992. évi LXXIV. Törvény
az általános forgalmi adóról) URL:
http://www.bfvk.hu/old/downloads/1992_LXXIV.pdf
[Accessed: 11/03/2014]
EC (2014) VAT Rates Applied in the Member States of the
European Union, Situation as of 13 January 2014, URL:
http://ec.europa.eu/taxation_customs/resources/documents/
taxation/vat/how_vat_works/rates/vat_rates_en.pdf
Sources of information – Energy prices
Central Statistical Office (KSH) (2014) Annual average prices
of some consumer goods and services (1996 -) (Egyes
termékek és szolgáltatások éves fogyasztói átlagára (1996–))
URL:
http://www.ksh.hu/docs/hun/xstadat/xstadat_eves/i_qsf003
57 District heating is not part of the calculations. The OECD ‘Inventory of Estimated
Budgetary Support and Tax Expenditures for Fossil Fuels’ indicates that under this reduced VAT rate in 2011 2 billion HUF (€ 7.1 mln) support was provided for coal, 5
billion HUF (€ 17.9 mln) for petroleum and 22 billion HUF (€ 78 mln) for natural gas. Please
note that the numbers for 2011 are provisional figures.

Enhancing comparability of data on estimated budgetary support and tax expenditures for fossil fuels
August 2014 131
a.html?1170 [Accessed: 12/03/2014]
National Tax and Customs Administration of Hungary (2013)
Fuel prices URL:
http://www.nav.gov.hu/nav/szolgaltatasok/uzemanyag
Eurostat (2014) Energy statistics – gas and electricity prices
URL:
http://epp.eurostat.ec.europa.eu/portal/page/portal/energy/
data/database [Accessed: 11/03/2014]
Sources of information – Energy balances
IEA (2013) Energy statistics of OECD countries, 2013 Edition,
ISBN 978-92-64-20298-6
IEA (2007) Energy statistics of OECD countries 2004-2005,
2007 Edition
Sources of information - National conversion factors and
emission factors
KVV (2008) Klímapolitika: Az üvegházhatású gázok
kibocsátás csökkentésének energetikai vonatkozásai,
URL:
http://klima.kvvm.hu/documents/14/NES_energetika.
213/2006. (X. 27.) Korm. Rendelet az üvegházhatású
gázok kibocsátási egységeinek kereskedelméről szóló
2005. évi XV. törvény végrehajtásának egyes
szabályairól, URL:
http://klima.kvvm.hu/documents/41/213_2006_kr.pd
f [Accessed: 11/03/2014]
IEA (2013) Energy balances of OECD countries, 2013
Edition, ISBN 978-92-64-20300-6
Belgian conversion factors from excel spreadsheet:
tax_exp_Bel_2009
Assumption made in the calculations
In addition to all of the above indicated assumptions the
following assumptions were also made in calculations in
relation to VAT:
No separate prices could be found for the different
types of coal and coke thus it was assumed that the
price indicated in the national statistics for briquette
applies for all types of coal and coke.
As no prices could be found for residential use of gas oil
for heating purposes and the consumption was very
low or zero this energy source was excluded from the
calculations.
The price of LPG for road use cannot be found for 2005
thus 2007 prices were used.

Enhancing comparability of data on estimated budgetary support and tax expenditures for fossil fuels
August 2014 132
Prices for natural gas used on roads was only found for
2011 thus based on the price changes of other fuels
between 2005 and 2011 it was assumed that the price
of natural gas in 2005 was 65 per cent of the price in
2011.
Tax expenditures in social contributions and personal income taxes
N.a.
Tax expenditures in corporate income taxes
N.a.
The standard rate of corporate income tax for Hungarian and foreign companies is
19%. However, for the first HUF 500 million (€ 1.7 mln) of taxable income, the tax
rate is 10%. Tax incentives include a research and development tax credit, tax credits
related to funding film making and performance arts, tax credits for small and medium
businesses and a sport sponsorship tax credit.58
In 2009, an additional Robin Hood tax was introduced at 8 per cent on pre-tax
profits on energy suppliers (among others on electricity and gas providers).59 This rate
was increased to 31 per cent in 2013.60
Tax expenditures in royalties
The XLVIII. Law of 1993 on mining61 covers the activities linked to the
mining of mineral resources.
According to the mining law a 12 per cent royalty (bányajéradék) is charged
on the value derived from the extraction of mineral oil and natural gas. This
rate was increased to 16 per cent in 2013.
The royalty is 12 per cent if the amount of the extracted natural gas is 300
million m3 per annum or the amount of the extracted oil is no more than 50 kt
per annum. If the amount of the extracted natural gas is between 300 and 500
million m3 per annum or for oil is between 50 kt and 200 kt the royalty is 20%.
If the extracted amounts exceed these limits the royalty is 30%.
The royalty is 8 per cent if the natural gas with a high inert gas content.
58 LXXXI. Law of 1996 on corporate tax and tax dividend (1996. évi LXXXI. Törvény a
társasági adóról és az osztalékadóról) URL:
http://net.jogtar.hu/jr/gen/hjegy_doc.cgi?docid=99600081.TV [Accessed:
25/03/2014] 59 LXVII. Law of 2008 on imporving the competitiveness of the district heating sector
(2008. évi LXVII. Törvény a távhőszolgáltatás versenyképesebbé tételérő) URL:
http://net.jogtar.hu/jr/gen/hjegy_doc.cgi?docid=A0800067.TV [Accessed:
25/03/2014] 60 Hungarian Government (2012) Hungary’s new tax system (2013 – A megújuló
Magyarország adórendszere – Adóváltozások összefoglaló) URL:
http://www.kormany.hu/download/e/bc/b0000/2013%20Ad%C3%B3v%C3%A1ltoz%
C3%A1sok%2012%2011%2027.pdf [Accessed: 08/04/2014] 61 XLVIII. Law of 1993 on mining (1993. évi XLVIII. Törvény a bányászatról) URL:
http://net.jogtar.hu/jr/gen/hjegy_doc.cgi?docid=99300048.TV [Accessed:
25/03/2014]

Enhancing comparability of data on estimated budgetary support and tax expenditures for fossil fuels
August 2014 133
The royalty is 0 per cent for solid mineral which are mined in
underground mines and for other solid minerals it is 2 per cent.
The royalty covers: natural gas, oil, coal, lignite, geothermic energy, carbon di-
oxide, minerals, peat, clay, sand, gravel and stones.
In 2005, HUF 24 million (€ 0.09 mln) royalty was declared and HUF 16 000
reduction was authorised by the government.62 In 2011, HUF 112 million (€
0.4 mln) royalty was declared and HUF 43 681 (€ 156) reduction was
authorised by the government.63
No royalty should be paid for oil and natural gas extracted via environmentally
friendly methods with an enhanced efficiency.
The standard rate of corporate income tax applied to mining activities is
19%. However, in Hungary for the first HUF 500 million (€ 1.7 mln) of taxable
income, the tax rate is 10%.64
62 MBH (2006) Tájékoztató bányajáradék bevallásról, befizetésről, 2005. Év, URL:
http://www.mbfh.hu/gcpdocs/201004/banyajaradek_2005.pdf 63
63 MBH (2012) Tájékoztató bányajáradék bevallásról, befizetésről, 2011. Év, URL:
http://www.mbfh.hu/gcpdocs/201306/2011.pdf 64 LXXXI. Law of 1996 on corporate tax and tax dividend (1996. évi LXXXI. Törvény a
társasági adóról és az osztalékadóról) URL:
http://net.jogtar.hu/jr/gen/hjegy_doc.cgi?docid=99600081.TV [Accessed:
25/03/2014]

Enhancing comparability of data on estimated budgetary support and tax expenditures for fossil fuels
August 2014 134
Ireland
Reporting years:2002 and 2011
Direct budgetary support to consumers/users
Name of the
scheme and
short
description
Fuel Allowance Electricity
Allowance
Gas Allowance
Final beneficiary Households
dependent on long-
term social welfare
and unable to
provide for own
heating needs
Households receiving
social welfare
payments and meeting
certain criteria
Households receiving
social welfare payments
and meeting certain
criteria
Direct
beneficiary
Households
receiving social
welfare payments
Utility company (if
household is an
Electric Ireland
customer) or paid
directly to eligible
households each
month through a
selected financial
institution or the Post
Office
Gas provider or paid
directly to eligible
households each month
through a selected
financial institution or the
Post Office
Variability Fuel Allowance is a
fixed amount paid
weekly from
October – April
each year (for 26
weeks) integrated
with existing social
welfare payments
In 2011, the
standard fuel
allowance was €20
per week in 2002 it
was €9 per week.
Fixed cash credit paid
each month either
automatically applied
to household’s bill (if
Electric Ireland
customer) or as a cash
payment to be used
with other suppliers.
In 2011, the electricity
allowance for a group
account was €43.80
per month while in
2003 it was €22.50
per month.
Depending on supplier,
paid as a fixed cash
credit on gas bill or as a
cash payment to an
account in a financial
institution or a post
office.
In 2011, the natural gas
allowance provided a
credit of up to €111.00 in
each two-monthly billing
period in the winter and a
credit of up to €52.00 in
each two-monthly billing
period in the summer.
The bottled gas refill
allowance was €40.70
per month. In 2003, the
natural gas allowance
covered the supply
charge of €27.93 plus up
to €11.11 of free natural
gas in each two-monthly

Enhancing comparability of data on estimated budgetary support and tax expenditures for fossil fuels
August 2014 135
billing period in winter
and up to €1.29 in each
two-monthly billing
period in summer. The
Bottled Gas Refill
Allowance provided five
cylinders every four
months.
Objectives To provide a
contribution to the
heating needs of
qualified low income
households.
Provided as part of the
Household Benefits
Package which
contribute to the costs
of running a household
Provided as part of the
Household Benefits
Package which contribute
to the costs of running a
household
Conditionality
for eligibility
Means-tested
payment linked to
the maximum rate
of the State Pension
(Contributory)
Dependent on age,
receipt of qualifying
allowances,
permanently living at
address at which
allowances are
applied, registered
consumer of electricity
etc. If aged between
66 and 70 and not
receiving a qualifying
payment, a means test
must be satisfied
linked to appropriate
weekly means limit
based on maximum
rate of State Pension
(Contributory).
If the applicant has an
electricity slot meter
or if the registered
consumer of electricity
at their address is the
landlord, they may
qualify for a Cash
Electricity Allowance of
€35 (2014).
Dependent on age,
receipt of qualifying
allowances, permanently
living at the address at
which allowances are
applied, registered
consumer of gas etc. If
aged between 66 and 70
and not receiving a
qualifying payment, a
means test must be
satisfied linked to
appropriate weekly
means limit based on
maximum rate of State
Pension (Contributory).
If the applicant's home is
not connected to an
electricity or natural gas
supply but otherwise
satisfy conditions, they
may qualify for a Cash
Gas Allowance of €35
(2014).
Conditionality
for magnitude
of subsidy
Fixed amount, does
not take into
consideration
heating
requirements or
energy efficiency of
dwelling
Fixed allowance per
month
Fixed allowance per
month
Source of
funding
General
government budget
General government
budget - Department
General government
budget - Department of

Enhancing comparability of data on estimated budgetary support and tax expenditures for fossil fuels
August 2014 136
- Department of
Social Protection
(formerly known as
Department of
Social and Family
Affairs)
of Social Protection
(formerly known as
Department of Social
and Family Affairs)
Social Protection
(formerly known as
Department of Social and
Family Affairs)
Fuel Not specified
Not specified Not specified
Total amount 2002: €47.2m
2011: €177.9m
2002: €25.3m
2011: €71.0m
2002: €871,000
2011: €5.3m
Information
sources
Citizen’s
Information Board,
Fuel Allowance,
http://www.citizensi
nformation.ie/en/so
cial_welfare/social_
welfare_payments/
extra_social_welfar
e_benefits/fuel_allo
wance.html
[accessed
18/3/2014]
Sustainable Energy
Ireland (2003) A
Review of Fuel
Poverty and Low
Income Housing,
http://www.seai.ie/
Grants/Warmer_Ho
mes_Scheme/Fuel_
Poverty_Report.pdf
[accessed
18/3/2014]
Department of
Public Expenditure
and Reform,
Estimates of public
expenditure, 2012
revised estimates
for public services,
http://www.per.gov
.ie/estpubexp2012/
[accessed
26/3/2014]
Department of
Public Expenditure
and Reform,
Revised estimates
of public
expenditures, Vol.
Department of Public
Expenditure and
Reform, Estimates of
public expenditure,
2012 revised
estimates for public
services,
http://www.per.gov.ie
/estpubexp2012/
[accessed 26/3/2014]
Sustainable Energy
Ireland (2003) A
Review of Fuel Poverty
and Low Income
Housing,
http://www.seai.ie/Gr
ants/Warmer_Homes_
Scheme/Fuel_Poverty_
Report.pdf [accessed
18/3/2014]
Department of Social
Protection, Household
Benefits Package,
https://www.welfare.ie
/en/Pages/Household-
Benefits-
Package.aspx#admin
[accessed 18/3/2014]
Department of Public
Expenditure and
Reform, Revised
estimates of public
expenditures, Vol.
2003, Part 5
http://www.per.gov.ie
/estpubexp2003/
[accessed 26/3/2014]
Department of Social
Citizen’s Information
Board, Households
Benefits Package,
http://www.citizensinfor
mation.ie/en/social_welfa
re/social_welfare_payme
nts/extra_social_welfare_
benefits/household_benef
its_package.html
[accessed 18/3/2014]
Department of Public
Expenditure and Reform,
Estimates of public
expenditure, 2012
revised estimates for
public services,
http://www.per.gov.ie/es
tpubexp2012/ [accessed
26/3/2014]
Sustainable Energy
Ireland (2003) A Review
of Fuel Poverty and Low
Income Housing,
http://www.seai.ie/Grant
s/Warmer_Homes_Sche
me/Fuel_Poverty_Report.
pdf [accessed 18/3/2014]
Department of Social
Protection, Household
Benefits Package,
https://www.welfare.ie/e
n/Pages/Household-
Benefits-
Package.aspx#admin
[accessed 18/3/2014]
Department of Public
Expenditure and Reform,
Revised estimates of
public expenditures, Vol.

Enhancing comparability of data on estimated budgetary support and tax expenditures for fossil fuels
August 2014 137
2003, Part 5
http://www.per.gov
.ie/estpubexp2003/
[accessed
26/3/2014]
Department of
Social Protection,
Fuel Allowance
Scheme,
https://www.welfar
e.ie/en/Pages/820_
National-Fuel-
Scheme.aspx
[accessed
18/3/2014]
Department of
Social Protection,
Rates of payment
2011,
https://www.welfar
e.ie/en/downloads/s
w19_jan_jun_2011.
pdf [accessed
26/3/2014]
Protection,
Rates of payment
2011,
https://www.welfare.ie
/en/downloads/sw19_j
an_jun_2011.pdf
[accessed 26/3/2014]
Department of Social
and Family Affairs,
Rates of payment
2003
https://www.welfare.ie
/en/downloads/sw19_
03.pdf [accessed
26/3/2014]
2003, Part 5
http://www.per.gov.ie/es
tpubexp2003/ [accessed
26/3/2014]
Department of Social
Protection,
Rates of payment 2011,
https://www.welfare.ie/e
n/downloads/sw19_jan_j
un_2011.pdf [accessed
26/3/2014]
Department of Social and
Family Affairs, Rates of
payment 2003
https://www.welfare.ie/e
n/downloads/sw19_03.pd
f [accessed 26/3/2014]
Direct budgetary support to producers
Direct budgetary support to primary producers
Name of the scheme
and short
description
Public Service Obligation (PSO) levy65
Final beneficiary Certain peat-fired gas (and renewable generation) power plants.
All three remaining new-build peat-fired electricity generation in
Ireland fall under the PSO.
Direct beneficiary Electricity Supply Board (ESB)
Aid category Price support / induced transfer (included as direct grant on EC
state aid registry)
Variability Value of the PSO is set on an annual basis by the Commission
for Energy Regulation (CER) corresponding to the additional
costs in sourcing, and producing a proportion of electricity from
such generators. This value can vary significantly from year to
year, notably depending on fuel prices. For example, between
2007-2010, the levy was zero as market conditions were such
that electricity generation from peat was competitive with gas-
fired power plants without support.
65 To check with study team whether this falls within the scope of our study

Enhancing comparability of data on estimated budgetary support and tax expenditures for fossil fuels
August 2014 138
Support to peat fired power plants is expected to cease by 2020
– the mechanism has been approved by the European
Commission until 2019.
Objectives The PSO levy is designed to offset the charges incurred by the
Electricity Supply Board (ESB) for its obligation to have a certain
quantity of electricity generated out of peat as mandated by
Government and approved by the European Commission.
The underlying policy objectives are of the levy relate to security
of energy supply, use of indigenous fuels (i.e. peat) and
promotion of renewable energy in electricity generation.
Conditionality for
eligibility
Electricity generated from peat, certain gas (and renewable)
power plants.
Conditionality for
magnitude of
subsidy
The PSO levy is determined each year based on estimates of
costs to be recovered by all relevant parties, relative to the PSO
benchmark price (determined, inter alia, using forecasts of fuel
and carbon prices). This amount is usually corrected
retrospectively (‘R-factor’) two PSO periods later, once actual
costs are verified and the true market price and generation
levels are known.
Source of funding The levy is paid by final electricity consumers (domestic
customers, small commercial customers, medium and large
customers) which pay a differentiated levy amount each month.
The levy is displayed as a separate item on consumers’
electricity bills.
The transmission system operator (TSO) and distribution system
operator (DSO) collect the levy from suppliers (who in turn are
responsible for collecting the levy from their customers). The
TSO is responsible for ensuring that payments are distributed
correctly.
Fuel Peat (also covers certain gas and renewables)
Total amount 2005: €62m
2011: €92.12m
Note: PSO periods run from 1 October to 30 September of the
following year. Thus, data reported for 2011 covers the period
from 1 October 2011 to 30 September 2012.
Information sources OECD (2013) Inventory of estimated budgetary support and tax
expenditures for fossil fuels 2013
Commission for Energy Regulation (2011) Public Service
Obligation levy 2011/2012,
http://www.cer.ie/docs/000077/cer11130.pdf [accessed
18/3/2014]
IEA (2013) Energy policies of IEA countries – Ireland 2012
Review,
http://www.iea.org/publications/freepublications/publication/IRE

Enhancing comparability of data on estimated budgetary support and tax expenditures for fossil fuels
August 2014 139
LAND2012_free.pdf [accessed 18/3/2014]
EC (2001) State aid n° N 6/A/2001 – Ireland Public Service
Obligations imposed on the Electricity Supply Board with
respect to the generation of electricity out of peat,
http://ec.europa.eu/competition/state_aid/cases/134269/13426
9_423080_39_2.pdf
Direct budgetary support for R&D purposes
Name of the scheme and
short description
Energy research programmes :
Specific programmes targeted at RD&D for fossil fuels could
not be identified. Thus this section provides some overall
estimates for R&D spending on fossil fuels in Ireland.
Final beneficiary
Direct beneficiary Universities (primary beneficiaries of fossil fuel research
projects listed in SEAI inventory)
Aid category Grants for research and development
Variability
Objectives
Conditionality for eligibility
Conditionality for magnitude
of subsidy
Source of funding
Fuel
Total amount According to the IEA database, the Irish government spent
the following amount on R&D for fossil fuels (which includes
oil & gas, coal and CCS):
2003: € 0.288m
2011: € 0.068
The inventory of energy RD&D compiled by Sustainable
Energy Ireland provides the following estimates:
2004: € 39,425 (fossil fuels)
2005: € 41,547 (other oil and gas)
2011: € 68,126 (other oil and gas)
More detailed break-downs of this expenditure could not be
identified.
Information sources Department of Public Expenditure and Reform, Estimates of
public expenditure, 2012 revised estimates for public
services, http://www.per.gov.ie/estpubexp2012/ [accessed
26/3/2014]
IEA (2013), "RD&D Budget", IEA Energy Technology RD&D
Statistics (database), doi: 10.1787/data-00488-en
(Accessed on 26 March 2014)
Sustainable Energy Ireland, Energy Research, Development
and Demonstration in Ireland, 2007 and 2008 inventories
report,
http://www.seai.ie/Publications/Energy_Policy_Publications/E
nergy_Research_Development_and_Demonstration/RDD_Inve

Enhancing comparability of data on estimated budgetary support and tax expenditures for fossil fuels
August 2014 140
ntory_2007_and_2008.30012.shortcut.pdf [accessed
3/4/2014]
Sustainable Energy Ireland, Energy Research,
Development and Demonstration in Ireland, Inventory,
http://inventory.sei.ie/analysis/iea?year=2011&show
SubClassifications=on [accessed 3/4/2014]
Sustainable Energy Ireland, Energy RD&D Inventory,
http://www.seai.ie/Publications/Energy_Policy_Publications/E
nergy_Research_Development_and_Demonstration/Energy-
RD_D-Inventory-2004.3965.shortcut.pdf [accessed 3/4/2014]
Public investments in energy infrastructure
Not applicable (no relevant cases could be identified in EC state aid registry)
Tax expenditures
Excises and other specific taxes on energy use
Name of the tax
scheme and
short
description
Mineral Oil Tax (MOT) is charged on all mineral oils produced or
imported to Ireland. The tax applies to hydrocarbon oil (light and
heavy), liquefied petroleum gas (LPG), substitute fuel, additives
and from July 2005 to coal.
Carbon tax has been applied to transport fuels (petrol and auto-
diesel) from December 2009, to non-transport fuels (kerosene,
marked gas oil, LPG, natural gas) from May 2010 and to solid fuels
(coal, lignite, peat) from May 2013.
Electricity tax has been applied on supplies of electricity since
October 2008.
Summary of
fuels and
use(r)s to which
reduced rates or
exemptions
applied in the
reporting years
In 2002, coal and natural gas were not subject to the MOT; there
was no electricity tax in place.
Exemptions/reductions from the MOT apply for:
- Heavy oil, diesel oil or LPG used for horticulture and
cultivation of mushrooms
- Heavy oil used for passenger road service vehicles
- Fuel oil used in relation to manufacture of alumina
- Mineral oil used to reduce chemicals in blast furnaces as an
addition to coke used as the principal fuel;
- Mineral oil used for navigation, other than in private pleasure
craft;
- Heavy oil used for aviation, other than private pleasure
flying;
- Diesel used for private pleasure navigation was subject to a
reduced rate until 31 October 2008 after which the same
MOT rate which applies to auto diesel has been applied.
- Jet kerosene for private pleasure flying was exempted from
the tax, and a reduced rate was allowed for aviation

Enhancing comparability of data on estimated budgetary support and tax expenditures for fossil fuels
August 2014 141
gasoline used for such flying up until 31 October 2008 after
which these fuels have been taxed at the same rates as
auto diesel and petrol respectively.
- Diesel used in railways
- Diesel used as motor fuel for agricultural purposes
The MOT was extended to users of coal from July 2005 with
exemptions for the following users of coal:
- Households,
- Generation of electricity,
- Combined heat and power generation,
- Agricultural, horticultural or pesciculture works, and in
forestry,
- Mineralogical processes,
- Dual use,
- Use by a charitable organisation,
- Fuel for trains,
- Use in energy intensive business which holds a GHG
emission permit.
In addition, from 2007, a variable National Oil Reserves Agency
(NORA) levy is applied on oil companies and oil consumers for
disposals of petroleum products to support achievement of
Ireland's oil stocks obligations. The levy was 0.476 cent per litre to
1.00 cent per litre with effect from 1st November 2007, and 2.00
cent per litre with effect from 1st October 2009. The levy applies
to motor spirits; gas oil, diesel oil and kerosene (excluding jet fuel
of the kerosene type) and fuel oils.
Note that from July 2013, a proportion of the MOT paid on auto-
diesel used in qualifying motor vehicles (bus/coach operators and
road haulage operators) will be repaid. The amount of the
repayment varies according to the average price at which auto-
diesel is available for purchase during a repayment period. In 2002
a reduced rate was applied for diesel used in scheduled passenger
road transport services.
Exemptions/reductions from the carbon tax include:
- Full relief for gas and solid fuel supplied for use in generation
of electricity
- Partial relief for gas used in installations with a GHG
emissions permit.
- Full relief for biofuels and the biofuel content of blended
fuels.
- Partial relief for certain high efficiency CHP with a capacity of
50 kW.
- Relief for farm diesel
- Coal and peat exempted until 2013
- Full relief for natural gas used in chemical reduction,
electrolytic or metallurgical processes
Since 2008, the electricity tax is applied to business use and
non-business use (except domestic use which are not subject to
the tax). Reliefs are also provided for electricity:
- generated from renewable sources,

Enhancing comparability of data on estimated budgetary support and tax expenditures for fossil fuels
August 2014 142
- produced from environmentally friendly heat and power
cogeneration,
- used for chemical reduction or in electrolytic or metallurgical
processes,
- used for combined heat and power generation,
- used for, or in connection with, the production of electricity,
- produced on board a craft.
-
Furthermore, as in almost all other EU Member States, the
excise duty applied on diesel in Ireland is lower than the duty
applied on petrol. In 2002 the excise duty applied on unleaded
petrol was EUR 401.36/1000l while the average excise duty
applied on diesel was EUR 328.14/1000l (average of duty
applied on diesel as a propellant with sulphur content >50
mg/kg and with sulphur content <=50 mg/kg). In 2011 the
excise duty applied on petrol was EUR 576.22/1000l while the
excise duty applied on diesel was EUR 465.7/1000l.
Amount
calculated
(benchmark:
highest excise
per unit of
energy
consumption)
total per unit of energy per unit of CO2
2002: € 1093
mln
2011: € 1307
mln
2002: € 2.25 / GJ
2011: € 2.91/ GJ
2002: €27.43 / ton
2011: € 34.69 / ton
Amount
calculated
(benchmark:
highest excise
per unit of CO2
emissions)
Total per unit of energy per unit of CO2
2002: € 1093
mln
2011: € 1307
mln
2002: € 2.25 / GJ
2011: € 2.91 / GJ
2002: € 27.43 / ton
2011: € 34.69 / ton
Amount
calculated
(benchmark:
proposal new
energy taxation
directive)
Total per unit of energy per unit of CO2
2002: € 332 mln
2011: € 107 mln
2002: € 0.68 / GJ
2011: € 0.24 / GJ
2002: € 8.33 / ton
2011: € 2.85 / ton
Information
sources
DG TAXUD (2011) Excise Duty Tables, Part II – Energy products
and Electricity, REF 1033, July 2011
EC (2011) Proposed minimum tax rates under revised Energy Tax
Directive,
http://ec.europa.eu/taxation_customs/resources/documents/taxati
on/minima_explained_en.pdf [accessed 24/3/2014]
Gargan, E., (2012) Reflections on the implementation of the
carbon tax in Ireland, Presentation to the UCD/ NESC Workshop:
Climate Change Meeting Ireland’s 2020 Obligations – 16 May
2012, Department of Finance, Ireland,
http://www.nesc.ie/assets/files/downloads/project_climate per

Enhancing comparability of data on estimated budgetary support and tax expenditures for fossil fuels
August 2014 143
cent20change/ucd_workshop/ericgargan.pdf [accessed 6/3/2013]
IEA (2013) Energy statistics of OECD countries, 2013 edition
Irish Tax and Customs (2013) Excise Duty – Guide to Electricity
Tax - Leaflets & Guides, Update from December 2013
Irish Tax and Customs, Excise leaflets - Mineral Oil Tax on Coal –
Public Notice 889,
http://www.revenue.ie/en/tax/excise/leaflets/pn1889.html
[accessed 3/4/2014]
Irish Tax and Customs, Excise leaflets - Guide to Natural Gas
Carbon Tax,
http://www.revenue.ie/en/tax/excise/leaflets/pn1889.html
[accessed 3/4/2014]
Irish Tax and Customs, Excise leaflets – Guide to Electricity Tax,
http://www.revenue.ie/en/tax/excise/leaflets/pn1889.html
[accessed 3/4/2014]
Irish Tax and Customs, Excise leaflets – Payment of Mineral Oil Tax
on Heavy Oil (Diesel) used for Private Pleasure Navigation,
http://www.revenue.ie/en/tax/excise/leaflets/pn1889.html
[accessed 3/4/2014]
Irish Tax and Customs, Excise leaflets – Rates of Mineral Oil Tax
for aviation fuels for Business Use, and for Private Pleasure
Flying, http://www.revenue.ie/en/tax/excise/leaflets/pn1889.html
[accessed 3/4/2014]
accessed 3/4/2014]
Irish Tax and Customs, Diesel Rebate Scheme,
http://www.revenue.ie/en/tax/excise/diesel-rebate-
scheme/index.html [accessed 26/5/2014]
Irish Statute Book, Finance Act 1999,
http://www.irishstatutebook.ie/1999/en/act/pub/0002/sec0094.ht
ml#sec94 [accessed 3/4/2014]
Irish Statute Book, Mineral Oil Tax Regulations, 2001, S.I. No.
442/2001, http://www.irishstatutebook.ie/2001/en/si/0442.html
Joyce, D., Convery, F., Dunne, L., (2012) Ireland’s carbon tax:
Equity and regressivity impacts, Presentation at Green Budget
Europe + the Institute Sustainable Development and International
Relations (IDDRI) Conference: Green taxation as a key for
sustainable fiscal reform, PARIS 29-30 October, 2012,
http://www.foes.de/pdf/20121107_GBE_IDDRI_Paris_3_Joyce.pdf
[accessed 17/4/2013]
NESC Secretariat (2012) Towards a New National Climate Policy:
Interim Report of the NESC Secretariat to the Department of
Environment, Community and Local Government, June 2012,

Enhancing comparability of data on estimated budgetary support and tax expenditures for fossil fuels
August 2014 144
http://www.environ.ie/en/Publications/Environment/ClimateChang
e/FileDownLoad,31202,en.pdf [accessed 10/4/2013]
Revenue Commissioners (2013) Statistical Report 2012 - Excise,
http://www.revenue.ie/en/about/publications/statistical/2012/inde
x.html [accessed 18/3/2014]
Sustainable Energy Authority of Ireland (SEAI) 1990-2011 Energy
Balances
http://www.seai.ie/Publications/Statistics_Publications/Energy_Bal
ance/Previous_Energy_Balances/ [accessed 17/3/2014]
Please see excel spreadsheet for further details
Value Added Tax
Categories of
energy supply
to which a
reduced VAT
rate was
applied in one
or both of the
reporting years
Standard VAT rate applies to:
Petrol
Road diesel (unmarked)
Industrial methylated spirits
Other gas oils
LPG motor gas
Reduced VAT rate applies to:
Coal, peat and other solid substances offered for sale solely as
fuel
Supply of electricity, but not distribution if distribution is
wholly or mainly in connection with transmission of
communication signals
Supply of gas used for domestic or industrial heating or
lighting, not including motor vehicle gas, gas used for
welding or cutting metal, gas sold as lighter fuel
Supply of hydrocarbon oil used for domestic or industrial
heating, excluding gas oil other than marked gas oil
(paraffin, kerosene jet fuel, marine diesel and tractor diesel)
A zero rate of VAT applies to:
Aircraft used or to be used by a transport undertaking
operating for reward chiefly on international routes
Sea-going vessels of a gross tonnage of more than 15 tons
used for the carriage of passengers for reward, for the
purposes of a sea fishing business, for other commercial or
industrial purposes, or for rescue or assistance at sea
Note that from 1 January 2012, the standard VAT rate increased to
23%, reduced rate remains at 13.5%.
Standard rate 2002: 21%
2011: 21%
Reduced rate 2002: 12.5%
2011: 13.5%
Amount of
support
total per unit of energy per unit of CO2

Enhancing comparability of data on estimated budgetary support and tax expenditures for fossil fuels
August 2014 145
calculated
(refer to Excel
file)
2002: €11584
mln
2011: € 194 mln
2002: €0.45 / GJ
2011: € 0.76/ GJ
2002: € 6.38 / ton
2011: € 10.79/ ton
Information
sources
Irish Tax and Customs, VAT Rates (Current and Historic)
http://www.revenue.ie/en/tax/vat/rates/current-historic-rates-
vat.html#rates
Vat Consolidation Act 2010 - Schedule 3 - Goods and services
chargeable at the reduced rate, available from
http://www.revenue.ie/en/tax/vat/guide/vat-rates.html#section4
[accessed 18/3/2014]
Irish Tax and Customs, VAT rates,
http://www.revenue.ie/en/tax/vat/rates/index.jsp#G [accessed
18/3/2014]
VAT Consolidation Act 2010 - Schedule 1 - Exempt activities,
available from http://www.revenue.ie/en/tax/vat/guide/vat-
rates.html#section4
[accessed 18/3/2014]
Irish Tax and Customs, VAT Rates (Current and Historic)
http://www.revenue.ie/en/tax/vat/rates/current-historic-rates-
vat.html#rates [accessed 18/3/2014]
Sustainable Energy Authority of Ireland - Archived Domestic Fuel
Costs - Average Price per Unit (€) [accessed 18/3/2014]
VAT Consolidation Act 2010 – Schedule 2 – Zero rated activities,
available from http://www.revenue.ie/en/tax/vat/guide/vat-
rates.html#section4 [accessed 26/5/2014]
Sustainable Energy Authority of Ireland - Domestic fuels,
comparison of energy costs - 2014 [accessed 18/3/2014]
Eurostat energy statistics, Electricity prices – Households & Gas
prices – Households,
http://epp.eurostat.ec.europa.eu/tgm/table.do?tab=table&init=1&la
nguage=en&pcode=ten00115&plugin=1
DG TAXUD (2011) Excise Duty Tables, Part II – Energy products and
Electricity, REF 1033, July 2011
Irish Tax and Customs (2013) Excise Duty – Guide to Electricity Tax
- Leaflets & Guides, Update from December 2013
Revenue Commissioners (2013) Statistical Report 2012 - Excise,
http://www.revenue.ie/en/about/publications/statistical/2012/index.
html [accessed 18/3/2014]
Proposed minimum tax rates under revised Energy Tax Directive,
http://ec.europa.eu/taxation_customs/resources/documents/taxatio
n/minima_explained_en.pdf [accessed 24/3/2014]
IEA (2013) Energy statistics of OECD countries, 2013 edition

Enhancing comparability of data on estimated budgetary support and tax expenditures for fossil fuels
August 2014 146
Sustainable Energy Authority of Ireland (SEAI) 1990-2011 Energy
Balances
http://www.seai.ie/Publications/Statistics_Publications/Energy_Bala
nce/Previous_Energy_Balances/ [accessed 17/3/2014]
Please see excel spreadsheet for further details
Tax expenditures in social contributions and personal income taxes
Information on social contributions and personal income taxes of relevance to fossil
fuels could not be found in the assessment undertaken for this study. There are
however some benefits-in-kind, such as the tax treatment of company cars66, which
can be considered indirect forms of support through tax expenditure.
Tax expenditures in corporate income taxes
Name of the
scheme and
short
description
Corporate tax
The standard corporation tax is 12.5% for trading income. A higher
rate of 25% is applied on excepted trades which include working
minerals and petroleum activities (since 1992).
Type of tax
expenditure
Capital allowances – 100% write-offs for exploration and
development costs and deductions for abandonment costs.
In 2007 an additional Profit Resource Rent Tax was introduced of
5% to 15% linked to the profitability of discoveries, thus potentially
yielding 40% revenue for licenses issued after 1/1/2007.
Petroleum activities are also subject to a ring fence which prevents
losses from extraction activities being set off against profits arising
from non-petroleum-related activities for tax purposes.
Objectives To encourage exploration offshore.
Conditionality
for eligibility
Petroleum industry receives a 100% deduction in corporate tax for
exploration expenditures and development expenditures that
become available when petroleum extraction activities commence
(for exploration expenditures) and when production in commercial
quantities commences (for development expenditures).
Furthermore a deduction for expenditures that companies may
incur in withdrawing from/shutting down an oil or gas field is also
provided. A 100% allowance applies for abandonment expenditure
for the chargeable period when the expenditure is incurred.
Conditionality
for magnitude
of subsidy
Development expenditure allowance is subject to
production in commercial quantities, having begun in the field for
which the assets were provided. Excludes expenditure on vehicles,
land, buildings, machinery/plants/structures for processing or
storing petroleum (other than initial treatment or storage),
acquisition / rights over petroleum deposits and interest payments.
66
Irish Tax and Customs, Private Use of Company Cars,
http://www.revenue.ie/en/tax/it/leaflets/benefit-in-kind/private-use-cars.html [accessed
4/4/2014]

Enhancing comparability of data on estimated budgetary support and tax expenditures for fossil fuels
August 2014 147
Exploration expenditure allowance is provided for capital
expenditure on petroleum exploration activities, but excludes any
interest payments. It includes successful and abortive exploration
expenditures.
Abandonment activities are those which a company undertakes to
comply with requirements under its petroleum lease on closing
down, decommissioning or abandoning the field or part thereof.
This includes dismantling and removing pipelines used to bring
petroleum to land.
Fuel Applies to the petroleum industry (oil and gas)
Total amount Estimates could not be found
Information
sources
Ernst and Young (2012) Global Oil and Gas Tax Guide 2012,
http://www.ey.com/Publication/vwLUAssets/2012-global-oil-and-
gas-tax-guide/$FILE/EY_Oil_Gas_Tax_Guide_2012.pdf [accessed
4/4/2014]
Joint Committee on Communications, Natural
Resources and Agriculture (2012) Report
Offshore Oil and Gas Exploration, May 2012
http://www.oireachtas.ie/parliament/media/Report-on-Offshore-
Oil-and-Gas-Exploration.pdf [accessed 4/4/2014]
OECD (2013) Inventory of estimated budgetary support and tax
expenditures for fossil fuels 2013
Tax expenditures in royalties
The government does not levy any royalties, nor does it participate in projects
through production-sharing contracts etc. (since 1987). Investment in oil exploration
and production is encouraged through various measures including licensing terms, the
regulatory framework and one-off initiatives.
Since 1992 a Corporation Tax Rate of 25% has applied to profits from oil
and gas production. This compares to the 12.5% rate that applies to most
other sectors. Thus, the absence of royalty payments is somewhat
compensated for by a higher corporate income-tax rate.
Operating expenses are 100% deductible. Allowances and loss relief with
respect to abandonment expenditures are also available.
The capital costs of exploration and development can be written off (i.e.
100% write off in year 1 or as early as possible thereafter). Unclaimed
deductions can be carried forward for an unlimited period. There is also a
possibility of writing off the cost of unsuccessful exploration in one area against
profits from future successful exploration. This full deduction implies a post-tax
decrease of several categories of fixed costs.
Licence application and rental fees are kept at a low level. Moreover,
licences are offered with attractive conditions in terms of matching the
requirement of exploration companies
From January 2007, an additional Petroleum Resource Rent Tax (PRRT) has
been introduced on profits from oil and gas extraction with rates ranging from
5% to 15% depending on the profitability of a field. This additional tax applies
Enhancing comparability of data on estimated budgetary support and tax expenditures for fossil fuels
August 2014 148
to petroleum leases that follow on from new exploration licences granted after
1 January 2007. This is payable in addition to the 25% corporate tax.
Information sources
IEA (2013) Energy policies of IEA countries – Ireland 2012 Review,
http://www.iea.org/publications/freepublications/publication/IRELAND2012_free.pdf
[accessed 18/3/2014]
Department of Communications, Energy and Natural Resources, Petroleum Taxation in
Ireland, http://www.dcenr.gov.ie/nr/rdonlyres/e226421f-47b6-42db-9458-
c5ef0ee61930/0/petroleumtaxationinireland.pdf [accessed 26/3/2014]
OECD (2013) Inventory of estimated budgetary support and tax expenditures for fossil
fuels 2013

Enhancing comparability of data on estimated budgetary support and tax expenditures for fossil fuels
August 2014 149
Italy
Reporting years: 2002 and 2011
Direct budgetary support to consumers/users
Fondo Riduzione Prezzo Carburanti – Bonus Idrocarburi
This subsidy scheme was created immediately after the approval of the Law 99 of 23
July 2009 (Art. 45 - Legge 23 Luglio 2009, n. 99) and following the increase from 7%
to 10% of the tax regime applied for onshore oil and gas production. With the new
revenues, the Italian State created in 2010 a special fund (Fondo Riduzione Prezzi
carburanti) aimed at reducing the final pump price for the inhabitants currently living
in the Basilicata region, in the southern part of Italy. The residents of Basilicata –
which is the largest onshore oil producer of the country – are eligible to receive a
special credit card which can be used only the purchase of transport fuels (Carta
Bonus Idrocarburi), on which the State annually charges an amount of money linked
to the annual revenues obtained from the oil and gas royalties in the region.67
Final
beneficiary
Adult Italian citizens resident in the Basilicata Region (within the
Provinces of Potenza and Matera) in possess of a driver licence.
Direct
beneficiary
The “Fondo Riduzione Prezzi Carburanti – Bonus Idrocarburi” was
created in 2009 as an intermediate body between the State and the
final beneficiaries and was charged to manage some of the royalties
paid by the
Variability The subsidy is related to the amount of royalties paid by the
Exploration and Production (E&P) oil and gas companies that have
active upstream operations in hydrocarbon-rich regions of the
country. The amount paid changes annually and not all the funding
are directly diverted into subsidies for consumers.
Objectives The Basilicata region is considered as disadvantaged area at the same
time hosts significant oil and gas reservoirs. Therefore, this subsidy
could be considered as a form of “compensation” especially for
households and Italian citizens living in hydrocarbons-rich regions. At
the same time, given the status of disadvantaged area of the region,
this could be considered also as financial help for the citizens.
Conditionality
for eligibility
All adult Italian citizens resident in the Basilicata Region (within the
Provinces of Potenza and Matera) in possess of a driver licence are
eligible to obtain this specific type of subsidy.
Conditionality
for
magnitude of
According to data provided by the Italian Ministry of Economic
Development, the following subsidies were paid to the residents of
Basilicata who were elected as eligible for the subsidy.
67 In 2012, the Northern Veneto region challenged this subsidy, arguing for a broader
interpretation of the original law (Sentenza del Consiglio di Stato n. 4134 del 6 agosto
2013). Currently, the subsidy scheme is ongoing a process of reform and the
distribution of the subsidy is currently suspended (Comunicato Interministeriale 18
Novembre 2013 – Temporanea sospensione dell’erogazione dei contributi)

Enhancing comparability of data on estimated budgetary support and tax expenditures for fossil fuels
August 2014 150
subsidy
- € 100,70 (per person) were paid in 2011,
- € 140,23 (per person) were paid in 201268
Source of
funding
The subsidy is mainly paid by oil & gas companies which have assets
or are acting as service operators in the Basilicata Region.69
Fuel The subsidy is directly addressed to the consumers of transport fuels
such a as gasoil, unleaded petrol and liquefied petroleum gas.
Total amount 2002: N/A
2011: 48,78 million €70
Information
sources
Ministero dello Sviluppo Economico (2012), ‘Fondo riduzione prezzi
carburanti : Seconda Erogazione – ANNO 2012’
URL:http://unmig.mise.gov.it/unmig/royalties/fondo_seconda_erogaz
ione.asp [24/02/2014]
Ministero dello Sviluppo Economico (2013) ‘Gettito royalties - Anno
2013: Proventi delle royalties applicate alle produzioni idrocarburi
degli anni 2011 e 2012’
URL:http://unmig.sviluppoeconomico.gov.it/unmig/royalties/2013/ro
yalties.2013.pdf [25/02/2014]
Ministero dello Sviluppo Economico (2011), ‘Decreto Interministeriale
30 dicembre 2011 – Riconoscimento delle somme, finalizzate a
benefici per i residenti, spettanti ad alcune regioni, province e comuni
interessate dalle attività di estrazione di idrocarburi, in proporzione
alle relative produzioni. Versamenti effettuati nell'anno 2011.’ URL:
http://unmig.sviluppoeconomico.gov.it/unmig/norme/di301211.htm
[2/4/2014]
Consiglio di Stato (2013), ‘Sentenza del Consiglio di Stato 6 Agosto
2013’, n. 4134’
URL:http://unmig.sviluppoeconomico.gov.it/unmig/norme/sentenza_c
ds_060813.pdf [02/04/2014]]
Parlamento Italiano (2009), ‘Legge del 23 luglio 2009 , n. 99 –
Disposizioni per lo sviluppo e l'internazionalizzazione delle imprese,
nonche' in materia di energia’,
URL:http://www.cnac.gov.it/attachments/article/6/Legge-23-luglio-
2009.pdf [05/02/2014].
68 It must also be added that not all the potential beneficiaries of the subsidy for 2012
have been paid and the distribution of the subsidies is currently blocked. 69 Eni, Shell Italia and Edison are the biggest contributing companies for this subsidy.
70 The total amount which has been paid by the E&P to the Fondo Riduzione Prezzi
carburanti, has been 55, 322 million € which have been partially diverted to other
regions of Italy.

Enhancing comparability of data on estimated budgetary support and tax expenditures for fossil fuels
August 2014 151
Direct budgetary support to producers
Direct budgetary support to primary producers
CIP 6/92 Subsidy Mechanism (‘assimilated sources’)
The so-called “CIP 6/92 Mechanism”, was introduced following the resolution of 29
April 1992 of the Inter-ministerial Price Committee (CIP) and was originally conceived
with the objective to increase domestic renewable energy production and stimulate
the construction of more efficient power plants using the latest technology (co-
generation, waste heat recovery or CHP units). However, the subsidy created two
categories of energy sources: renewables and the so-called “assimilated” sources.
Within the type of plants which are not considered renewable energy plants are
called ‘Assimilated energy sources’ includes not only thermal power stations with very
specific efficiency levels, but also plants which are burning waste derived from
refinery processes and also fossil-fuels powered plants that were operating in remote
areas of the country.71 Under the CIP6 scheme, electricity produced from renewable
or assimilated plants was acquired at a stable price initially by the old national utility
ENEL, and following the liberalization by the national electricity service operator, the
Gestore Servizi Energetici (GSE).
Final
beneficiary
Co-generation Plants (with combined production of Thermal and
electrical energy), CHP plants, heat recovery and waste fumes. Plus,
power plants which are using fossil fuels derived from minor isolated
hydrocarbon fields or coal mines were eligible for this subsidy.
Direct
beneficiary
Cassa Conguaglio Settore Energetico (CCSE) and Gestore Servizi
Energetici (GSE) act as intermediate bodies between the State and
the final benificiaries.
Aid category Direct support
Variability The subsidy can be found as a part of the levy Componente A3 which
of the energy bill of the consumer.72 Through this feed-in tariff, the
electricity could be acquired at surcharged price and then re-sold to
to the market.
Objectives The mechanism was implemented following the approval of the Law
9/1991, which signed the landmark for the privatization of the former
monopoly company ENEL. The scheme was therefore a way to
stimulate the installation of the most recent technology for electricity
generation and also to foster the use of renewable energy sources
and waste-to-energy plants in the country. However, the subsidy has
71 Under the Decreto del Presidente della Repubblica of 24 January 1994, fossil sources
coming from “minor isolated fields” were considered as “assimilated” sources, and
therefore, eligible to obtain a State aid provided in the form of guaranteed purchases
of electricity at fixed subiszided prices. This is important because this subsidy was also
the major source of founding for the Carbosulcis coal power plant over the period
2001-2010 (cfr. State Aid S.A.20867 – (ex 2012/NN) – State aid in favour of
Carbosulcis. Invitation to submit comments pursuant to Article 108(2) of the Treaty on
the Functioning of the European Union). 72 This part of the electricity bill is comprehensive also of the subsidy given to
renewable sources.

Enhancing comparability of data on estimated budgetary support and tax expenditures for fossil fuels
August 2014 152
been used also to subsidize electricity produced from fossil fuel
products too.
Conditionality
for eligibility
Under the CIP 6/92 mechanism are eligible fossil-energy energy
power plants whose construction request occurred between January
1992 and June 1995. Moreover, the power stations must have an
overall thermal and electricity efficiency of above 51 % (with no limits
to the thermal energy supplied) or must use equipment for heat and
energy recovery (such as steam traps).
Conditionality
for
magnitude of
subsidy
In 2002, around 41,183 GWh were subsidized under this scheme
(source: ISIS-MURE, 2011), while in 2011, around 21,807 GWh worth
of electricity from assimilated sources were subsidised using this
scheme (source: Autorita’ per l’Energia Elettrica ed il Gas, 2013).
Source of
funding
The subsidy is finally paid by final consumers through a levy in the
final electricity bill (per kWh of consumed electricity).73
Fuel Waste residues from refinery processes (usually discarded fossil fuel
products), heavy fuel oil, natural gas and coal.
Total amount 2002: € 3380 mln (source: Poletti et al., 2009)
2012: € 2199 mln74 (source: Autorita’ per l’Energia Elettrica ed il Gas,
2013)
Information
sources
Pellini, E. (2012), 'Measuring the impact of market coupling on the
Italian electricity market', Energy Policy, Vol. 48, pp. 322-333.
Poletti, c. et al (2009), 'L'incentivazione della produzione di energia
elettrica da fonti rinnovabili e assimilate attraverso il Provvedimento
CIP n. 6/92: Un'analisi economica', IEFE Research Report, N. 4.,
URL:http://www.iefe.unibocconi.it/wps/allegatiCTP/studio_IEFE_CIP_
6.pdf [24/02/2014].
Lorenzoni A. (2003), 'The Italian Green Certificates market betwen
uncertainty and opportunities', Energy Policy, Vol. 31, pp. 33-42.
Whitley S. (2013), 'Time to change the game: Fossil fuel subsidies
and climate', Oversead Development institute, London,
URL:http://www.odi.org.uk/sites/odi.org.uk/files/odi-
assets/publications-opinion-files/8668.pdf [25/02/2014]
Autorita’ per l’Energia Elettrica ed il Gas (2013), 'Relazione Annuale
sullo Stato dei Servizi e sull'Attivita Svolta: Volume I Stato dei
Servizi', Roma,
URL:http://www.autorita.energia.it/allegati/relaz_ann/13/RAVolumeI
_2013.pdf [21/02/2014]
ISIS-MURE (2011), ‘Definition of Energy Prices (CIP 6/92 Pricing
Scheme)’, URL:http://www.measures-odyssee-
mure.eu/public/mure_pdf/general/ITA5.pdf [4/04/2014]
Cassa Conguaglio per il Settore Elettrico (2012), ‘Rendiconto
73 The subsidy can be found as a levy in the final energy bill of the consumer under the
name Componente A3. 74 This data accounts only for the ‘assimilated’ sources and not for the renewables.

Enhancing comparability of data on estimated budgetary support and tax expenditures for fossil fuels
August 2014 153
dell’esercizio finanziario 2012’, URL:http://www.ccse.cc/site/chi-
siamo/bilancio [4/04/2014]
Official Journal of the European Union (2013), ‘State Aid – Italy –
State aid SA.20867 – Stae Aid in favour of Carbosulcis – Invitation to
submit comments pursuant to Article 108(2) of the Treaty on the
Functioning of the European Union’URL:http://eur-
lex.europa.eu/legal-
content/EN/TXT/PDF/?uri=OJ:C:2013:020:FULL&from=EN
[2/04/2014]
Compensation for small islands and minor electric companies
This subsidy was introduced with the idea to provide compensation to small electric
companies which do not have a direct connection with the national grid and are usually
located on small islands (such as Giglio, Ustica and Capri). These Islands were
therefore forced to autonomously produce their own electricity at higher price than the
national level because almost the majority of the power stations of the islands were
fuelled with diesel or LPG fossil fuels. The subsidy was intitially conceived in 1974
following the implementation of the CIP 34/7475 and has been revised in 1991
according to the Article 7 of Law n. 10/9176.
Final
beneficiary
Small energy producer companies operating on small islands (and not
connected to the continental grid)77
Direct
beneficiary
Cassa Conguaglio Settore Energetico (CCSE) and Gestore Servizi
Energetici (GSE) act as intermediate bodies between the State and the
final benificiaries.
Aid category Direct support
Variability The subsidy can be found as the levy Componente UC4 which accounts
for roughly 0,94% of the so-called Oneri di Sistema section of the
electricity bill of the consumer. 78
Objectives The UC4 scheme was created with the idea to subsidise energy
production for the population living on several small islands (such as
Ustica and Capri) not connected yet to the continental grid. For around
47,000 inhabitants, energy production is still provided usually using
naval diesel engines. As the expenses for fossil fuels have increased
steadily over the last decade and the electricity connections with the
mainland have not been realized yet, the costs of the subsidy continue
to weigh on the final user’s electricity bill.
Conditionality
for eligibility
Only companies geographically located on small Islands, remote towns
not connected yet to the national grid with less than 5000 customers
75 Inside Chapter VII, comma 3, lettera a) of CIP n. 34/74
76 Articole 7 of Law n. 10/91
77 After 2009, the subsidy has been extended also to the energy companies with less
than 5000 customers. A coincise list of enterprises could to be found on:
http://www.autorita.energia.it/it/elettricita/onerigenerali.htm#UC4 78 This part of the electricity bill is comprehensive also of the subsidy given to
renewable sources.
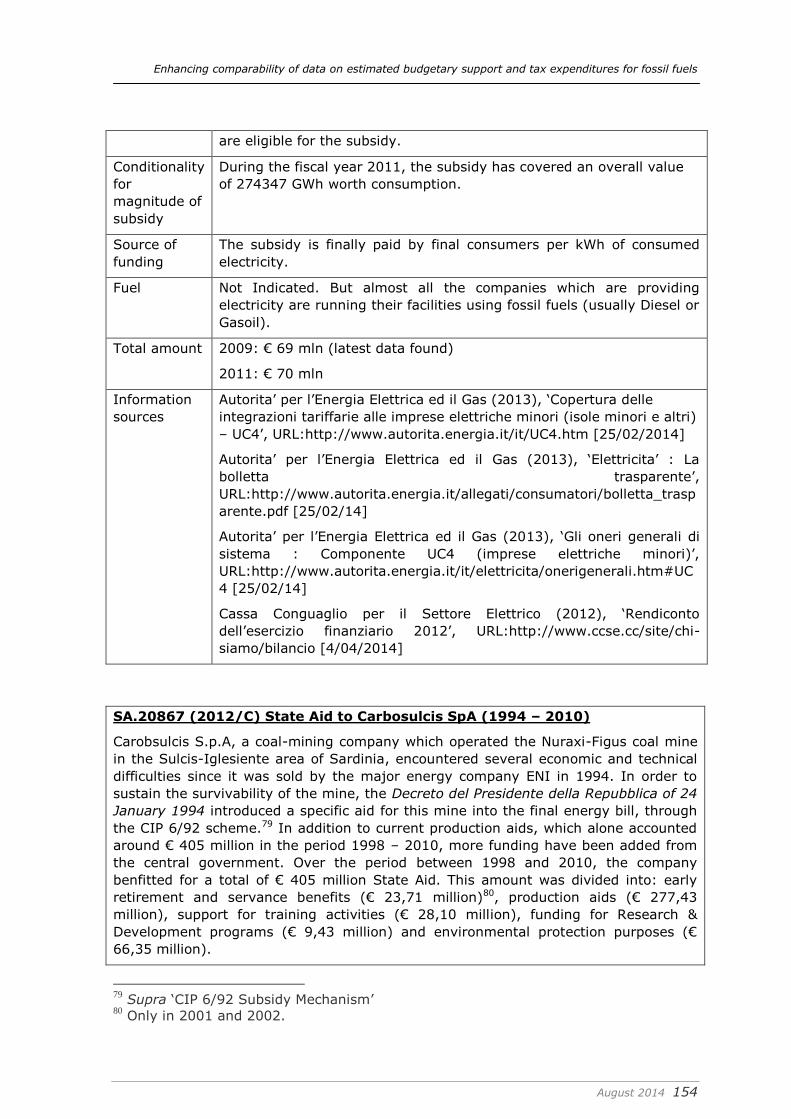
Enhancing comparability of data on estimated budgetary support and tax expenditures for fossil fuels
August 2014 154
are eligible for the subsidy.
Conditionality
for
magnitude of
subsidy
During the fiscal year 2011, the subsidy has covered an overall value
of 274347 GWh worth consumption.
Source of
funding
The subsidy is finally paid by final consumers per kWh of consumed
electricity.
Fuel Not Indicated. But almost all the companies which are providing
electricity are running their facilities using fossil fuels (usually Diesel or
Gasoil).
Total amount 2009: € 69 mln (latest data found)
2011: € 70 mln
Information
sources
Autorita’ per l’Energia Elettrica ed il Gas (2013), ‘Copertura delle
integrazioni tariffarie alle imprese elettriche minori (isole minori e altri)
– UC4’, URL:http://www.autorita.energia.it/it/UC4.htm [25/02/2014]
Autorita’ per l’Energia Elettrica ed il Gas (2013), ‘Elettricita’ : La
bolletta trasparente’,
URL:http://www.autorita.energia.it/allegati/consumatori/bolletta_trasp
arente.pdf [25/02/14]
Autorita’ per l’Energia Elettrica ed il Gas (2013), ‘Gli oneri generali di
sistema : Componente UC4 (imprese elettriche minori)’,
URL:http://www.autorita.energia.it/it/elettricita/onerigenerali.htm#UC
4 [25/02/14]
Cassa Conguaglio per il Settore Elettrico (2012), ‘Rendiconto
dell’esercizio finanziario 2012’, URL:http://www.ccse.cc/site/chi-
siamo/bilancio [4/04/2014]
SA.20867 (2012/C) State Aid to Carbosulcis SpA (1994 – 2010)
Carobsulcis S.p.A, a coal-mining company which operated the Nuraxi-Figus coal mine
in the Sulcis-Iglesiente area of Sardinia, encountered several economic and technical
difficulties since it was sold by the major energy company ENI in 1994. In order to
sustain the survivability of the mine, the Decreto del Presidente della Repubblica of 24
January 1994 introduced a specific aid for this mine into the final energy bill, through
the CIP 6/92 scheme.79 In addition to current production aids, which alone accounted
around € 405 million in the period 1998 – 2010, more funding have been added from
the central government. Over the period between 1998 and 2010, the company
benfitted for a total of € 405 million State Aid. This amount was divided into: early
retirement and servance benefits (€ 23,71 million)80, production aids (€ 277,43
million), support for training activities (€ 28,10 million), funding for Research &
Development programs (€ 9,43 million) and environmental protection purposes (€
66,35 million).
79 Supra ‘CIP 6/92 Subsidy Mechanism’
80 Only in 2001 and 2002.

Enhancing comparability of data on estimated budgetary support and tax expenditures for fossil fuels
August 2014 155
Final beneficiary Carbosulcis S.p.A. (owned by the Regione Autonoma della
Sardegna) in the territory Sulcis-Iglesiente in Sardinia
Direct beneficiary Carbosulcis S.p.A. (owned by the Regione Autonoma della
Sardegna) in the territory Sulcis-Iglesiente in Sardinia
Aid category Direct Support
Variability Major part (around 70% of total amount) of the subsidy
provided through the CIP 6/92 scheme. Remaining through
transfers from Central Government.
Objectives To maintain the economic sustainability of the mine, provide
environmental protection for the mining site, provide early
retirement schemes for certain workers, training activities and
R&D activities.
Conditionality for
eligibility
N/A
Conditionality for
magnitude of subsidy
N/A
Source of funding Major part (around 70% of total amount) of the subsidy
provided through the CIP scheme, the remaining amount
provided by the Central government.
Fuel Coal
Total amount 2002: € 34 mln total (€ 12 mln without the CIP 6/92)
2010: € 39 mln total
2011: € N/A
Information sources Official Journal of the European Union (2013),’ State aid —
Italy — State aid SA.20867 (2012/C) (ex 2012/NN) — State
aid in favour of Carbosulcis — Invitation to submit comments
pursuant to Article 108(2) of the Treaty on the Functioning of
the European Union Text with EEA relevance’, 2013/C 20/01
,URL: http://eur-lex.europa.eu/legal-
content/EN/TXT/?uri=uriserv:OJ.C_.2013.020.01.0001.01.ENG
[08/04/2014]
European Commission (2012), ‘State aid: Commission opens
two in-depth inquiries into Italian support measures in energy
sector in Sardinia (Press Release)’, IP/12/1242, URL:
[08/04/2014]
Direct budgetary support for R&D purposes
R&D Spending on fossil fuels
No specific schemes were identified. However, the OECD indicated that there is
actually a spending on R&D in Italy in the period between 2002 and 2011. The biggest

Enhancing comparability of data on estimated budgetary support and tax expenditures for fossil fuels
August 2014 156
part of the spending (in 2011) was allocated mainly on research related to the
development of CCS Technologies.81 Currently, in Italy there are several
demonstration plants which have implemented CCS technologies and the bulk of OECD
expenditures should be referred to these projects.82
Final
beneficiary
No data
Direct
beneficiary
No data
Aid category No data
Variability No data
Objectives Mainly research & development for CCS projects.
Conditionality
for eligibility
No data
Conditionality
for
magnitude of
subsidy
No data
Source of
funding
No data
Fuel Research mainly focused on coal, oil and natural gas
Total amount 2002: € 16.374 mln
2011: € 39.221 mln (Mainly on Coal R&D)
Information
sources
IEA (2014) IEA Energy Technology RD&D Statistics, DOI:
10.1787/enetech-data-en [Accessed: 21/03/2014]
Petro Barbucci, (2009), ‘The ENEL CCS Projects’, URL:
http://www.geology.sk/co2neteast/documents/workshop_bratislava/P_
BARBUCCI.pdf [05/04/2014].
Commission of the European Communities (2008), ‘Supporting Early
|Demonstration of Sustainable Power Generation from Fossil Fuels’,
COM (2008) 13 final, URL: http://eur-lex.europa.eu/legal-
content/EN/TXT/PDF/?uri=CELEX:52008DC0013&from=EN
[24/03/2014]
Official Journal of the European Union, ‘Regulation (EU) No 1233/2010
81 A potential assumption would be that these funds are directly linked to the
development of the CCS Sulcis integrated Project (found in the State Aid register
under reference SA.33424). 82 The ENEL Brindisi Coal-fired power station installed a CO2 capture system at its Unit
4 plant (contract awarded in April 2008 and completed in in December 2009). This
contract is part of a Strategic Cooperation Agreement to develop technologies for CO2
capture signed between ENI and ENEL. The other project is ENEL's Porto Tolle project,
to convert a fuel oil power plant to coal. Even if ENEL has already completed 70% of the total investment and had received almost 100€ million funding through the
European Energy Recovery Programme (EEPR), the plant project is currently on hold
because ENEL is still waiting for the operating license.
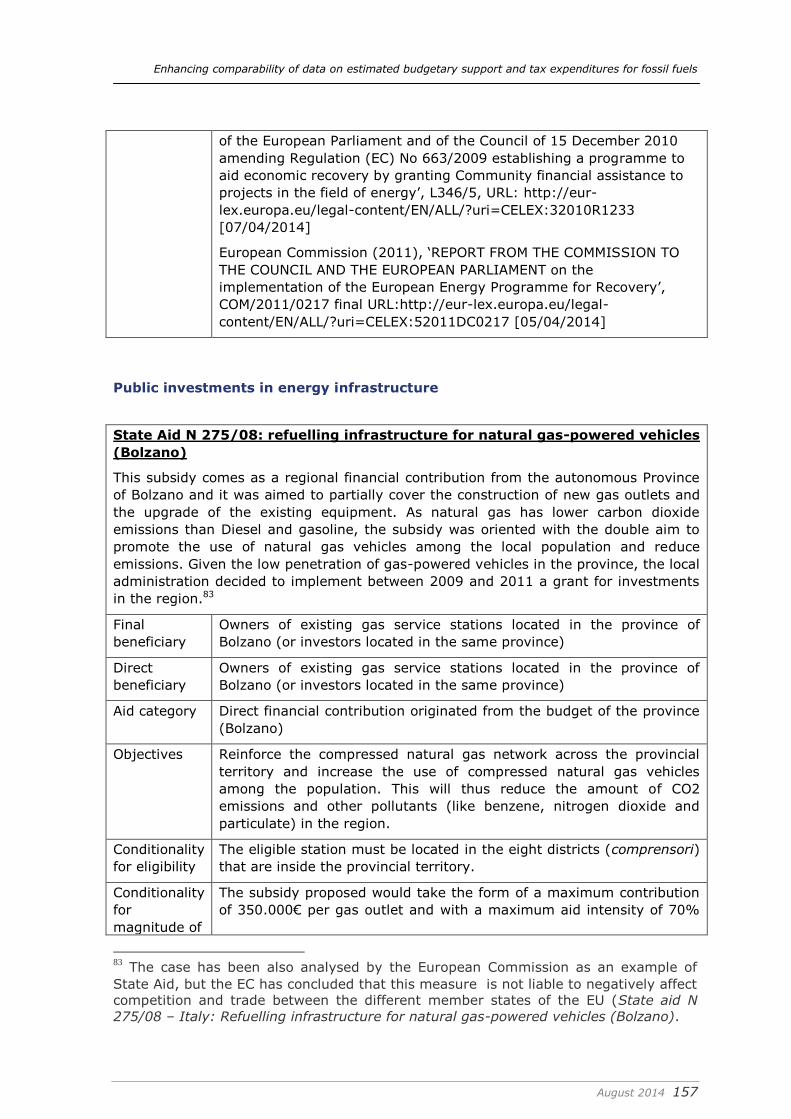
Enhancing comparability of data on estimated budgetary support and tax expenditures for fossil fuels
August 2014 157
of the European Parliament and of the Council of 15 December 2010
amending Regulation (EC) No 663/2009 establishing a programme to
aid economic recovery by granting Community financial assistance to
projects in the field of energy’, L346/5, URL: http://eur-
lex.europa.eu/legal-content/EN/ALL/?uri=CELEX:32010R1233
[07/04/2014]
European Commission (2011), ‘REPORT FROM THE COMMISSION TO
THE COUNCIL AND THE EUROPEAN PARLIAMENT on the
implementation of the European Energy Programme for Recovery’,
COM/2011/0217 final URL:http://eur-lex.europa.eu/legal-
content/EN/ALL/?uri=CELEX:52011DC0217 [05/04/2014]
Public investments in energy infrastructure
State Aid N 275/08: refuelling infrastructure for natural gas-powered vehicles
(Bolzano)
This subsidy comes as a regional financial contribution from the autonomous Province
of Bolzano and it was aimed to partially cover the construction of new gas outlets and
the upgrade of the existing equipment. As natural gas has lower carbon dioxide
emissions than Diesel and gasoline, the subsidy was oriented with the double aim to
promote the use of natural gas vehicles among the local population and reduce
emissions. Given the low penetration of gas-powered vehicles in the province, the local
administration decided to implement between 2009 and 2011 a grant for investments
in the region.83
Final
beneficiary
Owners of existing gas service stations located in the province of
Bolzano (or investors located in the same province)
Direct
beneficiary
Owners of existing gas service stations located in the province of
Bolzano (or investors located in the same province)
Aid category Direct financial contribution originated from the budget of the province
(Bolzano)
Objectives Reinforce the compressed natural gas network across the provincial
territory and increase the use of compressed natural gas vehicles
among the population. This will thus reduce the amount of CO2
emissions and other pollutants (like benzene, nitrogen dioxide and
particulate) in the region.
Conditionality
for eligibility
The eligible station must be located in the eight districts (comprensori)
that are inside the provincial territory.
Conditionality
for
magnitude of
The subsidy proposed would take the form of a maximum contribution
of 350.000€ per gas outlet and with a maximum aid intensity of 70%
83 The case has been also analysed by the European Commission as an example of
State Aid, but the EC has concluded that this measure is not liable to negatively affect
competition and trade between the different member states of the EU (State aid N
275/08 – Italy: Refuelling infrastructure for natural gas-powered vehicles (Bolzano).

Enhancing comparability of data on estimated budgetary support and tax expenditures for fossil fuels
August 2014 158
subsidy regarding an investment of 500.000€.
Source of
funding
The autonomous Province of Bolzano (Regional level).
Fuel The subsidy is limited for the construction of infrastructure related to
the compressed natural gas station and it is limited to natural gas.
Total amount 2002: N/A (Subsidy started in 2009)
2011: € 1 mln (total amount for three years is € 3.2 mln)
Information
sources
European Commission (2008), ‘State aid N 275/08 – Italy Refuelling
infrastructure for Natural gas-powered vehicles (Bolzano)’, URL:
http://ec.europa.eu/competition/state_aid/cases/225963/225963_854
187_25_1.pdf [01/04/2014]
State Aid N 180/2009 for En Plus Power Plant
The motivation behind this scheme was to endorse the regional development through
the construction of a thermo-electrical power plant (combined cycle gas turbine) with a
nominal power of 415 MW and a net efficiency of 57.1% in San Severo, in the Apulia
Region. The project was encouraged with the intent to bring development into the
Macro-South zone and foster the development of cogeneration systems in the regions.
The project started officially in 2007 and the power plant was finished in 2012.
Final
beneficiary
EN plus s.r.l. (limited liability partnership) consortium charged for the
construction and maintenance of the power plant
Direct
beneficiary
EN plus s.r.l. (limited liability partnership) consortium charged for the
construction and maintenance of the power plant
Aid category Grant
Objectives The subsidy is given in the form of an automatic tax credit and it is
aimed at developing co-generation plants in the Apulia region.
Conditionality
for eligibility
Only the San Severo power plant is eligible for this support.
Conditionality
for
magnitude of
subsidy
No data available
Source of
funding
Public Funding (in the form of tax breaks)
Fuel Natural Gas
Total amount 2002: N/A (Subsidy started in 2007)
2011: € 7.5 mln (total amount between 2007 and 2010 € 30 mln)
Information European Commission (2009), ‘State aid N 180/2009 – En Plus Power
Plant- Corrigendum’,

Enhancing comparability of data on estimated budgetary support and tax expenditures for fossil fuels
August 2014 159
sources URL:http://ec.europa.eu/competition/state_aid/cases/230482/230482
_1019072_51_1.pdf [20/04/2014]
European Commission (2009) ‘Aiuto di Stato N 180/2009 – Italia
grande progetto di investimento – En Plus Centrale termoelettrica’
URL:http://ec.europa.eu/competition/state_aid/cases/230482/230482
_1019868_53_2.pdf [20/04/2014
Parlamento Italiano (2007)‘Disposizioni per la formazione del bilancio
annual e pluriennale dello Stato (legge finanziaria 2007)’
URL:http://www.parlamento.it/parlam/leggi/06296l.htm [20/03/2014]
En Plus (2013) ‘Centrale turbogas a ciclo combinato di San Severo. Un
impianto eco-efficiente per lo sviluppo della capitanata’
URL:http://www.enplus.it/enplus/pdf/enplus07.pdf [01/04/2014]
Tax expenditures
Excises and other specific taxes on energy use
Excise taxes
An excise tax is applied to gasoline, diesel, kerosene, LPG, fuel oil (light and heavy) and
natural gas. Every year the excise tax rates are published by the Central Direction of
excises (Direzione Centrale Legislazione e procedure Accise), a body of the National
Agency for Customs and Duties of Italy (Agenzia delle Dogane e dei Monopoli). The
provided legal base has changed frequently over the reference years, however, the
most important documents are the Decreto Legislativo 26 Ottobre 1995, n. 504, the
DPCM 15/01/1999, the Law 388 of 23 December 2000 (Disposizioni per la Formazione
del Bilancio Annuale e Plurieannale dello Stato – Legge Finanziaria 2001) and the Law
99/2009 (Disposzioni per lo sviluppo e l’internazionalizzazione delle imprese).
An excise tax is applied to natural gas, LPG, Diesel, coal and coke and Electricity. Italy
has experienced a series of changes regarding its taxation of energy products especially
if we take into account regional taxes. The legal base for the taxation is broadly based
into the Law Decree n. 504 of 26 October 1995, which has been modified taking into
consideration the Law Decree 2/2/2007 n. 26 and the Law Decree n. 159 of 1 October
2007.
Summary of
fuels and
use(r)s to
which reduced
rates or
exemptions
applied in the
reporting
years
The following reduced rates are applied:
o Kerosene used by international aviation is exempt
o Kerosene used by domestic aviation is exempt
o Diesel used by domestic shipping is exempt
o Diesel used by international navigation is exempt
o Heavy fuel oil used for international navigation is exempt

Enhancing comparability of data on estimated budgetary support and tax expenditures for fossil fuels
August 2014 160
o Fuel tax concession exists for the fisheries sector
o Tax breaks for agriculture, forestry and aquaculture are
present.84 85
o Reduction rate for petroleum products used for public transports
is applied.86
o Rail transport (diesel) has a differentiated tax rate (30% of the
standard tax rate)
o Since 1995 a reduction rate for petroleum products is applied for
ambulances (40% of the benchmark rate for diesel, gasoline
and LPG)
o Tax relief (90% of the benchmark excise tax) is in place for LPG
used as transportation and in certain industrial plants.87
o In 2011, residential users of natural gas were taxed differently
according to the amount of natural gas annually consumed.
Between 2004 and 2008 a differentiated tax tariff system for
natural gas used for residential purposes was put in place
between the Southern (Mezzogiorno) and the North-Centre part
of the country.
o Large industrial users of natural gas (with consumption over
1.200.000 cubic meters of natural gas/year) are subject to a
reduction of 60% in the rate of excise tax usually levied on
sales of natural gas.
o Trucking companies operating in Italy are partially refunded of
the excise tax paid for fuel purchases
o Differentiated tax regime for the national army (Diesel and
gasoline)
o In Italy there are two different excise tax rates which apply to
heavy fuel oil according to the sulphur content. In the
calculations
o There is a taxation put in place for heavy fuel oil with different
sulphur content and for the use (domestic or industrial use)88
o A tax relief for people living in disadvantaged areas (not yet
connected to the natural gas network) in the form of a set of
reductions of excise taxes
84 According to the OECD benchmark rate, a reduction of 78% for diesel and 51% for
gasoline is applied. However, the national legislation assumes that diesel is taxed at
22% of the current standard rate and petrol is taxed at 49% of the standard rate. 85 This data was given by the OECD,however, the national legislation There is also a
tax break in the gasoline use for agriculture, but given that the consumption of this
fuel accounts for no more than 1% of the overall energy consumption in these sectors
it has been allocated to fuel use. 86 The reduction also applies for fuel used for boat transport in places where road
connections are not existing. 87 No data avalilable.
88 ATZ (Alto Tenore di Zolfo) and BTZ (Basso Tenore di Zolfo)

Enhancing comparability of data on estimated budgetary support and tax expenditures for fossil fuels
August 2014 161
Amount
calculated
(benchmark:
highest excise
per unit of
energy
consumption)
Total per unit of energy per unit of CO2
2002: € 34,524 mln
2011: € 32,215 mln
2002: € 6.49 / GJ
2011: € 6.56 / GJ
2002: € 85.60 / ton
2011: € 85.09 / ton
Amount
calculated
(benchmark:
highest excise
per unit of
CO2
emissions)
Total per unit of energy per unit of CO2
2002: € 34,524 mln
2011: € 31,690 mln
2002: € 6.49 / GJ
2011: € 6.45 / GJ
2002: € 85.60 / ton
2011: € 83.70 / ton
Amount
calculated
(benchmark:
proposal new
energy
taxation
directive)
total per unit of energy per unit of CO2
2002: € 3319 mln
2011: € 1983 mln
2002: € 0.62 / GJ
2011: € 0.40 / GJ
2002: € 8.23 / ton
2011: € 5.24 / ton
Information
sources
Sources of information – Excises
National Legislation:
o Law n. 388 of 23 December 2000, (Disposizioni per la formazione
del bilancio annuale e pluriennale dello Stato – legge finanziaria
2001), URL: http://www.normattiva.it/uri-
res/N2Ls?urn:nir:stato:legge:2000-12-23;388 [30/06/2014]
o Law Decree n. 504 of 26 October 1995 (Decreto Legislativo 26
Ottobre 1995, n. 504 – Testo unico delle disposizioni legislative
concernenti le imposte sulla produzione e sui consume e relative
sanzioni penali e amministrative), URL:
http://www.normattiva.it/uri-
res/N2Ls?urn:nir:stato:decreto.legislativo:1995;504
[01/04/2014]
o Law Decree n. 159 of 1 October 2007 (Decreto legislativo del 1
Ottobre 2007 n. 159 - Interventi urgenti in materia economico-
finanziaria, per lo sviluppo e l'equita' sociale) URL:
http://www.normattiva.it/uri-
res/N2Ls?urn:nir:stato:decreto.legge:2007;159 [05/04/2014]
Agenzia delle Dogane (2011), 'Aliquote di imposta vigenti nel settore
delle accise - Aggiornamenti al primo Gennaio 2011',
URL:http://www.agenziadogane.gov.it/wps/wcm/connect/40d9108045
73601d8329e79503fb0af3/aliq-naz-
gennaio_2011.pdf?MOD=AJPERES&CACHEID=40d910804573601
d8329e79503fb0af3 [05/04/2014]
EC DG TAXUD (2002) Excise duty tables – April 2002, Ref 1.014, April

Enhancing comparability of data on estimated budgetary support and tax expenditures for fossil fuels
August 2014 162
2002.
EC DG TAXUD (2011) Excise duty tables, Part II – Energy products and
electricity, Ref 1032, January 2011
OECD (2013), ‘Taxing Energy Use: A graphical Analysis’, OECD
Publishing.
OECD (2013) ‘Inventory of Estimated Budgetary Support and Tax
Expenditures for Fossil Fuels’, OECD Publishing.
Martini, R. (2012), ’Fuel Tax Concessions in the Fisheries Sector’,
OECD Food, Agriculture and Fisheries Papers, No. 56, OECD Publishing.
URL: http://www.oecd-
ilibrary.org/docserver/download/5k9bdccqft30.pdf?expires=140109779
7&id=id&accname=guest&checksum=4265DC4921023368E5E3C91B04
60AC17 [02/04/2014]
EUNOMIA (2013), ‘Study on Environmental Fiscal Reform Potential in
12 EU Member States – Final Report to DG Environment of the
European Commission’, URL:
http://ec.europa.eu/environment/integration/green_semester/pdf/EFR-
Final%20Report.pdf [02/04/2014]
ENI (2007), ‘Manuale delle Accise 2007’, URL:
https://www.eni.com/it_IT/attachments/documentazione/fiscale/testo-
unico-accise/Manuale_delle_Accise2007.pdf [30/06/2014]
ENI (2010), ‘Manuale delle Accise 2010’, URL:
http://www.eni.com/it_IT/attachments/documentazione/bilanci-
rapporti/rapporti-2010/Manuale-delle-Accise-2010.pdf [30/06/2014]
Sources of Information – energy prices:
OECD (2013), ‘Energy Prices and Taxes, Volume 2013 Issue 3. Third
Quarter 2013’, OECD Publishing.
OECD (2005), ‘Energy Prices and Taxes, Quarterly Statistics, Second
Quarter 2005’, OECD Publishing.
Eurostat (2014), Energy statistics – gas and electricity prices’ URL:
http://epp.eurostat.ec.europa.eu/portal/page/portal/energy/data/data
base [Accessed: 18/03/2014]
Unione Petrolifera Italiana (2014), ‘Statistiche economiche, energetiche
e
petrolifere’,URL:http://www.unionepetrolifera.it/it/Statistiche2012/men
u.html [Accessed: 2/04/2014]
Ministero dello Sviluppo Economico (2014), ‘Statistiche dell’Energia’,
URL:http://dgerm.sviluppoeconomico.gov.it/dgerm/ [Accessed:
21/03/2014]
Sources of Information – energy balances:
IEA (2004), ‘Energy Statistics of OECD Countries 2004’, OECD
Publishing.
IEA (2013), ‘Energy Statistics of OECD Countries 2013’, IEA.
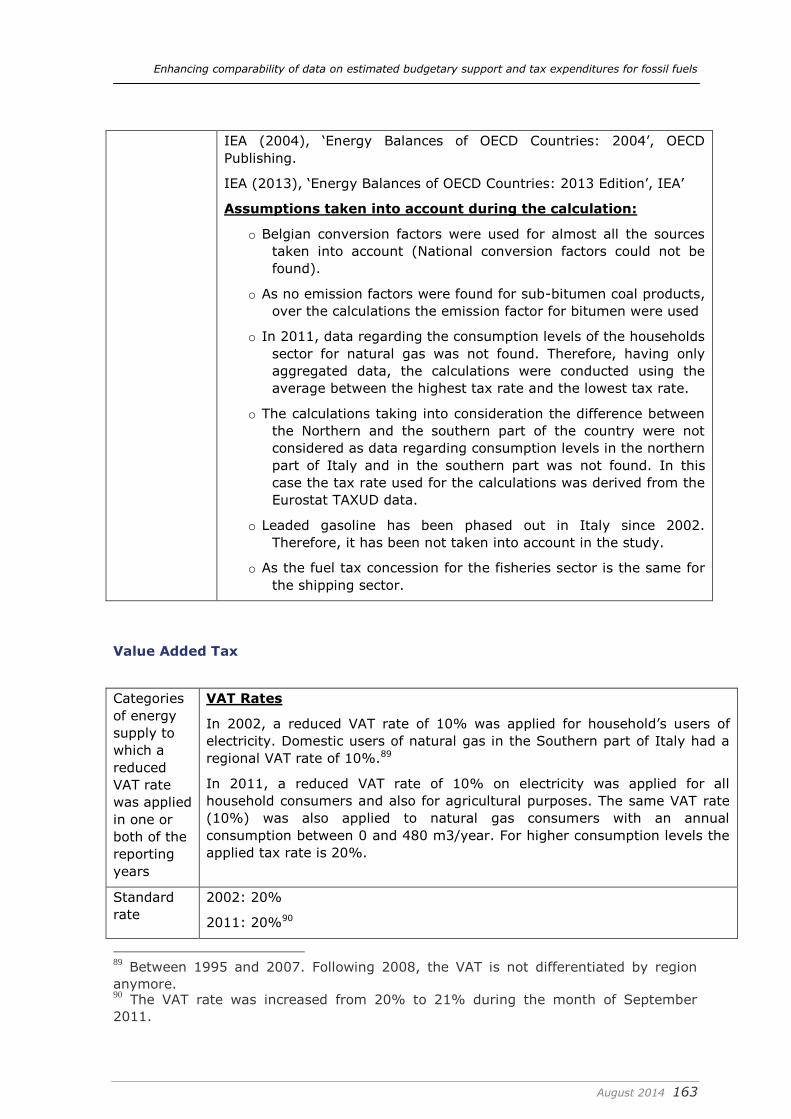
Enhancing comparability of data on estimated budgetary support and tax expenditures for fossil fuels
August 2014 163
IEA (2004), ‘Energy Balances of OECD Countries: 2004’, OECD
Publishing.
IEA (2013), ‘Energy Balances of OECD Countries: 2013 Edition’, IEA’
Assumptions taken into account during the calculation:
o Belgian conversion factors were used for almost all the sources
taken into account (National conversion factors could not be
found).
o As no emission factors were found for sub-bitumen coal products,
over the calculations the emission factor for bitumen were used
o In 2011, data regarding the consumption levels of the households
sector for natural gas was not found. Therefore, having only
aggregated data, the calculations were conducted using the
average between the highest tax rate and the lowest tax rate.
o The calculations taking into consideration the difference between
the Northern and the southern part of the country were not
considered as data regarding consumption levels in the northern
part of Italy and in the southern part was not found. In this
case the tax rate used for the calculations was derived from the
Eurostat TAXUD data.
o Leaded gasoline has been phased out in Italy since 2002.
Therefore, it has been not taken into account in the study.
o As the fuel tax concession for the fisheries sector is the same for
the shipping sector.
Value Added Tax
Categories
of energy
supply to
which a
reduced
VAT rate
was applied
in one or
both of the
reporting
years
VAT Rates
In 2002, a reduced VAT rate of 10% was applied for household’s users of
electricity. Domestic users of natural gas in the Southern part of Italy had a
regional VAT rate of 10%.89
In 2011, a reduced VAT rate of 10% on electricity was applied for all
household consumers and also for agricultural purposes. The same VAT rate
(10%) was also applied to natural gas consumers with an annual
consumption between 0 and 480 m3/year. For higher consumption levels the
applied tax rate is 20%.
Standard
rate
2002: 20%
2011: 20%90
89 Between 1995 and 2007. Following 2008, the VAT is not differentiated by region
anymore. 90 The VAT rate was increased from 20% to 21% during the month of September
2011.

Enhancing comparability of data on estimated budgetary support and tax expenditures for fossil fuels
August 2014 164
Reduced
rate
2002: 10%
2011: 10% for household consumers of electricity and certain users of
natural gas
Amount of
support
calculated
2002: € 898 mln
2011: € 1,371 mln
Information
sources
Sources Information for VAT Rates:
National Legislation:
- Law Decree n. 328 of 29 September 1997, 'Decreto-Legge 29
settembre 1997, n. 328: Disposizioni Tributarie Urgenti' URL
:http://www.normattiva.it/uri-
res/N2Ls?urn:nir:stato:decreto.legge:1997-09-29;328 [04/03/2014]
- Law Decree n. 138 of 13 August 2011, ‘Decreto Legge n. 138 de 13
Agosto 2011: Ulteriori misure urgenti per la stabilizzazione finanziaria
e per lo sviluppo’, URL:
http://www.governo.it/backoffice/allegati/64632-6995.pdf
[25/03/2014]
OECD (2013), ‘Energy Prices and Taxes, Volume 2013 Issue 3. Third Quarter
2013’, OECD Publishing.
OECD (2013) ‘Inventory of Estimated Budgetary Support and Tax
Expenditures for Fossil Fuels’, OECD Publishing
EC (2014) VAT Rates applied in the Member States of the European Union,
Situation as of 13 January 2014,
URL:http://ec.europa.eu/taxation_customs/resources
/documents/taxation/vat/how_vat_works/rates/vat_rates_en.pdf
[02/04/2014].
EC DG TAXUD (2002) Excise duty tables – April 2002, Ref 1.014, April 2002.
EC DG TAXUD (2011) Excise duty tables, Part II – Energy products and
electricity, Ref 1032, January 2011
Sources of Information – energy prices:
IEA (2004), ‘Energy Prices and Taxes, Vol. 2003/4’, OECD Publishing.
OECD (2013), ‘Energy Prices and Taxes, Volume 2013 Issue 3. Third Quarter
2013’, OECD Publishing.
Eurostat (2014), Energy statistics – gas and electricity prices’ URL:
http://epp.eurostat.ec.europa.eu/portal/page/portal/energy/data/database
[Accessed: 18/03/2014]
Unione Petrolifera Italiana (2014), ‘Statistiche economiche, energetiche e
petrolifere’,URL:http://www.unionepetrolifera.it/it/Statistiche2012/menu.html
[Accessed: 2/04/2014]
Ministero dello Sviluppo Economico (2014), ‘Statistiche dell’Energia’,
URL:http://dgerm.sviluppoeconomico.gov.it/dgerm/ [Accessed: 21/03/2014]

Enhancing comparability of data on estimated budgetary support and tax expenditures for fossil fuels
August 2014 165
Sources of Information – energy balances:
IEA (2004), ‘Energy Statistics of OECD Countries 2004’, OECD Publishing.
IEA (2013), ‘Energy Statistics of OECD Countries 2013’, IEA.
IEA (2004), ‘Energy Balances of OECD Countries: 2004’, OECD Publishing.
IEA (2013), ‘Energy Balances of OECD Countries: 2013 Edition’, IEA’
Assumptions taken into account during the calculation:
o Disaggregated data for to the different levels of natural gas
consumption between households and industry was not found.
Therefore, the assumption is that the VAT rate is an average between
the four different rates taken into account.
o Data regarding the price (final or commercial) of Kerosene was not
found
o Data regarding 2002 consumption levels between the North and the
South of Italy was not found.
o Prices of natural gas for households between 2000 and 2003 were
confidential.
Tax expenditures in social contributions and personal income taxes
N.a.
Tax expenditures in corporate income taxes
N.a.
Tax expenditures in royalties
Italy does have a system which can be identified as “lower royalties” for encouraging
the exploration and the harvest of hydrocarbons (the legislative framework can
initially be found within the Decreto Legislativo 25 novembre 1996, n. 625, Art. 19).
Between 1997 and 2010 Italy applied a low tax regime for onshore oil and gas
production (7% of original taxation), for offshore oil production (4%) and for offshore
gas production (7%).
An increase was decided in 2009. State’s royalty for offshore oil production now equals
to 7% and 10% for gas.
As part of the Decree 96/625, since 1996 a full royalty relief is put in place for the first
50.000 tonnes of oil produced offshore and for the first 20.000 tonnes of oil extracted
onshore. A similar exemption is applied for the first 25 million cubic meters of natural
gas produced from onshore production and for the first 80 million cubic meters for
offshore production.
Natural gas used in the harvest of hydrocarbons (offshore and onshore) has a
differentiated tax rate of 11,73 EUR per 1000 cubic meters.
Sources:
Enhancing comparability of data on estimated budgetary support and tax expenditures for fossil fuels
August 2014 166
Ernst & Young (2013), ‘Global Oil and Gas Tax Guide 2013’, URL:
http://www.ey.com/Publication/vwLUAssets/2013_global_oil_and_gas_tax_guide/$FIL
E/EY_Oil_and_Gas_2013.pdf [06/04/2014]
OECD (2013), ‘Inventory of Estimated Budgetary Support and Tax Expenditures for
Fossil Fuels 2013’, OECD Publishing.
Governo Italiano (1996), ‘Decreto Legislativo 25 novembre 1996 n. 625’,
URL:www.parlamento.it/parlam/leggi/deleghe/96625dl.htm [25/02/2014].
Parlamento Italiano (2009), ‘Legge del 23 luglio 2009 , n. 99 – Disposizioni per lo
sviluppo e l'internazionalizzazione delle imprese, nonche' in materia di energia’, URL:
http://www.cnac.gov.it/attachments/article/6/Legge-23-luglio-2009.pdf
[05/02/2014].
Governo Italiano (2007), ’Decreto legislativo del 1 Ottobre 2007 n. 159 - Interventi
urgenti in materia economico-finanziaria, per lo sviluppo e l'equita' sociale’
URL:http://www.normattiva.it/uri-res/N2Ls?urn:nir:stato:decreto.legge:2007;159
[05/04/2014]

Enhancing comparability of data on estimated budgetary support and tax expenditures for fossil fuels
August 2014 167
Latvia
Reporting years: 2005 and 2011
Direct budgetary support to consumers/users
N.a.
Direct budgetary support to producers
Direct budgetary support to primary producers
N.a.
Direct budgetary support for R&D purposes
N.a.
In 2005, a total amount of 94,500 EUR and in 2011 214,000 EUR of state public
budget was allocated for energy research. The main focus was on renewable energy
sources, energy independence and energy efficiency. The following information
sources were used:
Zinātne Latvijā. Valsts pētījumu programma.Izglītības un zinātnes ministrija,
2010. [Latvian Science. National Research programmes.Ministry of Education
and Science, 2010 (in Latvian)]
Latvijas Zinātnes padomes fundamentālo un lietišķo projektu finansējuma
sadale starp zinātnes nozarēm 2005.gadā apstiprināts ar LZP 2004.g. 6. jūnija
lēmumu Nr. 4-1-2 un 2005.g. 25. janvāra lēmumu Nr. 1-1-1 [Latvian Council
of Science of fundamental and applied project finance breakdown in 2005
Confirmed by LCS 2004 6th June Decision No. 4-1-2 and 2005 25th January No
decision. 1-1-1 (in Latvian) (available on
http://www.lzp.gov.lv/parskati/Proj_2005/PRJ05-2.HTM)]
Latvijas Zinātnes padomes 2011.gadā finansētie fundamentālo un lietišķo
pētījumu projekti saskaņā ar LZP 06.01.11.g. lēmumu Nr.7-1-230 [Latvian
Science Council funded fundamental and applied research projects in 2011
under the LCS 06.01.11.g. decision No.7-1-230 (available on
http://www.lzp.gov.lv/parskati/Fin-2011.htm (in Latvian)]
Pārskats par valsts pētījumu programmas enerăētikā “Inovatīvas enerģijas
resursu ieguves un izmantošanas tehnoloģijas un zema oglekļa emisiju
nodrošināšana ar atjaunojamiem energoresursiem, atbalsta pasākumi vides un
klimata degradācijas ierobežošanai 2. etapa izpilde”, 2011 [Overview of
national research programs in the energy sector "Innovative energy resource
extraction and use of technology and the provision of low-carbon renewable
energy, support measures for environmental degradation and climate (second
phase of execution)" (in Latvian) (available on
http://www.innovation.lv/fei/projects/VPP_energetika_atskaite_2011.pdf)]

Enhancing comparability of data on estimated budgetary support and tax expenditures for fossil fuels
August 2014 168
Public investments in energy infrastructure
N.a.
No entries in the State Aid Register of the European Commission were found.
Tax expenditures
Excises and other specific taxes on energy use
Name of the tax
scheme and short
description
Excise taxes are imposed on both oil products and natural gas.
Summary of fuels
and use(r)s to
which reduced
rates or exemptions
applied in the
reporting years
Diesel used as fuel for transport in agriculture is subject to
the excise tax exemption.
Excise tax exemption for oil products for industrial
consumers and excise tax reduction for petroleum, fuel
oil and diesel oil used for heating.
Oil products used in Special Economic Zones for (1) ships
and other floating vessels that are not used for leisure
and entertainment, (2) vessels used for the construction,
testing and maintenance needs, (3) ships and other
floating vessels used for waterway dredging and
expansion works, (4) production of electricity and CHPs,
which produce electricity and heat are fully exempted
from the excise tax.
Oil products used in domestic shipping except for private
leisure and entertainment are exempted from the excise
tax.
Oil products which individuals import for their own
consumption (one full vehicle standard fuel tank
additionally to fuel portable tank with no more than 10
liters per vehicle) from non-EU countries is subject to
excise tax exemption.
From July 1, 2011 till December 31, 2013 greenhouses
and industrial poultry rising were granted a full excise tax
rebate for natural gas used for heating.
From July 1, 2011 till December 31, 2013 a number of
industries were granted a full excise tax exemption for
natural gas used for industrial manufacturing and other
processes related to it, the processing of agricultural raw
materials, and technology required to maintain indoor
climate of industrial and agricultural raw material
processing premises.
Natural gas use was granted excise tax rate exemption till
30.06.2011.
Amount calculated Total per unit of energy per unit of CO2

Enhancing comparability of data on estimated budgetary support and tax expenditures for fossil fuels
August 2014 169
(benchmark:
highest excise per
unit of energy
consumption)
2005: € 480 mln
2011: € 371 mln
2005: € 3.88 / GJ
2011: € 3.09 / GJ
2005: € 52.93 / ton
2011: € 42.64 / ton
Amount calculated
(benchmark:
highest excise per
unit of CO2
emissions)
Total per unit of energy per unit of CO2
2005: € 480 mln
2011: € 371 mln
2005: € 3.88 / GJ
2011: € 3.09 / GJ
2005: € 52.93 / ton
2011: € 42.64 / ton
Amount calculated
(benchmark:
proposal new
energy taxation
directive)
Total per unit of energy per unit of CO2
2005: € 246 mln
2011: € 136 mln
2005: € 1.99 / GJ
2011: € 1.14/ GJ
2005: € 27.17 / ton
2011: € 15.68 / ton
Information
sources
1. Law On Excise Duties (in force since 01.05.2004)
2. Law On Excise Duties (in force since 12.12.2008)
3. Law On Application of Taxes in Free Ports and Special
Economic Zones (in force since 01.01.2002)
4. Regulations of Cabinet of Ministers of Latvia No.344
"Kārtība, kādā no akcīzes nodokļa atbrīvo dīzeļdegvielu
(gāzeļļu), ko izmanto lauksaimniecības produkcijas
ražošanai, lauksaimniecības zemes apstrādei un meža vai
purva zemes apstrādei, kurā kultivē dzērvenes vai
mellenes, kā arī zemes apstrādei zem zivju dīķiem"
(Procedures on exemption from excise duty diesel (gas
oil), which is used for agricultural production, agricultural
processing and forest and swamp land, is cultivated
cranberries or blueberries, as well as to process soil
underneath the fish ponds ) (in force since 03.05.2011.)
5. Database of the State Revenue Service of Latvia available
on
http://www.vid.gov.lv/default.aspx?tabid=11&id=401&hl
=1&lIzveleId=563&periodsId=1168;
6. Regulations of Cabinet of Ministers of Latvia No.177 "Par
Koncepciju par akcīzes nodokļa atvieglojumu vai
kompensācijas mehānismu zemniekiem, iegādājoties
dīzeļdegvielu" (The concept of the excise tax relief or
compensation mechanism for farmers for purchasing
diesel ) (in force since 29.03.2010.)
7. Report by Ministry of Finance of Latvia „Par iespēju valsts
budžeta apakšprogrammas „Akcīzes nodokļa par
dīzeļdegvielu atmaksāšana zemniekiem” līdzekļus

Enhancing comparability of data on estimated budgetary support and tax expenditures for fossil fuels
August 2014 170
atspoguļot pārskatā atbilstoši šo līdzekļu ekonomiskajai
būtībai” available on
www.mk.gov.lv/doc/2005/FMZino_240409_lauk.1320.do
c (23.04.2009.)
8. Regulations of Cabinet of Ministers No.559 (14.08.2012.)
on Regulations on Climate Change Financial Instrument
projects funded by open competition "Complex solutions
to reduce greenhouse gas emissions' (Klimata pārmaiņu
finanšu instrumenta finansēto projektu atklāta konkursa
"Kompleksi risinājumi siltumnīcefekta gāzu emisiju
samazināšanai" nolikums)
9. No data on diesel consumptions (tonns/year) were found
on diesel oil consumption for agriculture transport,
therefore this figure was obtained calculating it
backwards from financial amount compensated to end
users based on data from sources listed above.
10. The movement of oil products in 2006 (Naftas produktu
(degvielas) aprite 2006.gadā) available on
http://www.vid.gov.lv/default.aspx?tabid=11&id=402&hl
=1&lIzveleId=1551&periodsId=5735
11. The movement of oil products in 2011 (Naftas produktu
(degvielas) aprite 2011.gadā) available on
http://www.vid.gov.lv/default.aspx?tabid=11&id=402&hl
=1&lIzveleId=1551&periodsId=5735
12. State Revenue Service has estimated the average
annual amount of oil products imported by individuals
and it has been used as basis for calculations [24]. The
benchmark against which this tax expenditure is
calculated is the excise tax rate on unleaded gasoline.
13. Regulations of Cabinet of Ministers of Latvia No.457
"Noteikumi par dabasgāzes apriti un akcīzes nodokļa
piemērošanas kārtību" (Regulations on natural gas
movement and excise tax application) (in force since
01.07.2011.)
14. The Central Statistical Bureau does not provide detailed
data on natural gas consumption for greenhouses and
industrial poultry rising. Natural gas consumption
calculations are based on information available from
different sources:
Information sheet of the Agriculture
Organizations Cooperation Board (LOSP) available
on
www.losp.lv/sites/default/files/.../infolapa_16_23
_4_2010.doc
Pollution permission No. RI11IA0009 issued to
poultry rising factory Ķekava by Latvia
Environmental Office available on

Enhancing comparability of data on estimated budgetary support and tax expenditures for fossil fuels
August 2014 171
www.vpvb.gov.lv/lv/piesarnojums/a-b-
atlaujas/?download=2576
Pollution permission No. Nr. JET- 4- 017A issued
to poultry rising factory Balticovo by Latvia
Environmental Office available on
www.vpvb.gov.lv/lv/piesarnojums/a-b-
atlaujas/?download=1722
15. Regulations of Cabinet of Ministers of Latvia No.457
"Noteikumi par dabasgāzes apriti un akcīzes nodokļa
piemērošanas kārtību" (Regulations on natural gas
movement and excise tax application) (in force since
01.07.2011.)
16. Database of the the Central Statistical Bureau of Latvia
available on www.csb.gov.lv.
17. Energy balances of non-oecd countries (2013 edition)
for Latvia, 2005 and 2011, International Energy Agency
Value Added Tax
Categories of
energy supply to
which a reduced
VAT rate was
applied in one or
both of the
reporting years
VAT Tax Reduction for Natural Gas for Households
Natural gas used by households was subject to lower VAT tax
rates from July, 2006 until July 1, 2011.
In 2005 the standard VAT rate was applied to natural gas for
households.
Standard rate 2005: 18%
2011: 22%
Reduced rate 2005: n.a.
2011: 12%
Amount of
support
calculated
(refer to Excel
file)
Total per unit of energy per unit of CO2
2005: -
2011: € 4.3 mln
2005: -
2011: € 0.31 / GJ
2005: -
2011: € 2.88 /
ton
Information
sources 1. Law On Value Added Tax (in force since 09.03.1995.)
2. Naural gas consumption: IEA Energy Balances for
Latvia for 2005 and 2011.
3. Natural gas prices EUROSTAT
(http://ec.europa.eu/geninfo/legal_notices_en.htm).
4. Regulations of Cabinet of Ministers No.559

Enhancing comparability of data on estimated budgetary support and tax expenditures for fossil fuels
August 2014 172
(14.08.2012.) on Regulations on Climate Change
Financial Instrument projects funded by open
competition "Complex solutions to reduce greenhouse
gas emissions' (Klimata pārmaiņu finanšu instrumenta
finansēto projektu atklāta konkursa "Kompleksi
risinājumi siltumnīcefekta gāzu emisiju
samazināšanai" nolikums)
Tax expenditures in social contributions and personal income taxes
N.a.
Tax expenditures in corporate income taxes
N.a.
Tax expenditures in royalties
N.a. In Latvia no fossil minerals for energy use are extracted. Peat as the only mineral
is extracted for agriculture and gardening purposes.

Enhancing comparability of data on estimated budgetary support and tax expenditures for fossil fuels
August 2014 173
Lithuania
Reporting years: 2001 and 2011
Direct budgetary support to consumers/users
N.a.
Direct budgetary support to producers
Direct budgetary support to primary producers
N.a.
Direct budgetary support for R&D purposes
There are two national action programmes (1st Action Program for Development of
Human Resources and 2nd Action Program for Economic Growth). Up to now no fossil
fuel related projects were financed under these programmes.
Public investments in energy infrastructure
Name of the
scheme and
short
description
Regional Development Guidelines: Sectorial Measure for Energy.
The scheme consists of six sub-measures. One of them is
‘development of the natural gas system’.
Final
beneficiary
Final natural gas consumers.
Direct
beneficiary
Eligible beneficiaries of the scheme are private legal entities, state
enterprises and municipal enterprises.
Sub-measure "Development of the natural gas system" provided
grants to entities, which owned natural gas tranmission network,
i.e. AB "Amber Grid".
Aid category Regional development
Objectives The sub-measure ‘Development of the natural gas system aims at
modernising the natural gas transmission system in order to
increase the reliability of natural gas supplies and creating
conditions for the preparation for the integration in the single
natural gas market of the EU.
Conditionality
for eligibility
The sub-measure ‘Development of the natural gas system’ is
available to natural gas transmission system operators which build
and modernize the natural gas transmission network. The scheme
requires that a beneficiary maintains the investment in the territory
of Lithuania for a minimum period of five years (three years in case
of SMEs) after its completion.
Conditionality
for magnitude
of subsidy
50% Gross Grant Equivalent (GGE) is the maximum aid intensity
and 40 million LTL (11.6 million EUR) is the maximum support
under the sub-measure ‘Development of the natural gas system’.
Source of The beneficiary needs to provide a contribution of at least 25% of
the value of the total eligible costs. The scheme is financed using

Enhancing comparability of data on estimated budgetary support and tax expenditures for fossil fuels
August 2014 174
funding both resources from the Structural Funds and financial resources
from various legal entities. Support from the State budget is not
foreseen.
Fuel Natural gas.
Total amount Support to natural gas transmission system operator is provided
since 2012.
Financial resources from State budget was 0 LTL (0 EUR).
Information
sources
1. Lithuanian State aid register
http://ec.europa.eu/competition/elojade/isef/index.cfm?clea
r=1&policy_area_id=3.
2. Sub-measure "Development of the natural gas system" //
http://www.esparama.lt/priemone?priem_id=000bdd53800
0a981.
Tax expenditures
Excises and other specific taxes on energy use
Name of the
tax scheme
and short
description
Excise tax. From 1994 until 2002, excise tax was applied to a small share of
energy products produced in and imported to Lithuania.
Since 1 July 2002 a new edition of Law on Excise Tax came into force. It
implemented the main provisions of EU laws regarding the method how alcohol,
tobacco, energy products and electricity must be taxed. In 2010 the Law on
Excise Tax was replaced. Excise tax system was harmonized with EU provisions.
Currently, Law on Excise The prevailing excise tax rates on energy products,
coal and electricity in Lithuania meet or exceed the minimum rates set out in
Directive 2003/96/EEC. The only exception for the 2011 rates is for natural gas
for which Lithuania had an exemption based upon article 15(g) of this Directive
(until the end of 2013).
Summary of
fuels and
use(r)s to
which
reduced
rates or
exemptions
applied in the
reporting
years
In 2001, excise tax was applied to motor gasoline, jet fuels, kerosene, gasoil
(diesel), fuel oil, liquefied gases for transport and electricity. Only gasoil
(diesel) used in agricultural sector was exempted from an excise tax. Excise
taxes were not differentiated.
The following exemptions to excise tax were in force in 2011:
natural gas (if it wasn't used in transport),
fuel used by aviation and shipping (both international and domestic?);
LPG if it was poured to home gas cylinders or supplied to households;
gasoil if it was used in agriculture or fishing activities.
.,Reduced rates were applied to
gasoil and fuel oils used for heating;
fuel oils that satisfied certain criteria set by the Government;
coal, lignite and coke used for business needs (taxed by 50% lower rate
compared to the standard rate).;
Amount total per unit of energy per unit of CO2

Enhancing comparability of data on estimated budgetary support and tax expenditures for fossil fuels
August 2014 175
calculated
(benchmark:
highest
excise per
unit of
energy
consumption)
2001: € 439 mln
2011: € 794 mln
2001: € 3.59 / GJ
2011: € 5.50 / GJ
2001: € 51.82 / ton
2011: € 79.16 / ton
Amount
calculated
(benchmark:
highest
excise per
unit of CO2
emissions)
total per unit of energy per unit of CO2
2001: € 439 mln
2011: € 794 mln
2001: € 3.59 / GJ
2011: € 5.50 / GJ
2001: € 51.82 / ton
2011: € 79.16 / ton
Amount
calculated
(benchmark:
proposal new
energy
taxation
directive)
total per unit of energy per unit of CO2
2001: € 357 mln
2011: € 208 mln
2001: € 2.91 / GJ
2011: € 1.44 / GJ
2001: € 42.09 / ton
2011: € 20.71 / ton
Information
sources
1. Lithuanian Statistics (2006). Fuel and energy balances 2001-2005.
Vilnius.
2. Lithuanian Statistics (2012). Fuel and energy balance 2011. Vilnius.
3. International Energy Agency. Energy Balances of non-OECD countries,
2001-2002 and 2010-2011: Lithuania.
4. Law on Excise Tax (1994) //
http://www3.lrs.lt/pls/inter3/dokpaieska.showdoc_l?p_id=145304&p_tr2
=2.
5. Law on Excise Tax (2010) //
http://www3.lrs.lt/pls/inter3/dokpaieska.showdoc_l?p_id=389313&p_tr2
=2.
6. Konstantinaviciute et al. (2012). Assessment of country-specific CO2
emission factors for Lithuanian fuel combustion sector: study. Kaunas.
7. Lithuanian Statistics (2014) // http://osp.stat.gov.lt/temines-lenteles39;
http://osp.stat.gov.lt/web/guest/statistiniu-rodikliu-
analize?portletFormName=visualization&hash=58a15338-fadd-4050-
8e57-738e052cb5d5.
8. Lithuanian District Heating Association (2012) //
http://www.lsta.lt/files/statistika/2011_statistika.pdf.

Enhancing comparability of data on estimated budgetary support and tax expenditures for fossil fuels
August 2014 176
Volume of fossil fuels followed under the categories "Non-energy use",
"Transfers" "Distribution losses" and part of "Energy industry own use" were
not assessed. The reason for this is that specific fuels (shale oil, sulphur from
petroleum, paraffin, waxes, lubricants, bitumen, petroleum coke, refinery gas)
fall under the categories or because fuels were not actually consumed /
combusted. For assessment of electricity tax expenditures, volume of electricity
used in CHPs, heat plants and energy industries were taken from Lithuanian
Statistics (2006; 2012). Volume of oil products and coal was disaggregated
based on the data provided by Lithuanian Statistics (2006; 2012). Fuels used
for electricity production were not included in the assessment of tax
expenditures. Volume of fuels used for electricity production was calculated
considering to total fuels used in CHPs (data are provided by Lithuanian
Statistics and IEA) and fuels used for heat production (data are provided by
Lithuanian District Heating Association).
Value Added Tax
N.a. The standard VAT rate is applied to all types of fossil fuels and electricity.
Tax expenditures in social contributions and personal income taxes
N.a.
Tax expenditures in corporate income taxes
The Law on Profit Tax (2001; 2010) states that a standard profit tax rate was 24% in
2001 and 15% in 2011. The Law (2010) also foresaw profit tax concessions. Fossil fuel
related companies (including gas and oil extracting companies) could use tax
concessions if they satisfied determined criteria. However, these concessions were not
specifically related to fossil fuel related companies. Contrary, the list of activities,
where concessions could be applied says that companies which executed wholesale
and retail trade of oil products cannot use concessions. The Law on Profit Tax (2010)
also provides general rules for taxation of profit from fossil fuel related activities.
General provisions and principles are provided to all economic activities for
amortization of fixed asset. The 12th Business Accounting Standard "Non-current
tangible asset" is applied when recording non-current tangible assets, in accounting,
calculating their acquisition (production) cost and depreciation. The Law states that
non-current tangible assets used in the exploration and extraction of non-renewable
natural resources (gas and oil), are recorded in accounting in the manner established
by this standard.
Tax expenditures in royalties
The Law on Taxation of State's Natural Resources (2001; 2011) states that natural
mineral substances are subject for a tax. Based on this Law extracted peat is taxed at
a standard rate of 0.62 Lt/m3 (0.18 EUR/m3). Extracted peat, which is used in
sanatoriums and other health facilities for treatment purposes, is not taxed (but this
does not imply fossil fuel support, since the peat is not used as a fuel in this case).
The Law on Taxation of Oil and Gas (1996; 2003) states that gas and oil extracted in
Lithuanian territory and in its economic zone in the Baltic sea, is subject to a tax. In
2001, the basic tax rate was 20% of the selling price of extracted gas and oil. The
basic tariff was enlarged by 9 percentage points if oil and gas was extracted from
fields, which were explored using State's financial resources. If fields were partially
explored by State, then an additional 9% tax rate was proportionally reduced

Enhancing comparability of data on estimated budgetary support and tax expenditures for fossil fuels
August 2014 177
considering to amount of financial resources provided by entities. In 2003 the taxation
system was changed and updated, although the general tax structure remained the
same. In 2011, two basic tariff rate schemes were available. If oil and gas was
extracted in the fields, which were explored till 1 July 2003, then a 20% basic tax rate
is applied. If oil and gas was extracted in the fields, which were explored after 1 July
2003, the basic tariff rate is differentiated depending on the field location and
extracted volume. In 2011, basic tariff rates varied in a range of 2-16%. A 9%
compensatory tax rate was additionally applied if State's financial resources were used
to explore the field. The amount of taxes can be reduced by 50% if company posted
money to explore new fields. Based on the assessments (Simonyte, 2011) if oil and
gas compensatory tax rate was increased by 20-30%, then the State budget would
additionally have received 6-11 million LTL (1.7-3.2 million EUR). If 20% basic tax
rate would be applied to all companies, then 0.5 million LTL (0.2 million EUR) would
be additionally received by the State. If concession would be removed, then 0.5
million LTL (0.2 million EUR) would be additionally received by the State budget too.
471 thousand tons (2001) and 107.7 thousand tons (2011), of oil were extracted
(Lithuanian Statistics, 2012). Total amount of taxes paid to State's budget was 7.8
million Lt (2.3 million EUR) in 2011 (Lithuanian Statistics, 2014).
References
Law on Taxation of State's Natural Resources (2011) //
http://www3.lrs.lt/pls/inter3/dokpaieska.showdoc_l?p_id=387457.
Law on Taxation of State's Natural Resources (2001)
http://www3.lrs.lt/pls/inter3/dokpaieska.showdoc_l?p_id=112606.
Lithuanian Statistics (2012). Gamtos ištekliai ir aplinkos apsauga 2011 [Natural
resources and environment protection in 2011]. ISSN 2029-5952.
Law on Taxation of Oil and Gas (1996) //
http://www3.lrs.lt/pls/inter3/dokpaieska.showdoc_l?p_id=28213.
Law on Taxation of Oil and Gas (2003) //
http://www3.lrs.lt/pls/inter3/dokpaieska.showdoc_l?p_id=212201
I.Šimonytė: didesnis naftos mokestis – ne išsigelbėjimas [I. Simonyte: higher
tax on oil is not a solution] // http://www.veidas.lt/i-simonyte-didesnis-naftos-
mokestis-ne-issigelbejimas.
Lithuanian Statistics (2014). Collected taxes on extracted gas and oil in
Lithuania in 2011 // http://osp.stat.gov.lt/web/guest/statistiniu-rodikliu-
analize?portletFormName=visualization&hash=9f206d47-51b4-4566-9777-aa72bc74620d.

Enhancing comparability of data on estimated budgetary support and tax expenditures for fossil fuels
August 2014 178
Luxembourg
Reporting years: 2005 and 2010
Direct budgetary support to consumers/users
N.a.
Direct budgetary support to producers
Direct budgetary support to primary producers
N.a.
Direct budgetary support for R&D purposes
The IEA Database does not report any expenditures on government R&D for fossil
fuels in the reporting years.
Public investments in energy infrastructure
N.a.
Tax expenditures
Excises and other specific taxes on energy use
The current basic legislation governing excise taxes in Luxembourg are the Loi du 17
décembre 2010 fixant les droits d’accise et les taxes assimilées sur les produits
énergétiques, l’électricité, les produits de tabacs manufacturés, l’alcool et les boissons
alcooliques and the Règlement grand-ducal du 17 décembre 2010 fixant les taux
applicables en matière de droits d’accise autonomes sur les produits énergétiques.
The current implementation is modified by the Règlement grand-ducal du 16
décembre 2011 fixant les taux applicables en matière de droits d'accises autonomes
sur les produits énergétiques and the Règlement grand-ducal du 21 juillet 2012 fixant
les taux applicables en matière de droits d’accises autonomes sur les produits
énergétiques.
For each year, the actual excise rates can be obtained from the freely available
“Tableau synoptique des taux d'accise en euros” on the website of the Administration
des Douanes et Accises
(http://www.do.etat.lu/acc/Taux_droits_accise/Luxembourg.htm).
Summary of fuels and use(r)s to
which reduced rates or
exemptions applied in the
reporting years
The excise tariffs for energy products are
differentiated according to:
Fuel type: leaded and unleaded gasoline
(according to sulphur content), gasoil
(according to sulphur content), heavy fuel
oil, biofuels, LPG/methane, natural gas,
coal/cokes and electricity).

Enhancing comparability of data on estimated budgetary support and tax expenditures for fossil fuels
August 2014 179
Application: motor fuel, industrial/commercial
use, heating
Moreover, there are specific reductions. The most
important are:
For gasoil used in agriculture and horticulture,
pisciculture and silviculture, the rates are
zero.
For natural gas used as motor fuel or used in
electricity generation, the rates are also
zero.
In transport, gasoline for road transport is subject
to the highest rate.
Amount calculated (benchmark:
highest excise per unit of
energy consumption)
year: 2005
year: 2010
total per unit of
energy
per unit of CO2
€ 529 mln
€ 422 mln
€ 3.22 / GJ
€ 3.00 / GJ
€ 42.53 / ton
€ 38.66 / ton
Amount calculated (benchmark:
highest excise per unit of CO2
emissions)
year: 2005
year: 2010
total per unit of
energy
per unit of CO2
€ 529 mln
€ 422 mln
€ 3.22 / GJ
€ 3.00 / GJ
€ 42.53 / ton
€ 38.66 / ton
Amount calculated (benchmark:
proposal new energy taxation
directive)
year: 2005
year: 2010
total per unit of
energy
per unit of CO2
€ 318 mln
€ 190 mln
€ 1.93 / GJ
€ 1.35 / GJ
€ 25.56 / ton
€ 17.40 / ton
Information sources IEA, Energy prices and taxes
Tableau des taux d'accise applicables au Grand-
Duché de Luxembourg à partier du 1er février 2010
https://www.iea.org/co2highlights/co2highlights.pdf
Taxing Energy Use
e-mail correspondence
Value Added Tax
Categories of energy supply to
which a reduced VAT rate was
LPG for road transport

Enhancing comparability of data on estimated budgetary support and tax expenditures for fossil fuels
August 2014 180
applied in one or both of the
reporting years
Diesel (residential clients)
LPG (residential clients)
Natural gas (residential clients)
Coal (residential clients)
Electricity (residential clients)
Standard rate 2005 and 2010: 15%
Reduced rate 2005 and 2010:
LPG road: 6%
Diesel (res.): 12%
LPG (res.): 6%
Natural gas (res.): 6%
Coal (res.): 12%
Electricity (res): 6%
Amount of support calculated
2005: EUR 11 mln
2010: EUR 14 mln
Information sources For sources:
IEA, Energy prices and taxes
Tableau des taux d'accise applicables au Grand-
Duché de Luxembourg à partier du 1er février 2010
https://www.iea.org/co2highlights/co2highlights.pdf
Taxing Energy Use
e-mail correspondence
see excel documents.
Assumptions:
Where retail prices in Luxemburg were
missing, Belgian prices were applied
In line with TEU, it is assumed that 80% of
diesel is consumed by foreign professional
users (and is therefore recovered)
Tax expenditures in social contributions and personal income taxes
N.a.

Enhancing comparability of data on estimated budgetary support and tax expenditures for fossil fuels
August 2014 181
Tax expenditures in corporate income taxes
N.a.
Tax expenditures in royalties
To the best of our knowledge, the tax legislation in Luxemburg does not contain
specific provisions on royalty regimes for the extraction of natural resources.
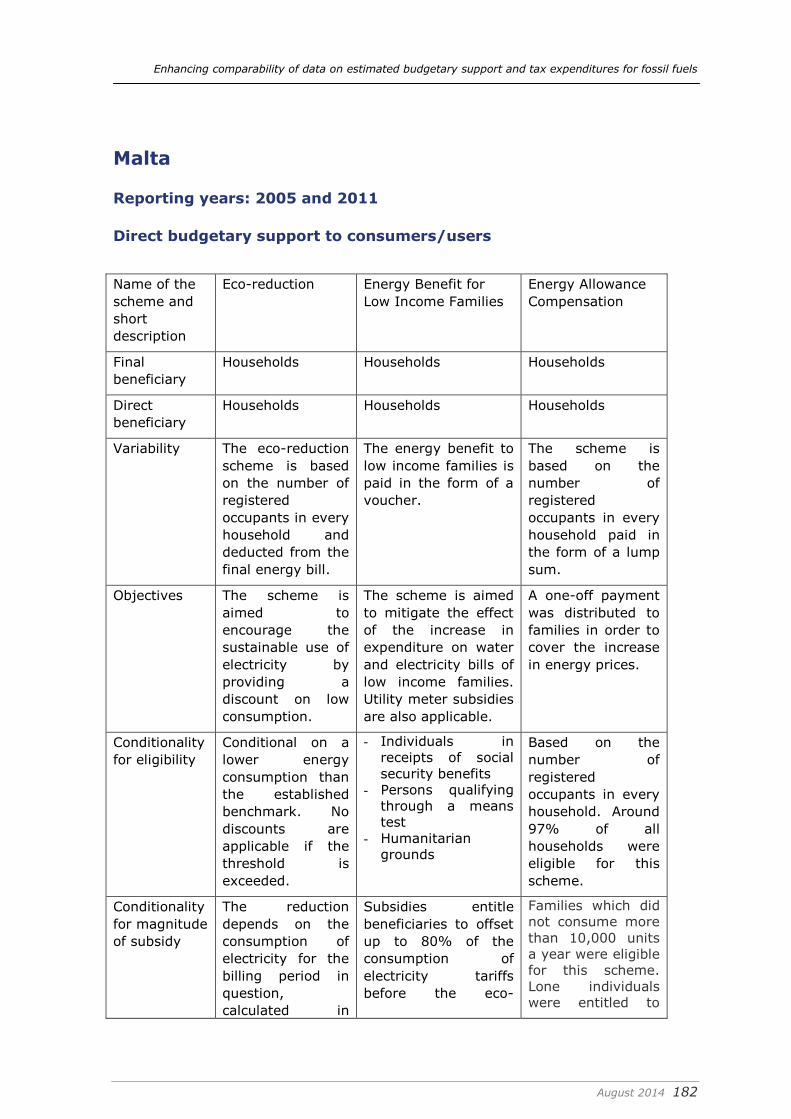
Enhancing comparability of data on estimated budgetary support and tax expenditures for fossil fuels
August 2014 182
Malta
Reporting years: 2005 and 2011
Direct budgetary support to consumers/users
Name of the
scheme and
short
description
Eco-reduction Energy Benefit for
Low Income Families
Energy Allowance
Compensation
Final
beneficiary
Households Households Households
Direct
beneficiary
Households Households Households
Variability The eco-reduction
scheme is based
on the number of
registered
occupants in every
household and
deducted from the
final energy bill.
The energy benefit to
low income families is
paid in the form of a
voucher.
The scheme is
based on the
number of
registered
occupants in every
household paid in
the form of a lump
sum.
Objectives The scheme is
aimed to
encourage the
sustainable use of
electricity by
providing a
discount on low
consumption.
The scheme is aimed
to mitigate the effect
of the increase in
expenditure on water
and electricity bills of
low income families.
Utility meter subsidies
are also applicable.
A one-off payment
was distributed to
families in order to
cover the increase
in energy prices.
Conditionality
for eligibility
Conditional on a
lower energy
consumption than
the established
benchmark. No
discounts are
applicable if the
threshold is
exceeded.
- Individuals in
receipts of social
security benefits
- Persons qualifying
through a means
test
- Humanitarian
grounds
Based on the
number of
registered
occupants in every
household. Around
97% of all
households were
eligible for this
scheme.
Conditionality
for magnitude
of subsidy
The reduction
depends on the
consumption of
electricity for the
billing period in
question,
calculated in
Subsidies entitle
beneficiaries to offset
up to 80% of the
consumption of
electricity tariffs
before the eco-
Families which did
not consume more
than 10,000 units
a year were eligible
for this scheme.
Lone individuals
were entitled to

Enhancing comparability of data on estimated budgetary support and tax expenditures for fossil fuels
August 2014 183
accordance on a
pro-rata basis of
the relative annual
cumulative
consumption. For
single person
households, a
25% discount on
all electricity
consumption is
given, if less than
2,000 units per
year are
consumed. For
two or more
person
households, if
consumption does
not exceed 1,750
units per person
annually,
25% discount
applies on the first
1,000 units and a
15% on the
remaining 750
units or part
thereof is
applicable.
reduction. €55, a household
of two benefitted
from €80, three
people from €105,
four people from
€130, five people
from €155, while a
household of six
individuals was
entitled to €180.
Source of
funding
The general
government
budget.
The general
government budget.
The general
government
budget.
Fuel Subsidy is not
limited to a
specific fuel. Since
energy use in
Malta is almost
100% fossil fuel
based, the support
can be mainly
attributed to fossil
fuels.
Subsidy is not limited
to a specific fuel.
Since energy use in
Malta is almost 100%
fossil fuel based, the
support can be mainly
attributed to fossil
fuels.
Subsidy is not
limited to a specific
fuel. Since energy
use in Malta is
almost 100% fossil
fuel based, the
support can be
mainly attributed
to fossil fuels.
Total amount 2010: €11.3 mln*
2011: €10.8mln*
2011: €4.6mln Subsidy was only
given as a one-off
allowance in 2010.
2010: €11mln
Information
sources
House of
Representatives
Department of
Information (2010)
Department of
Information (2010)

Enhancing comparability of data on estimated budgetary support and tax expenditures for fossil fuels
August 2014 184
(2011)*
Oosterhuis et al.
(2013)
ARMS Ltd (2014)
House of
Representatives
(2012)
Oosterhuis et al.
(2013)
House of
Representatives
(2010)
Oosterhuis et al.
(2013)
Notes:
* Efforts to obtain data from ARMS Ltd have proved futile. However, an answer
to Parliamentary Question 28080 of 2011 shows that in 2010, €11.3 million
were deducted from energy bills. In 2011, €6.3 milion were deducted till July
of the same year. Therefore an average was taken: €6.3 milion/7months =
€0.9million/month. This figure was then multiplied by 12 (months) to give the
estimate of €10.8mln for 2011.
An answer to Parliamentary Question 33377 of 2012 shows that in 2011,
€4,596,498 million were subsidisied through energy benefit vouchers. Efforts
to obtain data from ARMS Ltd proved futile.
References:
ARMS Ltd (2014). Tariff Prices. Available at:
https://www.smartutilities.com.mt/wps/portal/Public%20Area/Services/TariffPrice
s/!ut/p/c5/hY1LDoIwGITP4gn-oYXqlhRTCqaU8BDZkC4MaSLgwnh-
IW7cqDPLbx7U0-rZPf3oHn6Z3Y066sUQiIa3uQoAlSXQ0ias5hFHzlZ-
EYNUcRruT0DBWoCZqCrRVBya_2mft7-PhDL2CB1mB1nWYIXGm__a3zi-
KAaZdJmudJ86eDvuXtvzLJk!/dl3/d3/L2dBISEvZ0FBIS9nQSEh/.
Department of Information (2010) Diary of Events. Available at: http://www.doi-
archived.gov.mt/EN/archive/diaryofevents/2010doc.pdf.
House of Representatives (2010). One time payment subsidy. Available at:
http://www.pq.gov.mt/PQWeb.nsf/10491c99ee75af51c12568730034d5ee/c1256e
7b003e1c2dc12577c20042bd2b?OpenDocument.
House of Representatives (2011). Persuni ntitolati għal Eco-contribution. Available at:
http://www.pq.gov.mt/PQWeb.nsf/10491c99ee75af51c12568730034d5ee/c12578
81003b3b78c1257961002f436a?OpenDocument.
House of Representatives (2012). Arms Ltd - energy benefits. Available at:
http://www.pq.gov.mt/PQWeb.nsf/10491c99ee75af51c12568730034d5ee/c12578
81003b3b78c12579ce002cfa56?OpenDocument.
Oosterhuis, F., Alexandru, R., Blumberga, A., Bobinaite, V., Cauchi, J., Nikolova, N.,
Papyrakis, E. (2013). Budgetary support and tax expenditures for fossil fuels: An
inventory for six non - OECD EU countries. Available at:
http://ec.europa.eu/environment/enveco/taxation/pdf/fossil_fuels.pdf.

Enhancing comparability of data on estimated budgetary support and tax expenditures for fossil fuels
August 2014 185
Direct budgetary support to producers
Direct budgetary support to primary producers
N.a.
Direct budgetary support for R&D purposes
N.a.
Public investments in energy infrastructure
Final beneficiary Enemalta (State-owned)
Direct beneficiary Enemalta (State-owned)
Aid category Services of general economic interest
D - Electricity, gas, steam and air conditioning
supply
Variability Lump sum grant
Objectives Malta planned to support the modification of
boilers 1 and 2 at the Delimara power station.
to meet its obligations to reduce nitrogen oxide
(NOx) and dust emissions under the Large
Combustion Plants (LCP) Directive 2001/80/EC
and the Integrated Pollution Prevention and
Control (IPPC) Directive 2008/1/EC, which
requires the application of the best available
technologies for large plants.
Conditionality for eligibility Investment was meant unconditionally for
Delimara power station to reduce the
investment costs of meeting the existing
environmental standards applicable to large
combustion plants across the EU.
Conditionality for
magnitude of subsidy
Investment was meant unconditionally for
Delimara power station to reduce the
investment costs of meeting the existing
environmental standards applicable to large
combustion plants across the EU.
Source of funding The Maltese authorities planned to finance
€15.5 million (i.e. 84.7%) from regional funds
put at its disposal by the EU. The remainder
€2.8 million would have been financed by a
commercial loan with a government guarantee
at market prices
Fuel Subsidy not limited to some specific fuels
Total amount €18.3 million
The European Commission closed formal investigation procedures after Malta withdrew
notification and did not pursue project further. The support is therefore not reported in
the ‘direct budgetary support’ table in the main report of the present study.
Source:

Enhancing comparability of data on estimated budgetary support and tax expenditures for fossil fuels
August 2014 186
European Commission, DG Competition (2009). SA.29427 Environmental Project for
Delimara Power Station. Available at:
http://ec.europa.eu/competition/elojade/isef/case_details.cfm?proc_code=3_SA_2942
7.
Final beneficiary Enemalta (State-owned)
Direct beneficiary Enemalta (State-owned)
Investments on electricity transmission
and interconnector infrastructure
Aid category Execution of an important project of
common European interest
D.35.13 - Distribution of electricity
Objectives The first project is the design and
construction of one high voltage sub-
sea interconnector rated at 200MVA
between Pembroke in Malta and Marina
Di Ragusa in Sicily, with an option for a
second similar interconnector to be
installed at a later date. The shore
installations shall be appropriately sized
for both interconnectors and the first
interconnector is required to be in
service before the end of 2012. The
Tender shall include all required works
to deliver a fully functioning and ope
rational interconnector, including
theobtaining of all administrative
permits and approvals.
The second project is the extension of
the 132kV distribution network in order
to connect to the interconnector at a
newly equipped distribution centre at
Kappara to transmit and distribute the
electricity imported. Although by 2015
the distribution centre could also
connect a planned offshore large (c.100
MW) windfarm planned for construction
at Sikka l-Badja, the establishment of
the distribution centre for imported
electricity is a pre- condition for the
operation of the subs ea
interconnection with Sicily by 2012 at
the latest, so that the project will
primarily serve this purpose
Conditionality for eligibility Investment meant unconditionally for
this project.
Conditionality for magnitude of
subsidy
Financing put into effect in 2010.
However, the government guarantee
component is envisaged to remain in
force until 2027. Like other costs of the
projects, the guarantee price will be

Enhancing comparability of data on estimated budgetary support and tax expenditures for fossil fuels
August 2014 187
subject to the 6.61% return and full
cost recovery requirements on
electricity tariffs.
Source of funding The financing of the projects is covered
by a combination of EU contributions
under the Regulation, equity
contributions from Enemalta (€10
million) and loans taken by Enemalta
Corporation at commercially negotiated
conditions, with the guarantee of the
Government of Malta for not more than
80% of the total capital I nvestment.
The terms of the loans are under
discussion with international financial
institutions, including the European
Investment Bank.
Fuel Subsidy not limited to some specific
fuels
Total amount €150 million – one time investment
The European Commission concluded that the project does not constitute aid. The
support is therefore not reported in the ‘direct budgetary support’ table in the main
report of the present study.
Source:
European Commission, DG Competition (2010). N419/2009 Investments in electricity
transmission and interconnector infrastructure. Available at:
http://ec.europa.eu/competition/elojade/isef/case_details.cfm?proc_code=3_N419_20
09.
Tax expenditures
Excises and other specific taxes on energy use
Name of the tax
scheme and short
description
Final energy use in Malta is subject to excise taxes. The rates are
differentiated by fuel and type of use. In 2005, electricity use
was not yet taxed.
Summary of fuels
and use(r)s to
which reduced
rates or
exemptions applied
in the reporting
years
Exempted:
Fuel oil and gas oil used for electric power generation (not within
the scope of this study)
Reduced rate:
Gas oil / diesel for non-transport use
Amount calculated
(benchmark:
highest excise per
total per unit of energy per unit of CO2
2005: € 348 mln 2005: € 7.78 / GJ 2005: € 109.19 / ton

Enhancing comparability of data on estimated budgetary support and tax expenditures for fossil fuels
August 2014 188
unit of energy
consumption)
2011: € 817mln 2011: € 11.84 /
GJ
2011: € 164.20 / ton
Amount calculated
(benchmark:
highest excise per
unit of CO2
emissions)
Total per unit of energy per unit of CO2
2005: € 348 mln
2011: € 817 mln
2005: € 7.78 / GJ
2011: € 11.84 /
GJ
2005: € 109.19 / ton
2011: € 164.20 / ton
Amount calculated
(benchmark:
proposal new
energy taxation
directive)
Total per unit of energy per unit of CO2
2005: € 6 mln
2011: € 1 mln
2005: € 0.14 / GJ
2011: € 0.01 / GJ
2005: € 1.97 / ton
2011: € 0.12 / ton
Information
sources
Malta Resources Authority (2014). Regulated tariffs. Available at:
http://mra.org.mt/regulated-tariffs/.
Enemalta (2013). Fuel Price Revisions. Available at:
http://www.enemalta.com.mt/newsDetails.aspx?id=18083.
IEA Energy Balances (Malta for 2010-2011) as provided by Frans
Oosterhuis
IEA Energy Balances (Malta for 2004-2005) as provided by Frans
Oosterhuis
IEA Extended World Energy Balances (Malta for 1999-2011) as
provided by Frans Oosterhuis
Eurostat Energy balance sheets - 2010-2011 - 2013 edition
Available at:
http://epp.eurostat.ec.europa.eu/cache/ITY_OFFPUB/KS-EN-13-
001/EN/KS-EN-13-001-EN.PDF.
Eurostat Energy balance sheets – 2004-2005 - 2007 edition
Available at:
http://epp.eurostat.ec.europa.eu/cache/ITY_OFFPUB/KS-EN-07-
001/EN/KS-EN-07-001-EN.PDF.
Malta Customs Department (2011) List of TARIC Codes with their
respective VAT and Excise Rates
Malta Customs Department (2005) Excise Duties 2005
Malta Customs Department (2005) List of TARIC Codes with their
respective VAT
Assumptions made in the calculations:

Enhancing comparability of data on estimated budgetary support and tax expenditures for fossil fuels
August 2014 189
For electricity, the given Eurostat values were used.
The price for LPG was calculated at Loose/kg (household
consumers usually mostly purchase a 12kg cylinder).
For 2005, some average prices could be found for motor fuels
and LPG, however they are not from an official source.
For 2005, all prices were changed from Maltese Lira to Euro
using the official conversion rate of 1 EUR = 0.4293 MTL.
IEA and Eurostat Energy Balances were mostly in line, however
to obtain a more disaggregate image of the fuels used, the
Eurostat balances had to be referred to. The numbers did not
always match up, however the differences in tonnes of oil
equivalent values were minimal.
Value Added Tax
Categories of energy
supply to which a
reduced VAT rate was
applied in one or both
of the reporting years
Electricity Supply
Standard rate 2005: 18%
2011: 18%
Reduced rate 2005: 5%
2011: 5%
Amount of support
calculated
(refer to Excel file)
total per unit of energy per unit of CO2
2005: € 5.89 mln
2011: € 12.67 mln
2005: € 0.43/ GJ
2011: € 1.22/ GJ
2005: € 4.36/ ton
2011: € 11.47/ ton
Information sources Sources of information:
VAT Department (various years) . Value Added Tax Act.
Available at: http://www.vat.gov.mt/en/VAT-
Information/VAT-Legislation/Pages/VAT-Legislation.aspx.
Malta Resources Authority (2014). Regulated tariffs. Available
at: http://mra.org.mt/regulated-tariffs/.
Enemalta (2013). Fuel Price Revisions. Available at:
http://www.enemalta.com.mt/newsDetails.aspx?id=18083.
IEA Energy Balances (Malta for 2010-2011) as provided by
Frans Oosterhuis

Enhancing comparability of data on estimated budgetary support and tax expenditures for fossil fuels
August 2014 190
IEA Energy Balances (Malta for 2004-2005) as provided by
Frans Oosterhuis
Eurostat Energy balance sheets - 2010-2011 - 2013 edition
Available at:
http://epp.eurostat.ec.europa.eu/cache/ITY_OFFPUB/KS-EN-
13-001/EN/KS-EN-13-001-EN.PDF.
Eurostat Energy balance sheets – 2004-2005 - 2007 edition
Available at:
http://epp.eurostat.ec.europa.eu/cache/ITY_OFFPUB/KS-EN-
07-001/EN/KS-EN-07-001-EN.PDF.
Malta Customs Department (2011) List of TARIC Codes with
their respective VAT and Excise Rates
Malta Customs Department (2005) Excise Duties 2005
Malta Customs Department (2005) List of TARIC Codes with
their respective VAT
Assumptions made in the calculations:
For electricity, the given Eurostat values were used.
The price for LPG was calculated at Loose/kg (household
consumers usually mostly purchase a 12kg cylinder).
For 2005, some average prices could be found for motor fuels
and LPG, however they are not from an official source.
For 2005, all prices were changed from Maltese Lira to Euro
using the official conversion rate of 1 EUR = 0.4293 MTL.
IEA and Eurostat Energy Balances were mostly in line,
however to obtain a more disaggregate image of the fuels
used, the Eurostat balances had to be referred to. The
numbers did not always match up, however the differences in
tonnes of oil equivalent values were minimal.
Tax expenditures in social contributions and personal income taxes
N.a.
Tax expenditures in corporate income taxes
N.a.
Tax expenditures in royalties
Oil exploration and production licences in Malta are awarded under Production Sharing
Contracts (PSC).

Enhancing comparability of data on estimated budgetary support and tax expenditures for fossil fuels
August 2014 191
Revenue derived from oil and gas production is subject to an income tax of 35% on
the contractors’ profits.
An investment allowance amounting to 50% of the initial development assets is
applied to developments in water depths exceeding 200m. Depreciation expenses are
calculated over 4 years, however in the case of development in water depths
exceeding 200m, depreciation is calculated over a 3 year period.

Enhancing comparability of data on estimated budgetary support and tax expenditures for fossil fuels
August 2014 192
The Netherlands
Reporting years: 2000 and 2011
Direct budgetary support to consumers/users
N.a.
Direct budgetary support to producers
Direct budgetary support to primary producers
N.a.
Direct budgetary support for R&D purposes
Name of the scheme
and short
description
Publicly financed energy research
In 2011, a total amount of € 163 million was spent by public
authorities on energy research. Of this amount, 6% (€ 9
million) was allocated to the IEA theme ‘fossil fuels’. In the
three preceding years, this amount was higher (€ 14, 19 and 31
million respectively). In 2000, the amount of public support for
fossil fuel R&D was € 8.6 million.
Final beneficiary Society at large (through positive externalities of innovation).
Direct beneficiary Energy companies; other enterprises; research institutions.
Aid category Grants.
Variability Depending on the specific scheme/contract.
Objectives Stimulating innovation.
Conditionality for
eligibility
Depending on the specific scheme/contract.
Conditionality for
magnitude of
subsidy
Depending on the specific scheme/contract.
Source of funding State budget (main source is the Ministry of Economic Affairs).
Fuel Several.
Total amount 2000: EUR 8.6 million.
2011: EUR 9 million.
Information sources PriceWaterhouseCoopers, Monitoring Publiek Gefinancierd
Energieonderzoek 2005 en 2006. Openbare Samenvatting,
24 december 2007.
Agentschap NL, Monitor publiek gefinancierd energieonderzoek
2012, August 2013.

Enhancing comparability of data on estimated budgetary support and tax expenditures for fossil fuels
August 2014 193
Public investments in energy infrastructure
No relevant cases found in the State Aid register.
Tax expenditures
Excises and other specific taxes on energy use
Name of the tax scheme
and short description
Excise taxes (accijnzen) apply to oil products only. The
energy tax (energiebelasting) is levied on the supply of
natural gas and electricity to the (final) users of these
energy products. Coal is subject to a coal tax, but since
this tax has no reduced rates or exemptions (except for
the non-energy use of coal), it is not included in the
analysis.
In 2000, the structure of energy taxes was more
complicated, with some oil products being subject to a
combination of excise tax, energy tax and a separate fuel
tax (brandstoffenbelasting). The sum of the applicable tax
rates has been used for each subcategory in the analysis.
Summary of fuels and
use(r)s to which reduced
rates or exemptions
applied in the reporting
years
Apart from the usual exemptions (e.g. for navigation and
aviation) and differentiated rates (e.g. between petrol and
diesel) the following main schemes can be mentioned:
A decreasing block rate in the energy tax (the higher
the energy use, the lower the tax rate);
Reduced energy tax rates for greenhouse
horticulture and for religious and not-for-profit
institutions;
Reduced excise tax rates for diesel (gas oil) for non-
road use (e.g. agricultural tractors). This reduced
rate was abolished in 2013.
Amount calculated
(benchmark: highest
excise per unit of energy
consumption)
total per unit of
energy
per unit of CO2
2000: € 21,064
mln
2011: € 30,420
mln
2000: € 7.96 /
GJ
2011: € 11.95 /
GJ
2000: € 104.39 /
ton
2011: € 158.80 /
ton
Amount calculated
(benchmark: highest
excise per unit of CO2
emissions)
Total per unit of
energy
per unit of CO2
2000: € 21,064
mln
2011: € 30,420
mln
2000: € 7.96 /
GJ
2011: € 11.95 /
GJ
2000: € 104.39 /
ton
2011: € 158.80 /
ton
Amount calculated
(benchmark: proposal
total per unit of
energy
per unit of CO2

Enhancing comparability of data on estimated budgetary support and tax expenditures for fossil fuels
August 2014 194
new energy taxation
directive)
2000: € 1,489
mln
2011: € 424 mln
2000: € 0.56 /
GJ
2011: € 0.17 /
GJ
2000: € 7.38 / ton
2011: € 2.21 / ton
Information sources IEA/OECD: Energy Statistics of OECD countries, 2000-
2001 and 2013 edition
EWEB database
Eurostat Energy balances
Website Dutch Tax Authorities (www.belastingdienst.nl)
Eric Drissen (PBL), personal communication
A number of assumptions had to be made regarding the
share of different use(r) categories in the total use of
various energy carriers. These assumptions are specified
as comments in the Excel tables.
NB: The estimated amount of support contains a slight
overestimation due to the fact that an (unknown) part of
the natural gas used in greenhouse horticulture is used for
electricity production (cogeneration).
Value Added Tax
N.a. All energy supplies are subject to the standard VAT rate.
Tax expenditures in social contributions and personal income taxes
N.a.
Tax expenditures in corporate income taxes
Not applicable. There are a number of tax expenditure schemes (such as accelerated
depreciation for environmental and energy saving investments), but none of these are
specifically targeted at the fossil fuel industry.
Tax expenditures in royalties
There are two schemes stimulating the exploitation of small gas fields and the
exploration of offshore marginal gas fields. For details we refer to the OECD (2013)
report.
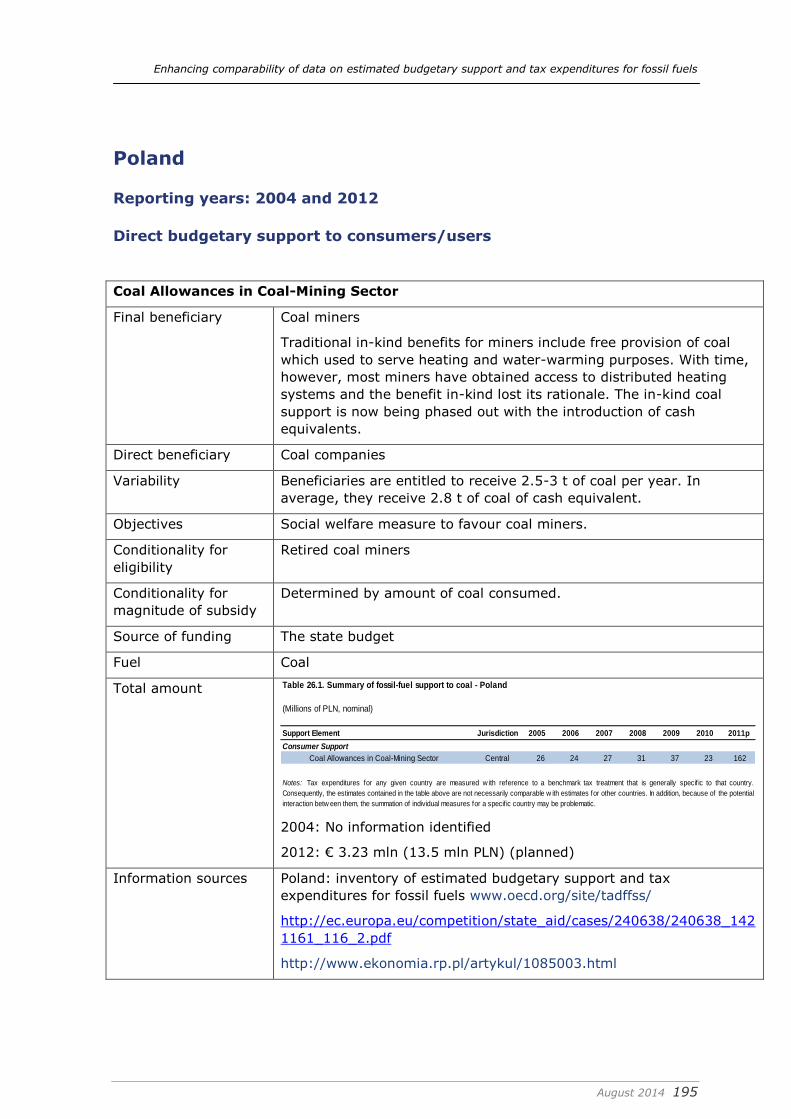
Enhancing comparability of data on estimated budgetary support and tax expenditures for fossil fuels
August 2014 195
Poland
Reporting years: 2004 and 2012
Direct budgetary support to consumers/users
Coal Allowances in Coal-Mining Sector
Final beneficiary Coal miners
Traditional in-kind benefits for miners include free provision of coal
which used to serve heating and water-warming purposes. With time,
however, most miners have obtained access to distributed heating
systems and the benefit in-kind lost its rationale. The in-kind coal
support is now being phased out with the introduction of cash
equivalents.
Direct beneficiary Coal companies
Variability Beneficiaries are entitled to receive 2.5-3 t of coal per year. In
average, they receive 2.8 t of coal of cash equivalent.
Objectives Social welfare measure to favour coal miners.
Conditionality for
eligibility
Retired coal miners
Conditionality for
magnitude of subsidy
Determined by amount of coal consumed.
Source of funding The state budget
Fuel Coal
Total amount Table 26.1. Summary of fossil-fuel support to coal - Poland
(Millions of PLN, nominal)
Support Element Jurisdiction 2005 2006 2007 2008 2009 2010 2011p
Consumer Support
Coal Allowances in Coal-Mining Sector Central 26 24 27 31 37 23 162
Notes: Tax expenditures for any given country are measured w ith reference to a benchmark tax treatment that is generally specif ic to that country.
Consequently, the estimates contained in the table above are not necessarily comparable w ith estimates for other countries. In addition, because of the potential
interaction betw een them, the summation of individual measures for a specif ic country may be problematic.
2004: No information identified
2012: € 3.23 mln (13.5 mln PLN) (planned)
Information sources Poland: inventory of estimated budgetary support and tax
expenditures for fossil fuels www.oecd.org/site/tadffss/
http://ec.europa.eu/competition/state_aid/cases/240638/240638_142
1161_116_2.pdf
http://www.ekonomia.rp.pl/artykul/1085003.html

Enhancing comparability of data on estimated budgetary support and tax expenditures for fossil fuels
August 2014 196
Direct budgetary support to producers
Direct budgetary support to primary producers
Initial investment aid for Hard-Coal-Mining Sector
Final beneficiary Existing hard coal mines
The aid applies to cover initial investment costs, i.e. fixed
capital costs directly related to infrastructure work or
equipment necessary for the mining of coal resources in
existing mines.
Direct beneficiary Existing hard coal holding companies
Aid category Restructuring
Objectives Sectoral development - to support investments ensuring
access to coal reserves.
Conditionality for
eligibility
The aid was granted to investment projects related to
ensuring access to coal reserves and was not granted for
covering costs related to the production-process itself.
Conditionality for
magnitude of subsidy
The aid for initial investment in coal mining will depend on
the financial situation of the state. The Minister responsible
for public finance during the drafting of the state budget
(each year) will analyse the possibility of granting aid for
initial investment. Possible State aid for initial investment
will require notification of the European Commission.
The state can reimburse up to 30% of the investment costs
incurred by coal producers.
Source of funding The state budget
Fuel Hard coal
Total amount 2004: € 3,531 mln (15,985 mln PLN)
2012: No information identified
Information sources Restructuring the hard coal mining sector 2004-2006 and
Strategy for 2007 – 2010 (adopted by the Council of
Ministers on 27/04/2004)
http://www.mg.gov.pl/NR/rdonlyres/1A74D3CD-3B99-
4FE8-A991-21EABCAF20EA/2512/gor_restr_2704.pdf
Strategy for hard coal mining sector in Poland between
2007 – 2015 (adopted by the Council of Ministers on
31/07/2007)
http://www.mg.gov.pl/NR/rdonlyres/EB0B7DB6-8D76-
41FE-94B6-
50176C2CA721/36302/StrategiaprzyjtaprzezRM.pdf
Poland: inventory of estimated budgetary support and tax
expenditures for fossil fuels www.oecd.org/site/tadffss/

Enhancing comparability of data on estimated budgetary support and tax expenditures for fossil fuels
August 2014 197
Direct budgetary support for coal sector
According to the report of the Centre for Social and Economic Analysis91, Polish coal
sector benefited from 22 bn PLN (around 5.3 bn EUR) subsidies in different forms of
state aid. Annual support from the state budget and operational programmes is
estimated 1.1 bn PLN (around 260 mln EUR). During the four reporting years (2010-
2013) 17 bn PNL (around 4.1 bn EUR) have been spent for the pension scheme for
coal miners. Overall subsidies for mining and power generation based on coal during
1990-2012 are estimated 170 bn PLN (in 2010 prices, around 41 bn EUR).
Direct budgetary support for R&D purposes
According to the IEA database, government RD&D on fossil fuels amounted to PLN
2.56 mln (€ 0.6 mln) in 2012. No data for 2004 are available.
Public investments in energy infrastructure
Aid to PGNiG for underground gas storage in Poland
Final beneficiary The single beneficiary of the aid is the
Storage System Operator (SSO)
Division which operates all gas storage
facilities in Poland and which belongs in
100% to the incumbent gas company –
Polskie Gornictwo Naftowe i
Gazownictwo S.A. ("PGNiG"). PGNiG
which is in 84.75% state-owned, is
active and has a quasi-monopolistic
position on the markets of production,
import, distribution, wholesale and
retail sales of gas.
Direct beneficiary See above
Aid category Direct grant
Objectives The measure concerns four investment
projects in expansion of existing or in
construction of new of underground
natural gas storage (UGS) facilities,
aimed at improving the security of gas
supply in Poland. The completion of the
project would increase the natural gas
storage capacity in Poland by about one
billion m3, from 1.6 billion m3 to 2.6
billion m3.
Conditionality for eligibility
Conditionality for magnitude of subsidy Any modification of the aid scheme has
91 Web article describing the report (not published) accessed on 3 June 2014
http://www.ekonomia.rp.pl/artykul/706193,1113172-Gornictwo-w-latach-2010-2013-
dostalo-22-mld-zl-pomocy-publicznej.html

Enhancing comparability of data on estimated budgetary support and tax expenditures for fossil fuels
August 2014 198
to be notified to the European
Commission.
Source of funding - State government (national
resources)
- Operational Programme
Infrastructure and Environment
(resources transferred to the
Polish authorities in the
framework of the Cohesion
Fund)
The EU support is about 63 M PLN
(15,77 M EUR)
Fuel Natural gas
Total amount The aid duration is from 23.03.2010 to
30.06.2015. The total amount of aid for
the period is 1 539 920 200 PLN (390
500 000 EUR), which is about 55% of
the total cost of the investment.
2004: 0 € (not existing)
2012: information not identified
Information sources http://ec.europa.eu/competition/elojad
e/isef/case_details.cfm?proc_code=3_N
660_2009
http://ec.europa.eu/competition/state_
aid/cases/234044/234044_1118402_56
_1.pdf
http://www.globaltradealert.org/measu
re/poland-aid-pgnig-underground-gas-
storage
http://www.pois.gov.pl/English/About_
Programme/Strony/About_the_Program
me.aspx
Regional aid scheme for a construction and reconstruction of the gas distribution
network
Final beneficiary The scheme applies to beneficiaries
who hold a concession for the natural
gas distribution. According to the
Energy Law (Act of 10 April 1997)
granting concessions for gas
distribution is open to any company
based in the EEA and which fulfils
specific for the sector and transparent

Enhancing comparability of data on estimated budgetary support and tax expenditures for fossil fuels
August 2014 199
requirements.
Direct beneficiary The aid granting authority is Instytut
Nafty i Gazu (Oil and Gas Institute).
Aid category Direct grant
Objectives The scheme consists in construction of
gas distribution networks in areas not
supplied with gas and for the
modernisation of the existing
distribution networks. To this end it
aims at providing incentives for the
investments enabling effective
functioning and balanced development
of natural gas distribution network in
Poland.
Conditionality for eligibility Aid under the scheme can be granted
only for the realisation of an initial
investment.
The beneficiary have to provide a
contribution of at least 25% of the
value of the total eligible costs in a
form which is free of any public
support.
Conditionality for magnitude of subsidy Any modification of the aid scheme has
to be notified to the European
Commission.
Source of funding - State government (national
resources)
- Operational Programme
Infrastructure and Environment
(resources transferred to the
Polish authorities in the
framework of the European
Regional Development Fund and
Cohesion Fund)
Fuel Natural gas
Total amount The aid duration is from 01.09.2007
(date of notification of the EC) to
31.12.2015. The total amount of aid for
the period is 666,17 M PLN (199,452 M
EUR).
2004: 0 € (not existing)
2012: information not identified
Information sources http://ec.europa.eu/competition/elojad
e/isef/case_details.cfm?proc_code=3_N

Enhancing comparability of data on estimated budgetary support and tax expenditures for fossil fuels
August 2014 200
435_2008
http://ec.europa.eu/competition/state_
aid/cases/227282/227282_983240_56_
1.pdf
Tax expenditures
Excises and other specific taxes on energy use
Excise taxes are charged on all fuels (see the Excel files). Certain exemptions
apply (see below).
Summary of fuels and
use(r)s to which reduced
rates or exemptions applied
in the reporting years
Refund of excise tax on diesel oil for agriculture,
exemption of excise tax for coal for certain
consumers, free provision of coal for heating for
coal miners
Amount calculated
(benchmark: highest excise
per unit of energy
consumption)
year: 2004
year: 2012
total per unit of
energy
per unit of
CO2
€ 21,987 mln
€ 22,324 mln
€ 6.98 / GJ
€ 7.19 / GJ
€ 76.38 /
ton
€ 79.04 /
ton
Amount calculated
(benchmark: highest excise
per unit of CO2 emissions)
year: 2004
year: 2012
total per unit of
energy
per unit of
CO2
€ 21,987 mln
€ 22,324 mln
€ 6.98 / GJ
€ 7.19 / GJ
€ 76.38 /
ton
€ 79.04 /
ton
Amount calculated
(benchmark: proposal new
energy taxation directive)
year: 2004
year: 2012
total per unit of
energy
per unit of
CO2
€ 5,407 mln
€ 3,986 mln
€ 1.72 / GJ
€ 1.28 / GJ
€ 18.78 /
ton
€ 14.11 /
ton
Information sources
Excel files Tax_exp_PL_2004 and 2012
Value Added Tax
Categories of energy supply to which a
reduced VAT rate was applied in one
None

Enhancing comparability of data on estimated budgetary support and tax expenditures for fossil fuels
August 2014 201
or both of the reporting years
Standard rate 2004: 22%
2012: 23%
Reduced rate No reduced rate for energy supplies.
Amount of support calculated
(refer to Excel file)
2004: EUR 0 mln
2012: EUR 0 mln
Information sources http://www.finanse.mf.gov.pl/vat/stawki-
podatkowe
Tax expenditures in social contributions and personal income taxes
N.a.
Tax expenditures in corporate income taxes
N.a.
Tax expenditures in royalties
No information identified.

Enhancing comparability of data on estimated budgetary support and tax expenditures for fossil fuels
August 2014 202
Portugal
Reporting years: 2005 and 2011
Direct budgetary support to consumers/users
N.a.
Direct budgetary support to producers
Direct budgetary support to primary producers
N.a.
Direct budgetary support for R&D purposes
In the IEA Data Services (http://www.iea.org/statistics/RDDonlinedataservice/), the
total RD&D budget in Million Euro (nominal prices) is 0.189 in 2005 and 0.052 in
2011. No information on the sources (Federal or Regional governements) and on the
beneficiaries of this funding is available.
Public investments in energy infrastructure
The State Aid Register of the European Commission was consulted and no cases of
public investments in energy infrastructure were found for the years of 2005 and
2011.
Tax expenditures
Excises and other specific taxes on energy use
ISP - Imposto sobre Produtos Petrolíferos (specific taxes on oil-derived products
per unit of fuel consumed)
Changes are reported in “tax rates PT_DG TAXUD” data sheets in Excel table
Summary of fuels and
use(r)s to which reduced
rates or exemptions applied
in the reporting years
The ISP applies to leaded and unleaded gasoline
for transportation; diesel for transportation,
industry, agriculture, heating; kerosene for
aviation, industry, heating; LPG for transportation
,industry, heating; natural gas for transportation;
heavy fuel oil for heating; coal for business
heating; coke for business heating. Entities
practicing the following activities and consuming
the fuels above were exempt of excise taxes:
Using fossil fuel products for non-energetic
application
Aviation – except private recreational
airplane uses
Coastal navigation and inland shipping,
including fishing activities – except private

Enhancing comparability of data on estimated budgetary support and tax expenditures for fossil fuels
August 2014 203
recreational navigation
Electricity and heat production
Public transportation
Industries subject to the EU Emission
Trading Scheme
Port and waterway dredging operations
Rail transportation
Airplane and ships manufacturing
Using coal, coke and fuel oil for power
generation or in CHP plants. Diesel fuel for
the same purpose in Açores and Madeira
Amount calculated
(benchmark: highest excise
per unit of energy
consumption)
year: 2005
year: 2011
total per unit of
energy
per unit of CO2
€ 7056 mln
€ 6275 mln
€ 11.52 / GJ
€ 11.51 / GJ
€ 144.03 / ton
€ 116.54 / ton
Amount calculated
(benchmark: highest excise
per unit of CO2 emissions)
year: 2005
year: 2011
Total per unit of
energy
per unit of CO2
€ 7056 mln
€ 6275 mln
€ 11.52 / GJ
€ 11.51 / GJ
€ 144.03 / ton
€ 116.54 / ton
Amount calculated
(benchmark: proposal new
energy taxation directive)
year: 2005
year: 2011
total per unit of
energy
per unit of CO2
€ 580 mln
€ 287 mln
€ 0.95 / GJ
€ 0.53 / GJ
€ 11.84 / ton
€ 5.33 / ton
Information
sources
Excel documents: tax_exp_Portugal_2005 and
tax_exp_Portugal_2011.
Value Added Tax
Categories of energy supply to which a
reduced VAT rate was applied in one
or both of the reporting years
Gasoil (for heating), kerosene, heavy
fuel oil (both years); natural gas,
electricity (2011 only)
Standard rate 2005: 19 % (first half of 2005); 21%
(second half of 2005)
2011: 23%
Reduced rate 2005: 12% (gasoil, kerosene, heavy

Enhancing comparability of data on estimated budgetary support and tax expenditures for fossil fuels
August 2014 204
fuel oil)
2011: 13% (gasoil, kerosene, heavy
fuel oil) and 6% (natural gas,
electricity)
Amount of support calculated
(refer to Excel file)
2005: € 0 mln
2011: € 226 mln
Information
sources
Excel documents: tax_exp_Portugal_2005 and
tax_exp_Portugal_2011.
Note: the amount for 2005 is probably not correct. According
to the available statistical data, the consumption of gasoil and
kerosene for (non-business) heating purposes in 2005 was
zero, which is unlikely to be true.
Tax expenditures in social contributions and personal income taxes
N.a.
Tax expenditures in corporate income taxes
Corporate-Revenue Tax Deductions for Oil Exploration and Production
Type of tax expenditure Special rates for exploration and
production activities
Objectives Incentives for oil exploration and
production
Conditionality for eligibility The deducted values have to be invested
in other exploration and production
activities in Portugal in the following 3
fiscal years from the tax deduction
Conditionality for magnitude of subsidy Article 42 of Portugal’s Corporate-
Revenue Tax Code (IRC) allows
companies undertaking oil exploration
and production (E&P) activities to deduct
the smallest of the following amounts
from their tax base for corporate-
revenue-tax purposes:
30% of the gross value obtained
from sales of oil produced in the
area of concession in the
corresponding fiscal period;
45 % of the amount that would
have been collected were the
previous deduction not available.
Fuel Crude oil

Enhancing comparability of data on estimated budgetary support and tax expenditures for fossil fuels
August 2014 205
Total amount No data available
Information sources Portugal: Inventory of estimated
budgetary support and tax expenditure
for fossil-fuels (OECD)
http://www.oecd.org/site/tadffss/PRT.pdf.
Tax expenditures in royalties
The extraction of crude oil in Portugal is subject to an Oil Production Tax (Imposto
sobre a Produção de Petróleo) whose rates vary with annual production volumes and a
field’s depth. This progressive royalty system also distinguishes between onshore and
offshore fields, with the latter benefitting from more favourable rates of tax. The
production of oil from offshore fields that are deeper than 200 meters is totally
exempt from the Oil Production Tax.
Portugal, however, produces virtually no crude oil or natural gas
(http://www.eia.gov/countries/country-data.cfm?fips=po).

Enhancing comparability of data on estimated budgetary support and tax expenditures for fossil fuels
August 2014 206
Romania
Reporting years: 2001 and 2011
Direct budgetary support to consumers/users
In the IVM (2013) report, fuel subsidies for railways were estimated in 2011 at RON
295 million (EUR 71 million). Most of this is probably related to the exemption from
excise taxes, which can be calculated at about EUR 55 million (fuel use 6092 TJ;
standard tax rate for diesel EUR 8.98 per GJ; see Excel sheet). The remaining part
(EUR 16 million) is assumed to be direct support for fuel costs. Comparable data for
2001 are not available.
Direct budgetary support to producers
Direct budgetary support to primary producers
According to the State Aid Scoreboard, state aid for hard coal mining peaked at EUR
254.6 million in 2004 and gradually decreased since then. In 2011 it was reported to
be zero, but in 2012 the amount was positive again. The average annual amount of
support over the period 2002-2012 was EUR 98.3 million. Data for 2001 are not
available.
In state aid case N239/07 the Commission decided not to raise objections against
grants for coal production to Compania Naţională a Huilei S.A. The amount involved
was RON 1.29 billion for the period 2007-2010, which equals to an average of EUR
83.8 mln per year. This is the amount reported for 2011 in the main report of this
study.
Source: European Commission, DG Competition, State Aid Scoreboard; State Aid
Register.
Direct budgetary support for R&D purposes
Government expenditure on energy R&D amounted to EUR 7.3 million in 2007. No
data are available on the share of fossil fuel related R&D in this budget.
Source: Eurostat (2010), Science, technology and innovation in Europe. 2010 edition.
Public investments in energy infrastructure
A state aid scheme for investments into expanding and modernising distribution
networks for electricity and natural gas amounted to EUR 28.4 million over the period
2009-2013 (state aid case N467/2009). Of this amount, 88% was co-financed by the
EFRD. The Romanian part of the state aid therefore amounted to EUR 3.7 mln for
2009-2013, or EUR 0.7 mln per year. Given the fact that 56% of Romania’s electricity
supply is from fossil fuels, the amount of state support for 2011 can be estimated at
EUR 0.5 million.

Enhancing comparability of data on estimated budgetary support and tax expenditures for fossil fuels
August 2014 207
Tax expenditures
Excises and other specific taxes on energy use
Name of the tax
scheme and short
description
Excise taxes (accize)
In 2001, excise taxes were only levied on oil products. By 2011,
excise taxes were also levied on coal, natural gas and electricity.
Summary of fuels
and use(r)s to
which reduced
rates or exemptions
applied in the
reporting years
In 2001, the excise tax rate for diesel was more than 50%
lower than for (unleaded) petrol. By 2011, the difference
was reduced to 18%.
Excise tax rates for LPG, natural gas, kerosene, coal and
electricity are differentiated between use for commercial
and non-commercial purposes.
Heating fuels used by individual households and charity
institutions are exempted from the excise tax.
Excise taxes on fuels used in agriculture can be refunded.
Public transport is exempted from excise taxes on fuels
and electricity.
Amount calculated
(benchmark:
highest excise per
unit of energy
consumption)
Total per unit of energy per unit of CO2
2001: € 1390 mln
2011: € 3075 mln
2001: € 2.01 / GJ
2011: € 4,72 / GJ
2001: € 26.58 / ton
2011: € 60.28 / ton
Amount calculated
(benchmark:
highest excise per
unit of CO2
emissions)
Total per unit of energy per unit of CO2
2001: € 1390 mln
2011: € 3075 mln
2001: € 2.01 / GJ
2011: € 4,72 / GJ
2001: € 26.58 / ton
2011: € 60.28 / ton
Amount calculated
(benchmark:
proposal new
energy taxation
directive)
Total per unit of energy per unit of CO2
2001: € 1279 mln
2011: € 614 mln
2001: € 1.85 / GJ
2011: € 0.94 / GJ
2001: € 24.45 / ton
2011: € 12.04 / ton
Information
sources
IEA (2014), EWEB database (2010 data used; 2011 not yet
available)
National Tax Code (2010)
http://www.cdep.ro/proiecte/2001/600/70/4/anexe674.pdf
http://static.anaf.ro/static/10/Anaf/legislatie/Cod_fiscal_norme_
2011.htm#ax1

Enhancing comparability of data on estimated budgetary support and tax expenditures for fossil fuels
August 2014 208
http://www.cfe-eutax.org/taxation/excise-duties/romania
IVM (2013), Budgetary support and tax expenditures for fossil
fuels An inventory for six non-OECD EU countries. Institute for
Environmental Studies, VU University Amsterdam
Value Added Tax
N.a. Both in 2001 and in 2011 the standard VAT rate was levied on fuels and
electricity.
Tax expenditures in social contributions and personal income taxes
N.a.
Tax expenditures in corporate income taxes
N.a.
Tax expenditures in royalties
Oil production is taxed at a rate of €4 per ton (2013). Natural gas production is taxed
at a rate of €7.40 per 1000 m3. No exemptions or reduced rates are reported for
these taxes.
Source:
Eunomia and Aarhus University (2014), Study on Environmental Fiscal Reform
Potential in 12 EU Member States. Final Report to DG Environment of the European
Commission.

Enhancing comparability of data on estimated budgetary support and tax expenditures for fossil fuels
August 2014 209
Slovakia
Reporting years: 2005 and 2011
Direct budgetary support to consumers/users
Refund of the production costs of electricity produced from domestic coal
(Feed-In Tariff for Domestic Lignite)
(in place until 2020, with the possibility of extension to 2035)
Since 2005, the electricity produced from domestic coal has been supported through a
refund of the production costs of electricity produced from domestic coal. The burden
of this refund falls partially on electricity consumers (reflected in higher electricity
prices) and partially on the budget chapter of the Ministry of the Economy.
Since producing electricity from lignite is significantly more expensive than electricity
production from other energy sources, those power plants that produce electricity from
domestic lignite are refunded for this activity (up to 15% of total electricity generation
can be subject to such a refund). The amount of the refund is determined annually by
RONI that publishes the subsidy amount per every MWh of lignite-fired electricity fed
to the network. RONI also sets the annual price of lignite.
Currently, the only power plant benefitting from this scheme is the Nováky thermal
power plant. In 2011, the measure was extended until 2020, with the possibility of
further extension until 2035.
Final
beneficiary
Domestic coal/mining sector
Direct
beneficiary
Domestic coal consumers - Electricity producers
Only one electricity producer profits of this support measure at the
moment: The Novaky thermal power plant.
Novaky currently produces about 8% of electricity in the country.
Variability The refund does not take the form of (possibly periodical) lump sum
grant, neither does it vary according to some identifiable parameters
(such as reductions in the production capacity, etc).
Objectives To ensure the coal supply security and general economic interest.
Besides renewable energy sources, lignite is the only significant
domestic primary energy source, and the government is keen to
maintain domestic lignite production and lignitefired electricity
generation. The Energy Security Strategy stipulates the maximum use
of domestic lignite reserves. It discusses the possibility of resuming or
opening lignite extraction at several deposits.
Conditionality
for eligibility
The generator has to prove that electricity was produced from
domestic coal in thermal power plants which are holders of permission
for electricity generation.
The thermal plant Novaky (owned by Slovenske elektrarne) is the only
company holding such permission.

Enhancing comparability of data on estimated budgetary support and tax expenditures for fossil fuels
August 2014 210
Conditionality
for
magnitude of
subsidy
Government resolutions adopted in 2005 and 2006 determined the
amount of electricity that must be produced from domestic coal in the
“general economic interest”. A new resolution adopted in January 2010
extended this “general economic interest” by 2020 with the possibility
of extension to 2035. The Regulatory Office for Network Industries
(RONI) administers the subsidy and annually publishes decisions on
prices through which a supplement (additional allowance) to every
MWh of lignite-fired electricity supplied to the network is determined.
Up to 15% of total electricity generation can be subsidised. The price
of domestic lignite is also set by RONI.
Source of
funding
The general government budget (the budget chapter of the
Ministry of the Economy)
End users (electricity consumers) – burden reflected in higher
electricity prices
Fuel Domestic coal - lignite
Total amount N/A
Information
sources
http://www.iea.org/publications/freepublications/publication/Slovak20
12_free.pdf
(Energy Policies of IEA Countries – Slovak republic (2012 Review)
http://www.oecd.org/site/tadffss/SVK.pdf
(Slovak republic: inventory of estimated budgetary support and tax
expenditures for fossil-fuels)
Direct budgetary support to producers
Direct budgetary support to primary producers
Raising Accessibility of Lignite Reserves in Hornonitranske Bane, Prievidza,
a.s. (data for 2006-2010)
Direct grants for raising accessibility of lignite reserves at the Hornonitranske Bane,
Prievidza, a.s., a joint-stock lignite-mining company, were provided by the state in the
period between 2006 and 2010. The joint-stock company submitted a plan in which it
envisaged extracting 12.2 million tonnes of lignite in three extraction areas: Nováky,
Cígel’ and Handlová in the period between 2005 and 2010.
The scheme was launched by the government decision N 324/2005 of 27 January 2006
and approved by the European Commission’s decision K(2006)92.
Final beneficiary Domestic coal/mining sector
Direct beneficiary Hornonitranske Bane, Prievidza, a.s., a
joint-stock lignite-mining company
Aid category Direct grants
Variability The subsidy take the form of (possibly
periodical) lump sum grant.

Enhancing comparability of data on estimated budgetary support and tax expenditures for fossil fuels
August 2014 211
Objectives Increasing the accessibility of lignite
reserves
Conditionality for eligibility Based on a plan in which it is envisaged
extracting 12.2 million tonnes of lignite in
three extraction areas.
Conditionality for magnitude of subsidy Given by the grant
Source of funding The general government budget
Fuel Domestic coal - lignite
Total amount N/A
Information sources http://www.oecd.org/site/tadffss/SVK.pdf
(Slovak republic: inventory of estimated
budgetary support and tax expenditures
for fossil-fuels)
Note: The direct subsidies for lignite mining in Slovakia are mainly aimed at the
reduction and liquidation of mining (for example Subsidy for the phasing‐out of the
Baňa Dolina mine in accordance with EU regulation)and social inherited liabilities
(social payments to coal miners, former coal miners and miners’ widows, as well as
severance payments for miners laid off). The total amount of subsidy for the period
2005‐2010 was approximately EUR 30 million.
Direct budgetary support for R&D purposes
According to the IEA database, the total expenditure on R&D is as follows in the two
reporting years is as follows:
2005: € 0 mln
2011: € 0,741 mln
The support provided in 2011 covered R&D on coal and CO2 capture and storage.
Public investments in energy infrastructure
N.a. Four state aid cases were identified in 2005 and this concerned severance
payments for miners laid off and retirement benefits for miners after phasing out
mining activity. None of these aids are relevant to infrastructure.
Tax expenditures
Excises and other specific taxes on energy use
Summary of fuels and use(r)s to
which reduced rates or
exemptions applied in the
reporting years
The following energy sources benefit from tax
exemptions:
electricity, gas (LPG) and coal used by final
household customers;
electricity used for some specified purposes
(i.e. for industrial production if the
electricity costs represent more than 50% of
the average own costs of the product
manufactured);

Enhancing comparability of data on estimated budgetary support and tax expenditures for fossil fuels
August 2014 212
electricity, coal and gas used for the
transportation of persons and cargo by
public transport (e.g. trains, underground
and tramways);
electricity produced from renewable energy
sources and CHP;
natural gas and coal used i) to produce
electricity and combined heat and power as
well as heat for domestic use, ii) for
operational and technological purposes and
iii) for any purpose other than motor fuel or
as heating fuel.
Exemptions from the coal tax92
Exemptions from the natural gas tax93
Reduced Excise Duty on Red Diesel94
Reduced Excise Duty on LPG95
92 As stipulated by § 19 of the Act No. 609/2007, use of coal is fully exempt from the
coal tax, if it is used: (a) for dual use, i.e. as fuel and for other purposes; (b) in
mineralogical processes; (c) for a purpose other than that of a motor fuel or fuel for
heat generation; (d) in the combined generation of electricity and heat; (e) in
electricity generation; (f) for production of coke and semi-coke; (g) in commercial
activities directly related to railroad or river transportation of persons or cargo; (h) by
households; (i) for operational and technological purposes in a mining and coal
processing company; (j) in the generation of heat for households.
Tax exemption for coal used (j) in the generation of heat for households was abolished
as of 1 January 2011.
93 As stipulated by § 31 of Act No. 609/2007, use of natural gas is fully exempt from
the natural gas tax, if it is used: (a) for dual use, i.e. as fuel and for other purposes;
(b) in mineralogical processes; (c) for a purpose other than that of a motor fuel or fuel
for heat generation; (d) in the combined generation of electricity and heat; (e) in
electricity generation; (f) as a motor fuel; (g) by households; (h) for operational and
technological purposes in a gas undertaking, including losses in a technologically
justified quantity;2;(i) in the generation of heat for households; (j) in commercial
activities directly related to railroad or river transportation of persons or cargo.
Tax exemption for natural gas used (f) as motor fuel and (i) in the generation of heat
for households was abolished as of 1 January 2011.
94 As stipulated by the Article 7 of the Act No. 98/2004 on the Excise Duty on Mineral
Oil, a reduced excise-tax rate on diesel applies to diesel used for (a) railroad
transportation of persons or cargo and for repair and maintenance of the railway
network, (b) machines used in agriculture, and (c) stationary engines and equipment
for electricity production. Diesel used for such purposes is dyed red, hence the name
“red diesel” (“červena nafta”). The scheme was introduced on 1 May 2004 was
abolished as of 1 January 2011.
95 As stipulated by the File 253 of the Amendments to Act No. 98/2004 on the Excise
Duty on Mineral Oil, an excise tax exemption applies to LPG used as fuel. The scheme
was introduced on 1 July 2008 and it was abolished as of 1 January 2011.

Enhancing comparability of data on estimated budgetary support and tax expenditures for fossil fuels
August 2014 213
Amount calculated (benchmark:
highest excise per unit of energy
consumption)
year: 2005
year: 2011
total per unit of
energy
per unit of CO2
€ 5,471 mln
€ 6,602 mln
€ 9.67 / GJ
€ 11.53 / GJ
€ 171.18 / ton
€ 198.93 / ton
Amount calculated (benchmark:
highest excise per unit of CO2
emissions)
year: 2005
year: 2011
total per unit of
energy
per unit of CO2
€ 5,454 mln
€ 6,602 mln
€ 9.64/ GJ
€ 11.53 / GJ
€ 170.63 / ton
€ 198.93 / ton
Amount calculated (benchmark:
proposal new energy taxation
directive)
year: 2005
year: 2011
total per unit of
energy
per unit of CO2
€ 1,216 mln
€ 1,251 mln
€ 2.15 / GJ
€ 2.19 / GJ
€ 38.03 / ton
€ 37.70 / ton
Information sources IEA (2013) Energy Statistics of OECD Countries.
DG TAXUD (2005) Excise duty tables. (Incorporates
all amendments received up to 27 November 2000)
DG TAXUD (2011) Excise duty tables. Part II -
Energy products and electricity. European
Commission. (Shows the situation as at 1 July
2011)
Eurostat
IEA Review of the Energy Policies of Slovakia 2010,
Preliminary Findings and Recommendations,
International Energy Agency, Bratislava, 26
November 2010.
Act No. 609/2007 on the Excise Duty on Electricity,
Coal, and Natural Gas supplementing Act No.
98/2004 on the Excise Duty on Mineral Oil, Ministry
of Finance of the Slovak Republic, Available at:
www.mfsr.sk/en/Documents/Material/2009/7/73/S
obot190209/Electricity/Electricity_Coal_Natural_Ga
s_609_2007.pdf.
IFP (2011), Inštitút finančnej politiky Ministerstvo
financií SR, Ministry of Finance of the Slovak
Republic.
Ministry of Finance (2011), State aid granted to
beneficiaries in all sectors except agriculture,
Ministry of Finance of the Slovak Republic.

Enhancing comparability of data on estimated budgetary support and tax expenditures for fossil fuels
August 2014 214
Value Added Tax
Categories of energy supply to
which a reduced VAT rate was
applied in one or both of the
reporting years
None
Standard rate 2005: 19%
2011: 20%
Reduced rate No reduced rates apply.
Amount of support calculated
(refer to Excel file)
n.a.
Information sources Assumptions made in calculation:
No prices for LPG could be found for heating use
(residential), so LPG transport prices were used.
Sources of information:
Statistical office of the Slovak republic:
http://slovak.statistics.sk/
DG Taxud, Excise duty tables:
https://circabc.europa.eu/sd/a/5d907b3b-52ee-
4808-9de5-
8e2b2647ac0f/EDT%202011%20Jan%20Energy.pdf
IEA statistics - Energy prices and taxes (first
quarter 2013)
Tax expenditures in social contributions and personal income taxes
N.a.
Tax expenditures in corporate income taxes
N.a.
Tax expenditures in royalties
N.a.

Enhancing comparability of data on estimated budgetary support and tax expenditures for fossil fuels
August 2014 215
Slovenia
Reporting years: 2004 and 2012
Direct budgetary support to consumers/users
Name of the
scheme and short
description
Feed-In Tariffs / operational support for
electricity produced in CHP Plants (ongoing)
Final beneficiary Investors in said plants
Direct beneficiary CHP plants
Variability Variable, according to electricity production
Objectives To encourage high-efficiency production
Conditionality for
eligibility
Combined heat and electricity production
Conditionality for
magnitude of
subsidy
n/a
Source of funding Tax on electricity consumption for renewables
and CHP
Fuel Various fossil fuels
Total amount EUR 18.4 mln (2012)
Information
sources
http://lab.fs.uni-
lj.si/kes/gospodarjenje_z_energijo/Poslovanje
_EGP_2012.pdf
Direct budgetary support to producers
Direct budgetary support to primary producers
N.a.
Direct budgetary support for R&D purposes
N.a.
Public investments in energy infrastructure
As most fossil fuels distributors and producers are state-owned and the infrastructure
is built by these companies, there is no direct impact on the state budget. The cost of
investments is amortised by those companies. Thus, no scheme exists to quantify the
expenditures for such investments.

Enhancing comparability of data on estimated budgetary support and tax expenditures for fossil fuels
August 2014 216
Tax expenditures
Excises and other specific taxes on energy use
Name of the tax
scheme and short
description
Excise duty
Summary of fuels
and use(r)s to
which reduced
rates or
exemptions
applied in the
reporting years
Exemptions applied: use of fuel for Diplomatic Missions.
Partial refund is levied on:fuel used in stationary working
machinery in construction and engineering use, trains, zip lines,
motor fuel used in agricultural and forestry machinery.
Full refund is allowed for diesel used as fuel for commercial
purposes (shipping, flight, transformation, processing).
Amount calculated
(benchmark:
highest excise per
unit of energy
consumption)
total per unit of energy per unit of CO2
2004: € 658 mln
2012: € 1517 mln
2004: € 1.34 / GJ
2012: € 3.14 / GJ
2004: € 15.29/ ton
2012: € 36.24 / ton
Amount calculated
(benchmark:
highest excise per
unit of CO2
emissions)
total per unit of energy per unit of CO2
2004: € 658 mln
2012: € 1517 mln
2004: € 1.34 / GJ
2012: € 3.14 / GJ
2004: € 15.29 / ton
2012: € 36.24 / ton
Amount calculated
(benchmark:
proposal new
energy taxation
directive)
total per unit of energy per unit of CO2
2004: € 734 mln
2012: € 678 mln
2004: € 1.50 / GJ
2012: € 1.40 / GJ
2004: € 17.08 / ton
2012: € 16.20 / ton
Information
sources
Excel documents: tax_exp_Slovenia_2004 and
tax_exp_Slovenia_2012
Value Added Tax
N.a.
Tax expenditures in social contributions and personal income taxes
N.a.
Tax expenditures in corporate income taxes
N.a.

Enhancing comparability of data on estimated budgetary support and tax expenditures for fossil fuels
August 2014 217
Tax expenditures in royalties
The Slovenian system of royalties is the following: the fee amount that the
Government charges is set by the specific regulation on extrapolation of mineral
resources. The basis for the calculation of the fee is the size of the extraction site and
the average unit price of certain types of mineral resources in the Republic of
Slovenia. No other specific aspects of taxation regime or similar conditions apply to
the system (e.g. specific tax provisions, accelerated depreciation, etc.).

Enhancing comparability of data on estimated budgetary support and tax expenditures for fossil fuels
August 2014 218
Spain
Reporting years: 2002 and 2011
Direct budgetary support to consumers/users
State Aid N 684 / 09: Aid scheme for coal workers
The subsidy refers to an historical measure put in place since 1973, where the workers
of the coal-mining companies where entitled to obtain a fixed quantity of coal until the
end of their life. From November to March, the miners freely received 300 kg of coal
and between April and October were authorized to obtain 250kg of coal from their
mining-coal companies.96 This system has been restructured following an agreement
between trade unions, companies and government, which took into consideration the
amount of coal equivalent converted in Euro was around € 216, 36 (or € 18, 03 per
month). Following the approval of Real Decree 808/2006, which pointed out some
measures for the reorganization of the mining industry, the issue raised again for the
old workers who were under a previous scheme for retirement. Therefore, the State
decided to introduce a financial compensation for certain workers which were under
the previous scheme.
Final
beneficiary
Coal-miners under the scheme
Direct
beneficiary
Coal-Mining companies which employed miners which where under the
scheme
Variability N/A
Objectives To ensure an equitable reorganization of the coal miners’ benefits.
Conditionality
for eligibility
N/A
Conditionality
for
magnitude of
subsidy
N/A
Source of
funding
Central government
Fuel Coal
Total amount 2010: € 2,75 Million (only in 2010)
Information
sources
National Legislation:
Order 29/1973, ‘Orden de 29 de enero de 1973 por la que se
aprueba la Ordenanza de Trabajo para la Minería del Carbón’,
URL : https://www.boe.es/diario_boe/txt.php?id=BOE-A-1977-
30602 [07/04/2014]
Royal Decree 808/2002, ‘Real Decreto 808/2006, de 30 de junio,
96 For an overall value of approximately 3250 kg of coal per year.

Enhancing comparability of data on estimated budgetary support and tax expenditures for fossil fuels
August 2014 219
por el que se establece el régimen de ayudas por costes
laborales mediante prejubilaciones, destinadas a cubrir cargas
excepcionales vinculadas a planes de acionalización y
reestructuración de la actividad de las empresas mineras del
carbón’. URL:
http://www.boe.es/boe/dias/2006/07/01/pdfs/A24783-
24789.pdf [06/04/2014]
European Commission (2010), 'Ayuda estatal N 684/2009 – España.
Ayuda en sustitución del suministro gratuito de carbón',
URL:http://ec.europa.eu/competition/state_aid/cases/234259/234259
_1085863_21_2.pdf [06/04/2014]
Official Journal of the European Union (2010) , ‘Authorisation for State
aid pursuant to Articles 107 and 108 TFEU. Cases where the
Commission raises no objections’, 2010/C 93/01, URL:http://eur-
lex.europa.eu/legal-
content/EN/TXT/?uri=uriserv:OJ.C_.2010.093.01.0001.01.ENG
[07/04/2014]
Direct budgetary support to producers
Direct budgetary support to primary producers
State Aid NN 80/2006 State aid to the coal sector for 2006 & State Aid NN
81/2006 (ex N286/2006) National Strategic Coal Reserve Plan for 2006-2012
Following the decision of restructuring the coal-mining sector in 2006 and the
publication of the National Strategic Coal Reserve Plan for 2006-2012, the Spanish
authorities decided to organize gradual closure of economically unsustainable mines
while maintaining at the same time a certain level of indigenous coal production for
the national security of supplies. The subsidy come into the form of subsides for mine-
closure and for coal production, and it also had encompassed a substantial reduction
for the State-owned company HUNOSA (Hulleras del Norte S. A.). The subsidies
considered in this case are relative for the period 2005 – 2006.
Final
beneficiary
The following mines have been indicated as the Coto Minero Jove S.A.,
Mina La Camocha S.A., Minas del Principado S.A., Minas de Valdeloso
S.L., Virgilio Riesco S.A., Carbones de Pedraforca S.A., Mina La Sierra
S.L. y Unión Minera Ebro-Segre S.A. Además, el pozo Figaredo de
HUNOSA.
Direct
beneficiary
The following mines have been indicated as the Coto Minero Jove S.A.,
Mina La Camocha S.A., Minas del Principado S.A., Minas de Valdeloso
S.L., Virgilio Riesco S.A., Carbones de Pedraforca S.A., Mina La Sierra
S.L. y Unión Minera Ebro-Segre S.A. Además, el pozo Figaredo de
HUNOSA.
Aid category Free Grant
Variability A progressive reduction of the amount of aid given to the coal-mining
industry over the years

Enhancing comparability of data on estimated budgetary support and tax expenditures for fossil fuels
August 2014 220
Objectives The stated objectives of the mechanism are:
1) Ensuring a correct “re-adjustment” of the subsidies given to
the industry over the previous years
2) Maintaining an adequate level of security of supplies through a
fixed quota level for coal production.
Conditionalit
y for
eligibility
In case of “large” companies (with an estimated capacity above
200.000 tonnes of coal) the conditionality to access the subsidy was to
have a substantial level of coal reserves and the potential for reducing
production. Regarding “small” enterprises (with a capacity less than
200.000 tonnes of coal)
Conditionalit
y for
magnitude of
subsidy
N/A
Source of
funding
Central government
Fuel Coal
Total amount Between 2005 and 2007 the total amount spend was around: € 1.421
mln
Information
sources
European Commission (2008), ‘Ayuda de Estado NN 80/2006 (ex N
301/2006, N 307/2006) - Ayuda estatal al sector del carbón para el
ejercicio 2006 & Ayuda de Estado NN 81/2006 (ex N 286/2006) - Plan
nacional de reserva estratégica del carbón 2006-2012’, URL:
http://ec.europa.eu/competition/state_aid/cases/217744/217744_886
116_30_2.pdf [04/04/2014]
Official Journal of the European Union (2008), ‘Authorisation for State
aid pursuant to Articles 87 and 88 of the EC Treaty Cases where the
Commission raises no objections’, ‘2008/C 297/01’, URL: http://eur-
lex.europa.eu/legal-
content/EN/TXT/?uri=uriserv:OJ.C_.2008.297.01.0001.01.ENG
[04/04/2014]
State Aid N 178 / 2010: Compensation service linked to a preferential
dispatch mechanism for domestic coal power stations
The subsidy provided a financial support of some selected (10) coal power plants,
which are be obliged to produce a specific amount of electricity through the use of
indigenous-made coal. (Under the conditions described in the Royal Decree 134/2010).
Within the mechanism, 97 the selected power stations will have priority over other
power plants for the delivery of electricity to the national grid. As the selected coal
power plants are in the proximity of important coal mines district, the coal nationally
97 “Preferential dispatch mecahnism”

Enhancing comparability of data on estimated budgetary support and tax expenditures for fossil fuels
August 2014 221
produced would be immediately used to burn electricity, as the possibility to export
coal at the moment is not economically viable.98 As some of the thermal plant (if not
all) would be closed down under without taking any measures, the Spanish
government decided to intervene and financially help the coal-fired stations. The
subsidy was enacted in 2010 and is due to be phased-out by the end of 2014.
Final
beneficiary
The following companies which directly owns or have stakes in the
selected coal-fired stations: Hidrocantabrico (HC Energia), Gas Natural
Fenosa, Endesa, Iberdola, E-On, EDF and EDP-HC Energia
Direct
beneficiary
The following coal-fired power stations: Soto de Ribera 3, Narcea 3,
Anllares, La Roble 2, Compostilla, Teruel, Guardo 2, Puentenuevo 3,
Escucha and Elcogas.
Aid category Financial compensation is given for the power plants that are burning
domestic ca. In this way, a minimum level of activity will be provided
and a coverture of production costs will be put in place for the above
mentioned coal-fired power plants.
Variability The variability of the subsidy is connected to the changes in the price
of the Spanish wholesale electricity market.
Objectives The stated objectives of the mechanism are:
1) To reinforce the Spanish electricity market which has been
particularly affected by the rapid surge of renewable energy.
According to the Spanish government, the development of coal-
fired capacity is needed under extreme weather conditions in
order to provide the stability of the electricity system.99
2) To ensure the security of electricity supplies in Spain through
an economic stimulus for the indigenous coal sources present
on the mainland territory of Spain.
3) Declining electricity demand in the coupled with a fall in
wholesale electricity prices in 2009 increased the financial
pressure on the coal-powered plants, which under business-as-
usual scenario would be forced to close. This event would
consequently affect the coal-mining activity in several regions
across Spain and force several mines to shut down activities.
Conditionality
for eligibility
To burn indigenously produced coal for the production of electricity for
the power plants that are eligible under the scheme.
Conditionality
for
The volumes of indigenous coal to be acquired from domestic coal
mines for each of the producers have been decided according to the
98 Given the low-quality of the Spanish coal, it would prove uneconomical to sell the
domestic quantities of coal to the international markets. 99 As pointed out by the Spainsh authorities, even If gas-fired gas stations are better
conceived for the typical intermittency of the renewable letricity sector, the financial
provisions laid down for the construction of new gas-fired power capacity in the
country would be more expensive than the current measures in place for this
compensation service. Moreover, the substantial lack of adequate electricity
interconnections between Spain and the two European neighbouring countries (France
and Portugal) reduced the possibility to fill the gap in case of declining renewable
energy production and rising demand.

Enhancing comparability of data on estimated budgetary support and tax expenditures for fossil fuels
August 2014 222
magnitude of
subsidy
previous procurement contracts in place and taking into account the
provision of the National Strategic Coal Reserve Plan for 2006-2012.
Over the years between 2011 and 2014, the volumes of electricity
concerned will not exceed 23,4 TWh per year (which is around 9% of
the national consumption of the nation).
Source of
funding
Public service compensation, which comes in the measure of a levy
imposed on electricity retail suppliers and to final electricity
consumers.
Fuel Coal
Total amount 2002: N/A
2011: € 400 Million
Information
sources
National Legislation:
- Law 54/1997, ‘Ley 54/1997, de 27 de noviembre, del Sector
Eléctrico’ URL:http://www.boe.es/diario_boe/txt.php?id=BOE-
A-1997-25340 [06/04/2010]
- Royal Decree 134/2010, ‘Real Decreto 134/2010, de 12 de
febrero, por el que se establece el procedimiento de resolución
de restricciones por garantía de suministro y se modifica el Real
Decreto 2019/1997, de 26 de diciembre, por el que se organiza
y regula el mercado de producción de energía eléctrica’, URL:
https://www.boe.es/diario_boe/txt.php?id=BOE-A-2010-15121
[06/04/2010]
- National Strategic Coal Reserves Plan for 2002-2012, ‘Plan
Nacional de reserva estrategica de carbon 2006-2012 y nuevo
modelo de desarrollo integral y sostenible de la comarcas
mineras’, URL: http://www.irmc.es/common/plan_carbon.pdf
[01/04/2014]
European Commission (2010), 'Ayuda estatal nº N 178/2010 – España
Compensación por servicio público asociada a un mecanismo de
entrada en funcionamiento preferente para las centrales de carbón
autóctono' URL:
http://ec.europa.eu/competition/state_aid/cases/236267/236267_115
1628_152_2.pdf [22/03/2014]
European Commission (2010), ‘State Aid N 178/2010 – Spain Public
service compensation linked to a preferential dispatch mechanism for
indigenous coal power plant’, URL:
http://ec.europa.eu/competition/state_aid/cases/236267/236267_115
0043_151_1.pdf [05/04/2014]
European Commission (2010), ‘State aid: Commission clears public
service compensation to electricity generators in Spain’, IP/10/1198,
URL: http://europa.eu/rapid/press-release_IP-10-1198_en.htm
[01/04/2014]
OECD (2013) ‘Inventory of Estimated Budgetary Support and Tax
Expenditures for Fossil Fuels’, OECD Publishing
Official Journal of the European Union (2010), ‘Authorisation for State

Enhancing comparability of data on estimated budgetary support and tax expenditures for fossil fuels
August 2014 223
aid pursuant to Articles 107 and 108 of the TFEU Cases where the
Commission raises no objections’, 2010/C 312/02, URL: http://eur-
lex.europa.eu/legal-
content/EN/TXT/?uri=uriserv:OJ.C_.2010.312.01.0005.01.ENG
[06/04/2014]
Oosterhuis, F. & Ten Brink, P. (eds.), (2014), ‘Paying the Polluter –
Environmentally Harmful Subsidies and their Reform’, Edward Elgar
Publishing.
Direct budgetary support for R&D purposes
R&D Schemes for fossil fuels
The data provided by the International Energy Agency highlighted that in the period
2002-2006 more than € 42 million were spent in RD&D for fossil fuels RD&D (mainly
coal). According to the Energy Policies of IEA Countries: Spain 2009 Review, in 2005
the CIEMAT, a public research body with a special focus on energy and environment,
allocated 9% of its energy research expenditure for fossil fuels technologies. This part
of the RD&D spending until 2005 was diverted into research for coal-related activities
and after that, the state started to divert an increasingly part of the funding in Oil &
Gas RD&D. Then, as it was reported in the IEA’s 2009 revision, combustion and
gasification technologies accounted for 5% of the CIEMAT budget. According to the
database, public RD&D support for fossil fuel was stopped after 2009.
Final
beneficiary
Several private-owned coal mining companies located in coal-
producing regions (e.g. the autonomous community of Castilla y Leon)
Direct
beneficiary
N/A
Aid category N/A
Variability N/A
Objectives Until 2005, mainly the bulk of the RD&D spending for fossil fuels was
focused on the development of Integrated gasification combined cycle
technologies and from 2006 CCS technologies absorbed a substantial
part of the funding.
Conditionality
for eligibility
N/A
Conditionality
for
magnitude of
subsidy
N/A
Source of
funding
Central Administration (Government)
Fuel RD&D spending was mainly focused on coal, and after 2005 on oil and
natural gas

Enhancing comparability of data on estimated budgetary support and tax expenditures for fossil fuels
August 2014 224
Total amount The following are for Government R&D in million EUR. Sum of
categories “oil and gas” and “coal” and separate figures reported for
“CO2 capture and storage” (IEA Energy RD&D statistics 2014).
Fossil Fuels (overall):
2002: € 3.2 mln
2011: € 0 mln (latest data available is for 2009 and it corresponds to
€ 2.3 mln)
Total amount in the period 2002-2011: € 32.8 mln
CO2 Carbon Capture and Storage
2007 (earliest): € 1,2 mln
2009 (latest): € 307,000
As already observed for the Austrian case, figures reported appear to
be quite low. In facts, reports from the OECD indicates that between
2006 and 2008, € 72 million were allocated through the CIUDEN
Foundation (established in 2006 by the Ministry of Science and
Innovation) for the construction of a demonstration plant for the
capture of CO2 in the mining district of El Bierzo.
Information
sources
IEA (2014) IEA Energy Technology RD&D Statistics, DOI:
10.1787/enetech-data-en [Accessed: 06/04/2014]
Official Journal of the European Union (2005), ‘Authorisation for State
aid pursuant to Articles 87 and 88 of the EC Treaty. Cases where the
Commission raises no objections’, 2005/C 125/03 URL:http://eur-
lex.europa.eu/LexUriServ/LexUriServ.do?uri=OJ:C:2005:125:0006:00
08:EN:PDF [06/04/2014]
European Commission (2004), ‘Ayuda estatal N 104/ 2003 – España
Régimen de incentivos mineros a empresas para los programas de
investigación y desarrollo, medio ambiente y formación minera para los
años 2003 – 2006 en la Comunidad Autónoma de Castilla y León’ URL:
http://ec.europa.eu/competition/state_aid/cases/138066/138066_471
887_3_2.pdf [05/04/2014]
European Commission (2008),'Ayuda estatal nº N 131/08 – España
Régimen de ayudas estatales a la investigación, desarrollo tecnológico
e innovación y programas medioambientales en el sector del carbón
para 2008-2012 - Prolongación de N 245/07'
URL:http://ec.europa.eu/competition/state_aid/cases/224720/224720
_869933_22_2.pdf [04/04/2014]
European Commission (2008) ‘Ayuda estatal nº N 131/08 – España
Régimen de ayudas estatales a la investigación, desarrollo tecnológico
e innovación y programas medioambientales en el sector del carbón
para 2008-2012 - Prolongación de N 245/07’ URL:
http://ec.europa.eu/competition/state_aid/cases/224720/224720_869
933_22_2.pdf [06/04/2014]
Official Journal of the European Union (2008), ‘Authorisation for State
aid pursuant to Articles 87 and 88 of the EC Treaty. Cases where the
Commission raises no objections’, 2008/C 15/02, URL:http://eur-
lex.europa.eu/legal-
content/EN/TXT/?uri=uriserv:OJ.C_.2008.015.01.0005.01.ENG
[06/04/2014]
Official Journal of the European Union (2008) 'Authorisation for State
aid pursuant to Articles 87 and 88 of the EC Treaty Cases where the
Commission raises no objections', 2008/C 329/02, URL:http://eur-
lex.europa.eu/legal-
content/EN/TXT/?uri=uriserv:OJ.C_.2008.329.01.0003.01.ENG

Enhancing comparability of data on estimated budgetary support and tax expenditures for fossil fuels
August 2014 225
[06/04/2014]
IEA (2009), ‘Energy Policies of IEA Countries: Spain 2009 Review’,
OECD Publishing.
IEA (2005), ‘Energy Policies of IEA Countries: Spain 2005 Review’,
OECD Publishing.
CIUDEN (2013), ‘Official Website’, URL:
http://www.ciuden.es/index.php/en/fundacion [07/04/2014]
Public investments in energy infrastructure
State Aid N 414/2000 & State Aid N 609/2007 – Gasification Plan for the
Valencian autonomous community
These two State Aids were conceived as way to extend the gas grid coverage also to
some disadvantaged parts of the Comunidad Valenciana. This project was
implemented also taking into account the difficult economic situation of the region and
the high level of unemployment. The first State aid (N 414/2000), covered the period
2000 – 2006 and a budget of around € 16,60 million. The State aid N 609/2007, is a
prosecution of the previous plan (as the application of the State aid N 414/2000
expired on December 2006) and it is planned to extend the project for the period
2007 – 2013, with an extimate budget expenditure of € 17.000.000.
Final
beneficiary
Companies specialized in the development and construction of gas
infrastructures (such as transport, distribution and final dispatchment)
Direct
beneficiary
Companies specialized in the development and construction of gas
infrastructures (such as transport, distribution and final dispatchment)
Aid category Free (non reboursable) grants
Objectives Foster the regional development of disadvantaged parts of the
Valencian Community through the expansion of the natural gas
network
Conditionality
for eligibility
There is a “geographical scope” in the subsidy as the State aid is only
applicable to companies which are operating in the Comunidad
Valenciana.
Conditionality
for
magnitude of
subsidy
N/A
Source of
funding
Regional government (Generalitat Valenciana)
Fuel Natural Gas
Total amount 2002: N/A
2011: € 3,6 mln (annual amount)
Information
sources
National Legislation
- Royal Decree 887/2006, ‘Real Decreto 887/2006, de 21 de julio,
por el que se aprueba el Reglamento de la Ley 38/2003, de 17
de noviembre, General de Subvenciones’ URL:

Enhancing comparability of data on estimated budgetary support and tax expenditures for fossil fuels
August 2014 226
http://www.boe.es/boe/dias/2006/07/25/pdfs/A27744-
27775.pdf [07/04/2014]
European Commission (2000), ‘Ayuda de Estado n° N 414/2000 -
ESPAÑA Plan de Gasificación de la Comunidad Valenciana’, URL:
http://ec.europa.eu/competition/state_aid/cases/136830/136830_115
3364_6_2.pdf [07/04/2014]
European Commission (2008), ‘State aid nº N 609/2007 - ESPAÑA Plan
de Gasificación de la Comunidad Valenciana’ URL:
http://ec.europa.eu/competition/state_aid/cases/222460/222460_788
966_2_1.pdf [02/04/2014]
European Commission (2008), ‘Ayuda de Estado nº N 609/2007 -
ESPAÑA Plan de Gasificación de la Comunidad Valenciana’, URL:
http://ec.europa.eu/competition/state_aid/cases/222460/222460_788
964_24_2.pdf [02/04/2014]
Official Journal of the European Communities (2008), ‘Authorisation for
State aid pursuant to Articles 87 and 88 of the EC Treaty Cases where
the Commission raises no objections’, 2008/C 124/01, URL: http://eur-
lex.europa.eu/legal-
content/EN/TXT/?uri=uriserv:OJ.C_.2008.124.01.0001.01.ENG
[07/04/2014]
Official Journal of the European Communities (2001), 'Authorisation for
State aid pursuant to Articles 87 and 88 of the EC Treaty Cases where
the Commission raises no objections', 2001/C 71/05, URL: http://eur-
lex.europa.eu/legal-
content/EN/TXT/PDF/?uri=CELEX:C2001/071/05&from=EN
[07/04/2014]
Tax expenditures
Excises and other specific taxes on energy use
Excise taxes
An excise tax is in place for gasoline, kerosene, diesel, LPG, Natural Gas and Fuel Oil
used in the transportation sector. Exice taxes are published by the: Dirección General
de Tributos (Subdirección General de Impuestos Especiales y Tributos sobre Comercio
Exterior) of the Ministry of Economy (Ministerio de Economía y Hacienda).100 Spain also
applies a sale tax in volume terms (Impuesto sobre las Ventas Minoristas de
Determinados Hidrocarburos) but abolished the system of additional regional taxes
applied for motor fuels in 2008. Natural gas and LPG are exempt from any excises if
used for heating purposes (also between the two reference years 2002 and 2011).
Electricity since January 1998 has a Special Tax equivalent to 4,864% of the price
100
In Spain, an special sale tax expressed in volume terms (Impuesto sobre las Ventas
Minoristas de Determinados Hidrocarburos) is also put in place at national level.

Enhancing comparability of data on estimated budgetary support and tax expenditures for fossil fuels
August 2014 227
supplied directly to the consumer.
Summary of fuels and use(r)s to which
reduced rates or exemptions applied in
the reporting years
A differentiated tax rate has been put in
place between diesel, gasoline and
LPG used for transportation. A lower
tax rate applies to Heavy Fuel oil used
for heating/process fuel purposes.
Domestic and International Aviation
fuels are exempt from excise duties
Domestic and International Navigation
fuels (Diesel and Heavy oil) are
exempt
A refund scheme is applied for diesel
used for agriculture. Temporary fuel
tax exemptions were put in place in
2008 for fisheries101
Rail fuel (diesel) is exempt from excises
Since 2006, a partial refund scheme is
in place for diesel fuel used for
farming activities and livestock102
There is a reduced tax rate for LPG,
Heavy fuel oil and diesel used in
mining and farming sectors.
Natural Gas used for heating purposes
for households and businesses does
not have excise rate (2002 and 2011)
Liquid Petroleum Gas used for heating
(business and households) is exempt
from excises.
Amount
calculated
(benchmark:
highest
excise per
unit of
energy
consumption)
Total € per unit of energy € per unit of CO2
2002: € 29,568 mln
2011: € 14,152 mln
2002: € 7.98 / GJ
2011: € 3.84 / GJ
2002: € 104.53 / ton
2011: € 50.09 / ton
Amount
calculated
(benchmark:
highest
excise per
unit of CO2
total per unit of energy per unit of CO2
2002: € 19,897 mln
2011: € 14,152 mln
2002: € 5.37 / GJ
2011: € 3.84 / GJ
2002: € 70.34 / ton
2011: € 50.09 / ton
101
The aids for the fisheries sector were addressed for fuel consumptions registered
between 1/11/2004 and 131/10/2005 102
The total amount of the refund scheme is equivalent to 78,71 €/1000 litres

Enhancing comparability of data on estimated budgetary support and tax expenditures for fossil fuels
August 2014 228
emissions)
Amount
calculated
(benchmark:
proposal new
energy
taxation
directive)
total per unit of energy per unit of CO2
2002: € 4477 mln
2011: € 3632 mln
2002: € 1.21 / GJ
2011: € 0.99 / GJ
2002: € 15.83 / ton
2011: € 12.86 / ton
Information
sources
Sources of Information – Excise tax rates:
National Legislation:
Law 24/2001 (Ley 24/2001, de 27 de diciembre, de Medidas Fiscales,
Administrativas y del Orden Social).URL:
http://www.boe.es/boe/dias/2001/12/31/pdfs/A50493-50619.pdf
[26/05/2014]
Law 49/1998 (Ley 49/1998, de 30 de diciembre, de Presupuestos
Generales del Estado para 1999) URL:
http://www.boe.es/diario_boe/txt.php?id=BOE-A-1998-30154
[06/04/2014]
Law 23/2001 (Ley 23/2001, de 27 de diciembre, de Presupuestos
Generales del Estado para el año 2002).
URL:http://www.boe.es/boe/dias/2001/12/31/pdfs/A50423-
50492.pdf [06/04/2014]
Law 39/2010 (Ley 39/2010, de 22 de diciembre, de Presupuestos
Generales del Estado para el año 2011). URL:
https://www.boe.es/diario_boe/txt.php?id=BOE-A-2010-19703
[06/04/2014]
Royal Decree 1517/2007 (Real Decreto 1517/2007, de 16 de
noviembre, por el que se establece un régimen temporal de ayudas
al sector pesquero, para el mantenimiento de la competitividad de la
actividad pesquera, acogidas al régimen deminimis)
URL:http://www.boe.es/boe/dias/2007/12/03/pdfs/A49815-
49816.pdf [31/03/2014]
National Plan for Strategic Coal Reserves 2006-2012 (2006), ‘Plan
Nacional de Resrva Estrategica de Carbon 2006-2012 y Nuevo
modelo de desarrollo integral y sostenibile de las comarcas mineras’
URL: http://www.irmc.es/common/plan_carbon.pdf [04/04/2014]
OECD (2013), ‘Energy Prices and Taxes, Volume 2013 Issue 3. Third
Quarter 2013’, OECD Publishing.
OECD (2013), ‘Taxing Energy Use: A graphical Analysis’, OECD Publishing.
OECD (2013) ‘Inventory of Estimated Budgetary Support and Tax
Expenditures for Fossil Fuels’, OECD Publishing
IEA (2009), ‘Energy Policies of IEA Countries: Spain 2009 Review’, OECD
Publishing

Enhancing comparability of data on estimated budgetary support and tax expenditures for fossil fuels
August 2014 229
Martini, R. (2012), “Fuel Tax Concessions in the Fisheries Sector”, OECD
Food, Agriculture and Fisheries Papers, No. 56, OECD Publishing.
EC (2014) VAT Rates applied in the Member States of the European Union,
Situation as of 13 January 2014,
URL:http://ec.europa.eu/taxation_customs/resources
/documents/taxation/vat/how_vat_works/rates/vat_rates_en.pdf
[02/04/2014].
EC DG TAXUD (2002) Excise duty tables – April 2002, Ref 1.014, April
2002.
EC DG TAXUD (2011) Excise duty tables, Part II – Energy products and
electricity, Ref 1032, January 2011
Sources of Information – energy balances:
IEA (2004), ‘Energy Statistics of OECD Countries 2004’, OECD Publishing.
IEA (2013), ‘Energy Statistics of OECD Countries 2013’, IEA.
IEA (2004), ‘Energy Balances of OECD Countries: 2004’, OECD Publishing.
IEA (2013), ‘Energy Balances of OECD Countries: 2013 Edition’, IEA.
Sources of Information – energy prices:
IEA (2004), ‘Energy Prices and Taxes, Vol. 2003/4’, OECD Publishing.
OECD (2013), ‘Energy Prices and Taxes, Volume 2013 Issue 3. Third
Quarter 2013’, OECD Publishing.
Eurostat (2014), Energy statistics – gas and electricity prices’ URL:
http://epp.eurostat.ec.europa.eu/portal/page/portal/energy/data/database,
[Accessed: 18/03/2014]
Value Added Tax
Categories
of energy
supply to
which a
reduced
VAT rate
was applied
in one or
both of the
reporting
years
VAT Rates
In 2002: A standard VAT (Impuesto sobre el Valor Añadido) rate of 16%
was applied to all the energy products which are under the scope of the
study (Fuel oil, Diesel, Natural Gas, Kerosene, Gasoline and Electricity)
2011: The 1st July 2010, the Standard VAT rate was increased from 16%
to 18%. Automatically, the VAT rate for all the energy products was
increased at 18% (no reductions for fossil fuels in the VAT rates were
applied by the Spanish government).103
Standard
rate
2002: 16%
2011: 18%
103
In 2009, the Canary Islands (Islas Canarias) applied a special Indirect Tax of 5%
instead of the 16% which was in place on the mainland.

Enhancing comparability of data on estimated budgetary support and tax expenditures for fossil fuels
August 2014 230
Reduced
rate104
2002: 7%
2011: 8%
Amount of
support
calculated
(refer to
Excel file)
2002: EUR 0 mln
2011: EUR 0 mln
Information
sources
Sources of Information for VAT Rates:
National Legislation:
Law 37/1992 (Ley del Impuesto sobre el Valor Añadido – Ley
37/1992), URL: https://www.boe.es/buscar/act.php?id=BOE-A-
1992-28740 [06/04/2014]
Law 26/2009 (Ley 26/2009 – de Presupuestos Generales del
Estado para el año 2010), URL:
https://www.boe.es/diario_boe/txt.php?id=BOE-A-2009-20765
[6/04/2014]
OECD (2013), ‘Energy Prices and Taxes, Volume 2013 Issue 3. Third
Quarter 2013’, OECD Publishing.
OECD (2013), ‘Taxing Energy Use: A graphical Analysis’, OECD
Publishing.
OECD (2013) ‘Inventory of Estimated Budgetary Support and Tax
Expenditures for Fossil Fuels’, OECD Publishing.
IEA (2009), ‘Energy Policies of IEA Countries: Spain 2009 Review’, OECD
Publishing
EC (2014) VAT Rates applied in the Member States of the European
Union, Situation as of 13 January 2014,
URL:http://ec.europa.eu/taxation_customs/resources
/documents/taxation/vat/how_vat_works/rates/vat_rates_en.pdf
[02/04/2014].
EC DG TAXUD (2002) Excise duty tables – April 2002, Ref 1.014, April
2002.
EC DG TAXUD (2011) Excise duty tables, Part II – Energy products and
electricity, Ref 1032, January 2011
Sources of Information – energy balances:
IEA (2004), ‘Energy Statistics of OECD Countries 2004’, OECD
Publishing.
IEA (2013), ‘Energy Statistics of OECD Countries 2013’, IEA.
IEA (2004), ‘Energy Balances of OECD Countries: 2004’, OECD
Publishing.
IEA (2013), ‘Energy Balances of OECD Countries: 2013 Edition’, IEA.
104
No reduced tax rate is applied for energy products under the scope of the study

Enhancing comparability of data on estimated budgetary support and tax expenditures for fossil fuels
August 2014 231
Sources of Information – energy prices:
IEA (2004), ‘Energy Prices and Taxes, Vol. 2003/4’, OECD Publishing.
OECD (2013), ‘Energy Prices and Taxes, Volume 2013 Issue 3. Third
Quarter 2013’, OECD Publishing.
Eurostat (2014), Energy statistics – gas and electricity prices’ URL:
http://epp.eurostat.ec.europa.eu/portal/page/portal/energy/data/databa
se [Accessed: 18/03/2014]
Assumptions taken into account during the calculations:
- The calculation did not take into account of the differentiated VAT
regime for fossil fuels in place for the autonomous community of
the Canary Islands due to lack of data
- Belgian conversion factors were used for almost all the sources
taken into account (National conversion factors could not be
found).
- As no emission factors were found for sub-bitumen coal products,
over the calculations the emission factor for bitumen were used
Tax expenditures in social contributions and personal income taxes
N.a.
Tax expenditures in corporate income taxes
Special Corporate Income Tax Regime
There is a special Corporate Income Tax rate in Spain which applies only for
companies engaged in exploration and investigation of potential hydrocarbon
reserves. This fiscal regime has been put in place in order to stimulate the discovery
of potential or yet-to-find oil and gas fields within the country.
Type of tax
expenditure
Advantageous tax regime for intangible assets, such as
geological seismic work and test drilling evaluation (Annual
rate equivalent to 50%)
Possible reduction of the tax rate, according to the ‘depletion
factor reserve’ (to a limit of 50% of the tax base)
Favourable compensation regime for offsetting tax-losses
Objectives The stated objectives of this tax regime are to encourage the
exploration of hydrocarbon reserves in the country.
Conditionality
for eligibility
The beneficiary of this subsidy must be an oil & gas company driven
only by investigation and exploration of hydrocarbons.
Conditionality
for
magnitude of
subsidy
N/A

Enhancing comparability of data on estimated budgetary support and tax expenditures for fossil fuels
August 2014 232
Fuel Oil and Gas (Hydrocarbons)
Total amount N/A
Information
sources
Ernst & Young (2011), ‘Global Oil and Gas Tax Guide 2011’, URL:
http://www.eisourcebook.org/cms/Global%20Oil%20and%20Gas%20
Tax%20Guide%202011.pdf [31/03/2014]
Tax expenditures in royalties
The royalties system put in place in Spain consists of a special corporate tax regime
(which is described above) and by a set of special rules which could be applicable to
Oil & Gas Companies.
The depletion factor reserve105 could be used only for companies which are
involved only into exploration and exploitation of hydrocarbons. These companies
could be eligible for a reduction of their tax base, and according to the Spanish law
could be equivalent to a reduction of 40% of the amount of the original tax base, or
up to 50% of the tax base. The total amount of the depletion factor is also
conditional to investments oriented at dismantling old fields or dismantling inactive
marine rigs.
An advantageous tax losses compensation regime is also in place for companies
involved in exploration and production activities and operators do not have a time limit
for offsetting the tax losses106
The companies have also a special regime for intangible assets,107 which could be
amortized at a maximum annual rate of 50%. Also, there is no maximum amortization
period for intangible assets.
A surface tax is applicable for oil and gas companies and it is calculated on a yearly
basis on the amount of land hectares used for exploration and/or exploitation
purposes. However, in case of research licences, the surface tax is considered as a
part of an intangible asset and could depreciated according to the special regime
described above.
Source:
Ernst & Young (2011), ‘Global Oil and Gas Tax Guide 2011’, URL:
http://www.eisourcebook.org/cms/Global%20Oil%20and%20Gas%20Tax%20Guide%
202011.pdf [31/03/2014]
105 The depletion factor reserve, is an accounting concept used in the mining and
petroleum industries. It is mainly used as a deduction which allows an operator to
account when product’s reserves are declining. 106 The companies are not subject to the normal 15-years maximum timeframe. 107 Itangible assets could be exploration expenses, exploration evaluation and
restoration of wells.
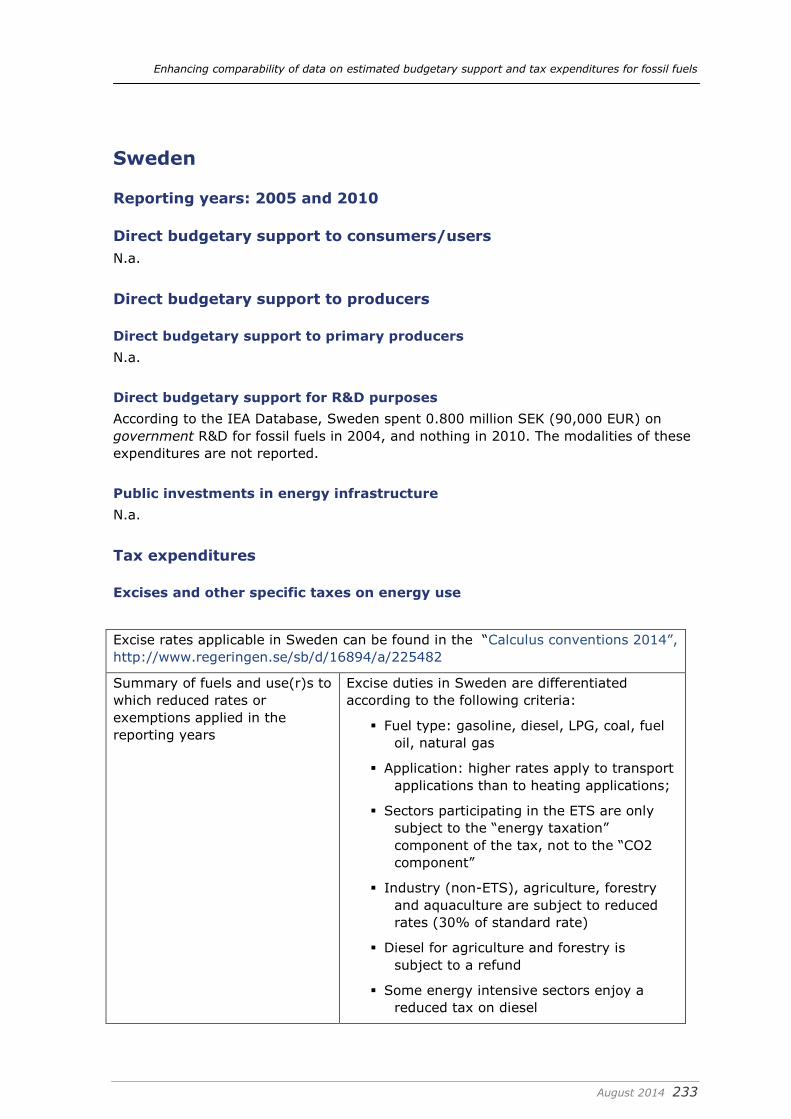
Enhancing comparability of data on estimated budgetary support and tax expenditures for fossil fuels
August 2014 233
Sweden
Reporting years: 2005 and 2010
Direct budgetary support to consumers/users
N.a.
Direct budgetary support to producers
Direct budgetary support to primary producers
N.a.
Direct budgetary support for R&D purposes
According to the IEA Database, Sweden spent 0.800 million SEK (90,000 EUR) on
government R&D for fossil fuels in 2004, and nothing in 2010. The modalities of these
expenditures are not reported.
Public investments in energy infrastructure
N.a.
Tax expenditures
Excises and other specific taxes on energy use
Excise rates applicable in Sweden can be found in the “Calculus conventions 2014”,
http://www.regeringen.se/sb/d/16894/a/225482
Summary of fuels and use(r)s to
which reduced rates or
exemptions applied in the
reporting years
Excise duties in Sweden are differentiated
according to the following criteria:
Fuel type: gasoline, diesel, LPG, coal, fuel
oil, natural gas
Application: higher rates apply to transport
applications than to heating applications;
Sectors participating in the ETS are only
subject to the “energy taxation”
component of the tax, not to the “CO2
component”
Industry (non-ETS), agriculture, forestry
and aquaculture are subject to reduced
rates (30% of standard rate)
Diesel for agriculture and forestry is
subject to a refund
Some energy intensive sectors enjoy a
reduced tax on diesel

Enhancing comparability of data on estimated budgetary support and tax expenditures for fossil fuels
August 2014 234
Until 2015, there is a special rebate for
energy intensive companies if the CO2
tax paid on heating or stationary
applications exceeds 1.2% of their
turnover
Households in northern Sweden enjoy a
reduced tariff on electricity
Companies participating in the “energy
efficiency programme” are exempted for
the energy tax on electricity for a 5-year
period
There is a specific tax on sulfur for peat,
coal, petroleum coal and other solid or
gaseous fossil fuels
In CHP plants that do not participate in the
ETS, the share of the fuel corresponding
to electricity production is exempted from
taxation; the tax rate applying to the
share corresponding to heating is 30% of
the standard tariff
CHP plants that do participate in the ETS
are exempted from the CO2 tax; the
energy tax only applies to heating, with a
tariff equal to 30% of the standard tariff
Due to data limitations, there are several
taxes and rebates for which we have not
been able to estimate the corresponding tax
expenditures: the rebates for CHP plants,
the specific exemptions for energy intensive
companies, the sulfur tax.
Amount calculated (benchmark:
highest excise per unit of
energy consumption)
year: 2005
year: 2010
total per unit of
energy
per unit of
CO2
€ 4279 mln
€ 5439 mln
€ 3.94 / GJ
€ 5.10 / GJ
€ 89.39 / ton
€ 118.16 / ton
Amount calculated (benchmark:
highest excise per unit of CO2
emissions)
year: 2005
year: 2010
total per unit of
energy
per unit of
CO2
€ 4279 mln
€ 5439 mln
€ 3.94 / GJ
€ 5.10 / GJ
€ 89.39 / ton
€ 118.16 / ton
Amount calculated (benchmark:
proposal new energy taxation
directive)
year: 2005
total per unit of
energy
per unit of
CO2
€ 406 mln
€ 155 mln
€ 0.37 / GJ
€ 0.15 / GJ
€ 8.47 / ton
€ 3.37 / ton

Enhancing comparability of data on estimated budgetary support and tax expenditures for fossil fuels
August 2014 235
year: 2010
Information sources http://www.regeringen.se/sb/d/16894/a/225482
Taxing Energy Use
e-mail correspondence with Swedish tax
administration
Value Added Tax
N.a.
Tax expenditures in social contributions and personal income taxes
N.a.
Tax expenditures in corporate income taxes
N.a.
Tax expenditures in royalties
N.a.

Enhancing comparability of data on estimated budgetary support and tax expenditures for fossil fuels
August 2014 236
United Kingdom
Reporting years: 2000 and 2011
The UK has progressively reduced subsidies to fossil fuels over the past 30 years in
line with EU and OECD guidelines. There are no end-user price controls, with all prices
being set by the market (Blyth et al., 2013)108.
Direct budgetary support to consumers/users
Schemes such as winter fuel payments for the elderly or cold-weather payments do
not depend on the price of fuels and are provided in-cash to eligible households. Most
of the remaining measures target consumption technologies such as low-carbon
vehicles and hydrogen refuelling equipment rather than energy use per se (OECD,
2013).
Direct budgetary support to producers
Direct budgetary support to primary producers
Name of the
scheme and short
description
From 2004 to 2009, the government subsidised maintaining
access to viable coal reserves at twelve deep mines.
Final beneficiary Mine operators.
Direct beneficiary
Aid category
Variability
Objectives They were required to ensure investments under unfavourable
global market price conditions.
Conditionality for
eligibility
Conditionality for
magnitude of
subsidy
Source of funding Central government.
Fuel Coal.
Total amount The total subsidies amounted to GBP 52.8 million over the five
years (which are outside the scope of the present study). Today
the selling price of domestic coal in the United Kingdom is freely
negotiated. Domestic coal prices are competitive with imports.
Since 2002, no state aid is given to support coal mine operating
108
House of Commons Environmental Audit Committee – Energy subsidies in the UK –
Written Evidence, URL:
http://www.publications.parliament.uk/pa/cm201314/cmselect/cmenvaud/writev/61/e
nergy.pdf

Enhancing comparability of data on estimated budgetary support and tax expenditures for fossil fuels
August 2014 237
costs and since 2008 none to maintain access to already
exploited coal reserves.
Information
sources
IEA (2012) Energy Policies of IEA Countries – The United
Kingdom, URL: http://www.oecd-ilibrary.org/energy/energy-
policies-of-iea-countries-united-kingdom-
2012_9789264170988-en;jsessionid=ejp6733p48qjk.x-oecd-
live-01
Name of the
scheme and short
description
UK Coal Operating Aid Scheme (data for 2000-2002)
The UK Coal Operating Aid Scheme (UKCOAS) was a temporary
programme designed to provide short-term financial support to
otherwise viable coal producers. It was introduced in 2000 for a
period of three years over which a total amount of GBP 162
million was to be spent in four tranches. The programme was
approved by the European Commission under the rules of the
former European Coal and Steel Community. Applications were
closed after 31 December 2002.
Final beneficiary Mine operators.
Direct beneficiary
Aid category
Variability
Objectives They were required to ensure investments under unfavourable
global market price conditions.
Conditionality for
eligibility
Conditionality for
magnitude of
subsidy
Source of funding Central government.
Fuel Coal.
Total amount It was introduced in 2000 for a period of three years over which
a total amount of GBP 162 million was to be spent in four
tranches. For the purpose of the present study, one third of
this amount, equivalent to € 66 million, is allocated to the year
2000.
Information
sources
OECD (2013) Inventory of Estimated Budgetary Support and
Tax Expenditures for Fossil Fuels
Direct budgetary support for R&D purposes
Name of the
scheme and
short
No specific scheme – IEA estimates presented

Enhancing comparability of data on estimated budgetary support and tax expenditures for fossil fuels
August 2014 238
description
Final
beneficiary
Direct
beneficiary
Aid category
Variability
Objectives A Spending Review undertaken in late 2010 concluded that
energy RD&D continues to be a political priority. DECC has been
allocated more than GBP 150 million over four years to support
the development and demonstration of low carbon energy
technologies. The government has also committed GBP 1 billion
for early demonstration of CCS-related technologies for coal-
fired power plants and potentially for gas-fired ones (IEA,
2012).
Conditionality
for eligibility
Conditionality
for magnitude
of subsidy
Source of
funding
IEA figures below refer to government R&D, not clear whether
this includes lower level government funding or only federal
level.
Fuel Oil, gas and coal as well as CCS reported below.
Total amount The following are for Government R&D in million EUR (nominal).
Sum of categories “oil and gas” and “coal” and separate figures
reported for “CO2 capture and storage”.
Oil, gas and coal:
2000: € 7.25 mln
2011: € 13.4 mln
CO2 capture and storage:
2000: € 0 mln
2011: € 39.28 mln (2010: € 68.65 mln – year also included due
to important fluctuation between across the years).
Information
sources
IEA (2014), IEA Energy Technology RD&D Statistics, DOI:
10.1787/enetech-data-en [accessed: 27/05/2014].
IEA (2012) Energy Policies in IEA Countries – The United
Kingdom 2012 Review, URL:
www.iea.org/publications/freepublications/publication/UK2012_f
ree.pdf
Public investments in energy infrastructure
The United Kingdom has a network of 4 800 km of private and government-owned oil
pipelines of which 2400 are privately owned. The government also operates a separate
oil pipeline system – the Government Pipeline and Storage System (GPSS) – supplying
a number of military airfields and with connections to some commercial airports, i.e.
Stansted and Manchester (IEA, 2012).
Tax expenditures
Excises and other specific taxes on energy use
Energy sales are subject to excise taxes which are levied on oil products used for
both commercial and non-commercial purposes.

Enhancing comparability of data on estimated budgetary support and tax expenditures for fossil fuels
August 2014 239
Name of the tax
scheme and short
description
Absence of excise duties on specific fuel types/for specific
purposes
Summary of fuels
and use(r)s to
which reduced
rates or
exemptions applied
in the reporting
years
No excise duties on fuel (kerosine, diesel, heavy fuel oil) used in
the categories:
international bunkers
international marine bunkers.
Absence of excise duty on LPG, natural cas, coal and electricity
used for heating purposes (both business and non-business).
Tax rate for LPG used for agriculture, horticulture, pisciculture
and forestry is zero in 2011.
Amount calculated
(benchmark:
highest excise per
unit of energy
consumption)
total per unit of energy per unit of CO2
2000: € 19,735
mln
2011: € 23,187
mln
2000: € 3.26/ GJ
2011: € 3.95 / GJ
2000:€ 42.25 / ton
2011: € 48.33 / ton
Amount calculated
(benchmark:
highest excise per
unit of CO2
emissions)
total per unit of energy per unit of CO2
2000: € 19,735
mln
2011: € 23,187
mln
2000: € 3.26/ GJ
2011: € 3.95 / GJ
2000:€ 42.25 / ton
2011: € 48.33 / ton
Amount calculated
(benchmark:
proposal new
energy taxation
directive)
total per unit of energy per unit of CO2
2000: € 4411 mln
2011: € 3704 mln
2000: € 0.73 / GJ
2011: € 0.63 / GJ
2000: € 9.44 / ton
2011: € 7.72 / ton
Information
sources
OECD (2013) Inventory of Estimated Budgetary Support and Tax
Expenditures for Fossil Fuels
IEA (2004), ‘Energy Statistics of OECD Countries 2000-2001’,
OECD Publishing.
IEA (2013), ‘Energy Statistics of OECD Countries 2013’, IEA.
IEA (2002), ‘Energy Prices & Taxes – Quarterly Statistics, Fourth
Quarter 2001’, OECD/IEA
IEA (2013), ‘Energy Prices and Taxes – Quarterly Statistics,
Third Quarter 2013’, OECD/IEA
IEA, Energy Balances of OECD Countries
EC DG TAXUD (2002), ‘Excise duty tables – 2000’, Ref 1010,
November 2000
EC DG TAXUD (2011), ‘Excise duty tables, Part II – Energy
products and electricity’, Ref 1032, January 2011
EC (2014) VAT Rates applied in the Member States of the

Enhancing comparability of data on estimated budgetary support and tax expenditures for fossil fuels
August 2014 240
European Union, Situation as of 13 January 2014,
URL:http://ec.europa.eu/taxation_customs/resources
/documents/taxation/vat/how_vat_works/rates/vat_rates_en.pdf
[02/04/2014].
In addition, the literature mentions excise related subsidies that could not yet be
verified but that are most probably already included in the data that was used for the
calculation and therefore can be assumed to be included in the information provided
above. These include:
Name of the tax scheme
and short description
Reduced Rate of Excise for Red Diesel (no data
available)
Summary of fuels and
use(r)s to which reduced
rates or exemptions
applied in the reporting
years
The use of “red diesel” (i.e. dyed diesel) and other such
petroleum products in the United Kingdom is subject to a
reduced rate of excise duty. Eligible uses include off-road
vehicles such as those used for agriculture, road
construction or clearing snow.
Information sources OECD (2013) Inventory of Estimated Budgetary Support
and Tax Expenditures for Fossil Fuels
Energy sales are also subject to a Climate Change Levy (CCL). Businesses users
pay the CCL on purchases of oil products (excluding transport fuels), natural gas, coal
and electricity. There are certain discounts and exemptions from the CCL, depending
on the source and use of the fuel (power generators are exempt, for example).
Value Added Tax
Categories of energy supply to
which a reduced VAT rate was
applied in one or both of the
reporting years
The domestic consumption of both heating fuel and
power in the UK is subject to a much lower rate of
VAT than that applied to regular products.
Reduced VAT rate applies to:
Different types of fuels that can be used when
used for heating non-business purposes (e.g.
natural gas, coal, electricity).
A reduced VAT rate of 5% is applied for LPG
used for heating both business and non-
business sectors in 2000, only for heating
non-business in 2011
A reduced VAT rate of 5% is applied for Diesel
used for heating purposes (business and non
business) in 2000 and and only for heating
business use in 2011
Fuel Oil and Kerosene used for heating
(domestic uses) had a VAT rate of 5% since
2000. In 2011, Kerosene’s VAT rate was
equal to the standard VAT rate

Enhancing comparability of data on estimated budgetary support and tax expenditures for fossil fuels
August 2014 241
A discounted VAT rate of 17,50% (instead of
20%) is applied for Gas Oil/Diesel used for
heating (business sector) in 2011. The VAT
rate for Diesel used for heating purposes
(with deliveries of less than 2300 liters) in
2000 was 5%
A reduced VAT rate of 5% is applied for LPG
used for heating for non-business purposes
(2011)
A reduced VAT rate of 5% is applied for Coal
and Coke products used for domestic heating
purposes (2011)
The VAT rate for applied for LPG and Methane
in 2000 was 5% (for domestic uses and
deliveries of less than 2300 liters)
Standard VAT rate applies to:
The above mentioned energy sources/fuels
when not used for heating purposes
Other fuels, i.e.
Petrol
Kerosene
Heavy fuel oil
Standard rate 2000: 17.5%
2011: 20%
Reduced rate 2000: 5%
2011: 5%
Amount of support calculated
total per unit of
energy
per unit of CO2
2000: € 2677
mln
2011: € 4361
mln
2000: € 1.56 /
GJ
2011: € 2.82 /
GJ
2000: € 20.03 /
ton
2011: € 37.12 /
ton
Information sources OECD (2013), ‘Inventory of Estimated Budgetary
Support and Tax Expenditures for Fossil Fuels’,
OECD Publishing
IEA (2004), ‘Energy Statistics of OECD Countries
2000-2001’, OECD Publishing.
IEA (2013), ‘Energy Statistics of OECD Countries
2013’, IEA.
IEA (2002), ‘Energy Prices & Taxes – Quarterly
Statistics, Fourth Quarter 2001’, OECD/IEA
IEA (2013), ‘Energy Prices and Taxes – Quarterly
Statistics, Third Quarter 2013’, OECD/IEA

Enhancing comparability of data on estimated budgetary support and tax expenditures for fossil fuels
August 2014 242
According to the OCED, the UK “subsidizes the use of fossil fuels by households by
almost £4 billion per year (OECD, 2013) by charging them 5 per cent VAT instead of
the standard 20 per cent rate”. According to Blyth et al (2013) by far the largest
subsidy for fossil fuels in the UK relates to the lower VAT rate of 5% for domestic
energy supplies (compared to 20% for the economy as a whole). Since VAT is a
general economy-wide tax, any reduction from the general national rate is considered
by the OECD to be a subsidy. Domestic energy supplies have always been taxed at a
lower rate in the UK, since being raised from zero to 5% in 1994, but this practice is
unusual, as most countries tax energy at the prevailing rate of VAT (see Section 3.1).
In 2011, this tax was worth £81m for coal, £380m for oil and £3,510m for gas (Blyth
et al, 2013).
Tax expenditures in social contributions and personal income taxes
N.a.
Tax expenditures in corporate income taxes
Name of the
scheme and
short
description
Tax breaks for North Sea oil and gas production. Most new oil
and gas fields in the North Sea pay as little as 30 per cent tax
because of tax breaks. 80 per cent (32 out of 40) of oil and gas
projects started in the North Sea since Budget 2009 have done so
benefitting from a ‘field allowance’. This allowance was first
introduced in 2009 and later extended to encourage the development
of small or technically-challenging fields.
The field allowance provides companies with a partial exemption from
the Supplementary Charge. Relief is calculated at the level of the
field but is provided at the company-level. Unclaimed allowances can
be carried forward.
Type of tax
expenditure
In theory, oil and gas production in the UK is subject to a high rate of
taxation:
a higher corporation tax rate of 30% on profits from oil and
gas production
an extra ‘supplementary charge’ of another 32%, taking the
tax rate to 62%. In some fields, this charge is reduced by
‘field allowances’
In addition, profits from older fields (before 1993) must pay the old
Petroleum Revenue Tax (PRT) of 50%, which can be deducted from
their corporation tax base. In practice this means profits from around
30 such fields will pay a marginal tax rate of 81 per cent (DECC,
2013).
In practice, profits from most newer fields are not subject to anything
close to the 62% tax rate because of the rapid expansion of tax
breaks called field allowances.
Objectives Field allowances were introduced by Alistair Darling in Budget 2009
and have since been expanded by George Osborne. Field allowances
give tax breaks to encourage production from “small or technically

Enhancing comparability of data on estimated budgetary support and tax expenditures for fossil fuels
August 2014 243
challenging new fields”. In 2012 new field allowances have been
created, and an existing one has been expanded:
“to increase investment and production in fields and projects that are
economic but - for tax reasons - are considered to be commercially
marginal. They support the Government's overall aim of maximising
the economic production of the UK's hydrocarbon resources” (HMRC,
2013).
Conditionality
for eligibility
Before 2012, qualifying fields had to be small in size, feature ultra-
high pressure or temperature, possess ultra-heavy oil reserves, or be
remote deep-water gas fields. In March 2012 and July 2012 the
Government announced further categories of qualifying field in
respect of particularly deep fields with sizeable reserves, and large
shallow-water gas fields. These changes came into force on 21
December 2012. This extension is expected to generate revenue
losses of about GBP 20 million per year (OECD, 2013).
The field allowance is available for a company that is a licensee in an
eligible oil field, being an oil field which is an additionally-developed
oil field or a new oil field.
A new oil field is a qualifying oil field and one which receives its first
authorisation of development (in whole or part) on or after 22 April
2009. The field allowance applies to accounting periods ending on or
after that date. However, a field that has been decommissioned and
is then redeveloped can qualify for the field allowance if certain
conditions are fulfilled, see OT21407 below.
A qualifying field is a field that on the authorisation day is a small
field, an ultra heavy oil field, an ultra high pressure/high temperature
oil field or a deep water gas field, as defined in the legislation. Fields
continue to be determined by DECC on geological grounds.
Data published by DECC shows that since field allowances were
introduced in 2009, 80 per cent of newly-approved oil and gas fields
have benefitted from one of these tax breaks (DECC, 2013a)
Conditionality
for
magnitude of
subsidy
The field allowance provides companies with a partial exemption from
the Supplementary Charge. Relief is calculated at the level of the
field but is provided at the company-level.
Fuel Oil and gas.
Total amount Allowances have been given since Budget 2012 that are worth over
£800 million in direct subsidy to the oil and gas industry (FoE, 2013).
The total estimated or reported amount of tax expenditure in 2012
was estimated to be € 1 billion (FoE, 2013). The 2012 extension of
the field allowances to very deep fields with sizeable reserves, and
large shallow-water gas fields was expected to generate revenue
losses of about GBP 20 million per year (HM Treasury, 2012).
Government’s
position
It must be noted that the governments position is that this is not a
fossil fuel subsidy.

Enhancing comparability of data on estimated budgetary support and tax expenditures for fossil fuels
August 2014 244
The government argues that “Oil and gas produced in the UK is
subject to a tax on profits of 62% for new fields and 81% for older
fields—significantly higher than the mainstream corporation tax rate.
This ensures the taxpayer benefits from highly profitable fields.”
“The Government has introduced field allowances for more
challenging categories of field that are economic, but commercially
marginal at the high rate of tax. Allowances support projects which
would not have gone ahead at 62% or 81% tax rates. Such fields are
relieved of the 32% supplementary charge for a portion of their
profits—but they still pay ring fence corporation tax at 30% for this
portion, higher than the mainstream corporation tax rate.”
“The Government does not accept the assertion that the oil and gas
tax regime represents a subsidy in any form. Even taking into
account the allowances, oil and gas companies pay a higher rate than
other companies on their ring fence profits. The tax rates and
associated allowances are designed in such a way to maximise the
economic production of oil and gas, while ensuring a fair return for
the taxpayer.” (House of Commons Environemntal Audit Committee,
2014)
Information
sources
FoE (2013) Briefing: Fossil fuel tax breaks in the UK
DECC (2013) DECC, ‘Government Revenues from UK oil and gas
production’,
https://www.gov.uk/government/uploads/system/uploads/attachmen
t_data/file/15756/4579-og-revenue-table.pdf
DECC (2013a) ‘Full Field Approvals’, URL:
www.gov.uk/government/uploads/system/uploads/attachment_data/
file/49932/Full_List_of_Approvals__January_2013_.xls
HMRC (2013) OT21405 - Field allowance: what is the field
allowance?, URL:
http://www.hmrc.gov.uk/manuals/otmanual/ot21405.htm
House of Commons Environmental Audit Committee (2014) Energy
subsidies: Government Resonse to the Committee’s Ninth Report of
Session 2013-14, URL:
http://www.publications.parliament.uk/pa/cm201314/cmselect/cmen
vaud/1103/1103.pdf
Tax expenditures in royalties
Taxation of the oil and gas sector in the United Kingdom occurs through a variety of
taxes. Fields approved for development prior to 16 March 1993 remain subject to the
old Petroleum Revenue Tax (PRT), which was instituted in 1975. The PRT is a project-
based tax that is levied at a rate of 50% of the profits from a given field. It allows for
the full deduction of both operating and capital expenditures. The PRT does not,

Enhancing comparability of data on estimated budgetary support and tax expenditures for fossil fuels
August 2014 245
however, allow the deduction of interest costs and other financing charges from
taxable profits (OECD, 2013).
Subsidy Amount involved
Petroleum Revenue Tax
(PRT)-related
breaks/exemptions
Petroleum: estimated 196 million EUR (159 million
GBP) in 2011; Natural gas: estimated 149 million EUR
(121 million GBP) in 2011 (OECD, 2013)
Meanwhile, oil and gas corporations are also subject to a modified version of the
regular corporation tax, namely the Ring-Fence Corporation Tax (RFCT). The
imposition of a “ring fence” around upstream oil and gas activities means that these
particular activities are to be treated separately for tax purposes from any other trade
in which oil and gas companies may be engaged. This therefore allows upstream oil
and gas activities to be taxed differently at the company-level. Differences in taxation
include, for instance, the impossibility for companies to use losses in other activities as
deductions against the income arising from oil and gas extraction (OECD, 2013).
While all fields are subject to the RFCT, those that were approved for development
prior to 16 March 1993 can deduct the amount of PRT taxes paid from their RFCT tax
base. This ensures that the fields that are still subject to the old PRT regime are not
taxed twice on the same profits. In addition, all types of fields are liable to the so-
called Supplementary Charge (SC), which was introduced in the Finance Act of 2002.
The SC is a 32% tax on profits from oil and gas production that is levied on top of the
RFCT (OECD, 2013).
The immediate write-off of both capital and exploration-and-development
expenditures is normally considered under the systems in many countries to amount
to a preferential tax treatment. The reason is that in calculating taxable profits in most
income-tax systems, capital expenses are allocated over the period to which they
contribute to earnings.
Allowing the immediate writing-off these types of expenditure therefore provides
companies with something akin to a zero-interest loan from the government since it
delays the collection of taxes. A present-value calculation would indeed show a
positive transfer from the government to the companies benefiting from such
provisions (OECD, 2013).
However, when combined with impossibility for companies to deduct interest costs and
other financing charges, the immediate write-off of both capital and exploration-and
development expenditures may not be considered a preferential tax treatment. This is
due to the fact that this particular combination of tax provisions may approximate
what is known as a “cash-flow” tax system. Cash-flow tax systems can be theoretically
equivalent to the more common imputed-income tax systems where the objective is to
levy a neutral business tax (Boadway and Bruce, 1984). For that reason, provisions
such as the expensing of exploration and development costs may not be preferential
tax provisions in the particular case of the United Kingdom (OECD, 2013).
Reference:
OECD (2013). Inventory of Estimated Budgetary Support and Tax Expenditures for
Fossil Fuels 2013, http://www.oecd-ilibrary.org/environment/inventory-of-estimated-
budgetary-support-and-tax-expenditures-for-fossil-fuels-2013_9789264187610-en,
accessed 11/02/13.

Enhancing comparability of data on estimated budgetary support and tax expenditures for fossil fuels
August 2014 246
Annex B: List of Member State experts
Member State Partner Expert
Austria IEEP Bettina Kretschmer
Belgium VITO Hans Michiels
Bulgaria IEEP Keti Medarova-Bergstrom
Croatia BIO (Deloitte) Martina Aleksic
Cyprus BIO Andreas Mitsios
Czech Republic BIO Andreas Mitsios
Denmark BIO Adrian Tan
Estonia BIO Marie Kutser
Finland VITO Caroline Lemeire
France BIO Benoît Tinetti
Germany IEEP Bettina Kretschmer
Greece BIO Andreas Mitsios
Hungary IEEP Andrea Illes
Ireland IEEP Sirini Withana
Italy IEEP Daniela Russi
Latvia subcontractor Andra Blumberga
Lithuania subcontractor Viktorija Bobinaite
Luxembourg VITO Hans Michiels
Malta subcontractor Jonathan Cauchi
Netherlands IVM Frans Oosterhuis
Poland BIO Lidia Wisniewska
Portugal BIO Fabio Menten
Romania subcontractor Raluca Alexandru
Slovakia BIO Martina Solska
Slovenia BIO (Deloitte) Martina Aleksic
Spain IEEP Daniela Russi
Sweden VITO Caroline Lemeire
United Kingdom IEEP Leonardo Mazza

Enhancing comparability of data on estimated budgetary support and tax expenditures for fossil fuels
August 2014 247
Annex C: Share of fossil fuels in electricity production by Member State
reporting year in period 2000-2005
most recent reporting year
Austria 26,6% 31,4%
Belgium 38,4% 39,7%
Bulgaria 58,7% 53,5%
Croatia 40,4% 40,4%
Cyprus 100,0% 98,1%
Czech Rep. 76,0% 59,8%
Denmark 82,8% 66,2%
Estonia 99,0% 91,5%
Finland 43,4% 41,0%
France 9,2% 9,8%
Germany 62,7% 58,6%
Greece 93,1% 81,4%
Hungary 55,9% 49,2%
Ireland 92,9% 86,4%
Italy 79,8% 72,4%
Latvia 30,6% 45,5%
Lithuania 17,7% 66,7%
Luxembourg 0,0% 0,0%
Malta 100,0% 100,0%
Netherlands 90,7% 85,8%
Poland 96,7% 92,6%
Portugal 80,7% 46,2%
Romania 61,6% 47,4%
Slovakia 27,9% 24,8%
Slovenia 36,6% 35,4%
Spain 58,6% 46,0%
Sweden 2,5% 5,0%
United Kingdom 73,9% 75,8%
Source: Eurostat data, except Croatia. The figure for Croatia is the capacity of power
plants in that country in 2010 (source:
http://www.eihp.hr/hrvatski/projekti/unece/pdf/bibilioteka/Energy%20profile%20-
%202010.pdf).