Embed Size (px)
Citation preview
Enhancing Coordination of Behavioral Health Services after Superstorm
Sandy: Planning for Future Disasters
HQSI
Updated Data Profile: Atlantic City and Ventnor City Community Medicare
Fee-for-Service Beneficiaries
DRAFTDemographics, Behavioral Health Conditions, and Utilization of
Health Services (Medicare Fee-for-Service Beneficiaries)
Rev. (5/9/14)
May 9, 2014
This material was prepared by Healthcare Quality Strategies, Inc. (HQSI), the Medicare Quality Improvement Organization for New Jersey, under contract with the Centers for Medicare & Medicaid Services (CMS), an agency of the U.S. Department of Health and Human Services. The contents presented do not necessarily reflect CMS policy. 10SOW-NJ-SSS-14-05(a) 05/14

This Page Left Intentionally Blank
Table of ConTenTs
aTlanTiC CiTy and VenTnor CiTyHealthcare Quality Strategies, Inc. | A-1Enhancing Coordination of Behavioral Health Services after Superstorm Sandy: Planning for Future Disasters
Preface ...............................................................................................................................1Introduction ......................................................................................................................2HQSI Project Team ...........................................................................................................7Acknowledgements ...........................................................................................................8Executive Summary ..........................................................................................................9Demographics ................................................................................................................ 11• Total Medicare FFS Beneficiaries ...................................................................................11• Percent of Medicare FFS Beneficiaries in the General Population in 2012 ..............11• Percent of Medicare FFS Beneficiary Population by Female ......................................11• Percent of Medicare FFS Beneficiary Population by Race ..........................................12• Percent of Medicare FFS Beneficiary Population by Age ............................................12• Median Household Income ............................................................................................12
Behavioral Health Conditions ...................................................................................... 13• Prevalence and Incidence ................................................................................................13
– Summary .......................................................................................................................13 – Depression or Proxy Disorders ..................................................................................16 – Depression.....................................................................................................................22 – Anxiety Disorders ........................................................................................................23 – Adjustment Disorders .................................................................................................24 – Post-Traumatic Stress Disorder ..................................................................................25 – Alcohol or Substance Abuse .......................................................................................26 – Substance Abuse Alone ...............................................................................................27 – Suicide and Intentional Self-Inflicted Injury ............................................................28
• Risk Factors for Depression or Proxy Disorders ..........................................................29 – Summary .......................................................................................................................29 – Any of the Top Five Risk Factors for Depression or Proxy Disorders ..................30 – Alzheimer's Disease and Related Disorders or Senile Dementia ...........................33 – Sleep Disturbance .........................................................................................................33 – Substance or Alcohol Abuse or Tobacco Use ...........................................................33 – Hip/Pelvic Fractures ....................................................................................................34 – Amputations .................................................................................................................34
Utilization ...................................................................................................................... 35• Utilization of Outpatient Behavioral Health Services .................................................35
– Assessments ..................................................................................................................35 › Summary ...................................................................................................................35 › Depression Screening ..............................................................................................35
Table of ConTenTs
aTlanTiC CiTy and VenTnor CiTyA-2 | Healthcare Quality Strategies, Inc. Enhancing Coordination of Behavioral Health Services after Superstorm Sandy: Planning for Future Disasters
› Neuropsychological Tests ........................................................................................40 › Psychiatric Diagnostic Procedures .........................................................................42
– Therapies .......................................................................................................................44 › Summary ...................................................................................................................44 › Individual Psychotherapy ........................................................................................45 › Family Psychotherapy ..............................................................................................47 › Group Psychotherapy...............................................................................................48
• Inpatient Health Services ................................................................................................49 – Summary .......................................................................................................................49 – Psychiatric Hospital Admissions ................................................................................50 – Acute Care Hospitals ...................................................................................................51
› Admissions ................................................................................................................51 › Observation Stays .....................................................................................................52 › Emergency Department Visits ................................................................................53
– Within 30 Days of Acute Care Hospital Discharge .................................................54 › Summary ...................................................................................................................54 › 30-Day Hospital Readmissions ...............................................................................55 › Observation Stays Within 30 Days of Discharge .................................................56 › Emergency Department Visits Within 30 Days of Discharge ............................57
– Other Settings ...............................................................................................................58 › Summary ...................................................................................................................58 › Home Health Agency Services ...............................................................................59 › Skilled Nursing Facility Services ............................................................................60 › Hospice Services .......................................................................................................61 › Medical Rehabilitation Services .............................................................................62
• Listing of Major Health Providers..................................................................................63• Atlantic City and Ventnor City Community Providers ..............................................64• Appendix A: Behavioral Health Conditions .................................................................65• Appendix B: Risk Factors for Depression or Proxy Disorders ...................................68• Appendix C: Utilization of Outpatient Mental Health Services ................................72• Appendix D: Utilization of Services – Inpatient and Other Settings ........................74• Appendix E: Time Frames and Formulae .....................................................................76• Appendix F: References ...................................................................................................77• Appendix G: Provider Summary Tables and Provider Listings .................................78
Index of Figures ............................................................................................................. 81
PrefaCe
Healthcare Quality Strategies, Inc. | 1Enhancing Coordination of Behavioral Health Services after Superstorm Sandy: Planning for Future DisastersaTlanTiC CiTy and VenTnor CiTy
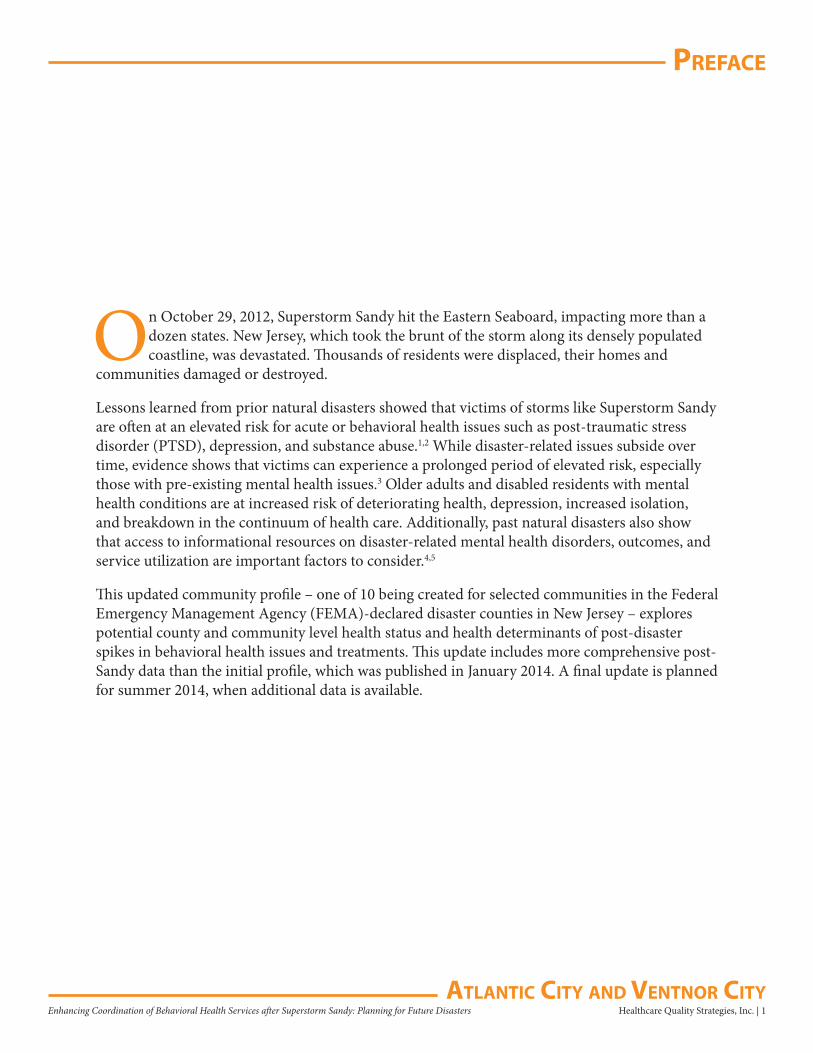
On October 29, 2012, Superstorm Sandy hit the Eastern Seaboard, impacting more than a dozen states. New Jersey, which took the brunt of the storm along its densely populated coastline, was devastated. Thousands of residents were displaced, their homes and
communities damaged or destroyed.
Lessons learned from prior natural disasters showed that victims of storms like Superstorm Sandy are often at an elevated risk for acute or behavioral health issues such as post-traumatic stress disorder (PTSD), depression, and substance abuse.1,2 While disaster-related issues subside over time, evidence shows that victims can experience a prolonged period of elevated risk, especially those with pre-existing mental health issues.3 Older adults and disabled residents with mental health conditions are at increased risk of deteriorating health, depression, increased isolation, and breakdown in the continuum of health care. Additionally, past natural disasters also show that access to informational resources on disaster-related mental health disorders, outcomes, and service utilization are important factors to consider.4,5
This updated community profile – one of 10 being created for selected communities in the Federal Emergency Management Agency (FEMA)-declared disaster counties in New Jersey – explores potential county and community level health status and health determinants of post-disaster spikes in behavioral health issues and treatments. This update includes more comprehensive post-Sandy data than the initial profile, which was published in January 2014. A final update is planned for summer 2014, when additional data is available.
inTroduCTion
2 | Healthcare Quality Strategies, Inc. Enhancing Coordination of Behavioral Health Services after Superstorm Sandy: Planning for Future Disasters aTlanTiC CiTy and VenTnor CiTy
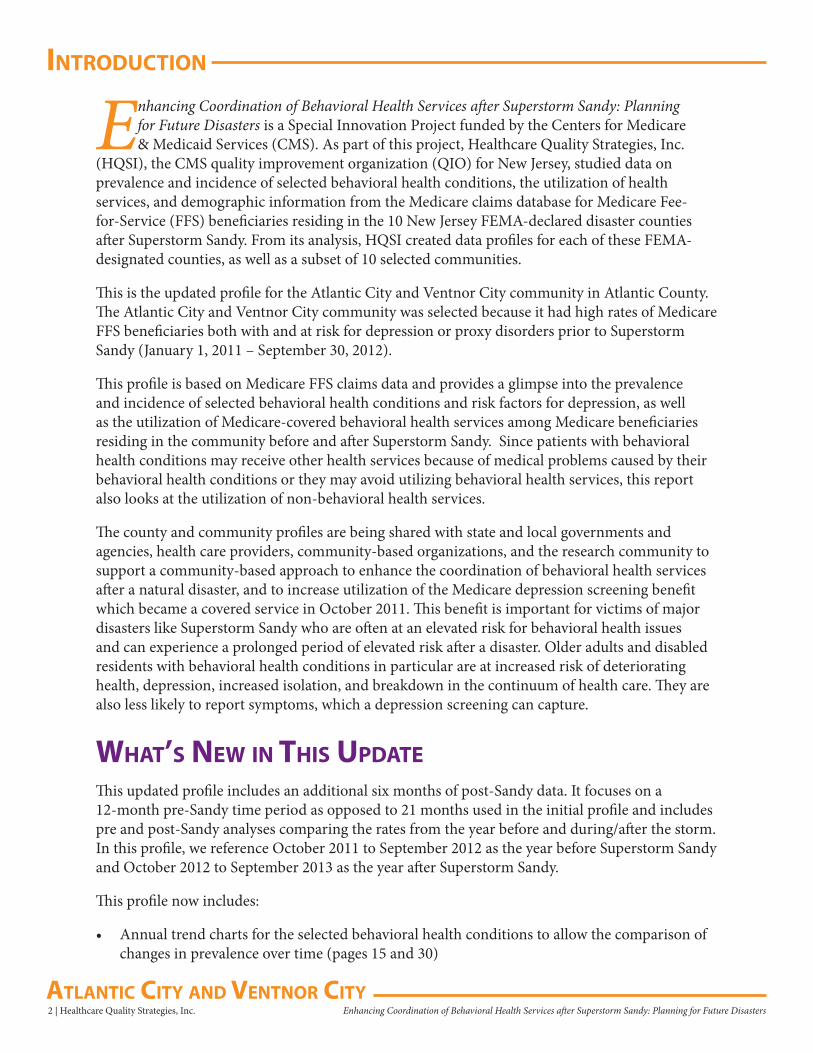
Enhancing Coordination of Behavioral Health Services after Superstorm Sandy: Planning for Future Disasters is a Special Innovation Project funded by the Centers for Medicare & Medicaid Services (CMS). As part of this project, Healthcare Quality Strategies, Inc.
(HQSI), the CMS quality improvement organization (QIO) for New Jersey, studied data on prevalence and incidence of selected behavioral health conditions, the utilization of health services, and demographic information from the Medicare claims database for Medicare Fee-for-Service (FFS) beneficiaries residing in the 10 New Jersey FEMA-declared disaster counties after Superstorm Sandy. From its analysis, HQSI created data profiles for each of these FEMA-designated counties, as well as a subset of 10 selected communities.
This is the updated profile for the Atlantic City and Ventnor City community in Atlantic County. The Atlantic City and Ventnor City community was selected because it had high rates of Medicare FFS beneficiaries both with and at risk for depression or proxy disorders prior to Superstorm Sandy (January 1, 2011 – September 30, 2012).
This profile is based on Medicare FFS claims data and provides a glimpse into the prevalence and incidence of selected behavioral health conditions and risk factors for depression, as well as the utilization of Medicare-covered behavioral health services among Medicare beneficiaries residing in the community before and after Superstorm Sandy. Since patients with behavioral health conditions may receive other health services because of medical problems caused by their behavioral health conditions or they may avoid utilizing behavioral health services, this report also looks at the utilization of non-behavioral health services.
The county and community profiles are being shared with state and local governments and agencies, health care providers, community-based organizations, and the research community to support a community-based approach to enhance the coordination of behavioral health services after a natural disaster, and to increase utilization of the Medicare depression screening benefit which became a covered service in October 2011. This benefit is important for victims of major disasters like Superstorm Sandy who are often at an elevated risk for behavioral health issues and can experience a prolonged period of elevated risk after a disaster. Older adults and disabled residents with behavioral health conditions in particular are at increased risk of deteriorating health, depression, increased isolation, and breakdown in the continuum of health care. They are also less likely to report symptoms, which a depression screening can capture.
WhaT’s neW in This uPdaTeThis updated profile includes an additional six months of post-Sandy data. It focuses on a 12-month pre-Sandy time period as opposed to 21 months used in the initial profile and includes pre and post-Sandy analyses comparing the rates from the year before and during/after the storm. In this profile, we reference October 2011 to September 2012 as the year before Superstorm Sandy and October 2012 to September 2013 as the year after Superstorm Sandy.
This profile now includes:
• Annual trend charts for the selected behavioral health conditions to allow the comparison of changes in prevalence over time (pages 15 and 30)
inTroduCTion
Healthcare Quality Strategies, Inc. | 3Enhancing Coordination of Behavioral Health Services after Superstorm Sandy: Planning for Future DisastersaTlanTiC CiTy and VenTnor CiTy
• A summary of the prevalence of depression or proxy disorders rate by demographic characteristics (race, gender, and age) to allow the comparison of rates across different demographic groups (pages 16-17)
• State maps highlighting the 10 FEMA-declared disaster counties before and after Superstorm Sandy and county-specific maps reflecting changes in prevalence of depression or proxy disorder (pages 20 and 21), top five risk factors for depression (pages 31 and 32), and depression screening rates (pages 38 and 39)
• Summary tables that highlight changes in the community and its county before and after Superstorm Sandy on annual prevalence of selected behavioral health conditions (page 13), utilization of outpatient behavioral health services for assessment (page 35) and therapies (page 44), utilization of inpatient services (pages 49 and 54), and utilization of services in other settings (page 58)
hoW To use This Profile This profile includes an analysis of the eight behavioral health conditions which, based on literature review and feedback from the subject matter experts consulted for this project, were found to increase after natural disasters.
This profile is divided into the following sections, each of which is preceded by a user-friendly overview:
• Demographics (page 11) • Prevalence and incidence of behavioral health conditions (page 13)• Risk factors for depression or proxy disorders (page 29)• Utilization of outpatient behavioral health services – assessments (page 35)• Utilization of outpatient behavioral health services – therapies (page 44)• Utilization of inpatient health services (page 49)• Utilization of inpatient health services within 30 days of acute care hospital discharge (page 54)• Other settings (page 58)• Listing of major health providers (page 63)
Here are some additional tips for using this profile:
• Use the Executive Summary (pages 9-10) for a quick overview of this profile’s key points, as well as the snapshot table that summarizes the prevalence of the selected behavioral health conditions and utilization of behavioral health services before and after Superstorm Sandy
• Use the Behavioral Health Conditions section (pages 13-34) for in-depth analyses and graphical comparison on the prevalence and incidence of eight behavioral health conditions before and after Superstorm Sandy
• Use the New Jersey and county maps to identify areas with higher rates of Medicare FFS beneficiaries at risk for depression and proxy disorders (pages 31-32); and areas with low utilization of the depression screening benefit (pages 38-39)
inTroduCTion
4 | Healthcare Quality Strategies, Inc. Enhancing Coordination of Behavioral Health Services after Superstorm Sandy: Planning for Future Disasters aTlanTiC CiTy and VenTnor CiTy
MeThodologyEach community profile compares one community’s statistics to the aggregate of its county. Primary data sources include Medicare FFS Part A and Part B claims, the Medicare enrollment database, and U.S. Census data. The Medicare enrollment database includes basic demographic statistics such as age, gender, and race while the U.S. Census data provides a proxy indicator (average household income) for socioeconomic status. Based on the ICD-9-CM (International Classification of Disease, Ninth Revision, Clinical Modification), CPT (Current Procedural Terminology), or HCPCS (Healthcare Common Procedure Coding System) codes in Medicare Part A and Part B claims, beneficiaries were identified for chronic conditions including diseases/conditions related to behavioral health, such as depression. Appendices A through F contain documentation, technical notes, codes, algorithms, data sources, and references.
Medicare Part A and Part B claims provide information on the utilization of mental health outpatient services for assessment (e.g., depression screening, diagnostic psychological tests) and treatment (e.g., individual psychotherapy). Medicare Part A claims were also used to analyze utilization of health services in or by acute care hospitals, skilled nursing facilities, medical rehabilitation facilities, home health agencies, hospice, and inpatient psychiatric facilities.
Furthermore, Medicare Part A and Part B claims were used to aggregate data on behavioral health providers including: provider location, overall provider type, provider type by services, and major provider listing. Geographical mapping of health providers was also done using ArcGIS Online Explorer.
To identify beneficiaries with an elevated risk of depression or proxy disorders after the storm, HQSI conducted a literature review on risk factors for depression or proxy disorders (see Appendix B). Previous studies identified psychosocial and biological factors, increased age, history of cancer, Parkinson’s disease, Alzheimer’s disease, changes in mental function, and medication side effects as risk factors for developing depression. Based on findings from the literature review and factors available through Medicare claims, logistic regression analysis was conducted with Medicare claims and the top five risk factors – Alzheimer’s disease and related disorders or senile dementia, hip/pelvic fractures, amputations, substance or alcohol abuse or tobacco use, and sleep disturbance – were used to identify beneficiaries with high risk for developing depression or proxy disorders.
inTroduCTion
Healthcare Quality Strategies, Inc. | 5Enhancing Coordination of Behavioral Health Services after Superstorm Sandy: Planning for Future DisastersaTlanTiC CiTy and VenTnor CiTy
MeasureMenT TiMe fraMesThis profile includes data from January 1, 2011 through September 30, 2013. Results are presented using different charts and measurement time frames as follows:
• Annual bar charts show the annual rates in the year before (October 1, 2011 to September 30, 2012) and during/after (October 1, 2012 to September 30, 2013) Superstorm Sandy. Statistics on demographics, prevalence of behavioral health conditions, and utilization of health services are presented for this 12-month period. These statistics allow for comparison between the community and its county
• Annual trend charts with rolling quarters for the behavioral health conditions and utilization statistics are included to adjust for seasonal variation and to examine possible changes in the year before and during/after Superstorm Sandy. The time period includes eight data points from January 1, 2011 to September 30, 2013
• Annual percent change (relative change) bar charts show relative increase or decrease in rates from the year before and during/after Superstorm Sandy. These statistics allow for comparison between the community and its county and to analyze the potential impact of Superstorm Sandy
• Quarterly new incidence charts for eight behavioral health conditions include seven quarters of data from January 1, 2012 to September 30, 2013. This allows for the identification of new cases in a given quarter when compared to the prior year
• Quarterly line charts show the trend in the utilization of depression screening for seven quarters from January 1, 2012 to September 30, 2013
inTroduCTion
6 | Healthcare Quality Strategies, Inc. Enhancing Coordination of Behavioral Health Services after Superstorm Sandy: Planning for Future Disasters aTlanTiC CiTy and VenTnor CiTy
daTa ConsideraTionsCurrently, there are three quarters of post-storm data available. This is the first of two planned profile updates. Claims data processing lag (at least six months) coupled with the one-year project time frame, reduces the optimal time frame for more accurate estimation of post-Sandy effects.
Identification of beneficiaries with behavioral health conditions is based on diagnoses being reported in Medicare FFS claims and could result in underestimation. There is no accurate way to identify when certain health conditions began and ended when claims data is used.
According to the subject matter experts consulted for this project, unlike other conditions, behavioral health issues are often underdiagnosed in our society and the stigma associated with behavioral health conditions may prevent people from seeking care in mental health facilities. The subject matter experts also indicated that estimating the prevalence of depression using claims data can be particularly difficult as depression is often undiagnosed or not documented. Depression can be present with symptoms of anxiety and adjustment disorders. Based on this feedback, a combination measure named “depression or proxy disorders” was created to estimate prevalence and incidence of depression. If a patient has at least one of the three conditions reported in Medicare claims, he/she will be flagged as having depression or proxy disorders.
This community profile can be used to compare the prevalence and incidence rates of eight selected behavioral health conditions based on the ICD-9-CM codes through the analysis of Medicare claims. This profile may be used to prioritize and plan community and county preparation for the care, tracking, and monitoring of Medicare beneficiary behavioral health status and health care utilization patterns.
HQSI will produce a final update in summer 2014 that will include additional data for the post-Superstorm Sandy time period.
hQsi ProjeCT TeaM
Healthcare Quality Strategies, Inc. | 7Enhancing Coordination of Behavioral Health Services after Superstorm Sandy: Planning for Future DisastersaTlanTiC CiTy and VenTnor CiTy
Martin P. Margolies Chief Executive Officer
Mary Jane Brubaker, MCIS Chief Operating Officer
Diane Babuin, MS, CPHQ Director, Quality Improvement and Communications
Ya-ping Su, PhD Director, Research and Analysis
Suzanne Dalton, RN, BS, EdM Project Manager
Andrew Miller, MD, MPH Medical Director
Mona Abdalla, BA Administrative Associate
Christine Aisenberg, BA Proofreader
Kathy Brown, BS InDesign Specialist
Zhengyu Bu, MS Health Services Research Analyst
Sue Chen, MS Statistician
Wei-Yi Chung, MS Database Administrator
Barbara Coleman Administrative Associate
Dawn Cullen, BA Communications Specialist
Diane Fairchild-Maretzky Proofreader
Karen Hale, MEd Community Liaison
Kim Karnell, BS Information Specialist
Janet Knoth, BS, RN, CHPN, CPHQ Quality Improvement Specialist
Judy Miller, MS, RN Quality Improvement Specialist
Olubukunola Oyedele, MPH Community Liaison
Rita Pascale Administrative Associate
Barbara Perzyna, BS Visual Communications Specialist
Ziphora Sam, MPH Epidemiologist
Marianne Sagarese, BSN, RN Quality Improvement Specialist
Nicole Skyer-Brandwene, MS, RPh, BCPS Quality Improvement Specialist
Ashley Strain, BA Communications Specialist
aCknoWledgeMenTs
8 | Healthcare Quality Strategies, Inc. Enhancing Coordination of Behavioral Health Services after Superstorm Sandy: Planning for Future Disasters aTlanTiC CiTy and VenTnor CiTy
Special thanks to the subject matter experts who assisted with the project by providing feedback and guidance to the HQSI project team.
Carol Benevy, MSW New Jersey Hope and Healing Project Barnabas Health Institute for Prevention
Mary Ditri, MA, CHCC New Jersey Hospital Association
Adrienne Fessler-Belli, MSW, LCSW New Jersey Department of Human Services Disaster & Terrorism Branch
Mark Firth, MA, MSW New Jersey Department of Human Services Division of Mental Health and Addiction Services
Mary Goepfert, MPA, APR, CPM New Jersey Group for Access and Integration Needs in Emergencies and Disasters
Sheldon Green New Jersey Primary Care Association
Connie Greene, MA, CAS, CSW, CPS Barnabas Health Institute for Prevention
Bob Kley Mental Health Association in New Jersey, Inc.
Lynn Kovitch, MEd New Jersey Department of Human Services Division of Mental Health and Addiction Services
Karen McCoy, RN, BSN Home Care Association of New Jersey
Elyse Perweiler, MPP, RN NJ Institute for Successful Aging
Lynn Stefanowicz, MA, LCSW Meridian Behavioral Health
Megan Sullivan, LPC, LCADC, DRCC New Jersey Department of Human Services Disaster & Terrorism Branch
Pete Summers The New Jersey Association of County and City Health Officials (NJACCHO)
exeCuTiVe suMMary
Enhancing Coordination of Behavioral Health Services after Superstorm Sandy: Planning for Future Disasters Healthcare Quality Strategies, Inc. | 9aTlanTiC CiTy and VenTnor CiTy
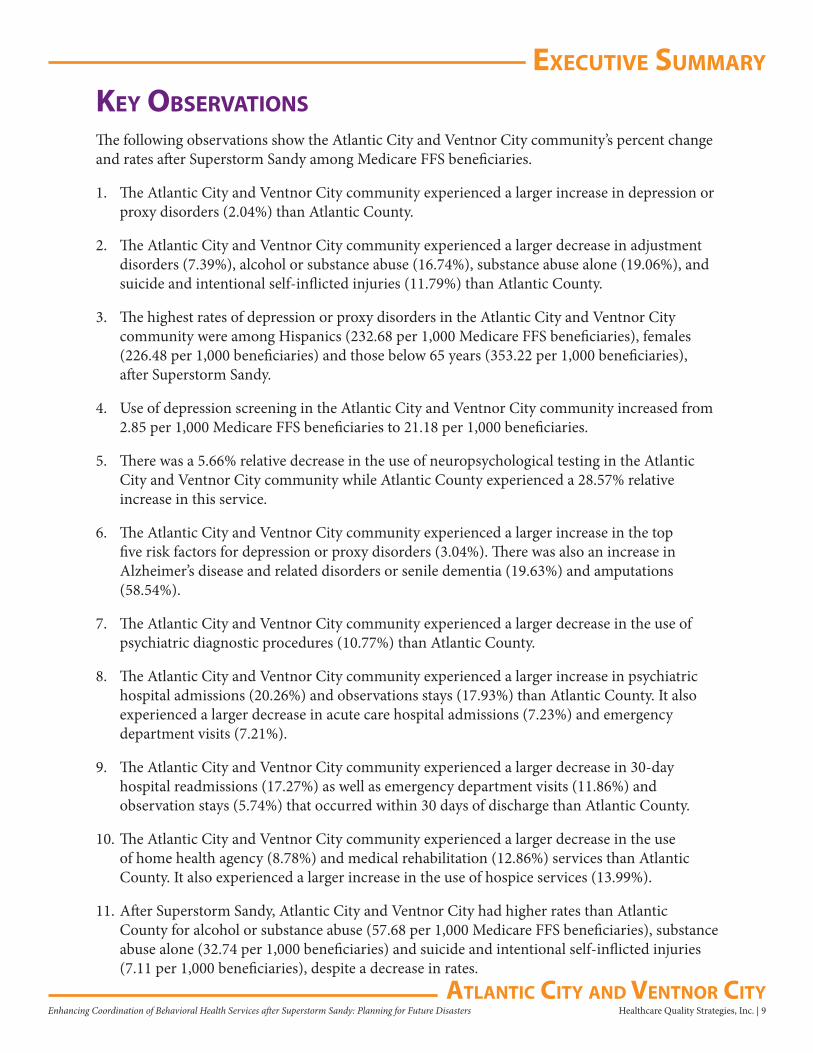
key obserVaTionsThe following observations show the Atlantic City and Ventnor City community’s percent change and rates after Superstorm Sandy among Medicare FFS beneficiaries.
1. The Atlantic City and Ventnor City community experienced a larger increase in depression or proxy disorders (2.04%) than Atlantic County.
2. The Atlantic City and Ventnor City community experienced a larger decrease in adjustment disorders (7.39%), alcohol or substance abuse (16.74%), substance abuse alone (19.06%), and suicide and intentional self-inflicted injuries (11.79%) than Atlantic County.
3. The highest rates of depression or proxy disorders in the Atlantic City and Ventnor City community were among Hispanics (232.68 per 1,000 Medicare FFS beneficiaries), females (226.48 per 1,000 beneficiaries) and those below 65 years (353.22 per 1,000 beneficiaries), after Superstorm Sandy.
4. Use of depression screening in the Atlantic City and Ventnor City community increased from 2.85 per 1,000 Medicare FFS beneficiaries to 21.18 per 1,000 beneficiaries.
5. There was a 5.66% relative decrease in the use of neuropsychological testing in the Atlantic City and Ventnor City community while Atlantic County experienced a 28.57% relative increase in this service.
6. The Atlantic City and Ventnor City community experienced a larger increase in the top five risk factors for depression or proxy disorders (3.04%). There was also an increase in Alzheimer’s disease and related disorders or senile dementia (19.63%) and amputations (58.54%).
7. The Atlantic City and Ventnor City community experienced a larger decrease in the use of psychiatric diagnostic procedures (10.77%) than Atlantic County.
8. The Atlantic City and Ventnor City community experienced a larger increase in psychiatric hospital admissions (20.26%) and observations stays (17.93%) than Atlantic County. It also experienced a larger decrease in acute care hospital admissions (7.23%) and emergency department visits (7.21%).
9. The Atlantic City and Ventnor City community experienced a larger decrease in 30-day hospital readmissions (17.27%) as well as emergency department visits (11.86%) and observation stays (5.74%) that occurred within 30 days of discharge than Atlantic County.
10. The Atlantic City and Ventnor City community experienced a larger decrease in the use of home health agency (8.78%) and medical rehabilitation (12.86%) services than Atlantic County. It also experienced a larger increase in the use of hospice services (13.99%).
11. After Superstorm Sandy, Atlantic City and Ventnor City had higher rates than Atlantic County for alcohol or substance abuse (57.68 per 1,000 Medicare FFS beneficiaries), substance abuse alone (32.74 per 1,000 beneficiaries) and suicide and intentional self-inflicted injuries (7.11 per 1,000 beneficiaries), despite a decrease in rates.
exeCuTiVe suMMary
10 | Healthcare Quality Strategies, Inc. Enhancing Coordination of Behavioral Health Services after Superstorm Sandy: Planning for Future Disasters aTlanTiC CiTy and VenTnor CiTy
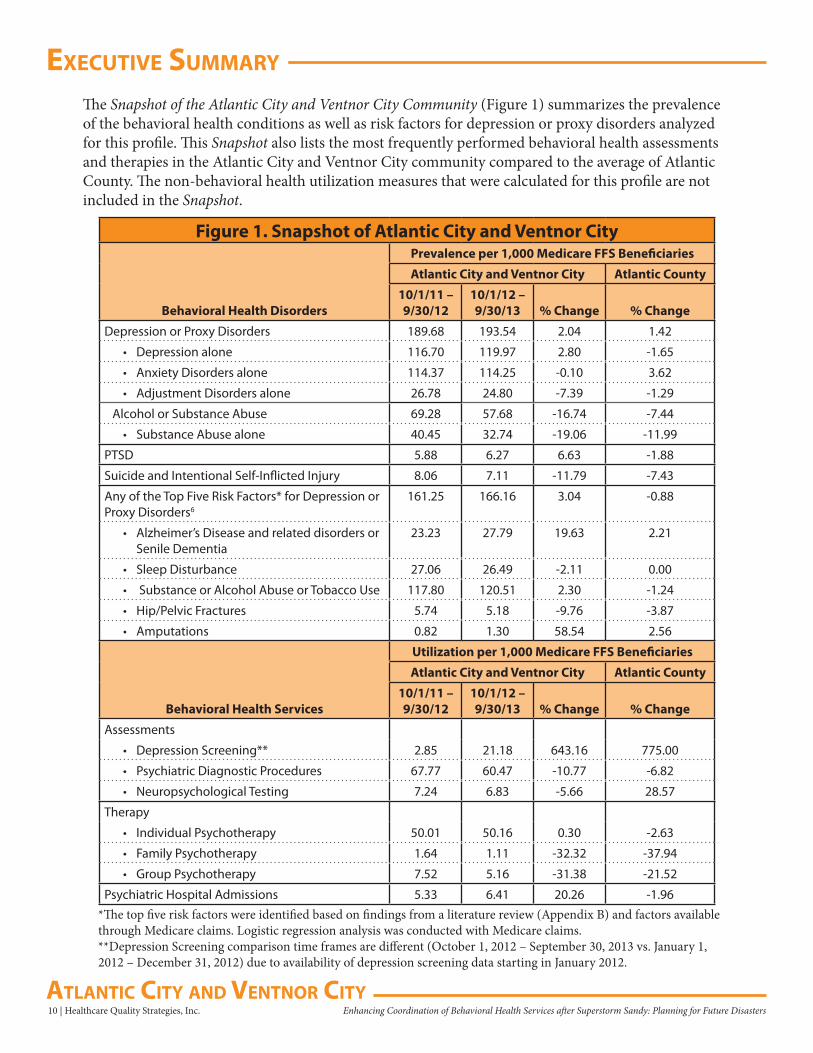
The Snapshot of the Atlantic City and Ventnor City Community (Figure 1) summarizes the prevalence of the behavioral health conditions as well as risk factors for depression or proxy disorders analyzed for this profile. This Snapshot also lists the most frequently performed behavioral health assessments and therapies in the Atlantic City and Ventnor City community compared to the average of Atlantic County. The non-behavioral health utilization measures that were calculated for this profile are not included in the Snapshot.
Figure 1. Snapshot of Atlantic City and Ventnor CityPrevalence per 1,000 Medicare FFS Beneficiaries
Atlantic City and Ventnor City Atlantic County
Behavioral Health Disorders10/1/11 – 9/30/12
10/1/12 – 9/30/13 % Change % Change
Depression or Proxy Disorders 189.68 193.54 2.04 1.42
• Depression alone 116.70 119.97 2.80 -1.65
• Anxiety Disorders alone 114.37 114.25 -0.10 3.62
• Adjustment Disorders alone 26.78 24.80 -7.39 -1.29
Alcohol or Substance Abuse 69.28 57.68 -16.74 -7.44
• Substance Abuse alone 40.45 32.74 -19.06 -11.99
PTSD 5.88 6.27 6.63 -1.88
Suicide and Intentional Self-Inflicted Injury 8.06 7.11 -11.79 -7.43
Any of the Top Five Risk Factors* for Depression or Proxy Disorders6
161.25 166.16 3.04 -0.88
• Alzheimer’s Disease and related disorders or Senile Dementia
23.23 27.79 19.63 2.21
• Sleep Disturbance 27.06 26.49 -2.11 0.00
• Substance or Alcohol Abuse or Tobacco Use 117.80 120.51 2.30 -1.24
• Hip/Pelvic Fractures 5.74 5.18 -9.76 -3.87
• Amputations 0.82 1.30 58.54 2.56
Utilization per 1,000 Medicare FFS Beneficiaries
Atlantic City and Ventnor City Atlantic County
Behavioral Health Services10/1/11 – 9/30/12
10/1/12 – 9/30/13 % Change % Change
Assessments
• Depression Screening** 2.85 21.18 643.16 775.00
• Psychiatric Diagnostic Procedures 67.77 60.47 -10.77 -6.82
• Neuropsychological Testing 7.24 6.83 -5.66 28.57
Therapy
• Individual Psychotherapy 50.01 50.16 0.30 -2.63
• Family Psychotherapy 1.64 1.11 -32.32 -37.94
• Group Psychotherapy 7.52 5.16 -31.38 -21.52
Psychiatric Hospital Admissions 5.33 6.41 20.26 -1.96*The top five risk factors were identified based on findings from a literature review (Appendix B) and factors available through Medicare claims. Logistic regression analysis was conducted with Medicare claims.**Depression Screening comparison time frames are different (October 1, 2012 – September 30, 2013 vs. January 1, 2012 – December 31, 2012) due to availability of depression screening data starting in January 2012.
deMograPhiCs
Healthcare Quality Strategies, Inc. | 11Enhancing Coordination of Behavioral Health Services after Superstorm Sandy: Planning for Future DisastersaTlanTiC CiTy and VenTnor CiTy
Medicare FFS Demographics Atlantic City and Ventnor City
figure 2. ToTal MediCare ffs benefiCiaries*
At A Glance(October 1, 2012 – September 30, 2013)
18.46% 17.27%
Atlantic City and Ventnor City Atlantic
figure 3. PerCenT of MediCare ffs benefiCiaries in The general PoPulaTion in 2012*
8,559
47,576
7,758
47,842
Atlantic City and Ventnor City Atlantic
10/1/11-9/30/12 10/1/12-9/30/13
figure 4. PerCenT of MediCare ffs benefiCiary PoPulaTion by feMale
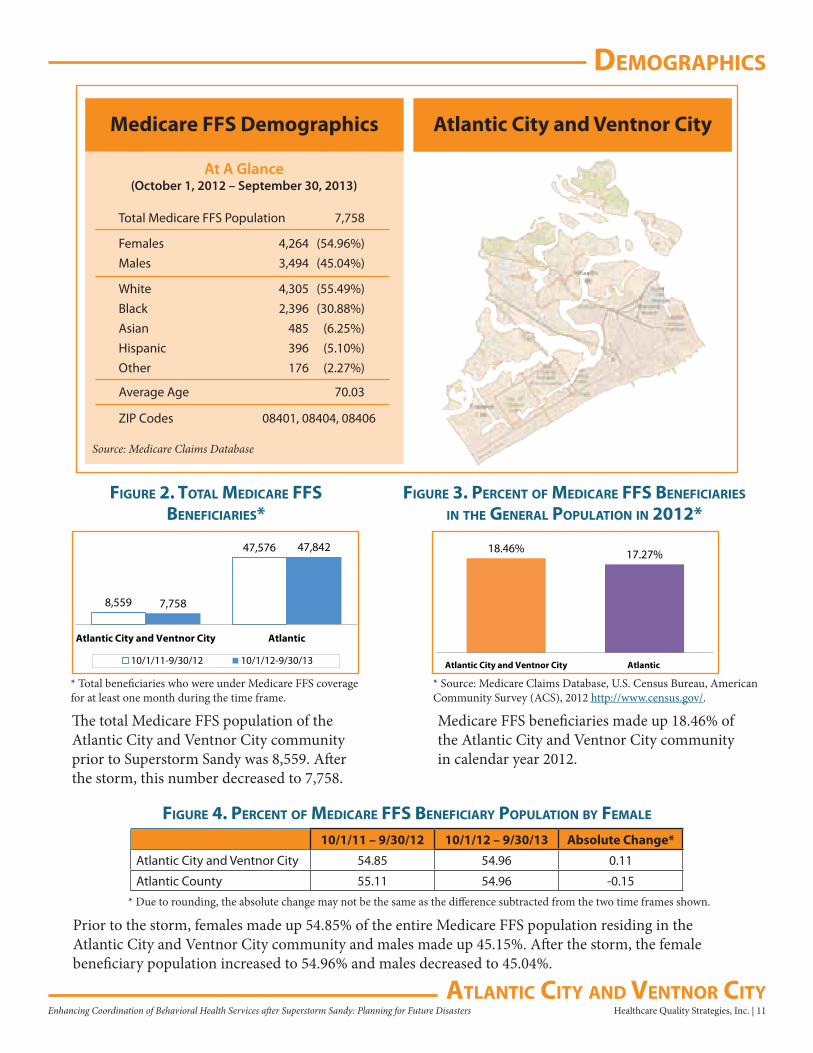
Total Medicare FFS Population 7,758
Females 4,264 (54.96%)Males 3,494 (45.04%)
White 4,305 (55.49%)Black 2,396 (30.88%)Asian 485 (6.25%)Hispanic 396 (5.10%)Other 176 (2.27%)
Average Age 70.03
ZIP Codes 08401, 08404, 08406
Source: Medicare Claims Database
The total Medicare FFS population of the Atlantic City and Ventnor City community prior to Superstorm Sandy was 8,559. After the storm, this number decreased to 7,758.
Medicare FFS beneficiaries made up 18.46% of the Atlantic City and Ventnor City community in calendar year 2012.
10/1/11 – 9/30/12 10/1/12 – 9/30/13 Absolute Change*
Atlantic City and Ventnor City 54.85 54.96 0.11
Atlantic County 55.11 54.96 -0.15
* Source: Medicare Claims Database, U.S. Census Bureau, American Community Survey (ACS), 2012 http://www.census.gov/.
* Due to rounding, the absolute change may not be the same as the difference subtracted from the two time frames shown.
* Total beneficiaries who were under Medicare FFS coverage for at least one month during the time frame.
Prior to the storm, females made up 54.85% of the entire Medicare FFS population residing in the Atlantic City and Ventnor City community and males made up 45.15%. After the storm, the female beneficiary population increased to 54.96% and males decreased to 45.04%.
deMograPhiCs
12 | Healthcare Quality Strategies, Inc. Enhancing Coordination of Behavioral Health Services after Superstorm Sandy: Planning for Future Disasters aTlanTiC CiTy and VenTnor CiTy
figure 5. PerCenT of MediCare ffs benefiCiary PoPulaTion by raCe
figure 6. PerCenT of MediCare ffs benefiCiary PoPulaTion by age
Atlantic City and Ventnor City Atlantic
Race10/1/11 – 9/30/12
10/1/12 – 9/30/13
Absolute Change*
10/1/11 – 9/30/12
10/1/12 – 9/30/13
Absolute Change*
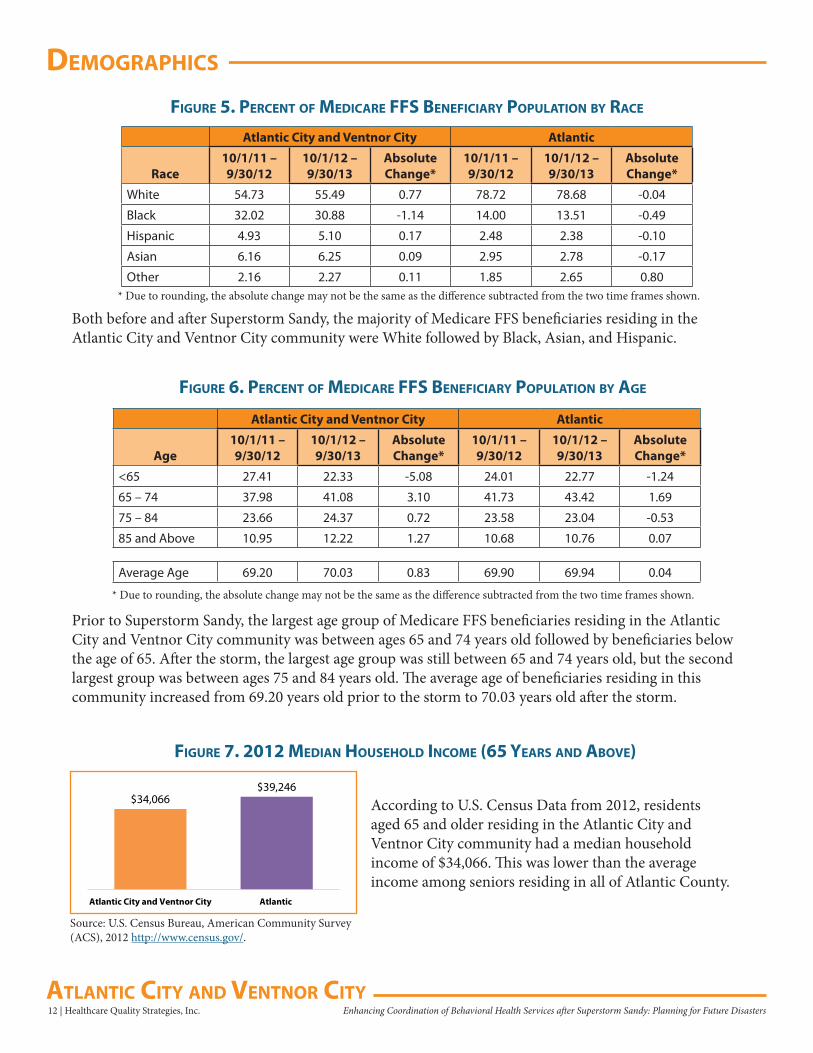
White 54.73 55.49 0.77 78.72 78.68 -0.04
Black 32.02 30.88 -1.14 14.00 13.51 -0.49
Hispanic 4.93 5.10 0.17 2.48 2.38 -0.10
Asian 6.16 6.25 0.09 2.95 2.78 -0.17
Other 2.16 2.27 0.11 1.85 2.65 0.80* Due to rounding, the absolute change may not be the same as the difference subtracted from the two time frames shown.
Both before and after Superstorm Sandy, the majority of Medicare FFS beneficiaries residing in the Atlantic City and Ventnor City community were White followed by Black, Asian, and Hispanic.
Atlantic City and Ventnor City Atlantic
Age10/1/11 – 9/30/12
10/1/12 – 9/30/13
Absolute Change*
10/1/11 – 9/30/12
10/1/12 – 9/30/13
Absolute Change*
<65 27.41 22.33 -5.08 24.01 22.77 -1.24
65 – 74 37.98 41.08 3.10 41.73 43.42 1.69
75 – 84 23.66 24.37 0.72 23.58 23.04 -0.53
85 and Above 10.95 12.22 1.27 10.68 10.76 0.07
Average Age 69.20 70.03 0.83 69.90 69.94 0.04
* Due to rounding, the absolute change may not be the same as the difference subtracted from the two time frames shown.
Prior to Superstorm Sandy, the largest age group of Medicare FFS beneficiaries residing in the Atlantic City and Ventnor City community was between ages 65 and 74 years old followed by beneficiaries below the age of 65. After the storm, the largest age group was still between 65 and 74 years old, but the second largest group was between ages 75 and 84 years old. The average age of beneficiaries residing in this community increased from 69.20 years old prior to the storm to 70.03 years old after the storm.
$39,246$34,066
AtlanticAtlantic City and Ventnor City
figure 7. 2012 Median household inCoMe (65 years and aboVe)
According to U.S. Census Data from 2012, residents aged 65 and older residing in the Atlantic City and Ventnor City community had a median household income of $34,066. This was lower than the average income among seniors residing in all of Atlantic County.
Source: U.S. Census Bureau, American Community Survey (ACS), 2012 http://www.census.gov/.
behaVioral healTh CondiTions
Healthcare Quality Strategies, Inc. | 13Enhancing Coordination of Behavioral Health Services after Superstorm Sandy: Planning for Future DisastersaTlanTiC CiTy and VenTnor CiTy
PreValenCe and inCidenCe
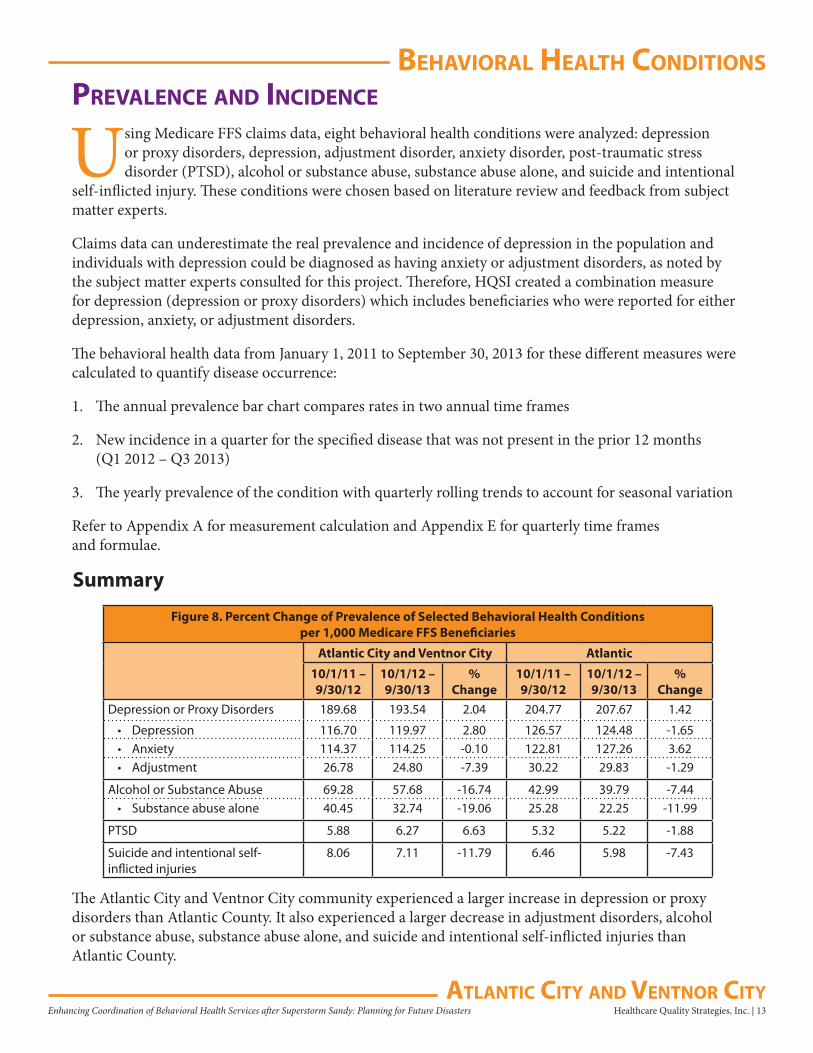
Using Medicare FFS claims data, eight behavioral health conditions were analyzed: depression or proxy disorders, depression, adjustment disorder, anxiety disorder, post-traumatic stress disorder (PTSD), alcohol or substance abuse, substance abuse alone, and suicide and intentional
self-inflicted injury. These conditions were chosen based on literature review and feedback from subject matter experts.
Claims data can underestimate the real prevalence and incidence of depression in the population and individuals with depression could be diagnosed as having anxiety or adjustment disorders, as noted by the subject matter experts consulted for this project. Therefore, HQSI created a combination measure for depression (depression or proxy disorders) which includes beneficiaries who were reported for either depression, anxiety, or adjustment disorders.
The behavioral health data from January 1, 2011 to September 30, 2013 for these different measures were calculated to quantify disease occurrence:
1. The annual prevalence bar chart compares rates in two annual time frames
2. New incidence in a quarter for the specified disease that was not present in the prior 12 months (Q1 2012 – Q3 2013)
3. The yearly prevalence of the condition with quarterly rolling trends to account for seasonal variation
Refer to Appendix A for measurement calculation and Appendix E for quarterly time frames and formulae.
Summary
Figure 8. Percent Change of Prevalence of Selected Behavioral Health Conditionsper 1,000 Medicare FFS Beneficiaries
Atlantic City and Ventnor City Atlantic
10/1/11 – 9/30/12
10/1/12 – 9/30/13
% Change
10/1/11 – 9/30/12
10/1/12 – 9/30/13
% Change
Depression or Proxy Disorders 189.68 193.54 2.04 204.77 207.67 1.42
• Depression 116.70 119.97 2.80 126.57 124.48 -1.65• Anxiety 114.37 114.25 -0.10 122.81 127.26 3.62• Adjustment 26.78 24.80 -7.39 30.22 29.83 -1.29
Alcohol or Substance Abuse 69.28 57.68 -16.74 42.99 39.79 -7.44• Substance abuse alone 40.45 32.74 -19.06 25.28 22.25 -11.99
PTSD 5.88 6.27 6.63 5.32 5.22 -1.88
Suicide and intentional self-inflicted injuries
8.06 7.11 -11.79 6.46 5.98 -7.43
The Atlantic City and Ventnor City community experienced a larger increase in depression or proxy disorders than Atlantic County. It also experienced a larger decrease in adjustment disorders, alcohol or substance abuse, substance abuse alone, and suicide and intentional self-inflicted injuries than Atlantic County.
behaVioral healTh CondiTions
14 | Healthcare Quality Strategies, Inc. Enhancing Coordination of Behavioral Health Services after Superstorm Sandy: Planning for Future Disasters aTlanTiC CiTy and VenTnor CiTy
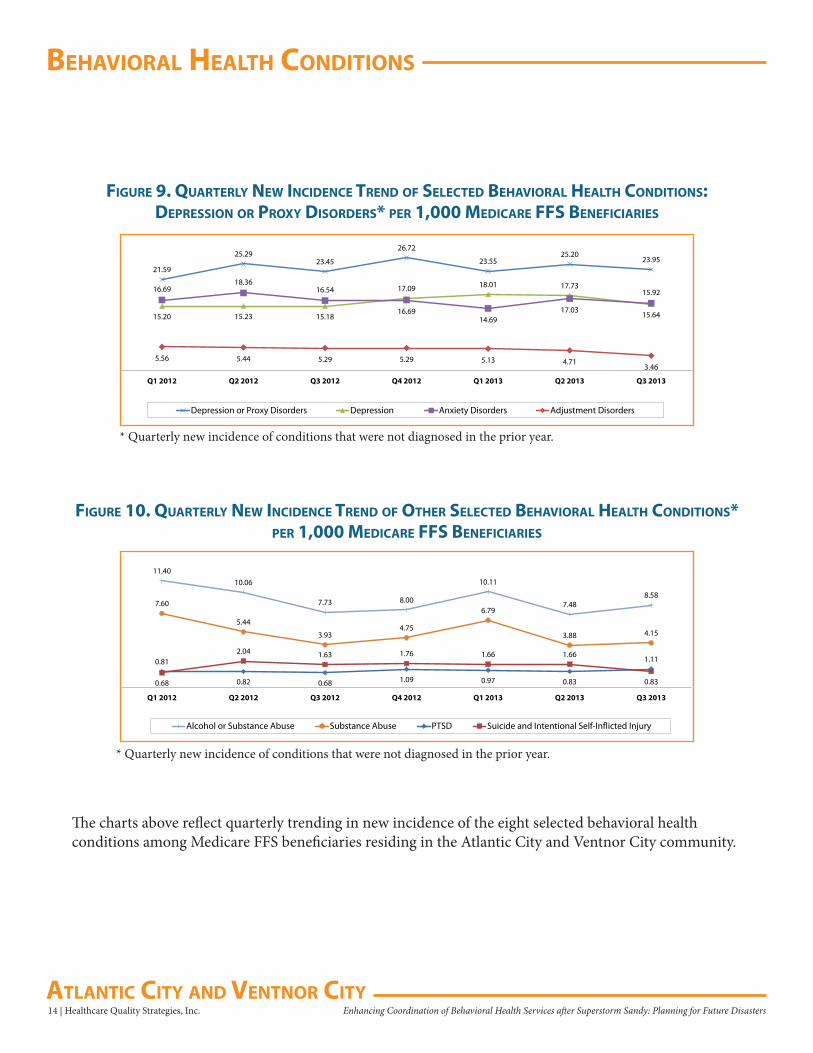
figure 9. QuarTerly neW inCidenCe Trend of seleCTed behaVioral healTh CondiTions:dePression or Proxy disorders* Per 1,000 MediCare ffs benefiCiaries
21.59
25.2923.45
26.72
23.5525.20
23.95
15.20 15.23 15.18
17.09 18.01 17.73
15.64
16.6918.36
16.54
16.6914.69
17.03
15.92
5.56 5.44 5.29 5.29 5.13 4.713.46
Q1 2012 Q2 2012 Q3 2012 Q4 2012 Q1 2013 Q2 2013 Q3 2013
Depression or Proxy Disorders Depression Anxiety Disorders Adjustment Disorders
* Quarterly new incidence of conditions that were not diagnosed in the prior year.
11.4010.06
7.73 8.00
10.11
7.488.58
7.60
5.44
3.934.75
6.79
3.88 4.15
0.81
0.82 0.68 1.09 0.97 0.83
1.11
0.68
2.04 1.63 1.76 1.66 1.66
0.83
Q1 2012 Q2 2012 Q3 2012 Q4 2012 Q1 2013 Q2 2013 Q3 2013
Alcohol or Substance Abuse Substance Abuse PTSD Suicide and Intentional Self-Inflicted Injury
figure 10. QuarTerly neW inCidenCe Trend of oTher seleCTed behaVioral healTh CondiTions*Per 1,000 MediCare ffs benefiCiaries
* Quarterly new incidence of conditions that were not diagnosed in the prior year.
The charts above reflect quarterly trending in new incidence of the eight selected behavioral health conditions among Medicare FFS beneficiaries residing in the Atlantic City and Ventnor City community.
behaVioral healTh CondiTions
Healthcare Quality Strategies, Inc. | 15Enhancing Coordination of Behavioral Health Services after Superstorm Sandy: Planning for Future DisastersaTlanTiC CiTy and VenTnor CiTy
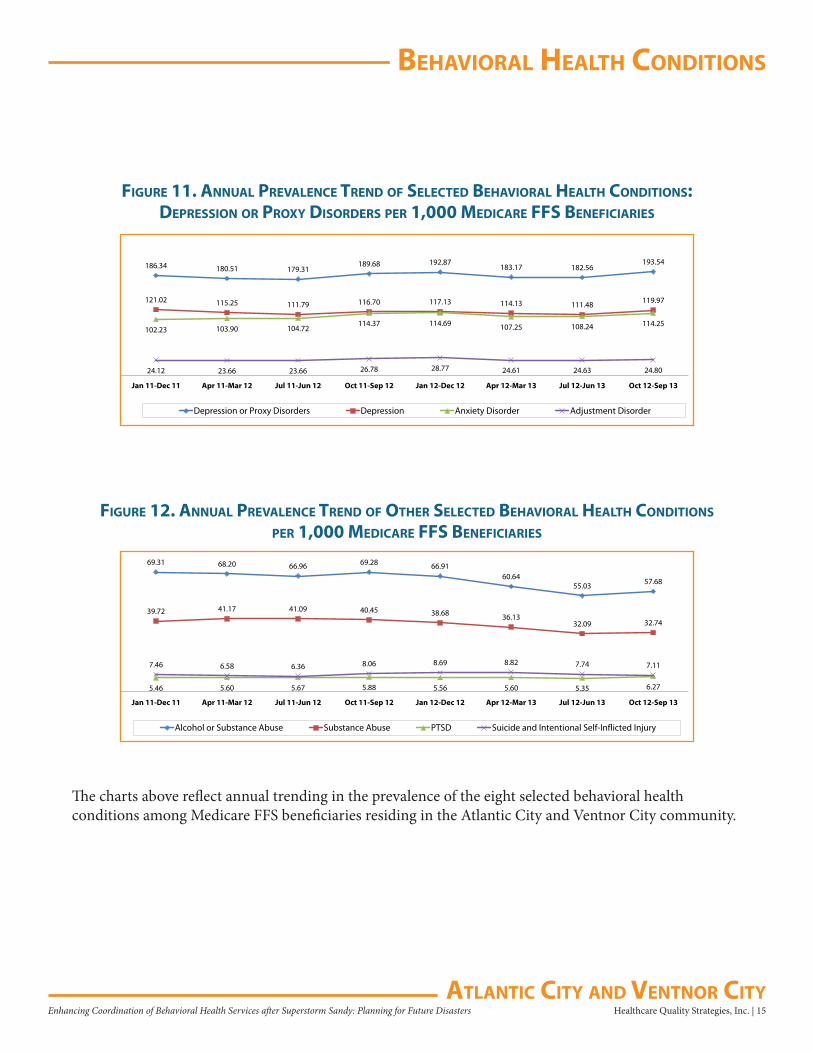
figure 11. annual PreValenCe Trend of seleCTed behaVioral healTh CondiTions:dePression or Proxy disorders Per 1,000 MediCare ffs benefiCiaries
186.34 180.51 179.31189.68 192.87
183.17 182.56193.54
121.02 115.25 111.79 116.70 117.13 114.13 111.48 119.97
102.23 103.90 104.72114.37 114.69 107.25 108.24 114.25
24.12 23.66 23.66 26.78 28.77 24.61 24.63 24.80
Jan 11-Dec 11 Apr 11-Mar 12 Jul 11-Jun 12 Oct 11-Sep 12 Jan 12-Dec 12 Apr 12-Mar 13 Jul 12-Jun 13 Oct 12-Sep 13
Depression or Proxy Disorders Depression Anxiety Disorder Adjustment Disorder
69.31 68.20 66.96 69.28 66.9160.64
55.03 57.68
39.72 41.17 41.09 40.45 38.68 36.1332.09 32.74
5.46 5.60 5.67 5.88 5.56 5.60 5.35 6.27
7.46 6.58 6.36 8.06 8.69 8.82 7.74 7.11
Jan 11-Dec 11 Apr 11-Mar 12 Jul 11-Jun 12 Oct 11-Sep 12 Jan 12-Dec 12 Apr 12-Mar 13 Jul 12-Jun 13 Oct 12-Sep 13
Alcohol or Substance Abuse Substance Abuse PTSD Suicide and Intentional Self-Inflicted Injury
figure 12. annual PreValenCe Trend of oTher seleCTed behaVioral healTh CondiTions
Per 1,000 MediCare ffs benefiCiaries
The charts above reflect annual trending in the prevalence of the eight selected behavioral health conditions among Medicare FFS beneficiaries residing in the Atlantic City and Ventnor City community.
behaVioral healTh CondiTions
16 | Healthcare Quality Strategies, Inc. Enhancing Coordination of Behavioral Health Services after Superstorm Sandy: Planning for Future Disasters aTlanTiC CiTy and VenTnor CiTy
Depression or Proxy Disorders
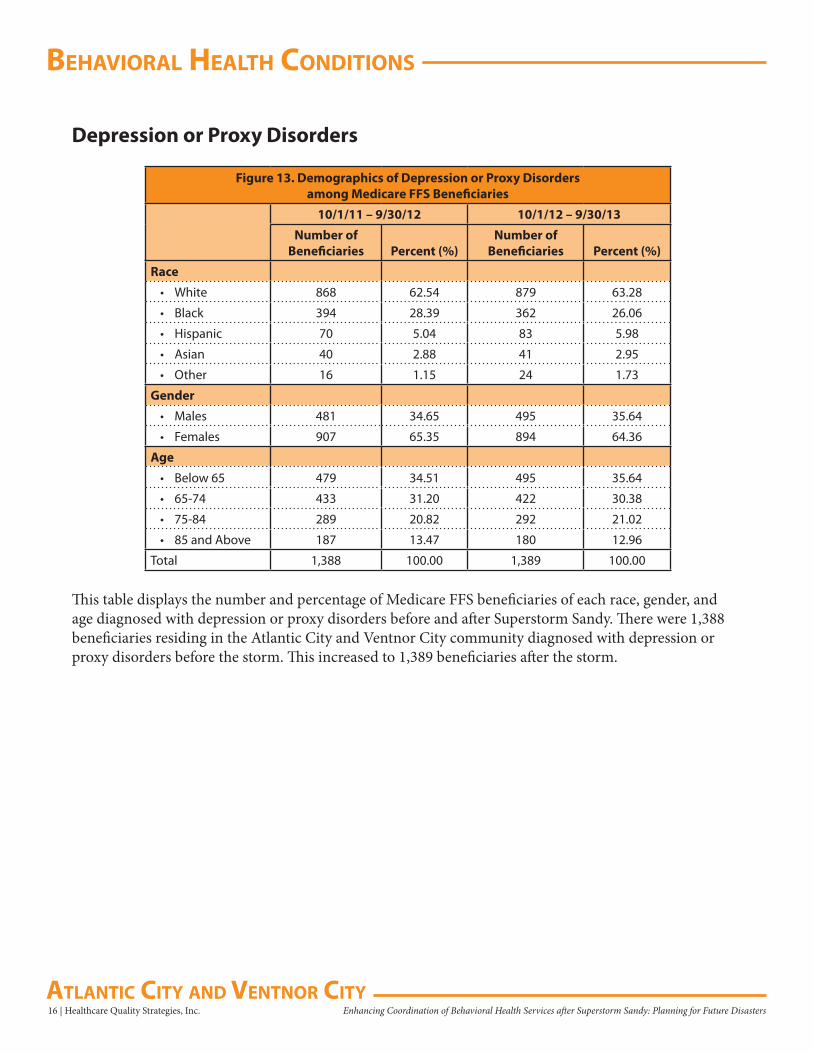
Figure 13. Demographics of Depression or Proxy Disorders among Medicare FFS Beneficiaries
10/1/11 – 9/30/12 10/1/12 – 9/30/13
Number of Beneficiaries Percent (%)
Number of Beneficiaries Percent (%)
Race
• White 868 62.54 879 63.28
• Black 394 28.39 362 26.06
• Hispanic 70 5.04 83 5.98
• Asian 40 2.88 41 2.95
• Other 16 1.15 24 1.73
Gender
• Males 481 34.65 495 35.64
• Females 907 65.35 894 64.36
Age
• Below 65 479 34.51 495 35.64
• 65-74 433 31.20 422 30.38
• 75-84 289 20.82 292 21.02
• 85 and Above 187 13.47 180 12.96
Total 1,388 100.00 1,389 100.00
This table displays the number and percentage of Medicare FFS beneficiaries of each race, gender, and age diagnosed with depression or proxy disorders before and after Superstorm Sandy. There were 1,388 beneficiaries residing in the Atlantic City and Ventnor City community diagnosed with depression or proxy disorders before the storm. This increased to 1,389 beneficiaries after the storm.
behaVioral healTh CondiTions
Healthcare Quality Strategies, Inc. | 17Enhancing Coordination of Behavioral Health Services after Superstorm Sandy: Planning for Future DisastersaTlanTiC CiTy and VenTnor CiTy
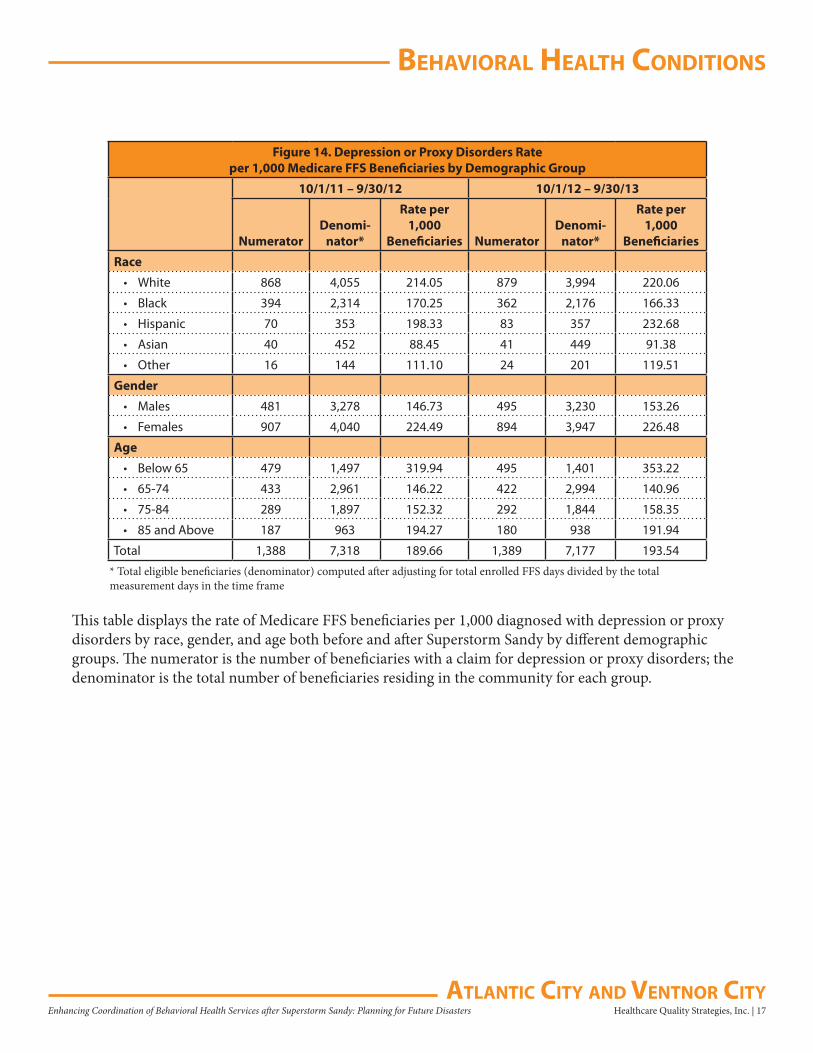
Figure 14. Depression or Proxy Disorders Rate per 1,000 Medicare FFS Beneficiaries by Demographic Group
10/1/11 – 9/30/12 10/1/12 – 9/30/13
NumeratorDenomi-
nator*
Rate per 1,000
Beneficiaries NumeratorDenomi-
nator*
Rate per 1,000
Beneficiaries
Race
• White 868 4,055 214.05 879 3,994 220.06
• Black 394 2,314 170.25 362 2,176 166.33
• Hispanic 70 353 198.33 83 357 232.68
• Asian 40 452 88.45 41 449 91.38
• Other 16 144 111.10 24 201 119.51
Gender
• Males 481 3,278 146.73 495 3,230 153.26
• Females 907 4,040 224.49 894 3,947 226.48
Age
• Below 65 479 1,497 319.94 495 1,401 353.22
• 65-74 433 2,961 146.22 422 2,994 140.96
• 75-84 289 1,897 152.32 292 1,844 158.35
• 85 and Above 187 963 194.27 180 938 191.94
Total 1,388 7,318 189.66 1,389 7,177 193.54
* Total eligible beneficiaries (denominator) computed after adjusting for total enrolled FFS days divided by the total measurement days in the time frame
This table displays the rate of Medicare FFS beneficiaries per 1,000 diagnosed with depression or proxy disorders by race, gender, and age both before and after Superstorm Sandy by different demographic groups. The numerator is the number of beneficiaries with a claim for depression or proxy disorders; the denominator is the total number of beneficiaries residing in the community for each group.
behaVioral healTh CondiTions
18 | Healthcare Quality Strategies, Inc. Enhancing Coordination of Behavioral Health Services after Superstorm Sandy: Planning for Future Disasters aTlanTiC CiTy and VenTnor CiTy
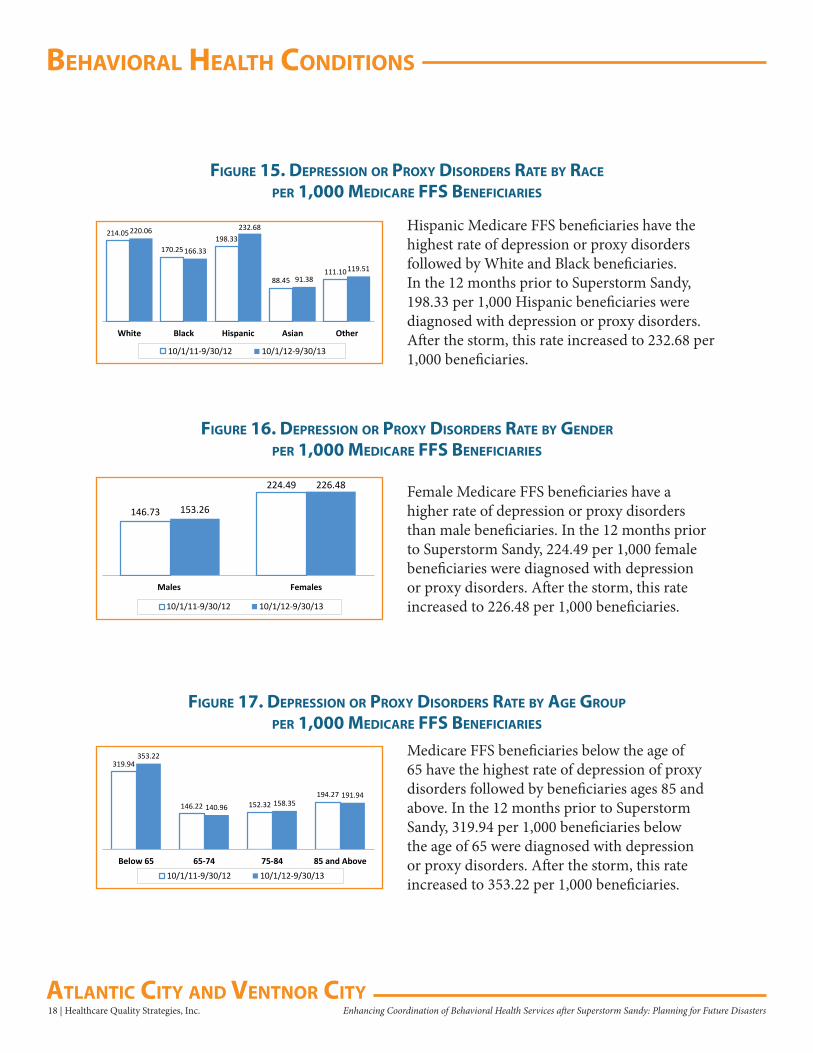
figure 15. dePression or Proxy disorders raTe by raCe
Per 1,000 MediCare ffs benefiCiaries
figure 16. dePression or Proxy disorders raTe by gender
Per 1,000 MediCare ffs benefiCiaries
figure 17. dePression or Proxy disorders raTe by age grouP
Per 1,000 MediCare ffs benefiCiaries
214.05
170.25198.33
88.45111.10
220.06
166.33
232.68
91.38119.51
White Black Hispanic Asian Other
10/1/11-9/30/12 10/1/12-9/30/13
146.73
224.49
153.26
226.48
Males Females
10/1/11-9/30/12 10/1/12-9/30/13
319.94
146.22 152.32194.27
353.22
140.96 158.35191.94
Below 65 65-74 75-84 85 and Above10/1/11-9/30/12 10/1/12-9/30/13
Hispanic Medicare FFS beneficiaries have the highest rate of depression or proxy disorders followed by White and Black beneficiaries. In the 12 months prior to Superstorm Sandy, 198.33 per 1,000 Hispanic beneficiaries were diagnosed with depression or proxy disorders. After the storm, this rate increased to 232.68 per 1,000 beneficiaries.
Female Medicare FFS beneficiaries have a higher rate of depression or proxy disorders than male beneficiaries. In the 12 months prior to Superstorm Sandy, 224.49 per 1,000 female beneficiaries were diagnosed with depression or proxy disorders. After the storm, this rate increased to 226.48 per 1,000 beneficiaries.
Medicare FFS beneficiaries below the age of 65 have the highest rate of depression of proxy disorders followed by beneficiaries ages 85 and above. In the 12 months prior to Superstorm Sandy, 319.94 per 1,000 beneficiaries below the age of 65 were diagnosed with depression or proxy disorders. After the storm, this rate increased to 353.22 per 1,000 beneficiaries.
behaVioral healTh CondiTions
Healthcare Quality Strategies, Inc. | 19Enhancing Coordination of Behavioral Health Services after Superstorm Sandy: Planning for Future DisastersaTlanTiC CiTy and VenTnor CiTy
figure 18. dePression or Proxy disorders Per 1,000 MediCare ffs benefiCiaries
figure 19. QuarTerly neW inCidenCe of dePression or Proxy disorders* Per 1,000 MediCare ffs benefiCiaries
21.59
25.29
23.45
26.72
23.5525.20
23.95
26.31
23.72
24.61
25.20
24.5925.95
24.50
Q1 2012 Q2 2012 Q3 2012 Q4 2012 Q1 2013 Q2 2013 Q3 2013
Atlantic City and Ventnor City Atlantic
* Quarterly new incidences of conditions that were non-existent (not reported) in the last 12 months.
189.68 204.77193.54 207.67
Atlantic City and Ventnor City Atlantic10/1/11-9/30/12 10/1/12-9/30/13
Annual Prevalence
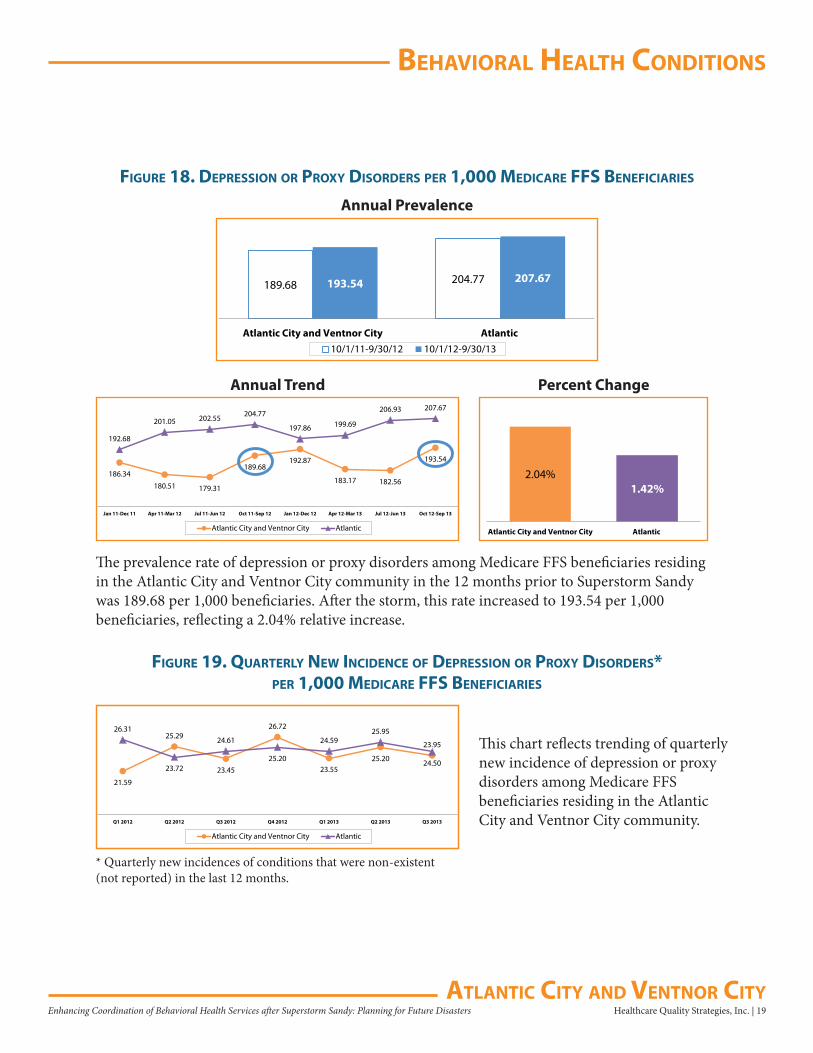
The prevalence rate of depression or proxy disorders among Medicare FFS beneficiaries residing in the Atlantic City and Ventnor City community in the 12 months prior to Superstorm Sandy was 189.68 per 1,000 beneficiaries. After the storm, this rate increased to 193.54 per 1,000 beneficiaries, reflecting a 2.04% relative increase.
2.04%1.42%
Atlantic City and Ventnor City Atlantic
186.34
180.51 179.31
189.68192.87
183.17 182.56
193.54
192.68
201.05 202.55 204.77
197.86 199.69
206.93 207.67
Jan 11-Dec 11 Apr 11-Mar 12 Jul 11-Jun 12 Oct 11-Sep 12 Jan 12-Dec 12 Apr 12-Mar 13 Jul 12-Jun 13 Oct 12-Sep 13
Atlantic City and Ventnor City Atlantic
Annual Trend Percent Change
This chart reflects trending of quarterly new incidence of depression or proxy disorders among Medicare FFS beneficiaries residing in the Atlantic City and Ventnor City community.
behaVioral healTh CondiTions
20 | Healthcare Quality Strategies, Inc. Enhancing Coordination of Behavioral Health Services after Superstorm Sandy: Planning for Future Disasters aTlanTiC CiTy and VenTnor CiTy
figure 20. PreValenCe of dePression or Proxy disorders*Per 1,000 MediCare ffs benefiCiaries in 10 CounTies
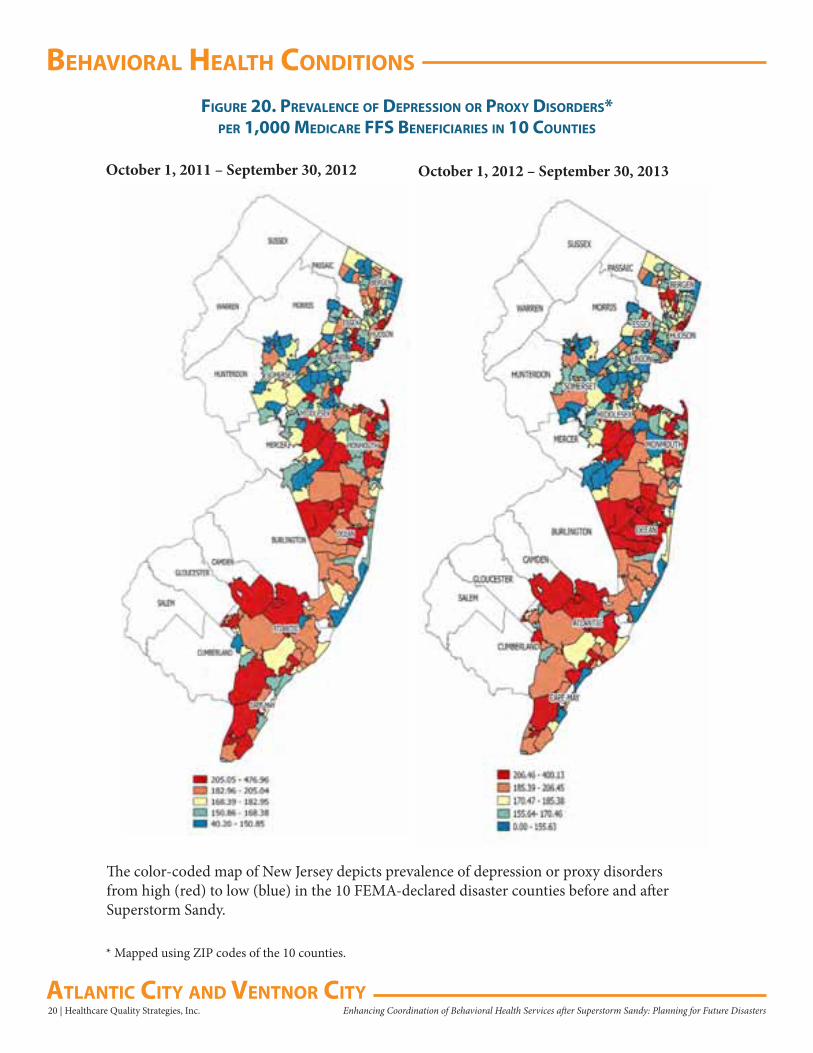
The color-coded map of New Jersey depicts prevalence of depression or proxy disorders from high (red) to low (blue) in the 10 FEMA-declared disaster counties before and after Superstorm Sandy.
* Mapped using ZIP codes of the 10 counties.
October 1, 2011 – September 30, 2012 October 1, 2012 – September 30, 2013
behaVioral healTh CondiTions
Healthcare Quality Strategies, Inc. | 21Enhancing Coordination of Behavioral Health Services after Superstorm Sandy: Planning for Future DisastersaTlanTiC CiTy and VenTnor CiTy
figure 21. aTlanTiC CounTy PreValenCe of dePression or Proxy disorders* Per 1,000 MediCare ffs benefiCiaries
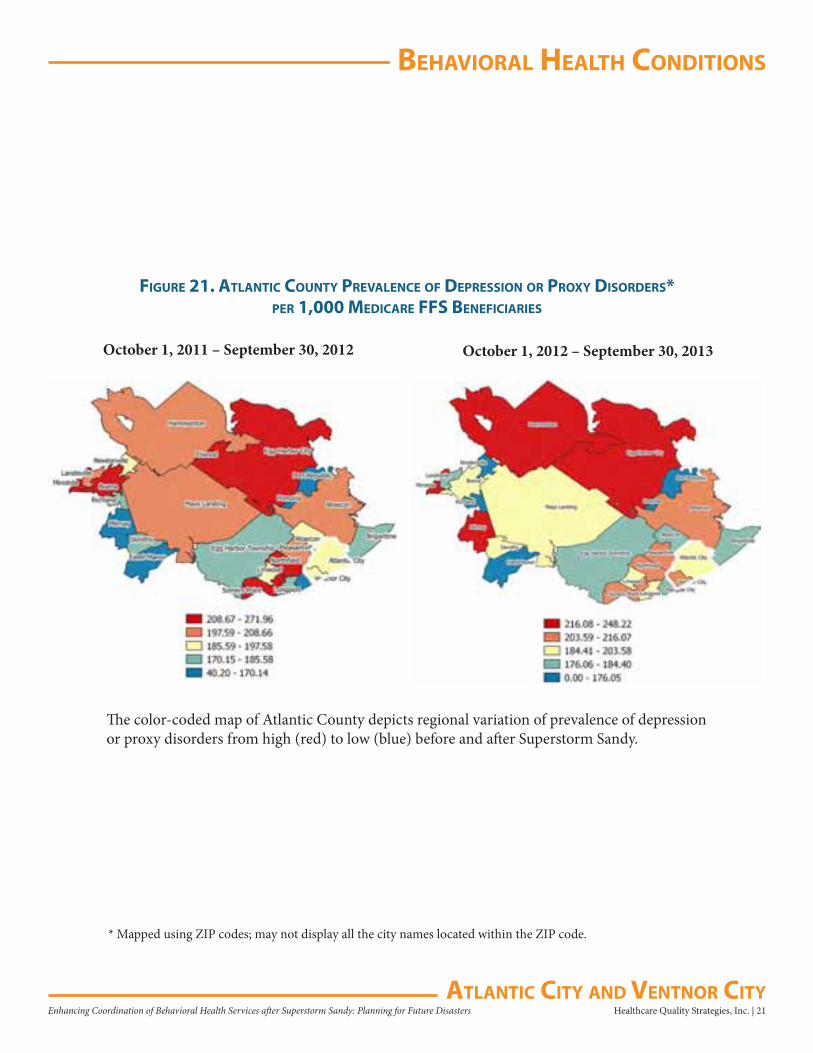
The color-coded map of Atlantic County depicts regional variation of prevalence of depression or proxy disorders from high (red) to low (blue) before and after Superstorm Sandy.
October 1, 2011 – September 30, 2012 October 1, 2012 – September 30, 2013
* Mapped using ZIP codes; may not display all the city names located within the ZIP code.
behaVioral healTh CondiTions
22 | Healthcare Quality Strategies, Inc. Enhancing Coordination of Behavioral Health Services after Superstorm Sandy: Planning for Future Disasters aTlanTiC CiTy and VenTnor CiTy
Depression
figure 22. dePression Per 1,000 MediCare ffs benefiCiaries
figure 23. QuarTerly neW inCidenCe of dePression* Per 1,000 MediCare ffs benefiCiaries
116.70 126.57119.97 124.48
Atlantic City and Ventnor City Atlantic10/1/11-9/30/12 10/1/12-9/30/13
Annual Prevalence
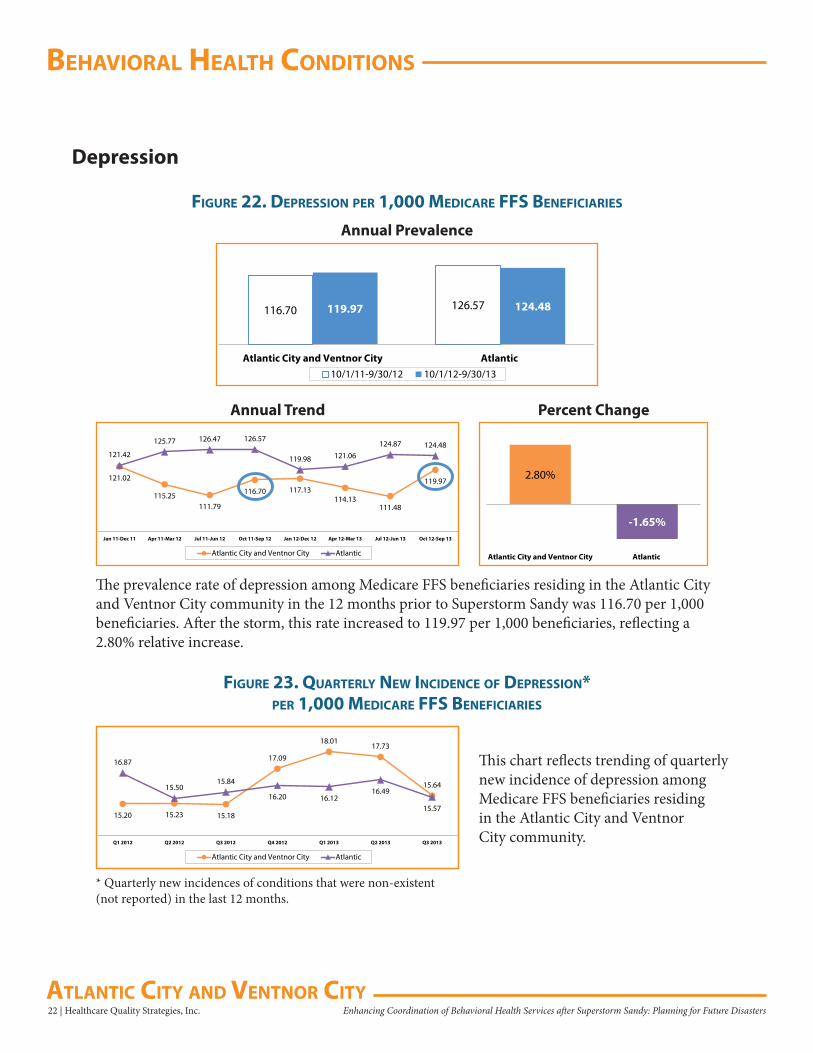
The prevalence rate of depression among Medicare FFS beneficiaries residing in the Atlantic City and Ventnor City community in the 12 months prior to Superstorm Sandy was 116.70 per 1,000 beneficiaries. After the storm, this rate increased to 119.97 per 1,000 beneficiaries, reflecting a 2.80% relative increase.
2.80%
-1.65%
Atlantic City and Ventnor City Atlantic
121.02
115.25111.79
116.70 117.13114.13
111.48
119.97
121.42
125.77 126.47 126.57
119.98 121.06124.87 124.48
Jan 11-Dec 11 Apr 11-Mar 12 Jul 11-Jun 12 Oct 11-Sep 12 Jan 12-Dec 12 Apr 12-Mar 13 Jul 12-Jun 13 Oct 12-Sep 13
Atlantic City and Ventnor City Atlantic
Annual Trend Percent Change
This chart reflects trending of quarterly new incidence of depression among Medicare FFS beneficiaries residing in the Atlantic City and Ventnor City community.
15.20 15.23 15.18
17.09
18.0117.73
15.64
16.87
15.5015.84
16.20 16.1216.49
15.57
Q1 2012 Q2 2012 Q3 2012 Q4 2012 Q1 2013 Q2 2013 Q3 2013
Atlantic City and Ventnor City Atlantic
* Quarterly new incidences of conditions that were non-existent (not reported) in the last 12 months.
behaVioral healTh CondiTions
Healthcare Quality Strategies, Inc. | 23Enhancing Coordination of Behavioral Health Services after Superstorm Sandy: Planning for Future DisastersaTlanTiC CiTy and VenTnor CiTy
Anxiety Disorders
figure 24. anxieTy disorders Per 1,000 MediCare ffs benefiCiaries
figure 25. QuarTerly neW inCidenCe of anxieTy disorders* Per 1,000 MediCare ffs benefiCiaries
114.37 122.81114.25 127.26
Atlantic City and Ventnor City Atlantic10/1/11-9/30/12 10/1/12-9/30/13
Annual Prevalence
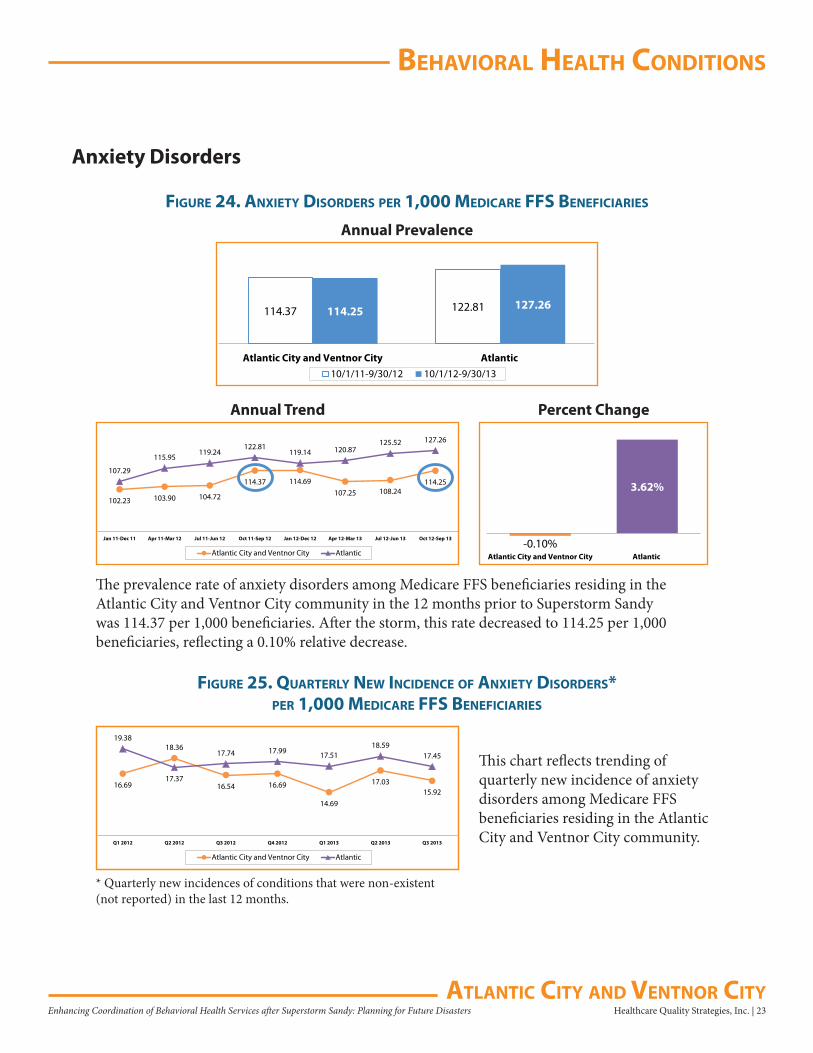
The prevalence rate of anxiety disorders among Medicare FFS beneficiaries residing in the Atlantic City and Ventnor City community in the 12 months prior to Superstorm Sandy was 114.37 per 1,000 beneficiaries. After the storm, this rate decreased to 114.25 per 1,000 beneficiaries, reflecting a 0.10% relative decrease.
-0.10%
3.62%
Atlantic City and Ventnor City Atlantic
102.23 103.90 104.72
114.37 114.69107.25 108.24
114.25107.29
115.95119.24
122.81119.14 120.87
125.52 127.26
Jan 11-Dec 11 Apr 11-Mar 12 Jul 11-Jun 12 Oct 11-Sep 12 Jan 12-Dec 12 Apr 12-Mar 13 Jul 12-Jun 13 Oct 12-Sep 13
Atlantic City and Ventnor City Atlantic
Annual Trend Percent Change
This chart reflects trending of quarterly new incidence of anxiety disorders among Medicare FFS beneficiaries residing in the Atlantic City and Ventnor City community.
16.69
18.36
16.54 16.69
14.69
17.0315.92
19.38
17.37
17.74 17.99 17.5118.59
17.45
Q1 2012 Q2 2012 Q3 2012 Q4 2012 Q1 2013 Q2 2013 Q3 2013
Atlantic City and Ventnor City Atlantic
* Quarterly new incidences of conditions that were non-existent (not reported) in the last 12 months.
behaVioral healTh CondiTions
24 | Healthcare Quality Strategies, Inc. Enhancing Coordination of Behavioral Health Services after Superstorm Sandy: Planning for Future Disasters aTlanTiC CiTy and VenTnor CiTy
Adjustment Disorders
figure 26. adjusTMenT disorders Per 1,000 MediCare ffs benefiCiaries
figure 27. QuarTerly neW inCidenCe of adjusTMenT disorders* Per 1,000 MediCare ffs benefiCiaries
26.78 30.2224.80 29.83
Atlantic City and Ventnor City Atlantic10/1/11-9/30/12 10/1/12-9/30/13
Annual Prevalence
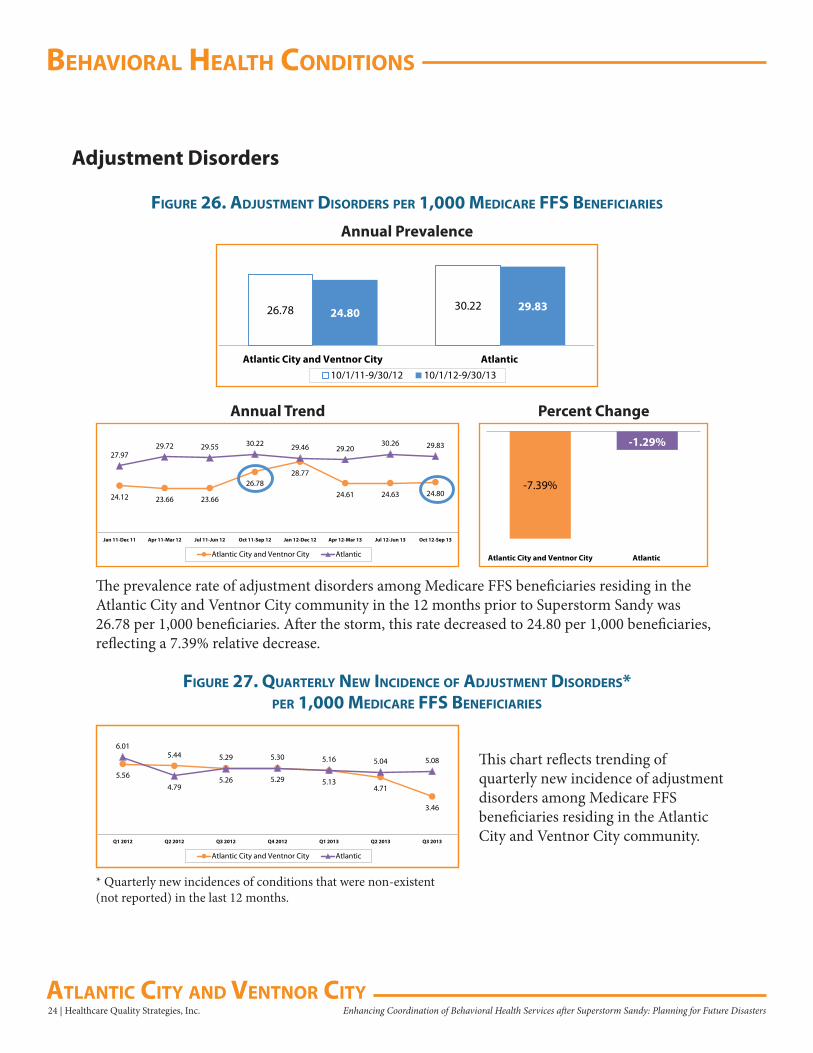
The prevalence rate of adjustment disorders among Medicare FFS beneficiaries residing in the Atlantic City and Ventnor City community in the 12 months prior to Superstorm Sandy was 26.78 per 1,000 beneficiaries. After the storm, this rate decreased to 24.80 per 1,000 beneficiaries, reflecting a 7.39% relative decrease.
-7.39%
-1.29%
Atlantic City and Ventnor City Atlantic
24.12 23.66 23.66
26.7828.77
24.61 24.63 24.80
27.9729.72 29.55 30.22 29.46 29.20
30.26 29.83
Jan 11-Dec 11 Apr 11-Mar 12 Jul 11-Jun 12 Oct 11-Sep 12 Jan 12-Dec 12 Apr 12-Mar 13 Jul 12-Jun 13 Oct 12-Sep 13
Atlantic City and Ventnor City Atlantic
Annual Trend Percent Change
This chart reflects trending of quarterly new incidence of adjustment disorders among Medicare FFS beneficiaries residing in the Atlantic City and Ventnor City community.
5.56
5.44 5.29
5.29 5.134.71
3.46
6.01
4.795.26
5.30 5.16 5.04 5.08
Q1 2012 Q2 2012 Q3 2012 Q4 2012 Q1 2013 Q2 2013 Q3 2013
Atlantic City and Ventnor City Atlantic
* Quarterly new incidences of conditions that were non-existent (not reported) in the last 12 months.
behaVioral healTh CondiTions
Healthcare Quality Strategies, Inc. | 25Enhancing Coordination of Behavioral Health Services after Superstorm Sandy: Planning for Future DisastersaTlanTiC CiTy and VenTnor CiTy
Post-Traumatic Stress Disorder (PTSD)
figure 28. PTsd Per 1,000 MediCare ffs benefiCiaries
5.88 5.326.27 5.22
Atlantic City and Ventnor City Atlantic10/1/11-9/30/12 10/1/12-9/30/13
Annual Prevalence
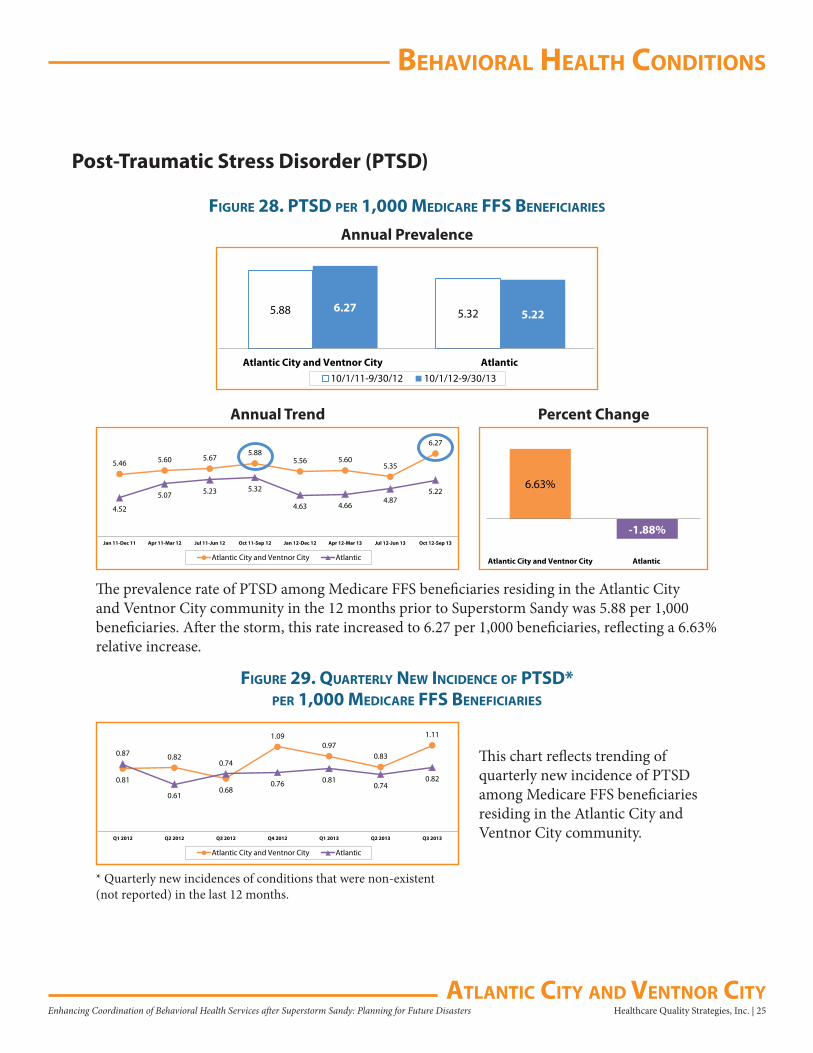
The prevalence rate of PTSD among Medicare FFS beneficiaries residing in the Atlantic City and Ventnor City community in the 12 months prior to Superstorm Sandy was 5.88 per 1,000 beneficiaries. After the storm, this rate increased to 6.27 per 1,000 beneficiaries, reflecting a 6.63% relative increase.
6.63%
-1.88%
Atlantic City and Ventnor City Atlantic
5.46 5.60 5.675.88
5.56 5.605.35
6.27
4.52
5.07 5.23 5.32
4.63 4.664.87
5.22
Jan 11-Dec 11 Apr 11-Mar 12 Jul 11-Jun 12 Oct 11-Sep 12 Jan 12-Dec 12 Apr 12-Mar 13 Jul 12-Jun 13 Oct 12-Sep 13
Atlantic City and Ventnor City Atlantic
Annual Trend Percent Change
figure 29. QuarTerly neW inCidenCe of PTsd* Per 1,000 MediCare ffs benefiCiaries
This chart reflects trending of quarterly new incidence of PTSD among Medicare FFS beneficiaries residing in the Atlantic City and Ventnor City community.
0.81
0.82
0.68
1.090.97
0.83
1.11
0.87
0.61
0.74
0.76 0.810.74
0.82
Q1 2012 Q2 2012 Q3 2012 Q4 2012 Q1 2013 Q2 2013 Q3 2013
Atlantic City and Ventnor City Atlantic
* Quarterly new incidences of conditions that were non-existent (not reported) in the last 12 months.
behaVioral healTh CondiTions
26 | Healthcare Quality Strategies, Inc. Enhancing Coordination of Behavioral Health Services after Superstorm Sandy: Planning for Future Disasters aTlanTiC CiTy and VenTnor CiTy
Alcohol or Substance Abuse
figure 30. alCohol or subsTanCe abuse Per 1,000 MediCare ffs benefiCiaries
figure 31. QuarTerly neW inCidenCe of alCohol or subsTanCe abuse* Per 1,000 MediCare ffs benefiCiaries
69.2842.99
57.6839.79
Atlantic City and Ventnor City Atlantic10/1/11-9/30/12 10/1/12-9/30/13
Annual Prevalence
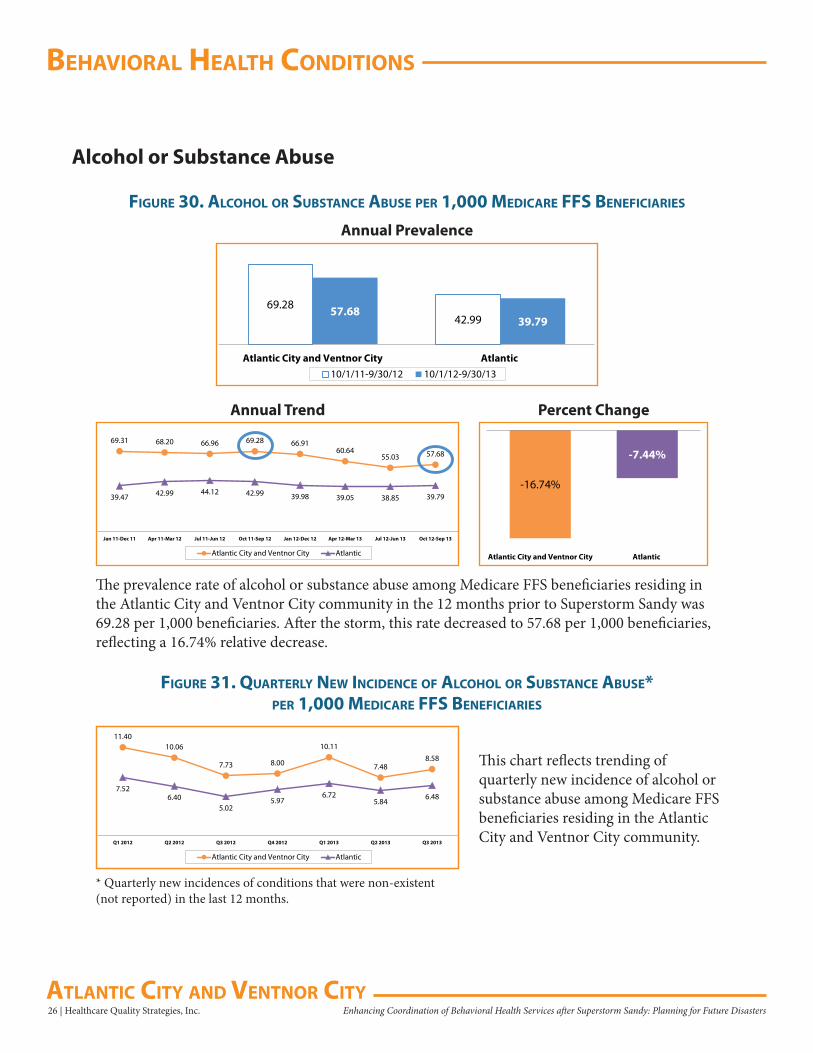
The prevalence rate of alcohol or substance abuse among Medicare FFS beneficiaries residing in the Atlantic City and Ventnor City community in the 12 months prior to Superstorm Sandy was 69.28 per 1,000 beneficiaries. After the storm, this rate decreased to 57.68 per 1,000 beneficiaries, reflecting a 16.74% relative decrease.
-16.74%
-7.44%
Atlantic City and Ventnor City Atlantic
69.31 68.20 66.96 69.28 66.9160.64
55.03 57.68
39.47 42.99 44.12 42.99 39.98 39.05 38.85 39.79
Jan 11-Dec 11 Apr 11-Mar 12 Jul 11-Jun 12 Oct 11-Sep 12 Jan 12-Dec 12 Apr 12-Mar 13 Jul 12-Jun 13 Oct 12-Sep 13
Atlantic City and Ventnor City Atlantic
Annual Trend Percent Change
This chart reflects trending of quarterly new incidence of alcohol or substance abuse among Medicare FFS beneficiaries residing in the Atlantic City and Ventnor City community.
11.4010.06
7.73 8.00
10.11
7.488.58
7.526.40
5.025.97
6.725.84
6.48
Q1 2012 Q2 2012 Q3 2012 Q4 2012 Q1 2013 Q2 2013 Q3 2013
Atlantic City and Ventnor City Atlantic
* Quarterly new incidences of conditions that were non-existent (not reported) in the last 12 months.
behaVioral healTh CondiTions
Healthcare Quality Strategies, Inc. | 27Enhancing Coordination of Behavioral Health Services after Superstorm Sandy: Planning for Future DisastersaTlanTiC CiTy and VenTnor CiTy
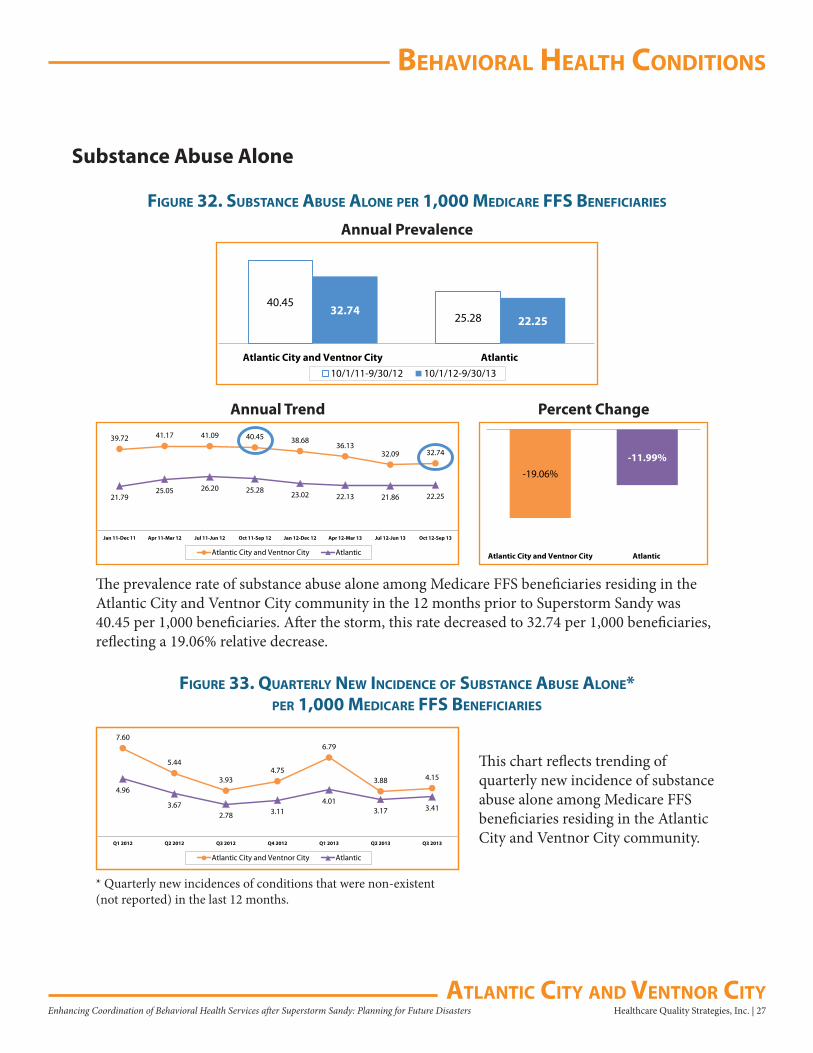
Substance Abuse Alone
figure 32. subsTanCe abuse alone Per 1,000 MediCare ffs benefiCiaries
figure 33. QuarTerly neW inCidenCe of subsTanCe abuse alone* Per 1,000 MediCare ffs benefiCiaries
40.4525.28
32.7422.25
Atlantic City and Ventnor City Atlantic10/1/11-9/30/12 10/1/12-9/30/13
Annual Prevalence
The prevalence rate of substance abuse alone among Medicare FFS beneficiaries residing in the Atlantic City and Ventnor City community in the 12 months prior to Superstorm Sandy was 40.45 per 1,000 beneficiaries. After the storm, this rate decreased to 32.74 per 1,000 beneficiaries, reflecting a 19.06% relative decrease.
-19.06%
-11.99%
Atlantic City and Ventnor City Atlantic
39.72 41.17 41.09 40.45 38.6836.13
32.09 32.74
21.7925.05 26.20 25.28 23.02 22.13 21.86 22.25
Jan 11-Dec 11 Apr 11-Mar 12 Jul 11-Jun 12 Oct 11-Sep 12 Jan 12-Dec 12 Apr 12-Mar 13 Jul 12-Jun 13 Oct 12-Sep 13
Atlantic City and Ventnor City Atlantic
Annual Trend Percent Change
This chart reflects trending of quarterly new incidence of substance abuse alone among Medicare FFS beneficiaries residing in the Atlantic City and Ventnor City community.
7.60
5.44
3.934.75
6.79
3.88 4.15
4.96
3.672.78 3.11
4.013.17 3.41
Q1 2012 Q2 2012 Q3 2012 Q4 2012 Q1 2013 Q2 2013 Q3 2013
Atlantic City and Ventnor City Atlantic
* Quarterly new incidences of conditions that were non-existent (not reported) in the last 12 months.
behaVioral healTh CondiTions
28 | Healthcare Quality Strategies, Inc. Enhancing Coordination of Behavioral Health Services after Superstorm Sandy: Planning for Future Disasters aTlanTiC CiTy and VenTnor CiTy
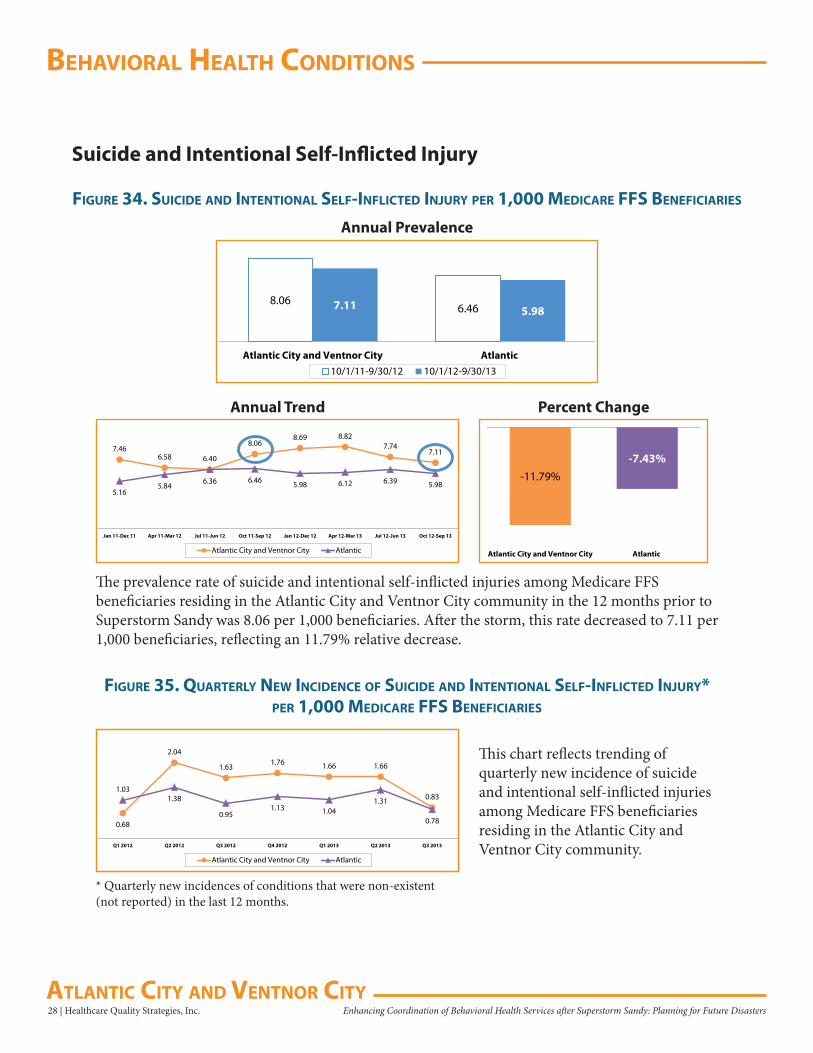
Suicide and Intentional Self-Inflicted Injury
figure 34. suiCide and inTenTional self-infliCTed injury Per 1,000 MediCare ffs benefiCiaries
8.066.467.11 5.98
Atlantic City and Ventnor City Atlantic10/1/11-9/30/12 10/1/12-9/30/13
Annual Prevalence
The prevalence rate of suicide and intentional self-inflicted injuries among Medicare FFS beneficiaries residing in the Atlantic City and Ventnor City community in the 12 months prior to Superstorm Sandy was 8.06 per 1,000 beneficiaries. After the storm, this rate decreased to 7.11 per 1,000 beneficiaries, reflecting an 11.79% relative decrease.
-11.79%
-7.43%
Atlantic City and Ventnor City Atlantic
7.466.58
6.36
8.068.69 8.82
7.747.11
5.165.84
6.40
6.46 5.98 6.12 6.39 5.98
Jan 11-Dec 11 Apr 11-Mar 12 Jul 11-Jun 12 Oct 11-Sep 12 Jan 12-Dec 12 Apr 12-Mar 13 Jul 12-Jun 13 Oct 12-Sep 13
Atlantic City and Ventnor City Atlantic
Annual Trend Percent Change
figure 35. QuarTerly neW inCidenCe of suiCide and inTenTional self-infliCTed injury* Per 1,000 MediCare ffs benefiCiaries
This chart reflects trending of quarterly new incidence of suicide and intentional self-inflicted injuries among Medicare FFS beneficiaries residing in the Atlantic City and Ventnor City community.
0.68
2.04
1.631.76 1.66 1.66
0.831.03
1.38
0.951.13 1.04
1.31
0.78
Q1 2012 Q2 2012 Q3 2012 Q4 2012 Q1 2013 Q2 2013 Q3 2013
Atlantic City and Ventnor City Atlantic
* Quarterly new incidences of conditions that were non-existent (not reported) in the last 12 months.
behaVioral healTh CondiTions
Healthcare Quality Strategies, Inc. | 29Enhancing Coordination of Behavioral Health Services after Superstorm Sandy: Planning for Future DisastersaTlanTiC CiTy and VenTnor CiTy
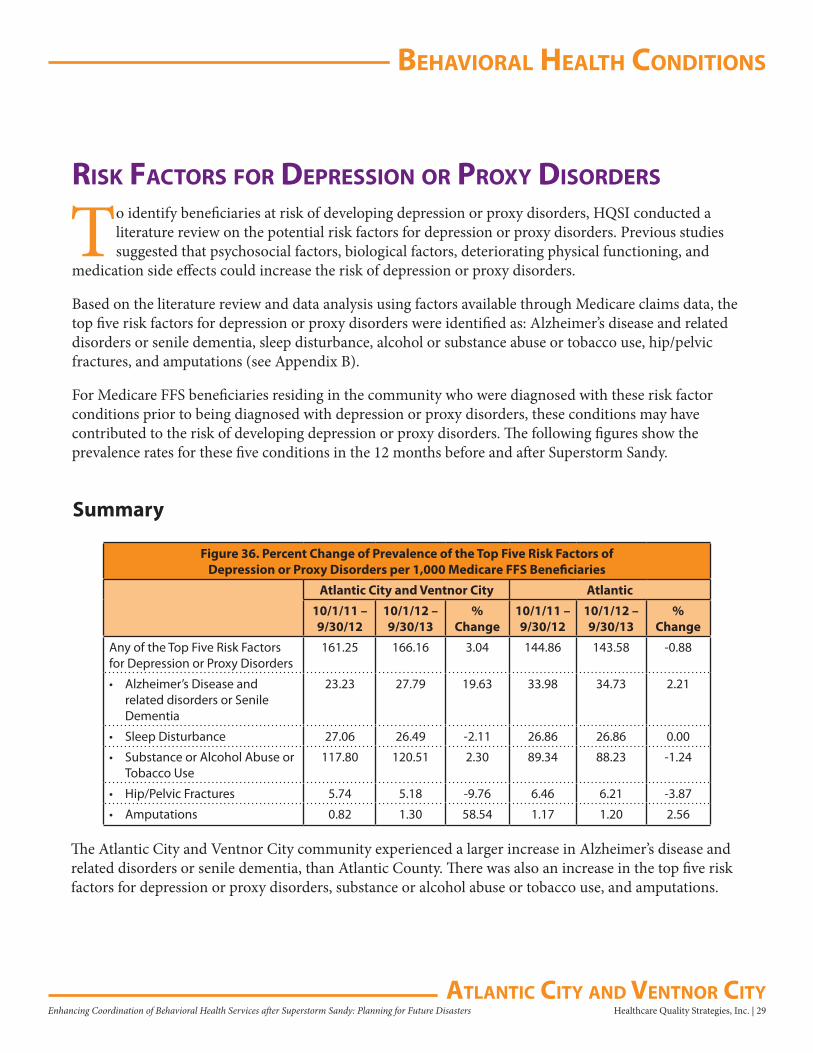
risk faCTors for dePression or Proxy disorders
To identify beneficiaries at risk of developing depression or proxy disorders, HQSI conducted a literature review on the potential risk factors for depression or proxy disorders. Previous studies suggested that psychosocial factors, biological factors, deteriorating physical functioning, and
medication side effects could increase the risk of depression or proxy disorders.
Based on the literature review and data analysis using factors available through Medicare claims data, the top five risk factors for depression or proxy disorders were identified as: Alzheimer’s disease and related disorders or senile dementia, sleep disturbance, alcohol or substance abuse or tobacco use, hip/pelvic fractures, and amputations (see Appendix B).
For Medicare FFS beneficiaries residing in the community who were diagnosed with these risk factor conditions prior to being diagnosed with depression or proxy disorders, these conditions may have contributed to the risk of developing depression or proxy disorders. The following figures show the prevalence rates for these five conditions in the 12 months before and after Superstorm Sandy.
Summary
Figure 36. Percent Change of Prevalence of the Top Five Risk Factors of Depression or Proxy Disorders per 1,000 Medicare FFS Beneficiaries
Atlantic City and Ventnor City Atlantic
10/1/11 – 9/30/12
10/1/12 – 9/30/13
% Change
10/1/11 – 9/30/12
10/1/12 – 9/30/13
% Change
Any of the Top Five Risk Factors for Depression or Proxy Disorders
161.25 166.16 3.04 144.86 143.58 -0.88
• Alzheimer’s Disease and related disorders or Senile Dementia
23.23 27.79 19.63 33.98 34.73 2.21
• Sleep Disturbance 27.06 26.49 -2.11 26.86 26.86 0.00
• Substance or Alcohol Abuse or Tobacco Use
117.80 120.51 2.30 89.34 88.23 -1.24
• Hip/Pelvic Fractures 5.74 5.18 -9.76 6.46 6.21 -3.87
• Amputations 0.82 1.30 58.54 1.17 1.20 2.56
The Atlantic City and Ventnor City community experienced a larger increase in Alzheimer’s disease and related disorders or senile dementia, than Atlantic County. There was also an increase in the top five risk factors for depression or proxy disorders, substance or alcohol abuse or tobacco use, and amputations.
behaVioral healTh CondiTions
30 | Healthcare Quality Strategies, Inc. Enhancing Coordination of Behavioral Health Services after Superstorm Sandy: Planning for Future Disasters aTlanTiC CiTy and VenTnor CiTy
161.25 144.86166.16
143.58
Atlantic City and Ventnor City Atlantic10/1/11-9/30/12 10/1/12-9/30/13
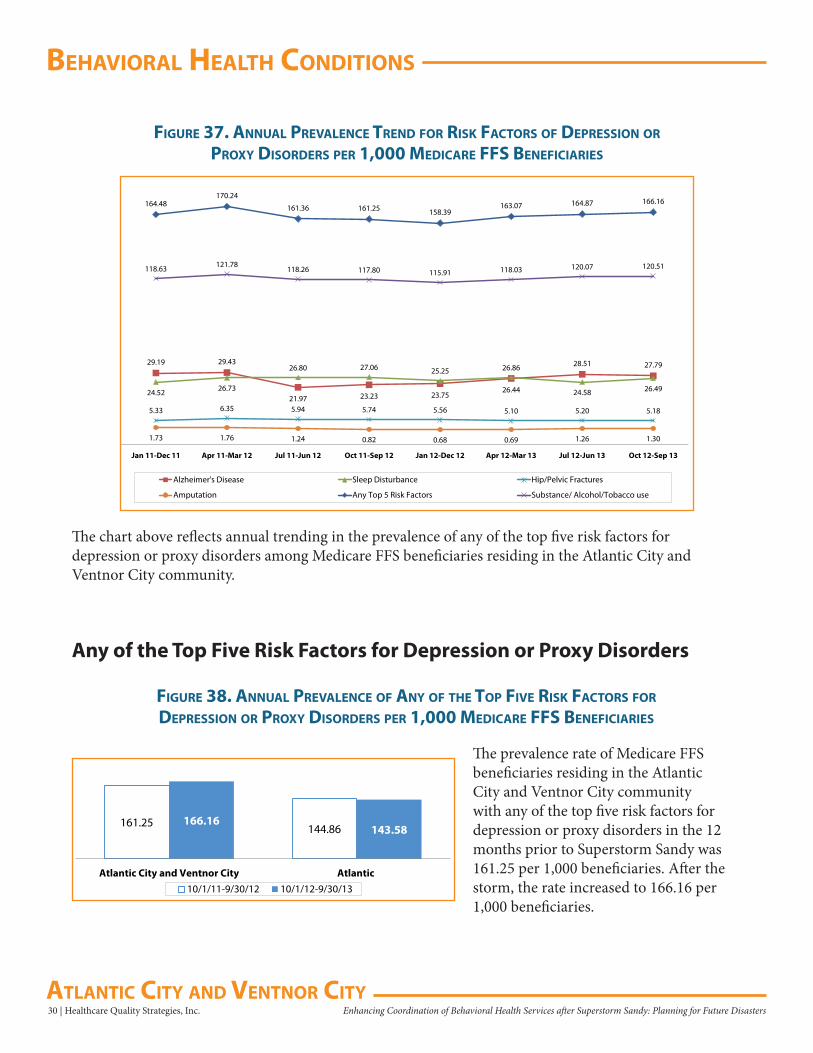
figure 38. annual PreValenCe of any of The ToP fiVe risk faCTors for dePression or Proxy disorders Per 1,000 MediCare ffs benefiCiaries
figure 37. annual PreValenCe Trend for risk faCTors of dePression or Proxy disorders Per 1,000 MediCare ffs benefiCiaries
29.19 29.43
21.97 23.23 23.7526.44
28.51 27.79
24.52 26.73
26.80 27.06 25.25 26.86
24.58 26.49
5.33 6.35 5.94 5.74 5.56 5.10 5.20 5.18
1.73 1.76 1.24 0.82 0.68 0.69 1.26 1.30
164.48170.24
161.36 161.25 158.39163.07 164.87 166.16
118.63 121.78118.26 117.80 115.91 118.03 120.07 120.51
Jan 11-Dec 11 Apr 11-Mar 12 Jul 11-Jun 12 Oct 11-Sep 12 Jan 12-Dec 12 Apr 12-Mar 13 Jul 12-Jun 13 Oct 12-Sep 13
Alzheimer's Disease Sleep Disturbance Hip/Pelvic Fractures
Amputation Any Top 5 Risk Factors Substance/ Alcohol/Tobacco use
The chart above reflects annual trending in the prevalence of any of the top five risk factors for depression or proxy disorders among Medicare FFS beneficiaries residing in the Atlantic City and Ventnor City community.
Any of the Top Five Risk Factors for Depression or Proxy Disorders
The prevalence rate of Medicare FFS beneficiaries residing in the Atlantic City and Ventnor City community with any of the top five risk factors for depression or proxy disorders in the 12 months prior to Superstorm Sandy was 161.25 per 1,000 beneficiaries. After the storm, the rate increased to 166.16 per 1,000 beneficiaries.
behaVioral healTh CondiTions
Healthcare Quality Strategies, Inc. | 31Enhancing Coordination of Behavioral Health Services after Superstorm Sandy: Planning for Future DisastersaTlanTiC CiTy and VenTnor CiTy
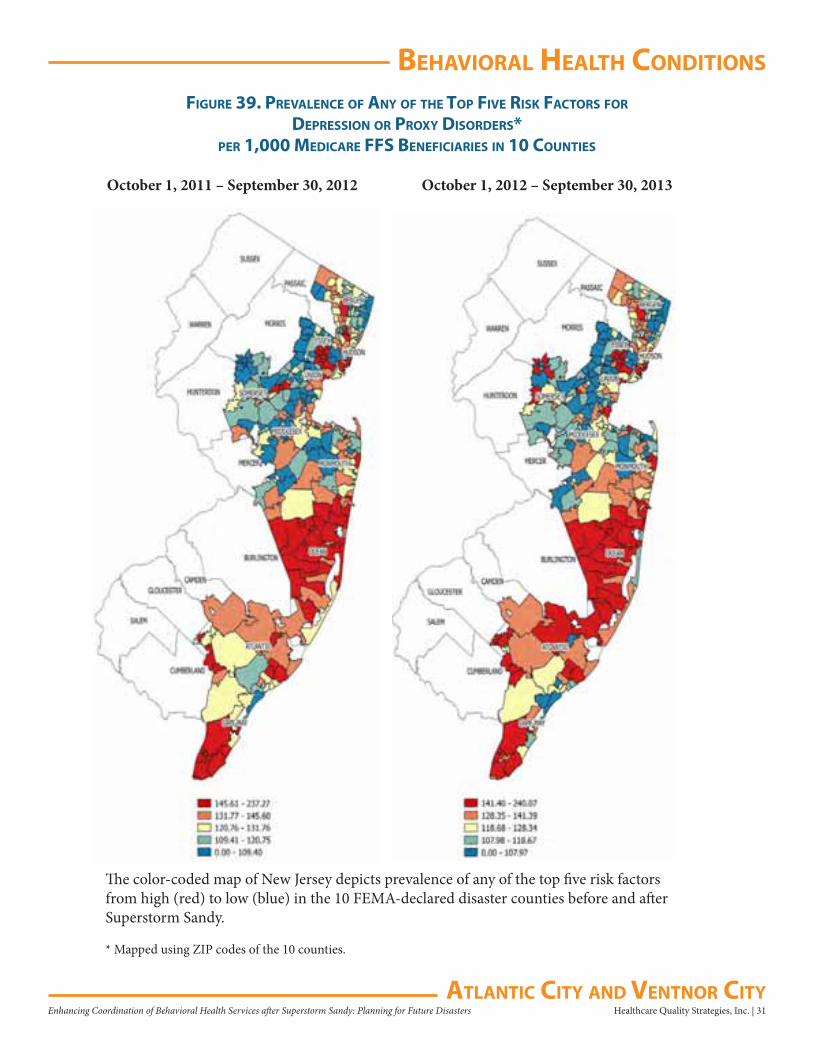
figure 39. PreValenCe of any of The ToP fiVe risk faCTors for
dePression or Proxy disorders*Per 1,000 MediCare ffs benefiCiaries in 10 CounTies
The color-coded map of New Jersey depicts prevalence of any of the top five risk factors from high (red) to low (blue) in the 10 FEMA-declared disaster counties before and after Superstorm Sandy.
* Mapped using ZIP codes of the 10 counties.
October 1, 2011 – September 30, 2012 October 1, 2012 – September 30, 2013
behaVioral healTh CondiTions
32 | Healthcare Quality Strategies, Inc. Enhancing Coordination of Behavioral Health Services after Superstorm Sandy: Planning for Future Disasters aTlanTiC CiTy and VenTnor CiTy
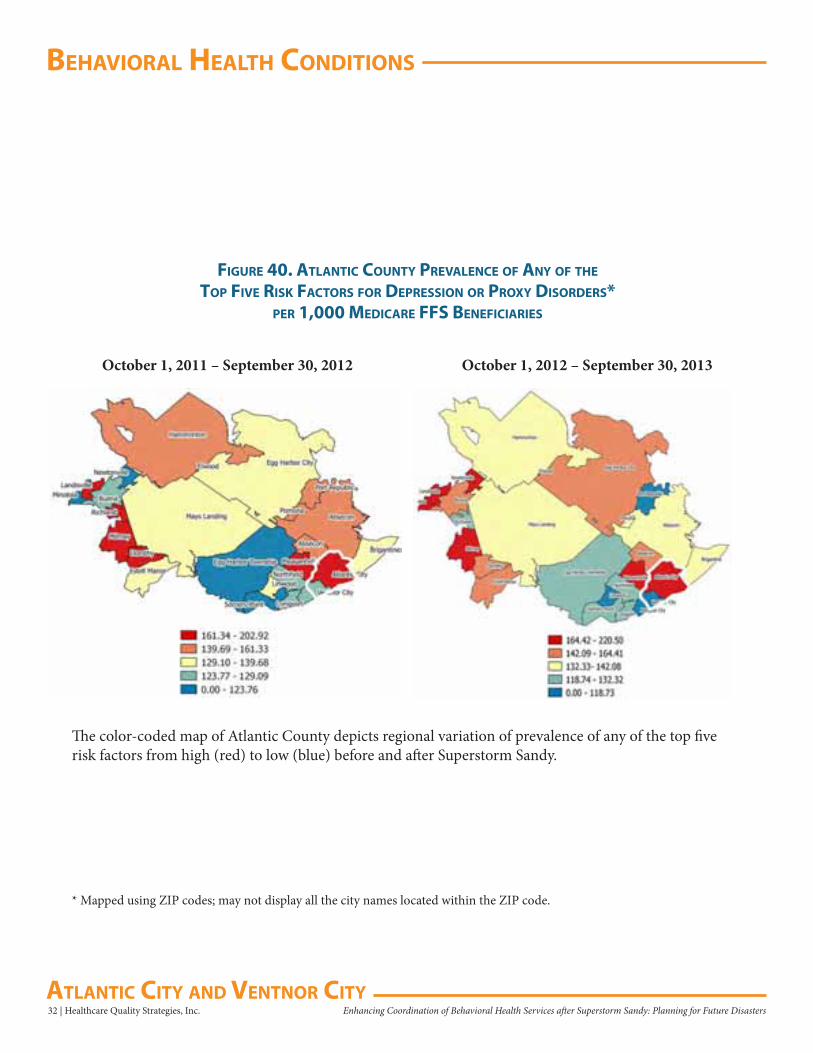
figure 40. aTlanTiC CounTy PreValenCe of any of The ToP fiVe risk faCTors for dePression or Proxy disorders*
Per 1,000 MediCare ffs benefiCiaries
The color-coded map of Atlantic County depicts regional variation of prevalence of any of the top five risk factors from high (red) to low (blue) before and after Superstorm Sandy.
October 1, 2011 – September 30, 2012 October 1, 2012 – September 30, 2013
* Mapped using ZIP codes; may not display all the city names located within the ZIP code.
behaVioral healTh CondiTions
Healthcare Quality Strategies, Inc. | 33Enhancing Coordination of Behavioral Health Services after Superstorm Sandy: Planning for Future DisastersaTlanTiC CiTy and VenTnor CiTy
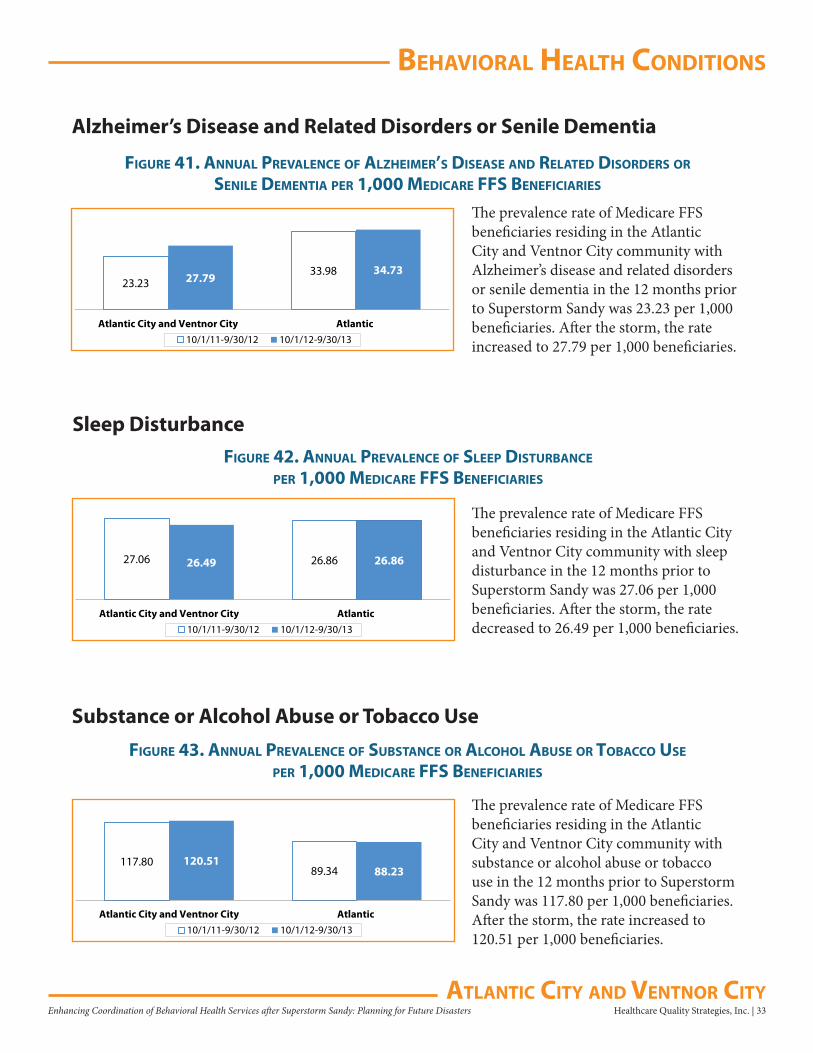
figure 41. annual PreValenCe of alzheiMer’s disease and relaTed disorders or senile deMenTia Per 1,000 MediCare ffs benefiCiaries
Alzheimer’s Disease and Related Disorders or Senile Dementia
23.2333.9827.79
34.73
Atlantic City and Ventnor City Atlantic10/1/11-9/30/12 10/1/12-9/30/13
The prevalence rate of Medicare FFS beneficiaries residing in the Atlantic City and Ventnor City community with Alzheimer’s disease and related disorders or senile dementia in the 12 months prior to Superstorm Sandy was 23.23 per 1,000 beneficiaries. After the storm, the rate increased to 27.79 per 1,000 beneficiaries.
figure 42. annual PreValenCe of sleeP disTurbanCe
Per 1,000 MediCare ffs benefiCiaries
Sleep Disturbance
27.06 26.8626.49 26.86
Atlantic City and Ventnor City Atlantic10/1/11-9/30/12 10/1/12-9/30/13
The prevalence rate of Medicare FFS beneficiaries residing in the Atlantic City and Ventnor City community with sleep disturbance in the 12 months prior to Superstorm Sandy was 27.06 per 1,000 beneficiaries. After the storm, the rate decreased to 26.49 per 1,000 beneficiaries.
figure 43. annual PreValenCe of subsTanCe or alCohol abuse or TobaCCo use
Per 1,000 MediCare ffs benefiCiaries
Substance or Alcohol Abuse or Tobacco Use
117.8089.34
120.5188.23
Atlantic City and Ventnor City Atlantic10/1/11-9/30/12 10/1/12-9/30/13
The prevalence rate of Medicare FFS beneficiaries residing in the Atlantic City and Ventnor City community with substance or alcohol abuse or tobacco use in the 12 months prior to Superstorm Sandy was 117.80 per 1,000 beneficiaries. After the storm, the rate increased to 120.51 per 1,000 beneficiaries.
behaVioral healTh CondiTions
34 | Healthcare Quality Strategies, Inc. Enhancing Coordination of Behavioral Health Services after Superstorm Sandy: Planning for Future Disasters aTlanTiC CiTy and VenTnor CiTy
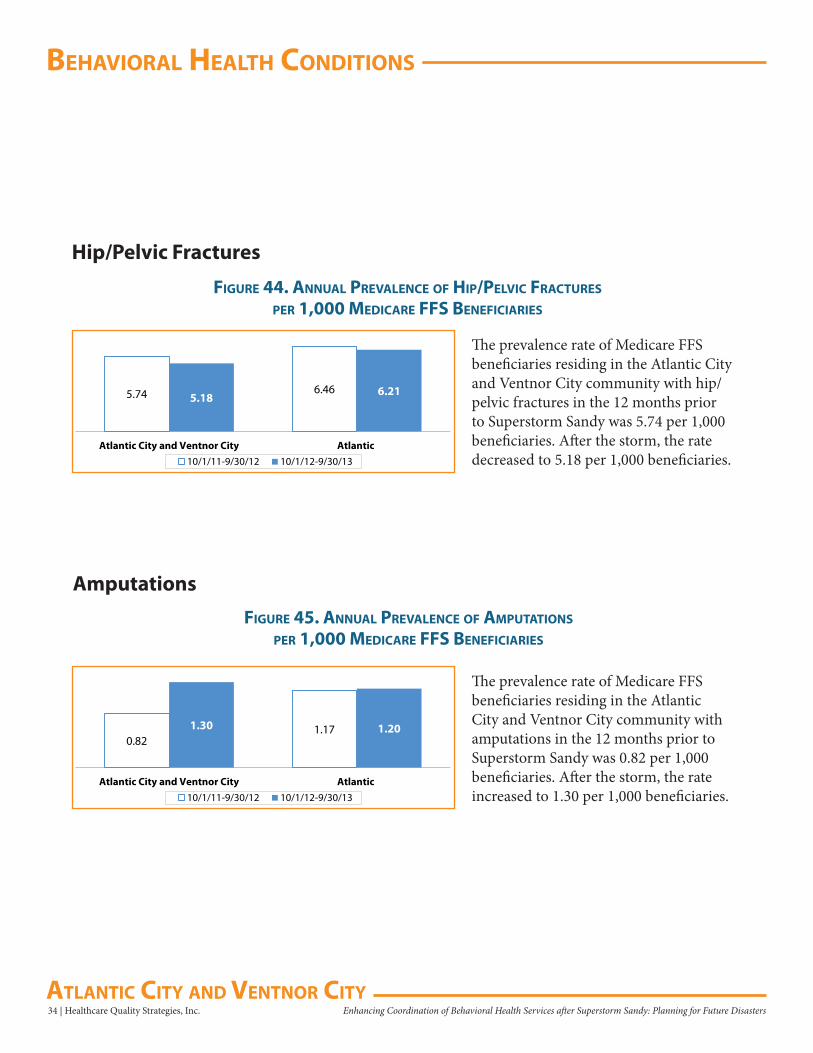
figure 44. annual PreValenCe of hiP/PelViC fraCTures
Per 1,000 MediCare ffs benefiCiaries
Hip/Pelvic Fractures
5.74 6.465.18 6.21
Atlantic City and Ventnor City Atlantic10/1/11-9/30/12 10/1/12-9/30/13
figure 45. annual PreValenCe of aMPuTaTions
Per 1,000 MediCare ffs benefiCiaries
0.821.171.30 1.20
Atlantic City and Ventnor City Atlantic10/1/11-9/30/12 10/1/12-9/30/13
The prevalence rate of Medicare FFS beneficiaries residing in the Atlantic City and Ventnor City community with hip/pelvic fractures in the 12 months prior to Superstorm Sandy was 5.74 per 1,000 beneficiaries. After the storm, the rate decreased to 5.18 per 1,000 beneficiaries.
Amputations
The prevalence rate of Medicare FFS beneficiaries residing in the Atlantic City and Ventnor City community with amputations in the 12 months prior to Superstorm Sandy was 0.82 per 1,000 beneficiaries. After the storm, the rate increased to 1.30 per 1,000 beneficiaries.
uTilizaTion
Healthcare Quality Strategies, Inc. | 35Enhancing Coordination of Behavioral Health Services after Superstorm Sandy: Planning for Future DisastersaTlanTiC CiTy and VenTnor CiTy
uTilizaTion of ouTPaTienT behaVioral healTh serViCes
Assessments*Summary
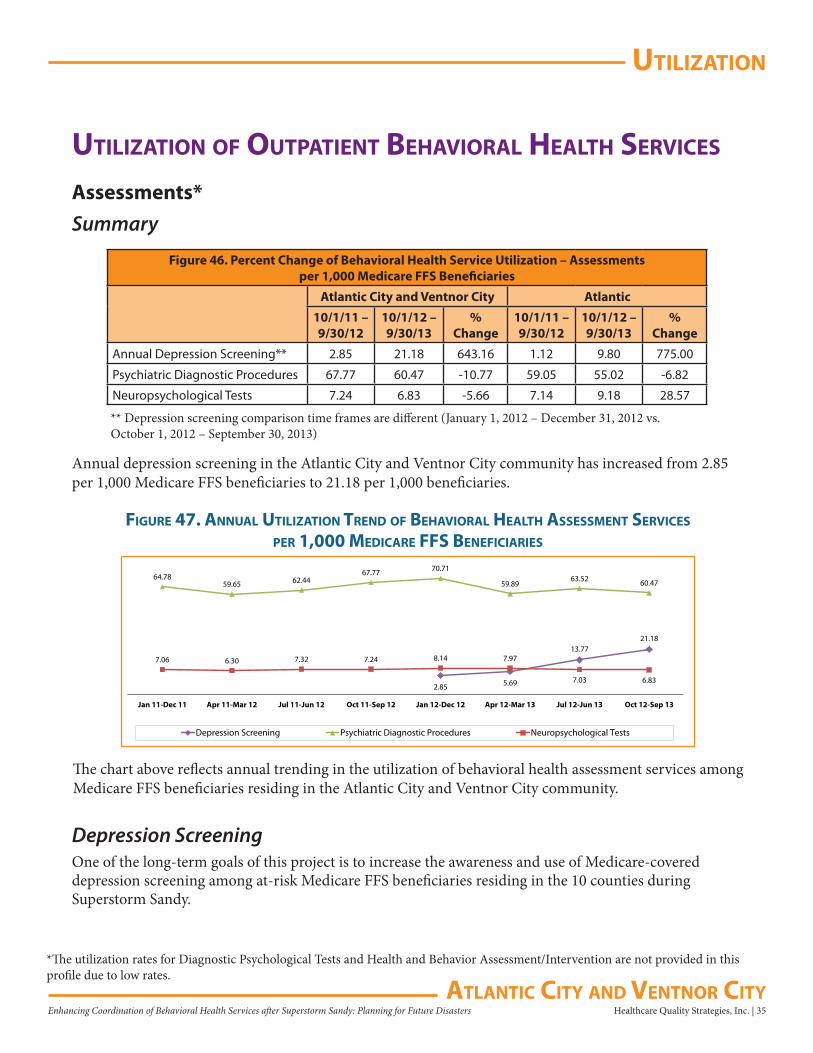
Figure 46. Percent Change of Behavioral Health Service Utilization – Assessmentsper 1,000 Medicare FFS Beneficiaries
Atlantic City and Ventnor City Atlantic
10/1/11 – 9/30/12
10/1/12 – 9/30/13
% Change
10/1/11 – 9/30/12
10/1/12 – 9/30/13
% Change
Annual Depression Screening** 2.85 21.18 643.16 1.12 9.80 775.00
Psychiatric Diagnostic Procedures 67.77 60.47 -10.77 59.05 55.02 -6.82
Neuropsychological Tests 7.24 6.83 -5.66 7.14 9.18 28.57
Annual depression screening in the Atlantic City and Ventnor City community has increased from 2.85 per 1,000 Medicare FFS beneficiaries to 21.18 per 1,000 beneficiaries.
** Depression screening comparison time frames are different (January 1, 2012 – December 31, 2012 vs. October 1, 2012 – September 30, 2013)
2.85 5.69
13.7721.18
64.7859.65 62.44
67.77 70.71
59.8963.52 60.47
7.06 6.30 7.32 7.24 8.14 7.97
7.03 6.83
Jan 11-Dec 11 Apr 11-Mar 12 Jul 11-Jun 12 Oct 11-Sep 12 Jan 12-Dec 12 Apr 12-Mar 13 Jul 12-Jun 13 Oct 12-Sep 13
Depression Screening Psychiatric Diagnostic Procedures Neuropsychological Tests
figure 47. annual uTilizaTion Trend of behaVioral healTh assessMenT serViCes
Per 1,000 MediCare ffs benefiCiaries
The chart above reflects annual trending in the utilization of behavioral health assessment services among Medicare FFS beneficiaries residing in the Atlantic City and Ventnor City community.
Depression ScreeningOne of the long-term goals of this project is to increase the awareness and use of Medicare-covered depression screening among at-risk Medicare FFS beneficiaries residing in the 10 counties during Superstorm Sandy.
*The utilization rates for Diagnostic Psychological Tests and Health and Behavior Assessment/Intervention are not provided in this profile due to low rates.
uTilizaTion
36 | Healthcare Quality Strategies, Inc. Enhancing Coordination of Behavioral Health Services after Superstorm Sandy: Planning for Future Disasters aTlanTiC CiTy and VenTnor CiTy
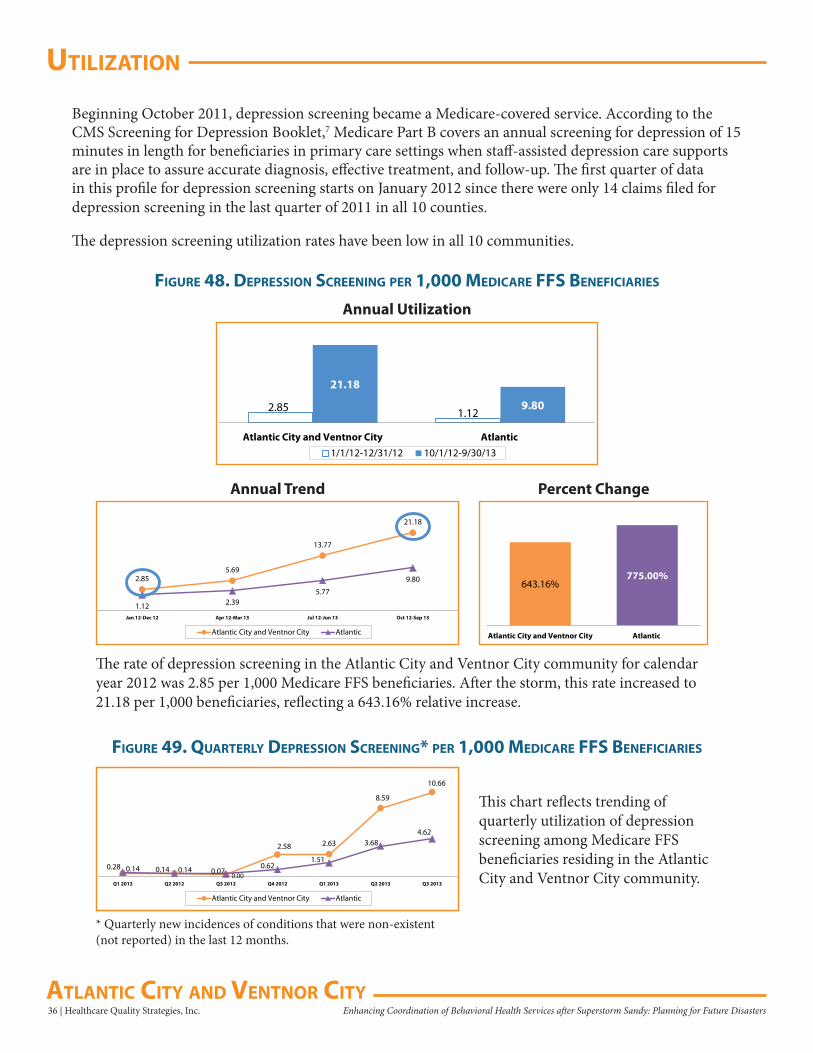
figure 48. dePression sCreening Per 1,000 MediCare ffs benefiCiaries
2.85 1.12
21.18
9.80
Atlantic City and Ventnor City Atlantic1/1/12-12/31/12 10/1/12-9/30/13
Annual Utilization
Beginning October 2011, depression screening became a Medicare-covered service. According to the CMS Screening for Depression Booklet,7 Medicare Part B covers an annual screening for depression of 15 minutes in length for beneficiaries in primary care settings when staff-assisted depression care supports are in place to assure accurate diagnosis, effective treatment, and follow-up. The first quarter of data in this profile for depression screening starts on January 2012 since there were only 14 claims filed for depression screening in the last quarter of 2011 in all 10 counties.
The depression screening utilization rates have been low in all 10 communities.
The rate of depression screening in the Atlantic City and Ventnor City community for calendar year 2012 was 2.85 per 1,000 Medicare FFS beneficiaries. After the storm, this rate increased to 21.18 per 1,000 beneficiaries, reflecting a 643.16% relative increase.
643.16%775.00%
Atlantic City and Ventnor City Atlantic
2.855.69
13.77
21.18
1.12 2.395.77
9.80
Jan 12-Dec 12 Apr 12-Mar 13 Jul 12-Jun 13 Oct 12-Sep 13
Atlantic City and Ventnor City Atlantic
Annual Trend Percent Change
figure 49. QuarTerly dePression sCreening* Per 1,000 MediCare ffs benefiCiaries
This chart reflects trending of quarterly utilization of depression screening among Medicare FFS beneficiaries residing in the Atlantic City and Ventnor City community.
0.14 0.140.00
2.58 2.63
8.59
10.66
0.28 0.14 0.070.62
1.51
3.684.62
Q1 2012 Q2 2012 Q3 2012 Q4 2012 Q1 2013 Q2 2013 Q3 2013
Atlantic City and Ventnor City Atlantic
* Quarterly new incidences of conditions that were non-existent (not reported) in the last 12 months.
uTilizaTion
Healthcare Quality Strategies, Inc. | 37Enhancing Coordination of Behavioral Health Services after Superstorm Sandy: Planning for Future DisastersaTlanTiC CiTy and VenTnor CiTy
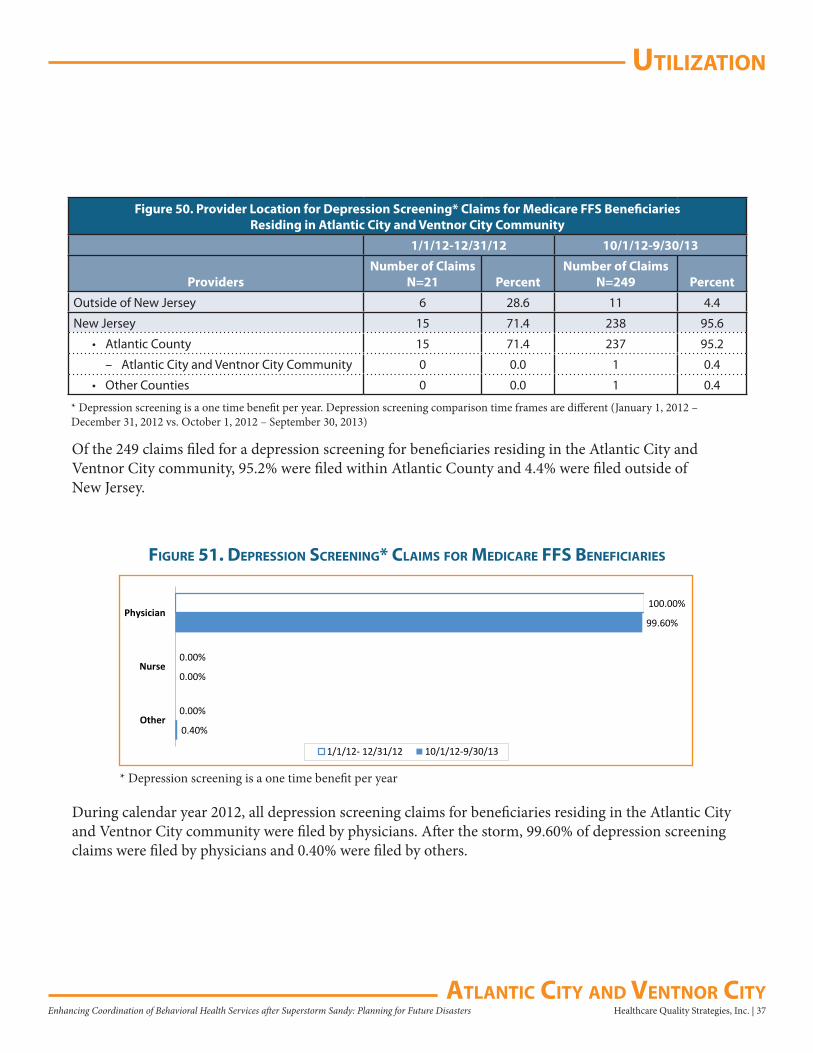
Figure 50. Provider Location for Depression Screening* Claims for Medicare FFS Beneficiaries Residing in Atlantic City and Ventnor City Community
1/1/12-12/31/12 10/1/12-9/30/13
ProvidersNumber of Claims
N=21 PercentNumber of Claims
N=249 Percent
Outside of New Jersey 6 28.6 11 4.4
New Jersey 15 71.4 238 95.6
• Atlantic County 15 71.4 237 95.2
– Atlantic City and Ventnor City Community 0 0.0 1 0.4
• Other Counties 0 0.0 1 0.4
* Depression screening is a one time benefit per year. Depression screening comparison time frames are different (January 1, 2012 – December 31, 2012 vs. October 1, 2012 – September 30, 2013)
Of the 249 claims filed for a depression screening for beneficiaries residing in the Atlantic City and Ventnor City community, 95.2% were filed within Atlantic County and 4.4% were filed outside of New Jersey.
* Depression screening is a one time benefit per year
0.40%
0.00%
99.60%
0.00%
0.00%
100.00%
Other
Nurse
Physician
1/1/12- 12/31/12 10/1/12-9/30/13
figure 51. dePression sCreening* ClaiMs for MediCare ffs benefiCiaries
During calendar year 2012, all depression screening claims for beneficiaries residing in the Atlantic City and Ventnor City community were filed by physicians. After the storm, 99.60% of depression screening claims were filed by physicians and 0.40% were filed by others.
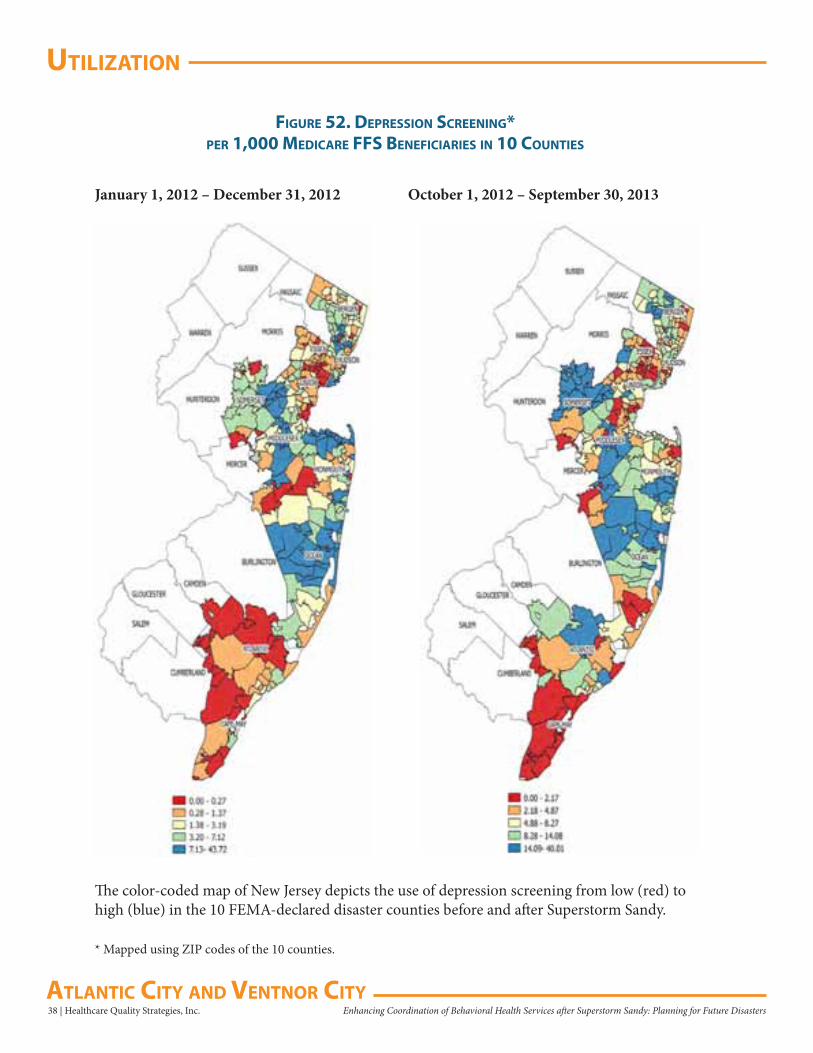
uTilizaTion
38 | Healthcare Quality Strategies, Inc. Enhancing Coordination of Behavioral Health Services after Superstorm Sandy: Planning for Future Disasters aTlanTiC CiTy and VenTnor CiTy
figure 52. dePression sCreening*Per 1,000 MediCare ffs benefiCiaries in 10 CounTies
The color-coded map of New Jersey depicts the use of depression screening from low (red) to high (blue) in the 10 FEMA-declared disaster counties before and after Superstorm Sandy.
January 1, 2012 – December 31, 2012 October 1, 2012 – September 30, 2013
* Mapped using ZIP codes of the 10 counties.
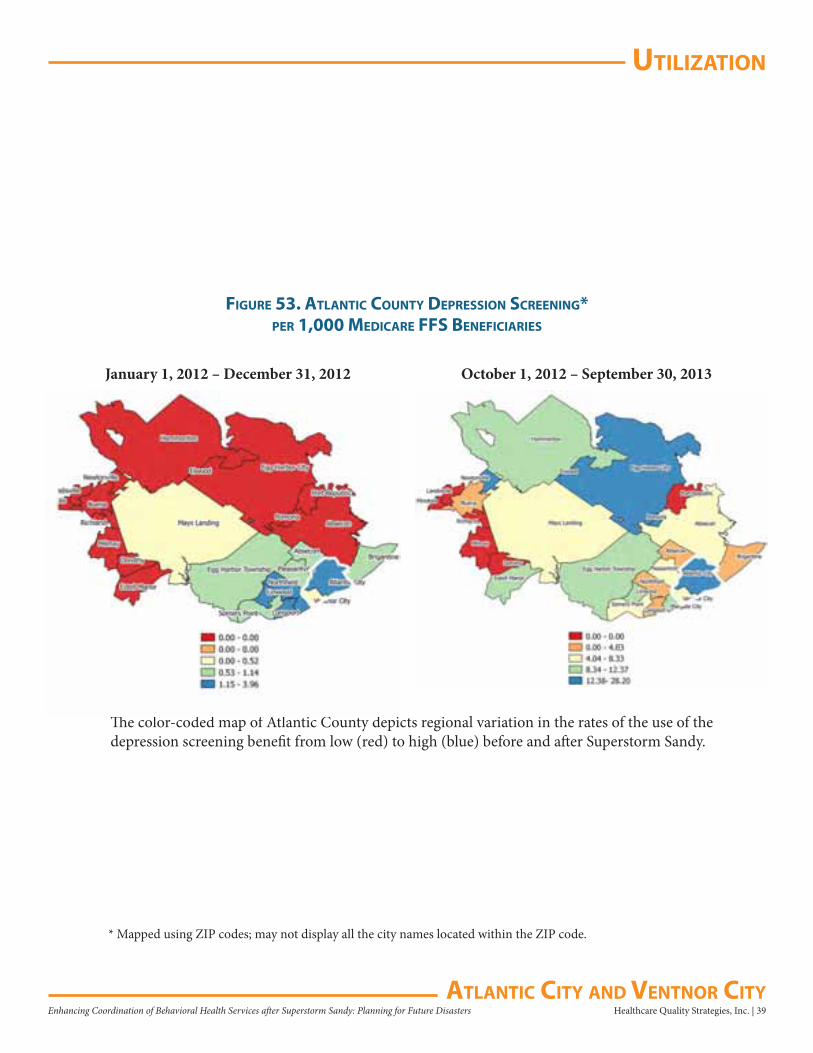
uTilizaTion
Healthcare Quality Strategies, Inc. | 39Enhancing Coordination of Behavioral Health Services after Superstorm Sandy: Planning for Future DisastersaTlanTiC CiTy and VenTnor CiTy
figure 53. aTlanTiC CounTy dePression sCreening*Per 1,000 MediCare ffs benefiCiaries
The color-coded map of Atlantic County depicts regional variation in the rates of the use of the depression screening benefit from low (red) to high (blue) before and after Superstorm Sandy.
January 1, 2012 – December 31, 2012 October 1, 2012 – September 30, 2013
* Mapped using ZIP codes; may not display all the city names located within the ZIP code.
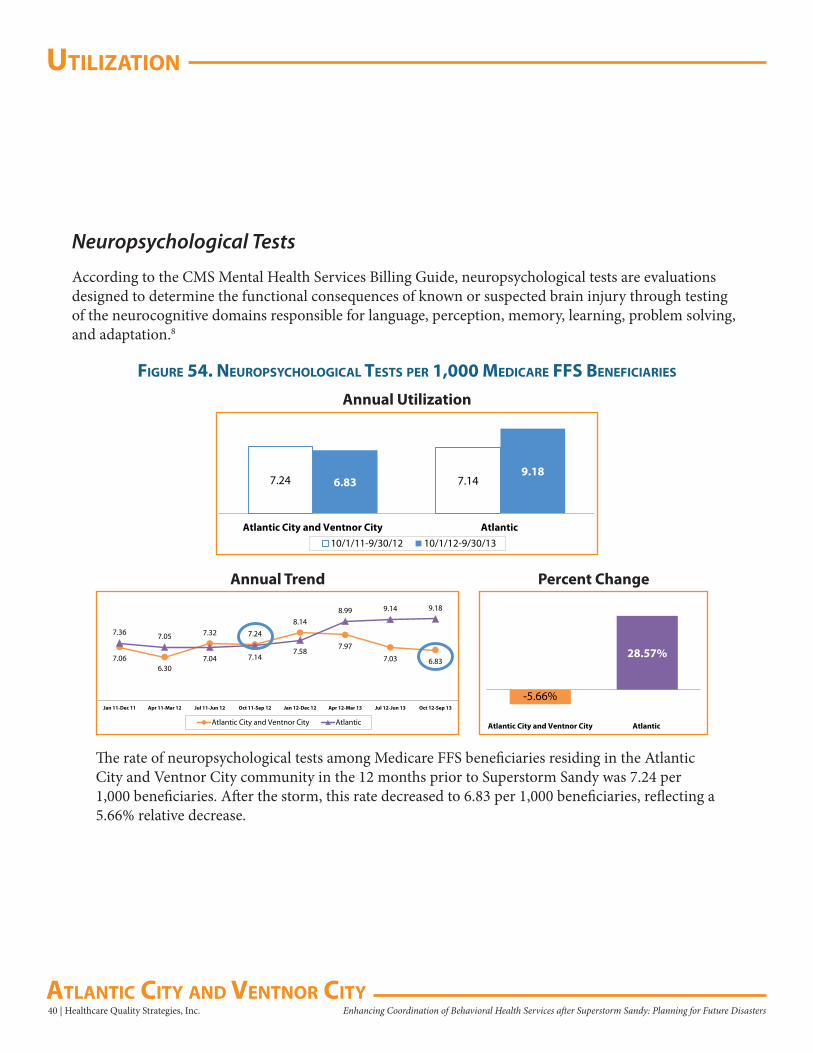
uTilizaTion
40 | Healthcare Quality Strategies, Inc. Enhancing Coordination of Behavioral Health Services after Superstorm Sandy: Planning for Future Disasters aTlanTiC CiTy and VenTnor CiTy
Neuropsychological Tests
According to the CMS Mental Health Services Billing Guide, neuropsychological tests are evaluations designed to determine the functional consequences of known or suspected brain injury through testing of the neurocognitive domains responsible for language, perception, memory, learning, problem solving, and adaptation.8
figure 54. neuroPsyChologiCal TesTs Per 1,000 MediCare ffs benefiCiaries
7.24 7.146.839.18
Atlantic City and Ventnor City Atlantic10/1/11-9/30/12 10/1/12-9/30/13
Annual Utilization
The rate of neuropsychological tests among Medicare FFS beneficiaries residing in the Atlantic City and Ventnor City community in the 12 months prior to Superstorm Sandy was 7.24 per 1,000 beneficiaries. After the storm, this rate decreased to 6.83 per 1,000 beneficiaries, reflecting a 5.66% relative decrease.
-5.66%
28.57%
Atlantic City and Ventnor City Atlantic
7.066.30
7.32 7.248.14
7.97
7.03 6.83
7.36 7.05
7.04 7.147.58
8.99 9.14 9.18
Jan 11-Dec 11 Apr 11-Mar 12 Jul 11-Jun 12 Oct 11-Sep 12 Jan 12-Dec 12 Apr 12-Mar 13 Jul 12-Jun 13 Oct 12-Sep 13
Atlantic City and Ventnor City Atlantic
Annual Trend Percent Change
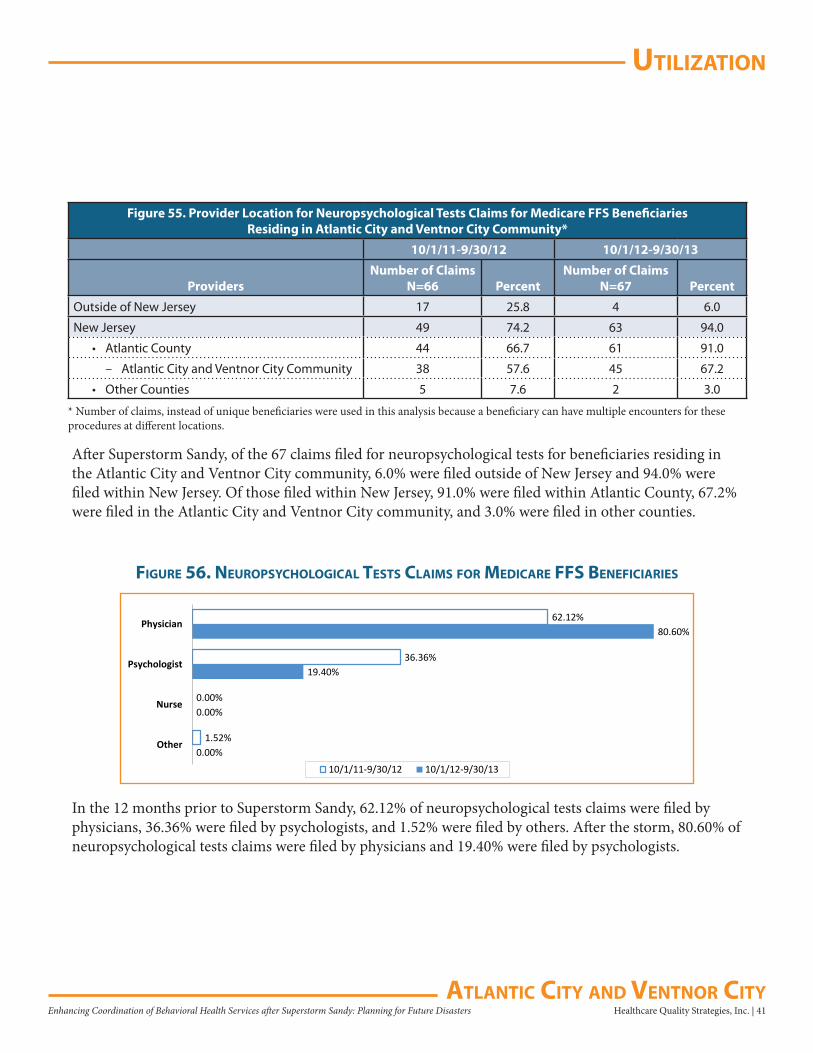
uTilizaTion
Healthcare Quality Strategies, Inc. | 41Enhancing Coordination of Behavioral Health Services after Superstorm Sandy: Planning for Future DisastersaTlanTiC CiTy and VenTnor CiTy
Figure 55. Provider Location for Neuropsychological Tests Claims for Medicare FFS Beneficiaries Residing in Atlantic City and Ventnor City Community*
10/1/11-9/30/12 10/1/12-9/30/13
ProvidersNumber of Claims
N=66 PercentNumber of Claims
N=67 Percent
Outside of New Jersey 17 25.8 4 6.0
New Jersey 49 74.2 63 94.0
• Atlantic County 44 66.7 61 91.0
– Atlantic City and Ventnor City Community 38 57.6 45 67.2
• Other Counties 5 7.6 2 3.0
* Number of claims, instead of unique beneficiaries were used in this analysis because a beneficiary can have multiple encounters for these procedures at different locations.
After Superstorm Sandy, of the 67 claims filed for neuropsychological tests for beneficiaries residing in the Atlantic City and Ventnor City community, 6.0% were filed outside of New Jersey and 94.0% were filed within New Jersey. Of those filed within New Jersey, 91.0% were filed within Atlantic County, 67.2% were filed in the Atlantic City and Ventnor City community, and 3.0% were filed in other counties.
0.00%
0.00%
19.40%
80.60%
1.52%
0.00%
36.36%
62.12%
Other
Nurse
Psychologist
Physician
10/1/11-9/30/12 10/1/12-9/30/13
figure 56. neuroPsyChologiCal TesTs ClaiMs for MediCare ffs benefiCiaries
In the 12 months prior to Superstorm Sandy, 62.12% of neuropsychological tests claims were filed by physicians, 36.36% were filed by psychologists, and 1.52% were filed by others. After the storm, 80.60% of neuropsychological tests claims were filed by physicians and 19.40% were filed by psychologists.
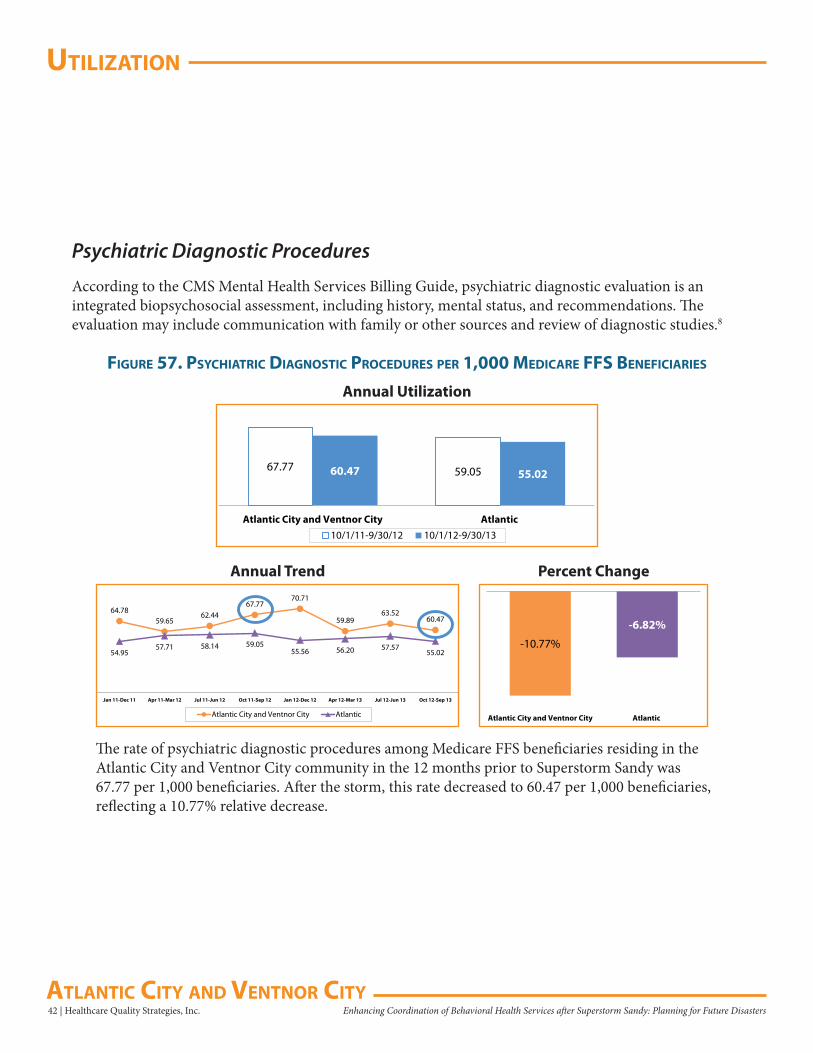
uTilizaTion
42 | Healthcare Quality Strategies, Inc. Enhancing Coordination of Behavioral Health Services after Superstorm Sandy: Planning for Future Disasters aTlanTiC CiTy and VenTnor CiTy
Psychiatric Diagnostic Procedures
According to the CMS Mental Health Services Billing Guide, psychiatric diagnostic evaluation is an integrated biopsychosocial assessment, including history, mental status, and recommendations. The evaluation may include communication with family or other sources and review of diagnostic studies.8
figure 57. PsyChiaTriC diagnosTiC ProCedures Per 1,000 MediCare ffs benefiCiaries
67.77 59.0560.47 55.02
Atlantic City and Ventnor City Atlantic10/1/11-9/30/12 10/1/12-9/30/13
Annual Utilization
The rate of psychiatric diagnostic procedures among Medicare FFS beneficiaries residing in the Atlantic City and Ventnor City community in the 12 months prior to Superstorm Sandy was 67.77 per 1,000 beneficiaries. After the storm, this rate decreased to 60.47 per 1,000 beneficiaries, reflecting a 10.77% relative decrease.
-10.77%
-6.82%
Atlantic City and Ventnor City Atlantic
64.7859.65
62.4467.77
70.71
59.8963.52
60.47
54.9557.71 58.14 59.05
55.56 56.20 57.5755.02
Jan 11-Dec 11 Apr 11-Mar 12 Jul 11-Jun 12 Oct 11-Sep 12 Jan 12-Dec 12 Apr 12-Mar 13 Jul 12-Jun 13 Oct 12-Sep 13
Atlantic City and Ventnor City Atlantic
Annual Trend Percent Change
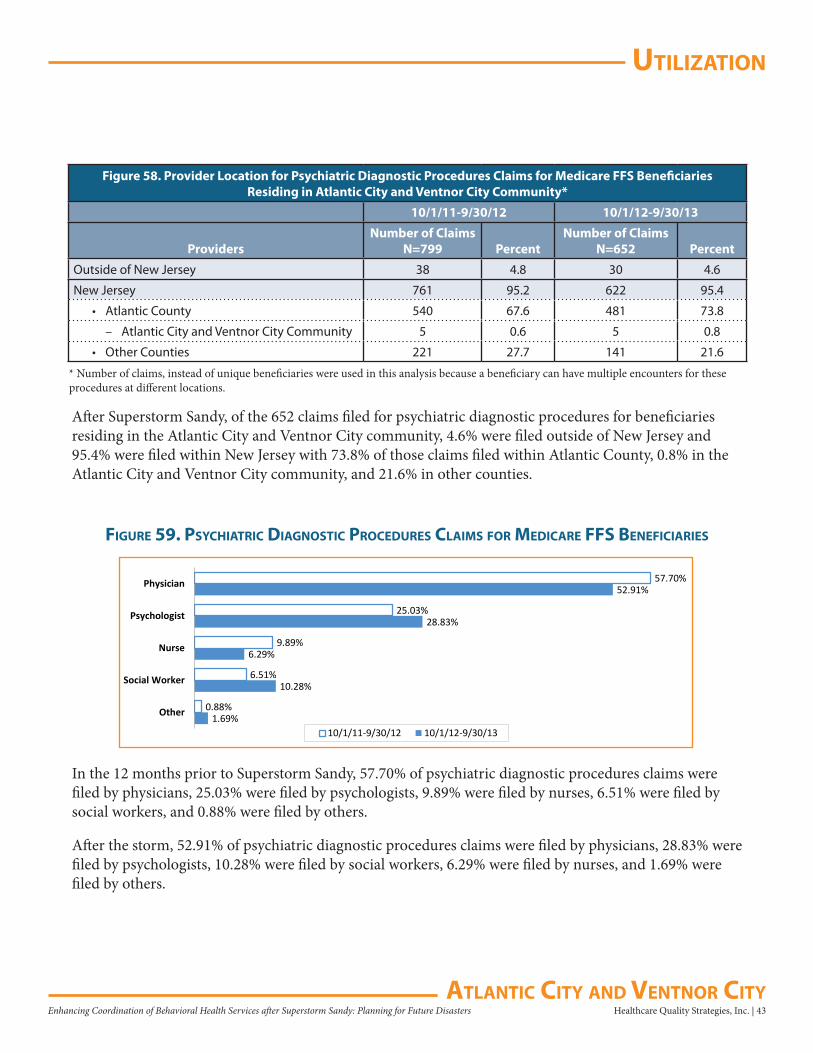
uTilizaTion
Healthcare Quality Strategies, Inc. | 43Enhancing Coordination of Behavioral Health Services after Superstorm Sandy: Planning for Future DisastersaTlanTiC CiTy and VenTnor CiTy
Figure 58. Provider Location for Psychiatric Diagnostic Procedures Claims for Medicare FFS Beneficiaries Residing in Atlantic City and Ventnor City Community*
10/1/11-9/30/12 10/1/12-9/30/13
ProvidersNumber of Claims
N=799 PercentNumber of Claims
N=652 Percent
Outside of New Jersey 38 4.8 30 4.6
New Jersey 761 95.2 622 95.4
• Atlantic County 540 67.6 481 73.8
– Atlantic City and Ventnor City Community 5 0.6 5 0.8
• Other Counties 221 27.7 141 21.6
1.69%
10.28%
6.29%
28.83%
52.91%
0.88%
6.51%
9.89%
25.03%
57.70%
Other
Social Worker
Nurse
Psychologist
Physician
10/1/11-9/30/12 10/1/12-9/30/13
figure 59. PsyChiaTriC diagnosTiC ProCedures ClaiMs for MediCare ffs benefiCiaries
* Number of claims, instead of unique beneficiaries were used in this analysis because a beneficiary can have multiple encounters for these procedures at different locations.
After Superstorm Sandy, of the 652 claims filed for psychiatric diagnostic procedures for beneficiaries residing in the Atlantic City and Ventnor City community, 4.6% were filed outside of New Jersey and 95.4% were filed within New Jersey with 73.8% of those claims filed within Atlantic County, 0.8% in the Atlantic City and Ventnor City community, and 21.6% in other counties.
In the 12 months prior to Superstorm Sandy, 57.70% of psychiatric diagnostic procedures claims were filed by physicians, 25.03% were filed by psychologists, 9.89% were filed by nurses, 6.51% were filed by social workers, and 0.88% were filed by others.
After the storm, 52.91% of psychiatric diagnostic procedures claims were filed by physicians, 28.83% were filed by psychologists, 10.28% were filed by social workers, 6.29% were filed by nurses, and 1.69% were filed by others.
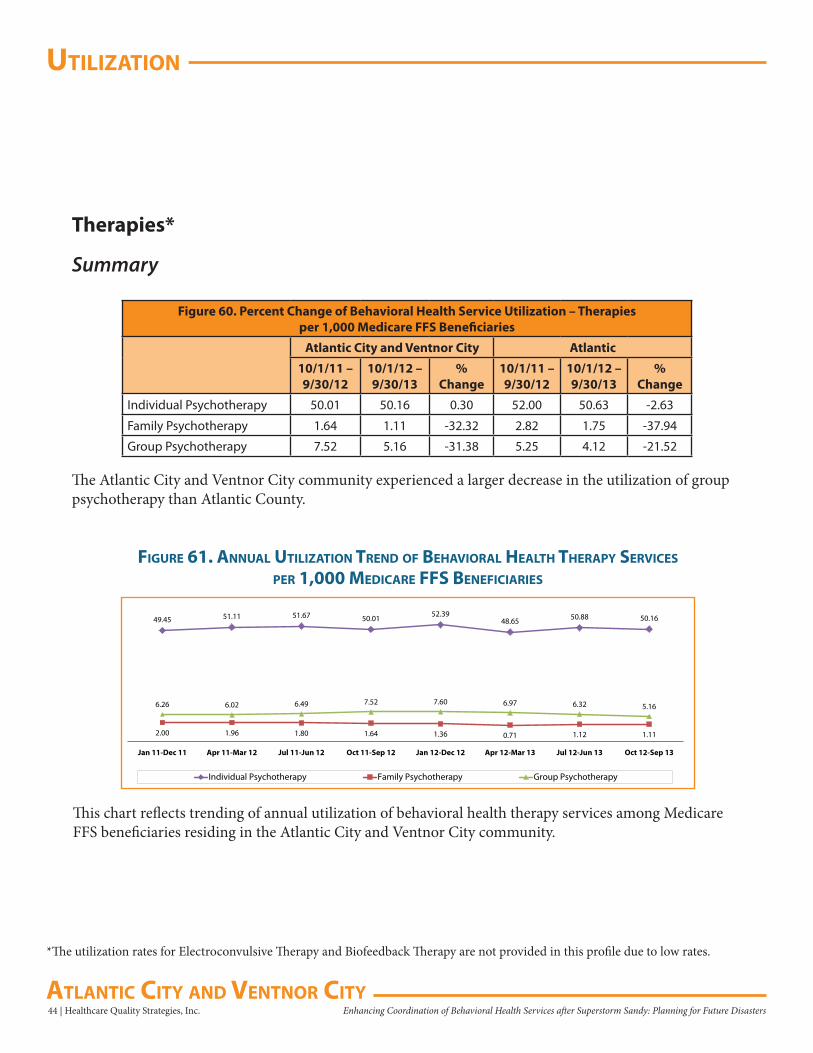
uTilizaTion
44 | Healthcare Quality Strategies, Inc. Enhancing Coordination of Behavioral Health Services after Superstorm Sandy: Planning for Future Disasters aTlanTiC CiTy and VenTnor CiTy
Therapies*
Summary
Figure 60. Percent Change of Behavioral Health Service Utilization – Therapiesper 1,000 Medicare FFS Beneficiaries
Atlantic City and Ventnor City Atlantic
10/1/11 – 9/30/12
10/1/12 – 9/30/13
% Change
10/1/11 – 9/30/12
10/1/12 – 9/30/13
% Change
Individual Psychotherapy 50.01 50.16 0.30 52.00 50.63 -2.63
Family Psychotherapy 1.64 1.11 -32.32 2.82 1.75 -37.94
Group Psychotherapy 7.52 5.16 -31.38 5.25 4.12 -21.52
The Atlantic City and Ventnor City community experienced a larger decrease in the utilization of group psychotherapy than Atlantic County.
49.45 51.11 51.67 50.01 52.3948.65 50.88 50.16
2.00 1.96 1.80 1.64 1.36 0.71 1.12 1.11
6.26 6.02 6.49 7.52 7.60 6.97 6.32 5.16
Jan 11-Dec 11 Apr 11-Mar 12 Jul 11-Jun 12 Oct 11-Sep 12 Jan 12-Dec 12 Apr 12-Mar 13 Jul 12-Jun 13 Oct 12-Sep 13
Individual Psychotherapy Family Psychotherapy Group Psychotherapy
figure 61. annual uTilizaTion Trend of behaVioral healTh TheraPy serViCes
Per 1,000 MediCare ffs benefiCiaries
This chart reflects trending of annual utilization of behavioral health therapy services among Medicare FFS beneficiaries residing in the Atlantic City and Ventnor City community.
*The utilization rates for Electroconvulsive Therapy and Biofeedback Therapy are not provided in this profile due to low rates.
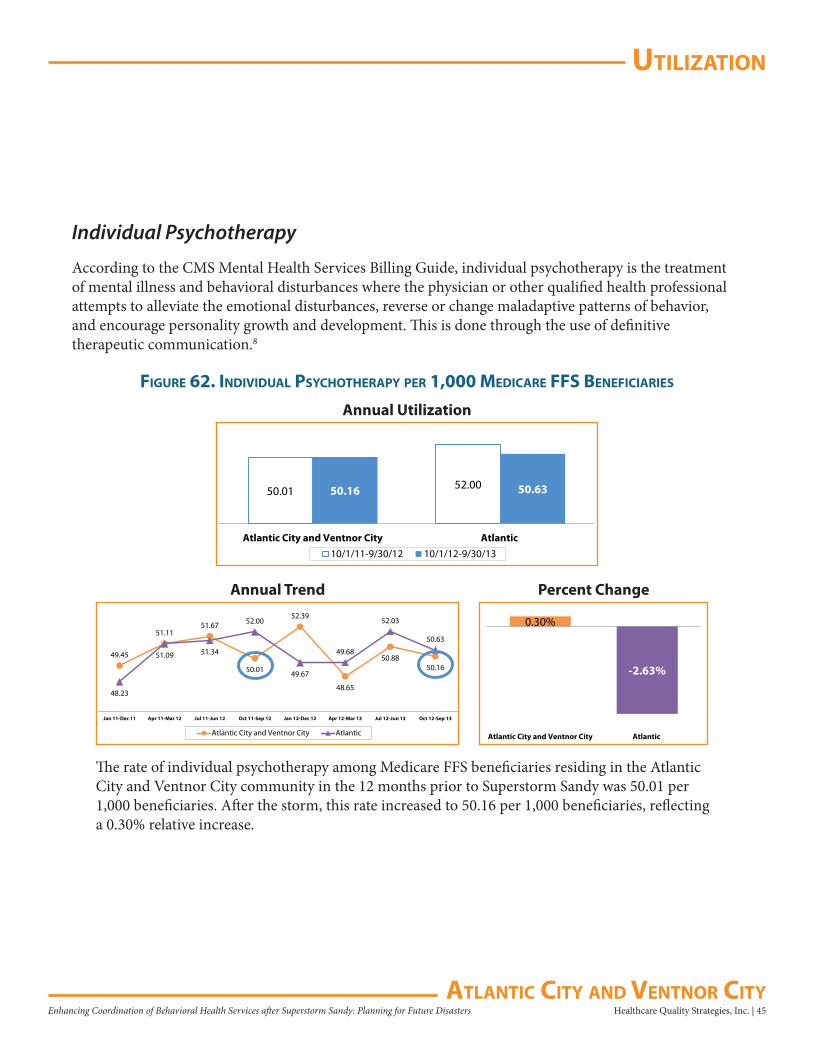
uTilizaTion
Healthcare Quality Strategies, Inc. | 45Enhancing Coordination of Behavioral Health Services after Superstorm Sandy: Planning for Future DisastersaTlanTiC CiTy and VenTnor CiTy
Individual Psychotherapy
According to the CMS Mental Health Services Billing Guide, individual psychotherapy is the treatment of mental illness and behavioral disturbances where the physician or other qualified health professional attempts to alleviate the emotional disturbances, reverse or change maladaptive patterns of behavior, and encourage personality growth and development. This is done through the use of definitive therapeutic communication.8
figure 62. indiVidual PsyChoTheraPy Per 1,000 MediCare ffs benefiCiaries
50.01 52.0050.16 50.63
Atlantic City and Ventnor City Atlantic10/1/11-9/30/12 10/1/12-9/30/13
Annual Utilization
The rate of individual psychotherapy among Medicare FFS beneficiaries residing in the Atlantic City and Ventnor City community in the 12 months prior to Superstorm Sandy was 50.01 per 1,000 beneficiaries. After the storm, this rate increased to 50.16 per 1,000 beneficiaries, reflecting a 0.30% relative increase.
0.30%
-2.63%
Atlantic City and Ventnor City Atlantic
49.45
51.1151.67
50.01
52.39
48.65
50.8850.16
48.23
51.09 51.34
52.00
49.67
49.68
52.03
50.63
Jan 11-Dec 11 Apr 11-Mar 12 Jul 11-Jun 12 Oct 11-Sep 12 Jan 12-Dec 12 Apr 12-Mar 13 Jul 12-Jun 13 Oct 12-Sep 13
Atlantic City and Ventnor City Atlantic
Annual Trend Percent Change
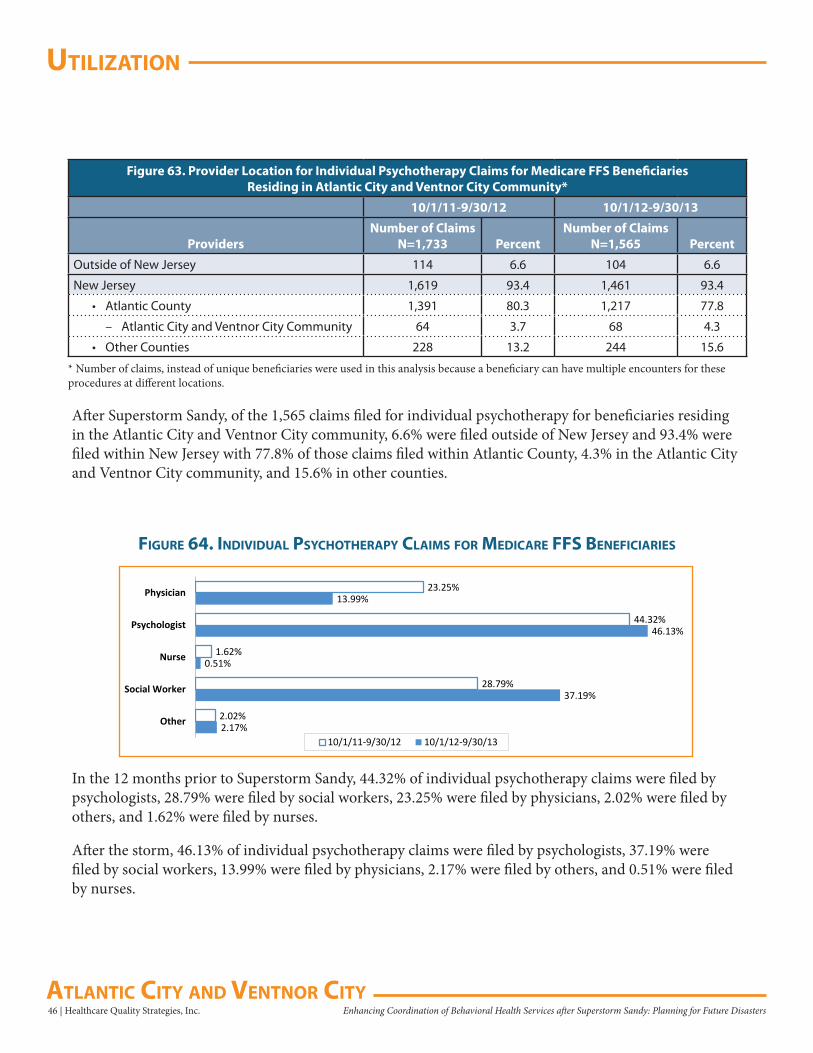
uTilizaTion
46 | Healthcare Quality Strategies, Inc. Enhancing Coordination of Behavioral Health Services after Superstorm Sandy: Planning for Future Disasters aTlanTiC CiTy and VenTnor CiTy
Figure 63. Provider Location for Individual Psychotherapy Claims for Medicare FFS Beneficiaries Residing in Atlantic City and Ventnor City Community*
10/1/11-9/30/12 10/1/12-9/30/13
ProvidersNumber of Claims
N=1,733 PercentNumber of Claims
N=1,565 Percent
Outside of New Jersey 114 6.6 104 6.6
New Jersey 1,619 93.4 1,461 93.4
• Atlantic County 1,391 80.3 1,217 77.8
– Atlantic City and Ventnor City Community 64 3.7 68 4.3
• Other Counties 228 13.2 244 15.6
* Number of claims, instead of unique beneficiaries were used in this analysis because a beneficiary can have multiple encounters for these procedures at different locations.
After Superstorm Sandy, of the 1,565 claims filed for individual psychotherapy for beneficiaries residing in the Atlantic City and Ventnor City community, 6.6% were filed outside of New Jersey and 93.4% were filed within New Jersey with 77.8% of those claims filed within Atlantic County, 4.3% in the Atlantic City and Ventnor City community, and 15.6% in other counties.
2.17%
37.19%
0.51%
46.13%
13.99%
2.02%
28.79%
1.62%
44.32%
23.25%
Other
Social Worker
Nurse
Psychologist
Physician
10/1/11-9/30/12 10/1/12-9/30/13
figure 64. indiVidual PsyChoTheraPy ClaiMs for MediCare ffs benefiCiaries
In the 12 months prior to Superstorm Sandy, 44.32% of individual psychotherapy claims were filed by psychologists, 28.79% were filed by social workers, 23.25% were filed by physicians, 2.02% were filed by others, and 1.62% were filed by nurses.
After the storm, 46.13% of individual psychotherapy claims were filed by psychologists, 37.19% were filed by social workers, 13.99% were filed by physicians, 2.17% were filed by others, and 0.51% were filed by nurses.
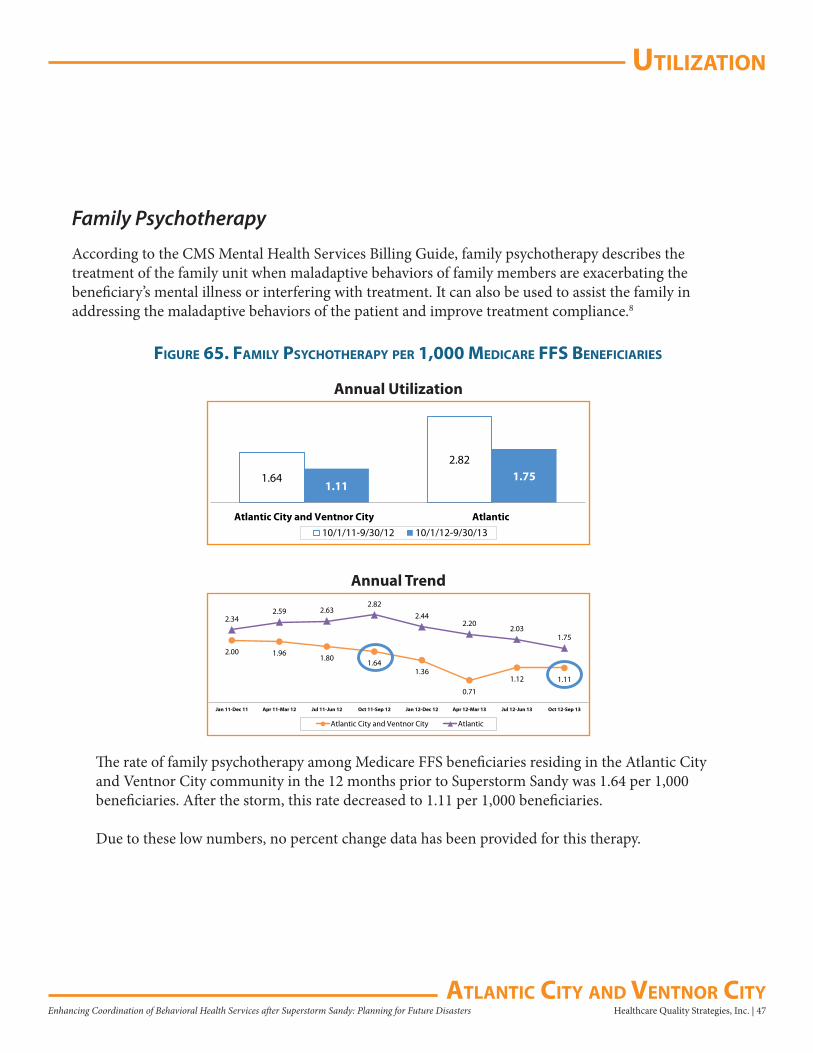
uTilizaTion
Healthcare Quality Strategies, Inc. | 47Enhancing Coordination of Behavioral Health Services after Superstorm Sandy: Planning for Future DisastersaTlanTiC CiTy and VenTnor CiTy
Family Psychotherapy
According to the CMS Mental Health Services Billing Guide, family psychotherapy describes the treatment of the family unit when maladaptive behaviors of family members are exacerbating the beneficiary’s mental illness or interfering with treatment. It can also be used to assist the family in addressing the maladaptive behaviors of the patient and improve treatment compliance.8
figure 65. faMily PsyChoTheraPy Per 1,000 MediCare ffs benefiCiaries
1.64
2.82
1.111.75
Atlantic City and Ventnor City Atlantic10/1/11-9/30/12 10/1/12-9/30/13
Annual Utilization
The rate of family psychotherapy among Medicare FFS beneficiaries residing in the Atlantic City and Ventnor City community in the 12 months prior to Superstorm Sandy was 1.64 per 1,000 beneficiaries. After the storm, this rate decreased to 1.11 per 1,000 beneficiaries.
Due to these low numbers, no percent change data has been provided for this therapy.
2.00 1.961.80
1.641.36
0.71
1.12 1.11
2.342.59 2.63
2.822.44
2.202.03
1.75
Jan 11-Dec 11 Apr 11-Mar 12 Jul 11-Jun 12 Oct 11-Sep 12 Jan 12-Dec 12 Apr 12-Mar 13 Jul 12-Jun 13 Oct 12-Sep 13
Atlantic City and Ventnor City Atlantic
Annual Trend
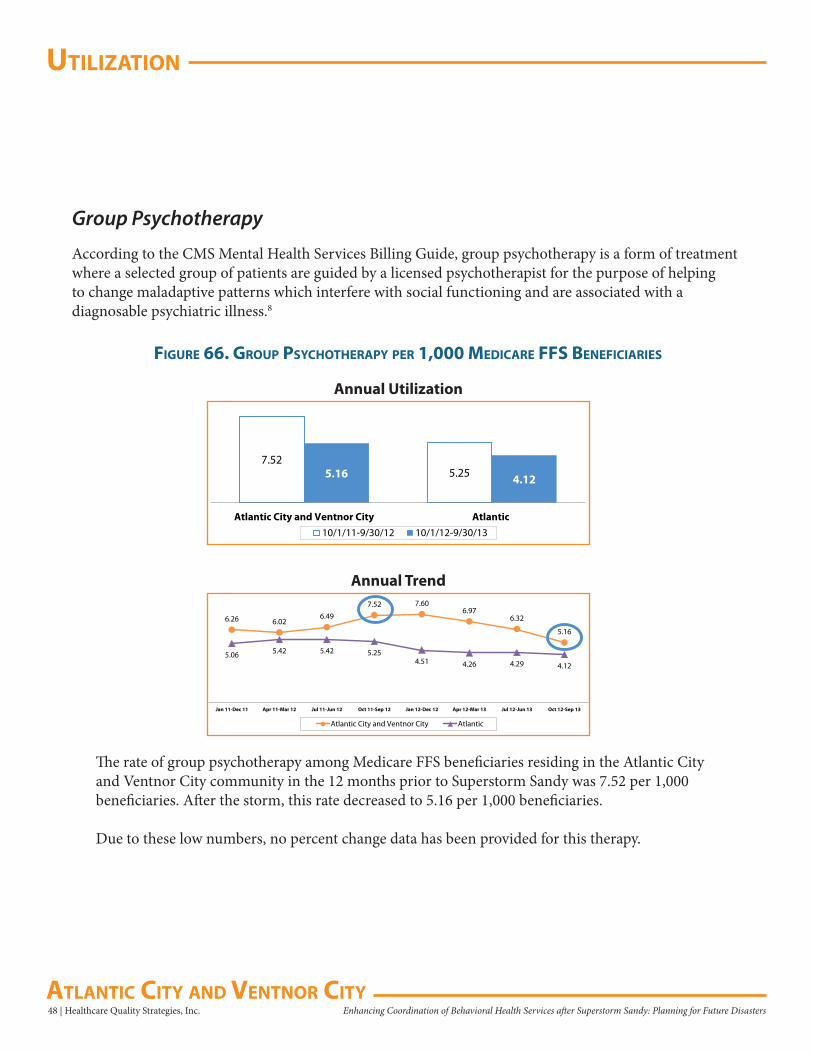
uTilizaTion
48 | Healthcare Quality Strategies, Inc. Enhancing Coordination of Behavioral Health Services after Superstorm Sandy: Planning for Future Disasters aTlanTiC CiTy and VenTnor CiTy
Group Psychotherapy
According to the CMS Mental Health Services Billing Guide, group psychotherapy is a form of treatment where a selected group of patients are guided by a licensed psychotherapist for the purpose of helping to change maladaptive patterns which interfere with social functioning and are associated with a diagnosable psychiatric illness.8
figure 66. grouP PsyChoTheraPy Per 1,000 MediCare ffs benefiCiaries
7.525.255.16 4.12
Atlantic City and Ventnor City Atlantic10/1/11-9/30/12 10/1/12-9/30/13
Annual Utilization
The rate of group psychotherapy among Medicare FFS beneficiaries residing in the Atlantic City and Ventnor City community in the 12 months prior to Superstorm Sandy was 7.52 per 1,000 beneficiaries. After the storm, this rate decreased to 5.16 per 1,000 beneficiaries.
Due to these low numbers, no percent change data has been provided for this therapy.
6.26 6.026.49
7.52 7.606.97
6.32
5.16
5.06 5.42 5.42 5.254.51 4.26 4.29 4.12
Jan 11-Dec 11 Apr 11-Mar 12 Jul 11-Jun 12 Oct 11-Sep 12 Jan 12-Dec 12 Apr 12-Mar 13 Jul 12-Jun 13 Oct 12-Sep 13
Atlantic City and Ventnor City Atlantic
Annual Trend
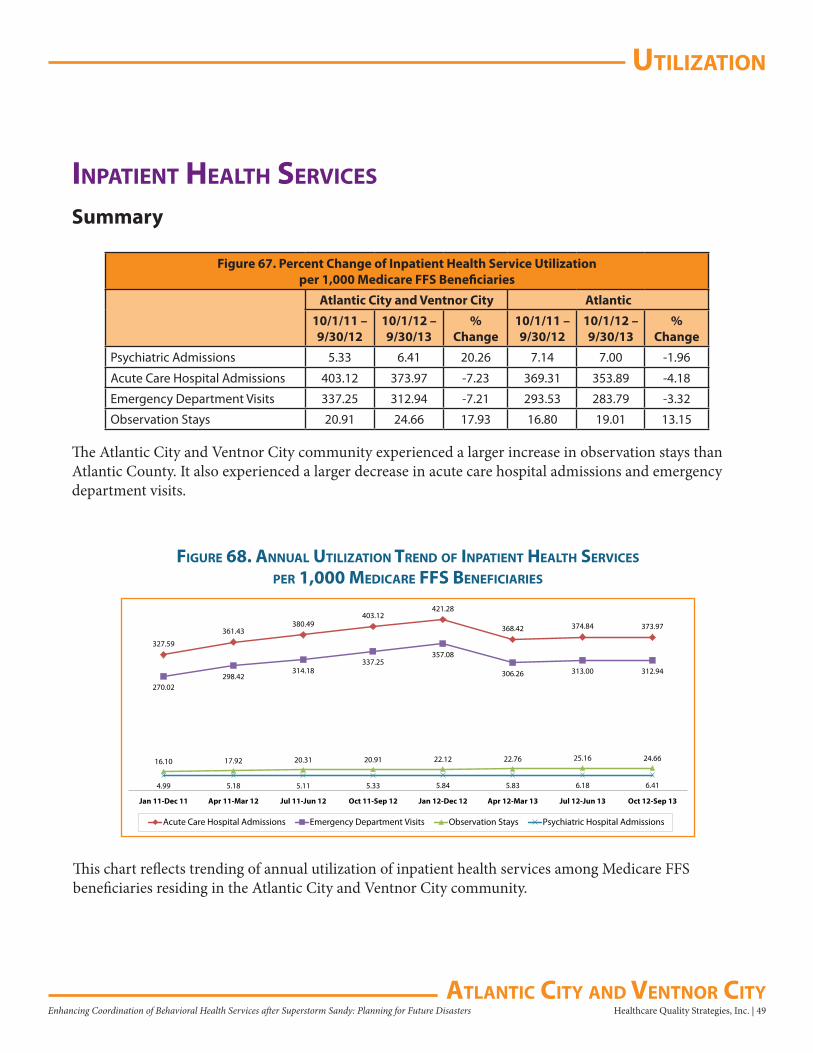
uTilizaTion
Healthcare Quality Strategies, Inc. | 49Enhancing Coordination of Behavioral Health Services after Superstorm Sandy: Planning for Future DisastersaTlanTiC CiTy and VenTnor CiTy
inPaTienT healTh serViCes
Summary
Figure 67. Percent Change of Inpatient Health Service Utilizationper 1,000 Medicare FFS Beneficiaries
Atlantic City and Ventnor City Atlantic
10/1/11 – 9/30/12
10/1/12 – 9/30/13
% Change
10/1/11 – 9/30/12
10/1/12 – 9/30/13
% Change
Psychiatric Admissions 5.33 6.41 20.26 7.14 7.00 -1.96
Acute Care Hospital Admissions 403.12 373.97 -7.23 369.31 353.89 -4.18
Emergency Department Visits 337.25 312.94 -7.21 293.53 283.79 -3.32
Observation Stays 20.91 24.66 17.93 16.80 19.01 13.15
The Atlantic City and Ventnor City community experienced a larger increase in observation stays than Atlantic County. It also experienced a larger decrease in acute care hospital admissions and emergency department visits.
327.59
361.43380.49
403.12421.28
368.42 374.84 373.97
270.02298.42
314.18337.25
357.08
306.26 313.00 312.94
16.10 17.92 20.31 20.91 22.12 22.76 25.16 24.66
4.99 5.18 5.11 5.33 5.84 5.83 6.18 6.41
Jan 11-Dec 11 Apr 11-Mar 12 Jul 11-Jun 12 Oct 11-Sep 12 Jan 12-Dec 12 Apr 12-Mar 13 Jul 12-Jun 13 Oct 12-Sep 13
Acute Care Hospital Admissions Emergency Department Visits Observation Stays Psychiatric Hospital Admissions
figure 68. annual uTilizaTion Trend of inPaTienT healTh serViCes
Per 1,000 MediCare ffs benefiCiaries
This chart reflects trending of annual utilization of inpatient health services among Medicare FFS beneficiaries residing in the Atlantic City and Ventnor City community.
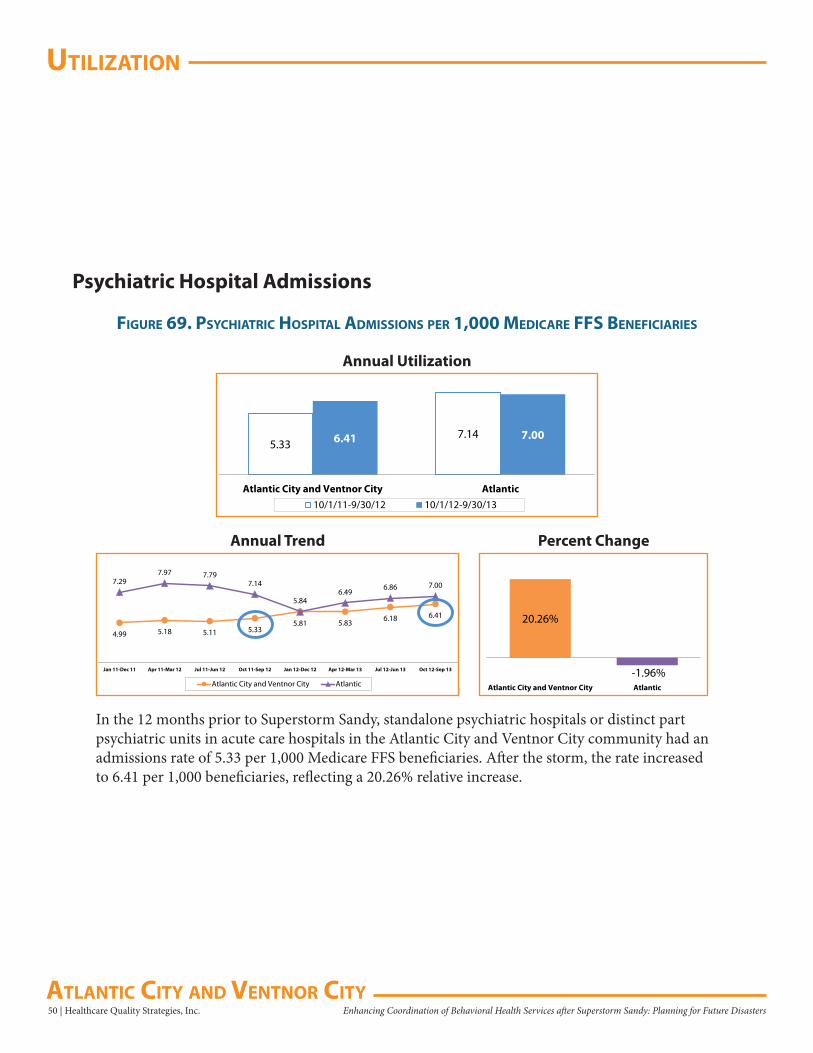
uTilizaTion
50 | Healthcare Quality Strategies, Inc. Enhancing Coordination of Behavioral Health Services after Superstorm Sandy: Planning for Future Disasters aTlanTiC CiTy and VenTnor CiTy
figure 69. PsyChiaTriC hosPiTal adMissions Per 1,000 MediCare ffs benefiCiaries
Psychiatric Hospital Admissions
5.337.146.41 7.00
Atlantic City and Ventnor City Atlantic10/1/11-9/30/12 10/1/12-9/30/13
Annual Utilization
In the 12 months prior to Superstorm Sandy, standalone psychiatric hospitals or distinct part psychiatric units in acute care hospitals in the Atlantic City and Ventnor City community had an admissions rate of 5.33 per 1,000 Medicare FFS beneficiaries. After the storm, the rate increased to 6.41 per 1,000 beneficiaries, reflecting a 20.26% relative increase.
20.26%
-1.96%Atlantic City and Ventnor City Atlantic
4.99 5.18 5.11 5.33
5.84
5.83 6.18 6.41
7.297.97 7.79
7.14
5.81
6.496.86 7.00
Jan 11-Dec 11 Apr 11-Mar 12 Jul 11-Jun 12 Oct 11-Sep 12 Jan 12-Dec 12 Apr 12-Mar 13 Jul 12-Jun 13 Oct 12-Sep 13
Atlantic City and Ventnor City Atlantic
Annual Trend Percent Change
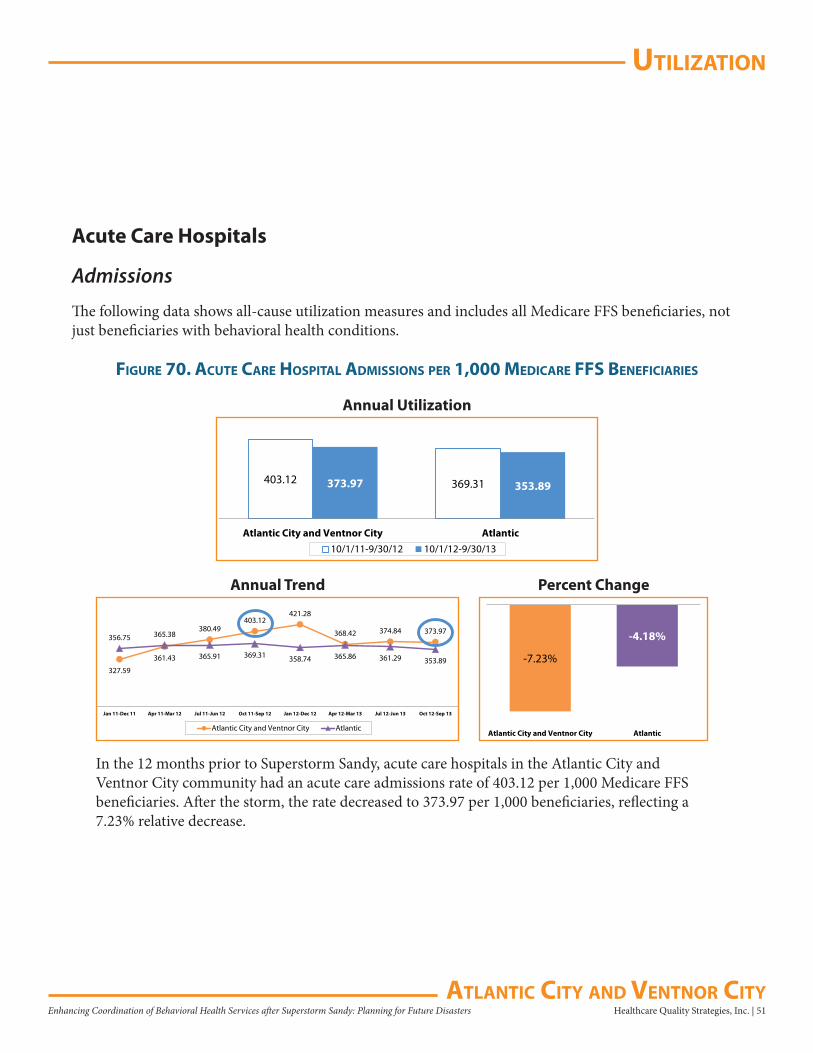
uTilizaTion
Healthcare Quality Strategies, Inc. | 51Enhancing Coordination of Behavioral Health Services after Superstorm Sandy: Planning for Future DisastersaTlanTiC CiTy and VenTnor CiTy
Acute Care Hospitals
Admissions
The following data shows all-cause utilization measures and includes all Medicare FFS beneficiaries, not just beneficiaries with behavioral health conditions.
figure 70. aCuTe Care hosPiTal adMissions Per 1,000 MediCare ffs benefiCiaries
403.12 369.31373.97 353.89
Atlantic City and Ventnor City Atlantic10/1/11-9/30/12 10/1/12-9/30/13
Annual Utilization
In the 12 months prior to Superstorm Sandy, acute care hospitals in the Atlantic City and Ventnor City community had an acute care admissions rate of 403.12 per 1,000 Medicare FFS beneficiaries. After the storm, the rate decreased to 373.97 per 1,000 beneficiaries, reflecting a 7.23% relative decrease.
-7.23%
-4.18%
Atlantic City and Ventnor City Atlantic
327.59
361.43
380.49403.12
421.28
368.42 374.84 373.97356.75 365.38
365.91 369.31 358.74 365.86 361.29 353.89
Jan 11-Dec 11 Apr 11-Mar 12 Jul 11-Jun 12 Oct 11-Sep 12 Jan 12-Dec 12 Apr 12-Mar 13 Jul 12-Jun 13 Oct 12-Sep 13
Atlantic City and Ventnor City Atlantic
Annual Trend Percent Change
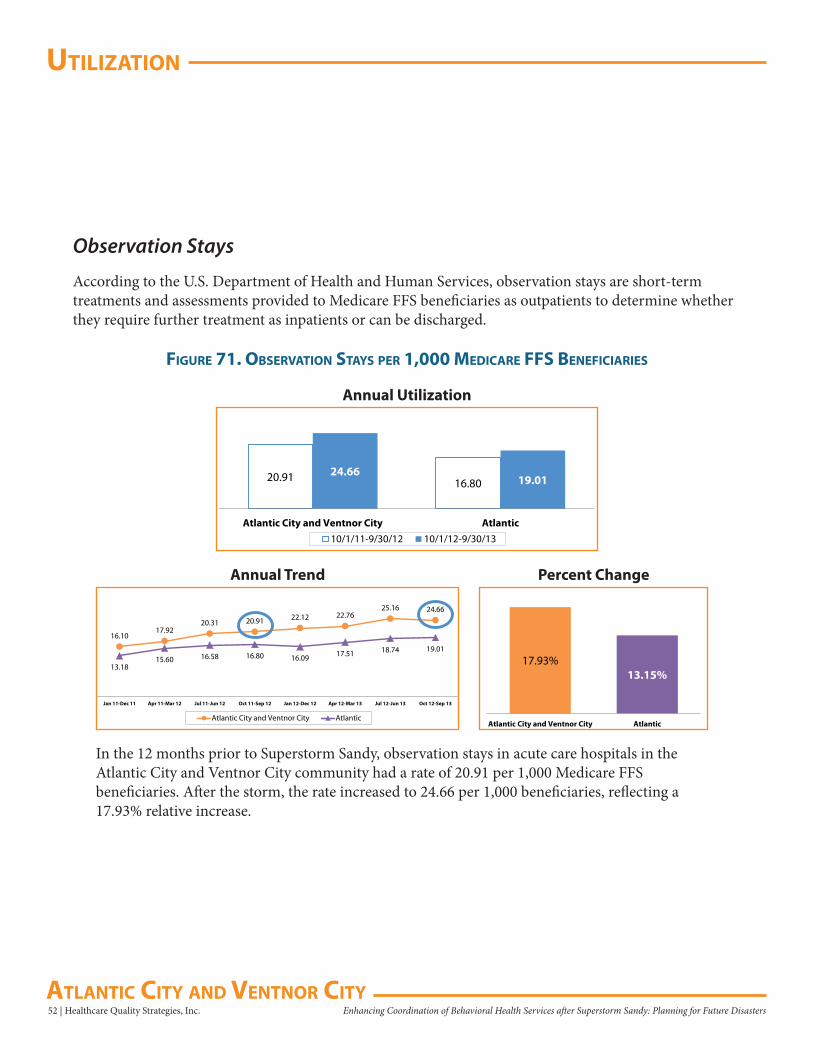
uTilizaTion
52 | Healthcare Quality Strategies, Inc. Enhancing Coordination of Behavioral Health Services after Superstorm Sandy: Planning for Future Disasters aTlanTiC CiTy and VenTnor CiTy
Observation Stays
According to the U.S. Department of Health and Human Services, observation stays are short-term treatments and assessments provided to Medicare FFS beneficiaries as outpatients to determine whether they require further treatment as inpatients or can be discharged.
figure 71. obserVaTion sTays Per 1,000 MediCare ffs benefiCiaries
20.91 16.8024.66
19.01
Atlantic City and Ventnor City Atlantic10/1/11-9/30/12 10/1/12-9/30/13
Annual Utilization
In the 12 months prior to Superstorm Sandy, observation stays in acute care hospitals in theAtlantic City and Ventnor City community had a rate of 20.91 per 1,000 Medicare FFS beneficiaries. After the storm, the rate increased to 24.66 per 1,000 beneficiaries, reflecting a 17.93% relative increase.
17.93%13.15%
Atlantic City and Ventnor City Atlantic
16.1017.92
20.31 20.91 22.12 22.7625.16 24.66
13.1815.60 16.58 16.80 16.09 17.51 18.74 19.01
Jan 11-Dec 11 Apr 11-Mar 12 Jul 11-Jun 12 Oct 11-Sep 12 Jan 12-Dec 12 Apr 12-Mar 13 Jul 12-Jun 13 Oct 12-Sep 13
Atlantic City and Ventnor City Atlantic
Annual Trend Percent Change
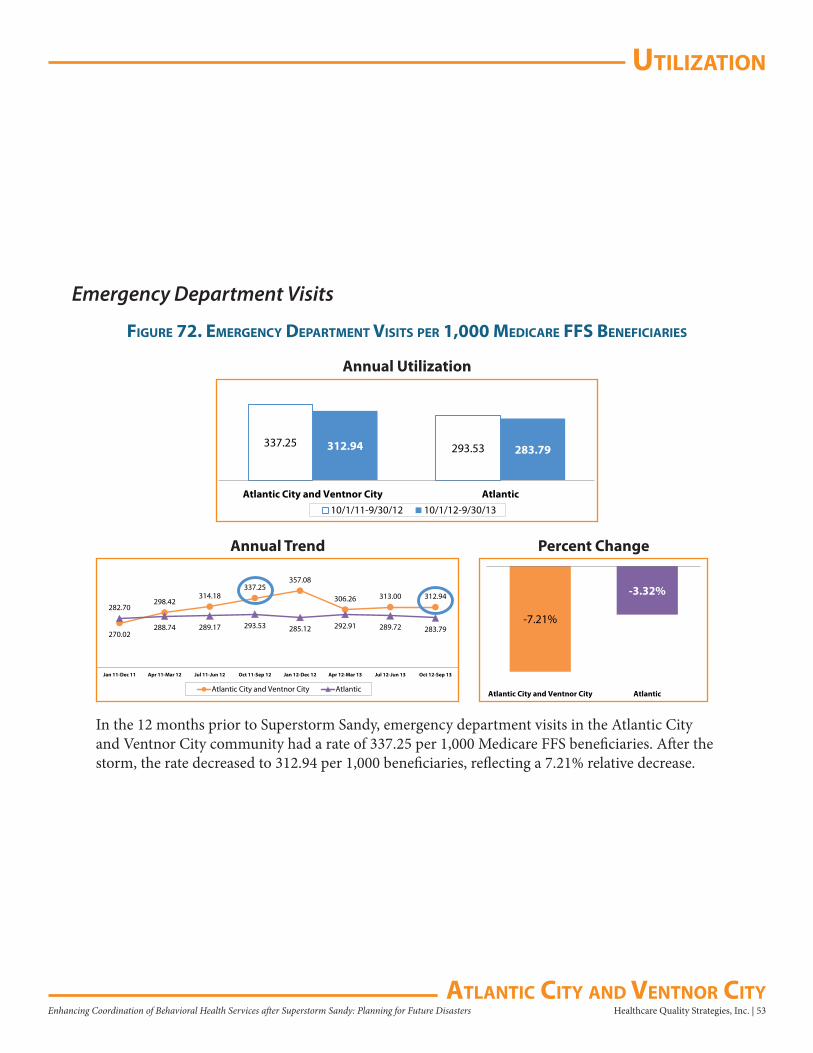
uTilizaTion
Healthcare Quality Strategies, Inc. | 53Enhancing Coordination of Behavioral Health Services after Superstorm Sandy: Planning for Future DisastersaTlanTiC CiTy and VenTnor CiTy
Emergency Department Visits
figure 72. eMergenCy deParTMenT VisiTs Per 1,000 MediCare ffs benefiCiaries
337.25 293.53312.94 283.79
Atlantic City and Ventnor City Atlantic10/1/11-9/30/12 10/1/12-9/30/13
Annual Utilization
In the 12 months prior to Superstorm Sandy, emergency department visits in the Atlantic City and Ventnor City community had a rate of 337.25 per 1,000 Medicare FFS beneficiaries. After the storm, the rate decreased to 312.94 per 1,000 beneficiaries, reflecting a 7.21% relative decrease.
-7.21%
-3.32%
Atlantic City and Ventnor City Atlantic
270.02
298.42314.18
337.25357.08
306.26 313.00 312.94282.70
288.74 289.17 293.53 285.12 292.91 289.72 283.79
Jan 11-Dec 11 Apr 11-Mar 12 Jul 11-Jun 12 Oct 11-Sep 12 Jan 12-Dec 12 Apr 12-Mar 13 Jul 12-Jun 13 Oct 12-Sep 13
Atlantic City and Ventnor City Atlantic
Annual Trend Percent Change
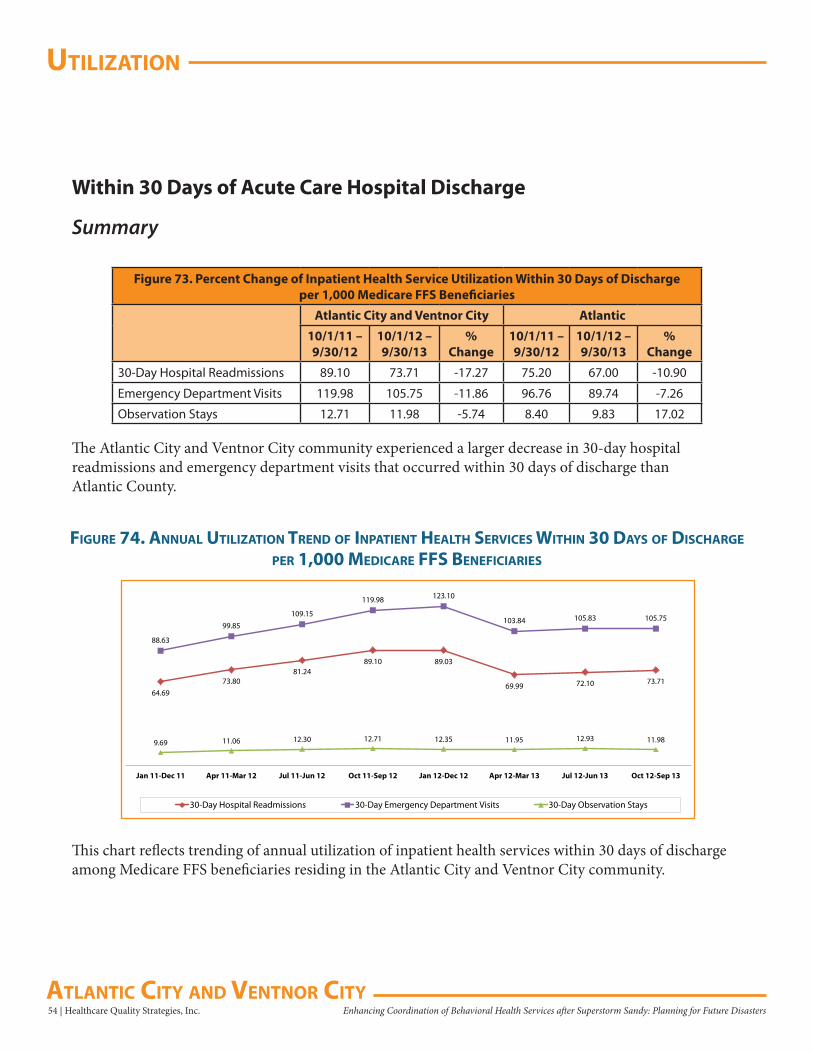
uTilizaTion
54 | Healthcare Quality Strategies, Inc. Enhancing Coordination of Behavioral Health Services after Superstorm Sandy: Planning for Future Disasters aTlanTiC CiTy and VenTnor CiTy
Within 30 Days of Acute Care Hospital Discharge
Summary
Figure 73. Percent Change of Inpatient Health Service Utilization Within 30 Days of Dischargeper 1,000 Medicare FFS Beneficiaries
Atlantic City and Ventnor City Atlantic
10/1/11 – 9/30/12
10/1/12 – 9/30/13
% Change
10/1/11 – 9/30/12
10/1/12 – 9/30/13
% Change
30-Day Hospital Readmissions 89.10 73.71 -17.27 75.20 67.00 -10.90
Emergency Department Visits 119.98 105.75 -11.86 96.76 89.74 -7.26
Observation Stays 12.71 11.98 -5.74 8.40 9.83 17.02
The Atlantic City and Ventnor City community experienced a larger decrease in 30-day hospital readmissions and emergency department visits that occurred within 30 days of discharge than Atlantic County.
64.6973.80
81.2489.10 89.03
69.99 72.10 73.71
88.63
99.85
109.15
119.98 123.10
103.84 105.83 105.75
9.69 11.06 12.30 12.71 12.35 11.95 12.93 11.98
Jan 11-Dec 11 Apr 11-Mar 12 Jul 11-Jun 12 Oct 11-Sep 12 Jan 12-Dec 12 Apr 12-Mar 13 Jul 12-Jun 13 Oct 12-Sep 13
30-Day Hospital Readmissions 30-Day Emergency Department Visits 30-Day Observation Stays
figure 74. annual uTilizaTion Trend of inPaTienT healTh serViCes WiThin 30 days of disCharge
Per 1,000 MediCare ffs benefiCiaries
This chart reflects trending of annual utilization of inpatient health services within 30 days of discharge among Medicare FFS beneficiaries residing in the Atlantic City and Ventnor City community.
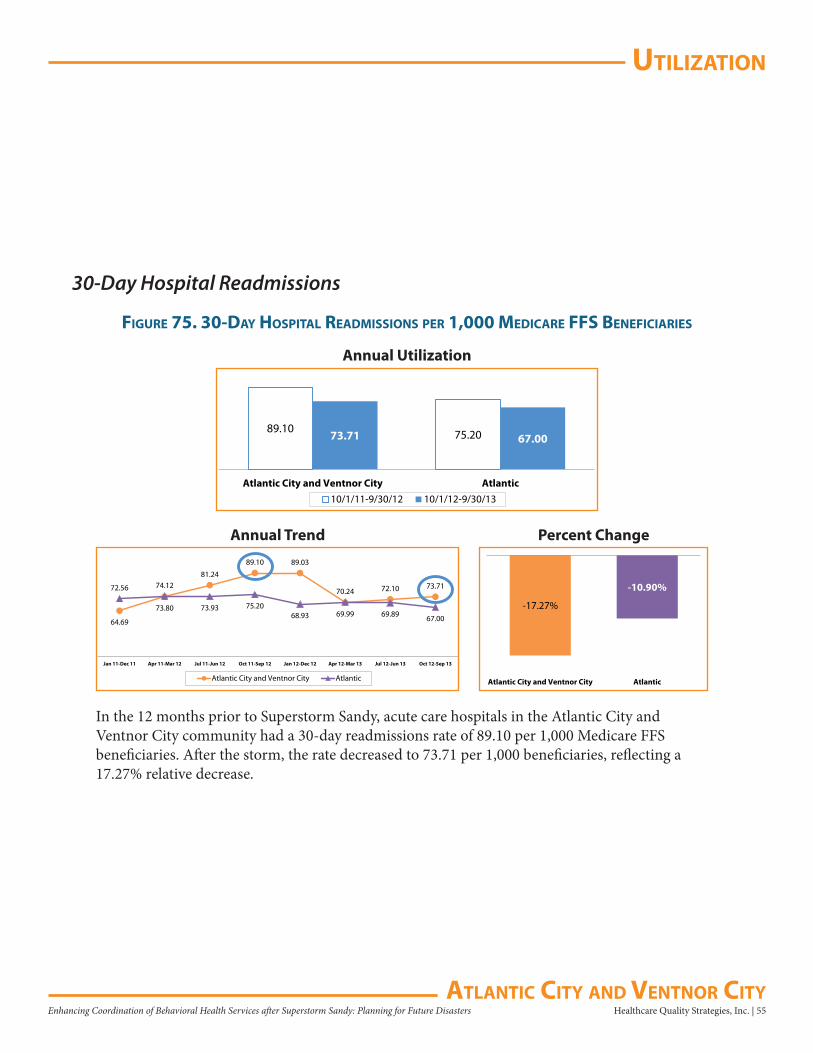
uTilizaTion
Healthcare Quality Strategies, Inc. | 55Enhancing Coordination of Behavioral Health Services after Superstorm Sandy: Planning for Future DisastersaTlanTiC CiTy and VenTnor CiTy
30-Day Hospital Readmissions
figure 75. 30-day hosPiTal readMissions Per 1,000 MediCare ffs benefiCiaries
89.10 75.2073.71 67.00
Atlantic City and Ventnor City Atlantic10/1/11-9/30/12 10/1/12-9/30/13
Annual Utilization
In the 12 months prior to Superstorm Sandy, acute care hospitals in the Atlantic City and Ventnor City community had a 30-day readmissions rate of 89.10 per 1,000 Medicare FFS beneficiaries. After the storm, the rate decreased to 73.71 per 1,000 beneficiaries, reflecting a 17.27% relative decrease.
-17.27%
-10.90%
Atlantic City and Ventnor City Atlantic
64.69
73.80
81.24
89.10 89.03
69.99
72.10 73.7172.56 74.12
73.93 75.2068.93
70.24
69.89 67.00
Jan 11-Dec 11 Apr 11-Mar 12 Jul 11-Jun 12 Oct 11-Sep 12 Jan 12-Dec 12 Apr 12-Mar 13 Jul 12-Jun 13 Oct 12-Sep 13
Atlantic City and Ventnor City Atlantic
Annual Trend Percent Change
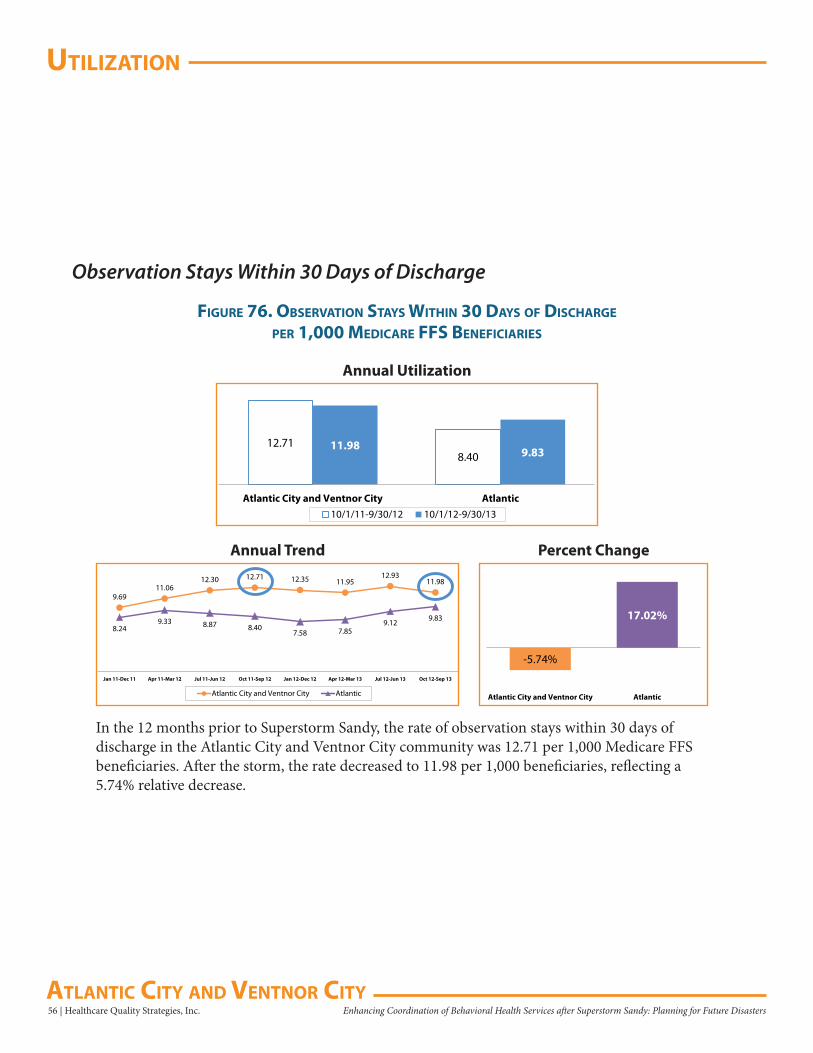
uTilizaTion
56 | Healthcare Quality Strategies, Inc. Enhancing Coordination of Behavioral Health Services after Superstorm Sandy: Planning for Future Disasters aTlanTiC CiTy and VenTnor CiTy
Observation Stays Within 30 Days of Discharge
figure 76. obserVaTion sTays WiThin 30 days of disCharge
Per 1,000 MediCare ffs benefiCiaries
12.718.40
11.98 9.83
Atlantic City and Ventnor City Atlantic10/1/11-9/30/12 10/1/12-9/30/13
Annual Utilization
In the 12 months prior to Superstorm Sandy, the rate of observation stays within 30 days of discharge in the Atlantic City and Ventnor City community was 12.71 per 1,000 Medicare FFS beneficiaries. After the storm, the rate decreased to 11.98 per 1,000 beneficiaries, reflecting a 5.74% relative decrease.
-5.74%
17.02%
Atlantic City and Ventnor City Atlantic
9.6911.06
12.30 12.71 12.35 11.9512.93
11.98
8.249.33 8.87 8.40
7.58 7.859.12 9.83
Jan 11-Dec 11 Apr 11-Mar 12 Jul 11-Jun 12 Oct 11-Sep 12 Jan 12-Dec 12 Apr 12-Mar 13 Jul 12-Jun 13 Oct 12-Sep 13
Atlantic City and Ventnor City Atlantic
Annual Trend Percent Change
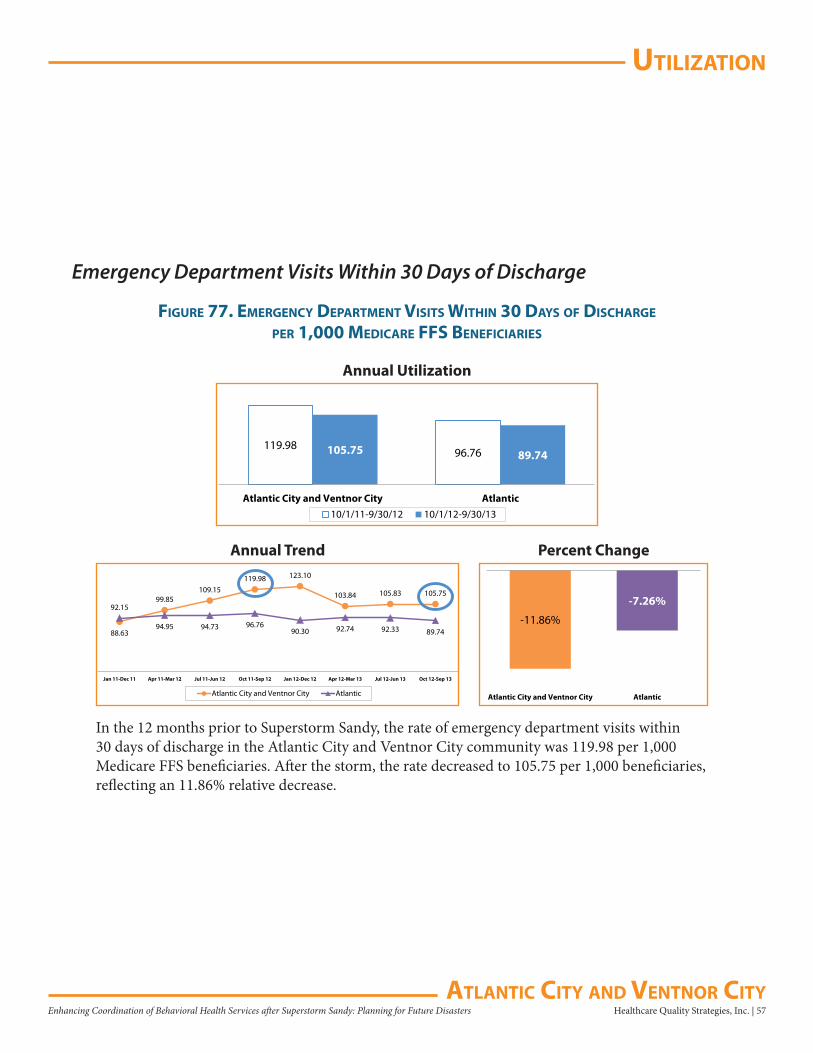
uTilizaTion
Healthcare Quality Strategies, Inc. | 57Enhancing Coordination of Behavioral Health Services after Superstorm Sandy: Planning for Future DisastersaTlanTiC CiTy and VenTnor CiTy
Emergency Department Visits Within 30 Days of Discharge
figure 77. eMergenCy deParTMenT VisiTs WiThin 30 days of disCharge
Per 1,000 MediCare ffs benefiCiaries
119.9896.76105.75 89.74
Atlantic City and Ventnor City Atlantic10/1/11-9/30/12 10/1/12-9/30/13
Annual Utilization
In the 12 months prior to Superstorm Sandy, the rate of emergency department visits within 30 days of discharge in the Atlantic City and Ventnor City community was 119.98 per 1,000 Medicare FFS beneficiaries. After the storm, the rate decreased to 105.75 per 1,000 beneficiaries, reflecting an 11.86% relative decrease.
-11.86%
-7.26%
Atlantic City and Ventnor City Atlantic
88.63
99.85109.15
119.98 123.10
103.84 105.83 105.75
92.15
94.95 94.73 96.7690.30 92.74 92.33 89.74
Jan 11-Dec 11 Apr 11-Mar 12 Jul 11-Jun 12 Oct 11-Sep 12 Jan 12-Dec 12 Apr 12-Mar 13 Jul 12-Jun 13 Oct 12-Sep 13
Atlantic City and Ventnor City Atlantic
Annual Trend Percent Change
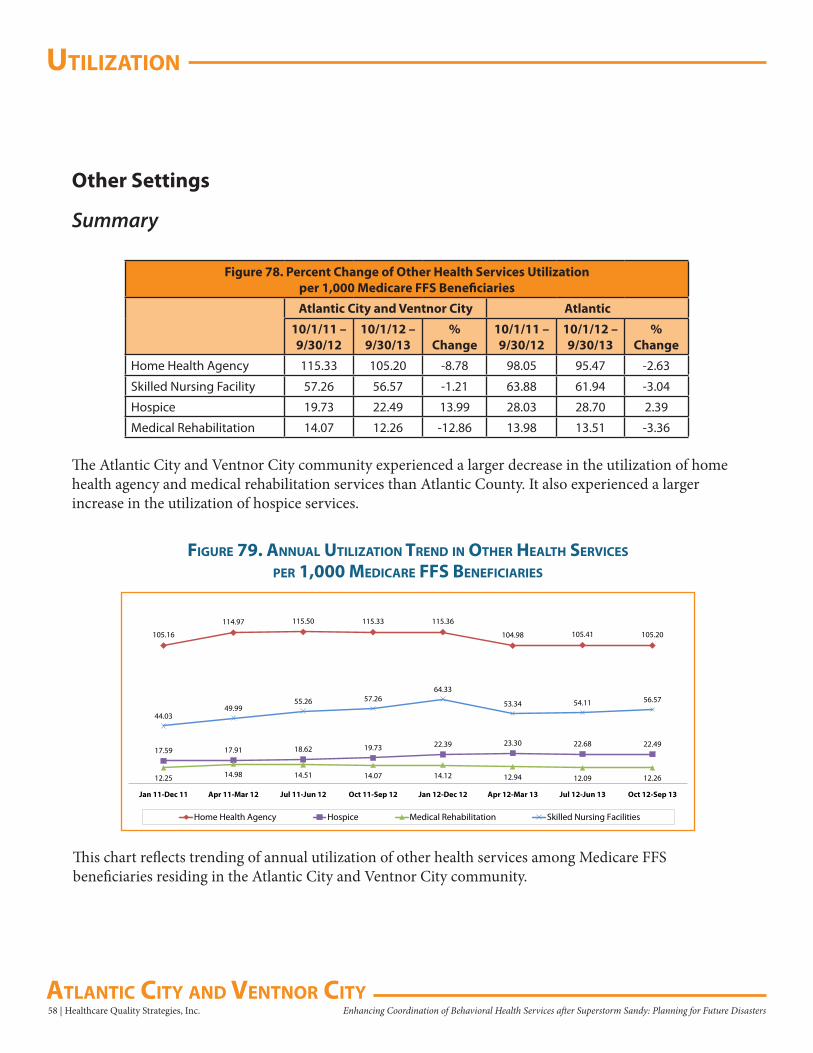
uTilizaTion
58 | Healthcare Quality Strategies, Inc. Enhancing Coordination of Behavioral Health Services after Superstorm Sandy: Planning for Future Disasters aTlanTiC CiTy and VenTnor CiTy
Other Settings
Summary
Figure 78. Percent Change of Other Health Services Utilizationper 1,000 Medicare FFS Beneficiaries
Atlantic City and Ventnor City Atlantic
10/1/11 – 9/30/12
10/1/12 – 9/30/13
% Change
10/1/11 – 9/30/12
10/1/12 – 9/30/13
% Change
Home Health Agency 115.33 105.20 -8.78 98.05 95.47 -2.63
Skilled Nursing Facility 57.26 56.57 -1.21 63.88 61.94 -3.04
Hospice 19.73 22.49 13.99 28.03 28.70 2.39
Medical Rehabilitation 14.07 12.26 -12.86 13.98 13.51 -3.36
The Atlantic City and Ventnor City community experienced a larger decrease in the utilization of home health agency and medical rehabilitation services than Atlantic County. It also experienced a larger increase in the utilization of hospice services.
105.16
114.97 115.50 115.33 115.36
104.98 105.41 105.20
17.59 17.91 18.62 19.73 22.39 23.30 22.68 22.49
12.25 14.98 14.51 14.07 14.12 12.94 12.09 12.26
44.0349.99
55.26 57.2664.33
53.34 54.11 56.57
Jan 11-Dec 11 Apr 11-Mar 12 Jul 11-Jun 12 Oct 11-Sep 12 Jan 12-Dec 12 Apr 12-Mar 13 Jul 12-Jun 13 Oct 12-Sep 13
Home Health Agency Hospice Medical Rehabilitation Skilled Nursing Facilities
figure 79. annual uTilizaTion Trend in oTher healTh serViCes
Per 1,000 MediCare ffs benefiCiaries
This chart reflects trending of annual utilization of other health services among Medicare FFS beneficiaries residing in the Atlantic City and Ventnor City community.
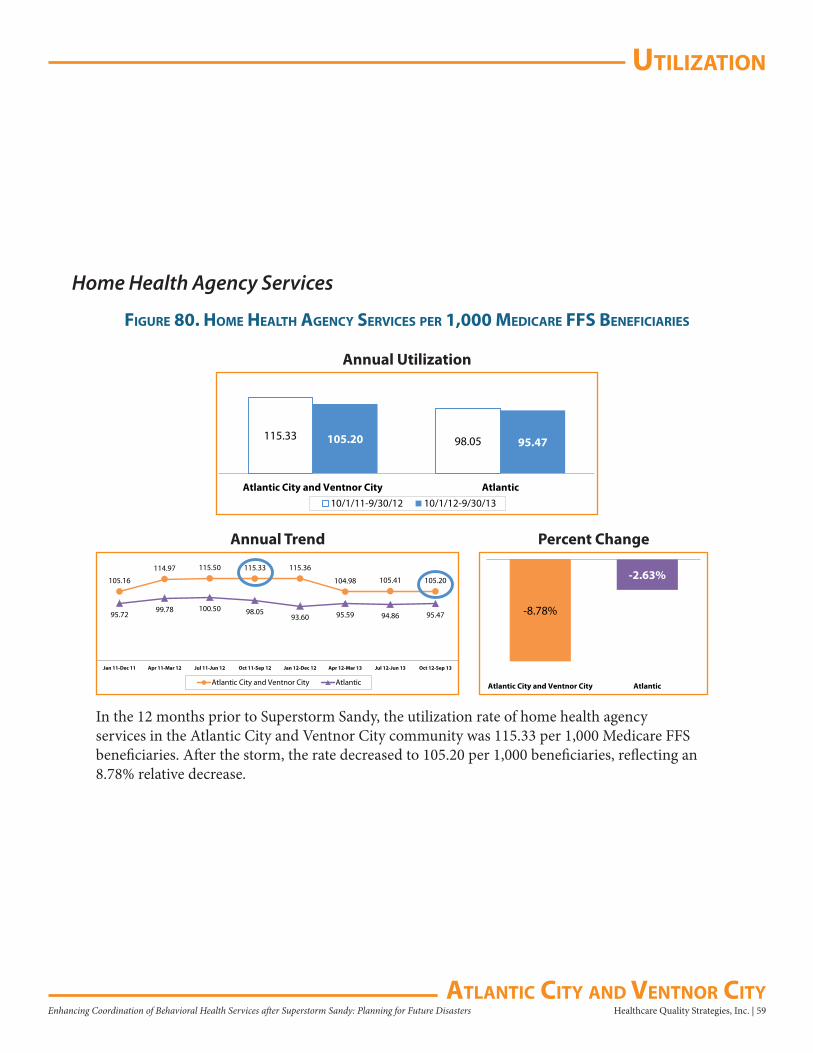
uTilizaTion
Healthcare Quality Strategies, Inc. | 59Enhancing Coordination of Behavioral Health Services after Superstorm Sandy: Planning for Future DisastersaTlanTiC CiTy and VenTnor CiTy
Home Health Agency Services
figure 80. hoMe healTh agenCy serViCes Per 1,000 MediCare ffs benefiCiaries
115.33 98.05105.20 95.47
Atlantic City and Ventnor City Atlantic10/1/11-9/30/12 10/1/12-9/30/13
Annual Utilization
In the 12 months prior to Superstorm Sandy, the utilization rate of home health agency services in the Atlantic City and Ventnor City community was 115.33 per 1,000 Medicare FFS beneficiaries. After the storm, the rate decreased to 105.20 per 1,000 beneficiaries, reflecting an 8.78% relative decrease.
-8.78%
-2.63%
Atlantic City and Ventnor City Atlantic
105.16
114.97 115.50 115.33 115.36
104.98 105.41 105.20
95.7299.78 100.50 98.05
93.60 95.59 94.86 95.47
Jan 11-Dec 11 Apr 11-Mar 12 Jul 11-Jun 12 Oct 11-Sep 12 Jan 12-Dec 12 Apr 12-Mar 13 Jul 12-Jun 13 Oct 12-Sep 13
Atlantic City and Ventnor City Atlantic
Annual Trend Percent Change
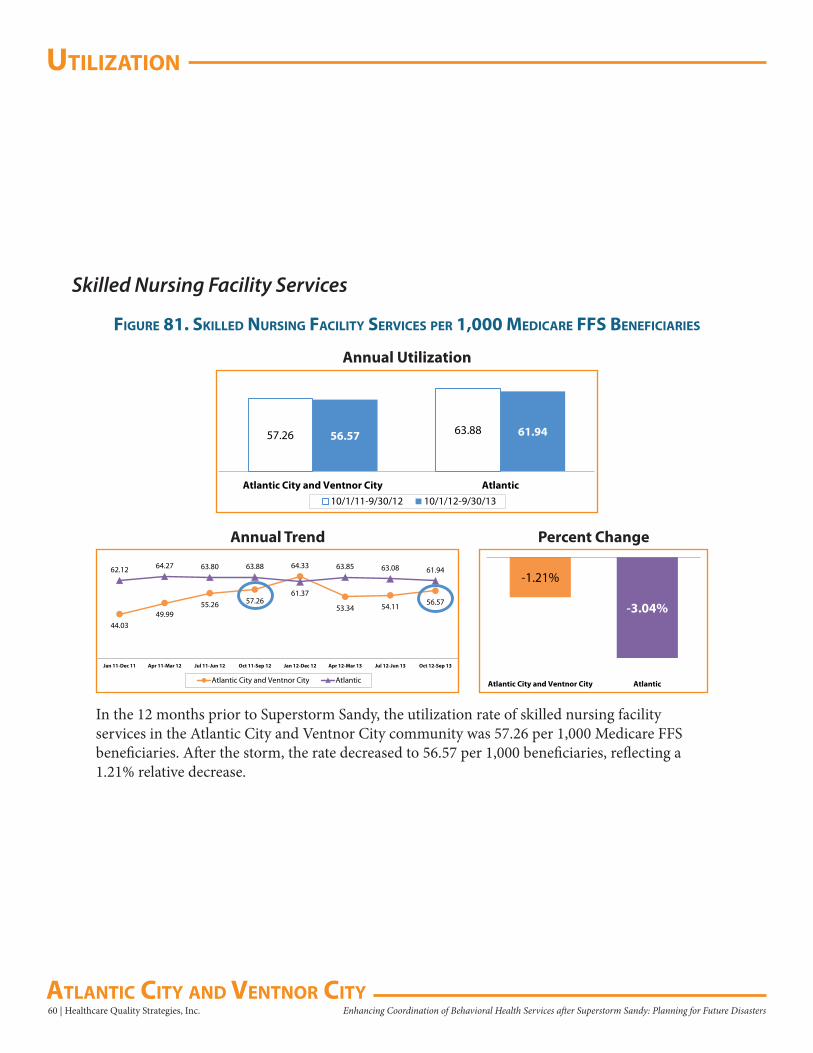
uTilizaTion
60 | Healthcare Quality Strategies, Inc. Enhancing Coordination of Behavioral Health Services after Superstorm Sandy: Planning for Future Disasters aTlanTiC CiTy and VenTnor CiTy
Skilled Nursing Facility Services
figure 81. skilled nursing faCiliTy serViCes Per 1,000 MediCare ffs benefiCiaries
57.26 63.8856.57 61.94
Atlantic City and Ventnor City Atlantic10/1/11-9/30/12 10/1/12-9/30/13
Annual Utilization
In the 12 months prior to Superstorm Sandy, the utilization rate of skilled nursing facility services in the Atlantic City and Ventnor City community was 57.26 per 1,000 Medicare FFS beneficiaries. After the storm, the rate decreased to 56.57 per 1,000 beneficiaries, reflecting a 1.21% relative decrease.
-1.21%
-3.04%
Atlantic City and Ventnor City Atlantic
44.0349.99
55.26 57.26
64.33
53.34 54.11 56.57
62.12 64.27 63.80 63.88
61.37
63.85 63.08 61.94
Jan 11-Dec 11 Apr 11-Mar 12 Jul 11-Jun 12 Oct 11-Sep 12 Jan 12-Dec 12 Apr 12-Mar 13 Jul 12-Jun 13 Oct 12-Sep 13
Atlantic City and Ventnor City Atlantic
Annual Trend Percent Change
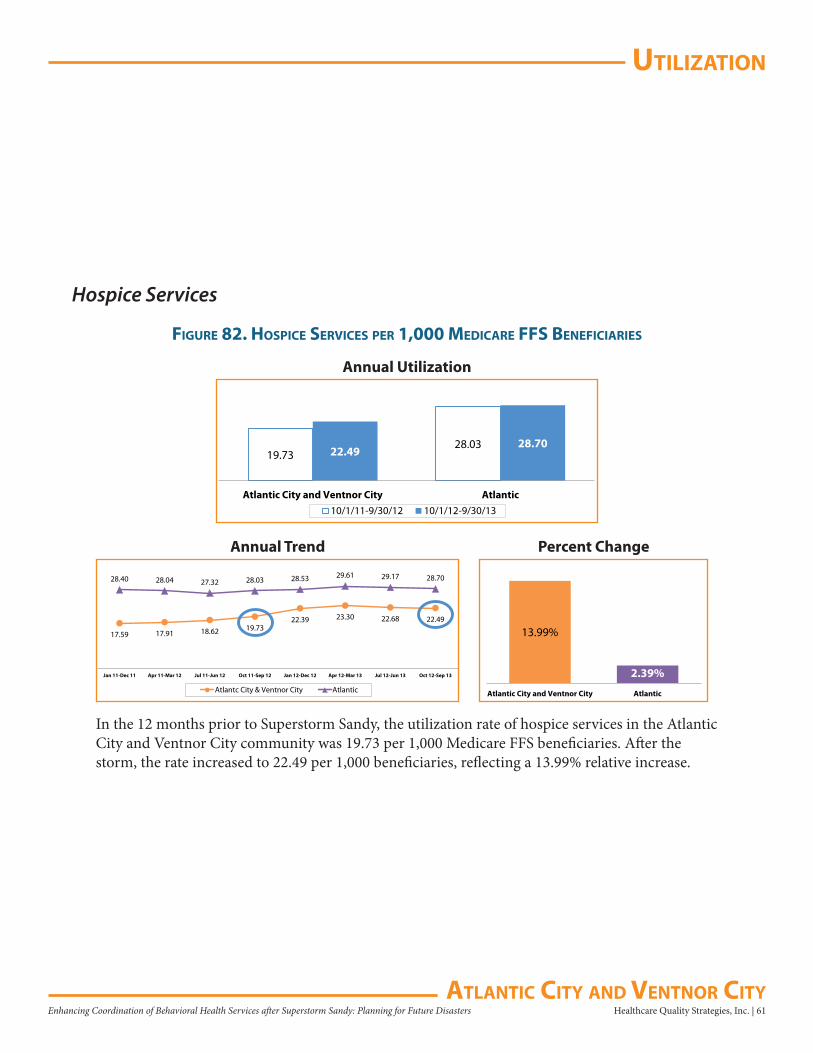
uTilizaTion
Healthcare Quality Strategies, Inc. | 61Enhancing Coordination of Behavioral Health Services after Superstorm Sandy: Planning for Future DisastersaTlanTiC CiTy and VenTnor CiTy
Hospice Services
figure 82. hosPiCe serViCes Per 1,000 MediCare ffs benefiCiaries
19.7328.03
22.4928.70
Atlantic City and Ventnor City Atlantic10/1/11-9/30/12 10/1/12-9/30/13
Annual Utilization
In the 12 months prior to Superstorm Sandy, the utilization rate of hospice services in the Atlantic City and Ventnor City community was 19.73 per 1,000 Medicare FFS beneficiaries. After the storm, the rate increased to 22.49 per 1,000 beneficiaries, reflecting a 13.99% relative increase.
13.99%
2.39%
Atlantic City and Ventnor City Atlantic
17.59 17.91 18.62 19.7322.39 23.30 22.68 22.49
28.40 28.04 27.32 28.03 28.53 29.61 29.17 28.70
Jan 11-Dec 11 Apr 11-Mar 12 Jul 11-Jun 12 Oct 11-Sep 12 Jan 12-Dec 12 Apr 12-Mar 13 Jul 12-Jun 13 Oct 12-Sep 13
Atlantc City & Ventnor City Atlantic
Annual Trend Percent Change
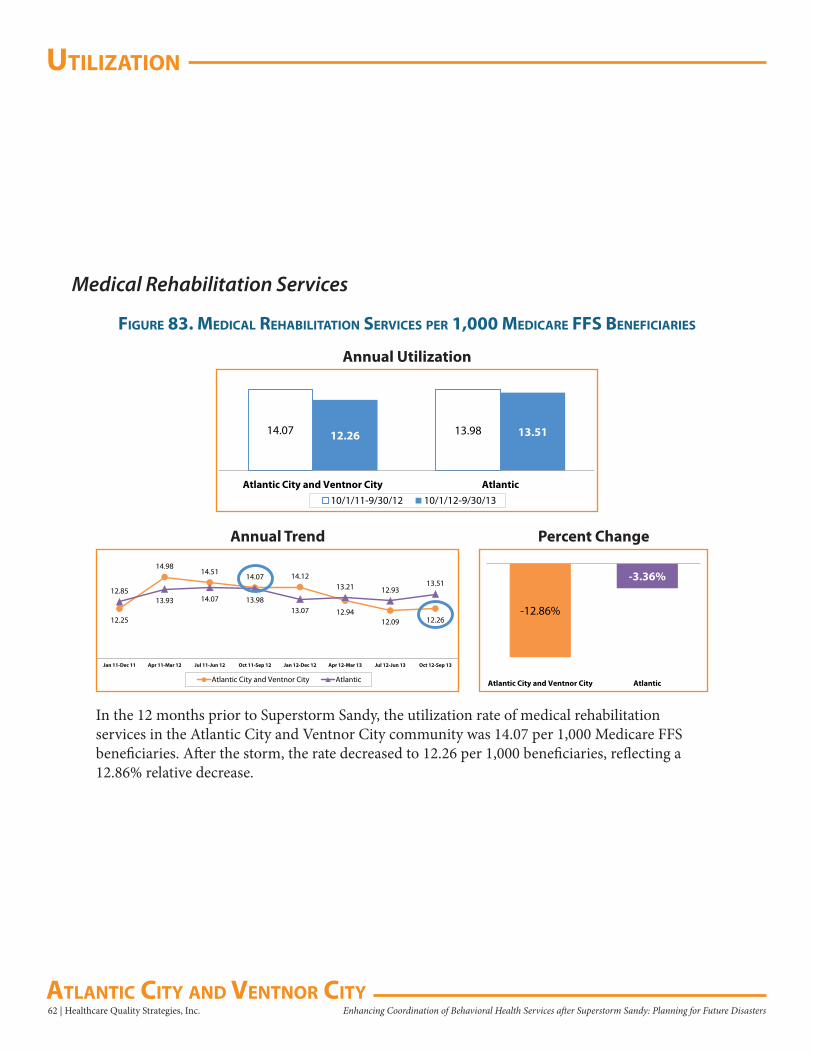
uTilizaTion
62 | Healthcare Quality Strategies, Inc. Enhancing Coordination of Behavioral Health Services after Superstorm Sandy: Planning for Future Disasters aTlanTiC CiTy and VenTnor CiTy
Medical Rehabilitation Services
figure 83. MediCal rehabiliTaTion serViCes Per 1,000 MediCare ffs benefiCiaries
14.07 13.9812.26 13.51
Atlantic City and Ventnor City Atlantic10/1/11-9/30/12 10/1/12-9/30/13
Annual Utilization
In the 12 months prior to Superstorm Sandy, the utilization rate of medical rehabilitation services in the Atlantic City and Ventnor City community was 14.07 per 1,000 Medicare FFS beneficiaries. After the storm, the rate decreased to 12.26 per 1,000 beneficiaries, reflecting a 12.86% relative decrease.
-12.86%
-3.36%
Atlantic City and Ventnor City Atlantic
12.25
14.9814.51
14.07 14.12
12.9412.09 12.26
12.8513.93 14.07 13.98
13.07
13.21 12.9313.51
Jan 11-Dec 11 Apr 11-Mar 12 Jul 11-Jun 12 Oct 11-Sep 12 Jan 12-Dec 12 Apr 12-Mar 13 Jul 12-Jun 13 Oct 12-Sep 13
Atlantic City and Ventnor City Atlantic
Annual Trend Percent Change
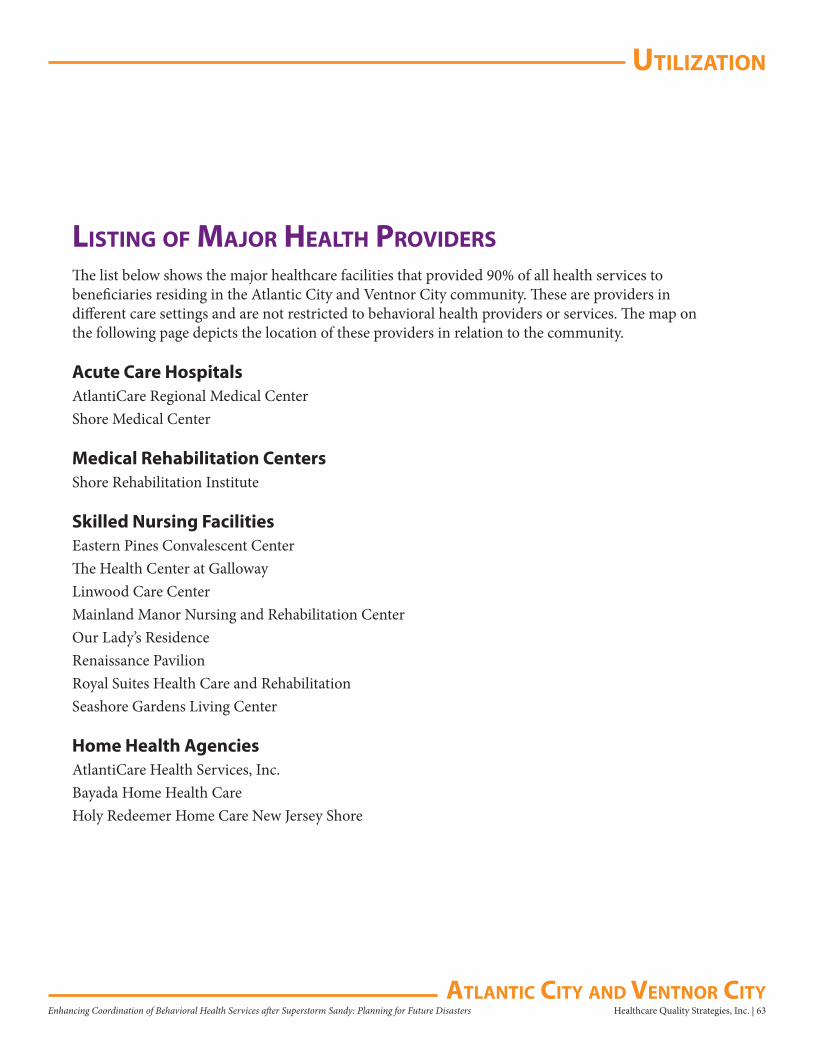
uTilizaTion
Healthcare Quality Strategies, Inc. | 63Enhancing Coordination of Behavioral Health Services after Superstorm Sandy: Planning for Future DisastersaTlanTiC CiTy and VenTnor CiTy
lisTing of Major healTh ProVidersThe list below shows the major healthcare facilities that provided 90% of all health services to beneficiaries residing in the Atlantic City and Ventnor City community. These are providers in different care settings and are not restricted to behavioral health providers or services. The map on the following page depicts the location of these providers in relation to the community.
Acute Care HospitalsAtlantiCare Regional Medical CenterShore Medical Center
Medical Rehabilitation CentersShore Rehabilitation Institute
Skilled Nursing FacilitiesEastern Pines Convalescent Center The Health Center at GallowayLinwood Care Center Mainland Manor Nursing and Rehabilitation Center Our Lady’s Residence Renaissance Pavilion Royal Suites Health Care and Rehabilitation Seashore Gardens Living Center
Home Health AgenciesAtlantiCare Health Services, Inc. Bayada Home Health Care Holy Redeemer Home Care New Jersey Shore
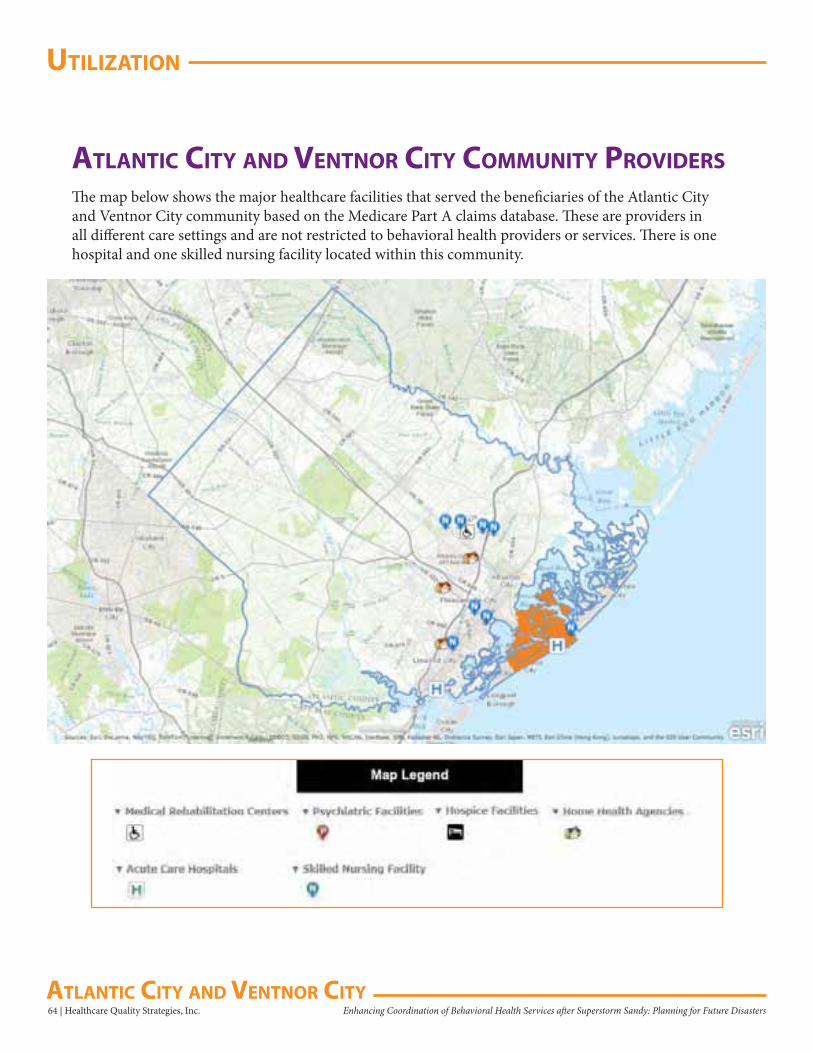
uTilizaTion
64 | Healthcare Quality Strategies, Inc. Enhancing Coordination of Behavioral Health Services after Superstorm Sandy: Planning for Future Disasters aTlanTiC CiTy and VenTnor CiTy
aTlanTiC CiTy and VenTnor CiTy CoMMuniTy ProVidersThe map below shows the major healthcare facilities that served the beneficiaries of the Atlantic City and Ventnor City community based on the Medicare Part A claims database. These are providers in all different care settings and are not restricted to behavioral health providers or services. There is one hospital and one skilled nursing facility located within this community.
aPPendix a
Healthcare Quality Strategies, Inc. | 65Enhancing Coordination of Behavioral Health Services after Superstorm Sandy: Planning for Future DisastersaTlanTiC CiTy and VenTnor CiTy
aPPendix a: behaVioral healTh CondiTions Documentation and Technical NotesThe following defines the study population, the time frames, and the exclusion and inclusion criteria:
Data Source• New Jersey Medicare FFS Part A and Part B claims data and denominator file
Reference Time Period• Annual prevalence of risk factors for depression or proxy disorders comparing October 1, 2011 –
September 30, 2012 to October 1, 2012 – September 30, 2013• Annual prevalence trend for risk factors for depression or proxy disorders consists of eight points of
data with rolling quarters (starting January 2011 and ending September 2013)• Quarterly new incidence trend charts of the selected behavioral health conditions contain data from
January 1, 2012 to September 30, 2013 and allows for the identification of new cases in a given quarter when compared to the prior year
Mapping Tool• QGIS Development Team, 2014, QGIS Geographic Information System. Open Source Geospatial
Foundation Project. http://qgis.osgeo.org• Source: ZIP code boundaries based on the 2013 U.S. Census Tiger Files
Denominator• Denominator was the sum of all eligible Medicare FFS beneficiaries who were in the CMS denominator
file during the measurement time frame• Eligible beneficiaries were computed after adjusting for total enrolled FFS days divided by the total
measurement days in the time frame• Where Medicare FFS enrolled days > 0
Numerator• Unique Medicare FFS beneficiaries with disease-specific inpatient or outpatient claims during the time
frame • CCW and AHRQ disease diagnosis code match (ICD-9-CM codes) Part A dgns_cd_1-25 and dgns_e_
cd_1-3; Match Part B dgns_cd_1_12
Exclusions• HMO coverage period • Age <18 or >= 110• Eligible Medicare FFS days/total measurement days = 0
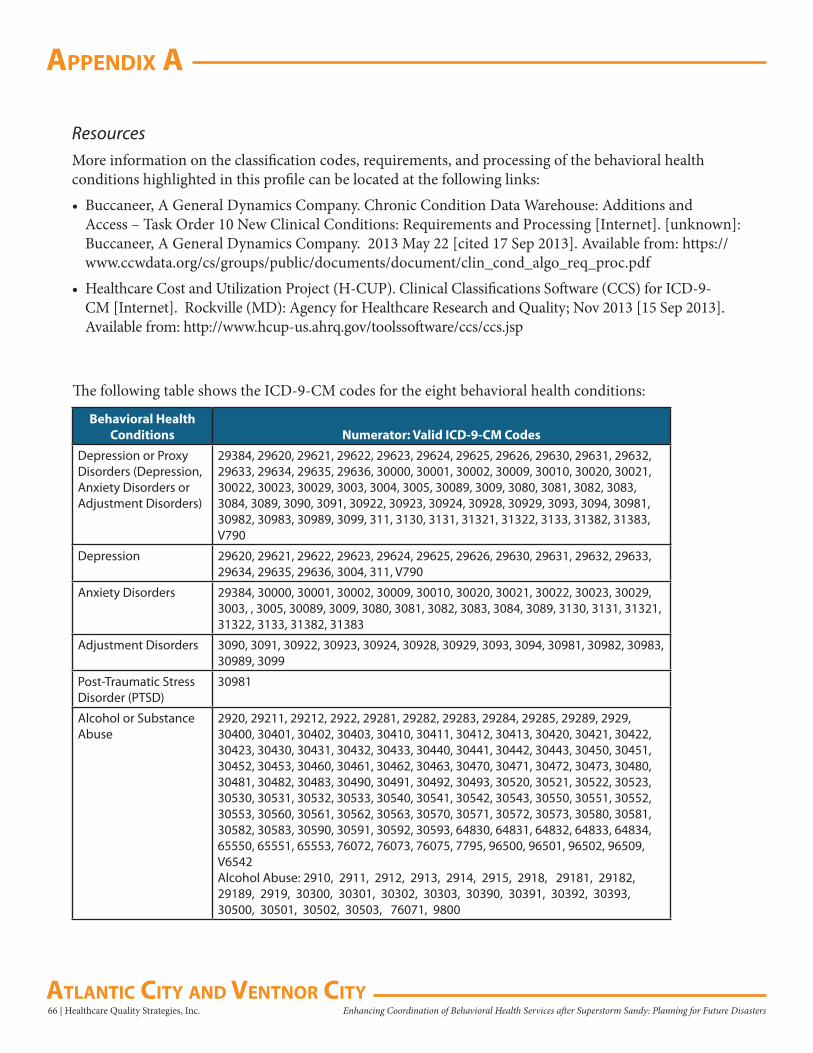
66 | Healthcare Quality Strategies, Inc. Enhancing Coordination of Behavioral Health Services after Superstorm Sandy: Planning for Future Disasters
aPPendix a
aTlanTiC CiTy and VenTnor CiTy
ResourcesMore information on the classification codes, requirements, and processing of the behavioral health conditions highlighted in this profile can be located at the following links:• Buccaneer, A General Dynamics Company. Chronic Condition Data Warehouse: Additions and
Access – Task Order 10 New Clinical Conditions: Requirements and Processing [Internet]. [unknown]: Buccaneer, A General Dynamics Company. 2013 May 22 [cited 17 Sep 2013]. Available from: https://www.ccwdata.org/cs/groups/public/documents/document/clin_cond_algo_req_proc.pdf
• Healthcare Cost and Utilization Project (H-CUP). Clinical Classifications Software (CCS) for ICD-9-CM [Internet]. Rockville (MD): Agency for Healthcare Research and Quality; Nov 2013 [15 Sep 2013]. Available from: http://www.hcup-us.ahrq.gov/toolssoftware/ccs/ccs.jsp
The following table shows the ICD-9-CM codes for the eight behavioral health conditions:
Behavioral Health Conditions
Numerator: Valid ICD-9-CM Codes
Depression or Proxy 29384, 29620, 29621, 29622, 29623, 29624, 29625, 29626, 29630, 29631, 29632, Disorders (Depression, 29633, 29634, 29635, 29636, 30000, 30001, 30002, 30009, 30010, 30020, 30021, Anxiety Disorders or 30022, 30023, 30029, 3003, 3004, 3005, 30089, 3009, 3080, 3081, 3082, 3083, Adjustment Disorders) 3084, 3089, 3090, 3091, 30922, 30923, 30924, 30928, 30929, 3093, 3094, 30981,
30982, 30983, 30989, 3099, 311, 3130, 3131, 31321, 31322, 3133, 31382, 31383, V790
Depression 29620, 29621, 29622, 29623, 29624, 29625, 29626, 29630, 29631, 29632, 29633, 29634, 29635, 29636, 3004, 311, V790
Anxiety Disorders 29384, 30000, 30001, 30002, 30009, 30010, 30020, 30021, 30022, 30023, 30029, 3003, , 3005, 30089, 3009, 3080, 3081, 3082, 3083, 3084, 3089, 3130, 3131, 31321, 31322, 3133, 31382, 31383
Adjustment Disorders 3090, 3091, 30922, 30923, 30924, 30928, 30929, 3093, 3094, 30981, 30982, 30983, 30989, 3099
Post-Traumatic Stress Disorder (PTSD)
30981
Alcohol or Substance Abuse
2920, 29211, 29212, 2922, 29281, 29282, 29283, 29284, 29285, 29289, 2929, 30400, 30401, 30402, 30403, 30410, 30411, 30412, 30413, 30420, 30421, 30422, 30423, 30430, 30431, 30432, 30433, 30440, 30441, 30442, 30443, 30450, 30451, 30452, 30453, 30460, 30461, 30462, 30463, 30470, 30471, 30472, 30473, 30480, 30481, 30482, 30483, 30490, 30491, 30492, 30493, 30520, 30521, 30522, 30523, 30530, 30531, 30532, 30533, 30540, 30541, 30542, 30543, 30550, 30551, 30552, 30553, 30560, 30561, 30562, 30563, 30570, 30571, 30572, 30573, 30580, 30581, 30582, 30583, 30590, 30591, 30592, 30593, 64830, 64831, 64832, 64833, 64834, 65550, 65551, 65553, 76072, 76073, 76075, 7795, 96500, 96501, 96502, 96509, V6542Alcohol Abuse: 2910, 2911, 2912, 2913, 2914, 2915, 2918, 29181, 29182, 29189, 2919, 30300, 30301, 30302, 30303, 30390, 30391, 30392, 30393, 30500, 30501, 30502, 30503, 76071, 9800
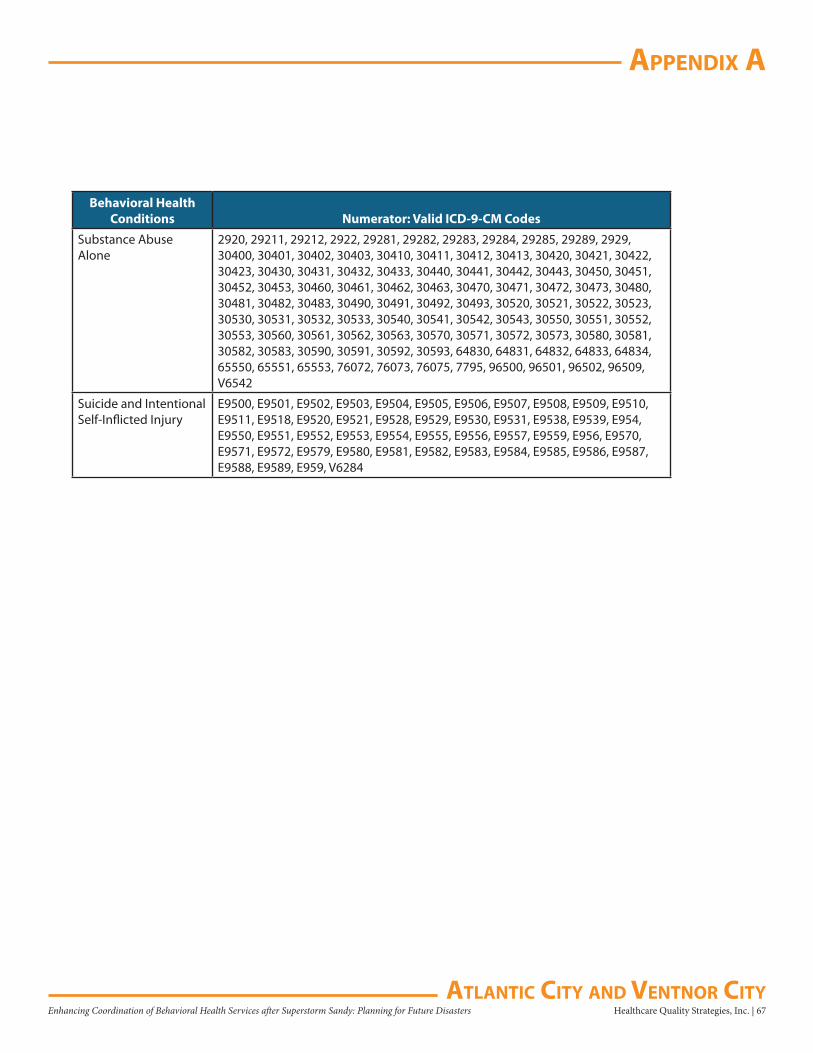
aPPendix a
Healthcare Quality Strategies, Inc. | 67Enhancing Coordination of Behavioral Health Services after Superstorm Sandy: Planning for Future DisastersaTlanTiC CiTy and VenTnor CiTy
Behavioral Health Conditions Numerator: Valid ICD-9-CM Codes
Substance Abuse Alone
2920, 29211, 29212, 2922, 29281, 29282, 29283, 29284, 29285, 29289, 2929, 30400, 30401, 30402, 30403, 30410, 30411, 30412, 30413, 30420, 30421, 30422, 30423, 30430, 30431, 30432, 30433, 30440, 30441, 30442, 30443, 30450, 30451, 30452, 30453, 30460, 30461, 30462, 30463, 30470, 30471, 30472, 30473, 30480, 30481, 30482, 30483, 30490, 30491, 30492, 30493, 30520, 30521, 30522, 30523, 30530, 30531, 30532, 30533, 30540, 30541, 30542, 30543, 30550, 30551, 30552, 30553, 30560, 30561, 30562, 30563, 30570, 30571, 30572, 30573, 30580, 30581, 30582, 30583, 30590, 30591, 30592, 30593, 64830, 64831, 64832, 64833, 64834, 65550, 65551, 65553, 76072, 76073, 76075, 7795, 96500, 96501, 96502, 96509, V6542
Suicide and Intentional Self-Inflicted Injury
E9500, E9501, E9502, E9503, E9504, E9505, E9506, E9507, E9508, E9509, E9510, E9511, E9518, E9520, E9521, E9528, E9529, E9530, E9531, E9538, E9539, E954, E9550, E9551, E9552, E9553, E9554, E9555, E9556, E9557, E9559, E956, E9570, E9571, E9572, E9579, E9580, E9581, E9582, E9583, E9584, E9585, E9586, E9587, E9588, E9589, E959, V6284
68 | Healthcare Quality Strategies, Inc. Enhancing Coordination of Behavioral Health Services after Superstorm Sandy: Planning for Future Disasters
aPPendix b
aTlanTiC CiTy and VenTnor CiTy
aPPendix b: risk faCTors for dePression or Proxy disorders
Documentation and Technical NotesThe following defines the study population, the time frame, the exclusion and inclusion criteria, and the literature review references:
Data Source• New Jersey Medicare FFS Part A and Part B claims data and denominator file
Reference Time Period • Annual prevalence of risk factors for depression or proxy disorders comparing October 1, 2011 –
September 30, 2012 to October 1, 2012 – September 30, 2013• Annual prevalence trend for risk factors for depression or proxy disorders consists of eight points of
data with rolling quarters (starting January 2011 and ending September 2013)
Mapping Tool• QGIS Development Team, 2014, QGIS Geographic Information System. Open Source Geospatial
Foundation Project. http://qgis.osgeo.org• Source: ZIP code boundaries based on the 2013 U.S. Census Tiger Files
Denominator• Denominator was the sum of all eligible Medicare FFS beneficiaries who were in the CMS denominator
file during the measurement time frame• Eligible beneficiaries were computed after adjusting for total enrolled FFS days divided by the total
measurement days in the time frame• Where Medicare FFS enrolled days > 0
Numerator• Unique Medicare FFS beneficiaries with disease-specific inpatient or outpatient claims during the time
frame• CCW and AHRQ disease diagnosis code match (ICD-9-CM codes) Part A dgns_cd_1-25 and dgns_e_
cd_1-3; Match Part B dgns_cd_1_12
Exclusions• HMO coverage period • Age <18 or >= 110• Eligible Medicare FFS days/total measurement days = 0
Model• Logistic Regression Models were used to determine the top five risk factors with the highest Odds
Ratios (OR) (p<0.001)
Healthcare Quality Strategies, Inc. | 69Enhancing Coordination of Behavioral Health Services after Superstorm Sandy: Planning for Future Disasters
aPPendix b
aTlanTiC CiTy and VenTnor CiTy
ResourcesMore information on the classification codes, requirements, and processing of the combination measure of depression or proxy disorders which includes beneficiaries reported for either depression, anxiety, or adjustment disorders can be located at the following links:• Buccaneer, A General Dynamics Company. Chronic Condition Data Warehouse: Additions and
Access – Task Order 10 New Clinical Conditions: Requirements and Processing [Internet]. [unknown]: Buccaneer, A General Dynamics Company. 2013 May 22 [cited 17 Sep 2013]. Available from: https://www.ccwdata.org/cs/groups/public/documents/document/clin_cond_algo_req_proc.pdf
• Healthcare Cost and Utilization Project (H-CUP). Clinical Classifications Software (CCS) for ICD-9-CM [Internet]. Rockville (MD): Agency for Healthcare Research and Quality; Nov 2013 [15 Sep 2013]. Available from: http://www.hcup-us.ahrq.gov/toolssoftware/ccs/ccs.jsp
Literature Review References for Risk Factors for Depression or Proxy Disorders
National Alliance on Mental Illness. Information Helpline: Depression in Older Persons Fact Sheet [Internet]. Arlington (VA): National Alliance on Mental Illness; 2009 Oct [cited 2013 Sep 17]. Available from: http://www.nami.org/Template.cfm?Section=Helpline1&Template=/ContentManagement/ContentDisplay.cfm&ContentID=144039
National Institute of Mental Health. Depression: Causes and Risk Factors [Internet]. Bethesda (MD): National Institute of Mental Health; 2013 Jul [cited 2013 Sep 17]. Available from: http://nihseniorhealth.gov/depression/causesandriskfactors/01.html
Centers for Disease Control and Prevention and National Association of Chronic Disease Directors. The State of Mental Health and Aging in America [Internet]. Atlanta (GA): National Association of Chronic Disease Directors, 2008 [cited 2013 Sep 19]. 11 p. Available from: http://www.cdc.gov/aging/pdf/mental_health.pdf
Jacques L, Jensen T, Schafer J, Caplan S, Schott L. Final Coverage Decision Memorandum for Screening for Depression in Adults [Internet]. Baltimore (MD): Centers for Medicare & Medicaid Services; 2011 Oct 14 [cited 2013 Sep 18]. 42 p. Available from: http://www.cms.gov/medicare-coverage-database/details/nca-decision-memo.aspx?NCAId=251
Thakur M, Blazer DG. Depression in long-term care. Journal of the American Medical Directors Association [Internet]. 2008 Feb [cited 2013 Sep 19];9(2):82-87. Available from: http://www.amda.com/tools/clinical/depression/DepressioninLongTermCare.pdf
Sozeri-Varma G. Depression in the elderly: clinical features and risk factors. Aging and Disease [Internet]. 2012 Dec [cited 2013 Sep 18];3(6):465-471. Available from: http://www.ncbi.nlm.nih.gov/pmc/articles/PMC3522513/
Qian J, Simoni-Wastila L, Rattinger GB, Lehmann S, Langenberg P, et al. Associations of depression diagnosis and antidepressant treatment with mortality among young and disabled Medicare beneficiaries with COPD. General Hospital Psychiatry. 2013 Jul 18 [cited 2013 Sep 22]; 35(6):612-618.
70 | Healthcare Quality Strategies, Inc. Enhancing Coordination of Behavioral Health Services after Superstorm Sandy: Planning for Future Disasters
aPPendix b
aTlanTiC CiTy and VenTnor CiTy
Shao W, Ahmad R, Khutoryansky N, Aagren M, Bouchard J. Evidence supporting an association between hypoglycemic events and depression. Current Medical Research and Opinion. 2013 Sep 23 [cited 2013 Sep 22]: 1-7.
Substance Abuse and Mental Health Services Administration. The Treatment of Depression in Older Adults: Depression and Older Adults: Key Issues [Internet]. Rockville, MD: Center for Mental Health Services, Substance Abuse and Mental Health Services Administration, U.S. Department of Health and Human Services, 2011 [cited 2013 Sep 24]. HHS Pub. No. SMA-11-4631. 24 p. Available from: http://store.samhsa.gov/shin/content/SMA11-4631CD-DVD/SMA11-4631CD-DVD-KeyIssues.pdf
Himelhoch S, Weller WE, Wu AW, Anderson GF, Cooper LA. Chronic medical illness, depression, and use of acute medical services among Medicare beneficiaries. Medical Care. 2004 Jun [cited 2013 Sep 25];42(6):512-521.
Mohile SG, Fan L, Reeve E, Jean-Pierre P, Mustian K, et al. Association of cancer with geriatric syndromes in older Medicare beneficiaries. Journal of Clinical Oncology: Official Journal of the American Society of Clinical Oncology [Internet]. 2011 Apr 10 [cited 2013 Sep 25];29(11): 1458-1464. Available from: http://www.ncbi.nlm.nih.gov/pmc/articles/PMC3082984/
Jayadevappa R, Malkowicz SB, Chhatre S, Johnson JC, Gallo JJ. The burden of depression in prostate cancer. Psycho-oncology. 2012 Dec [cited 2013 Sep 26];21(12):1338-1345.
Missouri Department of Mental Health. CPS Facts: Depression and Older Adults [Internet]. Jefferson City(MO): Missouri Department of Mental Health, [date unknown, cited 2013 Sep 26], 2 p. Available from: http://dmh.mo.gov/docs/mentalillness/elderlydepress.pdf
Oregon State University, Washington State University, University of Idaho. Depression in Later Life: Recognition and Treatment [Internet]. Corvallis(OR): Pacific Northwest Extension Publication; 2004 Jul [Published April 1990; revised July 2000; cited 2013 Sep 29]; 32 p. Available from: http://ir.library.oregonstate.edu/xmlui/bitstream/handle/1957/20713/pnw347.pdf
Cole MG, Dendukuri N. Risk factors for depression among elderly community subjects: a systematic review and meta-analysis. American Journal of Psychiatry [Internet]. 2003 Jun [cited 2013 Sep 29]; 160(6):1147-1156. Available from: http://ajp.psychiatryonline.org/article.aspx?articleid=176272
Kohn R, Levav I, Garcia ID, Machuca ME, Tamashiro R. Prevalence, risk factors and aging vulnerability for psychopathology following a natural disaster in a developing country. International Journal of Geriatric Psychiatry. 2005 Sep [cited 2013 Sep 29];20(9):835-841.
Pietrzak RH, Southwick SM, Tracy M, Galea S, Norris FH. Posttraumatic stress disorder, depression, and perceived needs for psychological care in older persons affected by Hurricane Ike. Journal of Affective Disorders [Internet]. 2012 Apr [cited 2013 Sep 30];138(1-2):96-103. Available from: http://www.ncbi.nlm.nih.gov/pmc/articles/PMC3306486/
Oriol W. Psychosocial Issues for Older Adults in Disasters [Internet]. Washington (DC): Emergency Services and Disaster Relief Branch, Center for Mental Health Services (CMHS), Substance Abuse and Mental Health Services Administration; 1999 [cited 2013 Sep 30]; DHHS Publication No. ESDRB SMA 99-3323. 79 p. Available from: http://store.samhsa.gov/shin/content/SMA99-3323/SMA99-3323.pdf
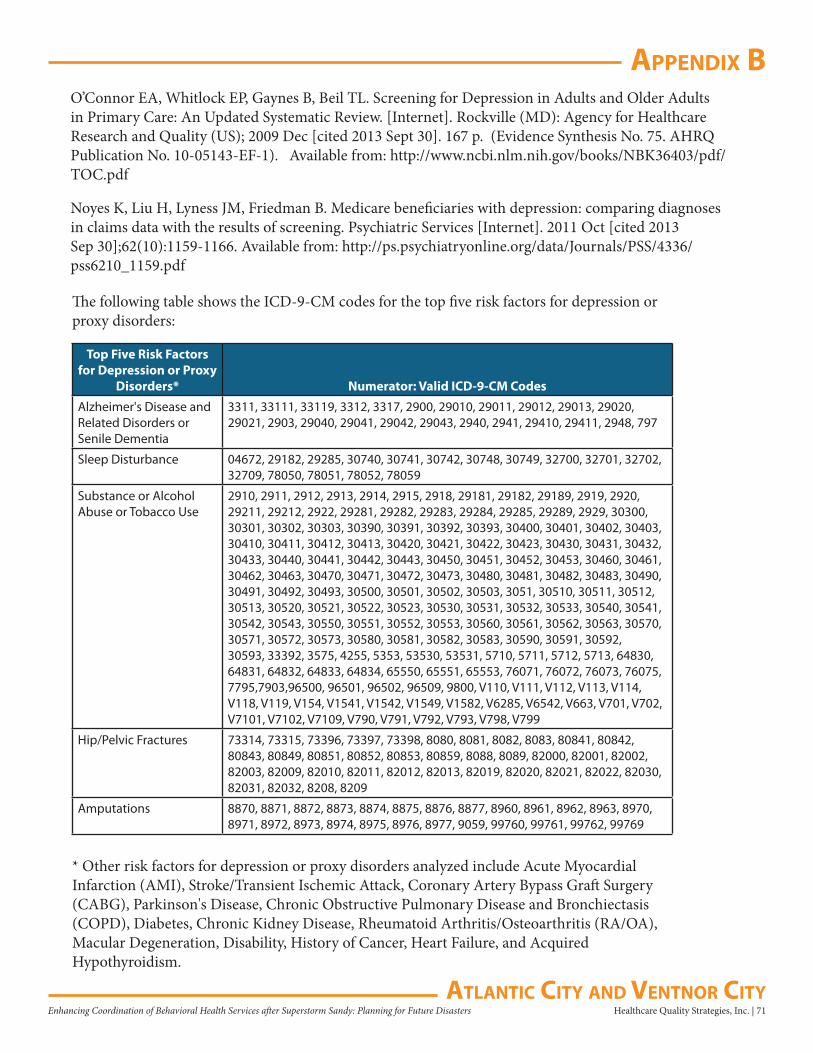
Healthcare Quality Strategies, Inc. | 71Enhancing Coordination of Behavioral Health Services after Superstorm Sandy: Planning for Future Disasters
aPPendix b
aTlanTiC CiTy and VenTnor CiTy
O’Connor EA, Whitlock EP, Gaynes B, Beil TL. Screening for Depression in Adults and Older Adults in Primary Care: An Updated Systematic Review. [Internet]. Rockville (MD): Agency for Healthcare Research and Quality (US); 2009 Dec [cited 2013 Sept 30]. 167 p. (Evidence Synthesis No. 75. AHRQ Publication No. 10-05143-EF-1). Available from: http://www.ncbi.nlm.nih.gov/books/NBK36403/pdf/TOC.pdf
Noyes K, Liu H, Lyness JM, Friedman B. Medicare beneficiaries with depression: comparing diagnoses in claims data with the results of screening. Psychiatric Services [Internet]. 2011 Oct [cited 2013 Sep 30];62(10):1159-1166. Available from: http://ps.psychiatryonline.org/data/Journals/PSS/4336/pss6210_1159.pdf
The following table shows the ICD-9-CM codes for the top five risk factors for depression or proxy disorders:
Top Five Risk Factors for Depression or Proxy
Disorders* Numerator: Valid ICD-9-CM Codes
Alzheimer's Disease and Related Disorders or Senile Dementia
3311, 33111, 33119, 3312, 3317, 2900, 29010, 29011, 29012, 29013, 29020, 29021, 2903, 29040, 29041, 29042, 29043, 2940, 2941, 29410, 29411, 2948, 797
Sleep Disturbance 04672, 29182, 29285, 30740, 30741, 30742, 30748, 30749, 32700, 32701, 32702, 32709, 78050, 78051, 78052, 78059
Substance or Alcohol Abuse or Tobacco Use
2910, 2911, 2912, 2913, 2914, 2915, 2918, 29181, 29182, 29189, 2919, 2920, 29211, 29212, 2922, 29281, 29282, 29283, 29284, 29285, 29289, 2929, 30300, 30301, 30302, 30303, 30390, 30391, 30392, 30393, 30400, 30401, 30402, 30403, 30410, 30411, 30412, 30413, 30420, 30421, 30422, 30423, 30430, 30431, 30432, 30433, 30440, 30441, 30442, 30443, 30450, 30451, 30452, 30453, 30460, 30461, 30462, 30463, 30470, 30471, 30472, 30473, 30480, 30481, 30482, 30483, 30490, 30491, 30492, 30493, 30500, 30501, 30502, 30503, 3051, 30510, 30511, 30512, 30513, 30520, 30521, 30522, 30523, 30530, 30531, 30532, 30533, 30540, 30541, 30542, 30543, 30550, 30551, 30552, 30553, 30560, 30561, 30562, 30563, 30570, 30571, 30572, 30573, 30580, 30581, 30582, 30583, 30590, 30591, 30592, 30593, 33392, 3575, 4255, 5353, 53530, 53531, 5710, 5711, 5712, 5713, 64830, 64831, 64832, 64833, 64834, 65550, 65551, 65553, 76071, 76072, 76073, 76075, 7795,7903,96500, 96501, 96502, 96509, 9800, V110, V111, V112, V113, V114, V118, V119, V154, V1541, V1542, V1549, V1582, V6285, V6542, V663, V701, V702, V7101, V7102, V7109, V790, V791, V792, V793, V798, V799
Hip/Pelvic Fractures 73314, 73315, 73396, 73397, 73398, 8080, 8081, 8082, 8083, 80841, 80842, 80843, 80849, 80851, 80852, 80853, 80859, 8088, 8089, 82000, 82001, 82002, 82003, 82009, 82010, 82011, 82012, 82013, 82019, 82020, 82021, 82022, 82030, 82031, 82032, 8208, 8209
Amputations 8870, 8871, 8872, 8873, 8874, 8875, 8876, 8877, 8960, 8961, 8962, 8963, 8970, 8971, 8972, 8973, 8974, 8975, 8976, 8977, 9059, 99760, 99761, 99762, 99769
* Other risk factors for depression or proxy disorders analyzed include Acute Myocardial Infarction (AMI), Stroke/Transient Ischemic Attack, Coronary Artery Bypass Graft Surgery (CABG), Parkinson's Disease, Chronic Obstructive Pulmonary Disease and Bronchiectasis (COPD), Diabetes, Chronic Kidney Disease, Rheumatoid Arthritis/Osteoarthritis (RA/OA), Macular Degeneration, Disability, History of Cancer, Heart Failure, and Acquired Hypothyroidism.
72 | Healthcare Quality Strategies, Inc. Enhancing Coordination of Behavioral Health Services after Superstorm Sandy: Planning for Future Disasters
aPPendix C
aTlanTiC CiTy and VenTnor CiTy
aPPendix C: uTilizaTion of ouTPaTienT MenTal healTh serViCes
Documentation and Technical NotesThe following defines the study population, the time frame, and the exclusion and inclusion criteria:
Data Source• New Jersey Medicare FFS Part A and Part B claims data and denominator file
Reference Time Period• Annual utilization comparing October 1, 2011 – September 30, 2012 to October 1, 2012 –
September 30, 2013• Annual utilization trend consists of eight points of data with rolling quarters (starting January 2011
and ending September 2013)• Quarterly utilization trend charts for depression screening contains data from January 1, 2012 to
September 30, 2013 and allows for the identification of new cases in a given quarter when compared to the prior year
Mapping Tool• QGIS Development Team, 2014, QGIS Geographic Information System. Open Source Geospatial
Foundation Project. http://qgis.osgeo.org• Source: ZIP code boundaries based on the 2013 U.S. Census Tiger Files
Denominator• Denominator was the sum of all eligible Medicare FFS beneficiaries who were in the CMS denominator
file during the measurement time frame• Eligible beneficiaries were computed after adjusting for total enrolled FFS days divided by the total
measurement days in the time frame• Where Medicare FFS enrolled days > 0
NumeratorUnique Medicare FFS beneficiaries with specific outpatient mental health service claims
Exclusions• HMO coverage period • Age <18 or >= 110• Eligible Medicare FFS days/total measurement days =0
ResourcesMore information on the definitions and uses of the outpatient mental health services highlighted in this profile can be located at http://www.medicarenhic.com/providers/pubs/REF-EDO-0012MentalHealthBillingGuide2013.pdf.
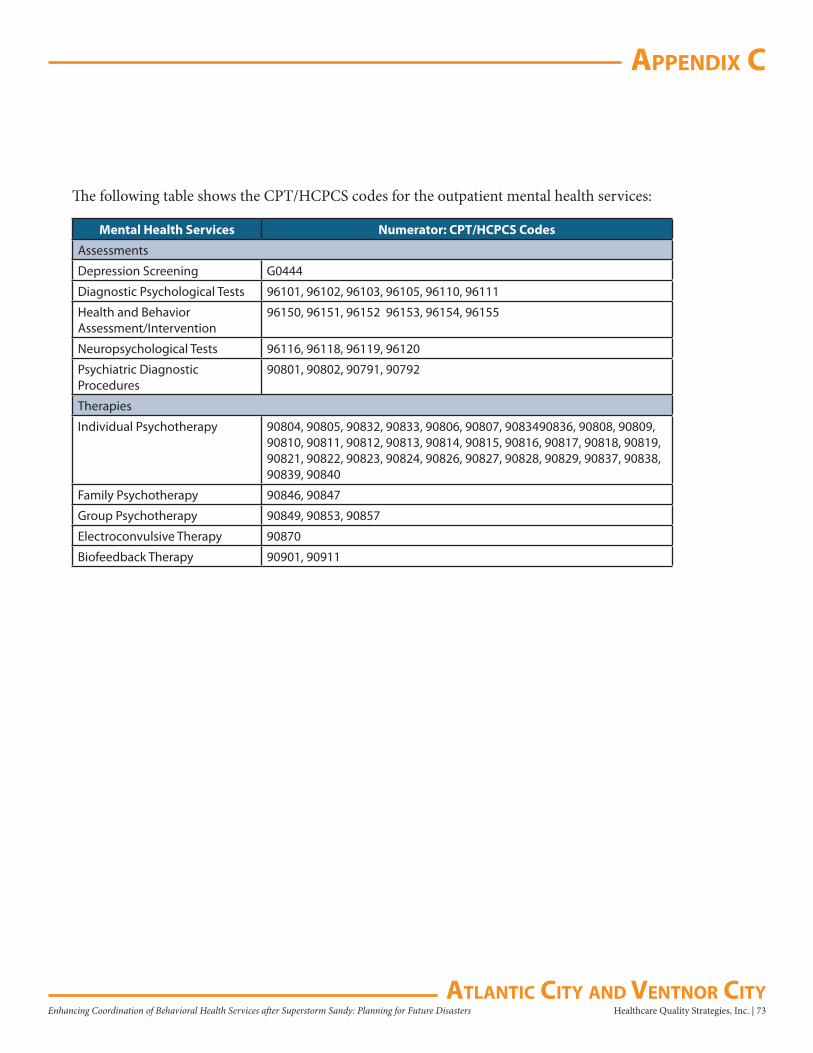
Healthcare Quality Strategies, Inc. | 73Enhancing Coordination of Behavioral Health Services after Superstorm Sandy: Planning for Future Disasters
aPPendix C
aTlanTiC CiTy and VenTnor CiTy
The following table shows the CPT/HCPCS codes for the outpatient mental health services:
Mental Health Services Numerator: CPT/HCPCS Codes
Assessments
Depression Screening G0444
Diagnostic Psychological Tests 96101, 96102, 96103, 96105, 96110, 96111
Health and Behavior Assessment/Intervention
96150, 96151, 96152 96153, 96154, 96155
Neuropsychological Tests 96116, 96118, 96119, 96120
Psychiatric Diagnostic Procedures
90801, 90802, 90791, 90792
Therapies
Individual Psychotherapy 90804, 90805, 90832, 90833, 90806, 90807, 9083490836, 90808, 90809, 90810, 90811, 90812, 90813, 90814, 90815, 90816, 90817, 90818, 90819, 90821, 90822, 90823, 90824, 90826, 90827, 90828, 90829, 90837, 90838, 90839, 90840
Family Psychotherapy 90846, 90847
Group Psychotherapy 90849, 90853, 90857
Electroconvulsive Therapy 90870
Biofeedback Therapy 90901, 90911
74 | Healthcare Quality Strategies, Inc. Enhancing Coordination of Behavioral Health Services after Superstorm Sandy: Planning for Future Disasters
aPPendix d
aTlanTiC CiTy and VenTnor CiTy
aPPendix d: uTilizaTion of serViCes – inPaTienT and oTher seTTings
Documentation and Technical NotesThe following defines the study population, the time frame, and the exclusion and inclusion criteria:
Data SourceNew Jersey Medicare FFS Part A claims data and denominator file
Reference Time Period• Annual utilization comparing October 1, 2011 – September 30, 2012 to October 1, 2012 –
September 30, 2013• Annual utilization trend consists of eight points of data with rolling quarters (starting January 2011
and ending September 2013)
Denominator• Denominator was the sum of all eligible Medicare FFS beneficiaries who were in the CMS denominator
file during the measurement time frame
• Eligible beneficiaries were computed after adjusting for total enrolled FFS days divided by the total measurement days in the time frame
• Where Medicare FFS enrolled days > 0
Exclusions• HMO coverage period
• Age <18 or >= 110
• Eligible Medicare FFS days/total measurement days =0
Utilization MeasureRefer to Appendix E.
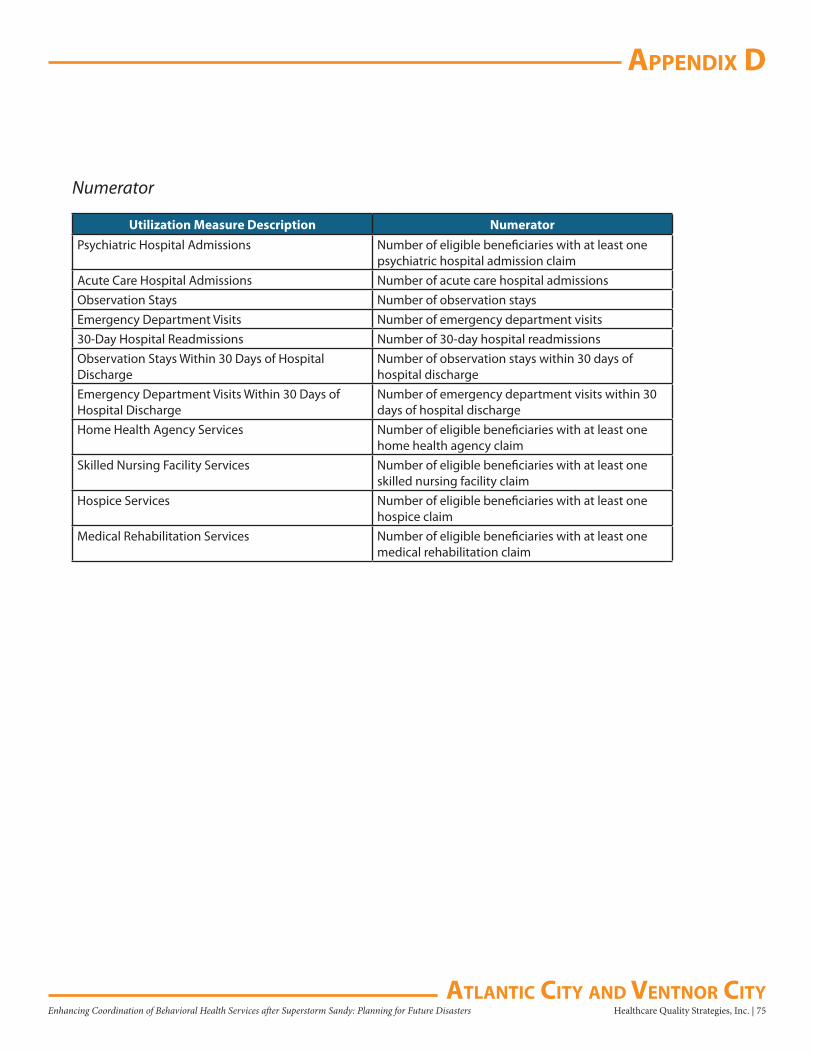
Healthcare Quality Strategies, Inc. | 75Enhancing Coordination of Behavioral Health Services after Superstorm Sandy: Planning for Future Disasters
aPPendix d
aTlanTiC CiTy and VenTnor CiTy
Numerator
Utilization Measure Description NumeratorPsychiatric Hospital Admissions Number of eligible beneficiaries with at least one
psychiatric hospital admission claimAcute Care Hospital Admissions Number of acute care hospital admissionsObservation Stays Number of observation staysEmergency Department Visits Number of emergency department visits30-Day Hospital Readmissions Number of 30-day hospital readmissionsObservation Stays Within 30 Days of Hospital Discharge
Number of observation stays within 30 days of hospital discharge
Emergency Department Visits Within 30 Days of Hospital Discharge
Number of emergency department visits within 30 days of hospital discharge
Home Health Agency Services Number of eligible beneficiaries with at least one home health agency claim
Skilled Nursing Facility Services Number of eligible beneficiaries with at least one skilled nursing facility claim
Hospice Services Number of eligible beneficiaries with at least one hospice claim
Medical Rehabilitation Services Number of eligible beneficiaries with at least one medical rehabilitation claim
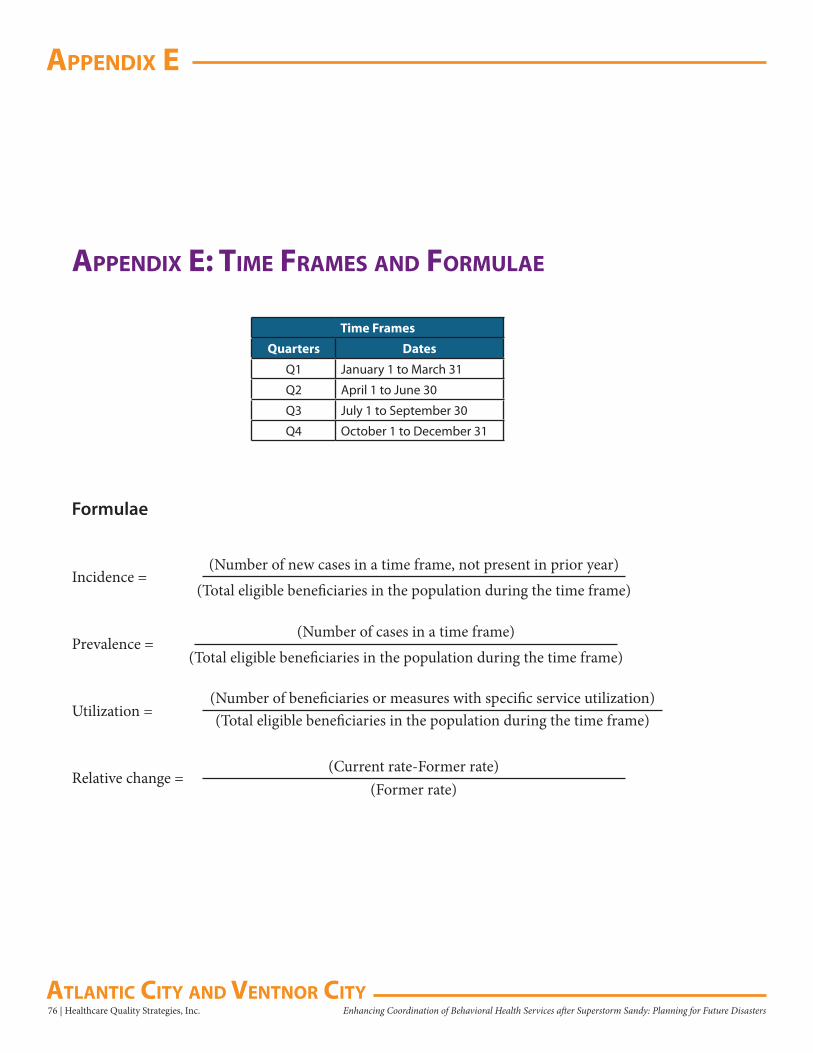
76 | Healthcare Quality Strategies, Inc. Enhancing Coordination of Behavioral Health Services after Superstorm Sandy: Planning for Future Disasters
aPPendix e
aTlanTiC CiTy and VenTnor CiTy
aPPendix e: TiMe fraMes and forMulae
Time Frames
Quarters Dates
Q1 January 1 to March 31
Q2 April 1 to June 30
Q3 July 1 to September 30
Q4 October 1 to December 31
Formulae
Incidence =(Number of new cases in a time frame, not present in prior year)
(Total eligible beneficiaries in the population during the time frame)
Prevalence =(Number of cases in a time frame)
(Total eligible beneficiaries in the population during the time frame)
Utilization =(Number of beneficiaries or measures with specific service utilization)(Total eligible beneficiaries in the population during the time frame)
Relative change =(Current rate-Former rate)
(Former rate)
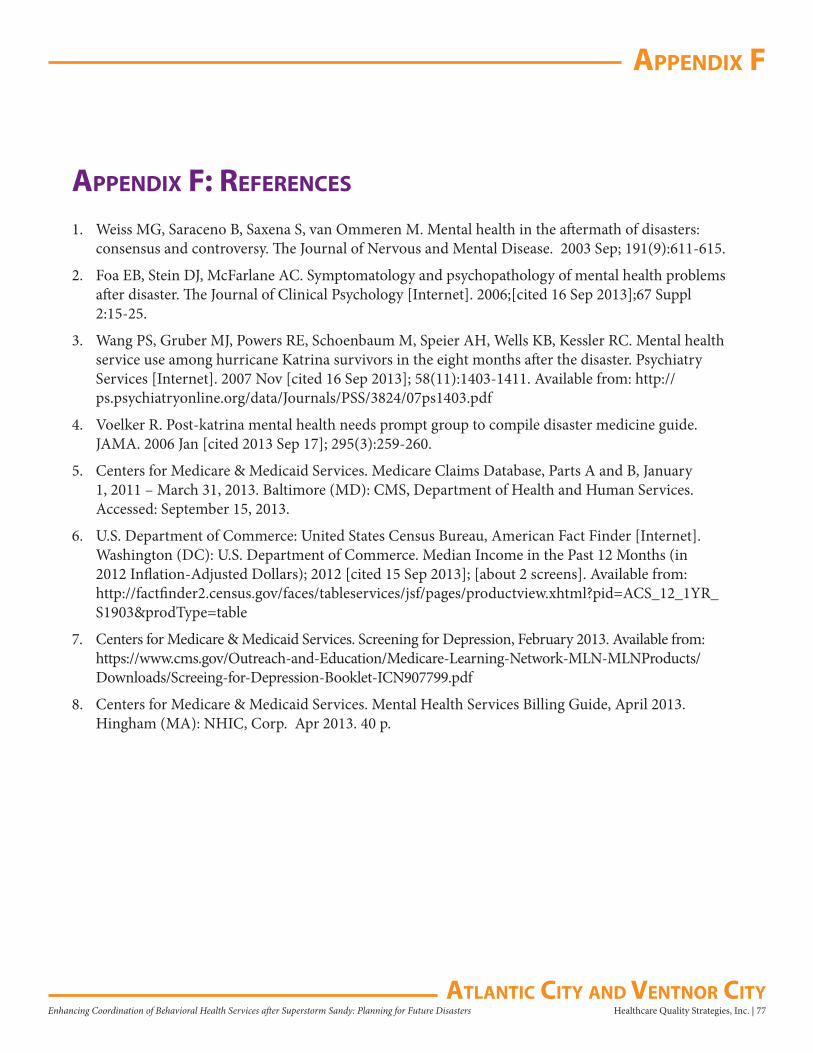
Healthcare Quality Strategies, Inc. | 77Enhancing Coordination of Behavioral Health Services after Superstorm Sandy: Planning for Future Disasters
aPPendix f
aTlanTiC CiTy and VenTnor CiTy
aPPendix f: referenCes
1. Weiss MG, Saraceno B, Saxena S, van Ommeren M. Mental health in the aftermath of disasters: consensus and controversy. The Journal of Nervous and Mental Disease. 2003 Sep; 191(9):611-615.
2. Foa EB, Stein DJ, McFarlane AC. Symptomatology and psychopathology of mental health problems after disaster. The Journal of Clinical Psychology [Internet]. 2006;[cited 16 Sep 2013];67 Suppl 2:15-25.
3. Wang PS, Gruber MJ, Powers RE, Schoenbaum M, Speier AH, Wells KB, Kessler RC. Mental health service use among hurricane Katrina survivors in the eight months after the disaster. Psychiatry Services [Internet]. 2007 Nov [cited 16 Sep 2013]; 58(11):1403-1411. Available from: http://ps.psychiatryonline.org/data/Journals/PSS/3824/07ps1403.pdf
4. Voelker R. Post-katrina mental health needs prompt group to compile disaster medicine guide. JAMA. 2006 Jan [cited 2013 Sep 17]; 295(3):259-260.
5. Centers for Medicare & Medicaid Services. Medicare Claims Database, Parts A and B, January 1, 2011 – March 31, 2013. Baltimore (MD): CMS, Department of Health and Human Services. Accessed: September 15, 2013.
6. U.S. Department of Commerce: United States Census Bureau, American Fact Finder [Internet]. Washington (DC): U.S. Department of Commerce. Median Income in the Past 12 Months (in 2012 Inflation-Adjusted Dollars); 2012 [cited 15 Sep 2013]; [about 2 screens]. Available from: http://factfinder2.census.gov/faces/tableservices/jsf/pages/productview.xhtml?pid=ACS_12_1YR_S1903&prodType=table
7. Centers for Medicare & Medicaid Services. Screening for Depression, February 2013. Available from: https://www.cms.gov/Outreach-and-Education/Medicare-Learning-Network-MLN-MLNProducts/Downloads/Screeing-for-Depression-Booklet-ICN907799.pdf
8. Centers for Medicare & Medicaid Services. Mental Health Services Billing Guide, April 2013. Hingham (MA): NHIC, Corp. Apr 2013. 40 p.
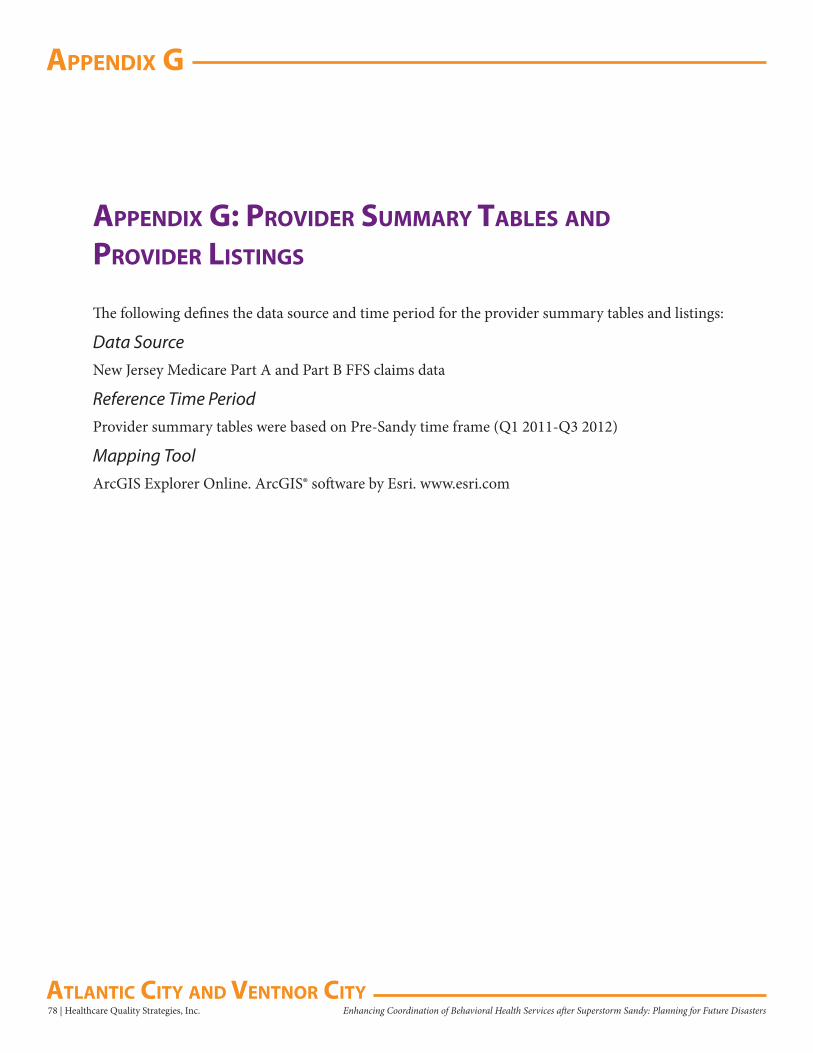
78 | Healthcare Quality Strategies, Inc. Enhancing Coordination of Behavioral Health Services after Superstorm Sandy: Planning for Future Disasters
aPPendix g
aTlanTiC CiTy and VenTnor CiTy
aPPendix g: ProVider suMMary Tables and ProVider lisTings
The following defines the data source and time period for the provider summary tables and listings:
Data SourceNew Jersey Medicare Part A and Part B FFS claims data
Reference Time PeriodProvider summary tables were based on Pre-Sandy time frame (Q1 2011-Q3 2012)
Mapping ToolArcGIS Explorer Online. ArcGIS® software by Esri. www.esri.com
Healthcare Quality Strategies, Inc. | 79Enhancing Coordination of Behavioral Health Services after Superstorm Sandy: Planning for Future Disasters
aPPendix g
aTlanTiC CiTy and VenTnor CiTy
Professional Type by Behavioral Health ServicesThe following defines the data source and time period for the provider summary tables and listings:
Data SourceNew Jersey Medicare FFS Part B claims data
Reference Time Period• Professional type of behavioral health service claims during October 1, 2011 – September 30, 2012 and
October 1, 2012 – September 30, 2013
Professional Type Credentials – Including, but not limited to:• Physicians: DO, MD
• Psychologists: PhD, PsyD, EdD
• Social Workers: MSW, LCSW
• Nurses: APN, RN, NP
• Others: Other

80 | Healthcare Quality Strategies, Inc. Enhancing Coordination of Behavioral Health Services after Superstorm Sandy: Planning for Future Disasters
aPPendix g
aTlanTiC CiTy and VenTnor CiTy
This Page Left Intentionally Blank
Healthcare Quality Strategies, Inc. | 81Enhancing Coordination of Behavioral Health Services after Superstorm Sandy: Planning for Future Disasters
index of figures
aTlanTiC CiTy and VenTnor CiTy
Executive SummaryFigure 1. Snapshot of Atlantic City and Ventnor City 10
DemographicsFigure 2. Total Medicare FFS Beneficiaries 11Figure 3. Percent of Medicare FFS Beneficiaries in the General Population in 2012 11Figure 4. Percent of Medicare FFS Beneficiary Population by Female 11Figure 5. Percent of Medicare FFS Beneficiary Population by Race 12Figure 6. Percent of Medicare FFS Beneficiary Population by Age 12Figure 7. 2012 Median Household Income (65 years and above) 12
Prevalence and IncidenceFigure 8. Percent Change of Prevalence of Selected Behavioral Health Conditions 13Figure 9. Quarterly New Incidence Trend of Selected Behavioral Health Conditions: Depression or Proxy Disorders 14Figure 10. Quarterly New Incidence Trend of Other Selected Behavioral Health Conditions 14Figure 11. Annual Prevalence Trend of Selected Behavioral Health Conditions: Depression
or Proxy Disorders 15Figure 12. Annual Prevalence Trend of Other Selected Behavioral Health Conditions 15Figure 13. Demographics of Depression or Proxy Disorders 16Figure 14. Depression or Proxy Disorders Rate by Demographic Group 17Figure 15. Depression or Proxy Disorders Rate by Race 18Figure 16. Depression or Proxy Disorders Rate by Gender 18Figure 17. Depression or Proxy Disorders Rate by Age Group 18Figure 18. Depression or Proxy Disorders (Annual Prevalence, Annual Trend, and
Percent Change) 19Figure 19. Quarterly New Incidence of Depression or Proxy Disorders 19Figure 20. Prevalence of Depression or Proxy Disorders in 10 Counties 20Figure 21. Atlantic County Prevalence of Depression or Proxy Disorders 21Figure 22. Depression (Annual Prevalence, Annual Trend, and Percent Change) 22Figure 23. Quarterly New Incidence of Depression 22Figure 24. Anxiety Disorders (Annual Prevalence, Annual Trend, and Percent Change) 23Figure 25. Quarterly New Incidence of Anxiety Disorders 23Figure 26. Adjustment Disorders (Annual Prevalence, Annual Trend, and Percent Change) 24Figure 27. Quarterly New Incidence of Adjustment Disorders 24Figure 28. PTSD (Annual Prevalence, Annual Trend, and Percent Change) 25Figure 29. Quarterly New Incidence of PTSD 25Figure 30. Alcohol or Substance Abuse (Annual Prevalence, Annual Trend, and
Percent Change) 26Figure 31. Quarterly New Incidence of Alcohol or Substance Abuse 26Figure 32. Substance Abuse Alone (Annual Prevalence, Annual Trend, and Percent Change) 27Figure 33. Quarterly New Incidence of Substance Abuse Alone 27
82 | Healthcare Quality Strategies, Inc. Enhancing Coordination of Behavioral Health Services after Superstorm Sandy: Planning for Future Disasters
index of figures
aTlanTiC CiTy and VenTnor CiTy
Figure 34. Suicide and Intentional Self-Inflicted Injury (Annual Prevalence, Annual Trend, and Percent Change) 28
Figure 35. Quarterly New Incidence of Suicide and Intentional Self-Inflicted Injury 28
Risk Factors for Depression or Proxy DisordersFigure 36. Percent Change of Prevalence of the Top Five Risk Factors of Depression or
Proxy Disorders 29Figure 37. Annual Prevalence Trend for Risk Factors of Depression or Proxy Disorders 30Figure 38. Annual Prevalence of Any of the Top Five Risk Factors for Depression or
Proxy Disorders 30Figure 39. Prevalence of Any of the Top Five Risk Factors for Depression or Proxy
Disorders in 10 Counties 31Figure 40. Atlantic County Prevalence of Any of the Top Five Risk Factors for
Depression or Proxy Disorders 32Figure 41. Annual Prevalence of Alzheimer’s Disease and Related Disorders or
Senile Dementia 33Figure 42. Annual Prevalence of Sleep Disturbance 33Figure 43. Annual Prevalence of Substance or Alcohol Abuse or Tobacco Use 33Figure 44. Annual Prevalence of Hip/Pelvic Fractures 34Figure 45. Annual Prevalence of Amputations 34
Utilization of Outpatient Behavioral Health ServicesAssessmentsFigure 46. Percent Change of Behavioral Health Service Utilization – Assessments 35Figure 47. Annual Utilization Trend of Behavioral Health Assessment Services 35Figure 48. Depression Screening (Annual Utilization, Annual Trend, and Percent Change) 36Figure 49. Quarterly Depression Screening 36Figure 50. Provider Location for Depression Screening Claims for Medicare
FFS Beneficiaries 37Figure 51. Depression Screening Claims for Medicare FFS Beneficiaries 37Figure 52. Depression Screening in 10 Counties 38Figure 53. Atlantic County Depression Screening 39Figure 54. Neuropsychological Tests (Annual Utilization, Annual Trend, and
Percent Change) 40Figure 55. Provider Location for Neuropsychological Tests Claims for Medicare FFS
Beneficiaries 41Figure 56. Neuropsychological Tests Claims for Medicare FFS Beneficiaries 41Figure 57. Psychiatric Diagnostic Procedures (Annual Utilization, Annual Trend, and
Percent Change) 42Figure 58. Provider Location for Psychiatric Diagnostic Procedures Claims for
Medicare FFS Beneficiaries 43Figure 59. Psychiatric Diagnostic Procedures Claims for Medicare FFS Beneficiaries 43
Healthcare Quality Strategies, Inc. | 83Enhancing Coordination of Behavioral Health Services after Superstorm Sandy: Planning for Future Disasters
index of figures
aTlanTiC CiTy and VenTnor CiTy
TherapiesFigure 60. Percent Change of Behavioral Health Service Utilization – Therapies 44Figure 61. Annual Utilization Trend of Behavioral Health Therapy Services 44Figure 62. Individual Psychotherapy (Annual Utilization, Annual Trend, and
Percent Change) 45Figure 63. Provider Location for Individual Psychotherapy Claims for Medicare FFS
Beneficiaries 46Figure 64. Individual Psychotherapy Claims for Medicare FFS Beneficiaries 46Figure 65. Family Psychotherapy (Annual Utilization and Annual Trend) 47Figure 66. Group Psychotherapy (Annual Utilization and Annual Trend) 48
Inpatient Health ServicesFigure 67. Percent Change of Inpatient Health Service Utilization 49Figure 68. Annual Utilization Trend of Inpatient Health Services 49Figure 69. Psychiatric Hospital Admissions (Annual Utilization, Annual Trend, and
Percent Change) 50Acute Care HospitalsFigure 70. Acute Care Hospital Admissions (Annual Utilization, Annual Trend, and
Percent Change) 51Figure 71. Observation Stays (Annual Utilization, Annual Trend, and Percent Change) 52Figure 72. Emergency Department Visits (Annual Utilization, Annual Trend, and
Percent Change) 53Within 30 Days of Acute Care Hospital DischargeFigure 73. Percent Change of Inpatient Health Service Utilization Within 30 Days
of Discharge 54Figure 74. Annual Utilization Trend of Inpatient Health Services Within 30 Days
of Discharge 54Figure 75. 30-Day Hospital Readmissions (Annual Utilization, Annual Trend, and
Percent Change) 55Figure 76. Observation Stays Within 30 Days of Discharge (Annual Utilization, Annual
Trend, and Percent Change) 56Figure 77. Emergency Department Visits Within 30 Days of Discharge (Annual
Utilization, Annual Trend, and Percent Change) 57Other SettingsFigure 78. Percent Change of Other Health Services Utilization 58Figure 79. Annual Utilization Trend in Other Health Services 58Figure 80. Home Health Agency Services (Annual Utilization, Annual Trend, and
Percent Change) 59Figure 81. Skilled Nursing Facility Services (Annual Utilization, Annual Trend, and
Percent Change) 60Figure 82. Hospice Services (Annual Utilization, Annual Trend, and Percent Change) 61Figure 83. Medical Rehabilitation Services (Annual Utilization, Annual Trend, and
Percent Change) 62

84 | Healthcare Quality Strategies, Inc. Enhancing Coordination of Behavioral Health Services after Superstorm Sandy: Planning for Future Disasters
index of figures
aTlanTiC CiTy and VenTnor CiTy
This page left intentionally blank

HQSI557 Cranbury Road, Suite 21
East Brunswick, NJ 08816T732-238-5570•F732-238-7766
www.hqsi.org