Embed Size (px)
Citation preview
on July 16, 2018http://rsif.royalsocietypublishing.org/Downloaded from
rsif.royalsocietypublishing.org
ResearchCite this article: Kolandaivelu K, O’Brien CC,
Shazly T, Edelman ER, Kolachalama VB. 2015
Enhancing physiologic simulations using
supervised learning on coarse mesh solutions.
J. R. Soc. Interface 12: 20141073.
http://dx.doi.org/10.1098/rsif.2014.1073
Received: 25 September 2014
Accepted: 15 January 2015
Subject Areas:bioengineering, biomedical engineering,
mathematical physics
Keywords:computational modelling, machine learning,
Gaussian process, nearest neighbours,
drug-coated balloons, drug-eluting stents
Author for correspondence:Vijaya B. Kolachalama
e-mail: [email protected]
Electronic supplementary material is available
at http://dx.doi.org/10.1098/rsif.2014.1073 or
via http://rsif.royalsocietypublishing.org.
& 2015 The Authors. Published by the Royal Society under the terms of the Creative Commons AttributionLicense http://creativecommons.org/licenses/by/4.0/, which permits unrestricted use, provided the originalauthor and source are credited.Enhancing physiologic simulations usingsupervised learning on coarse meshsolutions
Kumaran Kolandaivelu1,3, Caroline C. O’Brien1, Tarek Shazly4,Elazer R. Edelman1,2,3 and Vijaya B. Kolachalama1,5
1Institute for Medical Engineering and Science, and 2David H. Koch Institute for Integrative Cancer Research,Massachusetts Institute of Technology, Cambridge, MA 02139, USA3Cardiovascular Division, Brigham and Women’s Hospital, 75 Francis Street, Boston, MA 02115, USA4College of Engineering and Computing, University of South Carolina, Columbia, SC 29208, USA5Charles Stark Draper Laboratory, 555 Technology Square, Cambridge, MA 02139, USA
Computational modelling of physical and biochemical processes has emerged
as a means of evaluating medical devices, offering new insights that explain
current performance, inform future designs and even enable personalized
use. Yet resource limitations force one to compromise with reduced order
computational models and idealized assumptions that yield either qualitative
descriptions or approximate, quantitative solutions to problems of interest.
Considering endovascular drug delivery as an exemplary scenario, we used
a supervised machine learning framework to process data generated from
low fidelity coarse meshes and predict high fidelity solutions on refined
mesh configurations. We considered two models simulating drug delivery
to the arterial wall: (i) two-dimensional drug-coated balloons and (ii) three-
dimensional drug-eluting stents. Simulations were performed on compu-
tational mesh configurations of increasing density. Supervised learners
based on Gaussian process modelling were constructed from combinations
of coarse mesh setting solutions of drug concentrations and nearest neigh-
bourhood distance information as inputs, and higher fidelity mesh solutions
as outputs. These learners were then used as computationally inexpensive sur-
rogates to extend predictions using low fidelity information to higher levels of
mesh refinement. The cross-validated, supervised learner-based predictions
improved fidelity as compared with computational simulations performed
at coarse level meshes—a result consistent across all outputs and compu-
tational models considered. Supervised learning on coarse mesh solutions
can augment traditional physics-based modelling of complex physiologic
phenomena. By obtaining efficient solutions at a fraction of the computational
cost, this framework has the potential to transform how modelling approaches
can be applied in the evaluation of medical technologies and their real-time
administration in an increasingly personalized fashion.
1. IntroductionEmerging applications in clinical medicine and medical device design are just
beginning to embrace the potential of computational modelling [1,2]. In the
face of increasing interest by medical device companies, regulatory agencies
[3] and clinicians [4,5], it is critical that we find approaches that yield accurate
information quickly—whether it is in the optimization of device design over a
wide parameter space [6–9], to better understand device and implant perform-
ance in patient-specific environments [10–16], or even to perform virtual
feasibility studies for procedural planning (i.e. implantation of stents, endovas-
cular grafts, heart valves, bioprosthetics, etc.) [17–20]. Particularly in clinical
applications, speed and efficiency are paramount as results must be provided
mural surface
(a) (b)
mural surface
L
DR
W
perivascular wall
perivascular wall symmetry plane
Tflow direction
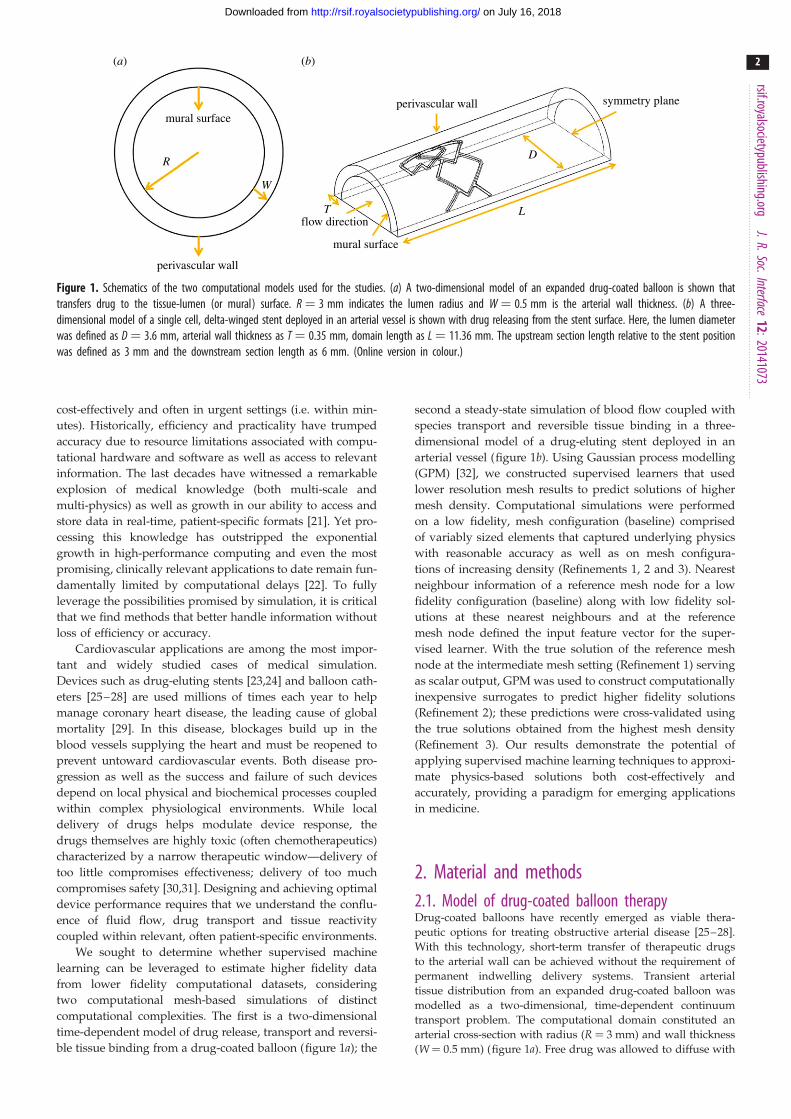
Figure 1. Schematics of the two computational models used for the studies. (a) A two-dimensional model of an expanded drug-coated balloon is shown thattransfers drug to the tissue-lumen (or mural) surface. R ¼ 3 mm indicates the lumen radius and W ¼ 0.5 mm is the arterial wall thickness. (b) A three-dimensional model of a single cell, delta-winged stent deployed in an arterial vessel is shown with drug releasing from the stent surface. Here, the lumen diameterwas defined as D ¼ 3.6 mm, arterial wall thickness as T ¼ 0.35 mm, domain length as L ¼ 11.36 mm. The upstream section length relative to the stent positionwas defined as 3 mm and the downstream section length as 6 mm. (Online version in colour.)
rsif.royalsocietypublishing.orgJ.R.Soc.Interface
12:20141073
2
on July 16, 2018http://rsif.royalsocietypublishing.org/Downloaded from
cost-effectively and often in urgent settings (i.e. within min-
utes). Historically, efficiency and practicality have trumped
accuracy due to resource limitations associated with compu-
tational hardware and software as well as access to relevant
information. The last decades have witnessed a remarkable
explosion of medical knowledge (both multi-scale and
multi-physics) as well as growth in our ability to access and
store data in real-time, patient-specific formats [21]. Yet pro-
cessing this knowledge has outstripped the exponential
growth in high-performance computing and even the most
promising, clinically relevant applications to date remain fun-
damentally limited by computational delays [22]. To fully
leverage the possibilities promised by simulation, it is critical
that we find methods that better handle information without
loss of efficiency or accuracy.
Cardiovascular applications are among the most impor-
tant and widely studied cases of medical simulation.
Devices such as drug-eluting stents [23,24] and balloon cath-
eters [25–28] are used millions of times each year to help
manage coronary heart disease, the leading cause of global
mortality [29]. In this disease, blockages build up in the
blood vessels supplying the heart and must be reopened to
prevent untoward cardiovascular events. Both disease pro-
gression as well as the success and failure of such devices
depend on local physical and biochemical processes coupled
within complex physiological environments. While local
delivery of drugs helps modulate device response, the
drugs themselves are highly toxic (often chemotherapeutics)
characterized by a narrow therapeutic window—delivery of
too little compromises effectiveness; delivery of too much
compromises safety [30,31]. Designing and achieving optimal
device performance requires that we understand the conflu-
ence of fluid flow, drug transport and tissue reactivity
coupled within relevant, often patient-specific environments.
We sought to determine whether supervised machine
learning can be leveraged to estimate higher fidelity data
from lower fidelity computational datasets, considering
two computational mesh-based simulations of distinct
computational complexities. The first is a two-dimensional
time-dependent model of drug release, transport and reversi-
ble tissue binding from a drug-coated balloon (figure 1a); the
second a steady-state simulation of blood flow coupled with
species transport and reversible tissue binding in a three-
dimensional model of a drug-eluting stent deployed in an
arterial vessel (figure 1b). Using Gaussian process modelling
(GPM) [32], we constructed supervised learners that used
lower resolution mesh results to predict solutions of higher
mesh density. Computational simulations were performed
on a low fidelity, mesh configuration (baseline) comprised
of variably sized elements that captured underlying physics
with reasonable accuracy as well as on mesh configura-
tions of increasing density (Refinements 1, 2 and 3). Nearest
neighbour information of a reference mesh node for a low
fidelity configuration (baseline) along with low fidelity sol-
utions at these nearest neighbours and at the reference
mesh node defined the input feature vector for the super-
vised learner. With the true solution of the reference mesh
node at the intermediate mesh setting (Refinement 1) serving
as scalar output, GPM was used to construct computationally
inexpensive surrogates to predict higher fidelity solutions
(Refinement 2); these predictions were cross-validated using
the true solutions obtained from the highest mesh density
(Refinement 3). Our results demonstrate the potential of
applying supervised machine learning techniques to approxi-
mate physics-based solutions both cost-effectively and
accurately, providing a paradigm for emerging applications
in medicine.
2. Material and methods2.1. Model of drug-coated balloon therapyDrug-coated balloons have recently emerged as viable thera-
peutic options for treating obstructive arterial disease [25–28].
With this technology, short-term transfer of therapeutic drugs
to the arterial wall can be achieved without the requirement of
permanent indwelling delivery systems. Transient arterial
tissue distribution from an expanded drug-coated balloon was
modelled as a two-dimensional, time-dependent continuum
transport problem. The computational domain constituted an
arterial cross-section with radius (R ¼ 3 mm) and wall thickness
(W ¼ 0.5 mm) (figure 1a). Free drug was allowed to diffuse with
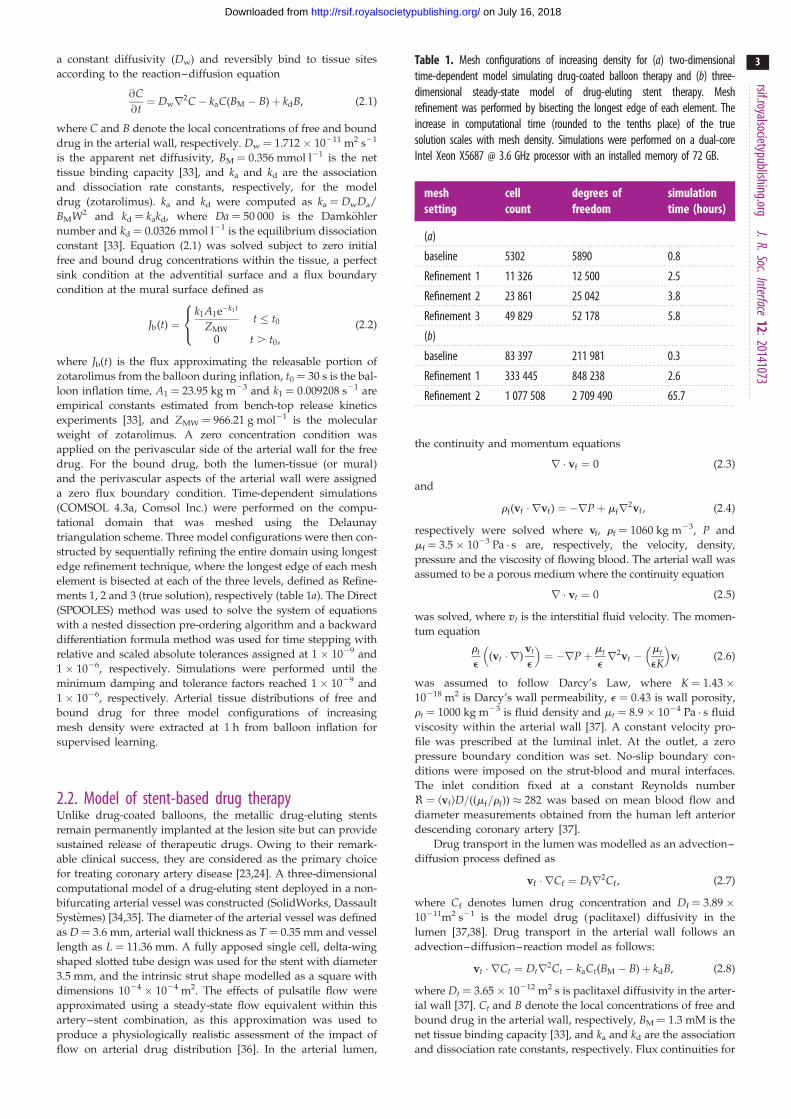
Table 1. Mesh configurations of increasing density for (a) two-dimensionaltime-dependent model simulating drug-coated balloon therapy and (b) three-dimensional steady-state model of drug-eluting stent therapy. Meshrefinement was performed by bisecting the longest edge of each element. Theincrease in computational time (rounded to the tenths place) of the truesolution scales with mesh density. Simulations were performed on a dual-coreIntel Xeon X5687 @ 3.6 GHz processor with an installed memory of 72 GB.
meshsetting
cellcount
degrees offreedom
simulationtime (hours)
(a)
baseline 5302 5890 0.8
Refinement 1 11 326 12 500 2.5
Refinement 2 23 861 25 042 3.8
Refinement 3 49 829 52 178 5.8
(b)
baseline 83 397 211 981 0.3
Refinement 1 333 445 848 238 2.6
Refinement 2 1 077 508 2 709 490 65.7
rsif.royalsocietypublishing.orgJ.R.Soc.Interface
12:20141073
3
on July 16, 2018http://rsif.royalsocietypublishing.org/Downloaded from
a constant diffusivity (Dw) and reversibly bind to tissue sites
according to the reaction–diffusion equation
@C@t¼ Dwr2C� kaC(BM � B)þ kdB, (2:1)
where C and B denote the local concentrations of free and bound
drug in the arterial wall, respectively. Dw ¼ 1.712 � 10211 m2 s21
is the apparent net diffusivity, BM ¼ 0.356 mmol l21 is the net
tissue binding capacity [33], and ka and kd are the association
and dissociation rate constants, respectively, for the model
drug (zotarolimus). ka and kd were computed as ka ¼ DwDa/
BMW2 and kd ¼ kakd, where Da ¼ 50 000 is the Damkohler
number and kd ¼ 0.0326 mmol l21 is the equilibrium dissociation
constant [33]. Equation (2.1) was solved subject to zero initial
free and bound drug concentrations within the tissue, a perfect
sink condition at the adventitial surface and a flux boundary
condition at the mural surface defined as
Jb(t) ¼k1A1e�k1t
ZMWt � t0
0 t . t0,
8<: (2:2)
where Jb(t) is the flux approximating the releasable portion of
zotarolimus from the balloon during inflation, t0 ¼ 30 s is the bal-
loon inflation time, A1 ¼ 23.95 kg m23 and k1 ¼ 0.009208 s21 are
empirical constants estimated from bench-top release kinetics
experiments [33], and ZMW ¼ 966.21 g mol21 is the molecular
weight of zotarolimus. A zero concentration condition was
applied on the perivascular side of the arterial wall for the free
drug. For the bound drug, both the lumen-tissue (or mural)
and the perivascular aspects of the arterial wall were assigned
a zero flux boundary condition. Time-dependent simulations
(COMSOL 4.3a, Comsol Inc.) were performed on the compu-
tational domain that was meshed using the Delaunay
triangulation scheme. Three model configurations were then con-
structed by sequentially refining the entire domain using longest
edge refinement technique, where the longest edge of each mesh
element is bisected at each of the three levels, defined as Refine-
ments 1, 2 and 3 (true solution), respectively (table 1a). The Direct
(SPOOLES) method was used to solve the system of equations
with a nested dissection pre-ordering algorithm and a backward
differentiation formula method was used for time stepping with
relative and scaled absolute tolerances assigned at 1 � 1029 and
1 � 1026, respectively. Simulations were performed until the
minimum damping and tolerance factors reached 1 � 1029 and
1 � 1026, respectively. Arterial tissue distributions of free and
bound drug for three model configurations of increasing
mesh density were extracted at 1 h from balloon inflation for
supervised learning.
2.2. Model of stent-based drug therapyUnlike drug-coated balloons, the metallic drug-eluting stents
remain permanently implanted at the lesion site but can provide
sustained release of therapeutic drugs. Owing to their remark-
able clinical success, they are considered as the primary choice
for treating coronary artery disease [23,24]. A three-dimensional
computational model of a drug-eluting stent deployed in a non-
bifurcating arterial vessel was constructed (SolidWorks, Dassault
Systemes) [34,35]. The diameter of the arterial vessel was defined
as D ¼ 3.6 mm, arterial wall thickness as T ¼ 0.35 mm and vessel
length as L ¼ 11.36 mm. A fully apposed single cell, delta-wing
shaped slotted tube design was used for the stent with diameter
3.5 mm, and the intrinsic strut shape modelled as a square with
dimensions 1024 � 1024 m2. The effects of pulsatile flow were
approximated using a steady-state flow equivalent within this
artery–stent combination, as this approximation was used to
produce a physiologically realistic assessment of the impact of
flow on arterial drug distribution [36]. In the arterial lumen,
the continuity and momentum equations
r � vf ¼ 0 (2:3)
and
rf(vf � rvf) ¼ �rPþ mfr2vf , (2:4)
respectively were solved where vf, rf ¼ 1060 kg m23, P and
mf ¼ 3.5 � 1023 Pa . s are, respectively, the velocity, density,
pressure and the viscosity of flowing blood. The arterial wall was
assumed to be a porous medium where the continuity equation
r � vt ¼ 0 (2:5)
was solved, where vt is the interstitial fluid velocity. The momen-
tum equation
rt
e(vt � r)
vt
e
� �¼ �rPþ mt
er2vt �
mt
eK
� �vt (2:6)
was assumed to follow Darcy’s Law, where K ¼ 1.43 �10218 m2 is Darcy’s wall permeability, e ¼ 0.43 is wall porosity,
rt ¼ 1000 kg m23 is fluid density and mt ¼ 8.9 � 1024 Pa . s fluid
viscosity within the arterial wall [37]. A constant velocity pro-
file was prescribed at the luminal inlet. At the outlet, a zero
pressure boundary condition was set. No-slip boundary con-
ditions were imposed on the strut-blood and mural interfaces.
The inlet condition fixed at a constant Reynolds number
< ¼ kvflD=((mf=rf)) � 282 was based on mean blood flow and
diameter measurements obtained from the human left anterior
descending coronary artery [37].
Drug transport in the lumen was modelled as an advection–
diffusion process defined as
vf � rCf ¼ Dfr2Cf , (2:7)
where Cf denotes lumen drug concentration and Df ¼ 3.89 �10211m2 s21 is the model drug (paclitaxel) diffusivity in the
lumen [37,38]. Drug transport in the arterial wall follows an
advection–diffusion–reaction model as follows:
vt � rCt ¼ Dtr2Ct � kaCt(BM � B)þ kdB, (2:8)
where Dt ¼ 3.65 � 10212 m2 s is paclitaxel diffusivity in the arter-
ial wall [37]. Ct and B denote the local concentrations of free and
bound drug in the arterial wall, respectively, BM ¼ 1.3 mM is the
net tissue binding capacity [33], and ka and kd are the association
and dissociation rate constants, respectively. Flux continuities for
(a) (b)
Figure 2. Schematic representing a finite number of nearest neighbours (denoted in green) that were extracted for a specific node (denoted in red) on the com-putational domains for the model simulating drug-coated balloon therapy (a) and the one simulating drug-eluting stent therapy (b). Computational mesh nodeswere denoted in blue.
rsif.royalsocietypublishing.orgJ.R.Soc.Interface
12:20141073
4
on July 16, 2018http://rsif.royalsocietypublishing.org/Downloaded from
drug transport were maintained at the mural interface. ka and kd
were computed as ka ¼ DtDa/BMT2 and kd ¼ kaKd, where
Da ¼ 2700 is the Damkohler number and kd ¼ 0.136 mM is
the equilibrium dissociation constant for paclitaxel [33].
A finite-element solver (COMSOL 4.3a, Comsol Inc.) was used
to perform the coupled flow and drug transport simulations. The
three-dimensional computational domain was discretized using
tetrahedral control volumes with a linear shape function into an
initial mesh (baseline). The mesh density was highest near the
strut and the mural surface and then decreased towards the centre-
line of the lumen. Sequential mesh refinement using the longest
edge bisection method was then performed to create cases with
refined mesh densities (table 1b). An open boundary condition
for drug concentration was applied at the inlet and the outlet of
the arterial lumen. An impermeable boundary condition was
established at the perivascular aspects of the model vessel. Stent
drug release was simulated using a Dirichlet boundary condition
of unit concentration. For the bound drug, the intramural and
the perivascular aspects of the arterial wall, tissue inlet and
tissue outlet were all assigned a zero flux boundary condition.
Symmetry boundary conditions were exploited on the model geo-
metry as the stent location was far from the lumen centreline. The
physiologic rates of luminal blood flow coupled with transport of
low diffusive drugs generate high Peclet numbers within the com-
putational domain. An upwind Petrov–Galerkin streamline
diffusion formulation was therefore enforced with full residual to
stabilize the governing equations. Simulations were performed
for computational configurations of increasing mesh densities
and until there was a 1 � 1029 reduction in the mass transport
residuals for each case. The solutions and mesh information for
all cases were subsequently processed for supervised learning.
2.3. Supervised learning frameworkSupervised learning is a branch of machine learning where func-
tions are inferred from labelled training data comprising a set of
variables called inputs and their corresponding outputs. The out-
puts can be qualitative/categorical or quantitative in nature, with
the corresponding learning problem denoted as ‘classification’ or
‘regression’, respectively [39,40]. In this paper, a construct for the
training data defined by an input vector x [ Rp trained with a
scalar output y(x) was used for supervised learning. Numerical
solutions on the mesh configurations of increasing density fol-
lowed by computation of the pairwise Euclidean distances for
each node’s nearest neighbours (figure 2a,b) within each compu-
tational mesh configuration were obtained [41]. During model
training, each node (xi) and the nearest neighbour (xj) have a
pairwise distance
dij ¼ffiffiffiffiffiffiffiffiffiffiffiffiffiffiffiffiffiffiffiffiffiffiffiffiffiffiffiffiffiffiffiffiffiffi(xi � xj)(xi � xj)
0q
, (2:9)
for the baseline mesh configuration. Note that j [ [1, 2, . . . , J],where J denotes the number of nearest neighbours. These pair-
wise distances along with the corresponding output for the
baseline mesh configuration
y0J ¼ [y0(x1), y0(x2), . . . , y0(xJ)], (2:10)
were included as part of the input feature space
xi ¼ {diJ , y0(xi), y0J }, where diJ ¼ [di1,di2, . . . ,diJ] with y1(xi) as the
output of interest for training the supervised learner. A standard
cross-validation procedure (k-fold, k ¼ 5) was used to determine
the fidelity of the trained supervised model. This procedure was
repeated over s shuffles (s ¼ 10) to demonstrate consistency
within model training. Average values of the root mean square
error (RMSE) over the shuffles were computed to compare
model predictions with the true physics-based solution.
The prediction phase then involves determining by2(xi) using
the trained model and the test data xi ¼ {diJ , y1(xi), y1J }, where
y1J ¼ [y1(x1), y1(x2), . . . , y1(xJ)]. Using the same modelling
construct, two other neighbourhood distance metrics ‘mahalano-
bis’ [42] and ‘cityblock’ were explored and their respective RMSE
values evaluated (see the electronic supplementary material for
more details).
rsif.royalsocietypublishing.orgJ.R.Soc.Interface
12:20141073
5
on July 16, 2018http://rsif.royalsocietypublishing.org/Downloaded from
2.4. Gaussian process modellingA Bayesian approach to GPM was used to train the model
for a given set of l input vectors X ¼ [x1, x2, . . . , xl] [ Rq�l,
where q ¼ 2J þ 1, with the corresponding output values
y ¼ [y1, y2, . . . , yl] [ Rl assumed to be available. Using the
learned model, output y(x) can be predicted for a new point x
[43,44]. The Gaussian process model can be compactly written as
Y(x) ¼ bþ Z(x), (2:11)
where b is an unknown hyperparameter and Z(x) is a Gaussian
stochastic process with zero-mean and covariance
Cov(Z(x), Z(x0)) ¼ s2zR(x, x0), (2:12)
where R(x,x0) is a correlation function that can be tuned to the
data and s2z is the process variance. A commonly used choice
of correlation function is the stationary family which obeys the
product correlation rule [45].
R(x, x0) ¼Yp
j¼1
exp (� ujjxj � x0 jj pj ), (2:13)
where uj � 0 and 0 , pj � 2 are the hyperparameters. We select
pj ¼ 2 such that the underlying function being modelled is
smooth and infinitely differentiable.
In the Bayesian approach to data modelling, two levels of
inferences are present. The first level is to infer the parameters
given the data and defined using the Bayes’ theorem as
P(uj, b, pjjX, y) ¼P(X, yjuj, b, pj)P(uj, b, pj)
P(X, y), (2:14)
where P(uj,b,pjjX,y) is the posterior probability of the parameters,
P(X,yjuj,b,pj) is the likelihood, P(uj,b,pj) is the prior (assumed to
be Gaussian) information about the parameters and P(X,y) is a
normalizing constant called the evidence. Note that Gaussian
processes are straightforward ways of defining prior distribu-
tions for regression and classification problems [46]. Once the
hyperparameters are estimated, the second level of inferencing
uses these values to estimate y(x) for a new feature vector x.
Because of the prior, the observed outputs are realizations of a
Gaussian random field, and therefore, we see that the posterior
distribution (P(y(x)jX,y,uj,b,pj)) of y(x) is also Gaussian [47], i.e.
Y(x)jy � N (bY(x), s2z C(x, x0)). The posterior mean and covariance
can be computed as
bY(x) ¼ bþ r(x)TR�1(y� 1bb) (2:15)
and
C(x, x0) ¼ s2z (R(x, x0)� r(x)TR�1r(x0)), (2:16)
where R [ Rl�l is the correlation matrix computed using the
training points; the ijth element of this matrix is computed as
Rij ¼ R(xi,x j). r(x) ¼ [R(x, x1), R(x, x2), . . . , R(x, xl)] [ Rl is the
correlation between the new point x and the training points,
and 1 ¼ [1, 1, . . . , 1] [ Rl [43,47].
Maximum-likelihood estimation (MLE) was used to compute
the hyperparameters u ¼ fujg, j ¼ 1, 2, . . . , q, b, and s2z defined in
equation (2.12). After dropping the constant terms that do not
depend on the hyperparameters, the log-likelihood function
becomes
L(u, b, s2z ) ¼ � 1
2l lns2
z þ ln jRj þ 1
s2z
(y� 1b)TR�1(y� 1b)
� �:
(2:17)
Given the maximum-likelihood estimate of u, the parameters
b and s2z were estimated as
bb ¼ (1TR�11)�11TR�1y (2:18)
and
cs2z ¼
1
l(y� 1b)TR�1(y� 1b): (2:19)
The log-likelihood function can be rewritten using equations
(2.17)–(2.19) such that the elements of u are the only unknown
hyperparameters. These hyperparameters were estimated using
the DIRECT global optimization algorithm [48]. Refer to the
electronic supplementary material for more details.
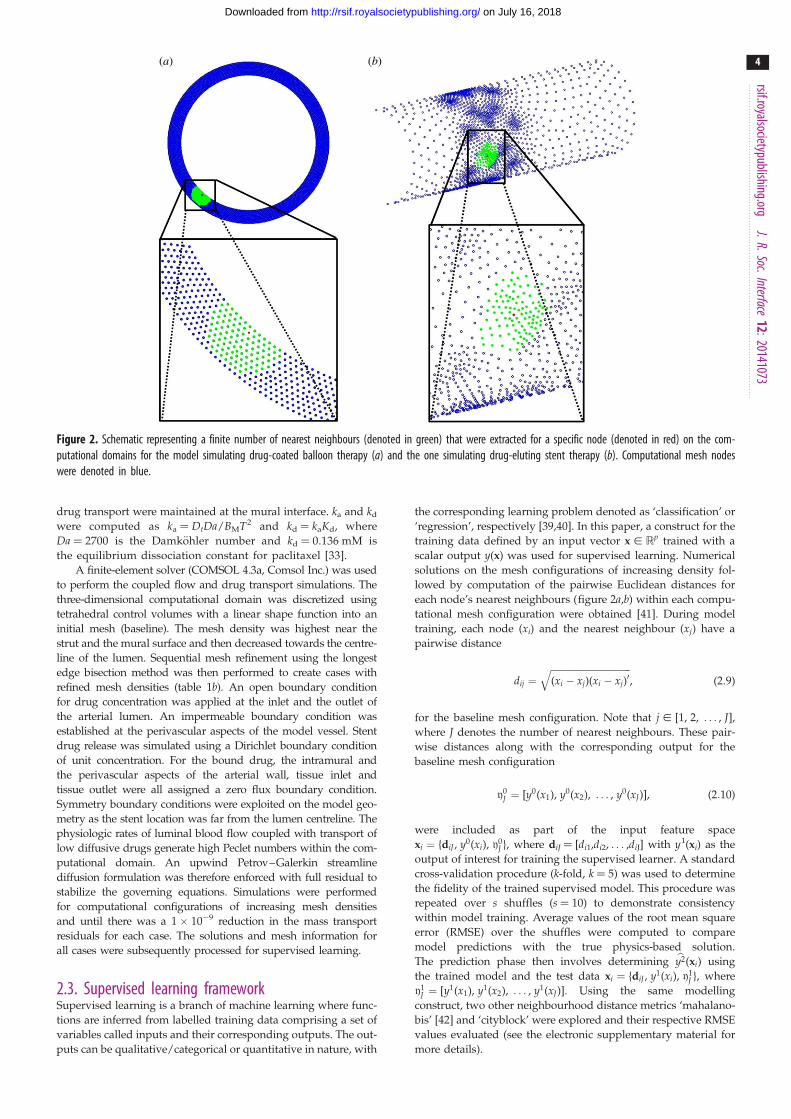
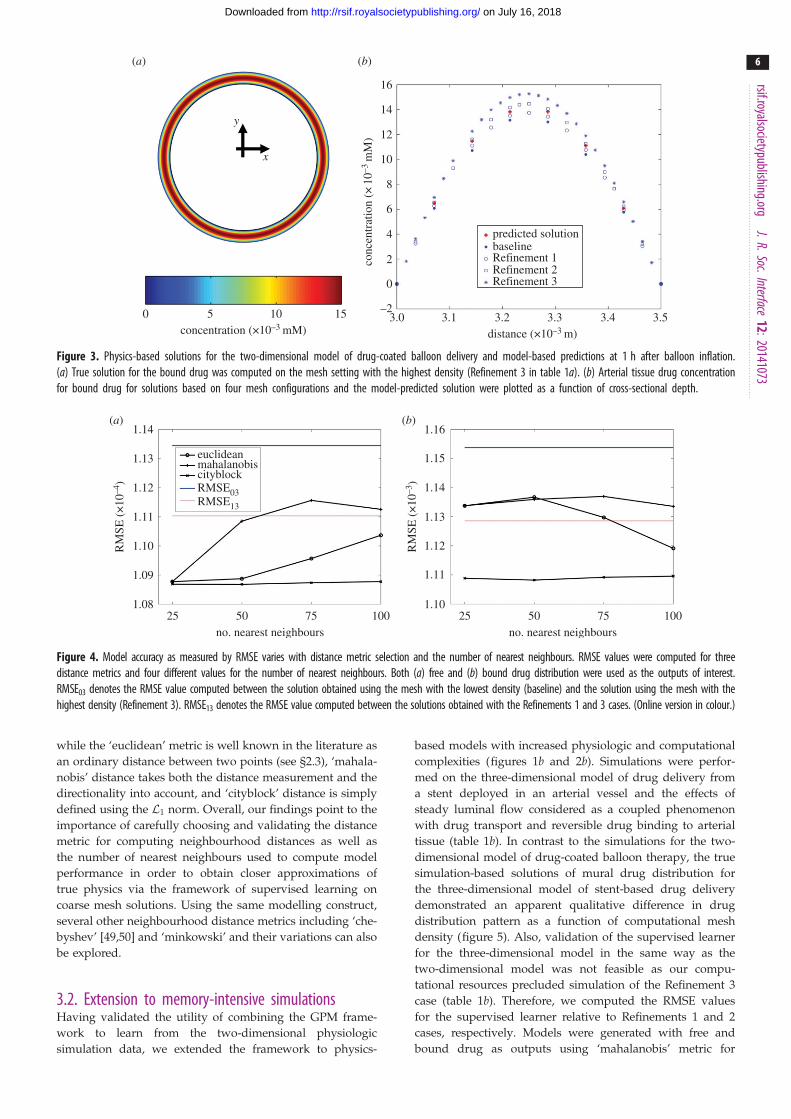
3. ResultsWe used GPM to determine whether the data-driven model-
ling framework can reduce computational time while
maintaining accurate solutions to problems of interest. For
the case of drug-coated balloon therapy, two-dimensional
physics-based models simulating drug transport into the
arterial tissue followed by reversible binding predicted arter-
ial distribution patterns of free and bound drug for four mesh
configurations (table 1a). GPM-based predictions for free and
bound arterial drug concentrations qualitatively resembled
the true solutions obtained on the two-dimensional time-
dependent model with the highest mesh density (figure 3aand electronic supplementary material, figure S1a). More
specifically, the supervised learner trained using information
at the baseline configuration and predicted using Refinement
1 settings generated results that were closer to the true sol-
ution (defined by Refinement 3) than the respective true
solution at Refinement 2 (figure 3b and electronic supplemen-
tary material, figure S1b). Note that for these cases, the
‘cityblock’ metric was used to compute 50 nearest neighbour
distances for the supervised learner-derived predictions of
arterial bound and free drug concentrations, respectively.
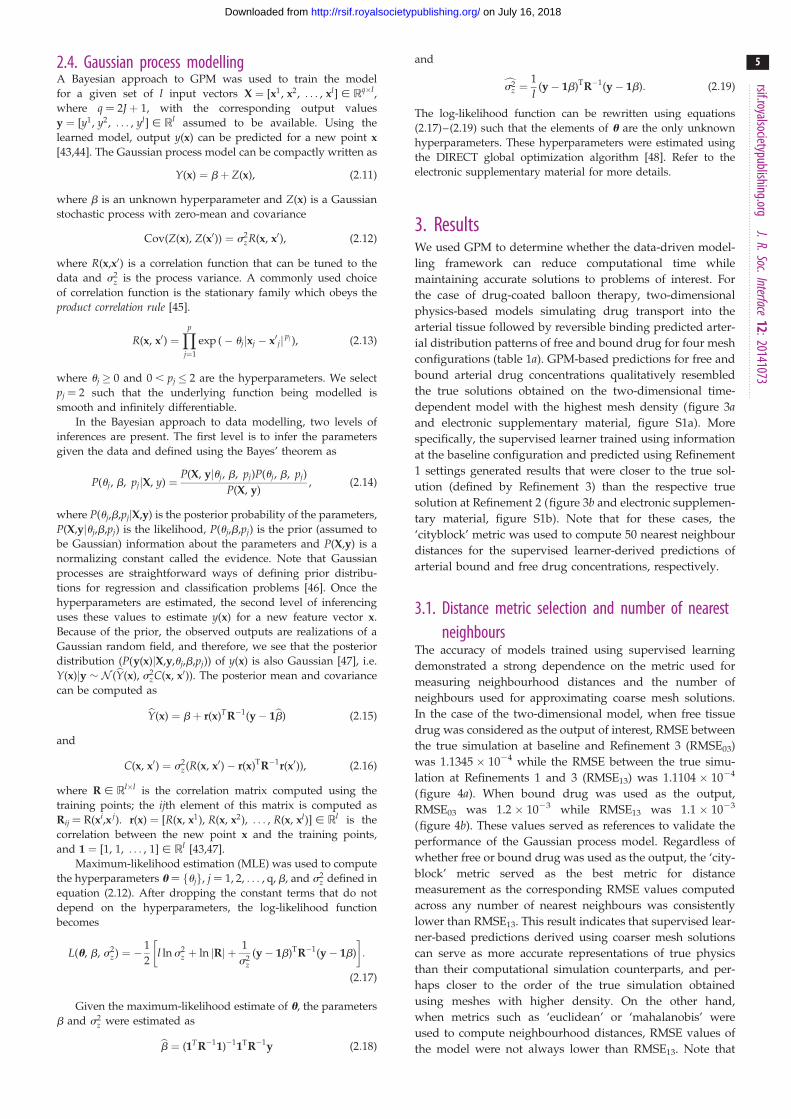
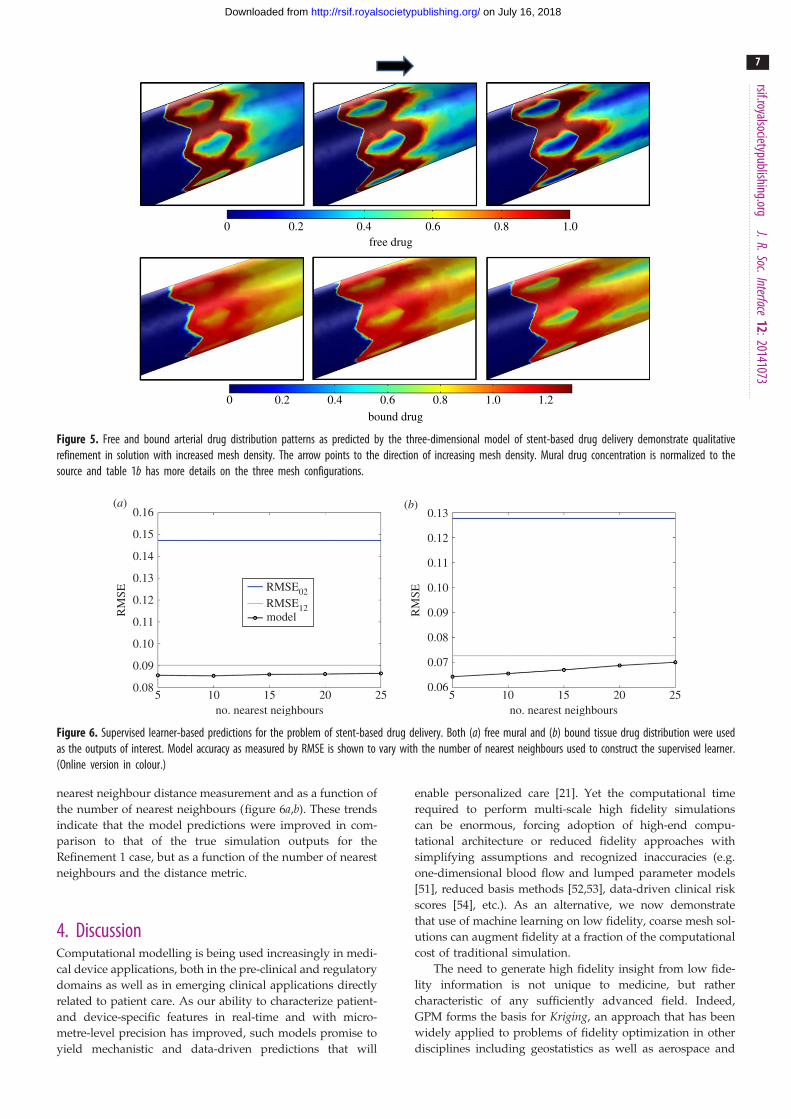
3.1. Distance metric selection and number of nearestneighbours
The accuracy of models trained using supervised learning
demonstrated a strong dependence on the metric used for
measuring neighbourhood distances and the number of
neighbours used for approximating coarse mesh solutions.
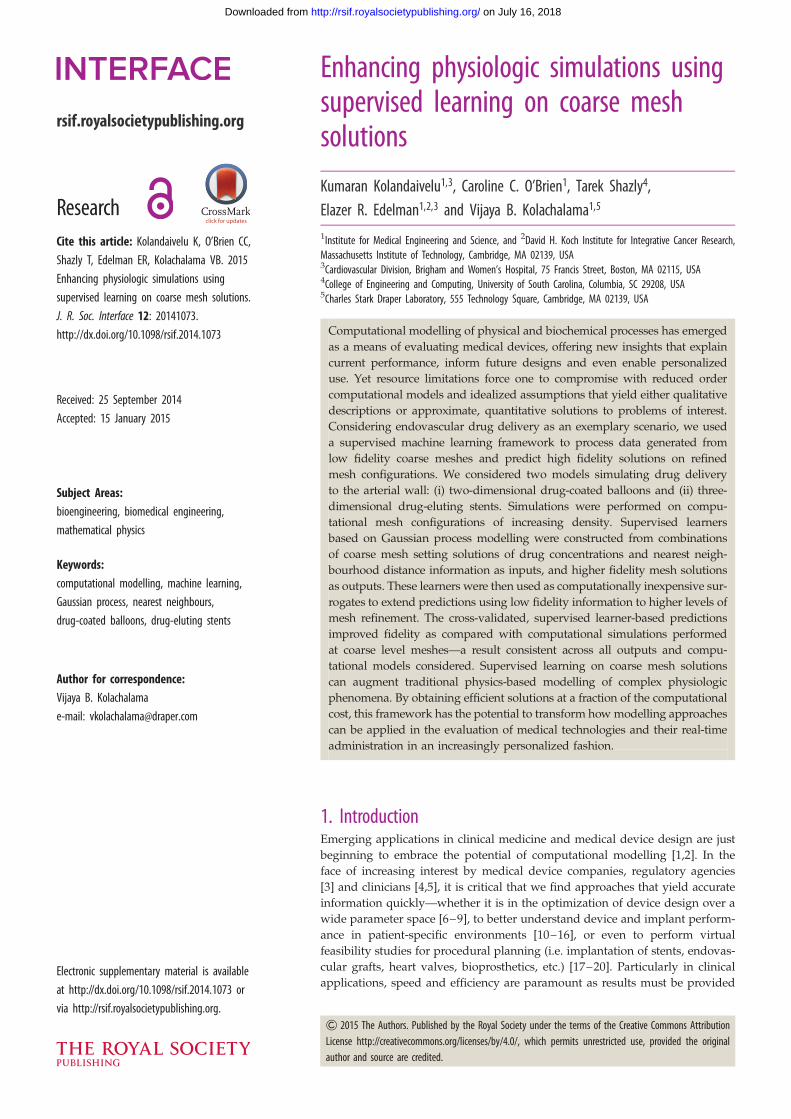
In the case of the two-dimensional model, when free tissue
drug was considered as the output of interest, RMSE between
the true simulation at baseline and Refinement 3 (RMSE03)
was 1.1345 � 1024 while the RMSE between the true simu-
lation at Refinements 1 and 3 (RMSE13) was 1.1104 � 1024
(figure 4a). When bound drug was used as the output,
RMSE03 was 1.2 � 1023 while RMSE13 was 1.1 � 1023
(figure 4b). These values served as references to validate the
performance of the Gaussian process model. Regardless of
whether free or bound drug was used as the output, the ‘city-
block’ metric served as the best metric for distance
measurement as the corresponding RMSE values computed
across any number of nearest neighbours was consistently
lower than RMSE13. This result indicates that supervised lear-
ner-based predictions derived using coarser mesh solutions
can serve as more accurate representations of true physics
than their computational simulation counterparts, and per-
haps closer to the order of the true simulation obtained
using meshes with higher density. On the other hand,
when metrics such as ‘euclidean’ or ‘mahalanobis’ were
used to compute neighbourhood distances, RMSE values of
the model were not always lower than RMSE13. Note that
(a) (b)
16
14
12
10
8
6
4
2
0
0 5 10 15 –23.0 3.1 3.2 3.3
distance (×10–3 m)
predicted solutionbaselineRefinement 1Refinement 2Refinement 3
conc
entr
atio
n (×
10–3
mM
)
concentration (×10–3 mM)3.4 3.5
x
y
Figure 3. Physics-based solutions for the two-dimensional model of drug-coated balloon delivery and model-based predictions at 1 h after balloon inflation.(a) True solution for the bound drug was computed on the mesh setting with the highest density (Refinement 3 in table 1a). (b) Arterial tissue drug concentrationfor bound drug for solutions based on four mesh configurations and the model-predicted solution were plotted as a function of cross-sectional depth.
(a) (b)
1.15
1.14
RM
SE (
×10
–3)
1.13
1.12
1.11
1.10
1.14
euclideanmahalanobiscityblockRMSE03RMSE13
RM
SE (
×10
–4)
1.13
1.12
1.11
1.10
1.09
1.0825 50 75
no. nearest neighbours10025 50 75
no. nearest neighbours100
1.16
Figure 4. Model accuracy as measured by RMSE varies with distance metric selection and the number of nearest neighbours. RMSE values were computed for threedistance metrics and four different values for the number of nearest neighbours. Both (a) free and (b) bound drug distribution were used as the outputs of interest.RMSE03 denotes the RMSE value computed between the solution obtained using the mesh with the lowest density (baseline) and the solution using the mesh with thehighest density (Refinement 3). RMSE13 denotes the RMSE value computed between the solutions obtained with the Refinements 1 and 3 cases. (Online version in colour.)
rsif.royalsocietypublishing.orgJ.R.Soc.Interface
12:20141073
6
on July 16, 2018http://rsif.royalsocietypublishing.org/Downloaded from
while the ‘euclidean’ metric is well known in the literature as
an ordinary distance between two points (see §2.3), ‘mahala-
nobis’ distance takes both the distance measurement and the
directionality into account, and ‘cityblock’ distance is simply
defined using the L1 norm. Overall, our findings point to the
importance of carefully choosing and validating the distance
metric for computing neighbourhood distances as well as
the number of nearest neighbours used to compute model
performance in order to obtain closer approximations of
true physics via the framework of supervised learning on
coarse mesh solutions. Using the same modelling construct,
several other neighbourhood distance metrics including ‘che-
byshev’ [49,50] and ‘minkowski’ and their variations can also
be explored.
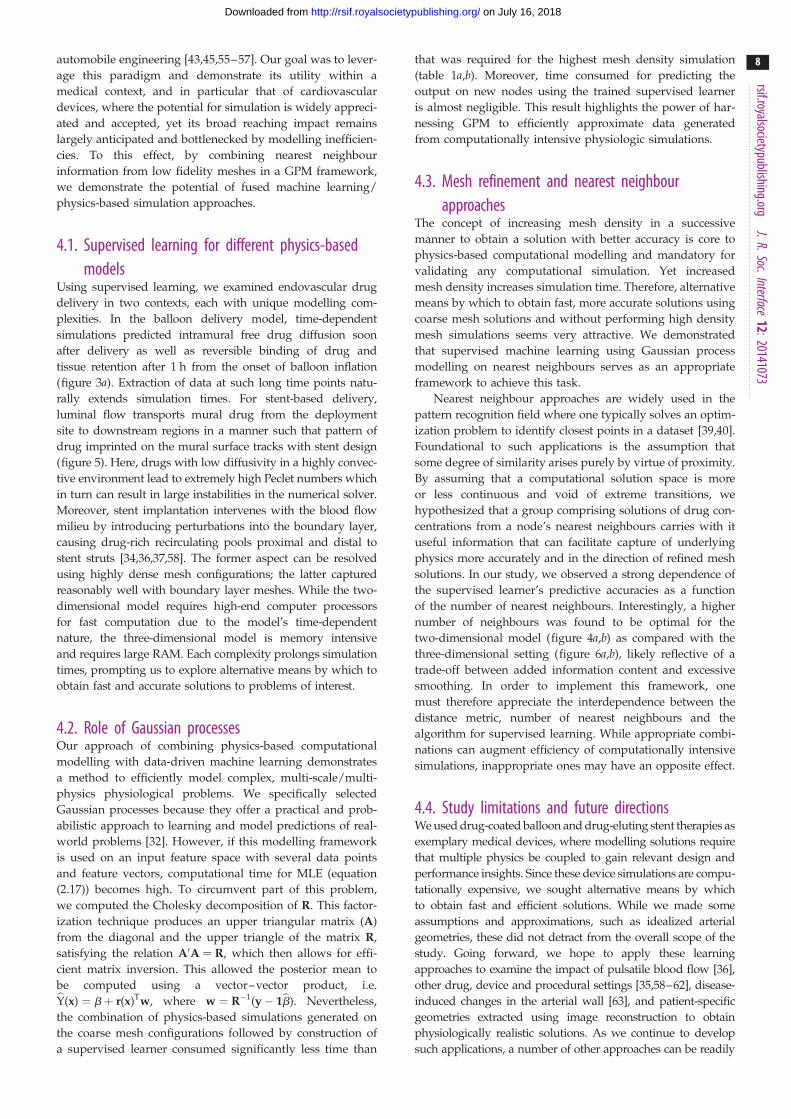
3.2. Extension to memory-intensive simulationsHaving validated the utility of combining the GPM frame-
work to learn from the two-dimensional physiologic
simulation data, we extended the framework to physics-
based models with increased physiologic and computational
complexities (figures 1b and 2b). Simulations were perfor-
med on the three-dimensional model of drug delivery from
a stent deployed in an arterial vessel and the effects of
steady luminal flow considered as a coupled phenomenon
with drug transport and reversible drug binding to arterial
tissue (table 1b). In contrast to the simulations for the two-
dimensional model of drug-coated balloon therapy, the true
simulation-based solutions of mural drug distribution for
the three-dimensional model of stent-based drug delivery
demonstrated an apparent qualitative difference in drug
distribution pattern as a function of computational mesh
density (figure 5). Also, validation of the supervised learner
for the three-dimensional model in the same way as the
two-dimensional model was not feasible as our compu-
tational resources precluded simulation of the Refinement 3
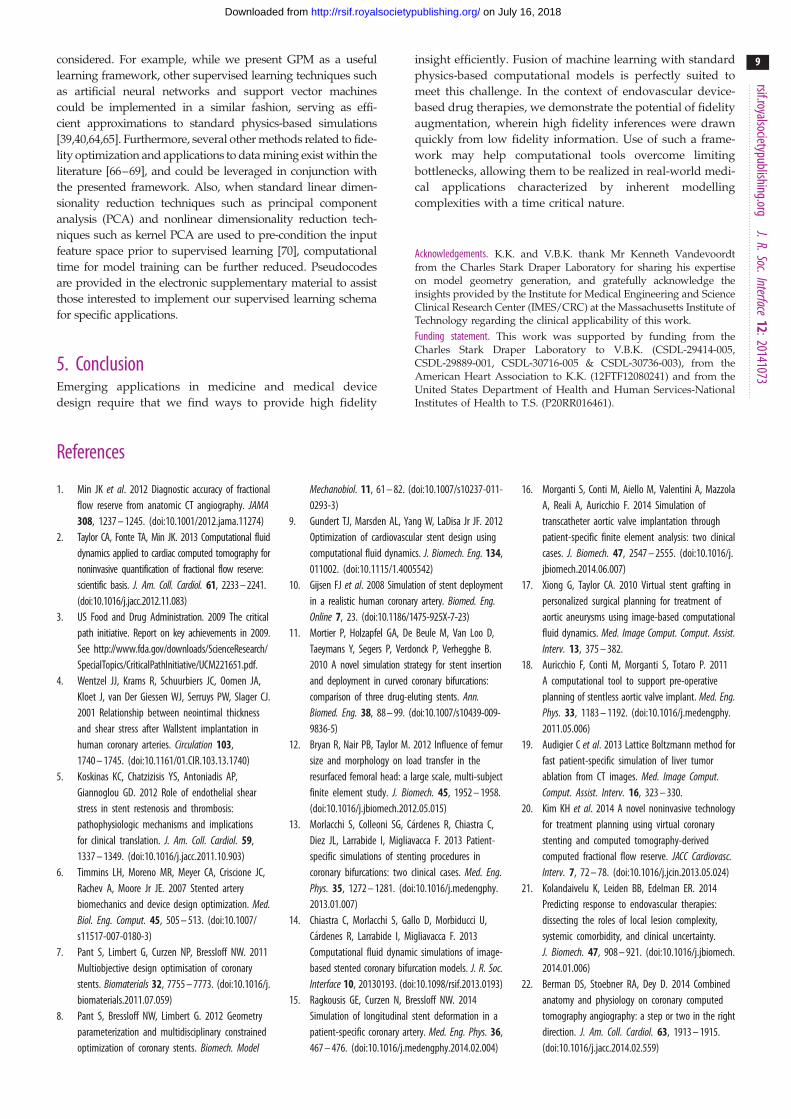
case (table 1b). Therefore, we computed the RMSE values
for the supervised learner relative to Refinements 1 and 2
cases, respectively. Models were generated with free and
bound drug as outputs using ‘mahalanobis’ metric for
0 0.2 0.4 0.6 0.8 1.0free drug
0 0.2 1.20.4 0.6 0.8 1.0
bound drug
Figure 5. Free and bound arterial drug distribution patterns as predicted by the three-dimensional model of stent-based drug delivery demonstrate qualitativerefinement in solution with increased mesh density. The arrow points to the direction of increasing mesh density. Mural drug concentration is normalized to thesource and table 1b has more details on the three mesh configurations.
(a) (b)
105 15 20 25no. nearest neighbours
105 15 20 25no. nearest neighbours
0.15
0.14
0.13
0.11
0.12
0.10
0.09
0.08
0.16
RM
SE
0.13
0.11
0.12
0.10
0.09
0.08
0.07
0.06
RM
SE
RMSE02RMSE12model
Figure 6. Supervised learner-based predictions for the problem of stent-based drug delivery. Both (a) free mural and (b) bound tissue drug distribution were usedas the outputs of interest. Model accuracy as measured by RMSE is shown to vary with the number of nearest neighbours used to construct the supervised learner.(Online version in colour.)
rsif.royalsocietypublishing.orgJ.R.Soc.Interface
12:20141073
7
on July 16, 2018http://rsif.royalsocietypublishing.org/Downloaded from
nearest neighbour distance measurement and as a function of
the number of nearest neighbours (figure 6a,b). These trends
indicate that the model predictions were improved in com-
parison to that of the true simulation outputs for the
Refinement 1 case, but as a function of the number of nearest
neighbours and the distance metric.
4. DiscussionComputational modelling is being used increasingly in medi-
cal device applications, both in the pre-clinical and regulatory
domains as well as in emerging clinical applications directly
related to patient care. As our ability to characterize patient-
and device-specific features in real-time and with micro-
metre-level precision has improved, such models promise to
yield mechanistic and data-driven predictions that will
enable personalized care [21]. Yet the computational time
required to perform multi-scale high fidelity simulations
can be enormous, forcing adoption of high-end compu-
tational architecture or reduced fidelity approaches with
simplifying assumptions and recognized inaccuracies (e.g.
one-dimensional blood flow and lumped parameter models
[51], reduced basis methods [52,53], data-driven clinical risk
scores [54], etc.). As an alternative, we now demonstrate
that use of machine learning on low fidelity, coarse mesh sol-
utions can augment fidelity at a fraction of the computational
cost of traditional simulation.
The need to generate high fidelity insight from low fide-
lity information is not unique to medicine, but rather
characteristic of any sufficiently advanced field. Indeed,
GPM forms the basis for Kriging, an approach that has been
widely applied to problems of fidelity optimization in other
disciplines including geostatistics as well as aerospace and
rsif.royalsocietypublishing.orgJ.R.Soc.Interface
12:20141073
8
on July 16, 2018http://rsif.royalsocietypublishing.org/Downloaded from
automobile engineering [43,45,55–57]. Our goal was to lever-
age this paradigm and demonstrate its utility within a
medical context, and in particular that of cardiovascular
devices, where the potential for simulation is widely appreci-
ated and accepted, yet its broad reaching impact remains
largely anticipated and bottlenecked by modelling inefficien-
cies. To this effect, by combining nearest neighbour
information from low fidelity meshes in a GPM framework,
we demonstrate the potential of fused machine learning/
physics-based simulation approaches.
4.1. Supervised learning for different physics-basedmodels
Using supervised learning, we examined endovascular drug
delivery in two contexts, each with unique modelling com-
plexities. In the balloon delivery model, time-dependent
simulations predicted intramural free drug diffusion soon
after delivery as well as reversible binding of drug and
tissue retention after 1 h from the onset of balloon inflation
(figure 3a). Extraction of data at such long time points natu-
rally extends simulation times. For stent-based delivery,
luminal flow transports mural drug from the deployment
site to downstream regions in a manner such that pattern of
drug imprinted on the mural surface tracks with stent design
(figure 5). Here, drugs with low diffusivity in a highly convec-
tive environment lead to extremely high Peclet numbers which
in turn can result in large instabilities in the numerical solver.
Moreover, stent implantation intervenes with the blood flow
milieu by introducing perturbations into the boundary layer,
causing drug-rich recirculating pools proximal and distal to
stent struts [34,36,37,58]. The former aspect can be resolved
using highly dense mesh configurations; the latter captured
reasonably well with boundary layer meshes. While the two-
dimensional model requires high-end computer processors
for fast computation due to the model’s time-dependent
nature, the three-dimensional model is memory intensive
and requires large RAM. Each complexity prolongs simulation
times, prompting us to explore alternative means by which to
obtain fast and accurate solutions to problems of interest.
4.2. Role of Gaussian processesOur approach of combining physics-based computational
modelling with data-driven machine learning demonstrates
a method to efficiently model complex, multi-scale/multi-
physics physiological problems. We specifically selected
Gaussian processes because they offer a practical and prob-
abilistic approach to learning and model predictions of real-
world problems [32]. However, if this modelling framework
is used on an input feature space with several data points
and feature vectors, computational time for MLE (equation
(2.17)) becomes high. To circumvent part of this problem,
we computed the Cholesky decomposition of R. This factor-
ization technique produces an upper triangular matrix (A)
from the diagonal and the upper triangle of the matrix R,
satisfying the relation A0A ¼ R, which then allows for effi-
cient matrix inversion. This allowed the posterior mean to
be computed using a vector–vector product, i.e.bY(x) ¼ bþ r(x)Tw, where w ¼ R�1(y� 1bb). Nevertheless,
the combination of physics-based simulations generated on
the coarse mesh configurations followed by construction of
a supervised learner consumed significantly less time than
that was required for the highest mesh density simulation
(table 1a,b). Moreover, time consumed for predicting the
output on new nodes using the trained supervised learner
is almost negligible. This result highlights the power of har-
nessing GPM to efficiently approximate data generated
from computationally intensive physiologic simulations.
4.3. Mesh refinement and nearest neighbourapproaches
The concept of increasing mesh density in a successive
manner to obtain a solution with better accuracy is core to
physics-based computational modelling and mandatory for
validating any computational simulation. Yet increased
mesh density increases simulation time. Therefore, alternative
means by which to obtain fast, more accurate solutions using
coarse mesh solutions and without performing high density
mesh simulations seems very attractive. We demonstrated
that supervised machine learning using Gaussian process
modelling on nearest neighbours serves as an appropriate
framework to achieve this task.
Nearest neighbour approaches are widely used in the
pattern recognition field where one typically solves an optim-
ization problem to identify closest points in a dataset [39,40].
Foundational to such applications is the assumption that
some degree of similarity arises purely by virtue of proximity.
By assuming that a computational solution space is more
or less continuous and void of extreme transitions, we
hypothesized that a group comprising solutions of drug con-
centrations from a node’s nearest neighbours carries with it
useful information that can facilitate capture of underlying
physics more accurately and in the direction of refined mesh
solutions. In our study, we observed a strong dependence of
the supervised learner’s predictive accuracies as a function
of the number of nearest neighbours. Interestingly, a higher
number of neighbours was found to be optimal for the
two-dimensional model (figure 4a,b) as compared with the
three-dimensional setting (figure 6a,b), likely reflective of a
trade-off between added information content and excessive
smoothing. In order to implement this framework, one
must therefore appreciate the interdependence between the
distance metric, number of nearest neighbours and the
algorithm for supervised learning. While appropriate combi-
nations can augment efficiency of computationally intensive
simulations, inappropriate ones may have an opposite effect.
4.4. Study limitations and future directionsWe used drug-coated balloon and drug-eluting stent therapies as
exemplary medical devices, where modelling solutions require
that multiple physics be coupled to gain relevant design and
performance insights. Since these device simulations are compu-
tationally expensive, we sought alternative means by which
to obtain fast and efficient solutions. While we made some
assumptions and approximations, such as idealized arterial
geometries, these did not detract from the overall scope of the
study. Going forward, we hope to apply these learning
approaches to examine the impact of pulsatile blood flow [36],
other drug, device and procedural settings [35,58–62], disease-
induced changes in the arterial wall [63], and patient-specific
geometries extracted using image reconstruction to obtain
physiologically realistic solutions. As we continue to develop
such applications, a number of other approaches can be readily
rsif.royalsocietypublishing.orgJ.R.Soc.Interface
1
9
on July 16, 2018http://rsif.royalsocietypublishing.org/Downloaded from
considered. For example, while we present GPM as a useful
learning framework, other supervised learning techniques such
as artificial neural networks and support vector machines
could be implemented in a similar fashion, serving as effi-
cient approximations to standard physics-based simulations
[39,40,64,65]. Furthermore, several other methods related to fide-
lity optimization and applications to data mining exist within the
literature [66–69], and could be leveraged in conjunction with
the presented framework. Also, when standard linear dimen-
sionality reduction techniques such as principal component
analysis (PCA) and nonlinear dimensionality reduction tech-
niques such as kernel PCA are used to pre-condition the input
feature space prior to supervised learning [70], computational
time for model training can be further reduced. Pseudocodes
are provided in the electronic supplementary material to assist
those interested to implement our supervised learning schema
for specific applications.
2:20141073 5. ConclusionEmerging applications in medicine and medical devicedesign require that we find ways to provide high fidelity
insight efficiently. Fusion of machine learning with standard
physics-based computational models is perfectly suited to
meet this challenge. In the context of endovascular device-
based drug therapies, we demonstrate the potential of fidelity
augmentation, wherein high fidelity inferences were drawn
quickly from low fidelity information. Use of such a frame-
work may help computational tools overcome limiting
bottlenecks, allowing them to be realized in real-world medi-
cal applications characterized by inherent modelling
complexities with a time critical nature.
Acknowledgements. K.K. and V.B.K. thank Mr Kenneth Vandevoordtfrom the Charles Stark Draper Laboratory for sharing his expertiseon model geometry generation, and gratefully acknowledge theinsights provided by the Institute for Medical Engineering and ScienceClinical Research Center (IMES/CRC) at the Massachusetts Institute ofTechnology regarding the clinical applicability of this work.
Funding statement. This work was supported by funding from theCharles Stark Draper Laboratory to V.B.K. (CSDL-29414-005,CSDL-29889-001, CSDL-30716-005 & CSDL-30736-003), from theAmerican Heart Association to K.K. (12FTF12080241) and from theUnited States Department of Health and Human Services-NationalInstitutes of Health to T.S. (P20RR016461).
References
1. Min JK et al. 2012 Diagnostic accuracy of fractionalflow reserve from anatomic CT angiography. JAMA308, 1237 – 1245. (doi:10.1001/2012.jama.11274)
2. Taylor CA, Fonte TA, Min JK. 2013 Computational fluiddynamics applied to cardiac computed tomography fornoninvasive quantification of fractional flow reserve:scientific basis. J. Am. Coll. Cardiol. 61, 2233 – 2241.(doi:10.1016/j.jacc.2012.11.083)
3. US Food and Drug Administration. 2009 The criticalpath initiative. Report on key achievements in 2009.See http://www.fda.gov/downloads/ScienceResearch/SpecialTopics/CriticalPathInitiative/UCM221651.pdf.
4. Wentzel JJ, Krams R, Schuurbiers JC, Oomen JA,Kloet J, van Der Giessen WJ, Serruys PW, Slager CJ.2001 Relationship between neointimal thicknessand shear stress after Wallstent implantation inhuman coronary arteries. Circulation 103,1740 – 1745. (doi:10.1161/01.CIR.103.13.1740)
5. Koskinas KC, Chatzizisis YS, Antoniadis AP,Giannoglou GD. 2012 Role of endothelial shearstress in stent restenosis and thrombosis:pathophysiologic mechanisms and implicationsfor clinical translation. J. Am. Coll. Cardiol. 59,1337 – 1349. (doi:10.1016/j.jacc.2011.10.903)
6. Timmins LH, Moreno MR, Meyer CA, Criscione JC,Rachev A, Moore Jr JE. 2007 Stented arterybiomechanics and device design optimization. Med.Biol. Eng. Comput. 45, 505 – 513. (doi:10.1007/s11517-007-0180-3)
7. Pant S, Limbert G, Curzen NP, Bressloff NW. 2011Multiobjective design optimisation of coronarystents. Biomaterials 32, 7755 – 7773. (doi:10.1016/j.biomaterials.2011.07.059)
8. Pant S, Bressloff NW, Limbert G. 2012 Geometryparameterization and multidisciplinary constrainedoptimization of coronary stents. Biomech. Model
Mechanobiol. 11, 61 – 82. (doi:10.1007/s10237-011-0293-3)
9. Gundert TJ, Marsden AL, Yang W, LaDisa Jr JF. 2012Optimization of cardiovascular stent design usingcomputational fluid dynamics. J. Biomech. Eng. 134,011002. (doi:10.1115/1.4005542)
10. Gijsen FJ et al. 2008 Simulation of stent deploymentin a realistic human coronary artery. Biomed. Eng.Online 7, 23. (doi:10.1186/1475-925X-7-23)
11. Mortier P, Holzapfel GA, De Beule M, Van Loo D,Taeymans Y, Segers P, Verdonck P, Verhegghe B.2010 A novel simulation strategy for stent insertionand deployment in curved coronary bifurcations:comparison of three drug-eluting stents. Ann.Biomed. Eng. 38, 88– 99. (doi:10.1007/s10439-009-9836-5)
12. Bryan R, Nair PB, Taylor M. 2012 Influence of femursize and morphology on load transfer in theresurfaced femoral head: a large scale, multi-subjectfinite element study. J. Biomech. 45, 1952 – 1958.(doi:10.1016/j.jbiomech.2012.05.015)
13. Morlacchi S, Colleoni SG, Cardenes R, Chiastra C,Diez JL, Larrabide I, Migliavacca F. 2013 Patient-specific simulations of stenting procedures incoronary bifurcations: two clinical cases. Med. Eng.Phys. 35, 1272 – 1281. (doi:10.1016/j.medengphy.2013.01.007)
14. Chiastra C, Morlacchi S, Gallo D, Morbiducci U,Cardenes R, Larrabide I, Migliavacca F. 2013Computational fluid dynamic simulations of image-based stented coronary bifurcation models. J. R. Soc.Interface 10, 20130193. (doi:10.1098/rsif.2013.0193)
15. Ragkousis GE, Curzen N, Bressloff NW. 2014Simulation of longitudinal stent deformation in apatient-specific coronary artery. Med. Eng. Phys. 36,467 – 476. (doi:10.1016/j.medengphy.2014.02.004)
16. Morganti S, Conti M, Aiello M, Valentini A, MazzolaA, Reali A, Auricchio F. 2014 Simulation oftranscatheter aortic valve implantation throughpatient-specific finite element analysis: two clinicalcases. J. Biomech. 47, 2547 – 2555. (doi:10.1016/j.jbiomech.2014.06.007)
17. Xiong G, Taylor CA. 2010 Virtual stent grafting inpersonalized surgical planning for treatment ofaortic aneurysms using image-based computationalfluid dynamics. Med. Image Comput. Comput. Assist.Interv. 13, 375 – 382.
18. Auricchio F, Conti M, Morganti S, Totaro P. 2011A computational tool to support pre-operativeplanning of stentless aortic valve implant. Med. Eng.Phys. 33, 1183 – 1192. (doi:10.1016/j.medengphy.2011.05.006)
19. Audigier C et al. 2013 Lattice Boltzmann method forfast patient-specific simulation of liver tumorablation from CT images. Med. Image Comput.Comput. Assist. Interv. 16, 323 – 330.
20. Kim KH et al. 2014 A novel noninvasive technologyfor treatment planning using virtual coronarystenting and computed tomography-derivedcomputed fractional flow reserve. JACC Cardiovasc.Interv. 7, 72 – 78. (doi:10.1016/j.jcin.2013.05.024)
21. Kolandaivelu K, Leiden BB, Edelman ER. 2014Predicting response to endovascular therapies:dissecting the roles of local lesion complexity,systemic comorbidity, and clinical uncertainty.J. Biomech. 47, 908 – 921. (doi:10.1016/j.jbiomech.2014.01.006)
22. Berman DS, Stoebner RA, Dey D. 2014 Combinedanatomy and physiology on coronary computedtomography angiography: a step or two in the rightdirection. J. Am. Coll. Cardiol. 63, 1913 – 1915.(doi:10.1016/j.jacc.2014.02.559)
rsif.royalsocietypublishing.orgJ.R.Soc.Interface
12:20141073
10
on July 16, 2018http://rsif.royalsocietypublishing.org/Downloaded from
23. Woods TC, Marks AR. 2004 Drug-eluting stents.Annu. Rev. Med. 55, 169 – 178. (doi:10.1146/annurev.med.55.091902.105243)
24. Stefanini GG, Holmes Jr DR. 2013 Drug-elutingcoronary artery stents. N Engl. J. Med. 368,254 – 265. (doi:10.1056/NEJMra1210816)
25. Waksman R, Pakala R. 2009 Drug-eluting balloon:the comeback kid? Circ. Cardiovasc. Interv. 2, 352 –358. (doi:10.1161/CIRCINTERVENTIONS.109.873703)
26. Gray WA, Granada JF. 2010 Drug-coated balloons forthe prevention of vascular restenosis. Circulation121, 2672 – 2680. (doi:10.1161/CIRCULATIONAHA.110.936922)
27. Byrne RA, Joner M, Alfonso F, Kastrati A. 2014 Drug-coated balloon therapy in coronary and peripheralartery disease. Nat. Rev. Cardiol. 11, 13 – 23.(doi:10.1038/nrcardio.2013.165)
28. Sarode K, Spelber DA, Bhatt DL, Mohammad A,Prasad A, Brilakis ES, Banerjee S. 2014 Drugdelivering technology for endovascularmanagement of infrainguinal peripheral arterydisease. JACC Cardiovasc. Interv. 7, 827 – 839.(doi:10.1016/j.jcin.2014.05.008)
29. World Health Organization. 2014 World HealthStatistics.
30. Hwang CW, Wu D, Edelman ER. 2001 Physiologicaltransport forces govern drug distribution for stent-based delivery. Circulation 104, 822 – 829. (doi:10.1161/hc3101.092214)
31. Wessely R, Schomig A, Kastrati A. 2006 Sirolimusand paclitaxel on polymer-based drug-elutingstents: similar but different. J. Am. Coll. Cardiol. 47,708 – 714. (doi:10.1016/j.jacc.2005.09.047)
32. Rasmussen CE, Williams CKI. 2006 Gaussian processesfor machine learning. Cambridge, MA: The MIT press.
33. Kolachalama VB et al. 2013 Mechanisms of tissueuptake and retention in zotarolimus-coated balloontherapy. Circulation 127, 2047 – 2055. (doi:10.1161/CIRCULATIONAHA.113.002051)
34. Kolachalama VB, Levine EG, Edelman ER. 2009Luminal flow amplifies stent-based drug depositionin arterial bifurcations. PLoS ONE 4, e8105. (doi:10.1371/journal.pone.0008105)
35. Shazly T, Kolachalama VB, Ferdous J, Oberhauser JP,Hossainy S, Edelman ER. 2012 Assessment ofmaterial by-product fate from bioresorbablevascular scaffolds. Ann. Biomed. Eng. 40, 955 – 965.(doi:10.1007/s10439-011-0445-8)
36. O’Brien CC, Kolachalama VB, Barber TJ, Simmons A,Edelman ER. 2013 Impact of flow pulsatility onarterial drug distribution in stent-based therapy.J. Control Release 168, 115 – 124. (doi:10.1016/j.jconrel.2013.03.014)
37. Kolachalama VB, Tzafriri AR, Arifin DY, Edelman ER.2009 Luminal flow patterns dictate arterial drugdeposition in stent-based delivery. J. Control Release133, 24 – 30. (doi:10.1016/j.jconrel.2008.09.075)
38. Lovich MA, Creel C, Hong K, Hwang CW, EdelmanER. 2001 Carrier proteins determine localpharmacokinetics and arterial distribution of
paclitaxel. J. Pharm. Sci. 90, 1324 – 1335. (doi:10.1002/jps.1085)
39. Bishop CM. 2007 Pattern recognition and machinelearning. Berlin, Germany: Springer.
40. Hastie T, Tibshirani R, Friedman J. 2009 Theelements of statistical learning: data mining,inference and prediction. Berlin, Germany: Springer.
41. Deza E, Deza MM. 2009 Encyclopedia of distances.Berlin, Germany: Springer.
42. Mahalanobis PC. 1936 On the generalised distancein statistics. Proc. Natl Inst. Sci. India 2, 49 – 55.
43. Keane AJ, Nair PB. 2005 Computational approachesfor aerospace design. The pursuit of excellence.New York, NY: John Wiley & Sons Ltd.
44. Kolachalama VB, Bressloff NW, Nair PB. 2007 Miningdata from hemodynamic simulations via Bayesianemulation. Biomed. Eng. Online 6, 47. (doi:10.1186/1475-925X-6-47)
45. Sacks J, Welch WJ, Mitchell TJ, Wynn HP. 1989Design and analysis of computer experiments. Stat.Sci. 4, 409 – 435. (doi:10.1214/ss/1177012413)
46. Neal RM. 1998 Regression and classification usingGaussian process priors. In Bayesian statistics 6 (edsJM Bernardo, JO Berger, AP Dawid, AFM Smith),pp. 475 – 501. Oxford, UK: Oxford University Press.
47. Currin C, Mitchell T, Morris M, Ylvisaker D. 1991Bayesian prediction of deterministic functions withapplications to the design and analysis of computerexperiments. J. Am. Stat. Assoc. 86, 953 – 963.(doi:10.1080/01621459.1991.10475138)
48. Jones DR, Perttunen CD, Stuckman BE. 1993Lipschitzian optimization without the Lipschitzconstant. J. Optimiz. Theory App. 79, 157 – 181.(doi:10.1007/BF00941892)
49. Cantrell CD. 2000 Modern mathematical methods forphysicists and engineers. Cambridge, UK: CambridgeUniversity Press.
50. Abello JM, Pardalos PM, Resende MGC. 2002 Handbookof massive data sets. Berlin, Germany: Springer.
51. Shi Y, Lawford P, Hose R. 2011 Review of zero-Dand 1-D models of blood flow in the cardiovascularsystem. Biomed. Eng. Online 10, 33. (doi:10.1186/1475-925X-10-33)
52. Quarteroni A, Rozza G. 2007 Numerical solution ofparametrized Navier – Stokes equations by reducedbasis methods. Numer. Methods Part D E 23,923 – 948. (doi:10.1002/num.20249)
53. Manzoni A, Quarteroni A, Rozza G. 2011 Shapeoptimization for viscous flows by reduced basismethods and free-form deformation. Int. J. Numer.Method Fluids 70, 646 – 670. (doi:10.1002/fld.2712)
54. Sianos G et al. 2005 The SYNTAX Score: anangiographic tool grading the complexity of coronaryartery disease. EuroIntervention 1, 219 – 227.
55. Matheron G. 1963 Principles of geostatistics. Econ.Geol. 58, 1246 – 1266. (doi:10.2113/gsecongeo.58.8.1246)
56. Alexandrov NM, Lewis RM, Gumbert CR, Green LL,Newman PA. 2001 Approximation and modelmanagement in aerodynamic optimization with
variable-fidelity models. J Aircraft 38, 1093 – 1101.(doi:10.2514/2.2877)
57. Gano SE, Renaud JE. 2005 Hybrid variable fidelityoptimization by using a Kriging-based scalingfunction. AIAA J. 43, 2422 – 2430. (doi:10.2514/1.12466)
58. Kolandaivelu K et al. 2011 Stent thrombogenicityearly in high-risk interventional settings is driven bystent design and deployment and protected bypolymer-drug coatings. Circulation 123, 1400 –1409. (doi:10.1161/CIRCULATIONAHA.110.003210)
59. Levin AD, Vukmirovic N, Hwang CW, Edelman ER.2004 Specific binding to intracellular proteinsdetermines arterial transport properties forrapamycin and paclitaxel. Proc. Natl Acad. Sci.USA 101, 9463 – 9467. (doi:10.1073/pnas.0400918101)
60. Kolachalama VB, Bressloff NW, Nair PB, ShearmanCP. 2008 Predictive haemodynamics in a one-dimensional human carotid artery bifurcation. PartII: application to graft design. IEEE Trans. Biomed.Eng. 55, 1176 – 1184. (doi:10.1109/TBME.2007.912398)
61. Onuma Y, Serruys PW. 2011 Bioresorbable scaffold:the advent of a new era in percutaneous coronaryand peripheral revascularization? Circulation 123,779 – 797. (doi:10.1161/CIRCULATIONAHA.110.971606)
62. Ferdous J, Kolachalama VB, Shazly T. 2013 Impactof polymer structure and composition on fullyresorbable endovascular scaffold performance. ActaBiomater. 9, 6052 – 6061. (doi:10.1016/j.actbio.2012.12.011)
63. Tzafriri AR, Vukmirovic N, Kolachalama VB, AstafievaI, Edelman ER. 2010 Lesion complexity determinesarterial drug distribution after local drug delivery.J. Control Release 142, 332 – 338. (doi:10.1016/j.jconrel.2009.11.007)
64. McCullagh P, Nelder JA. 1999 Generalized linearmodels. London, UK: Chapman & Hall.
65. Dobson AJ. 2001 An introduction to generalizedlinear models. London, UK: Chapman & Hall.
66. Booker AJ, Dennis Jr JE, Frank PD, Serafini DB,Torczon V, Trosset MW. 1999 A rigorous frameworkfor optimization of expensive functions bysurrogates. Struct. Optimiz. 17, 1 – 13. (doi:10.1007/BF01197708)
67. Garcke J, Griebel M, Thess M. 2001 Data miningwith sparse grids. Computing 67, 225 – 253. (doi:10.1007/s006070170007)
68. Shirazi AS, Mammen von S, Jacob C. 2013Abstraction of agent interaction processes. Simul-TSoc. Mod. Sim. 89, 524 – 538.
69. Shirazi AS, Davison T, Mammen von S, Denzinger J,Jacob C. 2014 Adaptive agent abstractions to speedup spatial agent-based simulations. Simul. ModelPract. Theory 40, 144 – 160. (doi:10.1016/j.simpat.2013.09.001)
70. Lee JA, Verleysen M. 2007 Nonlinear dimensionalityreduction. Berlin, Germany: Springer.