Embed Size (px)
Citation preview

Enhancing Policy Decision Making with Large-Scale Digital Traces
Vanessa Frias-MartinezUniversity of Maryland
NFAIS, February 2014


5.9 billion 87%
3.2 billion unique users 45%
mobile devices >>humans

Have you ever heard of DATIFICATION?1. Yes2. No

Mobile Digital Footprints…
…for Social Good?

Research Goal
To extract human behavioral information from mobile digital traces in order to assist decision makers in organizations working for social development

TOOLS
BEHAVIORAL INSIGHTS
Energy
RESEARCH DECISION MAKERS
Health
Education
Safety
Transportation
Interviews, surveys:
Information to assist on policy
decisions
Data MiningMachine LearningStatistical
MOBILE DIGITAL TRACES
To enhance or complement
information in an affordable manner

OUTLINE

Outline
• Cell Phone Data
• Projects with Social Impact– Cencell– AlertImpact
Cell Phone Data

Call Detail Records
Anonymized
Granularity1-4km²
CDR: Caller | Callee | Date | Duration | Geolocation

Modeling Human Behavior
Consumption•Number calls, duration, frequency, SMS/MMS/voice•Expenses•Handset Type and Features
Social•Degree of the social network •Strength of the contacts (Reciprocity & Frequency)•Geography of the social contacts
Mobility•Mobility Patterns (Entropy)•Diameter of mobility•Radius of gyration (Home/Work)
Over 270 variables

Cost-Effective Census Maps From Cell Phone Data
CenCell

Motivation: Census Maps
A/BC+CDE

National Statistical Institutes
A/BC+CDE

Important Data Comes at a Price
Expensive
Low resource regions
A/BC+CDE

Can the variables extracted from Call Detail Records be used as predictors of regional socioeconomic levels (SELs)?

Cost-effective Maps
NSI carries out surveys
Cell Phone Data
REDUCE COSTS
NSI surveys subset of regions
Forecasting Models
Predict the Present

Methodology

Classifying SELs - Training
Consumption
Social
Mobility
SEL
CLASSIFIER
Aggregated1-4km²

SEL
Classifying SELs - Testing
CLASSIFIER
Consumption
Social
Mobility
Aggregated

Experimental Evaluation

Datasets
• Data for a city in Latin America (NSI)– 1200 regions (GUs)– SEL values from 0..100
• Call Detail Records– 6 months, 500K customers– City has 920 coverage areas– 279 variables per coverage area
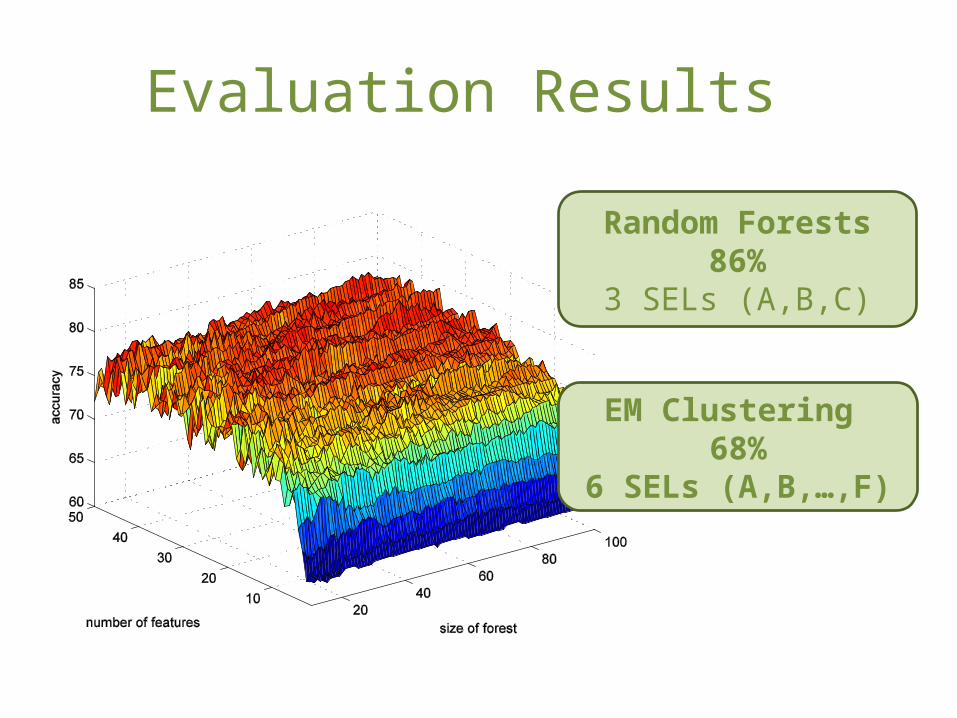
Evaluation Results
Random Forests 86%3 SELs (A,B,C)
EM Clustering 68%6 SELs (A,B,…,F)

Human Behavior and
Census Variables

Large Scale Quantitative Analysis
Consumption
Social
Mobility

InsightsConsumption Variables
Mobility Variables
AlertImpact
Understanding the Impact of Health Alerts using Cell Phone Data

H1N1 Mexico Timeline
PrefluClosing Schools
27th AprilReopen
6th May

Can we measure the impact that government alerts had on the mobility of the population ?
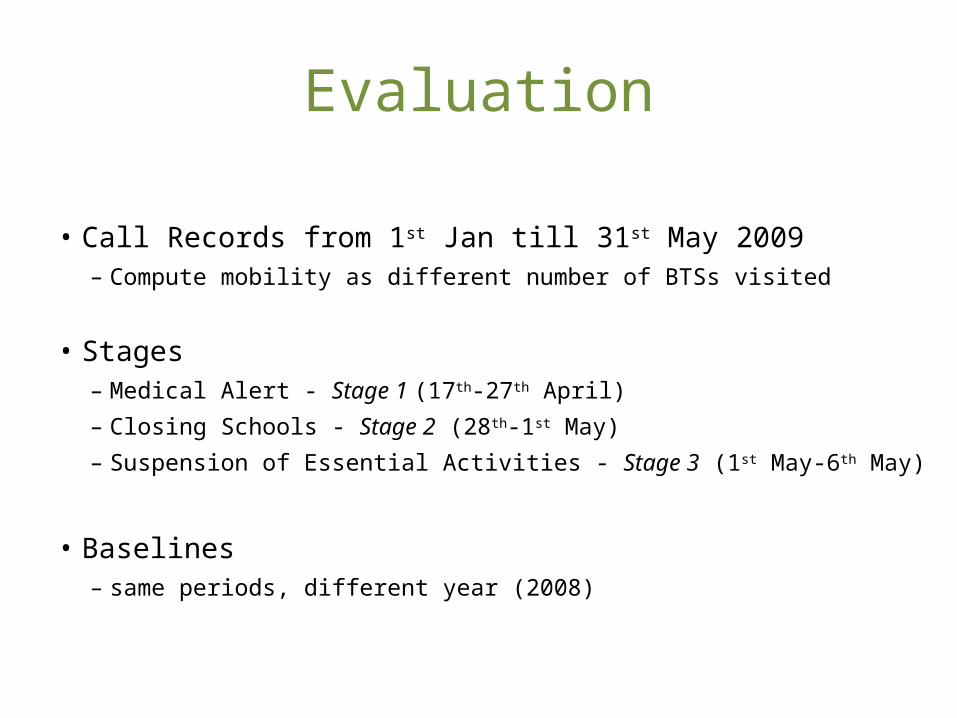
Evaluation
• Call Records from 1st Jan till 31st May 2009– Compute mobility as different number of BTSs visited
• Stages– Medical Alert - Stage 1 (17th-27th April)– Closing Schools - Stage 2 (28th-1st May)– Suspension of Essential Activities - Stage 3 (1st May-6th May)
• Baselines– same periods, different year (2008)

Changes in Mobility
April 27th May 1st May 6th
Alert Closed Shutdown Reopen
Baseline
Mobility reduced between 10% and 30%
Alert Closed Suspension Reopen

Changes in Epidemic Spreading
Baseline (“preflu” behavior all weeks)Intervention (alert,closed,shutdown)
Epidemic peak postponed 40 hours
Reduced number of infected in peak agents by 10%
BASELINEK

University Campus
Statistically Significant Decrease during Stages 2 and 3

Airport
Statistically Significant Increase during Stages 2 and 3

Take Away Message

Take Away Message
• Geolocated traces allow us to quantitatively – Model human behavior– Measure behavioral changes– Predict/Classify external sources of information

Future
• Enhance and complement the tools currently used by decision makers in organizations working for social good
– Use of open datasets, social media and other digital traces