Embed Size (px)
Citation preview
General rights Copyright and moral rights for the publications made accessible in the public portal are retained by the authors and/or other copyright owners and it is a condition of accessing publications that users recognise and abide by the legal requirements associated with these rights.
Users may download and print one copy of any publication from the public portal for the purpose of private study or research.
You may not further distribute the material or use it for any profit-making activity or commercial gain
You may freely distribute the URL identifying the publication in the public portal If you believe that this document breaches copyright please contact us providing details, and we will remove access to the work immediately and investigate your claim.
Downloaded from orbit.dtu.dk on: Aug 17, 2019
Enhancing the electro-mechanical properties of polydimethylsiloxane elastomersthrough blending with poly(dimethylsiloxane-co-methylphenylsiloxane) copolymers
Jeppe Madsen, Peter; Yu, Liyun; Boucher, Sarah ; Skov, Anne Ladegaard
Published in:R S C Advances
Link to article, DOI:10.1039/C8RA02314J
Publication date:2018
Document VersionPublisher's PDF, also known as Version of record
Link back to DTU Orbit
Citation (APA):Jeppe Madsen, P., Yu, L., Boucher, S., & Skov, A. L. (2018). Enhancing the electro-mechanical properties ofpolydimethylsiloxane elastomers through blending with poly(dimethylsiloxane-co-methylphenylsiloxane)copolymers. R S C Advances, 8, 23077-23088. https://doi.org/10.1039/C8RA02314J
Electronic Supplementary information
Enhancing the electro-mechanical properties of polydimethylsiloxane elastomers
through blending with poly(dimethylsiloxane-co-methylphenylsiloxane) copolymers
Peter Jeppe Madsen, Liyun Yu, Sarah Boucher, Anne Ladegaard Skov*
Danish Polymer Centre, Department of Chemical and Biochemical Engineering, Technical
University of Denmark, Søltofts Plads Building 227, 2800 Kgs. Lyngby, Denmark
*Corresponding author: Tel.: +45 45252825. Fax: +45 45882258. E-mail: [email protected]
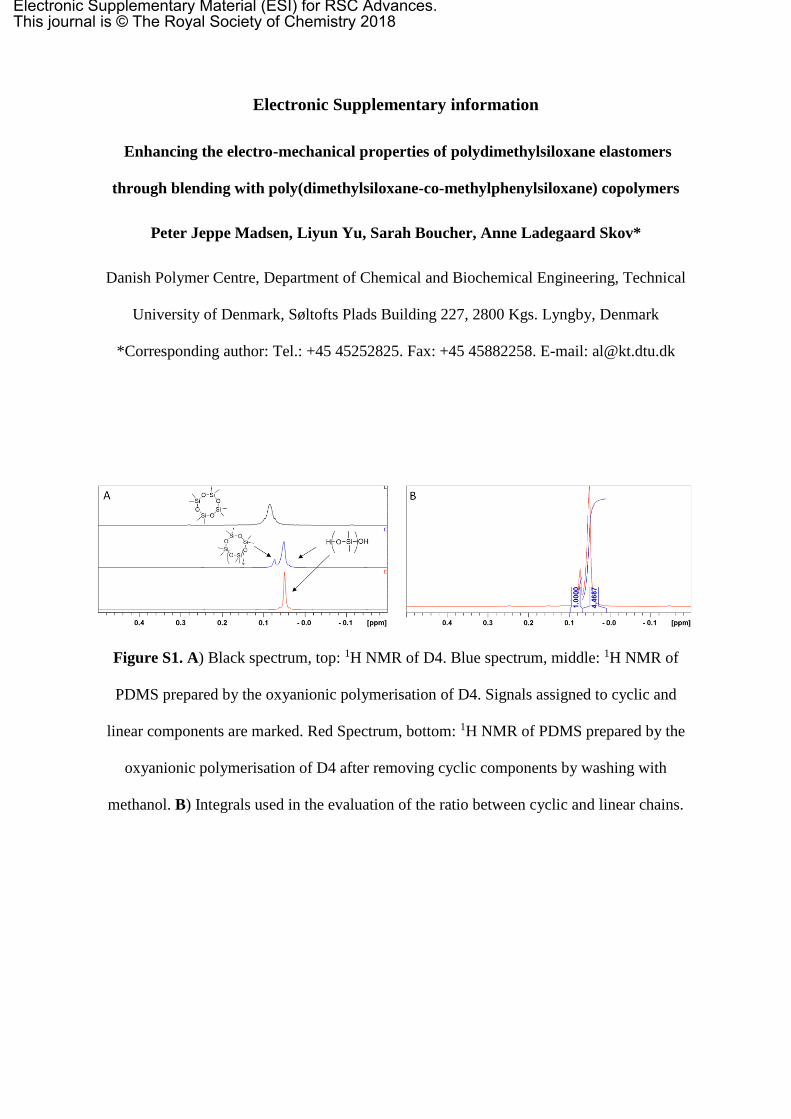
Figure S1. A) Black spectrum, top: 1H NMR of D4. Blue spectrum, middle: 1H NMR of
PDMS prepared by the oxyanionic polymerisation of D4. Signals assigned to cyclic and
linear components are marked. Red Spectrum, bottom: 1H NMR of PDMS prepared by the
oxyanionic polymerisation of D4 after removing cyclic components by washing with
methanol. B) Integrals used in the evaluation of the ratio between cyclic and linear chains.
Electronic Supplementary Material (ESI) for RSC Advances.This journal is © The Royal Society of Chemistry 2018
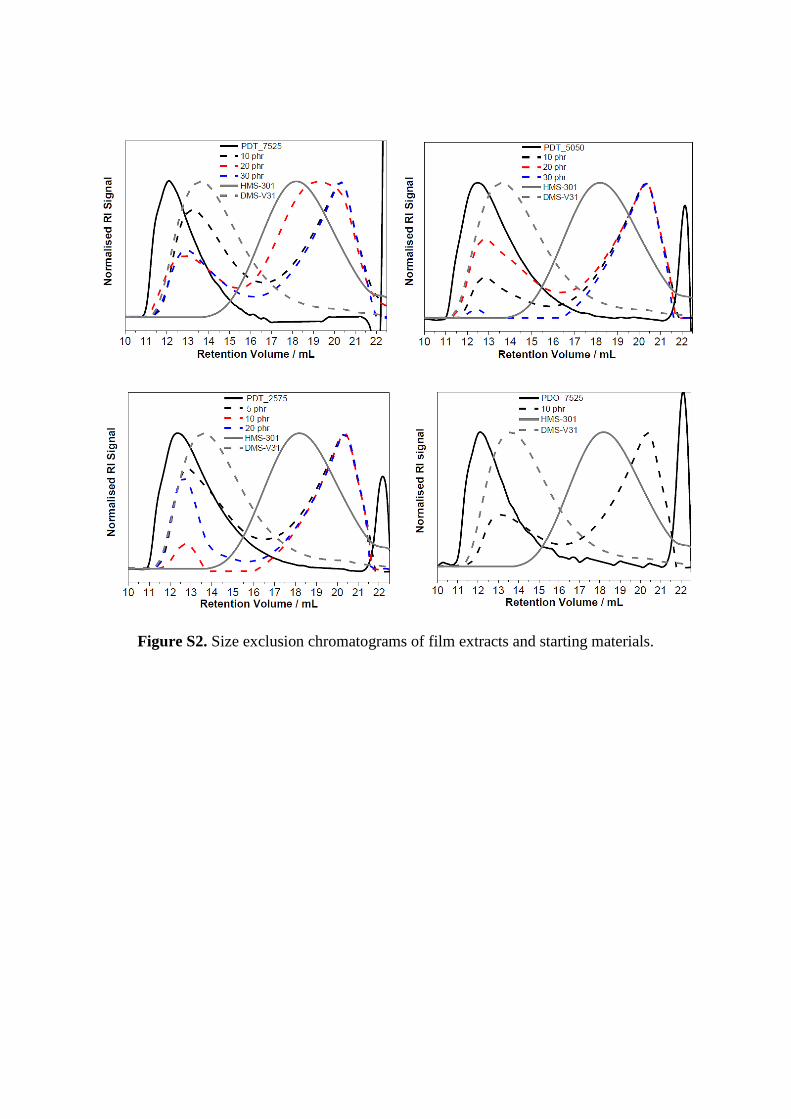
Figure S2. Size exclusion chromatograms of film extracts and starting materials.
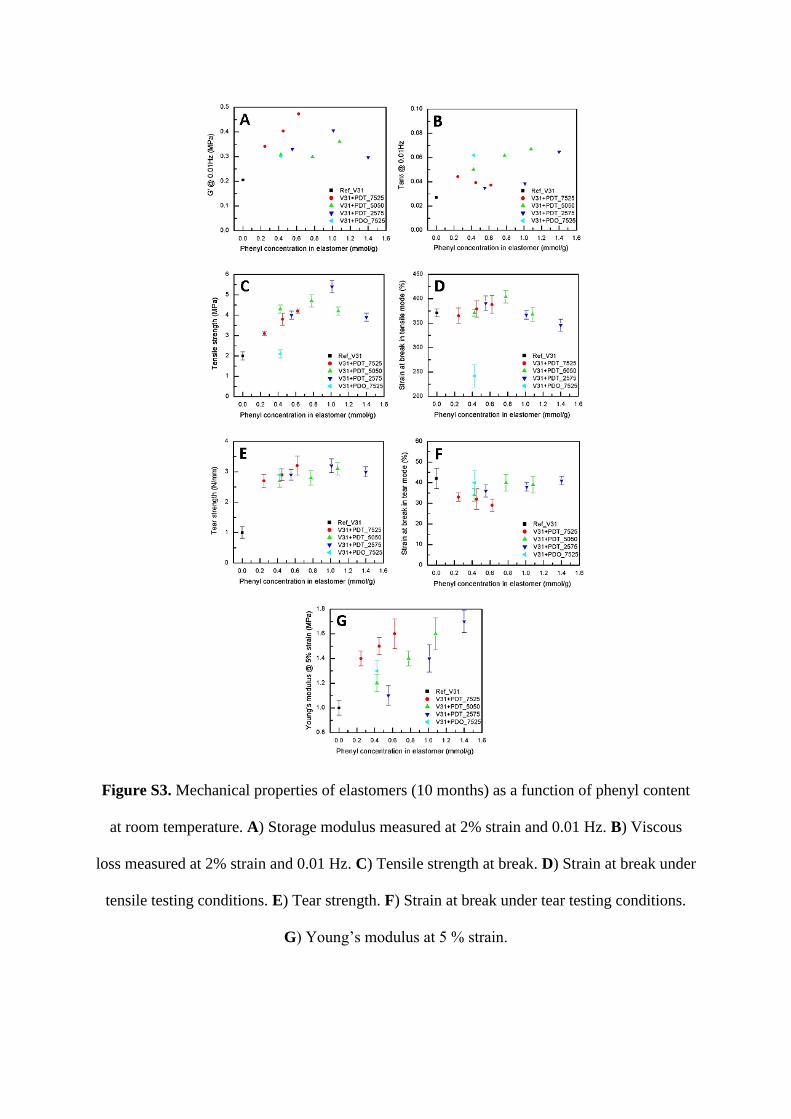
Figure S3. Mechanical properties of elastomers (10 months) as a function of phenyl content
at room temperature. A) Storage modulus measured at 2% strain and 0.01 Hz. B) Viscous
loss measured at 2% strain and 0.01 Hz. C) Tensile strength at break. D) Strain at break under
tensile testing conditions. E) Tear strength. F) Strain at break under tear testing conditions.
G) Young’s modulus at 5 % strain.
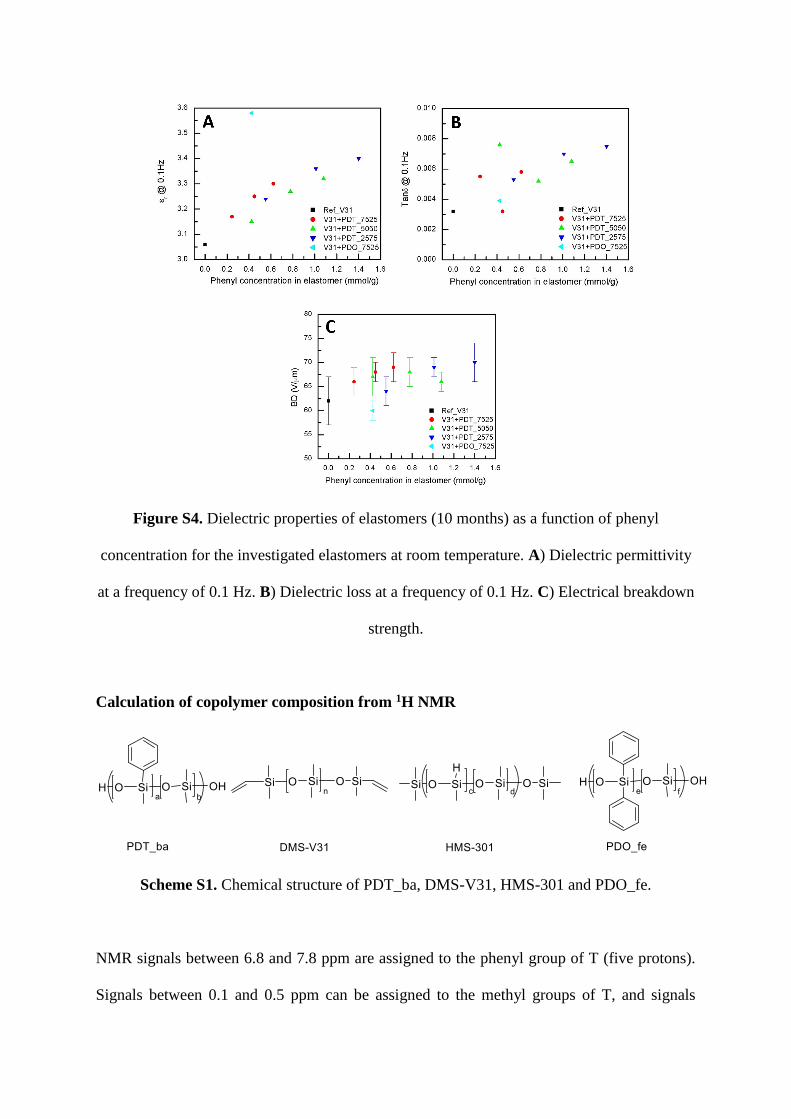
Figure S4. Dielectric properties of elastomers (10 months) as a function of phenyl
concentration for the investigated elastomers at room temperature. A) Dielectric permittivity
at a frequency of 0.1 Hz. B) Dielectric loss at a frequency of 0.1 Hz. C) Electrical breakdown
strength.
Calculation of copolymer composition from 1H NMR
Scheme S1. Chemical structure of PDT_ba, DMS-V31, HMS-301 and PDO_fe.
NMR signals between 6.8 and 7.8 ppm are assigned to the phenyl group of T (five protons).
Signals between 0.1 and 0.5 ppm can be assigned to the methyl groups of T, and signals
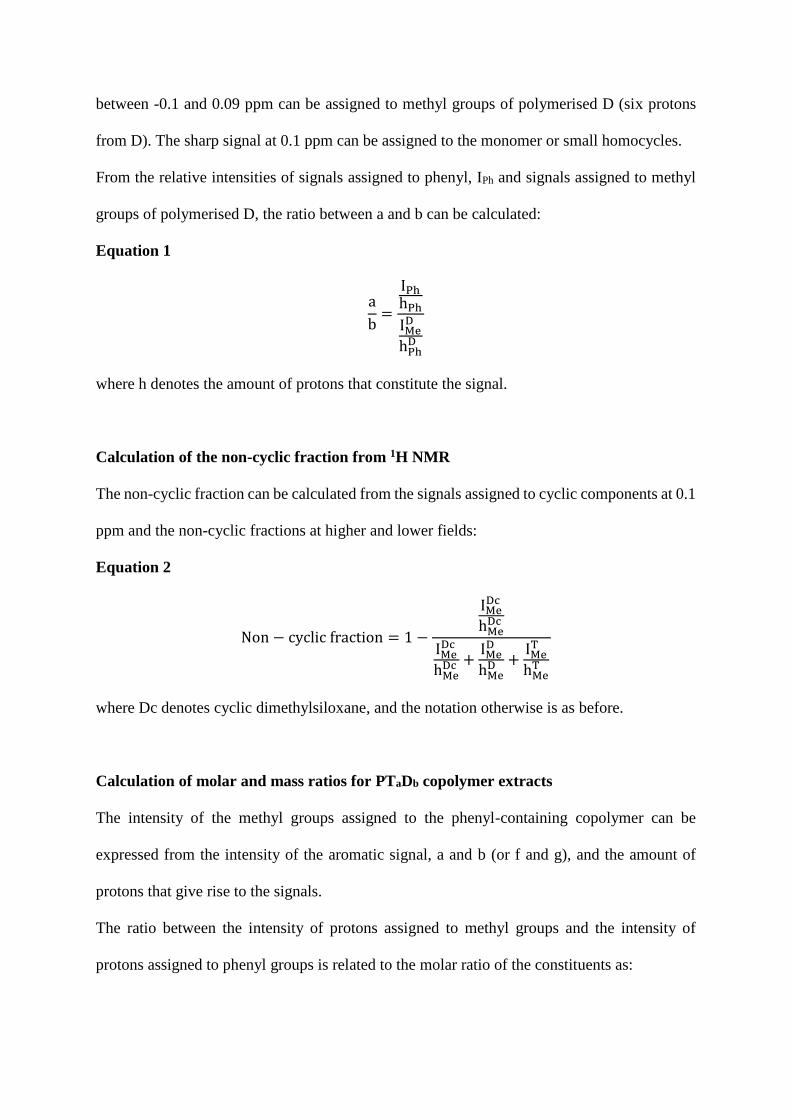
between -0.1 and 0.09 ppm can be assigned to methyl groups of polymerised D (six protons
from D). The sharp signal at 0.1 ppm can be assigned to the monomer or small homocycles.
From the relative intensities of signals assigned to phenyl, IPh and signals assigned to methyl
groups of polymerised D, the ratio between a and b can be calculated:
Equation 1
a
b=
IPh
hPh
IMeD
hPhD
where h denotes the amount of protons that constitute the signal.
Calculation of the non-cyclic fraction from 1H NMR
The non-cyclic fraction can be calculated from the signals assigned to cyclic components at 0.1
ppm and the non-cyclic fractions at higher and lower fields:
Equation 2
Non − cyclic fraction = 1 −
IMeDc
hMeDc
IMeDc
hMeDc +
IMeD
hMeD +
IMeT
hMeT
where Dc denotes cyclic dimethylsiloxane, and the notation otherwise is as before.
Calculation of molar and mass ratios for PTaDb copolymer extracts
The intensity of the methyl groups assigned to the phenyl-containing copolymer can be
expressed from the intensity of the aromatic signal, a and b (or f and g), and the amount of
protons that give rise to the signals.
The ratio between the intensity of protons assigned to methyl groups and the intensity of
protons assigned to phenyl groups is related to the molar ratio of the constituents as:
Equation 3
IMeTot
IPh=
h1′ nPTaDb
Ph + h2nPTaDbNP + h3nDMS−V31 + h4nHMS−301
h1nPTaDbPh
=h1
′ anPTaDb + h2bnPTaDb + h3nDMS−V31 + h4nHMS−301
h1anPTaDb
⇒
IMeTot
IPh−
h1′
h1−
h2b
h1a=
h3nDMS−V31
h1anPTaDb+
h4nHMS−301
h1anPTaDb
Without detailed knowledge of the relative amounts of DMS-V31 and HMS-301 in the extracts,
the molar ratio cannot be calculated. However, on the assumption that the concentration of
either DMS-V31 or HMS-301 is zero, an expression for the ratio can be obtained:
Equation 4
(IMe
Tot
IPh−
h1′
h1−
h2b
h1a)
h1a
h3/4=
nY
nPTaDb
where Y is DMS-V31 or HMS-301 and h3/4 is h3 for no HMS-301 or h4 for no DMS-V31.
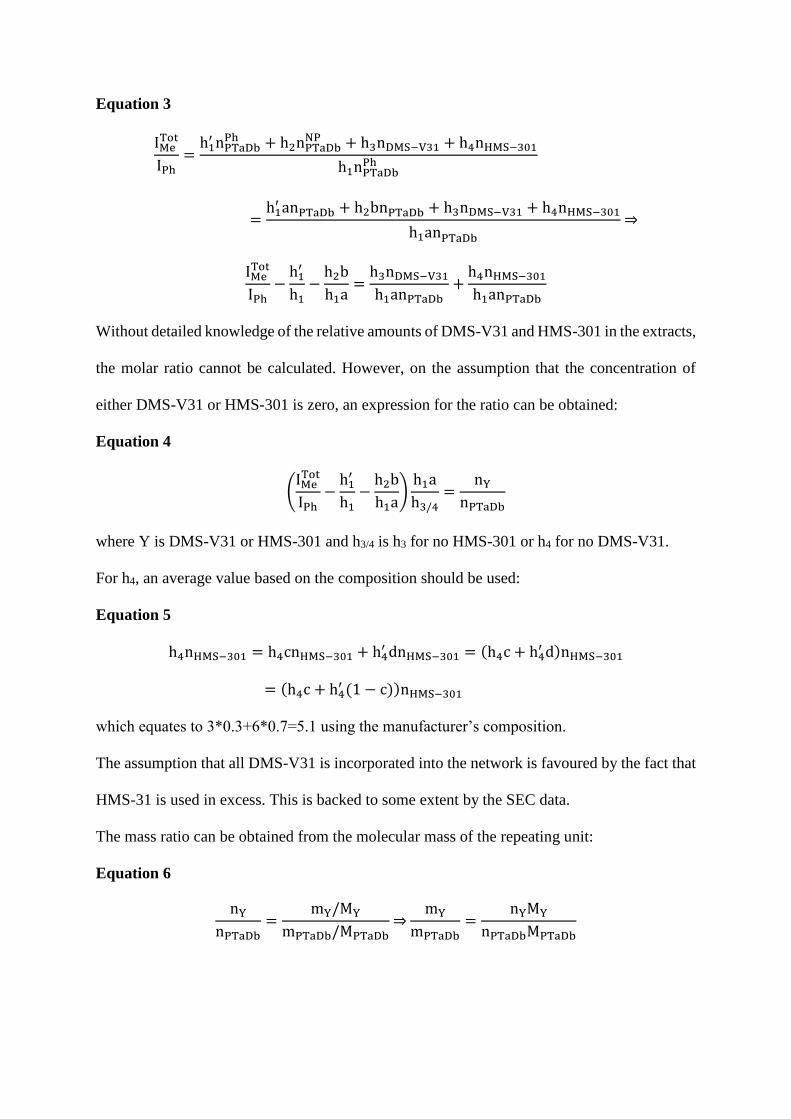
For h4, an average value based on the composition should be used:
Equation 5
h4nHMS−301 = h4cnHMS−301 + h4′ dnHMS−301 = (h4c + h4
′ d)nHMS−301
= (h4c + h4′ (1 − c))nHMS−301
which equates to 3*0.3+6*0.7=5.1 using the manufacturer’s composition.
The assumption that all DMS-V31 is incorporated into the network is favoured by the fact that
HMS-31 is used in excess. This is backed to some extent by the SEC data.
The mass ratio can be obtained from the molecular mass of the repeating unit:
Equation 6
nY
nPTaDb=
mY/MY
mPTaDb/MPTaDb⇒
mY
mPTaDb=
nYMY
nPTaDbMPTaDb
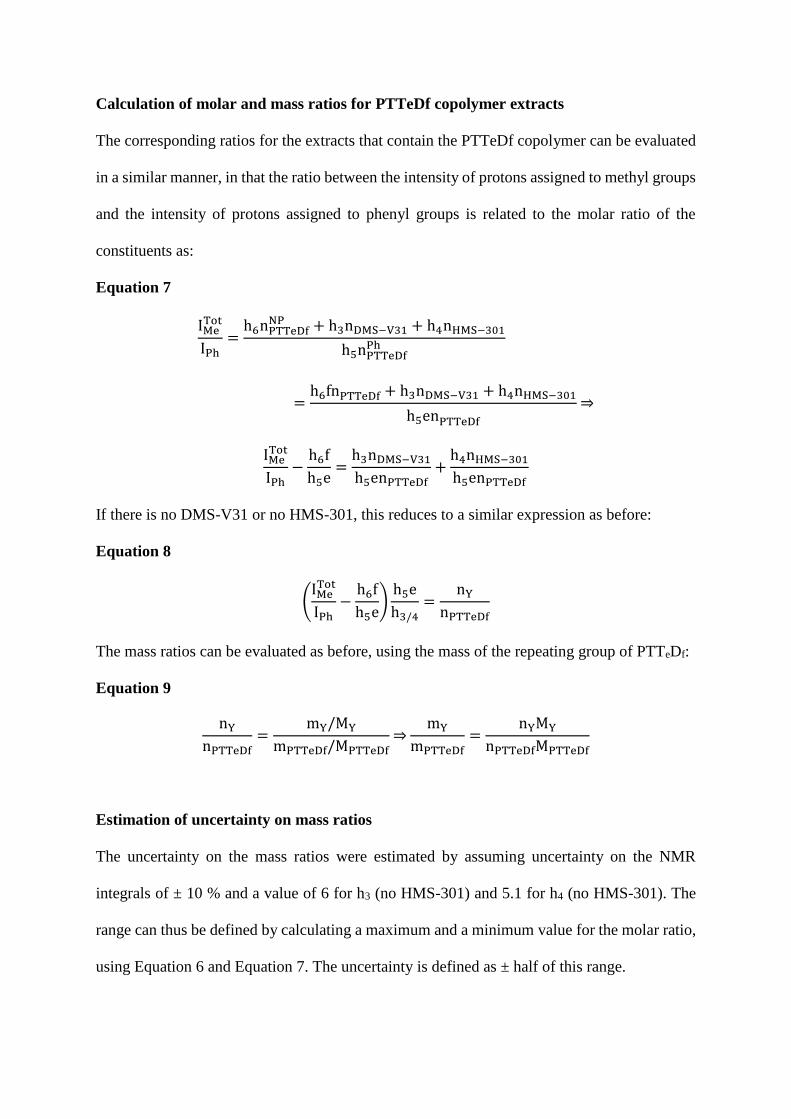
Calculation of molar and mass ratios for PTTeDf copolymer extracts
The corresponding ratios for the extracts that contain the PTTeDf copolymer can be evaluated
in a similar manner, in that the ratio between the intensity of protons assigned to methyl groups
and the intensity of protons assigned to phenyl groups is related to the molar ratio of the
constituents as:
Equation 7
IMeTot
IPh=
h6nPTTeDfNP + h3nDMS−V31 + h4nHMS−301
h5nPTTeDfPh
=h6fnPTTeDf + h3nDMS−V31 + h4nHMS−301
h5enPTTeDf
⇒
IMeTot
IPh−
h6f
h5e=
h3nDMS−V31
h5enPTTeDf+
h4nHMS−301
h5enPTTeDf
If there is no DMS-V31 or no HMS-301, this reduces to a similar expression as before:
Equation 8
(IMe
Tot
IPh−
h6f
h5e)
h5e
h3/4=
nY
nPTTeDf
The mass ratios can be evaluated as before, using the mass of the repeating group of PTTeDf:
Equation 9
nY
nPTTeDf=
mY/MY
mPTTeDf/MPTTeDf⇒
mY
mPTTeDf=
nYMY
nPTTeDfMPTTeDf
Estimation of uncertainty on mass ratios
The uncertainty on the mass ratios were estimated by assuming uncertainty on the NMR
integrals of ± 10 % and a value of 6 for h3 (no HMS-301) and 5.1 for h4 (no HMS-301). The
range can thus be defined by calculating a maximum and a minimum value for the molar ratio,
using Equation 6 and Equation 7. The uncertainty is defined as ± half of this range.
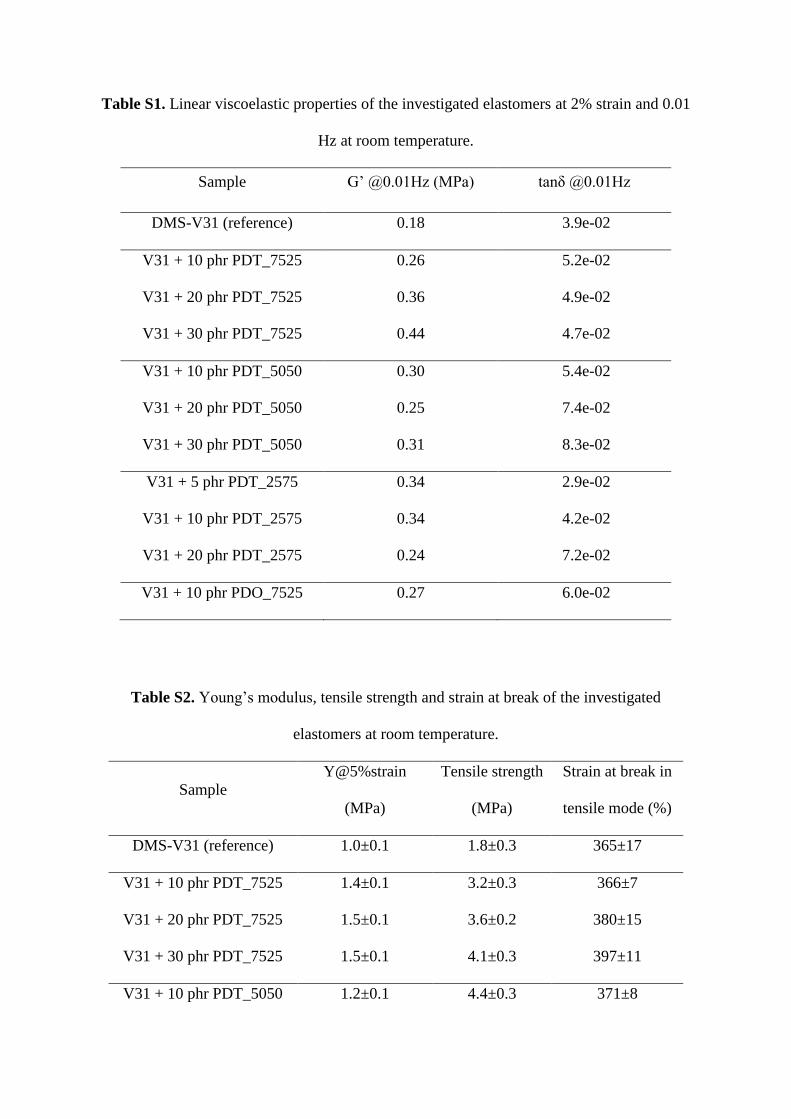
Table S1. Linear viscoelastic properties of the investigated elastomers at 2% strain and 0.01
Hz at room temperature.
Sample G’ @0.01Hz (MPa) tanδ @0.01Hz
DMS-V31 (reference) 0.18 3.9e-02
V31 + 10 phr PDT_7525 0.26 5.2e-02
V31 + 20 phr PDT_7525 0.36 4.9e-02
V31 + 30 phr PDT_7525 0.44 4.7e-02
V31 + 10 phr PDT_5050 0.30 5.4e-02
V31 + 20 phr PDT_5050 0.25 7.4e-02
V31 + 30 phr PDT_5050 0.31 8.3e-02
V31 + 5 phr PDT_2575 0.34 2.9e-02
V31 + 10 phr PDT_2575 0.34 4.2e-02
V31 + 20 phr PDT_2575 0.24 7.2e-02
V31 + 10 phr PDO_7525 0.27 6.0e-02
Table S2. Young’s modulus, tensile strength and strain at break of the investigated
elastomers at room temperature.
Sample
Y@5%strain
(MPa)
Tensile strength
(MPa)
Strain at break in
tensile mode (%)
DMS-V31 (reference) 1.0±0.1 1.8±0.3 365±17
V31 + 10 phr PDT_7525 1.4±0.1 3.2±0.3 366±7
V31 + 20 phr PDT_7525 1.5±0.1 3.6±0.2 380±15
V31 + 30 phr PDT_7525 1.5±0.1 4.1±0.3 397±11
V31 + 10 phr PDT_5050 1.2±0.1 4.4±0.3 371±8
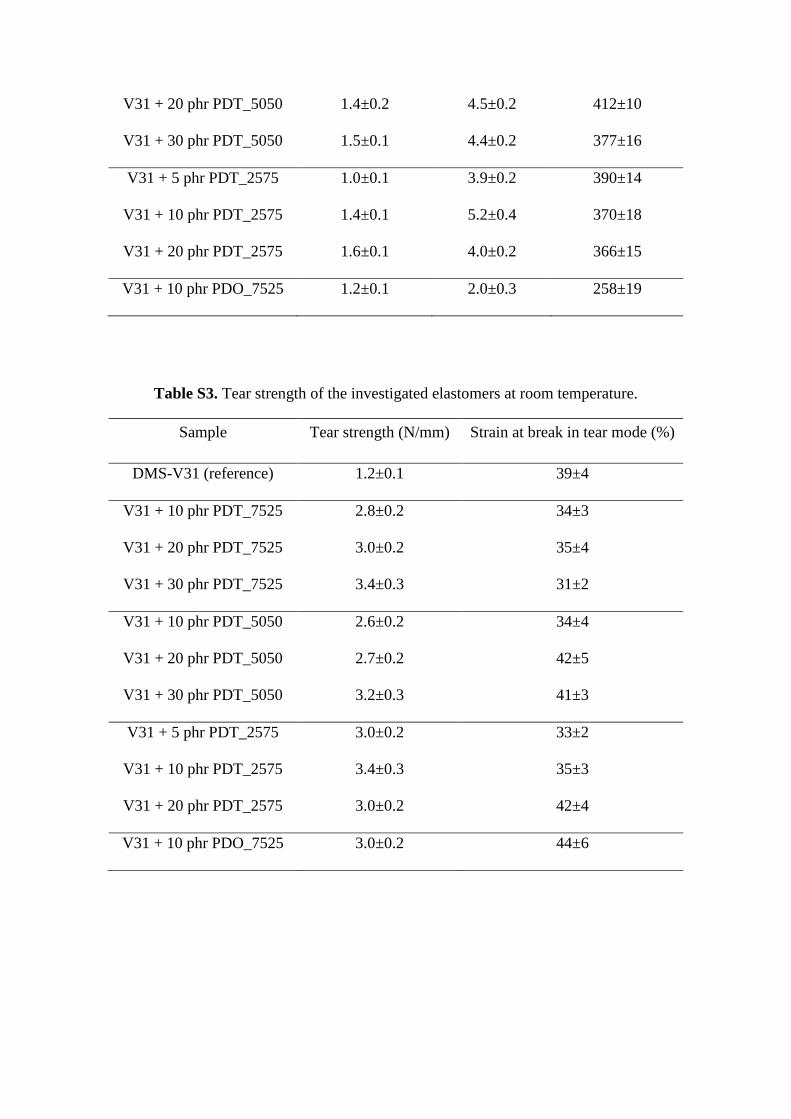
V31 + 20 phr PDT_5050 1.4±0.2 4.5±0.2 412±10
V31 + 30 phr PDT_5050 1.5±0.1 4.4±0.2 377±16
V31 + 5 phr PDT_2575 1.0±0.1 3.9±0.2 390±14
V31 + 10 phr PDT_2575 1.4±0.1 5.2±0.4 370±18
V31 + 20 phr PDT_2575 1.6±0.1 4.0±0.2 366±15
V31 + 10 phr PDO_7525 1.2±0.1 2.0±0.3 258±19
Table S3. Tear strength of the investigated elastomers at room temperature.
Sample Tear strength (N/mm) Strain at break in tear mode (%)
DMS-V31 (reference) 1.2±0.1 39±4
V31 + 10 phr PDT_7525 2.8±0.2 34±3
V31 + 20 phr PDT_7525 3.0±0.2 35±4
V31 + 30 phr PDT_7525 3.4±0.3 31±2
V31 + 10 phr PDT_5050 2.6±0.2 34±4
V31 + 20 phr PDT_5050 2.7±0.2 42±5
V31 + 30 phr PDT_5050 3.2±0.3 41±3
V31 + 5 phr PDT_2575 3.0±0.2 33±2
V31 + 10 phr PDT_2575 3.4±0.3 35±3
V31 + 20 phr PDT_2575 3.0±0.2 42±4
V31 + 10 phr PDO_7525 3.0±0.2 44±6
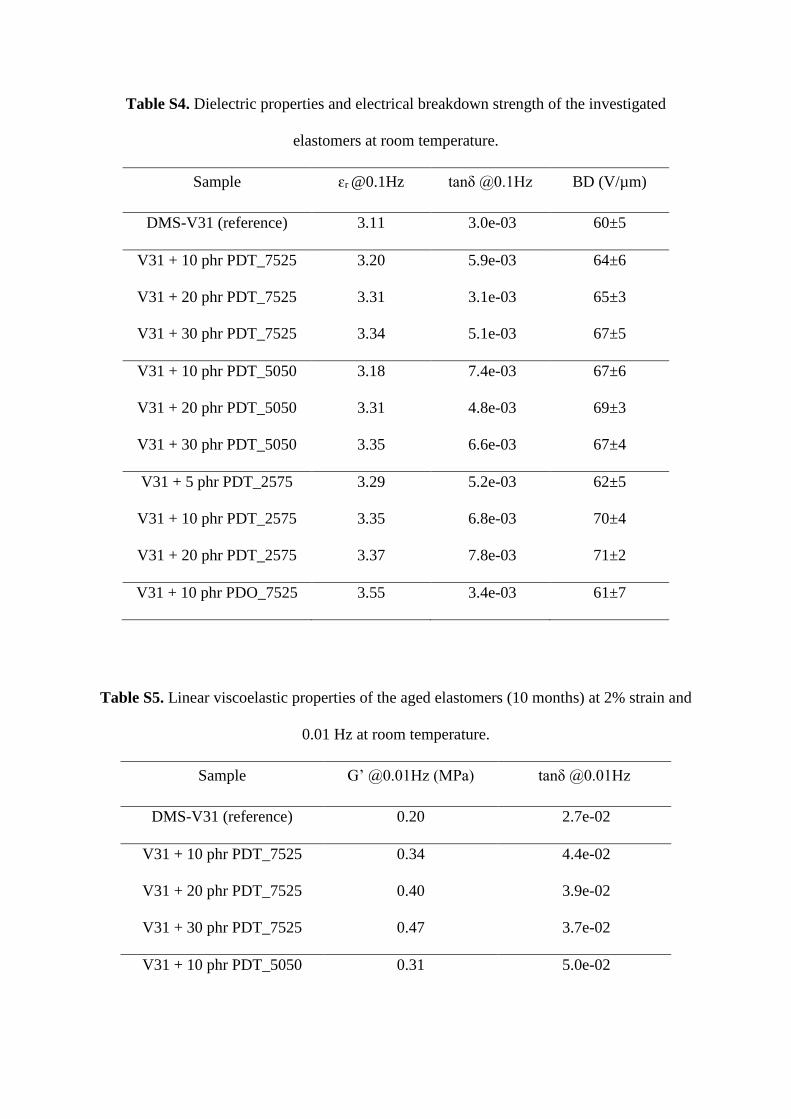
Table S4. Dielectric properties and electrical breakdown strength of the investigated
elastomers at room temperature.
Sample ɛr @0.1Hz tanδ @0.1Hz BD (V/µm)
DMS-V31 (reference) 3.11 3.0e-03 60±5
V31 + 10 phr PDT_7525 3.20 5.9e-03 64±6
V31 + 20 phr PDT_7525 3.31 3.1e-03 65±3
V31 + 30 phr PDT_7525 3.34 5.1e-03 67±5
V31 + 10 phr PDT_5050 3.18 7.4e-03 67±6
V31 + 20 phr PDT_5050 3.31 4.8e-03 69±3
V31 + 30 phr PDT_5050 3.35 6.6e-03 67±4
V31 + 5 phr PDT_2575 3.29 5.2e-03 62±5
V31 + 10 phr PDT_2575 3.35 6.8e-03 70±4
V31 + 20 phr PDT_2575 3.37 7.8e-03 71±2
V31 + 10 phr PDO_7525 3.55 3.4e-03 61±7
Table S5. Linear viscoelastic properties of the aged elastomers (10 months) at 2% strain and
0.01 Hz at room temperature.
Sample G’ @0.01Hz (MPa) tanδ @0.01Hz
DMS-V31 (reference) 0.20 2.7e-02
V31 + 10 phr PDT_7525 0.34 4.4e-02
V31 + 20 phr PDT_7525 0.40 3.9e-02
V31 + 30 phr PDT_7525 0.47 3.7e-02
V31 + 10 phr PDT_5050 0.31 5.0e-02
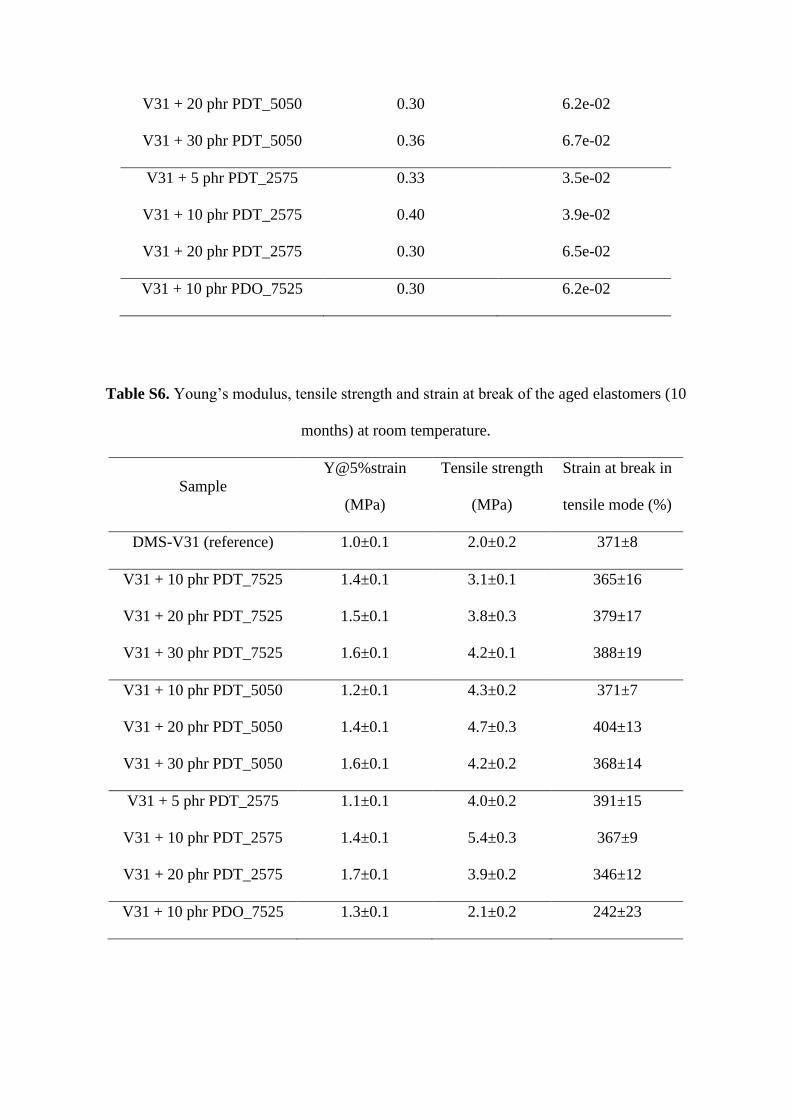
V31 + 20 phr PDT_5050 0.30 6.2e-02
V31 + 30 phr PDT_5050 0.36 6.7e-02
V31 + 5 phr PDT_2575 0.33 3.5e-02
V31 + 10 phr PDT_2575 0.40 3.9e-02
V31 + 20 phr PDT_2575 0.30 6.5e-02
V31 + 10 phr PDO_7525 0.30 6.2e-02
Table S6. Young’s modulus, tensile strength and strain at break of the aged elastomers (10
months) at room temperature.
Sample
Y@5%strain
(MPa)
Tensile strength
(MPa)
Strain at break in
tensile mode (%)
DMS-V31 (reference) 1.0±0.1 2.0±0.2 371±8
V31 + 10 phr PDT_7525 1.4±0.1 3.1±0.1 365±16
V31 + 20 phr PDT_7525 1.5±0.1 3.8±0.3 379±17
V31 + 30 phr PDT_7525 1.6±0.1 4.2±0.1 388±19
V31 + 10 phr PDT_5050 1.2±0.1 4.3±0.2 371±7
V31 + 20 phr PDT_5050 1.4±0.1 4.7±0.3 404±13
V31 + 30 phr PDT_5050 1.6±0.1 4.2±0.2 368±14
V31 + 5 phr PDT_2575 1.1±0.1 4.0±0.2 391±15
V31 + 10 phr PDT_2575 1.4±0.1 5.4±0.3 367±9
V31 + 20 phr PDT_2575 1.7±0.1 3.9±0.2 346±12
V31 + 10 phr PDO_7525 1.3±0.1 2.1±0.2 242±23
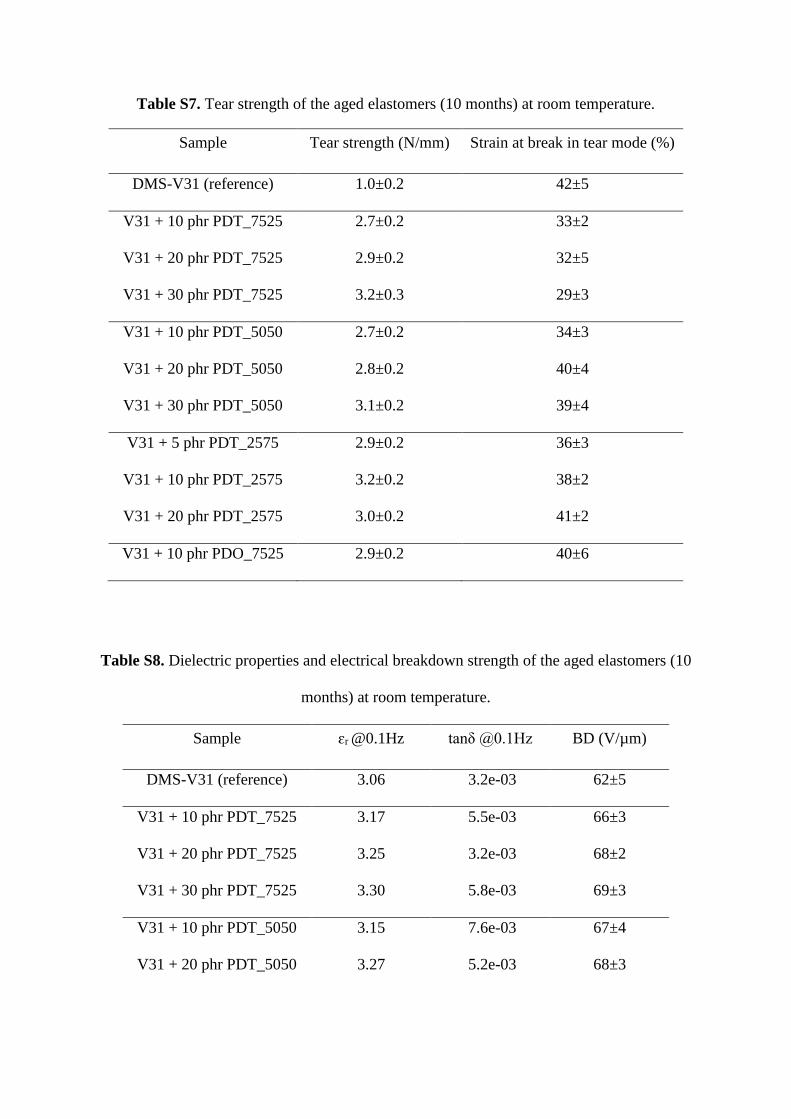
Table S7. Tear strength of the aged elastomers (10 months) at room temperature.
Sample Tear strength (N/mm) Strain at break in tear mode (%)
DMS-V31 (reference) 1.0±0.2 42±5
V31 + 10 phr PDT_7525 2.7±0.2 33±2
V31 + 20 phr PDT_7525 2.9±0.2 32±5
V31 + 30 phr PDT_7525 3.2±0.3 29±3
V31 + 10 phr PDT_5050 2.7±0.2 34±3
V31 + 20 phr PDT_5050 2.8±0.2 40±4
V31 + 30 phr PDT_5050 3.1±0.2 39±4
V31 + 5 phr PDT_2575 2.9±0.2 36±3
V31 + 10 phr PDT_2575 3.2±0.2 38±2
V31 + 20 phr PDT_2575 3.0±0.2 41±2
V31 + 10 phr PDO_7525 2.9±0.2 40±6
Table S8. Dielectric properties and electrical breakdown strength of the aged elastomers (10
months) at room temperature.
Sample ɛr @0.1Hz tanδ @0.1Hz BD (V/µm)
DMS-V31 (reference) 3.06 3.2e-03 62±5
V31 + 10 phr PDT_7525 3.17 5.5e-03 66±3
V31 + 20 phr PDT_7525 3.25 3.2e-03 68±2
V31 + 30 phr PDT_7525 3.30 5.8e-03 69±3
V31 + 10 phr PDT_5050 3.15 7.6e-03 67±4
V31 + 20 phr PDT_5050 3.27 5.2e-03 68±3
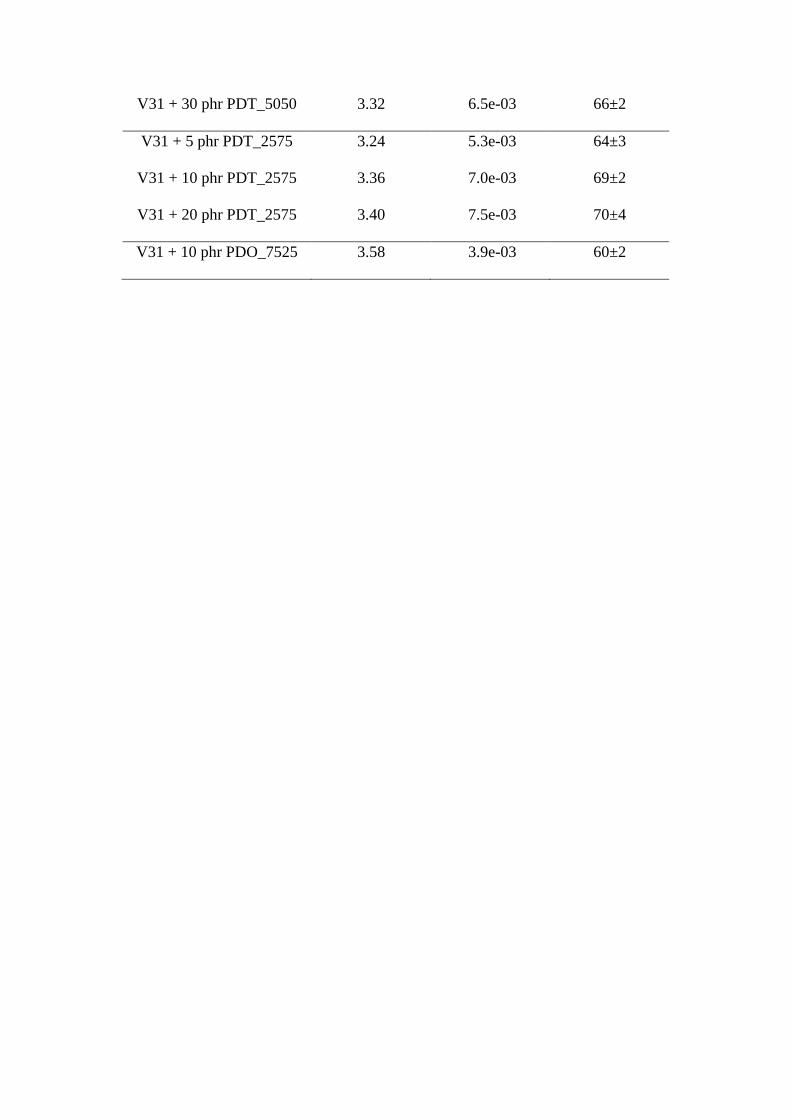
V31 + 30 phr PDT_5050 3.32 6.5e-03 66±2
V31 + 5 phr PDT_2575 3.24 5.3e-03 64±3
V31 + 10 phr PDT_2575 3.36 7.0e-03 69±2
V31 + 20 phr PDT_2575 3.40 7.5e-03 70±4
V31 + 10 phr PDO_7525 3.58 3.9e-03 60±2