Embed Size (px)
Citation preview

ARPO
ENI S.p.A.Agip Division
ORGANISINGDEPARTMENT
TYPE OFACTIVITY'
ISSUINGDEPT.
DOC.TYPE
REFER TOSECTION N.
PAGE. 1
OF 295
STAP P 1 M 7100
The present document is CONFIDENTIAL and it is property of AGIP It shall not be shown to third parties nor shall it be used forreasons different from those owing to which it was given
TITLE
COMPLETION DESIGN MANUAL
DISTRIBUTION LIST
Eni - Agip Division Italian Districts
Eni - Agip Division Affiliated Companies
Eni - Agip Division Headquarter Drilling & Completion Units
STAP Archive
Eni - Agip Division Headquarter Subsurface Geology Units
Eni - Agip Division Headquarter Reservoir Units
Eni - Agip Division Headquarter Coordination Units for Italian Activities
Eni - Agip Division Headquarter Coordination Units for Foreign Activities
NOTE: The present document is available in Eni Agip Intranet (http://wwwarpo.in.agip.it) and aCD-Rom version can also be distributed (requests will be addressed to STAP Dept. inEni - Agip Division Headquarter)
Date of issue:
f
e
d
c
b Issued by M. Bassanini C. Lanzetta A. Galletta28/06/99 28/06/99 28/06/99
REVISIONS PREP'D CHK'D APPR'D
28/06/99

ARPO
ENI S.p.A.Agip Division
IDENTIFICATION CODE PAGE 2 OF 295
REVISIONSTAP-P-1-M-7100 0
INDEX
1. INTRODUCTION 8
1.1. PURPOSE OF THE MANUAL 8
1.2. OBJECTIVES 12
1.3. FUNCTIONS OF A COMPLETION 13
1.4. MANUAL UPDATING, AMENDMENT, CONTROL & DEROGATION 13
2. RESERVOIR CONSIDERATIONS 14
2.1. INTRODUCTION 14
2.2. CHARACTERISTICS OF RESERVOIR ROCKS 142.2.1. Porosity 142.2.2. Permeability 142.2.3. Relative Permeability 152.2.4. Wettabilty 162.2.5. Fluid Distribution 172.2.6. Fluid Flow In The Reservoir 182.2.7. Effects Of Reservoir Characteristics 242.2.8. Reservoir Homogeneity 27
2.3. HYDROCARBON DATA 282.3.1. Oil Property Correlation 28
2.4. RESERVOIR/PRODUCTION FORECAST 292.4.1. Inflow Perfomance 312.4.2. Reservoir Simulation For IPR Curves 422.4.3. IPR Selection 442.4.4. Outflow Performance 462.4.5. Flow Rate Prediction 55
3. WELL TESTING 60
3.1. INTRODUCTION 603.1.1. Types of Tests 60
3.2. DST OBJECTIVE 63
3.3. DST STRING 64
3.4. RESERVOIR CHARACTERISTICS 693.4.1. Pressure Build-Up Analysis 693.4.2. Basics Of DST Operations 773.4.3. Common Test Tools Description 773.4.4. Tools Utilised With Permanent Packer Systems 803.4.5. Sub-Sea Test Tools Used On Semi-Submersibles 803.4.6. Deep Water Tools 813.4.7. Downhole Pressure Recording 82

ARPO
ENI S.p.A.Agip Division
IDENTIFICATION CODE PAGE 3 OF 295
REVISIONSTAP-P-1-M-7100 0
3.5. WELL PRODUCTION TEST OBJECTIVES 833.5.1. Periodic Tests 833.5.2. Productivity Or Deliverability Tests 843.5.3. Transient Tests 84
4. DRILLING CONSIDERATIONS 87
4.1. CASING DESIGN 874.1.1. Casing Profile 874.1.2. Casing Specifications 884.1.3. Casing Connections 89
4.2. WELL DEVIATION SURVEYS 89
4.3. CASING CEMENTING CONSIDERATIONS 904.3.1. Production Casing Cementing 904.3.2. Production Casing Cement Evaluation 91
5. WELL COMPLETION DESIGN 92
5.1. FACTORS INFLUENCING COMPLETION DESIGN 945.1.1. Reservoir Considerations 945.1.2. Mechanical Considerations 965.1.3. Safety Considerations 96
5.2. RESERVOIR-WELLBORE INTERFACE 975.2.1. Open Hole Completions 975.2.2. Uncemented Liner Completions 985.2.3. Perforated Completions 1005.2.4. Multi-Zone Completions 101
5.3. CASING-TUBING INTERFACE 1045.3.1. Packer Applications 1065.3.2. Packer-Tubing Interfaces 1075.3.3. Annulus Circulation 108
5.4. TUBING-WELLHEAD INTERFACE 1095.4.1. Tubing Hanger Systems 1095.4.2. Xmas Trees 1155.4.3. Metal-To-Metal Seals 115
5.5. FUTURE CONSIDERATIONS 1175.5.1. Stimulation 1185.5.2. Formation Management 1185.5.3. Well Servicing Techniques 119
5.6. OPTIMISING TUBING SIZE 1215.6.1. Reservoir Pressure 1235.6.2. Flowing Wellhead Pressure 1235.6.3. Gas-Liquid Ratio 1235.6.4. Artificial Lift 124

ARPO
ENI S.p.A.Agip Division
IDENTIFICATION CODE PAGE 4 OF 295
REVISIONSTAP-P-1-M-7100 0
6. CORROSION 126
6.1. DEVELOPMENT WELLS 126
6.2. CONTRIBUTING FACTORS TO CORROSION 126
6.3. FORMS OF CORROSION 1286.3.1. Sulphide Stress Cracking (SSC) 1286.3.2. Corrosion Caused By CO2 And Cl- 1356.3.3. Corrosion Caused By H2S, CO2 And Cl- 137
6.4. CORROSION CONTROL MEASURES 138
6.5. CORROSION INHIBITORS 139
6.6. CORROSION RESISTANCE OF STAINLESS STEELS 1396.6.1. Martensitic Stainless Steels 1396.6.2. Ferritic Stainless Steels 1406.6.3. Austenitic Stainless Steels 1406.6.4. Precipitation Hardening Stainless Steels 1406.6.5. Duplex Stainless Steel 142
6.7. COMPANY DESIGN PROCEDURE 1426.7.1. CO2 Corrosion 1426.7.2. H2S Corrosion 142
6.8. MATERIAL SELECTION 1446.8.1. OCTG Specifications 1456.8.2. DHE Specifications 1466.8.3. Wellhead Specifications 147
6.9. ORDERING SPECIFICATIONS 152
7. TUBING DESIGN 153
7.1. POLICIES 153
7.2. THEORY 1537.2.1. Mechanical Properties of Steel 1547.2.2. Temperature 1587.2.3. Tubing Movement/Stress Relationship 158
7.3. WELL DATA. 1607.3.1. Casing Profile/Geometry 1607.3.2. Tubing Data 1607.3.3. Bottom-hole Pressure 1607.3.4. Temperatures (Static and Flowing) 1607.3.5. Reservoir Fluids 1617.3.6. Completion Fluid 161
7.4. PRESSURE INDUCED FORCES 1617.4.1. Piston Effect 1627.4.2. Buckling Effect 1637.4.3. Ballooning Effect 1677.4.4. Temperature Effect 168
7.5. EVALUATION OF TOTAL TUBING MOVEMENT 169
ARPO
ENI S.p.A.Agip Division
IDENTIFICATION CODE PAGE 5 OF 295
REVISIONSTAP-P-1-M-7100 0
7.6. ANCHORED TUBING 1707.6.1. Tubing Permitting Limited Motion 1727.6.2. Packer Setting 174
7.7. TUBING LOAD CONDITIONS 1747.7.1. Pressure Testing 1747.7.2. Acid Stimulation 1757.7.3. Fracturing 1757.7.4. Flowing 1777.7.5. Shut-In 1777.7.6. Load Condition Summary 181
7.8. TUBING SELECTION 1817.8.1. Critical Factors 1827.8.2. Tubing Size And Weight 1827.8.3. Anchoring Systems 184
7.9. TUBING CONNECTIONS 1857.9.1. Policy 1857.9.2. Class of Service 1857.9.3. Selection Criteria 1867.9.4. NACE And Proximity Definitions 1897.9.5. CRA Connections 1907.9.6. Connection Data 190
7.10. TUBING STRESS CALCULATIONS 1907.10.1. Calculation Methods 1917.10.2. Safety Factor 1937.10.3. External Pressure Limit 1957.10.4. Packer Load Limits 1957.10.5. Example Manual Calculation 1967.10.6. Example Computation 205
8. SUB-SURFACE EQUIPMENT 206
8.1. PACKERS 2068.1.1. Selection Procedure 2078.1.2. Selection Criteria 2078.1.3. Well Classification 2098.1.4. Packer Selection For Single String Completion 2098.1.5. Single Selective Completion Packers 217
8.2. SUB-SURFACE SAFETY VALVES 2238.2.1. Policy 2238.2.2. Applications 2238.2.3. Wireline Retrievable Safety Valves 2238.2.4. Surface Controlled Sub-Surface Safety Valves 2248.2.5. Valve Type/Closure Mechanism Selection 224

ARPO
ENI S.p.A.Agip Division
IDENTIFICATION CODE PAGE 6 OF 295
REVISIONSTAP-P-1-M-7100 0
8.3. CONTROL/INJECTION LINE SELECTION 2258.3.1. Control Lines 2258.3.2. Injection Lines 2258.3.3. Tube Specifications 2268.3.4. Material Selection 2288.3.5. Fittings 2308.3.6. Protectors 2308.3.7. Encapsulation 2318.3.8. SCSSV Hydraulic Control fluid 2338.3.9. Control/Injection Line Selection Procedure Flow Chart 236
8.4. WIRELINE NIPPLE SELECTION 2378.4.1. Tapered Nipple Configuration 2388.4.2. Selective Nipple Configuration 239
9. PERFORATING 240
9.1. SHAPED CHARGE PERFORATING 240
9.2. GUN TYPES 2419.2.1. Wireline Conveyed Casing Guns 2419.2.2. Through-Tubing Hollow Carrier Guns 2439.2.3. Through-Tubing Strip Guns 2439.2.4. Tubing Conveyed Perforating 243
9.3. GUN PERFORMANCE 2449.3.1. API And Performance Data 2449.3.2. Underbalanced Perforating 2469.3.3. Firing Heads 2479.3.4. Perforating Procedures 247
10. ARTIFICIAL LIFT 250
10.1. GAS LIFT 25110.1.1. Impact On Completion Design 25310.1.2. Common Problems 254
10.2. ELECTRICAL SUBMERISBLE PUMPS 25410.2.1. ESP Performance 25610.2.2. Impact On Completion Design 25910.2.3. Common Problems 259
10.3. HYDRAULIC PUMPING SYSTEMS 26010.3.1. Impact On Completion Design 262
10.4. ROD PUMPS 26210.4.1. Impact On Completion Design 265
10.5. SCREW PUMP SYSTEMS 265
10.6. PLUNGER LIFT 265
10.7. SUMMARY ARTIFICIAL LIFT SELECTION CHARTS 26810.7.1. Design Considerations And Comparisons 26810.7.2. Operating Conditions Summary 27010.7.3. Artificial Lift Considerations 272

ARPO
ENI S.p.A.Agip Division
IDENTIFICATION CODE PAGE 7 OF 295
REVISIONSTAP-P-1-M-7100 0
11. USE OF UNDERBALANCE COMPLETION FLUIDS 274
11.1. POLICY 274
11.2. BARRIER PRINCIPLES 274
11.3. APPLICATION 274
11.4. RISK ASSESSMENT 27511.4.1. Well Testing 27511.4.2. Completions 275
APPENDIX A - REPORT FORMS 276
A.1. INITIAL ACTIVITY REPORT (ARPO 01) 277
A.2. DAILY REPORT (ARPO 02) 278
A.3. WASTE DISPOSAL MANAGEMENT REPORT (ARPO 06) 279
A.3. PERFORATING REPORT (ARPO 07) 280
A.4. GRAVEL PACK REPORT (ARPO 08) 281
A.5. MATRIX STIMULATION/HYDRAULIC FRACTURE REPORT (APRO 09) 282
A.6. WIRELINE REPORT (ARPO 11) 283
A.7. PRESSURE/TEMPERATURE SURVEY REPORT (ARPO 12) 284
A.8. WELL PROBLEM REPORT (ARPO 13) 285
A.9. WELL SITUATION REPORT (ARPO 20) 286
APPENDIX B - NOMENCLATURE FOR TUBING CALCULATIONS 287
APPENDIX C - ABBREVIATIONS 289
APPENDIX D - BIBLIOGRAPHY 292
APPENDIX E - TUBING MOVEMENT/STRESS COMPUTER PROGRAMMES 294

ARPO
ENI S.p.A.Agip Division
IDENTIFICATION CODE PAGE 8 OF 295
REVISIONSTAP-M-1-P-7100 0
1. INTRODUCTION
1.1. PURPOSE OF THE MANUAL
The purpose of this manual is to guide experienced engineers of all technical disciplines,within the Eni-Agip Division and Affiliated Companies, in the completion design process andits importance on well productivity, well servicing capabilities and completion life. These inconsequence, have a large impact on costs and field profit.
The Corporate Standards in this manual define the requirements, methodologies and rulesthat enable to operate uniformly and in compliance with the Corporate Company Principles.This, however, still enables each individual Affiliated Company the capability to operateaccording to local laws or particular environmental situations.
The final aim is to improve performance and efficiency in terms of safety, quality and costs,while providing all personnel involved in Drilling & Completion activities with commonguidelines in all areas worldwide where Eni-Agip operates.
The approach to completion design must be interdiscipline, involving Reservoir Engineering,Petroleum Engineering, Production Engineering and Drilling Engineering. This is vital inorder to obtain the optimum completion design utilising the process described in thismanual.
The manual will provide the engineers within the various disciplines with a system to guidethem through the process with the objectives of helping them make the key decisions andobtaining the optimum design to maximise productivity and, hence profit.
Many of the decisions made by the various disciplines are interrelated and impact on thedecisions made by other disciplines. For instance, the decision on the well architecture maysubsequently be changed due to the availability of well servicing or workover techniques.This does not mean that the process is sequential and many decisions can be made fromstudies and analysis run in parallel.
The design process consists of three phases:
• Conceptual• Detailed design• Procurement.
The process of well preparation and installation of completions is fully described in the‘Completions Procedures manual’.
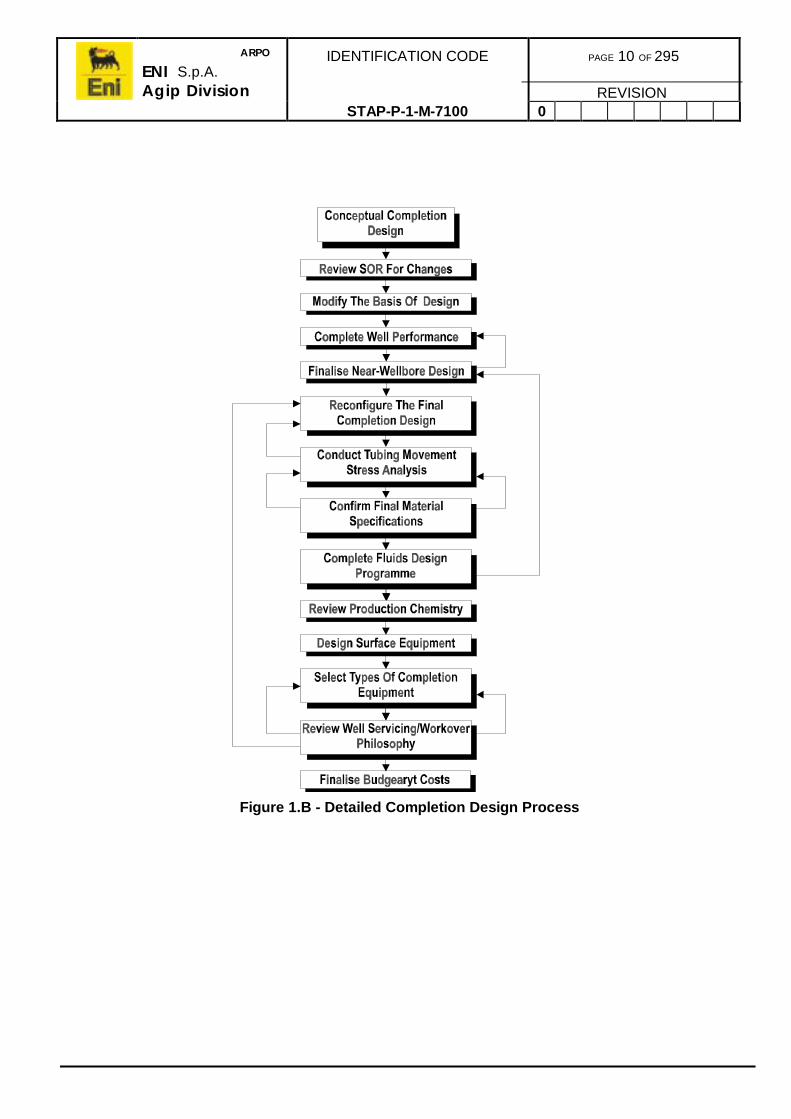
The activities in each phase are illustrated in figure 1.a, figure 1.b and figure 1.c.
The conceptual design process guides the engineers through analysis and key questions tobe considered. During this phase, the user will resolve many of the dilemmas, raised by theinterrelated decisions, at an early time. The final conceptual design will be used as the basisfor the detailed design process.
The conceptual design process begins at the field appraisal stage when a Statement OfRequirements (SOR) of the completion is produced. It is essential that this is an accuratestatement including all the foreseen requirements, as it has a fundamental effect on thefield final design and development.

ARPO
ENI S.p.A.Agip Division
IDENTIFICATION CODE PAGE 9 OF 295
REVISIONSTAP-P-1-M-7100 0
As more information is gleamed from further development wells and as conditions change,the statement of requirements need to reviewed and altered to modify the conceptualdesign for future wells. This provides a system of ongoing completion optimisation to suitchanging conditions, increased knowledge of the field and incorporate new technologies.
Figure 1.A - Conceptual Completion Design Process
ARPO
ENI S.p.A.Agip Division
IDENTIFICATION CODE PAGE 10 OF 295
REVISIONSTAP-P-1-M-7100 0
Figure 1.B - Detailed Completion Design Process

ARPO
ENI S.p.A.Agip Division
IDENTIFICATION CODE PAGE 11 OF 295
REVISIONSTAP-P-1-M-7100 0
Figure 1.C - Procurement Process

ARPO
ENI S.p.A.Agip Division
IDENTIFICATION CODE PAGE 12 OF 295
REVISIONSTAP-P-1-M-7100 0
1.2. OBJECTIVES
The fundamental objectives for a completion are:
• Achieve a desired (optimum) level of production or injection.• Provide adequate maintenance and surveillance programmes.• Be as simple as possible to increase reliability.• Provide adequate safety in accordance with legislative or company requirements
and industry common practices.• Be as flexible as possible for future operational changes in well function.• In conjunction with other wells, effectively contribute to the whole development
plan reservoir plan.• Achieve the optimum production rates reliably at the lowest capital and
operating costs.
These may be summarised as to safely provide maximum long term profitability. This,however, in reality is not simple and many critical decisions are needed to balance longterm and short term cash flow and sometimes compromises are made.
An expensive completion may derive more long term profit than a low cost completion butthe initial capital costs will be higher (Refer to figure 1.d).
Figure 1.D - Completion Design Versus Profitability

ARPO
ENI S.p.A.Agip Division
IDENTIFICATION CODE PAGE 13 OF 295
REVISIONSTAP-P-1-M-7100 0
On the other hand if the data available is not accurate, the estimate of some wellperformance and characteristics throughout the life of the well may be wrong and earlyworkover or well intervention operations will impact on well profitability.
An inherent problem is that the Reservoir Engineering Department’s objectives do notcoincide with the Completion Engineering Department’s in that Reservoir Engineering’sobjectives are for the whole field performance whereas the Completion Group’s is tooptimise for profit on a long term well by well basis which includes well servicing/workover.
Reservoir and geoscience groups often have to set plans and objectives for the field on wellperformance based on limited information, in the early stages, but are not concerned aboutproduction problems, well maintenance or detailed operations.
1.3. FUNCTIONS OF A COMPLETION
The main function of a completion is to produce hydrocarbons to surface or deliver injectionfluids to formations. This is its primary function, however a completion must also satisfy agreat many other functions required for safety, optimising production, servicing, pressuremonitoring and reservoir maintenance.
These main functional requirements must be built into the conceptual design and include:
• Protecting the production casing from formation pressure.• Protecting the casing from corrosion attack by well fluids.• Preventing hydrocarbon escape if there is a surface leak.• Inhibiting scale or corrosion.• Producing single or multiple zones.• Perforating (underbalanced or overbalanced).• Permanent downhole pressure monitoring.
1.4. MANUAL UPDATING, AMENDMENT, CONTROL & DEROGATION
The Corporate Standards in this manual define the requirements, methodologies and rulesthat enable to operate uniformly and in compliance with the Corporate Company Principles.This, however, still enables each individual Affiliated Company the capability to operateaccording to local laws or particular environmental situations.
The final aim is to improve performance and efficiency in terms of safety, quality and costs,while providing all personnel involved in Drilling & Completion activities with commonguidelines in all areas worldwide where Eni-Agip operates.

ARPO
ENI S.p.A.Agip Division
IDENTIFICATION CODE PAGE 14 OF 295
REVISIONSTAP-P-1-M-7100 0
2. RESERVOIR CONSIDERATIONS
2.1. INTRODUCTION
Oil and gas wells are expensive faucets that enable production of petroleum reservoirs orallow injection of fluids into an oil or gas reservoir. As pointed out in section 1.1, acompletion conceptual design must take into account all the well objectives to produce theoptimum design to maximise profitability.
The purpose of this section is to consider the characteristics of reservoir fluids and the flowof these in the area around the wellbore to allow these parameters to be tied into the wellcompletion design and well intervention/workover operational requirements.
2.2. CHARACTERISTICS OF RESERVOIR ROCKS
2.2.1. Porosity
Porosity or pore space in reservoir rocks provides the container for the accumulation of oiland gas and gives the rock characteristic ability to absorb and hold fluids. Most commercialreservoirs have sandstone, limestone or dolomite rocks, however some reservoirs evenoccur fractured shale.
2.2.2. Permeability
Permeability is a measure of the ability of which fluid can move through the interconnectedpore spaces of the rock. Many rocks such as clays, shales, chalk, anhydrite and somehighly cemented sandstones are impervious to movement of water, oil or gas even althoughthey may be quite porous. Darcy, a French engineer, working with water filters, developedthe first relationship which described the flow through porous rock which is still used today.
Darcy’s Law states that the rate of flow through a given rock varies directly with permeability(measure of the continuity of inter-connected pore spaces) and the pressure applied, andvaries inversely with the viscosity of the fluid flowing.
In a rock having a permeability of 1 Darcy, 1cc of a 1cp viscosity fluid will flow each secondthrough a portion of rock 1cm in length and having a cross-section of 1cm2, if the pressureacross the rock is 1 atmosphere.
pALq
K∆µ=
Eq. 2.A

ARPO
ENI S.p.A.Agip Division
IDENTIFICATION CODE PAGE 15 OF 295
REVISIONSTAP-P-1-M-7100 0
In oilfield units the linear form of Darcy’s Law for flow of incompressible fluid through a rockfilled with only one fluid is:
LB
)pp(kA10127.1q 213
µ−
×= − Eq. 2.B
where:
q = Flow rate, stb/dayk = Permeability, mdA = Flow rate, ft3
µ = Viscosity, cpL = Flow length, ftp1 = Inlet pressure, psip2 = Outlet pressure, psiB = Formation volume factor, res bbl/stb
2.2.3. Relative Permeability
As normally two or three fluids exist in the same pore spaces in a reservoir, relativepermeability relationships must be considered. Relative permeability represents the ease atwhich one fluid flows through connecting pore spaces in the presence of other fluids, incomparison to the ease that it would flow if there was no other fluid.
To understand this, assume a rock filled with only with oil at high pressure where gas hasnot been able to come out of solution:
• All available space is taken up by the oil and only oil is flowing.• If reservoir pressure is allowed to decline, some lighter components of the oil will
evolve as gas in the pore spaces. Flow of oil is reduced but gas saturation is toosmall for it to flow through the pores.
• If pressures to continue to decline, gas saturation continues to increase and atsome point (equilibrium gas saturation) gas begins to flow and the oil rate isfurther reduced.
• With further increases in gas saturation, the gas rate continues to increase andless oil flows through the pores until finally only gas flows.
• Significant oil may still occupy the pores but cannot be recovered by primaryproduction means as the permeability to oil has dropped to zero.
This same principle governs the flow of oil in the presence of water. The saturation of eachfluid present affects the ease of fluid movement or relative permeability.
The gas-oil or water-oil relative permeability relationships of a particular reservoir rockdepend on the configurations of the rock pore spaces and the wetting characteristics of thefluids and rock surfaces. In an oil-water system, the relative permeability to oil is significantlygreater when the rock is ‘water wet’.

ARPO
ENI S.p.A.Agip Division
IDENTIFICATION CODE PAGE 16 OF 295
REVISIONSTAP-P-1-M-7100 0
Where two or more fluids are present, the permeability in eq. 2.b represents thepermeability of the rock to the desired fluid. This can be achieved by multiplying absolutepermeability of the rock by the relative permeability of the rock to the desired fluid.
LB
)pp(Akk10127.1q
o
21roabs3
µ−
×= − Eq. 2.C
where:
qo = Oil flow rate, stb/daykabs = Absolute permeability, mdkro = Relative permeability to oil
For a well producing both water and oil, the ‘water cut’ or fraction of water in the total flowstream at standard conditions of temperature and pressure can be calculated by:
o
w
o
w
w
ow
BB
kk
1
1f
+µµ
+×=
Eq. 2.D
where:
ko = Relative permeability to oilkw = Relative permeability to waterµo = Viscosity of oil, cpµw = Viscosity of water, cpBo = Formation volume factor for oil, res bbl/stbBw = Formation volume factor for water, res bbl/stb
2.2.4. Wettabilty
Most reservoirs were formed or laid down in water with oil moving in later from adjacentzones to replace a portion of the water. For this reason, most reservoir rocks are consideredto be ‘water wet’. This means that the grains of the rock matrix are coated with a film ofwater permitting hydrocarbons to fill the centre of the pore spaces. The productivity of oil inthis condition is maximised.
Although it is extremely difficult to determine wettability of cores due to the cutting andpreparing specimens for laboratory testing which alters the wettability characteristics, it isnot important as this characteristic is included in the permeability measurements.
However, it is important when completing or servicing the well in that any foreign substancewhich may come into contact with the rock may alter its wettability characteristic and reducethe relative permeability to hydrocarbon fluids and cause emulsion which may block flow.

ARPO
ENI S.p.A.Agip Division
IDENTIFICATION CODE PAGE 17 OF 295
REVISIONSTAP-P-1-M-7100 0
2.2.5. Fluid Distribution
The distribution of fluids vertically in the reservoir is very important as the relative amountsof oil, gas and water present at a particular level determines the fluids that produced by awell completed at that level and also influence the relative rates of fluid production.
In rock the capillary forces, which are related to water wettability, work to change the normalsharp interfaces between the fluids separated by density.
From the point in a zone of the free water level upward to some point where watersaturation becomes constant is called the ‘transition zone’. Relative permeability permitsboth water and oil to flow within the transition zone. Water saturation above the transitionzone is termed ‘irreducible water saturation’ or more commonly the ‘connate watersaturation’. Above the transition zone, only oil will flow in an oil-water system.
Connate water is related to permeability and pore channels in lower rocks are generallysmaller. For a given height, the capillary pressure in two different pore sizes will be thesame, therefore the water film between the water and the oil will have the same curvature,hence more oil will be contained in larger pore spaces.
The nature and thickness of the transition zones between the water and oil, oil and gas, andwater and gas are influenced by several factors: uniformity, permeability, wettability, surfacetension and the relative density differences between the fluids. These can be summarisedin three statements:
• The lower the permeability of a given sand, the higher will be the connate watersaturation.
• In lower permeability sands, the transition zones will be thicker than in higherpermeability sands.
• Due to the greater density difference between gas and oil as compared to oiland water, the transition zone between the oil and gas is not as thick as thetransition zone between oil and water.
A well completed in the transition zone will be expected to produce both oil and water,depending on the saturations of each fluid present at the completion level. figure 2.asummarises oil, water and gas saturation in a typical homogeneous rock example.

ARPO
ENI S.p.A.Agip Division
IDENTIFICATION CODE PAGE 18 OF 295
REVISIONSTAP-P-1-M-7100 0
Figure 2.A - Example Fluid Distribution in a Uniform Sand Reservoir(Containing Connate Water, Oil and Gas Cap)
2.2.6. Fluid Flow In The Reservoir
Oil has little natural ability to produce itself into the wellbore. It is produced principally bypressure inherent in gas dissolved in oil, in associated free gas caps, or in associatedaquifers.
Pressure Distribution Around the Wellbore
Pressure distribution in the reservoir and factors which influence it are of great ofsignificance in interpreting well production trends caused by pressure characteristics.
Pressure distribution around a producing oil well completed in a homogeneous zone willgradually drop from the reservoir pressure some distance from the wellbore until closer tothe wellbore where it will decline quite sharply. The wellhead pressure will be much lowerdue to the influence of hydrostatic pressure and tubing frictional effects.

ARPO
ENI S.p.A.Agip Division
IDENTIFICATION CODE PAGE 19 OF 295
REVISIONSTAP-P-1-M-7100 0
In a radial flow situation, where fluids move towards the well from all directions, most of thepressure drop in the reservoir occurs fairly close to the wellbore. As shown in figure 2.b, in auniform sand, the pressure drop across the last 15ft of the formation surrounding thewellbore is about one half of the total pressure drop from the well to a point 500ft away inthe reservoir. Obviously flow velocities increase tremendously as fluid approaches thewellbore. This area around the wellbore is the ‘critical area’ and as much as possible shouldbe done to prevent damage or flow restrictions in this critical area.
Figure 2.B - Pressure Distribution Near Wellbore In Radial Flow
Radial Flow Around The Wellbore
Steady state radial flow of incompressible fluid is described by Darcy’s Law:
)r
r(n1B
)pp(kh00708.0q
w
o
wo
µ
−=
Eq. 2.E
Corrections are required to account for the flow of compressible fluids and for turbulent flowvelocities.

ARPO
ENI S.p.A.Agip Division
IDENTIFICATION CODE PAGE 20 OF 295
REVISIONSTAP-P-1-M-7100 0
Figure 2.C- Units For Darcy’s Law Equation
For non-homogeneous zones, which is the usual case, permeablities must be averaged forflow through parallel layers of differing permeabilities.
321
332211
hhh
hkhkhkk
++++
=Eq. 2.F
Figure 2.D - Radial Flow In Parallel Combination of Beds

ARPO
ENI S.p.A.Agip Division
IDENTIFICATION CODE PAGE 21 OF 295
REVISIONSTAP-P-1-M-7100 0
Varying permeabilities around the well in series can be averaged as follows:
3
2
3
2
1
2
1
w
1
w
o
k
)rr
(n1
k
)rr
(n1
k
)rr
(n1
)rr
(n1k
++
=
Eq. 2.G
Figure 2.E - Radial Flow In Series Combination Of Beds
Linear Flow Through Perforations
Ideally perforating tunnels should provide be large and deep enough to prevent anyrestriction to flow. In cases where there may be sand problems and a gravel pack is used,the tunnels are packed with gravel to hold the formation in place, which will cause arestriction.
Flow through perforating tunnels is linear rather radial and Darcy’s equation must becorrected as turbulent flow usually exists.
Experiments have shown that pressure drop through gravel filled perforations comparedwith uncorrected linear flow Darcy’s Law calculations is substantial as shown in figure 2.fbelow. Curve A indicates that plugging with even high permeability (1 Darcy) sand gives alarge pressure drop. Actual test data with very high permeability sand, curve B, provesturbulent flow results in higher pressure drop than Darcy’s Law calculations, curve C,predict.
Investigators have provided turbulence correction factors which can be applied to Darcy’sequation to permit calculation of pressure drop through perforating tunnels.

ARPO
ENI S.p.A.Agip Division
IDENTIFICATION CODE PAGE 22 OF 295
REVISIONSTAP-P-1-M-7100 0
Figure 2.F - Pressure Drop Versus Flow Rate Through Perforation
Causes Of Low Flowing Bottom-Hole Pressure
In a well with uniform sand and fluid conditions, two factors may cause low flowing bottom-hole pressures. These are permeability and producing rate.
With low permeability or excessive rate of production, pressure drawdown will beappreciable higher than normal thus reducing flowing bottom-hole pressures and causingthe well to be placed on artificial lift if higher productions rates are necessary.
Low permeability is often caused by damage close to the wellbore through drilling,completion or intervention operations. This is particularly detrimental as the effect close tothe wellbore is greatly magnified.
ARPO
ENI S.p.A.Agip Division
IDENTIFICATION CODE PAGE 23 OF 295
REVISIONSTAP-P-1-M-7100 0
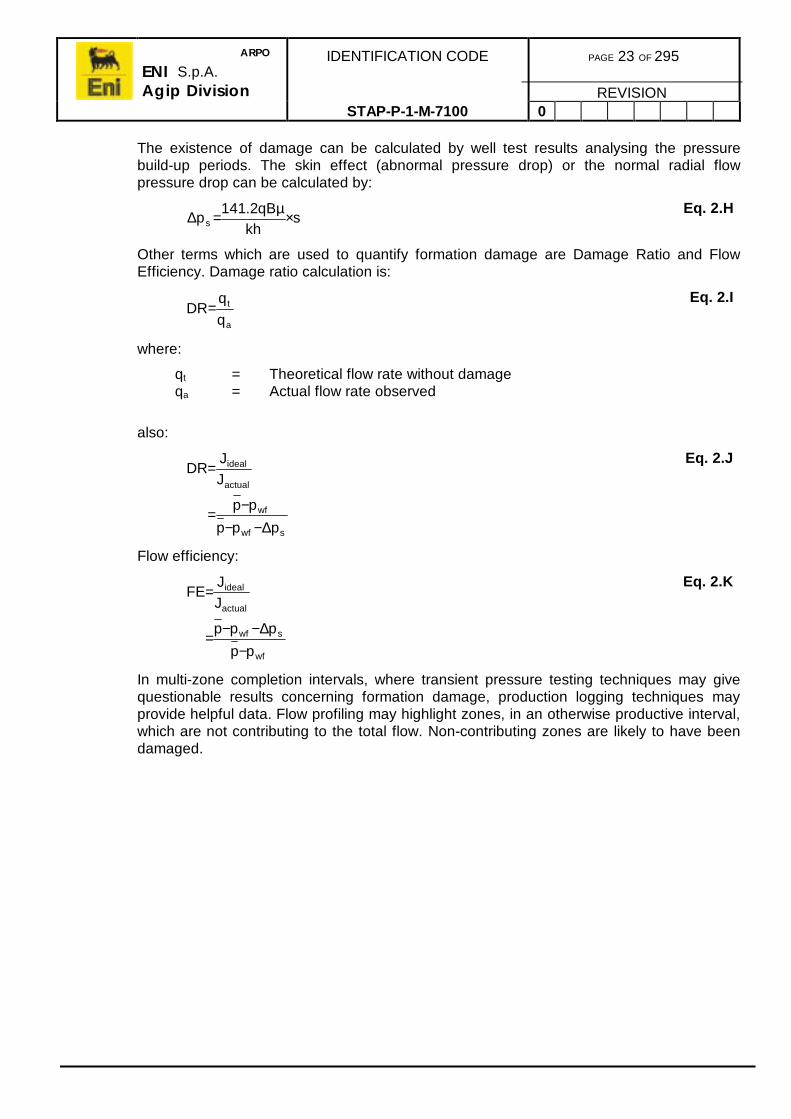
The existence of damage can be calculated by well test results analysing the pressurebuild-up periods. The skin effect (abnormal pressure drop) or the normal radial flowpressure drop can be calculated by:
skh
qB2.141ps ×µ=∆
Eq. 2.H
Other terms which are used to quantify formation damage are Damage Ratio and FlowEfficiency. Damage ratio calculation is:
a
t
q
qDR=
Eq. 2.I
where:
qt = Theoretical flow rate without damageqa = Actual flow rate observed
also:
swf
wf
actual
ideal
ppp
pp
JJ
DR
∆−−−
=
=Eq. 2.J
Flow efficiency:
wf
swf
actual
ideal
pp
ppp
JJ
FE
−∆−−
=
=Eq. 2.K
In multi-zone completion intervals, where transient pressure testing techniques may givequestionable results concerning formation damage, production logging techniques mayprovide helpful data. Flow profiling may highlight zones, in an otherwise productive interval,which are not contributing to the total flow. Non-contributing zones are likely to have beendamaged.

ARPO
ENI S.p.A.Agip Division
IDENTIFICATION CODE PAGE 24 OF 295
REVISIONSTAP-P-1-M-7100 0
2.2.7. Effects Of Reservoir Characteristics
Reservoir Drive Mechanisms
In an oil reservoir, primary production results from existing pressure in the reservoir. Thereare three basic drive mechanisms:
• Dissolved gas• Gas cap• Water drive.
Most reservoirs in actuality produce by a combination of all three mechanisms.
In a dissolved gas reservoir, the source of pressure is principally the liberation andexpansion of gas from the oil phase as pressure is reduced.
A gas drive reservoir’s primary pressure source is the expansion of a gas cap over the oilzone.
A water drive reservoir’s principle pressure source is an external water hydrostatic pressurecommunicated to below the oil zone.
The effect of the drive mechanism on the producing characteristics must be evaluated in thecompletion design process, and also for later re-completions, to systematically recoverreservoir hydrocarbons. figure 2.g and figure 2.h, show typical reservoir pressures versusproduction trends and gas-oil ratio production trends for the three basic drive mechanisms.
In a dissolved gas drive reservoir without any artificial pressure maintenance technique,pressure declines rapidly, gas-oil ratio peaks rapidly and then declines rapidly, and primaryoil recovery is relatively low. Re-completing would not reduce the gas-oil ratio.
In a gas cap drive reservoir, pressure declines less rapidly and gas-oil ratios increase as thegas cap expands into the up-structure well completion intervals. Well intervention or re-completion to shut-off up-structure intervals may control the gas-oil ratio, therefore losepressure less rapidly.
Water drive reservoirs pressure remains high and gas-oil ratios are lower but down-structure well intervals quickly begin to produce water. This is controlled by wellinterventions or re-completions to shut-off the water production or the well is shut-in.Gradually even the up-structure wells will water out to maximise oil recovery.
Obviously many factors must be considered in developing a reservoir, however the mainfactors concentrate on the reservoir itself and the procedure used to exploit hydrocarbonrecovery. Well spacing, or well location, is fundamental and the cost of time, labour andmaterials consumed in the drilling are largely non-recoverable, therefore if developmentdrilling proceeds on the basis of close spacing before the drive mechanism is identified, theinvestment will have already been made.
This does not usually present an insurmountable problem as a field of any considerablesize will require a minimum number of wells to be drilled in any case to define the reservoir,i.e. establish the detailed geological picture regarding zone continuity and locate oil-waterand gas-oil contacts. By careful planning when enough information is gained to determinethe well locations, these can be drilled at the appropriate spacing to maximise recovery withthe least amount of wells.

ARPO
ENI S.p.A.Agip Division
IDENTIFICATION CODE PAGE 25 OF 295
REVISIONSTAP-P-1-M-7100 0
Many case histories are available to show problems resulting from reservoir developmentwithout having sufficient information about the stratigraphy of the reservoir.
Figure 2.G - Reservoir Pressure Trends For Various Drive Mechanisms
Figure 2.H - Gas-Oil Ratios Trends For Various Drive Mechanisms

ARPO
ENI S.p.A.Agip Division
IDENTIFICATION CODE PAGE 26 OF 295
REVISIONSTAP-P-1-M-7100 0
With regard to drive mechanisms, some general statements can be made:
Dissolved gas drive reservoirs:
Well completions in reservoirs with low structural relief can be made in a regularly spacedpattern throughout the reservoir and, provided the rock is stratified, can be set low in thereservoir bed.
A regular spacing can also be used for dissolved gas reservoirs with high angle of dip.Again the completion intervals should be structurally low because of the angle of dip andthe exact sub-surface location would vary with well location on the structure. In this scenarioit would be expected that oil recovery would be greater with the minimum well investment asthe oil will drain down-structure through time. If this is recognised after drilling begins, thewell locations must be changed quickly to take full advantage of the situation.
Due to the low recovery by the primary drive mechanism, some means of secondaryrecovery will almost certainly be required at some point in life of the reservoir and the initialwell completion design should take this into account.
Gas cap drive reservoirs:
Wells are generally spaced on a regular pattern where the sand is thick, dip angle is lowand gas cap is completely underlayed by oil.
Again completion intervals should be low in the structure to permit the gas cap to grow formaximum recovery and minimum gas production.
Like the dissolved gas drive reservoir, the wells in thin sands with a high angle of dip islikely to be more efficiently controlled by having the completion irregularly spaced and low toconform to the shape of the reservoir. Regular spacing would place many completions toonear the gas-oil contact. Such reservoirs are common where multiple this sands are foundon a single structure and the oil column is only a fraction of the total productive relief.
Water drive reservoirs:
Wells can be spaced on a regular pattern on a thick sand and low angle of dip.
Completion intervals should be selected high on the structure to permit long production lifewhile oil is displaced up to the completion intervals by invading water from below.
A water reservoir in a thin sand with high angle of dip may best be developed with irregularwell spacing because of the structural characteristics. Regular spacing of the wells maycause early water production and possible early abandonment in conjunction with reducingthe drive effectiveness through excessive water production.
Significant levels of water production are unavoidable in later field life when maximisingproduction rates.

ARPO
ENI S.p.A.Agip Division
IDENTIFICATION CODE PAGE 27 OF 295
REVISIONSTAP-P-1-M-7100 0
2.2.8. Reservoir Homogeneity
The general procedures, as described in the previous section is to complete water drivereservoirs high and for dissolved gas drive reservoir low on the structure to obtain anadequate number of wells without excess. However this is only practical if the reservoir isuniform.
Most sandstone reservoirs were originally laid down as stratified layers of varying porosityand permeability. Similar assumptions can be made for carbonate and even reef typereservoirs which results in reservoirs of a highly stratified nature. Fluids from such reservoirswill flow through the various layers at different restrictions to flow and often there areimpervious beds between the layers so that fluid cannot flow between the bed to bed. Thisis demonstrated in figure 2.i and figure 2.j.
In thin beds or highly stratified beds, ‘fingering’ of the free gas down from a gas cap, orwater from a water basin, is a distinct possibility, especially if the interval is short andproduction rates are high.
If the reservoir is stratified, either by shale breaks or by variations in permeability, it willprobably be necessary to stagger the completion intervals in various members of thereservoir to be sure that each is drained properly. Vertical staggering of the completion canbe effected during development to obtain proportionate depletion of the various strata.Additional distribution of intervals in the various members can then be made during laterwell interventions on the basis of data obtained, experience and operating conditions.
To maximise recovery, intervals should be produced independently wherever practical(usually determined by economics). Single string/single zone completions are preferred tofacilitate thorough flushing for higher recovery and flexibility of re-completion to controlreservoir performance. Completions with more than one zone are termed multi-zonecompletions and are required for long completion intervals for obtaining sufficient volumesof production.
Figure 2.I - Irregular Water Encroachment and Breakthr ough

ARPO
ENI S.p.A.Agip Division
IDENTIFICATION CODE PAGE 28 OF 295
REVISIONSTAP-P-1-M-7100 0
Figure 2.J - High GOR Production by Encroachment of Gas
2.3. HYDROCARBON DATA
The practical approach to the study of reservoir fluid behaviour is to anticipate pressure andtemperature changes in the reservoir and at surface during production, and to measure, bylaboratory tests, the changes occurring in the reservoir samples. The results of these teststhen provide the basic fluid data for estimates of fluid recovery by various methods ofreservoir operations and also to estimate reservoir parameters through transient pressuretesting.
Two general methods are used to obtain samples of reservoir oil for laboratory examinationpurposes, by means of subsurface samplers and by obtaining surface samples of separatorliquid and gas. The surface samples are then recombined in the laboratory in proportionsequal the gas-oil ratio measured at the separator during well testing.
Information concerning the characteristics and behaviour of gas needed for gas reservoirs,depends upon the type of gas and the nature of the problem. If retrograde condensation isinvolved, it may require numerous tests and measurements. If the gas is wet with noretrograde condensation, or if dry gas, the information is less complex.
2.3.1. Oil Property Correlation
Several generalisations of oil sample data are available to permit correlations of oilproperties to be made (refer to the Compant Well Test Manual for sampling techniques).

ARPO
ENI S.p.A.Agip Division
IDENTIFICATION CODE PAGE 29 OF 295
REVISIONSTAP-P-1-M-7100 0
2.4. RESERVOIR/PRODUCTION FORECAST
To obtain the optimum performance from a well, it is first necessary to determine its fullpotential and which way this can be fully exploited within any technical or economicconstraints. The determination of the well’s performance entails analysing the following:
• In-flow performance• Near wellbore performance and design• Multiphase flow of tubing performance• Artificial lift.
The process of this analysis is shown in figure 2.k which requires continuous repetitionduring field life to account for changing conditions.
The inflow performance relationship (IPR) provides the flow potential of the reservoir intothe wellbore against the resistance to flow of the formation and near wellbore region. Thetheoretical IPR is an idealistic assumption of flow performance without pressure drop due toskin effect in the near wellbore region and governed only by the size, shape andpermeability of the producing zone and the properties of the produced fluids. The basictheory of this is described in this section along with some simplified IPR relationships fromobserved field data.
Flow behaviour in the near wellbore region may cause a dramatic effect on the IPR curvewhich results in greatly reduced flow capability. This is characterised by a damaged IPRcurve and the amount of damage or skin effect, is mainly caused by the drilling andcompletion practices. Good drilling and completion practices can or may minimise thisdamage allowing use of the idealised IPR curve to be used for completion design.
Some completion designs to deal with reservoir conditions, such as gravel packs forunconsolidated sands, will also cause reduced IPR curves which must be anticipated duringthe design phase. Two phase flow, velocity effects in gas wells, high rate or high GOR oilwells, in undamaged near wellbore regions also reduce the IPR curve. Alternatively,stimulation procedures which can provide a negative skin are desirable as this increasesproduction.
Once the IPR is completed, the outflow performance can be determined which takes intoconsideration the relationship between the surface flowrate and pressure drop in the tubing.The prediction of this relationship is complicated by the nature of multi-phase fluid flow.Hence, analysis of the outflow performance requires predictions of phase behaviour,effective fluid density, friction losses and flowing temperatures.
The results of the outflow performance analysis are usually produced graphically depictinghow bottom hole flowing pressure (BHFP), or pump intake pressure, varies with flowrateagainst a fixed back-pressure which is normally the wellhead or separator pressure. Thesecurves are termed tubing performance curves (TPC) and the point of intersection is thenatural flowing point as demonstrated earlier in figure 2.k.

ARPO
ENI S.p.A.Agip Division
IDENTIFICATION CODE PAGE 30 OF 295
REVISIONSTAP-P-1-M-7100 0
Figure 2.K - Process of Determining Optimum Well Performance
Selecting, or optimising, the tubing size is necessary to optimise the well performance overthe life of the well and should include the potential benefits of artificial lift systems and/orstimulation to reduce near wellbore skin effects.

ARPO
ENI S.p.A.Agip Division
IDENTIFICATION CODE PAGE 31 OF 295
REVISIONSTAP-P-1-M-7100 0
2.4.1. Inflow Perfomance
This section addresses the fundamental principles of inflow performance for oil and gaswells. The use of IPRs generated from reservoir simulation models is also described as isthe technique for the applications of the various techniques for predicting inflowperformance. Essentially the less data which is available, the more appropriate it is to usetheoretical radial flow equation. As more data becomes available, an empirical expressioncan be validated and applied, however for larger projects, reservoir simulation is usuallyemployed.
Oil Well - Straight Line IPR
The simplest IPR equation assumes that inflow into a well is proportional to the pressuredifferential between the reservoir and the wellbore which is termed the ‘drawdown’.
wfR ppp −=∆ Eq. 2.L
where:
∆p = Drawdown pressure, psipR = Reservoir pressure, psipwf = Bottom-hole flowing pressure, psi.
With a straight line IPR, the flow rate is directionally proportional to the drawdown. Thelinear relationship can be substantiated from theoretical arguments for a singleincompressible fluid (i.e. above the bubble point). However, it has been verified that thestraight line approach also provides the accuracy needed for well performance calculationsin situations which exceed the theoretical basis, e.g. low drawdowns and damaged wells.
In situations which allow the use of a straight line IPR, the constant of proportionality istermed the productivity index (PI). PI defined as J by the API, is:
wfR ppq
J−
=Eq. 2.M
where:
q = Total liquid flow rate at surface under stock tank conditions (14.7psia,60oF)

ARPO
ENI S.p.A.Agip Division
IDENTIFICATION CODE PAGE 32 OF 295
REVISIONSTAP-P-1-M-7100 0
Figure 2.L - Straight Line IPR or Productivity Index J
The assumption of stable inflow performance relationship, or stabilised flow, is that well isproducing in pseudo-steady state or steady state flow conditions. Before this the wellproduces under transient conditions, as in most well tests, result in higher estimates ofproductivity than when under stabilised conditions.
Productivity Index, J, also needs to be treated with caution as Production Engineers andReservoir Engineers assume different basis for J. Production Engineers relate J to grossliquid production (oil and water) whereas Reservoir Engineers relate it to oil productivity.
J can be calculated directly from bottom-hole gauges in well test results or estimatedpressures from simulation studies. Oil PI, J, can also be derived theoretically from Darcy’sradial flow equation:
′+−
µ
=
S75.0r
rn1B2.141
hkJ
w
eoo
oo
Eq. 2.N
where:
h = Net pay thickness, ftko = Effective oil permeability, mdµo Reservoir fluid viscosity, cpBo = Reservoir formation volume factor, bbl/stbro = Drainage radius, ftrw = Wellbore radius, ftS’ = Total effective skin, dimensionless (S ’= S + Dq)

ARPO
ENI S.p.A.Agip Division
IDENTIFICATION CODE PAGE 33 OF 295
REVISIONSTAP-P-1-M-7100 0
This assumes pseudo-steady state flow from a well in the centre of a circular reservoir andit is worth noting that ko is the effective permeability to oil for an oil PI. As water saturationincreases, Ko obviously decreases and as does Jo.
Deviation from the theoretical ideal PI (i.e. S’ = 0) should be expected as a result ofadditional pressure losses in the near wellbore area due to damage, fractures, increasedgas saturation in oil wells, producing below the bubble point, changes in radial flowgeometry and non-Darcy pressure losses due to high flow velocities in gas wells, high rateor high GOR oil wells.
Damaged wells with positive skins have straight line IPRs with PIs less than the ideal PI.Straight line IPRs with PIs greater than the ideal are typical of wells with negative skin suchas when they have been stimulated, have natural fractures or are highly deviated.
The PI is very useful for describing the potential of various wells as it combines all rock andfluid properties as well as geometrical issues in a single constant making it unnecessary toconsider these properties individually.
Figure 2.M- Effect of Damage And Fractures on a Well’s PI
ARPO
ENI S.p.A.Agip Division
IDENTIFICATION CODE PAGE 34 OF 295
REVISIONSTAP-P-1-M-7100 0
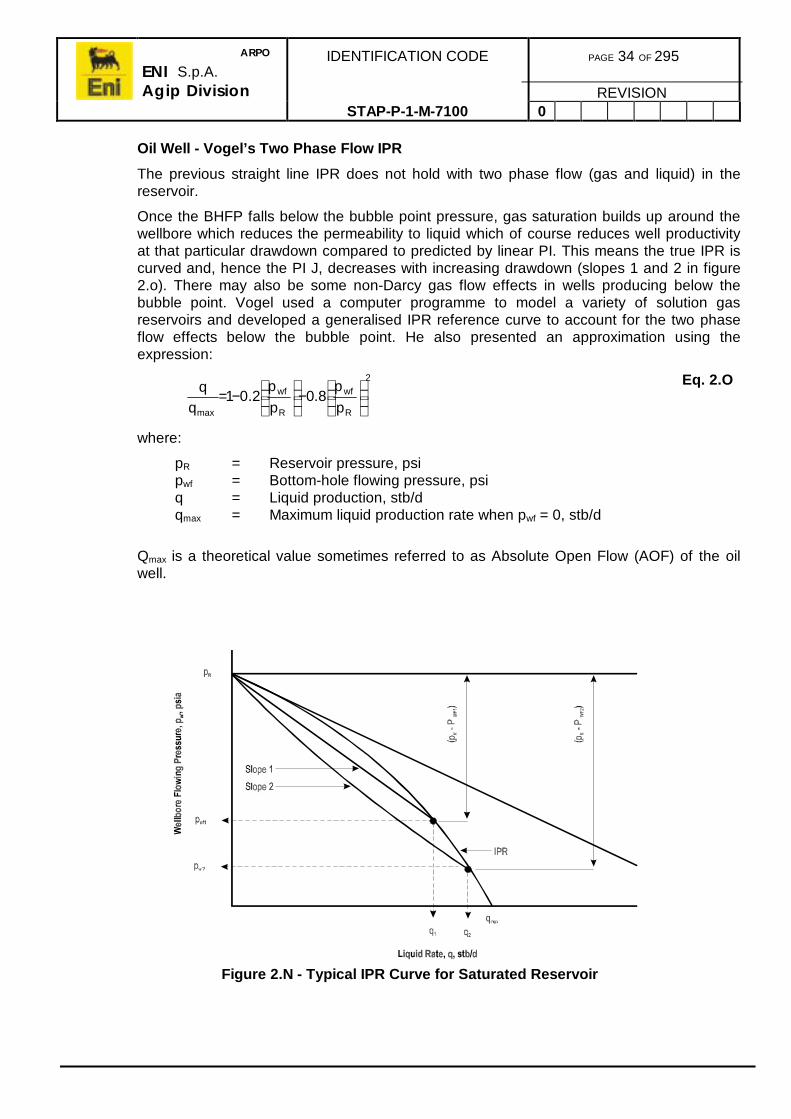
Oil Well - Vogel’s Two Phase Flow IPR
The previous straight line IPR does not hold with two phase flow (gas and liquid) in thereservoir.
Once the BHFP falls below the bubble point pressure, gas saturation builds up around thewellbore which reduces the permeability to liquid which of course reduces well productivityat that particular drawdown compared to predicted by linear PI. This means the true IPR iscurved and, hence the PI J, decreases with increasing drawdown (slopes 1 and 2 in figure2.o). There may also be some non-Darcy gas flow effects in wells producing below thebubble point. Vogel used a computer programme to model a variety of solution gasreservoirs and developed a generalised IPR reference curve to account for the two phaseflow effects below the bubble point. He also presented an approximation using theexpression:
2
R
wf
R
wf
max p
p8.0
p
p2.01
−
−=
Eq. 2.O
where:
pR = Reservoir pressure, psipwf = Bottom-hole flowing pressure, psiq = Liquid production, stb/dqmax = Maximum liquid production rate when pwf = 0, stb/d
Qmax is a theoretical value sometimes referred to as Absolute Open Flow (AOF) of the oilwell.
Figure 2.N - Typical IPR Curve for Saturated Reservoir

ARPO
ENI S.p.A.Agip Division
IDENTIFICATION CODE PAGE 35 OF 295
REVISIONSTAP-P-1-M-7100 0
Vogel’s equation has been validated through observed field data particularly on pumpedwells with high drawdowns where pwf approaches zero.
The model used to develop Vogel’s reference curve did not include skin effects which wouldtend to straighten the IPR curve. Procedures to correct for skin are available.
Figure 2.O - Vogel’s IPR Reference Curve

ARPO
ENI S.p.A.Agip Division
IDENTIFICATION CODE PAGE 36 OF 295
REVISIONSTAP-P-1-M-7100 0
Where inflow relationship passes through the bubble point, a straight line IPR is drawnabove the bubble point and the curved IPR signifies the two phase flow below this point. Forthis, Vogel’s equation is combined with the PI to develop a general IPR equation. This hasbeen published by Brown. When the BHFP is above the bubble point use the normalstraight line equation:
( )wfRo ppJq −= Eq. 2.P
and when it drops below the bubble point use the modified Vogel equation:
( )
−
−+−=
2
b
wf
b
wfbwfRo p
p8.0
pp
2.018.1
JpppJq
Eq. 2.Q
where:
pb = Bubble point pressure, psi
If water production is involved, it is dependant upon whether it is produced from the sameinterval or others. As oil is normally produced from a different zone to the water, thefollowing equations are applied:
( )wfRw ppJq −= Eq. 2.R
−
−=
2
R
wf
R
wfmaxoo p
p8.0
p
p2.01qq
Eq. 2.S
If oil and water both flow from the same zone then the Vogel equation is used for the grossflow rate:
( )
−
−+=+
2
R
wf
R
wfmaxoowo p
p8.0
p
p2.01qqqq
Eq. 2.T

ARPO
ENI S.p.A.Agip Division
IDENTIFICATION CODE PAGE 37 OF 295
REVISIONSTAP-P-1-M-7100 0
Figure 2.P - Combined Straight Line IPR and Vogel IPR
Oil Wells - Generalised IPR Curves
As described earlier, curvature of the IPR curve is not solely due to the reasons highlightedabove but also due to rate dependent skin. This is where Darcy’s law which is good formoderate to low flow rates is affected by high velocities. This non-Darcy flow, or turbulence,is sometimes the most dominant factor especially for gravel packs and high rate gas-liquidratio wells.
Fetkovich recognised that many oil wells could be handled in the same way as gas wellsusing the curved IPR:
( )n2wf
2Ro ppCq −= Eq. 2.U
where:
C = Linear deliverability coefficientn = Deliverability exponent (0.5 to 1.0)

ARPO
ENI S.p.A.Agip Division
IDENTIFICATION CODE PAGE 38 OF 295
REVISIONSTAP-P-1-M-7100 0
Golan and Whitson showed how this relationship could be expressed in a similar form toVogel’s reference curve as:
n2
R
wf
max p
p1
−=
Eq. 2.V
This equation is compared with Vogel’s reference curve in figure 2.q, for two values of theexponent, n. It is seen that when n = 1, the Vogel and Fetkovich IPRs are similar. It isrecommended that n be assumed to be 1 where no multi-rate data is available.
n is considered as the means to account for non-Darcy flow but there is no theoreticaltechnique for finding it as it is a function of the rate used during testing. If multi-rate data isavailable then a log-log plot of q versus (pR
2 - pwf2) will give a straight line with a slope of 1/n.
Figure 2.Q - Vogel And Fetkovich IPR Curve Comparisons
Use of this approach will provide better results than Vogel’s method, however it requiresfour points at widely different flow rates to maximise the benefit of this method. If such datais not available, n should be assumed as 1.
Blount and Jones presented an alternative generalised IPR equation which was anextension to the Forcheimer equation to include the non-Darcy flow effects:
2wfR bqaqpp +=− Eq. 2.W

ARPO
ENI S.p.A.Agip Division
IDENTIFICATION CODE PAGE 39 OF 295
REVISIONSTAP-P-1-M-7100 0
The Darcy flow coefficient, a, can be determined theoretically for a well producing atpseudo-steady state flow in the middle of a circular reservoir:
+−
µ= S75.0
r
rln
kh
B2.141a
w
eooEq. 2.X
The skin term, S, is relative to all non-rate dependent skin contributions.
The other non-Darcy flow coefficient, b, can also be found theoretically but requires aknowledge of the turbulence factor, β, which is rarely measured in the laboratory. Similarly,it takes no account of completion non-Darcy effects such as inefficient perforating, etc.Again, if multi-rate test data is available, both a and b can be determined using a plot of (qR
- pwf)/q versus q gives a straight line with a slope of b and an interception of a.
In very high permeability wells, coefficient b can be much greater than b and perforatingefficiency (shots/ft and penetration) is a very important to productivity.
Oil Wells - Predicting Future IPRs
Estimates of future IPR curves throughout the life of the reservoir are frequently required forproduction forecasting and planning artificial lift designs.
The effects of increasing water influx on the gross PI, described earlier in Section 2.2, leadsto a significant increase in skin due to scaling, mobilisation of fines, skin damage duringremedial operations and reduced contribution from reduced pay through plugging back.
In solution drive reservoirs, the reservoir pressure will decline against time, shifting the IPRcurve downwards resulting in a decline of the production rate and causing flow instability.The relative permeability to oil will also decrease due to increased gas saturation furthershifting the curve downwards. The liberation of gas also affects the oil fluid properties.
Standing presented a method of predicting future IPR curves by the equation:
presentoo
ro
futureoo
ro
present
future
B
k
B
k
*J
*J
µ
µ
=
Eq. 2.Y
and:
−
−=
2
futureR
wf
futureR
wffutureRfuturefuture p
p8.0
p
p2.01p*Jq
Eq. 2.Z
where:
J* = PI at minimal drawdown (i.e. where two phase flow effects arenegligible)

ARPO
ENI S.p.A.Agip Division
IDENTIFICATION CODE PAGE 40 OF 295
REVISIONSTAP-P-1-M-7100 0
J* at present conditions is established by carrying out a well test or theoretically. Relativepermeabilities and fluid saturations are determined from special core analysis data andreservoir material balance analysis (using either analytical calculations or a reservoirsimulation model). Fluid viscosities and volume are determined from PVT correlations.
If data for Standing’s equation are not available, the simpler approach like Fetkovichrelation for predicting qmax in Vogel’s reference curve. Eickmeier first proposed anexpression based on Fetkovich’s work, which in modified form is:
m
futureR
presentR
future.max
present.max
p
p
q
q
=
Eq. 2.AA
It may be shown theoretically that exponent m could vary between 1 and 3. An exponent of2.5 gives the best fit to the gas drive IPR curves by Vogel while values of 1.66 have beenfound in actual field studies by Eickmeir.
Gas Wells - Simplified Deliverability Relationship
Rawlins and Schellardt developed a simplified gas well back-pressure equation whichrelates gas flow rate to the BHFP and is the well Known AOF equation;
( )n2wf
2Rg ppCp −= Eq. 2.BB
This equation was developed empirically using several hundred multi-rate gas well test dataand not by theory but satisfactorily describes the behaviour of the gas well tests considered.
The exponent, n , in the equation must be estimated from one of a number of well testmethods (e.g. isochronal test) due to there being no accepted theoretical basis available. Alog-log plot of (pR
2 - pwf2) versus q is conducted from which the slope gives the value of 1/n.
This exponent can vary between 1.0 for laminar flow to 0.5 for fully turbulent flow. Obviouslyat low to moderate rates there is little turbulence and n is close to 1, however in high ratesthis is highly improbable and makes the IPR projections almost impossible and erring on theoptimistic side. It is, therefore, critical that well tests are conducted up to or above therate of intended production.
The constant C is also found from the log-log plot and varies as a function of flow time untilit reaches a constant pseudo-steady state. In some instances C can be calculated fromreservoir parameters, using kh and S from build-up data but is only applicable if flow islaminar (n = 1). To obtain a value of n, it is normal to test the well at three rates at a fixedperiod of time followed by a single rate until stabilisation is reached to obtain C. Theproblem with this isochronal test is the time required to reach stabilised flow in tight gassands which could be months.
While this method is widely used throughout the industry, it is not recommended forestimating IPRs as it lacks the theoretical basis and other rigorous equations are available.

ARPO
ENI S.p.A.Agip Division
IDENTIFICATION CODE PAGE 41 OF 295
REVISIONSTAP-P-1-M-7100 0
Gas Wells - Generalised Deliverability
Due to the shortcomings of the back-pressure equation described above and sinceturbulence which is common in gas wells, it must be accounted for properly and atheoretical based method is more often used in modern engineering. The expression belowis based on the work of Forchemier and is:
2ggwfR AqAqpp +=− Eq. 2.CC
The Darcy and non-Darcy coefficients, A and B, are determined in a similar manner as thegeneralised IPR equation for an oil well, however the straight line plot is (pR
2 - pwf2)/q versus
q. It will be seen that the gas IPR is curved even when the non-Darcy term is 0.
eq. 2.cc is not precisely correct since inherent in its derivation is an assumption that theproduct of µ and z is constant. For most gas compositions this is valid only at pressures lessthan approx 2,000psi or if drawdown pressure changes are small which is the case in highpermeability wells above 3,000psi when µz is proportional to pressure, an equation similarto eq. 2.w can be used. Between 2,000psi and 3,000psi, there is curvature in the plot of µzagainst p making neither approach applicable. In this range the correct inflow equation iswritten in terms of pseudo-pressures:
∫ µ=
p
pbg
dpz
p2)p(m
Eq. 2.DD
where:
µg = Gas viscosity, cpz = Gas deviation factor
and where the integration limits are substituted with the pressure range being considered,normally pg and pwf for inflow calculations, hence:
2ggwfR BqAq)p(m)p(m +=− Eq. 2.EE
where:
A =
+−
S75.0
r
rln
hkT
1422w
e
g
B =ghk
TD1422
Here the results of the multi-rate test would be plotted as m(pg) - m(pwf)/q versus q to find avalue of B from the slope and to check the value of A from the intercept.
The non-Darcy coefficient B can also be calculated theoretically but, as for oil wells,requires knowledge of the correct turbulence factor, β. The non-Darcy skin is also frequentlyaccounted for by using:
++−
=− g
w
e
g
gwfR DqS75.0
r
rln
hk
Tq1422)p(m)p(m
Eq. 2.FF

ARPO
ENI S.p.A.Agip Division
IDENTIFICATION CODE PAGE 42 OF 295
REVISIONSTAP-P-1-M-7100 0
where:
D is Derived from well testsqg = Gas flow rate, mscf/dT = Reservoir temperature, oFS = The sum of all non-rate dependent skinD = Rate dependent skinkg = Effective gas permeability, md
As modern test analysis use computer software, the pseudo-pressure values are readilyavailable, therefore there is a growing trend to use gas pseudo pressures for predicting gaswell IPRs at all pressure conditions although the pressure squared method has a use in thefield for convenience.
2.4.2. Reservoir Simulation For IPR Curves
Reservoir simulation is commonly used in the development, planning and reservoirmanagement of many fields today. With the use of simulation the production engineer isable not only to predict pressures, WORs and GORs to obtain production targets, but alsoto generate IPR curves for determination of how current and future well IPRs will varyacross the field.
To obtain the best use of simulation studies, a model needs to be set up by the reservoirengineer with input from the production engineer. Typically the following should beaddressed:
• Assumptions on the minimum permissible value of Pwf as dictated by theoutflow performance altered by varying water-cut, artificial lift or use ofcompression.
• Variations between the ideal IPRs and actual IPRs which may be expected fromthe undrilled well locations. This information is derived from well test results andis input into the models theoretical IPR equations as skin factor. Futurestimulation or any damaging effects need to be considered.
• Long term effects from well interventions, workovers and movement of fines willhave on near wellbore performance causing changes of skin during the life ofthe project.
• Using expected off takes, predict turbulence and two phase flow effects by theuse of total skin S’ inclusive of near wellbore and rate dependent skin effects.The value of D (Refer to eq. 2.ff ) can also be directly entered into somesimulators.
• If a PI is entered in rather than skin, well radius, etc., it will be necessary tocorrect it for the grid block’s size and shape.
• Outflow performance curves should be derived from an accurate computerprogramme as some programmes are not rigorous in the handling of two phaseflow.

ARPO
ENI S.p.A.Agip Division
IDENTIFICATION CODE PAGE 43 OF 295
REVISIONSTAP-P-1-M-7100 0
The results from such field models will provide the reservoir pressure, production rates andwellbore saturations at various time steps, however judgement is required when using theseresults, in particular check:
• Confirm if non-Darcy and multi-phase flow effects have been taken intoconsideration.
• Input on skin is realistic for the period covered.• Ensure that proposed completion effects on near wellbore performance, e.g.
gravel packing, partial completion, deviation, stimulation, etc. have beenconsidered.
• If the reservoir pressure refers to grid block or to the drainage area.• Whether rates have been modified for downtime due to maintenance, workover
or sales contracts, etc.
As the use of full field reservoir simulation requires many assumptions and simplificationsare made to manage the problem, therefore the predicted flow rates should not beconsidered as precise and the relevant reservoir engineer should be consulted to establishthe accuracy. They may also be able to advise on possible sudden changes in water cut orgas production due to conning or cusping.
Often more reliable predictions in shape of the well IPR can be achieved by engineers usingsingle well models to study the probability of water or gas conning or to model transient welltest results. It is also used to determine the sensitivity of production to drawdown andoptimise perforating strategy.
When and as new well data from log and RFT/DST results becomes available, it should beused to update the generalised IPR to reflect the actual pay interval, reservoir quality, skins,saturations, pressure and mechanical data. From this, revisions can be made to thecompletion designs, programmes and production forecast.
After using measured IPR curves, the model needs to be updated to include actual log andtest results. Once this achieved, then the model can be used to evaluate the effect ofdepletion, water breakthrough and saturation changes on production and used for artificiallift studies. Care must be exercised, however, in extrapolating the shape of the IPR anddetermining the effects by well operations and production may have on skin.
It is extremely important that production engineers understand that the uncertaintiesinvolved and do not give greater reliability on model studies than reasonably can beexpected.

ARPO
ENI S.p.A.Agip Division
IDENTIFICATION CODE PAGE 44 OF 295
REVISIONSTAP-P-1-M-7100 0
2.4.3. IPR Selection
In developing representative IPRs for a field, the appropriate IPR model needs to beselected based upon the anticipated production conditions. These are summarised again inthe following table:
Type Of Well Producing Conditions Recommended IPR Model
Undersaturated oil Pwf > pb Linear PI or radial flow equation
Saturated oil Pwf < pb Vogel or Fetkovich
Damaged saturated oil Pwf < pb
S > +3
Standing or linear PI if verydamaged (S > 7)
Undersaturated oil at pR butsaturated at pwf
PR > pb
Pwf < pb
Composite Vogel and linear
Wells producing oil and water WC > 0 Use as above for theappropriate oil and linear PI orradial flow equation for water
Water zone WC > 90% Linear PI or radial flow equation
High rate undersaturated oil q > 25stb/d/ft Blount - Jones or radial flowequation with turbulence
High rate saturated oil q > 25stb/d/ft
Pwf < pb
Blount - Jones
Gas wells Pseudo-pressure equation
(m(pR) - m(pwf) = Aq + Bq2)
Omit B if only single rate dataavailable
Table 2.A - IPR Selection Based on Reservoir Type
The appropriate technique will also depend on the reservoir data that is available which isfunction of the development stage. The selection of an IPR model based on this is given intable 2.b.

ARPO
ENI S.p.A.Agip Division
IDENTIFICATION CODE PAGE 45 OF 295
REVISIONSTAP-P-1-M-7100 0
Radial Flow Equation Reservoir ModelIPRs
Empirical IPRs
Technical Evaluations
Prospect evaluation
Exploration well results
Guestimate potential.
Extrapolate test results.
-
-
-
Validateinterpretation
Development Planning
Conceptual design, largefield
Primary method. Identify variationsgeographically withtime.
Validate results.Highlight damagerisks.
Conceptual design,small field/single well
Primary method. - Validate results.Highlight damagerisks.
Development plan Validate results andskin assumptions.
Primary method. Validate results.Highlight damagerisks.
Detailed design, largefield
Validate results.Evaluate completionresults.
Primary method. Validate results.Highlight damagerisks.
Detailed design, smallfield/single well
Primary method.Evaluate completionmethods.
If available, use forfuture IPRs.
Validate results.Highlight damagerisks.
Optimising Operations/ Workover
Well performanceassessment
Estimate skin anddetermine cause.
- Primary method.
Field studies (forecasts/artificial lift, lift/compression)
Primary method forpost workover IPR
Predict future IPR Primary method forcurrent IPRs.
Workover planning Primary method forpost workover IPR.
Predict future IPR Primary method forcurrent IPRs.
Revised developmentplan
Define model input Primary method. Validate reservoirmodel results.
Table 2.B - IPR Selection Based on Development Stage

ARPO
ENI S.p.A.Agip Division
IDENTIFICATION CODE PAGE 46 OF 295
REVISIONSTAP-P-1-M-7100 0
2.4.4. Outflow Performance
Tubing Performance
Predicting fluid flow behaviour in tubing involves combining the basic fundamentals of massmomentum and energy conservation with complex mass transfer phenomena for multi-component hydrocarbon mixtures. Application of these concepts, results in utilising thefollowing interrelated topics:
• Phase behaviour.• Flowing Temperature prediction.• Pressure drop prediction.
The relationship between pressure and temperature drop in wells and PVT behaviour iscomplex. Pressure drop is determined using empirical and semi-empirical correlations andcarried out on computer software programmes. Refer to the following sections.
The methods for predicting pressure and temperature drops are addressed in the followingsections.
PVT Relationships
There are two PVT methods used in the prediction of mass transfer between oil and gas,the ‘black oil’ model and the ‘compositional’ model.
The black oil model assumes a constant composition for the liquid phase and accounts formass transfer using the parameters gas-oil ratio and formation volume factor. The variablecomposition model requires performing vapour-liquid equilibrium (VLE) or ‘flash’ calculationsto determine the amount and composition of both the gas and liquid phases. Each modeluses differing methods to determine the densities and viscosities for each phase andinterfacial surface tension.
In general the black oil model is easier to use than the compositional model.
Oil Well - PVT Relationships
With most modern software programmes there are four methods of obtaining PVTproperties for oil wells which are listed in order of preference. In the vast majority of casesthere are sufficient data to use the tuned black oil model correlation method.
• Interpolate directly from experimental data.• Interpolate from compositional simulation data.• Tuned black oil model empirical correlations.• Untuned black oil model empirical correlations.

ARPO
ENI S.p.A.Agip Division
IDENTIFICATION CODE PAGE 47 OF 295
REVISIONSTAP-P-1-M-7100 0
The approach adopted when choosing the appropriate method for each application shouldbe:
a) Use the black oil model flash vaporisation lab data if they are available. Do notuse differential separation data since it is not representative of the vaporisationthat occurs in the tubing.
b) Use the tuned empirical correlations for black oil model variables if theappropriate although limited experimental data are available.
c) Use black oil model parameters generated from results of compositionalsimulation if it has been performed for incidental reasons, e.g. reservoir orproduction reasons, but only if experimental data is not available.
d) Do not use untuned black oil model empirical correlations unless the dataavailable cannot justify a more rigorous method.
Gas/Gas Condensate Wells - PVT Relationships
In software programmes, PVT properties for gas and gas condensate wells must bedescribed with the compositional model. Black oil models parameters should never be usedto predict PVT properties for gas or gas condensate systems.
Temperature Drop Calculation
Predicting the temperature loss in the wellbore as a function of depth and time is necessaryto determine PVT properties for use in calculating pressure drop. Some softwareprogrammes, temperature profiles may be specified in five ways:
• Linear profile based on measured or assumed wellhead and bottom-holetemperatures.
• Profile based on adiabatic heat transfer, i.e. constant temperature throughoutthe length of the string.
• Profile based on a specified heat transfer coefficient.• Profile based on conservation of energy that utilises complex wellbore heat
transfer calculations.• Profile based on a simplified version of the complete rigorous calculation
involving correlating parameter for which there is unavailable information butwith data which are available.
The linear profile is the most widely used due to the complexity of heat transfer calculationsin conjunction with the lack of sufficient measured data. Although the linear approach isunrealistic, the error has been found to be less than 15% in overall temperature drop intypical wells. However, in gas wells it has amore significant effect.
Some wells have produced fluids with special properties that are very sensitive totemperatures and more complex heat transfer calculations are required. These are:
• Gas condensate wells with retrograde condensate.• High pour point crude oil wells.• Wells in which hydrate formation can occur.

ARPO
ENI S.p.A.Agip Division
IDENTIFICATION CODE PAGE 48 OF 295
REVISIONSTAP-P-1-M-7100 0
Pressure Drop Calculation
Calculating pressure drop in tubing involve numerical integration of the steady-statepressure gradient equation over the entire tubing length. The equation consists of threecomponents and can be expressed as follows:
ACCFRHYD dLdp
dLdp
dLdp
dLdp
+
+
=
Eq. 2.GG
where:
cHYD gsingp
dLdp θ=
Eq. 2.HH
is the pressure gradient caused by the hydrostatic head of potential energy of the multi-phase liquid.
Dg2vpf
dLdp
c
2
FR
=
Eq. 2.II
is the pressure gradient caused by wall friction.
dLg
vdvp
dLdp
cACC
=
Eq. 2.JJ
is the pressure gradient caused by fluid acceleration.
In multi-phase systems, the variables such as p and v in the pressure gradient equation arenormally averages for the gas and liquid phases present, therefore, the pressure issensitive to the relative amounts of gas and liquid present at any location in the tubing. Thehydrostatic head is the most predominant component of the pressure gradient in oil wells,often accounting for 90% of the pressure drop. The friction losses are the remainder of thepressure loss and are more significant in gas wells with acceleration effects being negligibleexcept when near to atmospheric pressure.
Gas and oil phases normally flow at different speeds which is the phenomenon referred toas slippage. This slippage causes an additional accumulation of liquid in the tubing which istermed liquid hold up. The amount of slippage that occurs is dependent upon thegeometrical distribution of the gas and liquid in the pipe, referred to as the ‘flow pattern’ or‘flow regime’. Flow patterns are governed primarily by the flow rates of each phase, tubingdiameter and to a lesser extent PVT properties.

ARPO
ENI S.p.A.Agip Division
IDENTIFICATION CODE PAGE 49 OF 295
REVISIONSTAP-P-1-M-7100 0
Typical flow patterns are:
• Annular flow• Churn flow• Slug flow• Bubble flow• Liquid flow.
Considering the above, it is obvious that the pressure at each point in the well and,therefore, the total pressure drop is very dependent on flow pattern. Typical pressuregradients in wells for different flow patterns are:
• Single phase oil = 0.36psi/ft• Bubble flow = 0.25psi/ft• Slug flow = 0.20psi/ft• Mist flow = 0.1 - 0.2psi/ft
Hence, it is seen that prediction of pressure drop in multi-phase systems is complex andhas led to the development of different correlations to be used. Although many of thesehave been successful to some degree, no single method has been universally beenaccepted.
The early developed correlations assumed the flow as homogeneous mixtures ignoringliquid hold up effects. Attempts were made to compensate for these errors in the equationsby single empirical derived friction factor. Subsequent correlations were developed topredict liquid hold up but most of these first required an empirical correlation or ‘map’ topredict the flow pattern. The accuracy of existing correlations for predicting flow pattern,liquid hold up pressure gradient is limited by the ranges of data used in their developmentand no single method can be applied universally. More recent models developed based onflow mechanisms and conservation principles, referred to as mechanical models, offer morepotential for accurate predictions but these are not readily accepted as standard designmethods as yet.
Some software programmes use all the correlations available and the more recentpromising mechanical models can be added.
Flow Patterns
Transition between the various flow patterns, as listed in the previous section, can beidentified using flow pattern maps. The most common maps are empirically derived with co-ordinates based on dimensionless groups of variables that include volumetric flow rates,diameter and PVT properties.
Although bubble, slug and churn floe predominate in oil wells, it is possible for oil and gaswells to include all flow patterns in addition to single phase liquid and gas.

ARPO
ENI S.p.A.Agip Division
IDENTIFICATION CODE PAGE 50 OF 295
REVISIONSTAP-P-1-M-7100 0
Classification Of Methods
Published methods of multi-phase flow pressure gradients in wells can be placed into oneof three general categories based on the assumptions from which the method wasdeveloped:
• Homogeneous flow correlations where slippage and flow pattern are notconsidered.
• Slip flow correlations where slippage is considered but not flow pattern.• Flow pattern dependent correlations where liquid hold up and flow pattern are
considered.• Mechanised models where slippage, flow pattern and basic flow mechanisms
are considered.
Oil Well Correlations
Oil well correlations for predicting pressure gradients in oil wells have been published andthose most widely accepted in the Industry are:
• Duns and Ros (1963)• Hagedorn and Brown (1967)• Orkiszewski (1967)• Aziz, Covier and Fogarasi (1972)• Beggs and Brill (1973).
As illustrated in figure 2.r and figure 2.s, these correlations predict different pressure dropsfor the same application, however any one of these may be successful in a given field.Validation and actual field data are the only means of choosing a pressure loss method butthis is not available at the time of designing the completions. Ansari recently performed anevaluation of the most widely used correlations and his own proposed mechanistic model.,performed using the TUFFP well databank consisting of 1775 flowing well surveys coveringa broad range of production variables and pressure loss methods were also evaluated foreach flow pattern. table 2.c presents the overall results below:
Method Average Error AbsoluteAverage Error
StandardDeviation
Relative PerformanceFactor, RPC
Ansari 9.3 101.3 163.9 1.000
Hagbr -28.5 102.8 178.4 1.132
Dunros 33.4 110.9 177.7 1.178
Aziz -20.8 116.6 190.4 1.198
Begbril 41.3 134.9 207.9 1.404
Orkis 12.2 151.3 273.3 1.597
Mukbr 78.7 159.8 217.2 1.666
Table 2.C - Evaluation of Pressure Loss Methods Using TUFFP Well Databank
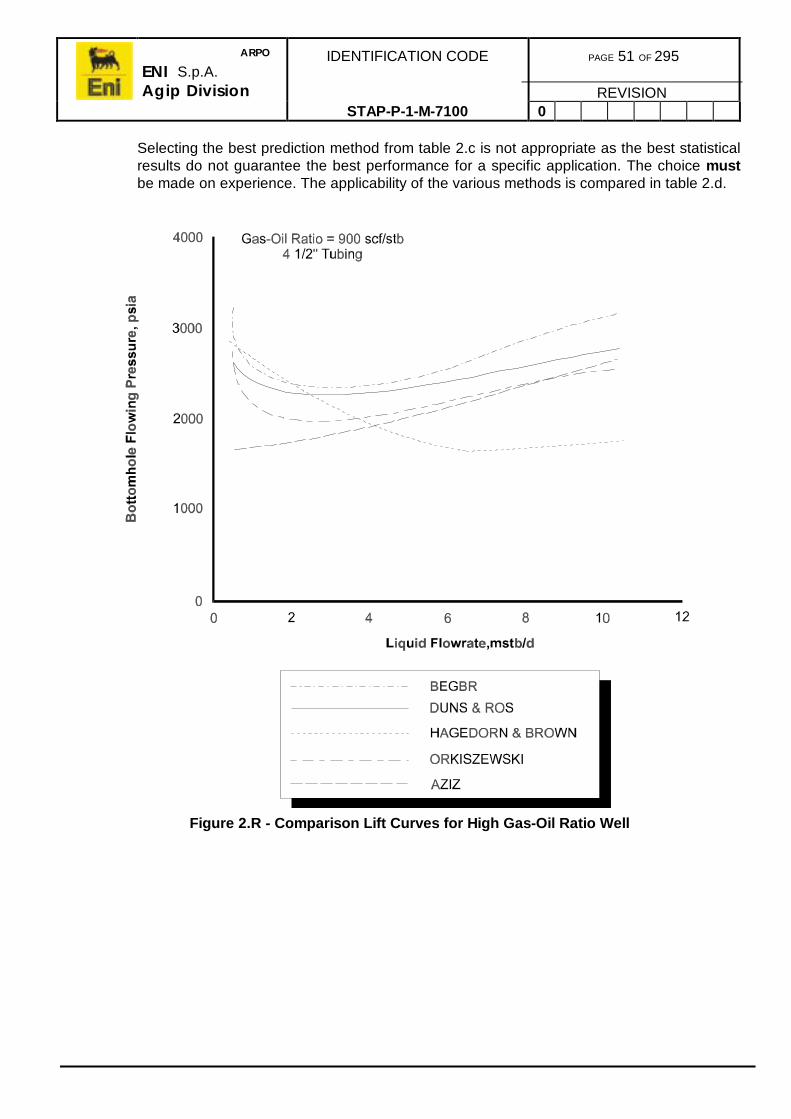
ARPO
ENI S.p.A.Agip Division
IDENTIFICATION CODE PAGE 51 OF 295
REVISIONSTAP-P-1-M-7100 0
Selecting the best prediction method from table 2.c is not appropriate as the best statisticalresults do not guarantee the best performance for a specific application. The choice mustbe made on experience. The applicability of the various methods is compared in table 2.d.
Figure 2.R - Comparison Lift Curves for High Gas-Oil Ratio Well

ARPO
ENI S.p.A.Agip Division
IDENTIFICATION CODE PAGE 52 OF 295
REVISIONSTAP-P-1-M-7100 0
Figure 2.S - Comparison of Lift Curves for Low Gas-Oil Ratio Well

ARPO
ENI S.p.A.Agip Division
IDENTIFICATION CODE PAGE 53 OF 295
REVISIONSTAP-P-1-M-7100 0
Method Category Accuracy Data Fluids Application/Comments
Ansari (TUFFP1963)
MechanisticModel
Good N/A N/A Appears a little conservative. Givesconsistent results for all flow patternsand TCP minimum. Needs to beverified through use.
Aziz et al (!972) Flow PatternDependent
Variabledependingon version
Laboratoryand field
Oil, water,gas
Optimistic. tends to under-predictpressure drop.
Beggs and Brill(1973)
Flow Pattern Poor Laboratory Air, water Developed for deviated wells buttends to significantly over-predictpressure drop. Should be avoidedunless well is highly deviated.
Beggs and Brill withPalmer
Flow PatternDependent
Fair Laboratory Air, water Developed for deviated wells buttends to over-predict.
Cornish (1976) Homo-geneous
Good insome flowpatterns
Field(annular
flow)
Oil, Gas Does not predict a TPC minimum.Usually not applicable for completiondesign.
Duns and Ros(1963)
Flow PatternDependent
Good Laboratory,
experimental plus
field data
Oil, gas,water
Conservative. Tends to over-predictpressure drop. Good where severalflow patterns exist.
Hagedorn andBrown (1965)
Slip Flow Good insome flowpatterns
Fieldexperiment
Oil, water,air
Does not predict a TCP minimum.Poor in bubble flow. Liquid hold upprediction can be less than for no slipflow. Should be used with caution.
Hagedorn andBrown with GriffithBubble andrestriction on holdup
Flow PatternDependent
Good Fieldexperiment
Oil, water,air
Optimistic. Tends to under-predictpressure drop. This is the preferredcorrelation in the absence of otherdata.
Kleyweg et alOccidental mod(1983)
Slip Flow Field Oil, water,Gas
Developed to optimise gas lift inhighly deviated wells (>70o) inClaymore field. Should not be usedexcept for similar conditions.
Orkiszewski (1967) Flow PatternDependent
Fair SomeHagedornand Browndata, field
Oil, water,gas
Conservative. Tends to over-predictpressure drop. can causeconvergence problems in computingalgorithm.
Table 2.D- Applicability of Pressure Loss Prediction Met hods
Gas And Gas Condensate Correlations
For gas and gas condensate wells the following methods are frequently used:
• Cullender and Smith• Single phase gas with modified gravities• Multi-phase flow correlations• Gray correlation.

ARPO
ENI S.p.A.Agip Division
IDENTIFICATION CODE PAGE 54 OF 295
REVISIONSTAP-P-1-M-7100 0
As with oil wells, validation with field data is the only reliable method for determining themost appropriate correlation and, similarly, this is never usually available at the time that thecompletions are designed. If this is the case, the Gray correlation is generally recommendedalthough the Ansari model mat prove to be even more accurate since it includes a goodmodel for predicting pressure gradient in annular flow which is the most predominant in gaswells.
Care is needed in the selection of tubing in that, even in low liquid rates, wells can quickly‘load up’ over a few weeks if it is not correctly sized. Although any of the correlations can beused, the Gray correlation is recommended based on the work with ‘Reinicke et al’ butresults should be used with caution.
In gas wells, liquid loading can also be predicted using simplified methods presented withTurner et al which are independent of pressure drop calculations. These methods havebeen reviewed by Lea and Tighe. For wells producing high gas-water or gas-condensateratios, it is recommended that tubing size be assessed using these methods in addition tolift curve methods and that the most conservative approach be adopted.
Effect Of Deviation Angle
Nowadays most wells of interest to operators are directional or deviated wells. The accuracyof pressure drop calculations in these circumstances using correlations developed forvertical is obviously extremely questionable.
Flow pattern and liquid hold up is very dependent on deviation angle. For wells withdeviations up to 45o from vertical, vertical correlations perform accurately enough for wellsgreater than 45o, accounting for deviation by simply using the sine in the hydrostaticcomponent of the pressure gradient equation may not be adequate in these cases, eitherthe Beggs and Brill correlation or a mechanistic model would be necessary.
In any study, differing correlations should not be used for different deviations, as thedifference between the predicted pressure drops is generally greater than the effect of thedeviation itself.
Effect Of Restrictions
Most oil and gas wells contain some types of flow control devices in the completion whichchoke flow. The geometry of these restrictions varies from a simple reduced diameter axialflow path to a tortuous complex path. When a multiphase mixture flows through arestriction, the phase velocities dramatically increase. If these reach sonic velocity, criticalflow occurs.
For critical flow, simple empirical correlations such as the Gilbert equation are sufficientlyaccurate. For sub-critical flow, behaviour is very dependent on geometry and a simpleBernoulli type equation with a discharge coefficient is recommended.

ARPO
ENI S.p.A.Agip Division
IDENTIFICATION CODE PAGE 55 OF 295
REVISIONSTAP-P-1-M-7100 0
Effect Of Erosion
Erosion in completions occurs when there are high velocities and if there are solids particlesin the flow stream. The most common points for erosion is where there are restrictionswhich cause increased velocities. The API have published a method in API RP 14E, todetermine the threshold velocities for erosion to occur in piping systems but the validity ofthis for all conditions is questionable.
2.4.5. Flow Rate Prediction
Following the establishment of both the IPR and TPC, they must be presented in the sameplot from which the intersection of the lines can be used to predict the flow rate of a well atgiven set of stable flow conditions (Refer to figure 2.t ).
Changing the system parameters like the tubing ID, reservoir pressure, GLR, etc., will effecteither or both the IPR and TPC and in consequence alters the production rate.Systematically varying the system parameters allows comparison of the incremental effectson production and these can, in turn, be forecast and analysed for cost/benefit of thecompletion options. Continuing in this manner provides information on which decisions canbe made on optimum well configuration or optimum operating conditions. This sectiondescribes this analysis.
Figure 2.T - Combining IPR and TPC Curves

ARPO
ENI S.p.A.Agip Division
IDENTIFICATION CODE PAGE 56 OF 295
REVISIONSTAP-P-1-M-7100 0
Natural Flow Point
The characteristic ‘J’ shape of the TPC means there can be several possible intersectionswith the IPR as shown in figure 2.t through figure 2.v. The TCP, Pmin, occurs due to the gasand liquid phase velocities differ at low flow rates, i.e. slippage occurs. At low flow rates, thehydrostatic component in the total pressure drop predominates. As liquid velocities tendtoward zero, the gas escapes from the well and the hydrostatic gradient approaches thestatic pressure of the liquid. On the other hand, as the flow rate increases, the hydrostaticcomponent reduces due the gas lift effect while the friction component increases until theminimum is reached when the friction pressure drop exactly offsets the decrease inhydrostatic pressure drop.
In figure 2.t, the IPR and TPC curves intersect well to the right of the minimum and, underthese conditions, the well will flow at a stable rate defined as the natural flow point. Theoptimum tubing size, or GLR, will give an intersection well to the right of the pmin and out ofthe flat portion of the TCP curve. but without incurring excessive friction losses.
If the intersection is either close to or to the left of the minimum (Refer to Figure), the wellwill tend to head and flow at unstable conditions due to the cyclic build up of liquid andperiodic slug lifting by accumulated pressure of the trapped gas. Because of theinaccuracies of the two phase flow correlations and the difficulty in obtaining reliable data inthis region, the start of unstable flow conditions is rarely known especially with large sizetubing. As the usual aim is to keep to the right of Pmin, this is generally not a problem.
Figure 2.U- Combined IPR and TPC Curves Under Unstable Conditions

ARPO
ENI S.p.A.Agip Division
IDENTIFICATION CODE PAGE 57 OF 295
REVISIONSTAP-P-1-M-7100 0
If the natural flow point is in the unstable region, a smaller size tubing or artificial lift systemshould be considered. Using smaller tubing may result in higher frictional pressure dropsand if this reduces flow rates to below uneconomic levels, a tapered tubing string may be aconsideration.
Where the IPR and TCP curves intersect close to, or to the left of the minimum, the flow willbecome increasingly unstable and wells with large size tubing will die quickly, whereas smalltubing may sustain unsteady flow until the IPR and TPC curves become almost tangential.
Where the curves intersect at two rates (Refer to figure 2.v), the intersection point to the leftis always unstable and the well will either die or progressively produce more fluid until itreaches the stable flow point. To obtain flow at these conditions, it is necessary to kick thewell off quickly.
Figure 2.V - IPR and TPC Curves with Two Apparent Intersection Points

ARPO
ENI S.p.A.Agip Division
IDENTIFICATION CODE PAGE 58 OF 295
REVISIONSTAP-P-1-M-7100 0
Artificial Lift Effects
A well will not flow naturally if the IPR and TPC curves do not intersect and in this caseartificial lift could be used to provide the pressure differential between the curves (Refer tofigure 2.w). An artificial lift system places an injection of energy into the flow system whichdisplaces the TPC curve downwards.
In a pumping well, the displacement is dependent on the pump performance curve (i.e.pump differential versus rate) which is plotted below the well performance curves as shownin figure 2.w. This results in a combined outflow performance curve termed the pump intakecurve.
It is necessary when carrying out this analysis, to consider the effect of downhole gasseparation on pump outflow performance.
In gas lifted wells, the TPC is displaced as a result of the effect of the gas on the density,velocity and flow regime in the tubing above the operating gas lift valve.
By generating an outflow performance curve for each potential system, they can be used tocompare the deliverability of the various methods. From this an economic cost analysis canbe produced to analyse capital and operating cost differences.
Figure 2.W- Combining Pump Performance and TCP Curves

ARPO
ENI S.p.A.Agip Division
IDENTIFICATION CODE PAGE 59 OF 295
REVISIONSTAP-P-1-M-7100 0
As shown in the example (figure 2.x below), it is apparent that gas lift will maximise thedeliverability of good wells (PI = 2.5std/d/psi) provided 2 7/8ins tubing is installed, whilesubmersible pumping gives the maximum rate from the poorer zones (PI = 0.4 to1.0stb/d/psi) provided there is no drawdown limitation.
Artificial lift is often widely used to improve flow stability and increase the production ofexisting producing wells, however the operating and capital costs of equipment must bejustified against the incremental increase in production rate.
Figure 2.X - Artificial Lift Options for Deep Wells with 5 1/2ins Casing

ARPO
ENI S.p.A.Agip Division
IDENTIFICATION CODE PAGE 60 OF 295
REVISIONSTAP-P-1-M-7100 0
3. WELL TESTING
3.1. INTRODUCTION
The main objective when drilling an exploration well is to test and evaluate the targetformation. The normal method of investigating the reservoir is to conduct a well test. Thereare two types of well test methods available:
• Drill Stem Test (DST)Where Drillpipe/Tubing in combination with downhole tools is used as a shortterm test to evaluate the reservoir.
• Production TestMany options of string design are available depending on the requirements ofthe test and the nature of the well.
Many designs of well testing strings are possible depending on the requirements of the testand the nature of the well and the type of flow test to be conducted but basically it consistsof installing a packer tailpipe, packer and downhole test tools and a tubing or drill pipe stringthen introducing a low density fluid into the string in order to enable the well to flow throughsurface testing equipment which controls the flow rate, separates the fluids and measuresthe flow rates and pressures.
3.1.1. Types of Tests
Drawdown
A drawdown test entails flowing the well and analysing the pressure response as thereservoir pressure is reduced below its original pressure. This is termed drawdown. It is notusual to conduct solely a drawdown test on an exploration well as it is impossible tomaintain a constant production rate throughout the test period as the well must first clean-up. During a test where reservoir fluids do not flow to surface, analysis is still possible. Thiswas the original definition of a drill stem test or DST. However, it is not normal nowadays toplan a test on this basis.
Multi-Rate Drawdown
A multi-rate drawdown test may be run when flow rates are unstable or there aremechanical difficulties with the surface equipment. This is usually more applicable to gaswells but can be analysed using the Odeh-Jones plot for liquids or the Thomas-Essi plot forgas.
It is normal to conduct a build-up test after a drawdown test.
The drawdown data should also be analysed using type curves, in conjunction with the buildup test.

ARPO
ENI S.p.A.Agip Division
IDENTIFICATION CODE PAGE 61 OF 295
REVISIONSTAP-P-1-M-7100 0
Build-Up
A build-up test requires the reservoir to be flowed to cause a drawdown then the well isclosed in to allow the pressure to increase back to, or near to, the original pressure which istermed the pressure build-up or PBU. This is the normal type of test conducted on an oilwell and can be analysed using the classic Horner Plot or superposition.
From these the permeability-height product, kh, and the near wellbore skin can beanalysed.
On low production rate gas wells, where there is a flow rate dependant skin, a simple formof test to evaluate the rate dependant skin coefficient, D, is to conduct a second flow andPBU at a different rate to the first flow and PBU. This is the simplest form of deliverabilitytest described below.
Deliverability
A deliverability test is conducted to determine the well’s Inflow Performance Relation, IPR,and in the case of gas wells the Absolute Open Flow Potential, AOFP, and the ratedependant skin coefficient, D.
The AOFP is the theoretical fluid rate at which the well would produce if the reservoir sandface was reduced to atmospheric pressure.
This calculated rate is only of importance in certain countries where government bodies setthe maximum rate at which the well may be produced as a proportion of this flow rate.
There are three types of deliverability test:
• Flow on Flow Test• Isochronal Test• The Modified Isochronal Test.
Flow-on-Flow
Conducting a flow-on-flow test entails flowing the well until the flowing pressure stabilisesand then repeating this at several different rates. Usually the rate is increased at each stepensuring that stabilised flow is achievable. The durations of each flow period are equal. Thistype of test is applicable to high rate gas well testing and is followed by a single pressurebuild up period.
Isochronal
An isochronal test consist of a similar series of flow rates as the flow-on-flow test, each rateof equal duration and separated by a pressure build-up long enough to reach the stabilisedreservoir pressure. The final flow period is extended to achieve a stabilised flowing pressurefor defining the IPR.
Modified Isochronal
The modified isochronal test is used on tight reservoirs where it takes a long time for theshut-in pressure to stabilise. The flow and shut-in periods are of the same length, exceptthe final flow period which is extended similar to the isochronal test. The flow rate again isincreased at each step.

ARPO
ENI S.p.A.Agip Division
IDENTIFICATION CODE PAGE 62 OF 295
REVISIONSTAP-P-1-M-7100 0
Reservoir Limit
A reservoir limit test is an extended drawdown test which is conducted on closed reservoirsystems to determine their volume. It is only applicable where there is no regional aquifersupport. The well is produced at a constant rate until an observed pressure drop, linear withtime, is achieved. Surface readout pressure gauges should be used in this test.
It is common practice to follow the extended drawdown with a pressure build-up. Thedifference between the initial reservoir pressure, and the pressure to which it returns, is thedepletion. The reservoir volume may be estimated directly from the depletion, also thevolume of produced fluid and the effective isothermal compressibility of the system. Thevolume produced must be sufficient, based on the maximum reservoir size, to provide ameasurable pressure difference on the pressure gauges, these must therefore be of thehigh accuracy electronic type gauges with negligible drift.
Interference
An interference test is conducted to investigate the average reservoir properties andconnectivity between two or more wells. It may also be conducted on a single well todetermine the vertical permeability between separate reservoir zones.
A well-to-well interference test is not carried out offshore at the exploration or appraisalstage as it is more applicable to developed fields. Pulse testing, where the flowrate at oneof the wells is varied in a series of steps, is sometimes used to overcome the backgroundreservoir pressure behaviour when it is a problem.
Injectivity
In these tests a fluid, usually seawater offshore is injected to establish the formation’sinjection potential and also its fracture pressure, which can be determined by conducting astep rate test. Very high surface injection pressures may be required in order to fracture theformation.
The water can be filtered and treated with scale inhibitor, biocide and oxygen scavenger, ifrequired. Once a well is fractured, which may also be caused by the thermal shock of thecold injection water reaching the sandface, a short term injection test will generally notprovide a good measure of the long term injectivity performance.
After the injectivity test, the pressure fall-off is measured. The analysis of this test is similarto a pressure build-up, but is complicated by the cold water bank.

ARPO
ENI S.p.A.Agip Division
IDENTIFICATION CODE PAGE 63 OF 295
REVISIONSTAP-P-1-M-7100 0
3.2. DST OBJECTIVE
A DST is conducted to determine the productivity characteristics of one specific zone.Currently, analysis can provide good data to help evaluate the productivity of the zone,completion practices, extent of formation damage and if there is a requirement forstimulation.
In many cases, actual well production rates can be accurately predicted from DST data as itshows what the well will produce against a gradually increasing back-pressure. From this aProductivity Index (PI) or Inflow Performance Relationship (IPR) can be established (Referto Section 2.4) and, if the flowing pressure gradient in the tubing can be estimated, thenactual producing rates can also be determined.
Testing is an expensive and high risk operation and, therefore, should only be conductedfor essential data. The starting premise should be that testing is not required unless it isclearly justified.
The second premise is that, if testing is warranted, it should be done in the simplestpossible manner, avoiding any operations which entail higher risk, such as running wirelineor coil tubing through the testing string.
By adopting this position, the Petroleum Engineer should not appear to be negative butwork towards obtaining essential data, which the company needs rather than that which isnice to have , in the most cost-effective manner.
The test objectives must be agreed by those who will use the results and those who willconduct the test before the test programme is prepared. The Petroleum Engineer shoulddiscuss with the geologists and reservoir engineers about the information required andmake them aware of the costs and risks involved with each method. They should select theeasiest means of obtaining data, such as coring, if possible. Such inter-disciplinarydiscussions should be formalised by holding a meeting (or meetings) at which theseobjectives are agreed and fixed.
The objectives of an exploration well test are to:
• Conduct the testing in a safe and efficient manner• Determine the nature of the formation fluids• Measure reservoir pressure and temperature• Interpret reservoir permeability-height product (kh) and skin value• Obtain representative formation fluid samples for laboratory analysis• Define well productivity and/or injectivity• investigate formation characteristics• Evaluate boundary effects.

ARPO
ENI S.p.A.Agip Division
IDENTIFICATION CODE PAGE 64 OF 295
REVISIONSTAP-P-1-M-7100 0
3.3. DST STRING
The well testing objectives, test location and relevant planning will dictate which is the mostsuitable test string configuration to be used. Some generic test strings used for testing fromvarious installations are shown overleaf. For more detailed information on well test stringsand tooling, refer to the Company ‘Well Test Manual’.
In general, well tests are performed inside a 7ins production liner, using full opening testtools with a 2.25ins ID. In larger production casing sizes the same tools will be used with alarger packer. In smaller casing sizes, smaller test tools will be required, but similarly, thetools should be full opening to allow production logging across perforated intervals. For abarefoot test, conventional test tools will usually be used with a packer set inside the 95/8inscasing.
If conditions allow, the bottom of the test string should be 100ft above the top perforation toallow production logging of the interval.
In the following description, tools which are required both in production tests andconventional tests are included. The list of tools is not exhaustive, and other tools may beincluded. However, the test string should be kept as simple as possible to reduce the risk ofmechanical failure. The tools should be dressed with elastomers suitable for the operatingenvironment, considering packer fluids, prognosed production fluids, temperature and thestimulation programme, if applicable.

ARPO
ENI S.p.A.Agip Division
IDENTIFICATION CODE PAGE 65 OF 295
REVISIONSTAP-P-1-M-7100 0
Figure 3.A- Typical Jack Up Test String With TCP Guns On Permanent Packer

ARPO
ENI S.p.A.Agip Division
IDENTIFICATION CODE PAGE 66 OF 295
REVISIONSTAP-P-1-M-7100 0
Figure 3.B - Typical Test String With TCP Guns Stabbed Through Production P acker

ARPO
ENI S.p.A.Agip Division
IDENTIFICATION CODE PAGE 67 OF 295
REVISIONSTAP-P-1-M-7100 0
Figure 3.C - Typical Jack Up Test String With Retrievable Packer

ARPO
ENI S.p.A.Agip Division
IDENTIFICATION CODE PAGE 68 OF 295
REVISIONSTAP-P-1-M-7100 0
Figure 3.D - Typical Semi-Submersible Test String - Retrievable Packer

ARPO
ENI S.p.A.Agip Division
IDENTIFICATION CODE PAGE 69 OF 295
REVISIONSTAP-P-1-M-7100 0
3.4. RESERVOIR CHARACTERISTICS
Reservoir characteristics that may be estimated from DST analysis include:
• Average Effective Permeability. This may be better than core permeabilitysince much greater volume is averaged. Also effective permeability rather thanabsolute permeability is obtained.
• Reservoir Pressure. Measured if shut-in time is adequate, or calculated if not.• Wellbore Damage. Damage ratio method permits estimation of what the well
should make without damage.• Barriers/Permeability Changes/Fluid Contacts. These reservoir anomalies
affect the slope of the pressure build-up plot. They usually require substantiatingdata to differentiate one from the other.
• Radius Of Investigation. An estimate of how far away, from the wellbore, theDST can ‘see’.
• Depletion. Can be detected if the reservoir is small and the test is conductedproperly.
In summary, the DST if properly applied is an essential tool for the Completions Engineer.
3.4.1. Pressure Build-Up Analysis
Horner Equation
Transient pressure analysis is based on the Horner pressure build-up equation whichdescribes the re-pressuring of the wellbore area during the shut-in period as the formationfluids moves into the ‘pressure sink’ created by the flowing portion of the test:
′∆′∆−′µ−=
ttt
logkh
Bq6.162pp 10iws
Eq. 3.A
where:
pws = Measured pressure in the wellbore during the build-up, psigt’ = Flowing time, mins∆t’ = Shut-in time, minspi = Shut-in reservoir pressure, psigq = Rate of flow, stb/dayµ + Fluid viscosity, cpB = Formation volume factor, reservoir bbl/stb/dayk = Formation permeability, mdh = Formation thickness, ft

ARPO
ENI S.p.A.Agip Division
IDENTIFICATION CODE PAGE 70 OF 295
REVISIONSTAP-P-1-M-7100 0
Conditions which must be assumed during the build-up period for eq. 3.a to be strictlycorrect are:
• Radial flow• Homogenous formation• Steady state conditions• Infinite reservoir• Single phase flow.
Most of these conditions are met on a typical DST although steady state flow is thecondition which may cause most concern particularly at early shut-in time.
Horner Build-Up Plot
Assuming these conditions are met, then a plot of pws versus
′∆
′∆+′
t
ttlog p
10 should yield a
straight line and the slope (m) of the straight line should be:
khBq6.162
mµ
=Eq. 3.B
The constant m is representative of a given fluid having physical properties µB flowing at arate q through a formation having physical properties kh.
figure 3.e shows an idealised Horner Plot with the pressure chart showing very simply howt’p and formation pressure pws at varied shut-in times ∆t’ are picked from the chart andrelated to the Horner plot. Usually pws is determined at 5min intervals along the shut-inpressure curve.
In a multi-phase flow period DST, selecting a value for t’p creates some problemmathematically, however little error is caused by assuming that t’p is the time of the flowingperiod immediately before the particular shut-in period. With equal flow periods on amultiple flow period DST, this is usually done. With a very short initial flow period, t’p can beassumed to be the total of the flowing times with very little error.
In figure 3.e, ,the slope m of the straight line is numerically the difference between the t’p
pressure value at 0t
ttlog p
10 =
′∆
′∆+′ and at 0.1
t
ttlog p
10 =
′∆
′∆+′
If the points are plotted on semi-log paper, m is the change in pressure over one log cycle.
The ideal plot is where all the points align up in a straight line but is seldom found inactuality, since ‘after-flow’ or wellbore storage effects cause deviation from the straight linein the early region. As a rule of thumb, four points are the fewest to determine a straightline.
An important issue is the time required to approach steady state or straight line conditions,depends on reservoir and fluid characteristics, and flow conditions. Experience hasformulated some certain rules of thumb to help determine the shut-in time. One of these isthat generally the shut-in pressure must reach at least 65% of the static pressure.

ARPO
ENI S.p.A.Agip Division
IDENTIFICATION CODE PAGE 71 OF 295
REVISIONSTAP-P-1-M-7100 0
Prior to type curve matching methods, no analysis of the plot was possible unless thestraight line was achieved, however, sometimes reasonable estimates of formationparameters could be made.
Figure 3.E - Idealised Horner Build-Up Plot
Reservoir Parameters Obtained By Build-Up Analysis
Average permeability, k, can be calculated::
mhBq6.162
kµ
=Eq. 3.C
Parameters, viscosity, µ, and formation volume, B, can be estimated from availablecorrelations if the gravity of the crude oil and the gas-oil ratio are determined bymeasurement.
Formation thickness, h, must be the net thickness of the productive zone, determined fromelectric log analysis. If the net thickness is not available then kh or formation capacity isdetermined:
mBq6.162
khµ
=Eq. 3.D

ARPO
ENI S.p.A.Agip Division
IDENTIFICATION CODE PAGE 72 OF 295
REVISIONSTAP-P-1-M-7100 0
If all the parameters are unknown, transmissibility B
khµ
is determined:
mq6.162
Bkh =µ
Eq. 3.E
Static reservoir pressure, pi, is obtained by extrapolating the Horner straight line to an‘infinite’ shut-in time:
At infinite shut-in time, 0.0.1t
tt=
′∆′∆+′
, or as shown in figure 3.e, 0t
ttlog p
10 =
′∆
′∆+′.
In figure 3.e, both the 1st build-up and 2nd build-up plots extrapolate to the same staticpressure lending confidence to the analysis. If the second build-up pressure was lower thanthe 1st, them depletion may have occurred.
Wellbore damage, is presented by the empirical equation for the dimensionless value, s,skin factor:
+
µφ′
−−
= 85.2rc
tklog
mpp
151.1sw
pffiEq. 3.F
However, this factor cannot be readily applied to specific formations to obtain to show thepotential of the zone would be if there was no damage. This was carried on a stage furtherintroducing the concept of damage ratio, DR, which compares the flow rate observed, q, tothe theoretical flow rate without damage:
a
t
q
qDR=
An another equation, for calculation of DR based on the skin factor relation of Hurst andvan Everdingen, is:
−
µφ
′−
=85.2
rc
tklogm
ppDR
w2
p
ffi Eq. 3.G
where:
pi = Shut-in reservoir pressure, psipff = Formation pressure at flow time T, psi (final flowing pressure)c = Fluid compressibility, vol/vol/psiΦ = Formation porosity, fractionµ = Viscosity of reservoir pressure, cprw = Well bore radius, insk = Effective permeability, mdt’p = Flowing time, mins

ARPO
ENI S.p.A.Agip Division
IDENTIFICATION CODE PAGE 73 OF 295
REVISIONSTAP-P-1-M-7100 0
Reservoir And Fluid Anomaly Indications
Many times the Horner build-up equation does not hold up under actual case. If changesoccur within the radius of investigation of the DST, they can be detected by a change inshape of the slope of the of the line.
If it is seen that the rate of flow q remains constant, then permeability k or fluid viscosity µare likely suspects for change as the wave of increasing pressure travels towards thewellbore.
Permeability may change due to natural lensing or formation damage but it is doubtful thatformation damage would affect sufficient volume of formation to be detected as a change ofslope on the build-up plot.
Fluid viscosities change by phase change or type of fluid. ‘Seeing’ a gas-liquid contact froman up-structure well would be difficult due to the normally short radius of investigationthrough a gas column. Alternatively, seeing a gas-liquid contact from a down-structure wellis a much more likely possibility.
A sealing barrier such as a fault or permeability pinchout can cause a change of slope m.
If the barrier is a straight line as A - A’ in figure 3.f , then the build-up slope will change by afactor of 2.
In summary, a change in permeability, viscosity, or existence of a barrier, can cause achange in the slope of the Horner plot, therefore the fact that a change of slope appears onthe build-up plot, leaves open the question of what caused the anomaly. This must beresolved through other geologic or reservoir information.
Figure 3.F - Effect of a Fault

ARPO
ENI S.p.A.Agip Division
IDENTIFICATION CODE PAGE 74 OF 295
REVISIONSTAP-P-1-M-7100 0
The distance to the anomaly, ra, whether it be a barrier, change of permeability, or a fluidcontact, can be calculated:
∆
∆+=
µφ−−a
ap
p
a2
t
ttln303.2
tkcr793,3
EEq. 3.H
where:
ra = Distance to anomaly, ftTp = Flow time, hrs∆ta = Shut-in time at the point of slope change, hrs-E = Exponential integral value.
Radius Of Investigation
The following equation from Van Poollen may be used to estimate the radius ofinvestigation of any particular DST in an infinite radial flow system:
c1076.5
tkr
4i
i µφ×=
Eq. 3.I
where:
ri = Radius of investigationtp = Flow time, mins
Needless to point out, the longer the flowing time, the deeper the radius of investigation.
Depletion
As explained previously, if the extrapolated pressure from a second build-up is lower thanthe initial pressure of the first build-up, then depletion may be the cause. Obviously, areservoir would need to be extremely small for this to occur, however there is plenty of fieldexamples to prove that it occurs.
Another reason that a recorded initial shut-in pressure may be higher than true shut-inpressure. This effect is termed supercharged which may be caused by leak off of filtrateover-pressuring the formation. This effect needs to be diagnosed to confirm supercharging.

ARPO
ENI S.p.A.Agip Division
IDENTIFICATION CODE PAGE 75 OF 295
REVISIONSTAP-P-1-M-7100 0
Reservoir Parameters - Gaseous System
When conducting DSTs of gas zones, flow rate is calculated in scf/day or if in largequantities mscf/d. This involves correcting for deviation of the reservoir gas from theperfect gas law using the gas deviation factor, Z. and the absolute temperature factor, oR.
For the Horner build-up plot, the square of the formation pressure, pws, during the build-up is
plotted versus
′∆
′∆+′
t
ttp as shown in figure 3.g.
If the SG of the gas is known, the values of Z and µ can be found from standard testingliterature.
Figure 3.G - Typical Horner Plot - Gas well
Equations for permeability, estimated wellbore AOFP for a gas zone are:
Permeability:
hm
ZTq1637k
g
fg µ=
Eq. 3.J
where:
Z = Gas deviation factorQg = Rate of flow, mscf/dayTf = Formation temperature, oR = (oF + 460)mg = Horner build-up slope for gas well

ARPO
ENI S.p.A.Agip Division
IDENTIFICATION CODE PAGE 76 OF 295
REVISIONSTAP-P-1-M-7100 0
Wellbore Damage:
+
−=
65.2p
1tlogm
ff
2p
i
2p
EDR
g
Eq. 3.K
Absolute Open Flow Potential
Using the single point back-pressure test method:
( )( )ni
2i
2
ni
2g
pp
pqAOF
−=
Eq. 3.L
where:
n is an exponent varying between 0.5 and 1.0
If ff
2i
2
i2
g
pp
pqAOFMax0.1n
−==
Eq. 3.M
If ff
2i
2
ig
pp
pqAOFMax5.0n
−==
Eq. 3.N
Type Curve Methods
There are several type curve methods are available for analysing early time DST data frompressure transient tests. Although these methods are generally used on longer termproduction tests, they can be used on DST analysis to salvage some information from a testwhere sufficient data not available to obtain a straight line. Ramey, McKinley andEarlougher-Kersch methods have applications with McKinley being the easiest to use butthe others perhaps more accurate.
It should be iterated that the Horner should be used whenever possible and type curvesused to in picking correct straight line by indicating when wellbore storage effects haveended.

ARPO
ENI S.p.A.Agip Division
IDENTIFICATION CODE PAGE 77 OF 295
REVISIONSTAP-P-1-M-7100 0
3.4.2. Basics Of DST Operations
In simple terms, a DST is carried out by running test tools in a BHA on a test string in thehole (Refer to previous Section 3.3). When the string is successfully installed and allpressure and function testing is completed, a fluid is circulated into the tubing to provide anunderbalance to allow the well to flow after perforating.
The downhole tester valve is opened to flow the well to clean up perforating debris andinvasive fluids from the formation, the tester valve is then closed to allow the formationfluids to build-up back up to reservoir pressure which is recorded on pressure recorders orgauges.
After a suitable time (usually 11/2 times the flow period), the tester valve is then reopened toconduct the planned flow and shut-in periods in accordance to the programme requirementsto obtain other additional data and verification. figure 3.h shows a typical schematic of asimple single flow operational sequence.
A description of the tools used in DST test strings are outlined in the next section.
Figure 3.H - DST Typical Sequence of Events
3.4.3. Common Test Tools Description
Refer to the Company ‘Well Test Manual’.
Bevelled Mule Shoe
If the test is being conducted in a liner the mule shoe makes it easier to enter the liner top.The bevelled mule shoe also facilities pulling wireline tools back into the test string.
If testing with a permanent packer, the mule shoe allows entry into the packer bore.

ARPO
ENI S.p.A.Agip Division
IDENTIFICATION CODE PAGE 78 OF 295
REVISIONSTAP-P-1-M-7100 0
Perforated Joint/Ported Sub
The perforated joint or ported sub allows wellbore fluids to enter the test string if the tubingconveyed perforating system is used. This item may also be used if wireline retrievablegauges are run below the packer.
Gauge Case (Bundle Carrier)
The carrier allows pressure and temperature recorders to be run below or above the packerand sense either annulus or tubing pressures and temperatures.
Pipe Tester Valve
A pipe tester valve is used in conjunction with a tester valve which can be run in the openposition in order to allow the string to self fill as it is installed. The valve usually has aflapper type closure mechanism which opens to allow fluid bypass but closes when applyingtubing pressure for testing purposes.
The valve is locked open on the first application of annulus pressure which is during the firstcycling of the tester valve.
Retrievable Test Packer
The packer isolates the interval to be tested from the fluid in the annulus. It should be set byturning to the right and includes a hydraulic hold-down mechanism to prevent the tool frombeing pumped up the hole under the influence of differential pressure from below thepacker.
Circulating Valve (Bypass Valve)
This tool is run in conjunction with retrievable packers to allow fluid bypass while running inand pulling out of hole, hence reducing the risk of excessive pressure surges or swabbing.It can also be used to equalise differential pressures across packers at the end of the test. Itis automatically closed when sufficient weight is set down on the packer.
This valve should ideally contain a time delay on closing, to prevent pressuring up of theclosed sump below the packer during packer setting. This feature is important when runningtubing conveyed perforating guns which are actuated by pressure. If the valve does nothave a delay on closing, a large incremental pressure, rather than the static bottom-holepressure, should be chosen for firing the guns
Safety Joint
Installed above a retrievable packer, it allows the test string above this tool to be recoveredin the event the packer becomes stuck in the hole. It operates by manipulating the string(usually a combination of reciprocation and rotation) to unscrew and the upper part of thestring retrieved. The DST tools can then be laid out and the upper part of the safety joint runback in the hole with fishing jar to allow more powerful jarring action.

ARPO
ENI S.p.A.Agip Division
IDENTIFICATION CODE PAGE 79 OF 295
REVISIONSTAP-P-1-M-7100 0
Hydraulic Jar
The jar is run to aid in freeing the packer if it becomes stuck. The jar allows an overpull tobe taken on the string which is then suddenly released, delivering an impact to the stucktools.
Downhole Tester Valve
The downhole tester valve provides a seal from pressure from above and below. The valveis operated by pressuring up on the annulus. The downhole test valve allows downhole shutin of the well so that after-flow effects are minimised, providing better pressure data. It alsohas a secondary function as a safety valve.
Single Operation Reversing Sub
Produced fluids may be reversed out of the test string and the well killed using this tool. It isactuated by applying a pre-set annulus pressure which shears a disc or pins allowing amandrel to move and expose the circulating ports. Once the tool has been operated itcannot be reset, and therefore must only be used at the end of the test.
This reversing sub can also be used in combination with a test valve module if a furthersafety valve is required. One example of this is a system where the reversing sub iscombined with two ball valves to make a single shot sampler/safety valve.
Multiple Operation Circulating Valve
This tool enables the circulation of fluids closer to the tester valve whenever necessary as itcan be opened or closed on demand and is generally used to install an underbalance fluidfor brining in the well.
This tool is available in either annulus or tubing pressure operated versions. The tubingoperated versions require several pressure cycles before the valve is shifted into thecirculating position. This enables the tubing to be pressure tested several times whilerunning in hole. Eni-Agip’s preference is the annulus operated version.
Drill Collar
Drill collars are required to provide a weight to set the packer. Normally two stands of 43/4ins drill collars (46.8 lbs/ft) should be sufficient weight on the packer, but should beregarded as the minimum.
Slip Joint
These allow the tubing string to expand and contract in the longitudinal axis due to changesin temperature and pressure. They are non-rotating to allow torque for setting packers oroperating the safety joint.
ARPO
ENI S.p.A.Agip Division
IDENTIFICATION CODE PAGE 80 OF 295
REVISIONSTAP-P-1-M-7100 0
Crossovers
Crossovers warrant special attention, they are of the utmost importance as they connectevery piece of equipment in the test string which have differing threads. If crossovers haveto be manufactured, they need to be tested and fully certified. In addition, they must bechecked with each mating item of equipment before use.
3.4.4. Tools Utilised With Permanent P acker Systems
A permanent or permanent retrievable packer arrangement is used on a Jack-up or LandRig test utilising a production Xmas tree.
Pressure Operated Bypass Valve
This allows the test string to be stabbed into the packer in an un-performed well. The toolequalises pressure between the sump and the annulus when the tester valve is closed,preventing the sump from being pressured up due to the volume of the seal assemblyentering the packer. The valve is very similar to the circulating valve (bypass valve) except itis closed by annulus pressure instead of weight.
If the tester valve can be run in the open position then this valve is not required.
Sub-Surface Safety Valve
A subsurface safety valve is often run for safety being placed at least 100 ft below the mudline. A control line is run to the valve through a conventional tubing hanger/spoolarrangement. The designs can be like a modified lubricator valve or a completion typesubsurface safety valve. Some versions required by other operators are installed in thestring immediately below a surface test tree in the BOP stack arrangement but this does notprovide safety in the ultimate catastrophic situation when there is a collision by anothervessel.
Tubing Hanger
This will be spaced out to position the packer seal assembly into the packer and land off inthe tubing hanger spool.
3.4.5. Sub-Sea Test Tools Used On Semi-Submersibles
The sub-sea test tree (SSTT) assembly includes a fluted hanger, slick joint, and sub-seatest tree.
Fluted Hanger
The fluted hanger lands off and sits in the wear bushing of the wellhead and is adjustable toallow the SSTT assembly to be correctly positioned in the BOP stack so that when theSSTT is disconnected the shear rams can close above the disconnect point.

ARPO
ENI S.p.A.Agip Division
IDENTIFICATION CODE PAGE 81 OF 295
REVISIONSTAP-P-1-M-7100 0
Slick Joint (Polished Joint)
The slick joint (usually 5ins OD) is installed above the fluted hanger and has a smooth(slick) outside diameter around which the BOP pipe rams can close and sustain annuluspressure for DST tool operation or, if in an emergency disconnection, contain annuluspressure. The slick joint should be positioned to allow the two bottom sets of pipe rams tobe closed on it and also allow the blind rams to close above the disconnect point of theSSTT.
Sub-Sea Test Tree
The SSTT is a fail-safe sea floor master valve which provides two functions; the shut off ofpressure in the test string and; disconnection of the landing string from the test string due toan emergency situation or for bad weather. The SSTT is constructed in two parts; the valveassembly consisting of two fail safe closed valves and; a latch assembly. The latch containsthe control ports for the hydraulic actuation of the valves and the latch head.
The control umbilical is connected to the top of the latch which can, under mostcircumstances be reconnected, regaining control without killing the well. The valves holdpressure from below, but open when a differential pressure is applied from above, allowingsafe killing of the well without hydraulic control if unlatched.
Lubricator Valve
The lubricator valve is run one stand of tubing below the surface test tree. This valveeliminates the need to have a long lubricator to accommodate wireline tools above thesurface test tree swab valve. It also acts as a safety device when, in the event of a gasescape at surface, it can prevent the full unloading of the contents in the landing string afterclosing of the SSTT. The lubricator valve is hydraulic operated through a second umbilicalline and should be either a fail closed or; fail-in-position valve. When closed it will containpressure from both above and below
3.4.6. Deep Water Tools
Retainer Valve
The retainer valve is installed immediately above the SSTT on tests in extremely deepwaters to prevent large volumes of well fluids leaking into the sea in the event of adisconnect. It is hydraulic operated and must be a fail-open or fail-in-position valve. Whenclosed it will contain pressure from both above and below. It is usually run in conjunctionwith a deep water SSTT described below.

ARPO
ENI S.p.A.Agip Division
IDENTIFICATION CODE PAGE 82 OF 295
REVISIONSTAP-P-1-M-7100 0
Deep Water SSTT
As exploration moves into deeper and remote Subsea locations, the use of dynamicpositioning vessels require much faster SSTT unlatching than that available with the normalhydraulic system on an SSTT. The slow actuation is due to hydraulic lag time whenbleeding off the control line against friction and the hydrostatic head of the control fluid. Thisis overcome by use of the deepwater SSTT which has an Electro-Hydraulic control system.
The Hydraulic Deep Water Actuator is a fast response controller for the deepwater SSTTand retainer valve. This system uses hydraulic power from accumulators on the treecontrolled electrically from surface (MUX). The fluid is vented into the annulus or anatmospheric tank to reduce the lag time and reducing closure time to seconds.
If a programme required deepwater test tools, the tool operating procedures would beincluded in the test programme.
3.4.7. Downhole Pressure Recording
The complete sequence of events are recorded by bottom-hole pressure gauges and someflow data may also be recorded on surface read-out systems.
The gauges record the events from initial running of the test string to well kill and retrievalprocedures although, with the modern type gauges, they may be programmed to ‘sleep’while the string is being installed as it wastes memory. However, with the large memoryelectronic gauges on the market today, this is not necessary as they have sufficient memoryto record at fast intervals throughout even long term tests without running out of memory.The problem then is to dump or ignore data points which are not relevant to data gathering.
Other gauges, termed ‘smart’ gauges can be programmed to collect data at moderate timeintervals until they detect a quick pressure change, such as opening or shutting in the well,when they change to very short time intervals where this facility is required.

ARPO
ENI S.p.A.Agip Division
IDENTIFICATION CODE PAGE 83 OF 295
REVISIONSTAP-P-1-M-7100 0
3.5. WELL PRODUCTION TEST OBJECTIVES
The main objective of well production varies from simple determination of the amount andtype of fluids produced to sophisticated transient pressure determinations of reservoirparameters and hetrogenities. In short, well tests are tools which can be used to helpestablish the condition of production or injection wells.
Engineers need to make themselves familiar with the various test procedures and knowtheir advantages and limitations in order for them to fully utilise them to optimise the designof completions.
Well production tests may be classified as follows:
• Periodic• Productivity or Deliverability• Transient Pressure.
Descriptions of some of these tests are described earlier in this section.
Periodic production tests have the purpose of determining the relative quantities of oil, gasand water produced under normal producing conditions. They serve as an aid in well andreservoir operation and meeting legal and regulatory requirements.
Productivity or deliverability tests are usually performed on initial completion, or re-completion, to determine the capability of the well under various degrees of pressuredrawdown. Results may set production allowables, aid in selections of well completionmethods and design of artificial lift systems and production facilities.
Transient pressure tests require a higher degree of sophistication and are used todetermine formation damage or stimulation related to an individual well, or reservoirparameters such as permeability, pressure, volume and hetrogenities.
3.5.1. Periodic Tests
Production tests are carried out routinely to physically measure oil, gas and water producedby individual wells under normal producing conditions.
From the well and reservoir viewpoint, they provide periodic physical well conditions whereunexpected changes such as extraneous water or gas production may highlight well orreservoir problems. Abnormal production declines may also indicate artificial lift problems,sand build-up, scale build-up in perforations, etc.
On oil wells, results are reported as oil production rate, gas-oil ratio and water oil ratio as apercentage of water in the total liquid stream. Accuracy in measurement, with carefulrecording of the conditions is essential. Choke size, tubing pressures, casing pressure,details of artificial lift system operation and all other effects on the well producing capabilityshould be recorded. Potential production problems should be recognised in order that theycan be properly handled such as emulsions, security of power fluid or gas lift gas supply,etc.
It is important that the well is produced at its normal conditions as flow rate will vary therelative quantities of oil, gas and water.
On gas wells, routine are less common as each well normally has individual measuringcapability. Gas production is reported as well as condensate and water. Similar to oil wells,the wells must be produced at the normal rates.

ARPO
ENI S.p.A.Agip Division
IDENTIFICATION CODE PAGE 84 OF 295
REVISIONSTAP-P-1-M-7100 0
3.5.2. Productivity Or Deliverab ility Tests
This test is different from the periodic test in that the liquid flow performance can bedetermined empirically using measured flow rates at varying bottom-hole pressuredrawdowns and they do not rely on mathematical descriptions of the flow process. With alimited number of measurements, they permit prediction of what a well could produce atother pressure drawdowns. This is then used to predict the PI (Refer to Section 2.4.1) andare successfully applied to non-Darcy conditions.
They do not permit calculation of formation permeability or the degree of abnormal flowrestrictions (formation damage) near the wellbore. They do, however include the effects offormation damage, therefore can be used as an indicator of well flow conditions or a basisfor simple comparison of completion effectiveness among wells in a particular reservoir.
Commonly used deliverability tests for oil wells may be classified as:
• Productivity Index• Inflow Performance• Flow-After-Flow• Isochronal.
These tests are described in Section 2.4.1 or in Section 3.4.1 above.
Gas well deliverability tests are designed to establish AOFP. Termed multi-point back-pressure tests, they can be classified as:
• Flow-After-Flow• Isochronal.
These tests are described in Section 2.4.1 or in Section 3.4.1 above.
3.5.3. Transient Tests
Radial Flow Characteristics
Flow from reservoirs are characterised as transient, pseudo-steady state or steady stateflow, depending on whether the pressure response initiated by opening the well hadreached the drainage area boundary and on the type of boundary.
Transient flow occurs when the well is initially opened or has a significant rate change, andis a result of the pressure disturbance moving out towards the outer boundary of thedrainage area. During this the production conditions at the wellbore change rapidly and theBHPF, pwf, decreases exponentially with time.
Most DSTs and many production tests are conducted under transient flow conditions andconsequently the observed productivity will often appear greater than that seen in long termproduction. This means that corrections need to made to compensate for transient flowbehaviour as well as for skin effects.

ARPO
ENI S.p.A.Agip Division
IDENTIFICATION CODE PAGE 85 OF 295
REVISIONSTAP-P-1-M-7100 0
When the flow reaches the outer boundary, flow becomes steady state or pseudo- steadystate. If the boundary is a constant pressure boundary, then PR will not alter with time and istermed steady state. However if it is a no-flow boundary, then PR will decline purely as aresult of depletion and the flow is then termed pseudo-steady state.
When the BHFP appears to be constant or declining slowly proportionally with time, the wellis stabilised and pseudo-steady state flow equations can be used to predict the long termdeliverability of a well.
Transient pressure tests are classified as:
• Pressure Build-up• Pressure Drawdown• Multiple Rate• Injectivity or Fall-off• Multiple Well Interference.
Each type presents certain advantages and limitations and factors which are important forreasonable results.
Transient pressure testing and calculation procedures for oil wells are particularly wellcovered in SPE Monograph No. 5 - Advances in Well Test Analysis.
Pressure Build-Up Tests
Pressure build-up tests are described earlier in Section 3.4.1 - DST tests.
Pressure Drawdown Testing
Pressure drawdown tests have advantages over pressure build-up tests, productioncontinues as the test is being carried out, and an estimate can be made of the reservoirvolume in communication with the wellbore. Therefore, the ‘Reservoir Limit Test’ can beused to estimate if there is sufficient hydrocarbons in place to justify additional wells in anew reservoir.
Multiple Rate Testing
Pressure build-up or drawdown tests require a constant flow rate which is sometimesdifficult to achieve over a long period of time. Multiple rate analysis can be applied toseveral flow situations, e.g. uncontrolled variable rates, a series of constant rates orconstant bottom-hole pressure with continually changing flow rate.
Multiple rate tests have the advantage of providing transient test data without the need forwell shut-in. They minimise wellbore storage effects and phase segregation effects soprovide good results where build-up or drawdown tests would not.
Accurate flow rate and pressure measurement is essential and more critical than on build-up or drawdown tests. The rate changes must be significant enough to effect the transientpressure behaviour. The analysis procedure is direct and simple but computations are moretroublesome and are often conducted by computer software.
ARPO
ENI S.p.A.Agip Division
IDENTIFICATION CODE PAGE 86 OF 295
REVISIONSTAP-P-1-M-7100 0
Injection Well Tests
Injection well transient testing is basically simple provide the mobility of the injected fluids issimilar to the in-situ fluids. The injectivity parallels the drawdown test and a pressure fall-offtest parallels the build-up test. Calculation of reservoir characteristics is similar.
A stepped rate injectivity test can be carried out to estimate fracture pressure in an injectionwell which is useful in tertiary flood applications to avoid accidental injection of expensivefluid into uncontrolled fractures.
Interference Tests (multiple well testing)
In interference testing, a long duration rate change in one well creates a pressure change inan observation well that is related to reservoir characteristics. A pulse test is an interferencetest that provides data by changing production rate in a cyclic manner to produce short termpressure pulses which are measured in the observation well(s). The responses may be verysmall, therefore, accurate pressure monitoring devices are required.
Using computers the data can be analysed to give a description of the variation in reservoirproperties according to location. Vertical pulse testing may indicate vertical formationcontinuity. Orientation and length of vertical fractures may be estimated through pulsetesting and reservoir simulation techniques.

ARPO
ENI S.p.A.Agip Division
IDENTIFICATION CODE PAGE 87 OF 295
REVISIONSTAP-P-1-M-7100 0
4. DRILLING CONSIDERATIONS
These are primarily the responsibility of drilling engineering, however the productiondepartment provide the design parameters to the drilling engineers.
4.1. CASING DESIGN
Refer to the Drilling Design and Casing Design Manuals for all casing design policies andcriteria. These manuals provide the policies and design procedures for both exploration anddevelopment wells.
4.1.1. Casing Profile
The surface and intermediate casings are designed to provide well control and boreholestability during the drilling operation. The production casing is the string, or combination ofstrings, through which the well will be completed and controlled throughout its life. Theproduction casing and its cement isolates the producing intervals to facilitate reservoircontrol, anchor the completion equipment and act as a safety barrier to the uncontrolledemission of hydrocarbons.
The production casing is usually:
• A full string of pipe cemented at TD.• A drilled through casing and liner.
In highly productive wells, e.g. offshore, the production casing size may be swedged toaccommodate larger tubing and completion equipment (i.e. TRSSV’s with control line) nearsurface or a hot string of isolated pipe. This larger tubing reduces friction losses.
The size of the production casing is primarily dictated to accommodate the optimum size ofcompletion tubing and equipment, and/or artificial lift systems. However, as is obvious indeep high pressure wells, there is a limit to the size of production casing which can beprovided. In low rate and deep land wells, production casing sizes are typically 7ins or51/2ins. In high rate and offshore wells, 103/4ins, 95/8ins and 7ins are the common sizes(Refer to the Casing Design Manual).
The decision whether to run a liner or not primarily lies with the drilling engineer howeverthe impact of the completion needs to thoroughly considered. If there were a choice, thecompletions engineer would always prefer the largest casing possible to provide theflexibility in well interventions, workovers and re-completions with artificial lift, etc. Howevertoday, the popularity of the mono-bore completion, where a large size tubing mates to asimilar size liner utilising a PBR or similar type system, it is a completion design parameter.
This is a design which provides the greatest flexibility to live well intervention operations asthe completion is full bore allowing regular tools to be run and used in the sump areaeliminating the use of through-tubing devices. This gives live well interventions much morescope to conduct stimulation, plugging back, straddle packing-off gassed out zones, etc.which may have required a workover in previous times.
figure 4.a shows these various casing profile options.

ARPO
ENI S.p.A.Agip Division
IDENTIFICATION CODE PAGE 88 OF 295
REVISIONSTAP-P-1-M-7100 0
Figure 4.A - Casing Schemes and Terminology
4.1.2. Casing Specifications
Design criteria and casing specifications are fully described in the ‘Casing Design Manual’.
Specifically with regard to metallurgy, it is Eni-Agip’s policy to use standard serviceproduction casing where there is a casing tubing annulus as the tubing is designed for thewell environment and isolates the production casing. However, production casing or linerbelow the production packer or liner hanger PBR system, will have similar specification tothe tubing in order to combat corrosion from produced fluids. The crossover between thetwo different materials must be selected in order that there is no localised erosion.
Casing exposed to H2S will have a specification in accordance to NACE MR01-75. Casingabove the packer is exposed to the completion or packer fluid which must be chemicallydosed to prevent any corrosion although, in general, only a biocide and possibly corrosioninhibitor needs to be added.
ARPO
ENI S.p.A.Agip Division
IDENTIFICATION CODE PAGE 89 OF 295
REVISIONSTAP-P-1-M-7100 0
4.1.3. Casing Connections
Where an annulus is to be used as a production conduit for gas production, injection or gaslift supply, a premium thread connection should be used to reduce the risk of leakageespecially if the pressure is above circa 1,250psi. This is due to the poor performance of theAPI Buttress Thread.
Some operators specify premium connections if the wellhead pressure is to be above5,000psi.
The main problem in casing design of producing wells over exploration wells is theincreased temperature. Usually production casing is held in tension but this may not beadequate enough in high temperature and thermal wells to prevent buckling. An overpull isoften required especially if the casing is not cemented into the previous shoe.
4.2. WELL DEVIATION SURVEYS
A well directional survey must be carried out to ensure the tolerances for well deviation anddoglegs have not been exceeded as the installation of the completion is sensitive to angleand getting fairly large diameter tubing through casing doglegs as well as placing extremebending loads on the tubing. Refer to the ‘Directional Control and Surveying ProceduresManual’ and the ‘Casing Design Manual’.
Any anomalies found in the deviation survey needs to be communicated to the completionengineer to ensure that all potential problems are analysed and will not impede thecompletion of the well.
Although the drilling of highly deviated and horizontal wells is now commonplace it shouldbe noted that in wells above 70o deviation, there are problems with logging, cementing,gravel packing and the completion process as wireline cannot be used above this limit.Completion tools or equipment operated by different methods must be adopted.
To help overcome these problems, many operators drill ‘S’ shaped profiles with drop offthrough the pay zone for critical wells, however this does not satisfy all situations.
The method of drilling horizontal wells also needs to be considered by the drilling engineeras the turning radius will be dependant upon the completion method employed. Forinstance, the turning radius for an open hole or liner may be short but a long radius isrequired for gravel packing or installation of pre-packed screens.

ARPO
ENI S.p.A.Agip Division
IDENTIFICATION CODE PAGE 90 OF 295
REVISIONSTAP-P-1-M-7100 0
4.3. CASING CEMENTING CONSIDERATIONS
The primary function of the cement around the production casing is to isolate individualformations to provide selectivity, prevent movement of formation fluids along the well pathfor reservoir control, and to isolate higher weaker formations from well pressures. Thecement also acts to support and protect the casing from buckling, eccentric loading,excessive movement due to pressure or temperature and external corrosion.
4.3.1. Production Casing Cementing
The minimum cement column height requirements will depend upon local regulations,operating conditions, temperatures, formation properties, fluid properties and pressures.The cement column should extend well past (circa 500m) above the highest pay zone butalso cover aquifers or any other potential producing zones. A minimum lap of 100m isnormal.
Many operators prefer to cement up inside the previous casing shoe to provide even greatersupport and protection, however this is not possible in high rate offshore wells wheretemperature increase in the casing/tubing annulus on the trapped fluids causes pressurewhich cannot be bled off at surface, therefore is allowed to bleed off at the casing shoe.Thermal wells are normally cemented to surface to avoid this problem.
A cement job which does not successfully flush out the drilling fluid in front of the cementand, if there is poor bonding between the outside of the pipe and the cement, and bondingbetween the cement and the formation, channelling and micro-annuli may be formed whichare paths through which the formation fluids can flow. This problem can be alleviated bythorough planning, using a good fluids programme and adopting good operatingprocedures.
The main problems associated with primary cementing are:
• Channelling of the cement and bypassing of mud due to pipe eccentricity andpoor fluid rheology.
• Failure to cement washouts.• Poor formation bonding due to lack of mud cake removal.• Poor cement procedure leading to gas entry or cross flow.• Cement strength loss due to high temperatures (<230oF) when using normal
Portland cement.• Cement dehydration opposite high temperature zones.• Dissolution of evaporites by the cement.
In general, the list of recommendations given below will help improve the success of zonalisolation:
• Drill the hole within gauge.• Condition the mud correctly.• Use a 500ft low viscosity spacer with surfactant if required.• Use a thin slurry at the front end.• Use cement with an API high temperature/high pressure fluid loss of less than
200cm3/30 min for high permeability oil wells and 50cm3/30min for gas wells.• Use the highest practical displacement velocities.

ARPO
ENI S.p.A.Agip Division
IDENTIFICATION CODE PAGE 91 OF 295
REVISIONSTAP-P-1-M-7100 0
• Design the programme so as the cement has a minimum contact time of 4 minsat all points where zonal isolation is needed.
• The cement column should extend 1,200ft above the top of the pay zone.• Pipe reciprocation should be used or otherwise rotation.• Centralise the casing in the pay zone.• Ensure quality control of the cement formulation is strict.• Use batch mixing whenever possible.
4.3.2. Production Casing Cement Evaluation
To ensure that the cement programme has been successfully isolated the formation/casing,formation/liner or casing/liner annulus, the quality of the cement should be evaluated. Thisis carried out by running a cement bond log (CBL-VDL) which is an acoustic device thatlooks for channelling. However, the tool averages the condition around the circumference ofthe casing and sometimes fails to detect small channels.
A more recent tool is the Schlumberger CET, which uses eight helically mounted sensors toscan the cement and provides a measurement of the compressive strength which should intheory give a better detection.
Generally there is ambivalence shown towards the results of cement bond evaluation logsand unless they show extremely poor conditions, they tend to be ignored especially asrepair of cement jobs is very difficult to conduct successfully.

ARPO
ENI S.p.A.Agip Division
IDENTIFICATION CODE PAGE 92 OF 295
REVISIONSTAP-P-1-M-7100 0
5. WELL COMPLETION DESIGN
The aim of this section is now to develop the structure of the completion based on the workcarried out according to the previous sections. This means that the SOR must beestablished, the conceptual designs have been developed and the optimum wellperformance determined.
The completion structure and procedures, that satisfy the above, now need to bedeveloped. However this cannot be carried out in isolation as well servicing and workoverphilosophies as well as the completion installation process need to be considered.
To enable this process, it is necessary to describe the basic architectural components of acompletion, particularly:
• Reservoir and wellbore interface.• Casing and tubing interface.• Tubing and wellhead interface.
Refer to figure 5.a
The solutions adopted will vary according on the well objectives, environment, location,artificial lift method (if applicable), anticipated well problems and cost. Although the tools areavailable to provide the most complex completions to solve severe production ormechanical problems and meet the specific objectives, it should never be forgotten that, inprinciple, completions should be kept as simple in design as possible to minimise theinstallation risks and costs.

ARPO
ENI S.p.A.Agip Division
IDENTIFICATION CODE PAGE 93 OF 295
REVISIONSTAP-P-1-M-7100 0
Figure 5.A - Completion Design Interface Classification Options

ARPO
ENI S.p.A.Agip Division
IDENTIFICATION CODE PAGE 94 OF 295
REVISIONSTAP-P-1-M-7100 0
5.1. FACTORS INFLUENCING COMPLETION DESIGN
5.1.1. Reservoir Considerations
Production Zone Isolation
Consideration of reservoir management and regulatory requirements will determine thezonal isolation in thick pay zones (<30m) or multiple-zone completions. Special attentionmust be given to layers with great in permeability variations to determine differentialdepletion.
With zones of have significant different inflow performance characteristics, then it may bemore economic to segregate production. This can be achieved by drilling a well into eachzone which is extremely costly, or as more likely, by using a multiple-string completion.Wells with gas cap or water drive reservoirs which need to be produced at controlled ratesmay also be candidates for a multiple completion. The downside of using multiplecompletions is there complexity, cost and installation.
Distance From Fluid Contacts
The distance of producing interval from fluid contacts may influence the offtake rate and theperforating policy. It is obviously economically attractive to perforate high permeablesections close to fluid contacts, however for the short term gain there may be increasedpenalties later with increased gas or water production which may need to be plugged off bya well intervention.
These aspects need to be considered as does perforating the lower sections in downdipwells in flank and bottom water drive reservoirs. The effects of partial peforating need to beconsidered on the well IPR.
Secondary Targets
Potential secondary or re-completion targets need to be identified and included in the SORbecause if they are not considered, they may be inadvertently isolated behind a liner lap orshoe track. They should be treated as a normal pay zone which will be left unperforated.
Minimum Zone Separation
The main cementing service companies are able to provide information on the minimumseparation by good cement between zones for effective hydraulic under differentialdepletion conditions. A guideline chart for recommended isolation depth is shown in Figfigure 5.b below. If fracture stimulation is planned the separation distance is approximatelythree times greater.
The effect of bridge plug setting and completion equipment lengths on zonal isolation mustbe considered as they may demand longer separation intervals, e.g. between productionpackers, etc.
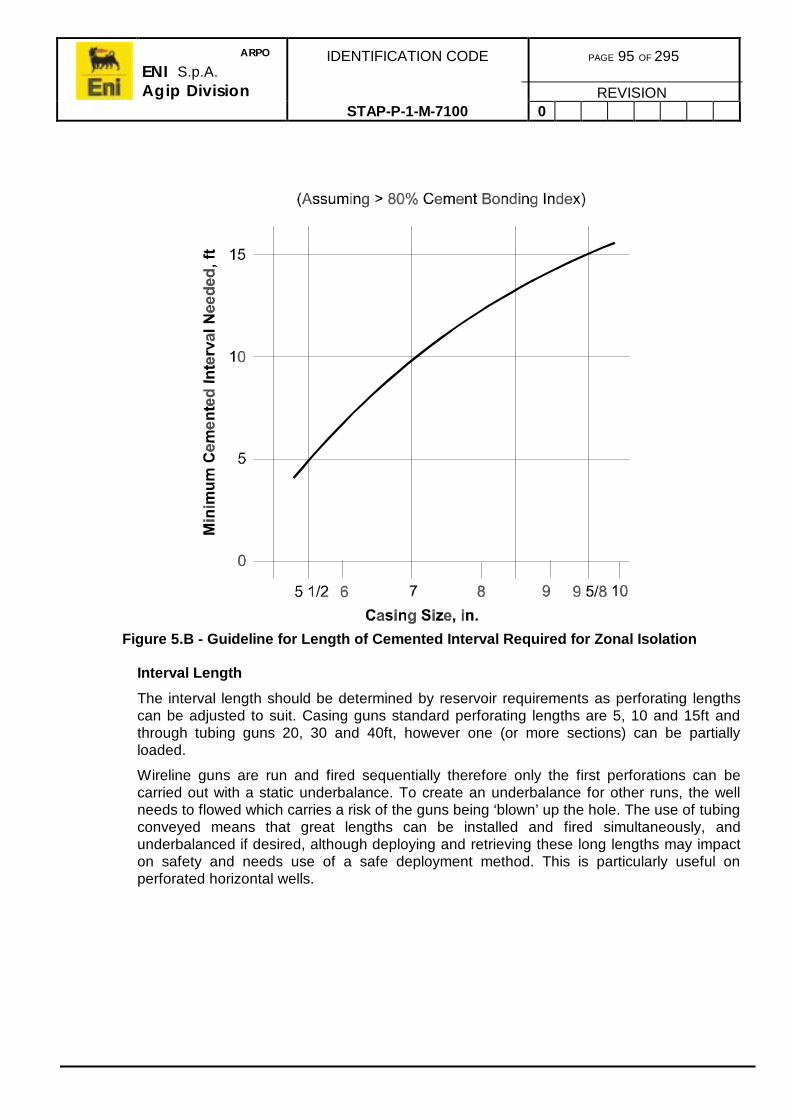
ARPO
ENI S.p.A.Agip Division
IDENTIFICATION CODE PAGE 95 OF 295
REVISIONSTAP-P-1-M-7100 0
Figure 5.B - Guideline for Length of Cemented Interval Required for Zonal Isolation
Interval Length
The interval length should be determined by reservoir requirements as perforating lengthscan be adjusted to suit. Casing guns standard perforating lengths are 5, 10 and 15ft andthrough tubing guns 20, 30 and 40ft, however one (or more sections) can be partiallyloaded.
Wireline guns are run and fired sequentially therefore only the first perforations can becarried out with a static underbalance. To create an underbalance for other runs, the wellneeds to flowed which carries a risk of the guns being ‘blown’ up the hole. The use of tubingconveyed means that great lengths can be installed and fired simultaneously, andunderbalanced if desired, although deploying and retrieving these long lengths may impacton safety and needs use of a safe deployment method. This is particularly useful onperforated horizontal wells.

ARPO
ENI S.p.A.Agip Division
IDENTIFICATION CODE PAGE 96 OF 295
REVISIONSTAP-P-1-M-7100 0
5.1.2. Mechanical Considerations
The main mechanical influence on completion design is the casing profile and deviationdiscussed previously in sections 4.1 and 4.2.
It is essential that sufficient clearance is available to allow the completion to fit comfortablyinside the casing profile. With completions large tubing sizes, this may mean running of atapered casing string to accommodate the TRSV and control line. To this end it is importantto carry out the procedures to prepare the well by cleaning it and displacing to cleancompletion fluids and checking the internal drift.
Entry into liner laps in high angles are also problematic, especially when running thecompletion from a moving floater so consideration needs to be given to the procedure or byusing an automatic mule shoe.
The type of production packer selected is dependent upon its application and installationmethod due to hole angle, whether it is single trip, etc.
5.1.3. Safety Considerations
Safety of the personnel and well site installation are paramount in completion design andthe completion procedures.
Whenever possible and economical, perforated completions should be used over open holefor well control as the casing, once it is tested, is a mechanical barrier which is safer forBOP removal. Modern compact or high performance wellheads are preferred over thetraditional spool systems as the completion may be installed with out BOP removal (Refer tothe ‘Drilling Design Manual’).
Downhole packers in the completion string which anchor the tubing are barriers used toprotect the annulus from well pressures and corrosion from well fluids althoughoperationally they also isolate gas lift gas or pump power fluids from formation pressures ingas lift and pump completions. Refer to section 8.1 for the Eni-Agip Company policy on theuse of packers.
Downhole safety valves are installed as per the En-Agip company policy given in section8.2.1.

ARPO
ENI S.p.A.Agip Division
IDENTIFICATION CODE PAGE 97 OF 295
REVISIONSTAP-P-1-M-7100 0
5.2. RESERVOIR-WELLBORE INTERFACE
There are three reservoir-wellbore interface options which can be further classified intoseven major alternatives in completion architecture (Refer to figure 5.a):
• Open hole completions• Uncemented liner completions.
- Slotted pipe- Wire wrapped screens- Open hole gravel packs
• Perforated completions.- Standard perforated- Fracture Stimulation- Cased hole gravel packs
5.2.1. Open Hole Completions
Their use is predominately in thick carbonate or hard sandstone reservoirs that producefrom fracture systems or thin permeable streaks which are difficult to identify on logs andare easily damaged by drilling and cementing operations. They maximise the fractureintersections and inflow potential due to the large surface area if drilling and completiondamage is avoided. However they provide little or no selectivity in reservoir management toreduce unwanted water or gas production. An open hole completions can subsequently beconverted to a liner completion to overcome the selectivity problem.
Often referred to as a ‘barefoot’ completions, the method of completion entails drilling downto a depth just above the producing formation and setting the production casing. A hole isnow drilled through the formation exposing it to the wellbore. The well is now completedwith no casing set across the formation (Refer to figure 5.c).
The decision process depends on four key issues:
• Is there a risk of causing damage to well productivity with a cased andperforated completion ?
• Is zonal selectivity required ?• Is fracture stimulation required ?• Is there any potential sand production ?

ARPO
ENI S.p.A.Agip Division
IDENTIFICATION CODE PAGE 98 OF 295
REVISIONSTAP-P-1-M-7100 0
Figure 5.C - Open Hole and Uncemented Liner Interface Options
5.2.2. Uncemented Liner Completions
Uncemented liners are used to overcome production problems associated with open holecompletions and to extend their application to other types of formations. The formation issupported by a either a slotted liner, sand screen or is gravel packed (Refer to figure 5.c).
Although they have some advantages over open hole, they still have the same selectivityand undesired fluid problems.
The selection process depends on four key issues is the same as for open holecompletions:
• Is there a risk of causing damage to well productivity with a cased andperforated completion ?
• Is zonal selectivity required ?• Is fracture stimulation required ?• Is there any potential sand production ?

ARPO
ENI S.p.A.Agip Division
IDENTIFICATION CODE PAGE 99 OF 295
REVISIONSTAP-P-1-M-7100 0
If a slotted liner or plain screen is to be used, a designer must also consider:
• Whether to use the more expensive and finer wire wrapped screen or slottedpipe.
• Slot width requirement which is dependent on the sand size and stability, fluidviscosity and control objectives. A slot width that would retain the coarsest 10%of the sand is common practice in heavy oil wells with coarser slots for light oilwells, and finer slots or pre-packed screens for filtering and for uniform sizedsands.
• Clearance required for washover (1 - 1.5ins on OD) and whether centralisersshould be expandable, or millable, solid type.
• The location of the packer and packer tailpipe.• Is gravel packing more suitable alternative ?
For open hole gravel packs, the following additional issues need to be considered:
• Loss circulation control during under-reaming and tripping, and how the LCMcan be subsequently removed before gravel packing.
• The stability of the hole during under-reaming and the limitations this mayimpose on hole angle and screen length.
• Gravel pack design with regard to grain size, length of blank pipe, volumes,reserve volume, etc.
• Type of gravel packer and will it double as the production packer ?
Slotted Liner
This type of completion entails a liner with flow slots machined throughout its lengthinstalled below the production casing. The slot widths can range between 0.254 - 1.016mm.
A slotted liner is used where there is a risk of wellbore instability to maintain a bore throughthe formation which otherwise might collapse and plug off all production. It also helps inliquid lift due to the smaller flow area.
Wire Wrapped Screen
A plain wire wrapped screen is used either as a simple filter to strain out small amounts ofintermittently produced sand from a relatively stable formation or as a sand retention screenwhere high permeability, coarse sands would readily flow onto the screen forming a rubblezone.
External Gravel pack
An open hole gravel pack is used where the sands are too fine or abrasive for a plainscreen. The open hole is under-reamed to remove drilling damage and to create a largerannulus for the filter sized gravel to pack against the formation wall. When properlyinstalled, it is the most effective sand control measure for weak sandstones andunconsolidated rocks, however carries more risk than a cased hole gravel pack.

ARPO
ENI S.p.A.Agip Division
IDENTIFICATION CODE PAGE 100 OF 295
REVISIONSTAP-P-1-M-7100 0
5.2.3. Perforated Completions
This type of completions are the most common world-wide due to the selectivity, flexibility,lower costs, increased safety and convenience that they provide. There are threesubdivisions, standard, fracture stimulation and cased hole gravel pack (Refer to figure 5.d).
The key issues in cased hole completion design are:
• Perforated interval selection, gun type, shot density, underbalance oroverbalance, and perforating method, i.e. casing guns, through tubing guns orTCP.
• Completion fluids programme selection with regard to fluid quality and formationdamage.
• Type of formation and if special perforating techniques are required, e.g. highshot density, ultra deep penetration or stimulation treatments.
• Effective zonal isolation due to cement quality and distance between zones.
Standard Perforated Casing Completions
These are used when the rock is reasonably stable and permeable. Deep penetratingperforating charges are generally used especially in hard rock, with the shot densitydependent upon the vertical permeability and layer frequency, the deliverabilityrequirements and method of perforating.
The deep penetrating charges are desired to perforate through the damage zone cause bythe drilling or completing process. Perforating underbalance may also improved perforationclean-up.
Fracture Stimulation
Fracture stimulation is used to increase the effective sandface area and to provide a highpermeability flow path to the wellbore increasing the IPR from low permeability rocks(<25md).
The risk in fracture stimulation is that the fractures will more than likely not be containedwithin the pay zone and the casing cementing programme completion equipment rating, etc.would need to be designed with the additional loading of the stimulation operation.
Cased Hole Gravel Pack
Cased hole gravel pack completions are used to control sand production in perforatedcompletions. Unlike the open hole gravel pack, the cased hole gravel is placed between thecased hole and the sand screen, ideally, with the gravel forced into the perforations holdingthe formation sand in place.
Since the gravel has an finite permeability, a large flow area must be achieved by using ‘bighole’ charges with the maximum shot density (dependent on gun size).
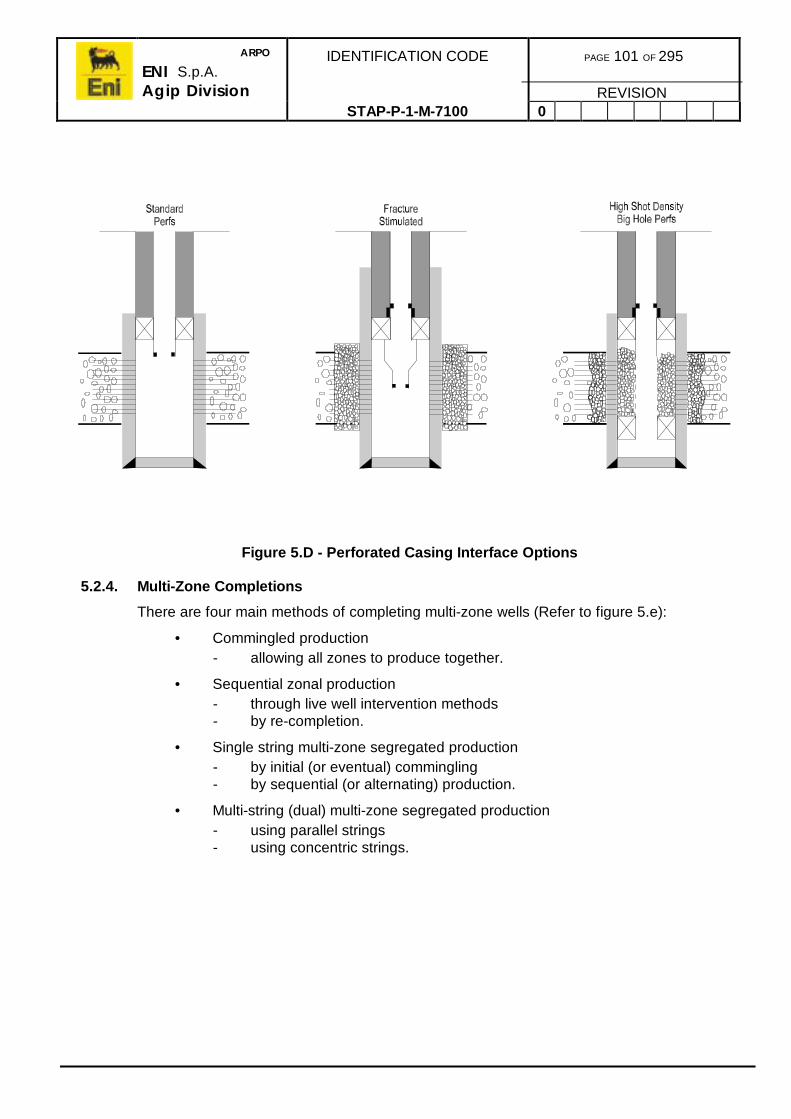
ARPO
ENI S.p.A.Agip Division
IDENTIFICATION CODE PAGE 101 OF 295
REVISIONSTAP-P-1-M-7100 0
Figure 5.D - Perforated Casing Interface Options
5.2.4. Multi-Zone Completions
There are four main methods of completing multi-zone wells (Refer to figure 5.e):
• Commingled production- allowing all zones to produce together.
• Sequential zonal production- through live well intervention methods- by re-completion.
• Single string multi-zone segregated production- by initial (or eventual) commingling- by sequential (or alternating) production.
• Multi-string (dual) multi-zone segregated production- using parallel strings- using concentric strings.

ARPO
ENI S.p.A.Agip Division
IDENTIFICATION CODE PAGE 102 OF 295
REVISIONSTAP-P-1-M-7100 0
Commingled Production
Commingled production is only allowable is limited instances where there are no reservoirmanagement problems and regulatory rules allow.
Sequential Zonal Production
Due to its simplicity and ease of installation, completion designers prefer to use singlestring/single zone completion methods for mutli-zone situations. This preference is subject,however, to economics, reservoir management and regulatory requirements. In this method,the zones are depleted from the bottom upwards and temporarily suspended or abandonedsequentially and then the next higher zone completed.
If zones are close together, the initial completion can be installed to allow plugging andperforating of each zone by well intervention methods, however there is a trade off in thatflow efficiency of the deeper zones and depth access for artificial lift and well killing will becompromised. An option is to conduct a workover pulling the tubing and re-completing bymoving the packer depth upwards.
Single String Multi-Zone Production
These provide easy methods of bring on other fresh zones when the first zone experiencesproduction problems. They may also be used for reservoir management, by allowingcommingling or individual section production at different stages in the wells life in order tomaximise the full potential of the reservoir. Downhole chokes or regulators can be installedto control flow from each zone when commingling to prevent cross-flow, reduce excessivegas, etc.
Dual String Multi-Zone Production
Dual string multi-zone completions are often used offshore or on stacked reservoirs wherethe production rate is per zone is limited by inflow performance and the previous methodsdescribed above would be uneconomic. They can often double an individual wellsproductivity for a reasonably low cost increment.
Either parallel strings or concentric strings can be used. Concentric strings may yield higherflow capability but obviously no downhole safety valve can be installed in the outer tubing.Some operators use the casing tubing annulus as another flow conduit but this is subject toindividual operator philosophy and regulatory rules dictating.
If artificial lift is required parallel strings would normally be needed.
Triple strings and indeed quadruple string have been used in the past, but generally theyare not economic as they are too restrictive of well capacity.

ARPO
ENI S.p.A.Agip Division
IDENTIFICATION CODE PAGE 103 OF 295
REVISIONSTAP-P-1-M-7100 0
Figure 5.E - Multi-Zone Completions

ARPO
ENI S.p.A.Agip Division
IDENTIFICATION CODE PAGE 104 OF 295
REVISIONSTAP-P-1-M-7100 0
5.3. CASING-TUBING INTERFACE
There are three main casing-tubing interface options which have six sub-divisions (Refer tofigure 5.f):
• Packerless completions- Anchored- Unanchored- Tubingless.
• Packer Completions- Shallow set- Deep set.
• PBR Completions- Liner hanger.
Packers and PBRs are required to provide a seal between the tubing and production casingor liner for the following reasons:
• To isolate the casing-tubing annulus from well fluids and pressure acting as abarrier on the annulus side.
• To prevent heading in the annulus improving flow conditions.• Prevent annulus corrosion from well fluids.• To allow the annulus to be used for supplying artificial lift fluids or injection of
inhibitors.• To allow the annulus to be used for production (if permitted).• To isolate liner laps or casing leaks.• To anchor the tubing if no tubing movement is desired.• To facilitate well operations through having wireline nipples in a tailpipe, e.g. well
plugging, BHP gauge positioning, etc.• To protect formations from damage from well intervention or workover fluids by
plugging in the tailpipe.
Some onshore low pressure wells are completed without a packer or liner PBR as the risk ofdamage to the wellhead, hence the risk of injury to personnel and pollution of theenvironment, is low. This has both advantages and disadvantages. There is one barrier lesson the annulus side and the casing may be exposed to corrosive well fluids and the wellpressure even if it is low and some operators do not allow this practice. On the other hand,on pump completions it is useful for venting off gas. It is essential for plunger liftcompletions which uses annulus gas as its energy source for unloading liquids.
Tubingless completions, i.e. wells which use a small diameter casing or a tubing as theproduction casing, offers serious well control problems as there is no downhole safety at all.These are used on low rate, low pressure wells but are not allowed by most operatingcompanies.

ARPO
ENI S.p.A.Agip Division
IDENTIFICATION CODE PAGE 105 OF 295
REVISIONSTAP-P-1-M-7100 0
Anchored tubing completions are used on rod pumpers to keep the tubing in tension so thatthe reciprocation of the rods does not cause buckling on the upstroke and stretch on thedownstroke unless the well is shallow and annulus clearance is small.
Packer completions are the most popular due to their flexibility in the options in which theyare available and their ability to be installed in an exact position at any desired depthcompared to the liner PBR. The liner PBR completion offers a larger through bore than apacker option and, therefore are used in high rate wells and mono-bore completions wherefull bore access is gained to he formation.
The liner PBR interface should not be confused with the packer PBR system whichalthough is exactly the same in basic design, is used for packer-tubing sealing and cateringfor tubing movement.
Figure 5.F - Casing-Tubing Interfaces

ARPO
ENI S.p.A.Agip Division
IDENTIFICATION CODE PAGE 106 OF 295
REVISIONSTAP-P-1-M-7100 0
5.3.1. Packer Applications
Packer application with regard to completion design is addressed in this section as thereare some basic features which affect the completion architecture.
Although there are many varieties of packers available, there are three basic types used incompletion designs:
• Permanent• Retrievable• Permanent Retrievable.
Eni-Agip do not have any particular policy to the type of packer system to be used in aparticular situation due to the wide range of packers available and changing technology butdo operate a packer qualification system to ensure that any packer used meets with specificcriteria. The packer qualification system is specified in STAP-M-1-M-5010.
Retrievable Packer Systems
The definition of a retrievable packer is that it is installed and retrieved on the completiontubing. They have advantages in that they can be installed in high angle wells although theiroperating differential pressure rating, temperature rating and bore size are less thanequivalent permanent packers. It is important that designers fully consider the effects ofpressure and tubing stresses on these packer systems and associated packer-tubingconnections. Their packing element systems are also more sensitive to well fluids as theyare more complex due to their ability to be retrieved but after redressing they can be re-used.
Retrievable packers tend to be used for the following applications:
• Completions which have relative short life span.• Where there is likely to be workovers requiring full bore access.• Multi-zone completions for zonal segregation.• In relatively mild well conditions.
Retrievable packer setting mechanisms are by:
• Tubing tension• Tubing compression• Hydraulic pressure• Tubing rotation.
Tension or compression set packers are very sensitive to tubing movement and are rarelyused nowadays owing to the benefits and variety of other retrievable packers available.

ARPO
ENI S.p.A.Agip Division
IDENTIFICATION CODE PAGE 107 OF 295
REVISIONSTAP-P-1-M-7100 0
Permanent Packer Systems
The definition of a permanent packer is that it is retrieved from the well by milling.Permanent packers have high differential pressure and temperature ratings and largerbores. They have many options of both tailpipe and packer-tubing attachments to cater fora large range of applications such as:
• Severe or hostile operating conditions with differential pressures > 5,000psi andtemperatures in excess of 300oF and high stresses.
• Long life completions.• Where workovers are expected to be above the packer, hence not requiring its
removal which is costly.• Where workovers are expected to be above the packer and the packer tailpipe
can be used for plugging the well and isolating foreign fluids from the formation.• Providing large bore for high rate wells.
Permanent packer setting mechanisms are by:
• Wireline explosive charge setting tool.• Tubing tension.• Hydraulic pressure by workstring setting tool or on the completion string.• Tubing rotation.
Permanent Retrievable Packer Systems
Permanent retrievable packers are a hybrid of the permanent style packer designed to beretrieved on a workstring without milling. They offer similar performances as permanentpackers but generally have smaller bores.
All the packers above can be equipped with tailpipes to accommodate wireline downholetools such as plugs, standing valves, BHP gauges, etc.
5.3.2. Packer-Tubing Interfaces
Tubing can be interfaced with packers through three basic options:
• FixedBy threaded connection to the packer mandrel as with retrievable packers.Snap latch requiring an overpull to releaseBy an anchor latch system to a permanent packer.
• Free movingSeal unit in a packer bore.Seal unit in a PBR attached to the packer.Travel joint.ELTSR.
• Limited movementSeal unit set down in a packer bore allowing upward movement only.Closed PBR or ELTSR.

ARPO
ENI S.p.A.Agip Division
IDENTIFICATION CODE PAGE 108 OF 295
REVISIONSTAP-P-1-M-7100 0
Free movement or partial movement options are used when tubing movement must becatered for otherwise it may be over-stressed due to tubing forces found through the stressanalysis (Refer to section 7). However, sometimes they suffer from premature seal failuredue to being dynamic seals and if the material type has not been correctly selected for theenvironment and pressure differentials. To help prevent seal failure, seal units can be shearpinned in a mid open or closed position to prevent seal movement until the stresses in thetubing reach a predetermined level.
The selected packer-tubing interface has a significant effect on the completion architectureespecially with regard to installation procedure, well kill method, stimulation treatment andtype of hanger system.
The most popular packer systems are those which have ‘one trip’ installation saving extratrips by workstring or wireline to install the packer before running the completion tubing.
5.3.3. Annulus Circulation
Communication between the tubing and annulus on packer type completions is consider tobe beneficial to efficient well killing, maintaining a fluid barrier in the annulus, circulating killfluid before workovers or circulating in underbalance fluids well kick off. This is the samereasons for installing kill strings in packerless completions.
Circulating devices, typically sliding sleeves or sliding side doors (SSDs) installed above thetop packers, are used for this purpose but they have traditionally been a weak link in designwhen seals material was not suited to the well conditions. This would require a workover toreplace the sleeve so other devices such as SPMs are used as the seals can be recoveredand replaced by wireline methods. Some operators recommend that no circulation devicebe used which limits the flexibility of the completion and requires a tubing punch to be usedfor circulation before workovers.
If a circulating device is undesired but the option is to kill the well by circulation rather thanbullheading, a single shot shear kill valve can be installed which is operated by annuluspressure.
Annulus circulation is used for:
• Displace completion fluids and Kick-Off wells.• Isolation/opening of producing intervals in single selective or dual selective
completions.• Well killing in tight formations where bullheading might be difficult.• Installation of hydraulic pumps• The SSD type circulating valves are normally equipped with a landing nipple
profile in the upper sub to allow installation of a straddle to stop leaks or fornormal wireline nipple uses.

ARPO
ENI S.p.A.Agip Division
IDENTIFICATION CODE PAGE 109 OF 295
REVISIONSTAP-P-1-M-7100 0
5.4. TUBING-WELLHEAD INTERFACE
The wellhead carries the casing and completion loads which is transferred to the groundthrough the surface casing. It also isolates the top of the tubing-casing annulus, mates andseals with the Xmas tree and provides annulus access to all the annuli. It consists of anassembly made up of casing head spools, tubing hanger/spool and Xmas tree. The casinghead and tubing hanger spools are now commonly replaced by compact or unitisedwellheads (Refer to the ‘Drilling Design Manual’) to reduce height and improve safety asthere are less BOP removals for spool installations.
Wellhead specifications are laid out in API Specification 6A and are rated by:
• Maximum working pressure according to the maximum anticipated surfacepressure.
• Temperature operating range.
Temperature Classification Operating Range, oF
K -75 to 180
L -60 to 180
M -40 to 180
P -20 to 180
S 0 to 150
T 0 to 180
U 0 to 250
PSL O -20 to 250
Table 5.A - API Temperature Classifications
Above 250oF the working pressure is de-rated against temperature (down to72% of rating at 650 oF.
• Retained fluid rating (Refer to section 6).• Product specification level PSL (Refer to API spec 6A).
5.4.1. Tubing Hanger Systems
There are five common types of tubing hanger systems available:
• Slip and seal assemblies.• Mandrel compression hangers.• Ram type tension hangers.• Downhole tubing hangers (e.g. annular safety system).• Direct attachment to the Xmas tree (threaded).

ARPO
ENI S.p.A.Agip Division
IDENTIFICATION CODE PAGE 110 OF 295
REVISIONSTAP-P-1-M-7100 0
The main consideration in hanger selection is whether the tubing is to be placed incompression or tension and/or the number of tubings, flow or supply. Other considerationsare DHSV control lines, downhole chemical injection lines, downhole electronic gaugecables and ESP cables which are terminated by stab seals, extended necks or annular ringseals. On subsea wells vertical annular access is usually required for well plugging whichrequires mandrel type hangers with orientation to the guide base and, hence subsea tree.Dual hanger systems also need to be orientated to mate with the dual Xmas tree.
Depending on the well location, i.e. subsea, platform or land, well plugging for tree removalneeds to be considered and that is usually satisfied by having a locking profile in the hangerbores, either wireline nipple profile or a back pressure thread for land wells.

ARPO
ENI S.p.A.Agip Division
IDENTIFICATION CODE PAGE 111 OF 295
REVISIONSTAP-P-1-M-7100 0
Figure 5.G - API Recommended Minimum PSL for Wellhead Equipment

ARPO
ENI S.p.A.Agip Division
IDENTIFICATION CODE PAGE 112 OF 295
REVISIONSTAP-P-1-M-7100 0
Table 5.B- Eni-Agip Standard Wellhead Equipment Chart
AG
IPC
OD
E
Ref
.nr
Top
flang
e (in
)
Max
. W
.P.
(psi
)
Btm
(CS
G)
(in)
Ref
. nr
Btm
Fla
nge
(in)
Max
. W
.P.
(psi
)
Top
flang
e (in
)
Max
. W
.P.
(psi
)
Ref
. nr
Btm
flang
e(in
)
Max
. W
.P.
(psi
)
Top
flang
e(in
)
Max
. W
.P.
(psi
)
Ref
. nr
Btm
Fla
nge
(in)
Max
. W
.P.
(psi
)
Top
flang
e(in
)
Max
. W
.P.
(psi
)
Ref
. nr
Dia
m(in
)M
ax.
W.P
. (p
si)
Dia
mtb
g(in
)
MS
CL
11.
313
5/8
5000
13 3
/8 &
9 5
/82.
113
5/8
5000
13 5
/850
005.
113
5/8
5000
950
006.
19
5000
2 7/
8
MS
CL
21.
313
5/8
5000
13 3
/8 &
9 5
/82.
113
5/8
5000
13 5
/850
005.
113
5/8
5000
950
006.
29
5000
3 1/
2
MS
CL
31.
313
5/8
5000
13 3
/8 &
9 5
/82.
113
5/8
5000
13 5
/850
005.
113
5/8
5000
950
006.
39
5000
5
DC
SF
SL
11.
221
1/4
5000
20 &
18
5/8
2.4
21 1
/450
0013
5/8
5000
2.1
13 5
/850
0013
5/8
5000
5.1
13 5
/850
009
5000
6.6
950
002
x 2
3/8
DC
SF
SL
21.
221
1/4
5000
20 &
18
5/8
2.4
21 1
/450
0013
5/8
5000
2.2
13 5
/850
0013
5/8
1000
05.
213
5/8
1000
09
1000
06.
89
1000
02
x 2
3/8
DC
SF
SL
31.
221
1/4
5000
20 &
18
5/8
2.4
21 1
/450
0013
5/8
5000
2.1
13 5
/850
0013
5/8
5000
5.3
13 5
/850
0011
5000
6.5
1150
002
x 3
1/2
SC
SO
11.
221
1/4
5000
20 &
18
5/8
2.4
21 1
/450
0013
5/8
5000
2.1
13 5
/850
0013
5/8
5000
5.4
13 5
/850
007
1/16
5000
6.4
7 1/
1650
003
1/2
DC
SO
11.
221
1/4
5000
20 &
18
5/8
2.4
21 1
/450
0013
5/8
5000
2.1
13 5
/850
0013
5/8
5000
5.4
13 5
/850
007
1/16
5000
6.9
7 1/
1650
002
x 2
3/8
DC
SO
21.
221
1/4
5000
20 &
18
5/8
2.4
21 1
/450
0013
5/8
5000
2.2
13 5
/850
0013
5/8
1000
05.
513
5/8
1000
07
1/16
1000
06.
77
1/16
1000
02
x 2
3/8
DC
SO
31.
221
1/4
5000
20 &
18
5/8
2.4
21 1
/450
0013
5/8
5000
2.2
13 5
/850
0013
5/8
1000
05.
213
5/8
1000
09
1000
06.
89
1000
02
x 2
3/8
(*)
1.2
21 1
/450
0020
& 1
8 5/
82.
521
1/4
5000
13 5
/810
000
2.3
13 5
/810
000
13 5
/810
000
1.1
26 3
/430
0024
1/2
2.6
26 3
/430
0021
1/4
5000
2.5
21 1
/450
0013
5/8
1000
02.
313
5/8
1000
013
5/8
1000
0
3° C
AS
ING
HE
AD
SP
OO
L
(*)
Typ
ical
wel
lhea
d co
nfig
ura
tion
for
dee
p w
ells
(p
o Va
lley)
Typi
cal o
utlin
es fo
r on
-sho
re, o
ff-sh
ore
sin
gle
and
dual
com
plet
ion
clas
s -A
and
cla
ss -B
(STA
P -M
-1-S
S-5
701E
)
CA
SIN
G H
EA
DC
AS
ING
HE
AD
SP
OO
LC
AS
ING
HE
AD
SP
OO
LT
UB
ING
SP
OO
LT
UB
ING
HA
NG
ER

ARPO
ENI S.p.A.Agip Division
IDENTIFICATION CODE PAGE 113 OF 295
REVISIONSTAP-P-1-M-7100 0
WP (psi) 3K (A) 3K (B) 5K (C) 5K (D) 10K (E) 10K (F) 15K (G) 15K (H) Section 1 470 470 470 470 470 510 510 - Section 2 620 620 625 690 690 850 850 510 Section 3 472 472 472 670 660 700 700 850 Section 4 - - - 581 700 700 750 700 Section 5 - - - - - -- 750
Figure 5.H - Typical Wellhead
20"
13 3/8"
9 5/8"
7"
4
3
2
1

ARPO
ENI S.p.A.Agip Division
IDENTIFICATION CODE PAGE 114 OF 295
REVISIONSTAP-P-1-M-7100 0
Figure 5.I - Typical Unitised Wellhead and Xmas Tree

ARPO
ENI S.p.A.Agip Division
IDENTIFICATION CODE PAGE 115 OF 295
REVISIONSTAP-P-1-M-7100 0
5.4.2. Xmas Trees
The type of Xmas tree and construction are important as they have an effect on safety andcost. The important pointers for the design engineer are:
• Conventional composite flanged connection trees with a single master valve arethe norm for land and low to moderate offshore wells.
• In very high pressure wells (i.e. 15,000psi) Eni-Agip normally installs anadditional gate valve between the tubing spool and the Xmas tree to providedouble barrier protection.
• A second master valve is normally required to enable repair to any of the othertree valves with two barriers in situ (the lower master valve and the tubinghanger plug). Today it is normal to have to justify only a single master valve asthe upper master is usually an ESD hydraulically operated valve which is at riskof undue wear and tear.
• Trees for sour service or high pressure will normally have two outlets, productionand kill wing sides. The kill wing is often permanently connected up to the killline to a permanent pump or to allow quick and easy connection of a portablepump.
• A swab valve is an essential element to enable safe rig up of vertical wellinterventions by wireline, coiled tubing or snubbing services or for the BPV rodlubricator.
• The production wing, which is often a remote hydraulic operated valve, chokeand flowline arrangement must be configured to meet with how the well isclosed-in and opened up. Pressure losses of the offtake system must beconsidered in the well deliverability analysis (Refer to Section 2.4.3).
• Chemical injection points are usually available at the tree or through the hangersystem for downhole.
• If the tree upper master valve and production wings are fully automated, thecontrol system should be designed to close the wing valve first a few secondsbefore the upper master to avoid erosion or damage over a period of time to theupper master gate and seats as they are more difficult to repair.
A typical Xmas tree is shown in figure 5.i.
5.4.3. Metal-To-Metal Seals
The purpose of metal-to-metal seals is to provide enhanced sealing where it is required inparticular applications.
Policy
Metal-to-metal seals shall be used in the applications outlined in the following sections.

ARPO
ENI S.p.A.Agip Division
IDENTIFICATION CODE PAGE 116 OF 295
REVISIONSTAP-P-1-M-7100 0
Application
The following criteria is applicable to the various conditions listed in the following tables:
a) Between producing strings/casing/tubing hanger and tubing hanger seal flange.
b) Between tubing hanger and tubing spool.
c) On production casing or production liner.
d) On control line connections.
These designations A, B, C and D will be used in the tables in the tables below.
Oil And Gas Producers
These tables apply equally to onshore and offshore wells.
Sweet Service Wells (with top hole temperature less than 100°C)
9 = YES 8 = NO
Sealing WP, psi A B C D
5,000 9 8 8 9
10,000 9 9 8 9
>10,000 9 9 8 9
Sweet Service Wells (with top hole temperature exceeding 100°C)
Sealing WP, psi A B C D
5,000 9 9 8 9
10,000 9 9 8 9
>10,000 9 9 9 9
H2S Service Wells
Sealing WP, psi A B C D
5,000 9 8 8 9
10,000 9 9 8 9
Gas Injectors
Sealing WP, psi A B C D
5,000 9 8 8 9
10,000 9 9 8 9

ARPO
ENI S.p.A.Agip Division
IDENTIFICATION CODE PAGE 117 OF 295
REVISIONSTAP-P-1-M-7100 0
Water Injectors
Sealing WP, psi A B C D
5,000 9 8 8 9
10,000 9 9 8 9
Artificial Lift Wells (both onshore and offshore wells)
Sealing WP, psi A B C D
5,000 9 8(1) 8 9
10,000 9 9 8 9
(1) If H2S is present it will be a YES.
5.5. FUTURE CONSIDERATIONS
Built into the conceptual stage, a design life for the completion will have been established.During this process future well servicing and maintenance will also have been planned. Thiswill have included identification of the potential reasons for well interventions or workoverservicing. This will have an impact of the completion architecture and establish aphilosophy.
The well location and type of development has a large impact on the techniques availableand cost of well servicing and maintenance optimising the completion design around thepotential problems and remedial techniques is a balancing act between effectiveness andcost.
As an example of this is horizontal completions selected to maximise initial well productivity,where the stand-off from the water or gas zones increases the risk of producing earlyunwanted fluids. In this case to the stand-off can be increased but there is a penalty inlower initial production rates.
Another example is on offshore subsea fields, due to the high cost of subsea well re-entrys,well servicing should be minimised as they require a floating vessel from which to deploythe re-entry system. This means well life should be planned for the life of the field or as longas feasible (typically 7-10 years) although some unplanned problems may occur.
Alternately, on an easily accessible land wells where servicing and workover methods arerelatively much less costly, servicing can be conducted almost on demand. This may lend tothe selection of a wireline retrievable type safety valve rather than a tubing retrievable typeas in the event of failure, the valve can be replaced cheaply without requiring a workover.
Well servicing or workover techniques also have an impact on the well area with regard toheight and lateral space, and may be problematic on platforms where space, height andweight are at a premium.

ARPO
ENI S.p.A.Agip Division
IDENTIFICATION CODE PAGE 118 OF 295
REVISIONSTAP-P-1-M-7100 0
5.5.1. Stimulation
If future stimulation operations are required such as fracturing, the effects of the pressurescausing additional stresses on the tubing and packer need to be input and catered for in thetubing design process (Refer to Section 7). If the costs of upgrading the well tubulars toresist these stresses are prohibitive, e.g. the surface pressure would demand a higherpressure rated Xmas tree than required for production only, then straddles are sometimesutilised to keep pressure off the SCSSV and Xmas tree. It could also increase the tubingmovement and alter the choice of tubing movement device and spacing out.
If acid stimulations are planned, the effects on the completion materials needs to beconsidered or alternatively to use coiled tubing for spotting of the acid before pumping tothe formation.
5.5.2. Formation Management
As the fluid interfaces move through time and unwanted fluids are produced, or asproducing zones become depleted and require isolating before brining on other zones,cement squeezes and reperforating techniques are required. Also, producing zones aresometimes damaged by scale build up or movement of fines, etc. and need reperforating.
If the well has been planned for these operations then the completion may have beendesigned to accomplish these operations without pulling of the tubing in a workoveroperation.
A single string sequential completion may be employed where existing perforations can beisolated simply by installation of a bridge plug on wireline but often the perforations requireto be squeezed off with cement (Refer to Section 5.2.4). This can be conducted by coiledtubing or snubbing services without killing the well. The next production zone can then beperforated using through tubing perforating techniques (Refer to Section 9).
If a multi-zone single string selective completion design has been installed then producingzones can be closed off or opened up by wireline techniques and hence, are more flexiblebut have higher initial capital cost.
Excessive water or gas production due to fingering which requires continuing productionfrom lower zones can be isolated by cement squeezing or if using a monobore typecompletion by installing a straddle across the interval on wireline or coiled tubing methods.
If multi-zone multi-string completions are installed then the individual zones can simply beclosed off by shutting in the well at surface or, if there are more than one zone to a string,by opening and closing isolation sleeves.
Where this problem has not been planned into the completion design a complete workoverto re-complete may be required.

ARPO
ENI S.p.A.Agip Division
IDENTIFICATION CODE PAGE 119 OF 295
REVISIONSTAP-P-1-M-7100 0
5.5.3. Well Servicing Techniques
Well servicing includes live well intervention services or major workovers to pull the tubing.
Live well interventions can be conducted by:
• Wireline (electric line or slickline).• Coiled Tubing.• Snubbing.• Pumps.
Snubbing cannot be deployed from any floating installation.
A specialist subsea wireline technique has been developed for subsea well interventionswithout using the riser re-entry system which is much quicker and less costly.
Workovers can be conducted by:
• Workovers rigs• Drilling rigs• Hydraulic workover units.
Hydraulic workover cannot be deployed from any floating installation.
Slickline
Is probably the most widely used well servicing method and is used for:
• Mechanical well clean out (tubing and sump)• Installation and retrieval of flow controls (plugs, chokes, standing valves, gas lift
valves, etc.)• Tubing control (drifting)• Calipering• Swabbing• BHP pressure and temperature monitoring• Electronic memory logging• Opening and closing of circulation devices• Perforating• Fishing.
Braided Line
Braided line is used for:
• Heavy duty wireline work (installing large heavy flow controls).• Fishing (when slickline has been unsuccessful, fishing electric line).

ARPO
ENI S.p.A.Agip Division
IDENTIFICATION CODE PAGE 120 OF 295
REVISIONSTAP-P-1-M-7100 0
Electric Line
Electric line is used for:
• Logging (PLT, etc.• Calipering• Real time BHP surveys• Perforating• Packer setting• Installing bridge plugs.
Coiled Tubing
Coiled tubing (C/T) is used for:
• Stimulation (acidising)• Cementing• Cleaning out tubing and sump• Gas lifting• Logging (stiff wireline)• Installing flow controls (wireline type tools)• Milling• Drilling (underbalance side tracking, multi-laterals)• Fishing (generally when wireline has been unsuccessful).
Snubbing
Snubbing is used for:
• Stimulation (acidising)• Cementing• Cleaning out tubing and sump• Gas lifting• Installing flow controls (wireline type tools)• Milling• Drilling (underbalance side tracking, multi-laterals).
Snubbing has found a revival with platform horizontal wells where it is used to work in longhorizontal sections where C/T may not be capable.

ARPO
ENI S.p.A.Agip Division
IDENTIFICATION CODE PAGE 121 OF 295
REVISIONSTAP-P-1-M-7100 0
5.6. OPTIMISING TUBING SIZE
The optimum tubing size is selected to obtain the desired offtake rates at the lowest capitaland operating costs. This usually means at the maximum initial flow rate and maintaining itas long as possible, however, depending on the inflow capability (Refer to Section 2.4), itmay be possible to accelerate offtake by the early installation of artificial lift.
Whatever the case, the selection process inevitably involves analysis of the gross fluiddeliverability and flow stability under changing reservoir conditions to confirm that theproduction forecast can be met and to determine when artificial lift or compression isrequired.
A fixed flow rate, as tubing size increases, fluid velocities decrease and reduces thefrictional effects. The net result should be higher production rates only if the IPR/TPCintercept remains to the right of the TPC minimum. If the PI was infinite, one increase in APItubing size would double the maximum theoretical capacity.
The example well #1 in figure 5.j shows that the 41/2” tubing size should be selected toensure the offtake exceeds the target of 8,000 to 9,000stb/d and perhaps even largertubing could be investigated. However, at low rates, the reduced fluid velocities experiencedin larger tubing increase the hydrostatic head because of slippage. This shifts the TPCminimum to a higher rate and, therefore widening the flat uncertain portion around theminimum. If the IPR curve intersects the TPCs in the region near the minimum, the optimumtubing size will be a compromise maximising flow rate and having steady producingconditions. For example, using the IPR for well 2, the maximum flow rate is obtained with 1/2”tubing but only a slight reduction in flow rate is seen if the 27/8” tubing is selected whichgives steadier and regular flow.
It is generally recommended to select a tubing size such that the flowing pressure, Pwf, isgreater than 1.05 of pressure minimum, pmin to ensure stability.
As previously mentioned, the changing conditions over the life of the well must beconsidered when selecting tubing size. These changes are normally declining reservoirpressure and increasing water cut which will reduce flow rates. This trend is downwardstowards cessation of flow and ,obviously the tubing selected for the start of production willnot be the optimum size after some period of time. The choice at that time will be to reducewellhead pressure, replace the tubing with a smaller size or to implement artificial lift whichwill have associated costs.
The optimum size of tubing is clearly the size which will be most cost effective over anumber of years, typically 5-8 years. Where high costs workovers are involved such as onsubsea wells, the selection may be for an even longer period of time, incurring early loss ofpotential production.
The following sub-sections describes the various factors and there effect on TPC.

ARPO
ENI S.p.A.Agip Division
IDENTIFICATION CODE PAGE 122 OF 295
REVISIONSTAP-P-1-M-7100 0
Figure 5.J - Example Tubing Sizes on Well Deliverability
Figure 5.K- Effect of Reservoir Pressure on TPC

ARPO
ENI S.p.A.Agip Division
IDENTIFICATION CODE PAGE 123 OF 295
REVISIONSTAP-P-1-M-7100 0
5.6.1. Reservoir Pressure
As reservoir pressure declines over time, it collapses towards the origin, as illustrated infigure 5.k, leading to decreasing natural flow rates. Unstable flow conditions and eventuallycessation will occur unless some other change in the system is made.
In reservoirs where significant reductions in reservoir pressure are anticipated, the effect onproductivity must be considered during the completion design stage to find the most costeffective method of maximising productivity, e.g. where workover costs are high to completewith smaller size tubing to ensure stability through the economic life of the well.
5.6.2. Flowing Wellhead Pressure
Any flowing wellhead pressure is actually back-pressure transmitted downhole to thebottom-hole flowing pressure, therefore reducing the potential drawdown. Also highwellhead pressures reduces the amount of free gas and compresses the remaining freegas, both which increase hydrostatic head. All of these reduce the natural flow rate of thewell.
The larger tubing sizes are more sensitive to changes in flowing wellhead pressure as thedensity factor dominates more than in smaller tubing. Again this means that smaller tuningmay need to be selected instead of the ideal larger tubing to cater for anticipated changesin wellhead pressure.
Changes in wellhead pressure can be attributed to slugging in the flowline, wells beingproduced or closed in which use the same flowline, facility malfunctions, build-up of wax,etc.
This clearly shows how important the assumed wellhead pressure accuracy is in the welldeliverability forecast and economics.
5.6.3. Gas-Liquid Ratio
Increasing gas-liquid ratios cause a decrease in hydrostatic head and increase in frictionalpressure drop which in the early stages may actually result in increased flow rates.However, above a critical point there will be a net increase in the overall pressure drop,hence flow rates. In these circumstances the frictional effects near surface become verydominant and can be alleviated by the use of a tapered tubing string.
figure 5.l shows the effect of increasing GLR.

ARPO
ENI S.p.A.Agip Division
IDENTIFICATION CODE PAGE 124 OF 295
REVISIONSTAP-P-1-M-7100 0
Figure 5.L - Effect of Increasing GLR
5.6.4. Artificial Lift
The intention of installing artificial lift is to reduce the hydrostatic head and, therefore,bottom-hole pressure. This effectively shifts the TPC downwards bringing the intersectionpoint further towards stable flowing conditions. An example of rates which can be obtainedby different artificial lift methods is illustrated in figure 5.m.
Refer to section 10 for the applications and comparisons of the various methods of artificiallift.
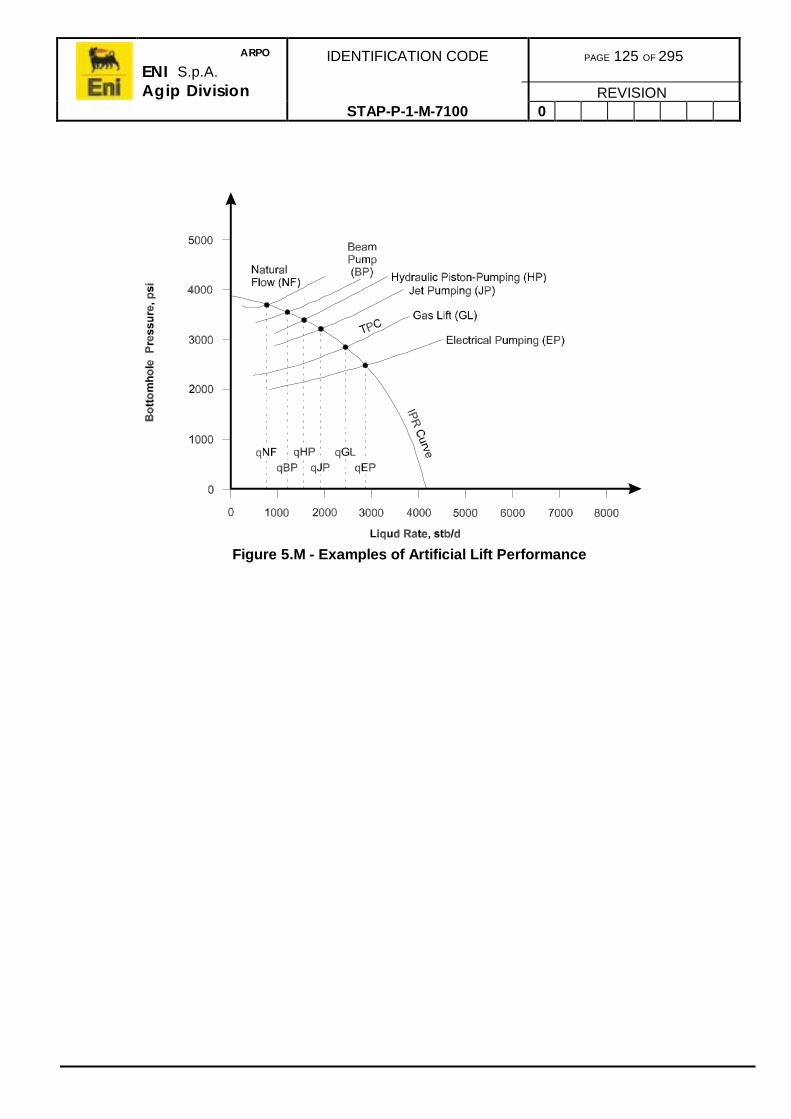
ARPO
ENI S.p.A.Agip Division
IDENTIFICATION CODE PAGE 125 OF 295
REVISIONSTAP-P-1-M-7100 0
Figure 5.M - Examples of Artificial Lift Performance

ARPO
ENI S.p.A.Agip Division
IDENTIFICATION CODE PAGE 126 OF 295
REVISIONSTAP-P-1-M-7100 0
6. CORROSION
A production well design should attempt to contain produced corrosive fluids within tubing.They should not be produced through the casing/tubing annulus.
However, it is accepted that tubing leaks and pressured annuli are a fact of life and as such,production casing strings are considered to be subject to corrosive environments whendesigning casing for a well where hydrogen sulphide (H2S) or carbon dioxide (CO2) ladenreservoir fluids can be expected.
During the drilling phase, if there is any likelihood of a sour corrosive influx occurring,consideration should be given to setting a sour service casing string before drilling into thereservoir.
The BOP stack and wellhead components must also be suitable for sour service.
6.1. DEVELOPMENT WELLS
Casing corrosion considerations for development wells can be confined to the productioncasing only.
• Internal corrosion
The well should be designed to contain any corrosive fluids (produced or injected)within the tubing string by using premium connections.
Any part of the production casing that is likely to be exposed to the corrosiveenvironment, during routine completion/workover operations or in the event of a tubingor wellhead leak, should be designed to withstand such an environment.
• External corrosion
Where the likelihood of external corrosion due to electrochemical activity is high and theconsequences of such corrosion are serious, the production casing should be cathodicallyprotected (either cathodically or by selecting a casing grade suitable for the expectedcorrosion environment).
6.2. CONTRIBUTING FACTORS TO CORROSION
Most corrosion problems which occur in oilfield production operations are due to thepresence of water. Whether it may be present in large amounts or in extremely smallquantities, it is necessary to the corrosion process. In the presence of water, corrosion is anelectrolytic process where electrical current flows during the corrosion process. To have aflow of current, there must be a generating or voltage source in a completed electricalcircuit.

ARPO
ENI S.p.A.Agip Division
IDENTIFICATION CODE PAGE 127 OF 295
REVISIONSTAP-P-1-M-7100 0
The existence, if any, of the following conditions alone, or in any combination may be acontributing factor to the initiation and perpetuation of corrosion:
• Oxygen (O2)Oxygen dissolved in water drastically increases its corrosivity potential. It can causesevere corrosion at very low concentrations of less than 1.0ppm.
The solubility of oxygen in water is a function of pressure, temperature and chloridecontent. Oxygen is less soluble in salt water than in fresh water.
Oxygen usually causes pitting in steels.
• Hydrogen Sulphide (H2S)Hydrogen sulphide is very soluble in water and when dissolved behaves as a weakacid and usually causes pitting. Attack due to the presence of dissolved hydrogensulphide is referred to as ‘sour’ corrosion.
The combination of H2S and CO2 is more aggressive than H2S alone and is frequentlyfound in oilfield environments.
Other serious problems which may result from H2S corrosion are hydrogen blisteringand sulphide stress cracking.
It should be pointed out that H2S also can be generated by introduced micro-organisms.
• Carbon Dioxide (CO2)When carbon dioxide dissolves in water, it forms carbonic acid, decreases the pH ofthe water and increase its corrosivity. It is not as corrosive as oxygen, but usually alsoresults in pitting.
The important factors governing the solubility of carbon dioxide are pressure,temperature and composition of the water. Pressure increases the solubility to lowerthe pH, temperature decreases the solubility to raise the pH.
Corrosion primarily caused by dissolved carbon dioxide is commonly called ‘sweet’corrosion.
Using the partial pressure of carbon dioxide as a yardstick to predict corrosion, thefollowing relationships have been found:
Partial pressure >30psi usually indicates high corrosion risk.
Partial pressure 3-30psi may indicates high corrosion risk.
Partial pressure <3psi generally is considered non corrosive.
• TemperatureLike most chemical reactions, corrosion rates generally increase with increasingtemperature.

ARPO
ENI S.p.A.Agip Division
IDENTIFICATION CODE PAGE 128 OF 295
REVISIONSTAP-P-1-M-7100 0
• PressurePressure affects the rates of chemical reactions and corrosion reactions are noexception.
In oilfield systems, the primary importance of pressure is its effect on dissolved gases.More gas goes into solution as the pressure is increased this may in turn increase thecorrosivity of the solution.
• Velocity of fluids within the environmentStagnant or low velocity fluids usually give low corrosion rates, but pitting is morelikely. Corrosion rates usually increase with velocity as the corrosion scale is removedfrom the casing exposing fresh metal for further corrosion.
High velocities and/or the presence of suspended solids or gas bubbles can lead toerosion, corrosion, impingement or cavitation.
6.3. FORMS OF CORROSION
The following forms of corrosion are addressed in this manual:
Corrosion caused by H2S (SSC)
Corrosion caused by CO2 and Cl-
Corrosion caused by combinations of H2S, CO2 and Cl-
Corrosion in injection wells and the effects of pH and souring are not included.
The procedure adopted to evaluate the corrosivity of the produced fluid and themethodology used to calculate the partial pressures of H2S and CO2 will be illustrated in thefollowing sub-sections.
6.3.1. Sulphide Stress Cracking (SSC)
The SSC phenomenon is occurs usually at temperatures of below 80°C and with thepresence of stress in the material. The H2S comes into contact with H2O which is anessential element in this form of corrosion by freeing the H+ ion. Higher temperatures, e.g.above 80°C inhibit the SSC phenomenon, therefore knowledge of temperature gradients isvery useful in the choice of the tubular materials since differing materials can be chosen forvarious depths.
Evaluation of the SSC problem depends on the type of well being investigated. In gas wells,gas saturation with water will produce condensate water and therefore create the conditionsfor SSC. In oil wells, two separate cases need to be considered, vertical and deviated wells:
a) In vertical oil wells, generally corrosion occurs only when the water cut becomeshigher than 15% which is the ‘threshold’ or commonly defined as the ‘criticallevel’ and it is necessary to analyse the water cut profile throughout theproducing life of the well.

ARPO
ENI S.p.A.Agip Division
IDENTIFICATION CODE PAGE 129 OF 295
REVISIONSTAP-P-1-M-7100 0
b) In highly deviated wells (i.e. deviations >80o), the risk of corrosion by H2S ishigher since the water, even if in very small quantities, deposits on the surfaceof the tubulars and so the problem can be likened to the gas well case wherethe critical threshold for the water cut drops to 1% (WC <1%).
The following formulae are used to calculate the value of pH2S (partial pressure of H2S) inboth the cases of gas (or condensate gas) wells or oil wells.
Firstly, the potential for SSC occurring is evaluated by studying the water cut valuescombined with the type of well and deviation profile. If the conditions specified above areverified then the pH2S can be calculated.
Gas Or Condensate Gas Well
H2S partial pressure is calculated by:
pH2S = SBHP x Y(H2S)/100 Eq. 6.A
where:
SBHP = Static bottom-hole pressure [atm]Y(H2S) = Mole fraction of H2SpH2S = Partial H2S pressure [atm]
SSC is triggered at pH2S >0.0035 atm and SBHP >4.5 atm.
Oil Bearing Well
The problem of SSC exists when there is wetting water; i.e.:
Water cut >15% for vertical wellsWater cut >1% for horizontal or highly deviated wells (>80o)or if the GOR >800 Nm3/m3
The pH2S calculation is different for undersaturated and oversaturated oil.
Undersaturated Oil
In an oil in which the gas remains dissolved, because the wellhead and bottom-holepressures are higher than the bubble point pressure (Pb) at reservoir temperature, is termedundersaturated.
In this case the pH2S is calculated in two ways:
• Basic method.• Material balance method.
If the quantity of H2S in gas at the bubble point pressure [mole fraction = Y(H2S)], is notknown or the values obtained are not reliable, the pH2S is calculated using both methodsand the higher of the two results is taken as the a reliable value. Otherwise the basicmethod is used.

ARPO
ENI S.p.A.Agip Division
IDENTIFICATION CODE PAGE 130 OF 295
REVISIONSTAP-P-1-M-7100 0
Basic Method
This method is used, without comparison with the other method, when the H2S value in theseparated gas at bubble point conditions is known and is reliable or if Y(H2S), molar fractionin the separated gas at bubble point pressure (Pb) is higher than 2%.
The pH2S is calculated by:
pH2S = Pb x Y(H2S)/100 Eq. 6.B
where:
Pb = Bubble point pressure at reservoir temperature [atm]Y(H2S) = Mole fraction in the separated gas at bubble point (from PVT data if
extrapolated)pH2S = Partial H2S pressure [atm]
Material Balance Method
This method is used when data from production testing is available and/or when thequantity of H2S is very small (<2,000ppm) and the water cut value from is lower than 5%(this method cannot be used when the WC values are higher). The value of H2S in ppm tobe used in the calculation must also be from stable flowing conditions. Note: H2S sampledin short production tests, is generally lower than the actual value under stabilisedconditions.
The following algorithm is used to calculate the pH2S:
Step 1
pH2S is calculated at the separator (pH2Ssep):
pH2Ssep = (Psep x H2Ssep)/106 Eq. 6.C
where:
Psep = Absolute mean pressure at which the separator works (from tests) inatm
H2Ssep = Mean H2S value in the separator gas (generally measured in ppm)
The mean molecular weight of the produced oil, PM:
( )6.23
GOR
PM
29d6.23
GOR1000
1000PM
giac
−××+×γ
×γ= Eq. 6.D
where:
PM = mean molecular weight of the reservoir oil =
×∑
=
100/MiCin
li
Ci = Mole % of the ith component of the reservoir oilMi = Molecular weight of the ith component of the reservoir oild = Density of the gas at separator conditions referred to air =1

ARPO
ENI S.p.A.Agip Division
IDENTIFICATION CODE PAGE 131 OF 295
REVISIONSTAP-P-1-M-7100 0
The quantity of H2S in moles/litre dissolved in the separator oil is calculated:
[H2S]oil = (pH2Ssep/H1 x (γ x 1000)/ PM ) Eq. 6.E
where:
H1 = Henry constant of the produced oil at separator temperature (atm/Molefraction). (See Procedure for calculating Henry constant)
PM = Mean molecular weight of the produced oil
γ = Specific weight g/l of the produced oil
The quantity of H2S in the gas in equilibrium is calculated (per litre of oil):
[H2S]gas = (GOR/23.6 x H2Ssep/106) Eq. 6.F
where:
GOR = Gas oil ratio Nm3/m3 (from production tests)23.6 = Conversion factor
The pH2S is calculated at reservoir conditions:
pH2S = (([H2S]oil + [H2S]gas)/K ) x H2 Eq. 6.G
where:
K = (γ x 1000/PM + GOR/23.6) total number of moles of the liquid phase in
the reservoirH2 = Henry constant for the reservoir temperature and reservoir oil (see
procedure for calculating Henry constant)
In general, H2S corrosion can occur at either the wellhead or bottom-hole without distinction.
There is SSC potential if pH2S >0.0035 atm and STHP >18.63 atm.
Procedure For Calculating Henry Constant
The value of the Henry constant is a function of the temperature measured at the separator.The mapping method can be applied for temperatures at the separator of between 20°Cand 200°C. Given the diagram in figure 6.a which represents the functions H(t) for the threetypes of oils:
• Heptane PM =100
• N-propyl benzene PM = 120
• Methylnaphthalene PM =142

ARPO
ENI S.p.A.Agip Division
IDENTIFICATION CODE PAGE 132 OF 295
REVISIONSTAP-P-1-M-7100 0
Remarks On The H 1 Calculation
Having calculated the molecular weight of the produced oil PM using the formula in eq. 6.d ,
the reference curve is chosen (given by points) to calculate the Henry constant on the basisof the following value thresholds:
• If PM> 142, the H(t) curve of methylnaphthalene is used.
• If PM> 120, the H(t) curve of propyl benzene is used.
• If PM> 100, the H(t) curve of heptane is used.
• If 100 <PM< 120, the mean value is calculated using the H(t) curve of propyl
benzene and the H(t) curve of methylnaphthalene.
• If 120 <PM < 142 the mean value is calculated using the H(t) curve of heptane
and the H(t) curve of propyl benzene.• Given FTHT, wellhead flowing temperature, the H1 value is interpolated linearly
on the chosen curve(s). For this purpose the temperature values immediatelybefore and after the temperature studied are taken into consideration.
Comments On The H 2 Calculation
Having calculated the molecular weight of the reservoir oil PM res, using temperature
measured at the separator, H2 is measured in a similar way as H1.

ARPO
ENI S.p.A.Agip Division
IDENTIFICATION CODE PAGE 133 OF 295
REVISIONSTAP-P-1-M-7100 0
Figure 6.A - H(t) Reference Curves
Oversaturated Oil
Oil is considered oversaturated when the gas in the fluid separates because the pressure ofthe system is lower than the bubble point pressure. Two situations can arise:
Case A
FTHP < Pb
FBHP > Pb
Case B
FTHP < Pb
FBHP < Pb
20
30
40
50
60
70
80
90
100
110
120
130
20 30 40 50 60 70 80 90 100 110 120 130 140 150 160 170 180 190 200
methylnaphthalene PM = 142
N-propylbenzene PM = 120
heptane PM = 100
T C°
Henry atm/Y[H 2S]

ARPO
ENI S.p.A.Agip Division
IDENTIFICATION CODE PAGE 134 OF 295
REVISIONSTAP-P-1-M-7100 0
Calculation Of Partial Pressure In Case A:
1) Calculation is of the partial pressure in the reservoir:
In this case pH2S is calculated in the way described for undersaturated oil.
2) Calculation is of the partial pressure at the wellhead, i.e. when FTHP <Pb:
The data result from the production conditions and only the basic method is used.
Basic Method
pH2S = STHP x Y(H2S)/100
where:
STHP = Static tubing head pressure [atm]Y(H2S) = Mole fraction in separated gas at STHP pressure and wellhead
temperaturepH2S = Partial H2S pressure [atm]
The SSC phenomenon is triggered off at the wellhead if pH2S >0.0035 atm and STHP>18.63 atm.
Calculation Of Partial Pressure In Case B:
Calculation of partial pressure in the reservoir:
In the reservoir the gas is already separated, FBHP <Pb, calculation of pH2S can beapproximated on the basis of the following:
• The PVTs are reliable, Y(H2S) >0.2%, the partial pressure is calculated as:pH2S = Y(H2S) x FBHP 1
where:
Y(H2S) = Molar fraction in gas separated at FBHP and at reservoirtemperature (from PVT)
• The PVTs are not reliable, the material balance method can be used as in thecase of undersaturated oil; these are the worst conditions. The error made canbe high when Pb > FBHP.
Calculation Of Partial Pressure At Wellhead
The calculation method is that used for case A (FTHP <Pb) 2
1 If the percentage (ppm) of H2S in the gas under static conditions is not known, the correspondingvalue in reservoir conditions is assumed as being partial pressure at the wellhead.2 If the percentage (ppm) of H2S in the separated gas under static conditions is not known, thecorresponding value in reservoir conditions is assumed as being partial pressure at the wellhead.

ARPO
ENI S.p.A.Agip Division
IDENTIFICATION CODE PAGE 135 OF 295
REVISIONSTAP-P-1-M-7100 0
6.3.2. Corrosion Caused By CO 2 And Cl -
In the presence of water, CO2 gives rise to a corrosion form which is different to thosecaused by the presence of H2S. It also occurs only if the partial pressure of CO2 exceeds aparticular threshold. As in the case of SSC, the possibility that corrosions exist in water cutvalues combined with the type of well and deviation profile is evaluated. If the conditionsdescribed in section 6.3.1 exist, then the pCO2 is then calculated.
Gas Or Condensate Gas Wells
The partial pressure is calculated:
pCO2 = SBHP x Y(CO2)/100
where:
SBHP = Static bottom-hole pressure [atm]Y(CO2) = Mole fraction of CO2
pCO2 = Partial pressure of CO2 [atm]
Corrosion occurs if pCO2 >0.2 atm.
Oil Bearing Wells
The problem exists where there is wetting water; i.e.:
• Water cut >15% for vertical wells.• Water cut >1% for horizontal or highly deviated wells (> 80 degrees).
Undersaturated Oil Wells
The partial pressure of CO2 is calculated:
pCO2 = Pb x Y(CO2)/100
where:
Pb = Bubble point pressure at reservoir temperatureY(CO2) = Mole fraction of CO2 in separated gas at bubble point pressure (from
the PVTs)pCO2 = Partial pressure of CO2 [atm]
Corrosion occurs if pCO2 >0.2 atm.
The pCO2 values calculated in this way are used to evaluate the corrosion at bottom holeand wellhead; i.e. pCO2 at wellhead is assumed as corresponding to reservoir conditions.

ARPO
ENI S.p.A.Agip Division
IDENTIFICATION CODE PAGE 136 OF 295
REVISIONSTAP-P-1-M-7100 0
Oversaturated Oil
The oil is considered oversaturated when the gas separates in the fluid because thepressure of the system is lower than bubble point pressure. Two situations may arise:
Case A
FTHP <Pb
FBHP >Pb
Case B
FTHP <Pb
FBHP <Pb
Calculation Of Partial Pressure In Case A:
Calculation of pCO2 in reservoir conditions:
FBHP >Pb pCO2 is calculated in the same way as undersaturated oil wells earlier in thissection.
pCO2 = Pb x Y(CO2)/100
where:
Pb = Bubble point pressure at reservoir temperatureY(CO2) = Mole fraction in separated gas at bubble point pressure (from the PVTs)pCO2 = Partial pressure of CO2 [atm]
Corrosion occurs if pCO2 >0.2 atm.
Calculation Of pCO 2 At Wellhead:
pCO2 = STHP x Y(CO2)/100
where:
Y(CO2) = Mole fraction in separated gas at STHP3
STHP = Static tubing head pressure [atm]
Corrosion occurs if pCO2 >0.2 atm.
3 If the percentage (ppm) of CO2 in the gas under static conditions is not known, the correspondingvalue in reservoir conditions is assumed as being partial pressure at the wellhead

ARPO
ENI S.p.A.Agip Division
IDENTIFICATION CODE PAGE 137 OF 295
REVISIONSTAP-P-1-M-7100 0
Calculation Of Partial Pressure In Case B:
Calculation of pCO2 at reservoir conditions:
pCO2 = FBHP x Y(CO2)/100
where:
Y(CO2) = Mole fraction in separated gas at pressure FBHP (from the PVTs)
Calculation Of pCO 2 At Wellhead:
The calculation method is the same as the one used in the wellhead conditions in case A:
pCO2 = STHP x Y(CO2)/100
where:
Y(CO2) = Mole fraction in separated gas at STHP4
There is corrosion if pCO2 >0.2 atm.
6.3.3. Corrosion Caused By H 2S, CO2 And Cl-
It is possible to encounter H2S and CO2 besides Cl-. In this case the problem is much morecomplex and the choice of suitable material is more delicate. The phenomenon isdiagnosed by calculating the partial pressures of H2S and CO2 and comparing them with therespective thresholds.
4 If the percentage (ppm) of CO2 in the gas under flowing/static conditions is not known, thecorresponding value in reservoir conditions is assumed as being partial pressure at the wellhead.

ARPO
ENI S.p.A.Agip Division
IDENTIFICATION CODE PAGE 138 OF 295
REVISIONSTAP-P-1-M-7100 0
6.4. CORROSION CONTROL MEASURES
Corrosion control measures may involve the use of one or more of the following:
• Cathodic protection• Chemical inhibition• Chemical control• Oxygen scavengers• Chemical sulphide scavengers• pH adjustment• Deposit control• Coatings• Non metallic materials or metallurgical• Control• Stress reduction• Elimination of sharp bends• Elimination of shock loads and vibration• Improved handling procedures• Corrosion allowances in design• Improved welding procedures• Organisation of repair operations.
Refer to table 6.a below.
Measure Means
Control of the environment • pH• Temperature• Pressure• Chloride concentration• CO2 concentration• H2S concentration• H2O concentration• Flow rate• Inhibitors
Surface treatment • Plastic coating• Plating
Improvement of the corrosion resistivity of thesteel
Addition of the alloying elements microstructure
Table 6.A - Counter Measures to Prevent Corrosion

ARPO
ENI S.p.A.Agip Division
IDENTIFICATION CODE PAGE 139 OF 295
REVISIONSTAP-P-1-M-7100 0
6.5. CORROSION INHIBITORS
An inhibitor is a substance which retards or slows down a chemical reaction. Thus, acorrosion inhibitor is a substance which, when added to an environment, decreases the rateof attack by the environmental on a metal.
Corrosion inhibitors are commonly added in small amounts to acids, cooling waters, steamor other environments, either continuously or intermittently to prevent serious corrosion.
There are many techniques used to apply corrosion inhibitors in oil and gas wells:
• Batch treatment (tubing displacement, standard batch, extended batch)• Continuous treatment• Squeeze treatment• Atomised inhibitor squeeze - weighted liquids• Capsules• Sticks.
6.6. CORROSION RESISTANCE OF STAINLESS STEELS
Stainless steel is usually used in applications for production tubing, however it isoccasionally used for production casing or tubing below the packer depth.
The main reason for the development of stainless steel is its resistance to corrosion. To beclassed as a stainless steel, an iron alloy usually must contain at least 12% chromium involume. The corrosion resistance of stainless steels is due to the ability of the chromium topassivate the surface of the alloy.
Stainless steels may be divided into four distinct classes on the basis of their chemicalcontent, metallurgical structure and mechanical properties these are:
6.6.1. Martensitic Stainless Steels
The martensitic stainless steels contain chromium as their principal alloying element. Themost common types contain around 12% chromium, although some chromium content maybe as high as 18%.
The carbon content ranges from 0.08% to 1.10% and other elements such as nickel,columbium, molybdenum, selenium, silicon, and sulphur are added in small amounts forother properties in some grades.
The most important characteristic that distinguishes these steels from other grades is theirresponse to heat treatment. The martensitic stainless steels are hardened by the same heattreatment procedures used to harden carbon and alloy steels.
The martensitic stainless steels are included in the ‘400’ series of stainless steels. The mostcommonly used of the martensitic stainless steels is AISI Type 410. The only grade ofoilfield tubular used in this category is 13Cr. As their name indicates, the microstructure ofthese steels is martensitic. Stainless steels are strongly magnetic whatever the heattreatment condition.

ARPO
ENI S.p.A.Agip Division
IDENTIFICATION CODE PAGE 140 OF 295
REVISIONSTAP-P-1-M-7100 0
6.6.2. Ferritic Stainless Steels
The second class of stainless steels, is the ferritic stainless steels, which are similar to themartensitic stainless steels in that they have chromium as the principal alloying element.The chromium contents of ferritic stainless steels is normally higher than that of themartensitic, stainless steel, and the carbon content is generally lower.
The chromium content ranges between 13% to 27% but are not able to be hardened byheat treatment. They are used principally for their temperature properties.
Ferritic stainless steels are also part of the ‘400’ series, the principal types being 405, 430,and 436.
The microstructure of the ferritic stainless steels consists of ferrite, which are also stronglymagnetic. Ferrite is simply body cantered cubic iron or an alloy based on this structure.
6.6.3. Austenitic Stainless Steels
The austenitic stainless steels have two principal alloying elements, chromium and nickel.Their micro-structure consists essentially of austenite which is face cantered cubic iron oran iron alloy based on this structure.
They contain a minimum of 18% chromium and 8% nickel, with other elements added forparticular reasons, and may range up to as high as 25% chromium and 20% nickel.
Austenitic stainless steels generally have the highest corrosion resistance of any of thestainless steels, but their strength is lower than martensitic and ferritic stainless steels. Theyare not able to be hardened by heat treatment although they are hardenable to some extentby cold working and are generally non-magnetic.
Austenitic stainless steels are grouped in the ‘300’ series, the most common being 304.Others commonly used are 303 free machining, 316 high Cr and Ni which may include Mo,and 347 stabilised for welding and corrosion resistance.
These steels are widely used in the oilfield for fittings and control lines, but due to its lowstrength is not used for well tubulars.
6.6.4. Precipitation Hardening Stainless Steels
The most recent development in stainless steel is a general class known as ‘precipitationhardened stainless steels’, which contain various amounts of chromium and nickel.
They combine the high strength of the martensitic stainless steels with the good corrosionresistance properties of the austenitic stainless steels.
Most were developed as proprietary alloys, and there is a wide variety of compositionsavailable.
The distinguishing characteristic of the precipitation hardened stainless steel is that throughspecific heat treatments at relatively low temperatures, the steels can be hardened tovarying strength levels.
Most can be formed and machined before the final heat treatment and the finished productbeing hardened. Precipitation in alloys is analogous to precipitation as rain or snow.
These are most commonly used for component parts in downhole and surface tools and notas oilfield tubulars. Refer to figure 6.b for the various compositions of stainless steels.
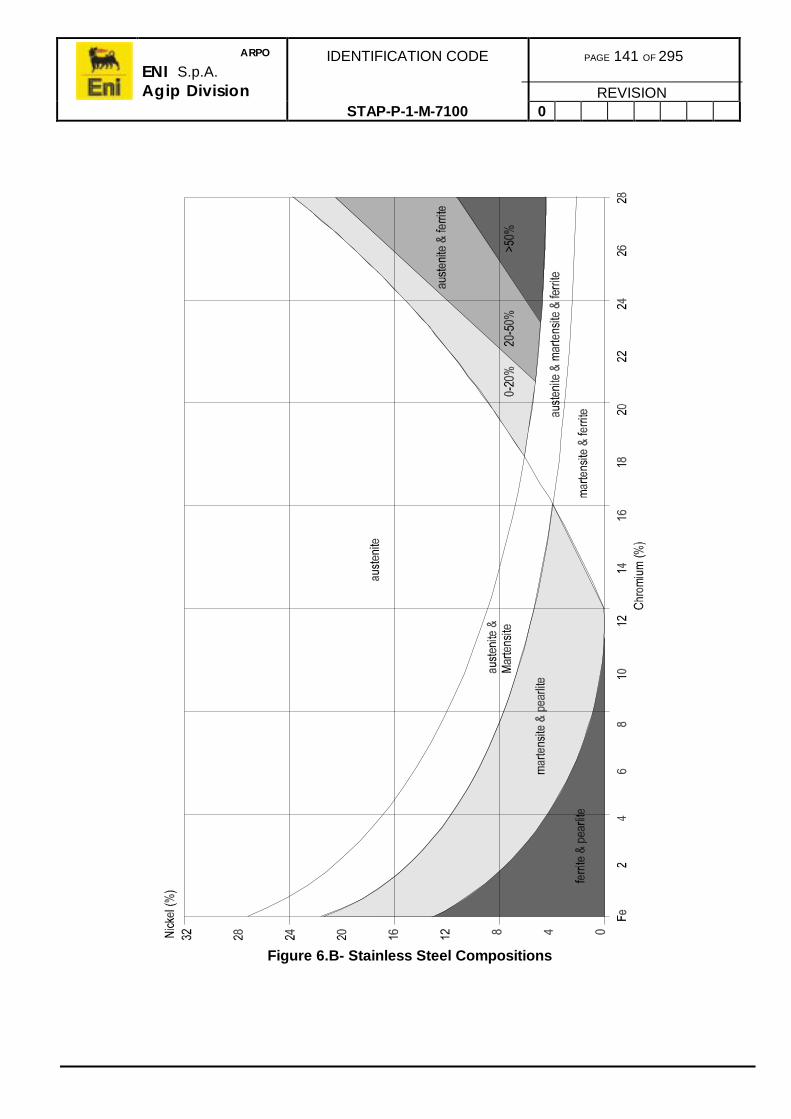
ARPO
ENI S.p.A.Agip Division
IDENTIFICATION CODE PAGE 141 OF 295
REVISIONSTAP-P-1-M-7100 0
Figure 6.B- Stainless Steel Compositions

ARPO
ENI S.p.A.Agip Division
IDENTIFICATION CODE PAGE 142 OF 295
REVISIONSTAP-P-1-M-7100 0
6.6.5. Duplex Stainless Steel
In general, ferritic-austenitic (duplex) stainless steel consists of between 40-70% ferrite andhas a typical composition of 22% Cr-5.5% Ni-3% Mo-0.14% N.
The resulting steel has properties that are normally found in both phases: the ferritepromotes increased yield strength and resistance to chloride and hydrogen sulphidecorrosion cracking; while the austenite phase improves workability and weldability.
This material is used extensively for tubulars used in severe CO2 and H2S conditions.
As a general note, there is a large gap between the 13Cr and Duplex Stainless Steels usedas tubulars for their good anti-corrosion properties. This gap is attempted to be filled with‘Super 13Cr’ tubing being developed.
6.7. COMPANY DESIGN PROCEDURE
6.7.1. CO2 Corrosion
In producing wells, the presence of CO2 may lead to corrosion on those parts coming incontact with CO2 which normally means the production tubing and part of the productioncasing below the packer.
Corrosion may be limited by:
• The selection of high alloy chromium steels, resistant to corrosion.• Inhibitor injection, if using carbon steel casing. Generally, wells producing CO2
partial pressure higher than 20psi requires inhibition to limit corrosion.
6.7.2. H2S Corrosion
In wells, where there is H2S, consideration should be given to limit casing andwellhead yield strength according to API 5CT and ‘NACE’ standard MR-01-75.
Casing and tubing material will be selected according to the amount of H2S and othercorrosive media present.
Refer to figure 6.c and figure 6.d for partial pressure limits.

ARPO
ENI S.p.A.Agip Division
IDENTIFICATION CODE PAGE 143 OF 295
REVISIONSTAP-P-1-M-7100 0
Figure 6.C - Sour Gas Systems
Figure 6.D - Sour Multiphase Systems

ARPO
ENI S.p.A.Agip Division
IDENTIFICATION CODE PAGE 144 OF 295
REVISIONSTAP-P-1-M-7100 0
6.8. MATERIAL SELECTION
The choice of material is based on the application of engineering diagrams supplied bymanufacturers of tubing and, hence the use of the modified SMI has been adopted, refer tofigure 6.e and figure 6.f. The choice of materials proposed is conservatively as recentdevelop materials such as 13%Cr and Super Duplex class have not been consideredbecause experiments on these materials are not completed.
In the partial pressures of H2S and CO2 are below the critical thresholds established in theprevious section, all materials in class C-steel/L-A-steel can be used, otherwise thefollowing combinations of conditions may exist:
• Solely H2S in oil wells• Solely H2S in gas or gas condensate wells• Solely CO2 and Cl-
• Both H2S and CO2.
The tables regarding the choice of materials are shown below. These give the rules used byEni-Agip sectioned on the basis of the conditions as listed above and the use in the well.
Materials are sub-divided into three categories, OCTG, DHE materials and wellheadmaterials.

ARPO
ENI S.p.A.Agip Division
IDENTIFICATION CODE PAGE 145 OF 295
REVISIONSTAP-P-1-M-7100 0
6.8.1. OCTG Specifications
Refer to table 6.b below.
OCTG Materials For Corrosion By H 2S Only In Oil Wells
Conditions Material Alternately0.0035< pH2S max < 0.1 FBHT >80oC J55, K55, N80, C95, P110 L80-Mod, C90-1, T95-1
0.0035< pH2S max < 0.1 60oC< FBHT >80oC J55, K55, N80 L80-Mod, C90-1, T95-1
0.0035< pH2S max < 0.1 FBHT >80oC L80 L80-Mod, C90-1, T95-1
pH2S max < 0.1 L80 Mod, C90-1, T95-1
OCTG Materials For Corrosion By H 2S Only In Gas Wells
Conditions Material Alternately0.0035< pH2S max < 0.1 FBHT >80oC J55, K55, N80-2, C95 L80-Mod, C90-1, T95-1
0.0035< pH2S max < 0.1 FBHT <80oC L80 L80-Mod, C90-1, T95-1
OCTG Materials For Corrosion By CO 2 And Cl*
Conditions Material Alternately0.2< pCO2S max <100 FBHT <150oC Cl* <50,000 13% Cr
0.2< pCO2S max <100 150oC< FBHT <200oC 22% Cr
0.2< pCO2S max <100 200oC< FBHT <250oC 25% Cr-SA 25% Cr
OCTG Materials For Corrosion By CO 2 , H2S And Cl*
Conditions Material Alternately0.2< pCO2S max <100e
0.0035< pH2S max <0.005
FBHT <150oC Cl* <50,000 13% Cr-80KSIMax
22% Cr25% Cr
0.2< pCO2S max <100epH2S max <0.005
FBHT <200oC Cl* >50,000 22% Cr CW25% Cr CW
0.2< pCO2S max <100e0.0035< pH2S max <0.005
150oC< FBHT <200oC Cl* <50,000 22% Cr25% Cr
0.2< pCO2S max <100e0.0035< pH2S max <0.005
200oC< FBHT <250oC Cl* <50,000 25% Cr
0.2< pCO2S max <100e0.0035< pH2S max <0.005
200oC< FBHT <250oC Cl* >50,000 25% Cr CW
0.2< pCO2S max <100e0.005< pH2S max <0.1
FBHT <250oC Cl* <20,000 25% Cr
pCO2S max <100e0.005< pH2S max <0.1
FBHT <250oC Cl* <50,000 25% Cr CW
0.2< pCO2S max <100e0.005< pH2S max <0.1
200oC< FBHT <250oC Cl* <50,000 28% Cr
0.2< pCO2S max <100e0.1< pH2S max <1
FBHT <200oC Cl* <50,000 22% Cr SA 22% Cr, 25% CrIncoloy 825
0.2< pCO2S max <100e0.1< pH2S max <1
FBHT <250oC Cl* <50,000 25% Cr SA 28% CrIncoloy 825
0.2< pCO2S max <100e0.1< pH2S max <1
FBHT <200oC Cl* >50,000 28% Cr Incoloy 825
0.2< pCO2S max <100epH2S max >1
28% Cr Incoloy 825
Table 6.B - OCTG Materials for Sour Service

ARPO
ENI S.p.A.Agip Division
IDENTIFICATION CODE PAGE 146 OF 295
REVISIONSTAP-P-1-M-7100 0
6.8.2. DHE Specifications
Refer to table 6.c below.
Materials For DHE Corrosion By H 2S Only In Oil Wells
Conditions Material AlternatelypH2S max < 0.1 FBHT >80oC AISI-41XX-110KSI-MAX
pH2S max < 0.1 FBHT >80oC AISI-41XX-80KSI-MAX
pH2S max < 0.1 FBHT <65oC AISI-41XX-HRC-22-MAX
pH2S max > 0.1 FBHT <65oC AISI-41XX-HRC-22-MAX
Materials For DHE Corrosion By H 2S Only In Gas Wells
Conditions Material AlternatelypH2S max < 0.1 FBHT >80oC AISI-41XX-80KSI-MAX
pH2S max < 0.1 AISI-41XX-HRC-22-MAX
FBHT <80oC AISI-41XX-HRC-22-MAX
Materials For DHE Corrosion By CO 2 And Cl*
Conditions Material AlternatelypCO2S max <100 FBHT <100oC Cl* <50,000
pCO2S max <100 100oC< FBHT <150oC Cl* <50,000
pCO2S max <100 150oC< FBHT <250oC 28% Cr Inconel 718Incoloy 825
Materials For DHE Corrosion By CO 2 , H2S And Cl*
Conditions Material Alter OrpCO2S max <100epH2S max < 0.005
FBHT <100oC Cl* <50,000 9% Cr-1Moly
pCO2S max <100epH2S max < 0.005
100oC< FBHT <150oC Cl* <50,000 13%-Cr-80KSI-MAX
22% Cr25% Cr
Inconel 718Incoloy 825
pCO2S max <100epH2S max < 0.005
150oC< FBHT <250oC Cl* <50,000 22% Cr25% Cr
Inconel 718Incoloy 825
pCO2S max <100epH2S max <0.005
200oC< FBHT <250oC Cl* <50,000 25% CrInconel 718Incoloy 825
pCO2S max <100epH2S max <0.005
100oC< FBHT <150oC Cl* >50,000 22% Cr CW25% Cr CW
Inconel 718Incoloy 825
pCO2S max <100epH2S max < 0.005
150oC< FBHT <250oC Cl* >50,000 25% Cr CW Inconel 718Incoloy 825
pCO2S max <100epH2S max <0.1
200oC< FBHT <250oC Cl* <50,000 25% Cr Inconel 718Incoloy 825
pCO2S max <100epH2S max <0.1
200oC< FBHT <250oC Cl* >50,000 28% Cr Inconel 718Incoloy 825
pCO2S max <100epH2S max <1
FBHT <200oC Cl* <50,000 22% Cr SA25% Cr SA
22% Cr,Inconel 718Incoloy 825
pCO2S max <100epH2S max <1
FBHT <250oC Cl* <50,000 25% Cr SA28% Cr
Inconel 718Incoloy 825
pCO2S max <100epH2S max <1
FBHT <250oC Cl* >50,000 28% Cr Inconel 718Incoloy 825
Table 6.C- DHE Material for Sour Service

ARPO
ENI S.p.A.Agip Division
IDENTIFICATION CODE PAGE 147 OF 295
REVISIONSTAP-P-1-M-7100 0
6.8.3. Wellhead Specifications
Refer to below.
Wellhead Materials For Corrosion Caused By H 2S
Conditions TubingHanger
Tbg HeadAdapter
TubingSpool
Cross TopAdapter
CasingSpool
Stud Nut
pH2S-MAX >0.035
AISI-4140HRC-22-
MAX
AISI-4135HRC-22-
MAX
AISI-4135HRC-22-
MAX
AISI-4135HRC-22-
MAX
AISI-4135HRC-22-
MAX
AISI-4135HRC-22-
MAX
ASTM-A193-B7M
ASTM-A194-2M
pH2S-MAX <0.035
AISI-4140 AISI-4135 AISI-4135 AISI-4135 AISI-4135 AISI-4135 ASTM-A193-B7M
ASTM-A194-2H
Automatic-Master-Valve Manual Master-Valve
Conditions Body BonnetFlanges
Gate & Seats Steam Body BonnetFlanges
Gate & Seats Steam
pH2S-MAX>0.035
AISI-4135-HRC-22-MAX
AISI-4140-HRC-22-MAX
AISI-4140-HRC-22-MAX
AISI-4135-HRC-22-MAX
AISI-4140-HRC-22-MAX
AISI-4140HRC-22-MAX
pH2S-MAX <0.035
AISI-4135 AISI-4140 AISI-4140 AISI-4135 AISI-4140 AISI-4140
Wellhead Materials For Corrosion Caused By CO2 and Cl -
Conditions TubingHanger
Tbg HeadAdapter
TubingSpool
Cross TopAdapter
CasingSpool
Stud Nut
0.2<pCO2 Max 100
FTHT < 150 Cl- <50000
13%-Cr-80ksi-Max
F6NM
13%-Cr-80ksi-Max
F6NM
AISI-4135 13%-Cr-80ksi-Max
F6NM
13%-Cr-80ksi-Max
F6NM
Carbon-SteelAISI-41XX
ASTM-A193-B7
ASTM-A194-2H
pCO2-Max < 100
150 <FTHT <200
Cl- < 50000
Monel-K500Inconel-718
AISI-4135-IC
Inconel-625
AISI-4135 AISI-4135-IC Inconel -625 Monel-
K500
AISI-4135-IC
Inconel -625
Monel-K500
AISI-4135 ASTM-A193-B7
ASTM-A194-2H
Automatic-Master-Valve Manual Master-Valve
Conditions Body BonnetFlanges
Gate & Seats Steam Body BonnetFlanges
Gate & Seats Steam
0.2 < pCO2-Max< 100e
FTHT < 150e Cl- < 50000
13%-Cr-80ksi-Max
F6NM
13%-Cr-80ksi-Max
Monel-K500
17-4-PH
13%-Cr-80ksi-Max
F6NM
13%-Cr-80ksi-Max
Monel-K500
17-4-PH
pCO2-Max <100e
150<FTHT< 200e
Cl- < 50000
AISI-4135-IC
Inconel-625
Inconel -718 Inconel -718 AISI-4135-IC
Inconel-625
Inconel-718 Inconel-718
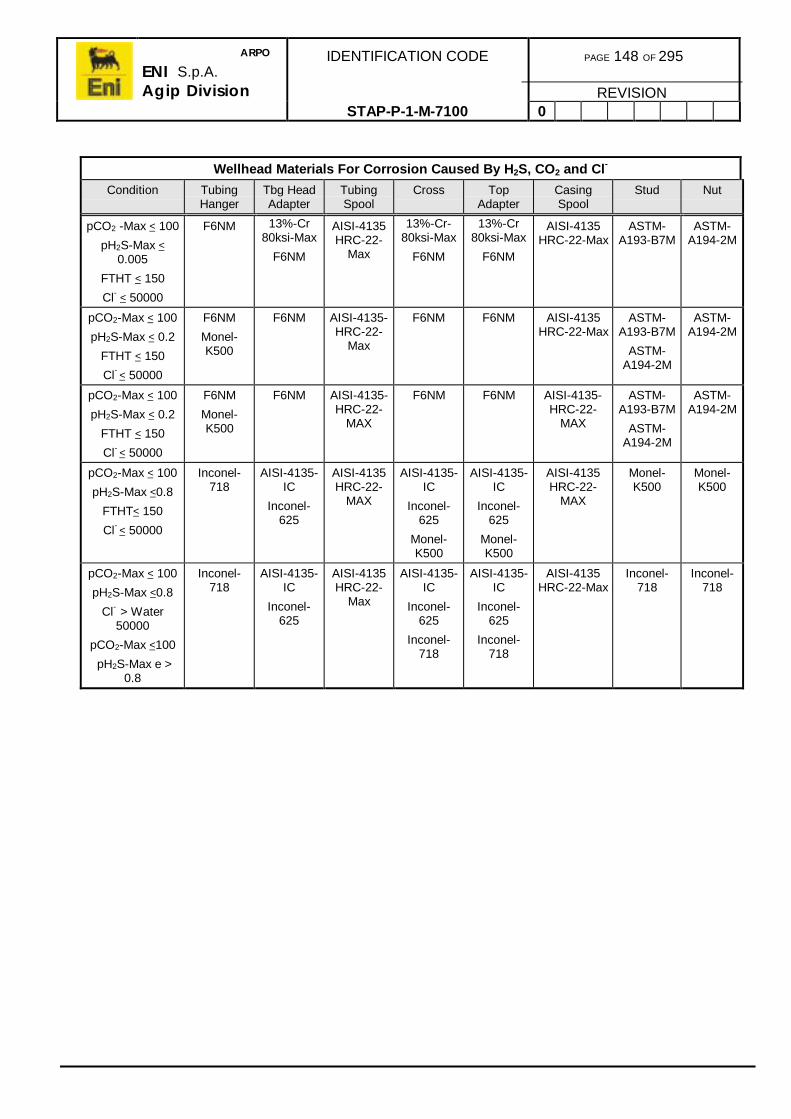
ARPO
ENI S.p.A.Agip Division
IDENTIFICATION CODE PAGE 148 OF 295
REVISIONSTAP-P-1-M-7100 0
Wellhead Materials For Corrosion Caused By H 2S, CO2 and Cl -
Condition TubingHanger
Tbg HeadAdapter
TubingSpool
Cross TopAdapter
CasingSpool
Stud Nut
pCO2 -Max < 100
pH2S-Max <0.005
FTHT < 150
Cl- < 50000
F6NM 13%-Cr80ksi-Max
F6NM
AISI-4135HRC-22-
Max
13%-Cr-80ksi-Max
F6NM
13%-Cr80ksi-Max
F6NM
AISI-4135HRC-22-Max
ASTM-A193-B7M
ASTM-A194-2M
pCO2-Max < 100
pH2S-Max < 0.2
FTHT < 150
Cl- < 50000
F6NM
Monel-K500
F6NM AISI-4135-HRC-22-
Max
F6NM F6NM AISI-4135HRC-22-Max
ASTM-A193-B7M
ASTM-A194-2M
ASTM-A194-2M
pCO2-Max < 100
pH2S-Max < 0.2
FTHT < 150
Cl- < 50000
F6NM
Monel-K500
F6NM AISI-4135-HRC-22-
MAX
F6NM F6NM AISI-4135-HRC-22-
MAX
ASTM-A193-B7M
ASTM-A194-2M
ASTM-A194-2M
pCO2-Max < 100
pH2S-Max <0.8
FTHT< 150
Cl- < 50000
Inconel-718
AISI-4135-IC
Inconel-625
AISI-4135HRC-22-
MAX
AISI-4135-IC
Inconel-625
Monel-K500
AISI-4135-IC
Inconel-625
Monel-K500
AISI-4135HRC-22-
MAX
Monel-K500
Monel-K500
pCO2-Max < 100
pH2S-Max <0.8
Cl- > Water50000
pCO2-Max <100
pH2S-Max e >0.8
Inconel-718
AISI-4135-IC
Inconel-625
AISI-4135HRC-22-
Max
AISI-4135-IC
Inconel-625
Inconel-718
AISI-4135-IC
Inconel-625
Inconel-718
AISI-4135HRC-22-Max
Inconel-718
Inconel-718

ARPO
ENI S.p.A.Agip Division
IDENTIFICATION CODE PAGE 149 OF 295
REVISIONSTAP-P-1-M-7100 0
Automatic-Master-Valve Manual Master-Valve
Conditions Body BonnetFlanges
Gate & Seats Steam Body BonnetFlanges
Gate & Seats Steam
pCO2 -Max < 100
pH2S- Max <0.005
FTHT < 150
Cl- < 50000
13%-Cr-80KSI-Max
F6NM
13%-Cr-80 KSI-Max
17-4-PH F6NM 13%-Cr-80KSI-Max
F6NM
13%-Cr-80KSI- Max
17-4-PH
F6NM
pCO2- Max < 100
pH2S- Max < 0.2
FTHT < 150
Cl- < 50000
F6NM 13%-Cr-80 KSI-Max
Stellite-6
Monel-K500 F6NM 13%-Cr-80KSI- Max -
Stellite--6
Monel-K500
pCO2- Max < 100
pH2S- Max < 0.8
FTHT< 150
Cl-<50000
AISI-4135-I.C.
Inconel-625
F6NM
Inconel-718
Monel-K500 AISI-4135-I.C.
Inconel-625
F6NM
Inconel-718
Monel-K500
pCO2- Max < 100
pH2S- Max < 0.8
Cl- Water 50000
pCO2- Max < 100
pH2S- Max e >0.8
AISI-4135- I.C.
Inconel-625
Inconel-718 Inconel-718 AISI-4135-I.C.
Inconel-625
Inconel-718 Inconel-718
Table 6.D- Wellhead Material for Sour Service

ARPO
ENI S.p.A.Agip Division
IDENTIFICATION CODE PAGE 150 OF 295
REVISIONSTAP-P-1-M-7100 0
Figure 6.E - OCTG Material Selection Diagram
10-1
10-2
10-3
10-4
100
FBHT <= 150 Cand Cl - <= 50000 ppm13% Cr
150 > FBHT <= 200 C Cl- <= 50000 ppm22% Cr
200<FBHT<=250 C25% Cr-SAor25% Cr
C- STEELJ 55N 80P 110
FBHT<= 250 Cand Cl- <= 20000 ppm25% Cr-CW
FBHT<=250 Cand Cl- <= 50000 ppm25% Cr-CW
200<FBHT<=250 CandCl- > 50000 ppm28 % CrorINCOLOY- 825
(*)
FBHT <= 200 CCl-<=50000 ppm22 % Cr-SAor25 % Cr-SA28 % CrINCOLOY- 825
FBHT <= 250 CCl- <= 50000 ppm25 % Cr-SAor28 % CrINCOLOY- 825
FBHT<= 250 CCl- > 50000 ppm28 % CrINCOLOY- 825
FBHT < 200 C28 % Cr
orINCOLOY-825
LOW ALLOY STEEL
L 80 modC 90 T1C 95 T1
10
1
10010110-110-210-310-4pH2S (atm)
pCO2(atm)
(*)FBHT<= 150 CCl- <= 50000 ppm13 % Cr 80 Ksi maxor 22 % Cr 25 % Cr
FBHT <= 200 CCl- > 50000 ppm22 % Cr- CW 25 % Cr -CW
150 < FBHT <= 200 CCl- < 50000 ppm22 % Cr 25 % Cr
200 < FBHT <= 250 CCl- < 50000 ppm25 % Cr-CW
200 < FBHT <= 250Cl- > 50000 ppm25 % Cr-CW
FBHT < = 65 CL 80orL 80 mod;C 90 T1T 95 T1
FBHT >80 CJ55 K55 N80-1 C95P110-1 (only oil)orL80 mod C90 T1
65 < FBHT<= 80CJ 55 K 55 N80-1orL 80 mod C90 T1T 95 T1

ARPO
ENI S.p.A.Agip Division
IDENTIFICATION CODE PAGE 151 OF 295
REVISIONSTAP-P-1-M-7100 0
Figure 6.F - DHE Material Selection Diagram
10-1
10-2
10-3
10-4
100
FBHT <= 100 CCl- <= 50000 ppm9 Cr 1 Mo
100 < FBHT <= 150 C Cl- <= 50000 ppm13 % Cr 80 ksi max
150 > FBHT<= 250 C25% Cr-CWor25% CrINCONEL 718INCOLOY 825
C-STEELor
AISI 41XX
200 < FBHT<= 250 CCl- <= 50000 ppm25 % CrorINCONEL 718INCOLOY 825
200 < FBHT<=250 CCl- > 50000 ppm28 % CrorINCONEL 718INCOLOY 825
(*)
FBHT <= 200 CCl-<=50000 ppm22 % Cr-SA25 % Cr-SA28 % CrINCOLOY 825INCONEL 718
200 < FBHT <= 250 CCl- <= 50000 ppm25 % Cr-SA28 % CrINCOLOY 825INCONEL 718
FBHT<= 250 CCl- > 50000 ppm28 % CrINCOLOY- 825INCONEL 718
FBHT < 200 C28 % Cr
orINCOLOY 825INCONEL 718
AISI 41XX22 HRC max
10
1
10010110-110-210-310-4pH2S (atm)
pCO2(atm)
(*)150 < FBHT <= 200 CCl- <= 50000 ppm22 % Cr 25 % CrINCONEL 718INCOLOY 825
200 < FBHT <= 250 CCl- > 50000 ppm25 % Cr INCONEL 718INCOLOY 825
100 < FBHT <= 200 CCl- > 50000 ppm22 % Cr-CW 25 % Cr-CW INCONEL 718INCOLOY 825
200 > FBHT <= 250 CCl- > 50000 ppm25 % Cr-CWINCONEL 718INCOLOY 825
FBHT < = 65 CAISI 41XX 22 HRC max
65 < FBHT <=80 CC-STEEL 80 Ksi maxAISI 41XX
FBHT > 80 CC-STEEL 110 Ksi maxAISI 41XX

ARPO
ENI S.p.A.Agip Division
IDENTIFICATION CODE PAGE 152 OF 295
REVISIONSTAP-P-1-M-7100 0
6.9. ORDERING SPECIFICATIONS
When ordering tubulars for sour service, the following specifications should be included, inaddition to those given in the above table.
1) Downgraded grade N80, P105 or P110 tubulars are not acceptable for orders for J55or K55 casing.
2) The couplings must have the same heat treatment as the pipe body.
3) The pipe must be tested to the alternative test pressure (see API Bulletins 5A and5AC).
4) Cold die stamping is prohibited, all markings must be paint stencilled or hot diestamped.
5) Three copies of the report providing the ladle analysis of each heat used in themanufacture of the goods shipped, together with all the check analyses performed,must be submitted.
6) Three copies of a report showing the physical properties of the goods supplied andthe results of hardness tests (Refer to step 3 above) must be submitted.
7) Shell modified API thread compound must be used.
Note: Recommendations for casing to be used for sour service must bespecified according to the API 5CT for restricted yield strength casings.
The casing should also meet the following criteria:
• The steel used in the manufacture of the casing should have been quenchedand tempered. (This treatment is superior to tubulars heated/treated by othermethods, e.g. normalising and tempering).
• All sour service casing should be inspected using non-destructive testing orimpact tests only, as per API Specification 5CT.

ARPO
ENI S.p.A.Agip Division
IDENTIFICATION CODE PAGE 153 OF 295
REVISIONSTAP-P-1-M-7100 0
7. TUBING DESIGN
7.1. POLICIES
All completion tubing strings will have tubing movement calculations conducted to ascertainthe maximum load applied to the string and/or completion tubing movement to be cateredfor in the completion design.
All tubing strings should be designed for stress, preferably using an appropriate up to datecomputer programme. Currently Eni-Agip Division and Affiliates recommended programmeis the Enertech WS-Tube programme to the latest version.
A safety factor (SF) of 1.25 applies to the ratio of the calculated stress in a string tothe minimum yield strength of the selected tubing in carbon steels.
A safety factor (SF) of 1.35 applies to the ratio of the calculated stress in a string tothe minimum yield strength of the selected tubing of CRA materials.
If the stress SF is less than these limits, the calculation should be run again substituting,either a heavier weight or, a higher grade of pipe. Under some special conditions, the SFsmay be reduced, refer to the criteria in section 7.10.2.
Tubing size shall be determined by the reservoir engineers using IPR curves and Nodalanalysis (Refer to section 5.6).
7.2. THEORY
During completion tubing design process, it is necessary to calculate the variations in lengthfor the stresses applied under load conditions. When these have been determined it willconfirm the suitability of the selected tubing.
Tubing movement occurs due to only two reasons:
• Temperature changes• Change in pressure induced forces.
Movement can only occur if the tubing is free to move. If the tubing is not free to move andis anchored to a packer then stress will be subjected to the tubing string and packer. Thisrelationship is fully explained in section 7.10 Stress Calculations.
Tubing movement upwards (contraction) is assumed to be negative and downwards(lengthening) is positive.
To fully understand these effects, it is first necessary to understand the properties of steelsused in the manufacture of tubing.

ARPO
ENI S.p.A.Agip Division
IDENTIFICATION CODE PAGE 154 OF 295
REVISIONSTAP-P-1-M-7100 0
7.2.1. Mechanical Properties of Steel
Failure of a material or of a structural part may occur by fracture (e.g. the shattering ofglass), yield, wear, corrosion, and other causes. These failures are failures of the material.Buckling may cause failure of the part without any fracture of the material. As load isapplied, deformation takes place before any final fracture occurs. With all solid materials,some deformation may be sustained without permanent deformation, i.e., the materialbehaves elastically. Beyond the elastic limit, the elastic deformation is accompanied byvarying amounts of plastic, or permanent, deformation. If a material sustains large amountsof plastic deformation before final fracture, it is classed as a ductile material, and if fractureoccurs with little or no plastic deformation, the material is classed as brittle.
Tests of materials may be conducted in many different ways, such as by torsion,compression and shear, but the tension test is the most common and is qualitativelycharacteristic of all the other types of tests. The action of a material under the graduallyincreasing extension in the tension test is usually represented by plotting apparent stress(the total load divided by the original cross-sectional area of the test piece) as ordinatesagainst the apparent strain (elongation between two gauge points marked on the test piecedivided by the original gauge length) as abscissae. A typical curve for steel is shown infigure 7.a.
In this, the elastic deformation is approximately a straight line as called for by Hooke's Law,and the slope of this line, or the ratio of stress to strain within the elastic range, is themodulus of elasticity E, sometimes called Young's Modulus. This gives rise to Poisson’sRatio, both are explained in figure 7.b.
Figure 7.A - Stress-Strain Curve for Tubing Steel

ARPO
ENI S.p.A.Agip Division
IDENTIFICATION CODE PAGE 155 OF 295
REVISIONSTAP-P-1-M-7100 0
Beyond the elastic limit, permanent or plastic strain occurs. If the stress is released in theregion between the elastic limit and the yield strength; see figure 7.a, the material willcontract along a line generally nearly straight and parallel to the original elastic line, leavinga permanent set.
Figure 7.B - Deformation Constants for Tubing Steel

ARPO
ENI S.p.A.Agip Division
IDENTIFICATION CODE PAGE 156 OF 295
REVISIONSTAP-P-1-M-7100 0
In steels, a curious phenomenon occurs after the elastic limit, known as yielding. This givesrise to a dip in the general curve followed by a period of deformation at approximatelyconstant load. The maximum stress reached in this region is called the upper yield pointand the lower part of the yielding region the lower yield point.
In the harder and stronger steels, and under certain conditions of temperature, the yieldingphenomenon is less prominent and is correspondingly harder to measure.
In materials that do not exhibit a marked yield point, it is customary to measure a yieldstrength. This is arbitrarily defined as the stress at which the material has a specifiedpermanent set (the value of 0.2% is widely accepted in the industry).
For steels used in the manufacturing of tubular goods, API specifies the yield strength asthe tensile strength required to produce a total elongation of 0.5% to 0.6% of the gaugelength.
Similar arbitrary rules are followed with regard to the elastic limit in commercial practice.Instead of determining the stress up to which there is no permanent set, as required bydefinition, it is customary to designate the end of the straight portion of the curve (bydefinition the proportional limit) as the elastic limit. Careful practice qualifies this bydesignating it the proportional elastic limit.
As extension continues beyond yielding, the material becomes stronger causing a rise ofthe curve, but at the same time the cross-sectional area of the specimen becomes less as itis drawn out.
This loss of area weakens the specimen so that the curve reaches a maximum and thenfalls off until final fracture occurs. The stress at the maximum point is called the tensilestrength or the ultimate strength of the material and is its most often quoted property.
The mechanical and chemical properties of casing, tubing and drill pipe are laid down in APIspecification of further specs. 5CT which is a combination of former specs. 5A, 5AC, 5AXand 5AQ - Casing and Tubing requirements. Depending on the type or grade, minimumrequirements are laid down for the mechanical properties, and in the case of the yield pointeven maximum requirements (except for H-40). The denominations of the different gradesare based on the minimum yield strength, e.g.:
H-40 - min. yield strength 40,000 psi.
J-55 - min. yield strength 55,000 psi.
L-80 - min. yield strength 80,000 psi.
Others are shown in figure 7.c.
The lines indicating equivalent hardness of 22 and 23 Rc indicates the tolerances for use ofthe materials in H2S conditions according to NACE which is fully described in section 7.9.4.

ARPO
ENI S.p.A.Agip Division
IDENTIFICATION CODE PAGE 157 OF 295
REVISIONSTAP-P-1-M-7100 0
Figure 7.C - Strengths of Various Grades of Steel
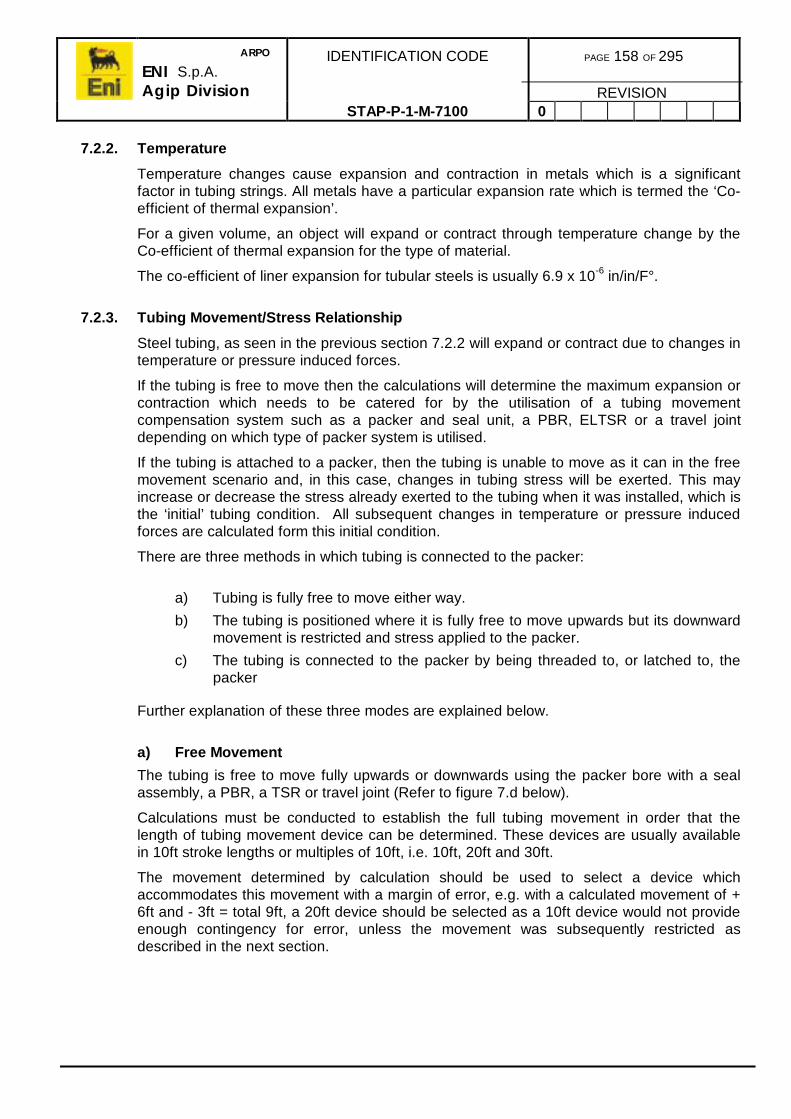
ARPO
ENI S.p.A.Agip Division
IDENTIFICATION CODE PAGE 158 OF 295
REVISIONSTAP-P-1-M-7100 0
7.2.2. Temperature
Temperature changes cause expansion and contraction in metals which is a significantfactor in tubing strings. All metals have a particular expansion rate which is termed the ‘Co-efficient of thermal expansion’.
For a given volume, an object will expand or contract through temperature change by theCo-efficient of thermal expansion for the type of material.
The co-efficient of liner expansion for tubular steels is usually 6.9 x 10⁻⁶ in/in/F°.
7.2.3. Tubing Movement/Stress Relationship
Steel tubing, as seen in the previous section 7.2.2 will expand or contract due to changes intemperature or pressure induced forces.
If the tubing is free to move then the calculations will determine the maximum expansion orcontraction which needs to be catered for by the utilisation of a tubing movementcompensation system such as a packer and seal unit, a PBR, ELTSR or a travel jointdepending on which type of packer system is utilised.
If the tubing is attached to a packer, then the tubing is unable to move as it can in the freemovement scenario and, in this case, changes in tubing stress will be exerted. This mayincrease or decrease the stress already exerted to the tubing when it was installed, which isthe ‘initial’ tubing condition. All subsequent changes in temperature or pressure inducedforces are calculated form this initial condition.
There are three methods in which tubing is connected to the packer:
a) Tubing is fully free to move either way.
b) The tubing is positioned where it is fully free to move upwards but its downwardmovement is restricted and stress applied to the packer.
c) The tubing is connected to the packer by being threaded to, or latched to, thepacker
Further explanation of these three modes are explained below.
a) Free Movement
The tubing is free to move fully upwards or downwards using the packer bore with a sealassembly, a PBR, a TSR or travel joint (Refer to figure 7.d below).
Calculations must be conducted to establish the full tubing movement in order that thelength of tubing movement device can be determined. These devices are usually availablein 10ft stroke lengths or multiples of 10ft, i.e. 10ft, 20ft and 30ft.
The movement determined by calculation should be used to select a device whichaccommodates this movement with a margin of error, e.g. with a calculated movement of +6ft and - 3ft = total 9ft, a 20ft device should be selected as a 10ft device would not provideenough contingency for error, unless the movement was subsequently restricted asdescribed in the next section.

ARPO
ENI S.p.A.Agip Division
IDENTIFICATION CODE PAGE 159 OF 295
REVISIONSTAP-P-1-M-7100 0
b) Limited Downward Movement
In this case the tubing is fully free to move upwards but is restricted in its downwardmovement (Refer to figure 7.e).
This restricted downward movement results in further stress applied to the bottom of thetubing and, correspondingly to the packer. This additional stress will be calculated duringthe tubing movement calculations and must not exceed the stress limit for the tubing,otherwise permanent deformation will occur.
c) Anchored Tubing
In this case the tubing is anchored to the packer by being threaded to it (as in the casewhen using retrievable packers) or by using an anchoring device such as an Anchor Latch,Ratchet Latch, etc. (Refer to figure 7.f).
When the tubing is anchored to the packer and movement is eliminated, it will result inincreased tensional and compressive forces, hence increased stress in the tubing. This maybe acceptable when temperature and pressure changes are not excessive. Similarly, thecalculations will determine that the tubing stress limit is not exceeded.
Figure 7.D - Free Moving Figure 7.E - LimitedMovement
Figure 7.F - Anchored Tubing

ARPO
ENI S.p.A.Agip Division
IDENTIFICATION CODE PAGE 160 OF 295
REVISIONSTAP-P-1-M-7100 0
7.3. WELL DATA.
The well data and parameters required (or already determined) to produce an accuratetubing movement/stress analysis and, hence, selection of a tubing are:
• Casing design profile• Casing programme contingency profile• Tubing size from optimisation analysis• Pressure gradient• Temperature gradient• Reservoir fluids specific gravities• Completion fluid specific gravities• Production/injection or stimulation forecast.
7.3.1. Casing Profile/Geometry
The planned casing design and contingency plans are required as they affect the tubingmovement calculations (Refer to 4.1.1). Each casing or liner weight and correspondinglength of section must be known to enable calculation. Deviation tables are also required.
7.3.2. Tubing Data
The optimum tubing size, determined by nodal analysis conducted by the reservoirengineers, is required and is the basis of all the calculations. The tubing grade is selected inaccordance to the criteria listed in section 6 to combat the effects of any corrosion from thewell conditions.
The tubing movement/stress calculations will then determine the tubing weight or anychange in grade required to meet with the applied SF for stress.
The well deviation is also important to determine the type of packer/tubing seal deviceand/or tubing movement device to ensure that, either, straight pull or torque can be appliedto the tubing downhole at the packer depth overcoming any frictional drag.
Once the tubing size, weight and grade is confirmed then the appropriate rated completioncomponents can be specified in order that the purchasing department can prepare tenderdocuments.
7.3.3. Bottom-hole Pressure
Accurate initial and prognosed future formation pressures both static and dynamic arefundamental to tubing movement/stress calculations. These pressures can be obtainedfrom previous well exploration test data or appraisal well test reports.
7.3.4. Temperatures (Static and Flowing)
Accurate well temperature data are vital in tubing movement/stress analysis as thetemperature effect is usually the effect which causes the greatest tubing movement.
The average temperature of each section of tubing and casing must be known ordetermined to input into the calculations.
Similar to the pressure data, temperature data may be found from previous well test results.

ARPO
ENI S.p.A.Agip Division
IDENTIFICATION CODE PAGE 161 OF 295
REVISIONSTAP-P-1-M-7100 0
7.3.5. Reservoir Fluids
As described earlier, the constituents of the produced reservoir fluids will initially determinethe material required for the tubing. This is subject to any corrosion inhibition methodswhich may be implemented.
Particular importance should be paid to Hydrogen Sulphide, Carbon Dioxide and Chloridelevels. In the presence of water and under certain temperature conditions, these corrosiveagents can cause serious problems, therefore it is essential that a detailed corrosion studyis completed to enable the choice of materials and/or inhibition procedures.
If justified economically, the material chosen should combat the effects of corrosion,however if this choice is not economic and some corrosion inhibition process was suitablethen this would be a fallback position.
Future parameters must also be considered as water may rise and the GOR will change,therefore the materials should be chosen to last the planned life of the completion.
7.3.6. Completion Fluid
The completion fluid, usually a brine, is chosen for its compatibility with the formation and itsfluids so as not to cause any formation damage. It should be selected to provide anoverbalance at the top of the reservoir. It also must be selected for its stability over longtime periods and not suffer from dehydration or deterioration.
As the completion fluid (sometimes referred to as the packer fluid) will be left in the annulus,it should be suitably dosed with corrosion inhibitors and oxygen scavenger to preventcorrosion to the exposed tubulars and elastomers.
The information required to make a considered selection may be obtained from the ADIS(Advanced Drilling Information System) database (which holds all the data regarding thedrilling of the well), well tests carried out earlier and other sources which may be useful inthe decision making process.
7.4. PRESSURE INDUCED FORCES
When a well is completed, either with a tubing seal unit in a packer bore or a tubingmovement device, it will have completion fluid in both the tubing and the annulus, this isreferred to as the initial condition. All subsequent conditions are calculated from this initialcondition.
These are three pressure induced effects which produce forces that moves the tubing.These effects are:
a) Piston effect.
b) Buckling effect.
c) Ballooning effect.
Each of these effects are addressed in this section.

ARPO
ENI S.p.A.Agip Division
IDENTIFICATION CODE PAGE 162 OF 295
REVISIONSTAP-P-1-M-7100 0
7.4.1. Piston Effect
Tubing, when run in a well must first withstand the load of its own weight which may be asignificant factor especially in deep wells. This tensile load is greatest in the jointimmediately below the tubing hanger. The tubing is run into a completion fluid withequivalent fluid density inside and outside the tubing which results in a reduction of the loaddue to buoyancy.
If there is an alteration from this initial condition causing a change in pressure forces acrossthe packer seal unit then a piston effect is caused. This will alter the tensile load on the topand bottom of the tubing.
The change in length due to these alterations is calculated from Hooks Law:
Where E is the modulus of elasticity (sometimes referred to as a Young’s Modulus formula).
The force (F) change is caused by the change in piston force from the initial conditionscreated by a change in pressure in the annulus or tubing at the packer. 7.7 and figure 7.hillustrate this piston force for two cases, tubing larger than the packer bore, and tubingsmaller than the packer bore. The formula in each case is the same:
FEA
LL
s
−=∆ 1Eq. 7.A
Substituting for F, the equation becomes:
( ) ( )[ ]PoAoApPAApEA
LL
s
∆−−∆−−=∆ 111Eq. 7.B
where:
L = Length of the tubing string to the packer depth (ins)E = Young’s Modulus of Elasticity (psi)As = Cross sectional area of tubing (ins2)Ap = Area of the packer bore (ins2)Ai = Area of the tubing ID (ins2)Ao = Area of the tubing OD (ins2)∆Pi = Change in tubing pressure at the packer (psi)∆Po = Change in annulus pressure at the packer (psi)

ARPO
ENI S.p.A.Agip Division
IDENTIFICATION CODE PAGE 163 OF 295
REVISIONSTAP-P-1-M-7100 0
Figure 7.G - Packer Bore Larger ThanTubing OD
Figure 7.H - Packer Bore Smaller Than TubingOD
7.4.2. Buckling Effect
Helical buckling is initiated by compressive force acting on the bottom of the tubing and isthe formation of helical spirals in the tubing string. The helix shown in figure 7.i has avariable pitch as the compressive force is progressively lowered by the weight of the pipehanging below. The buckling effect is greater when pressure differential is applied acrossthe pipe. Unless the tubing string is short or the compressive force is exceedingly high,some of the tubing will be buckled and the rest straight. The exact point between thebuckled and straight sections is the ‘neutral point’ (Refer to figure 7.i).
The neutral point can be calculated from the following:
nF
w= Eq. 7.C
where:
W = Ws + Wi - WoWi = Ai x Weight of fluid inside the tubingWo = Ao x Weight of fluid outside the tubing
Ao
Ai
r
Ap Pi
Ai
r
Ap Pi
Ao
PoPo
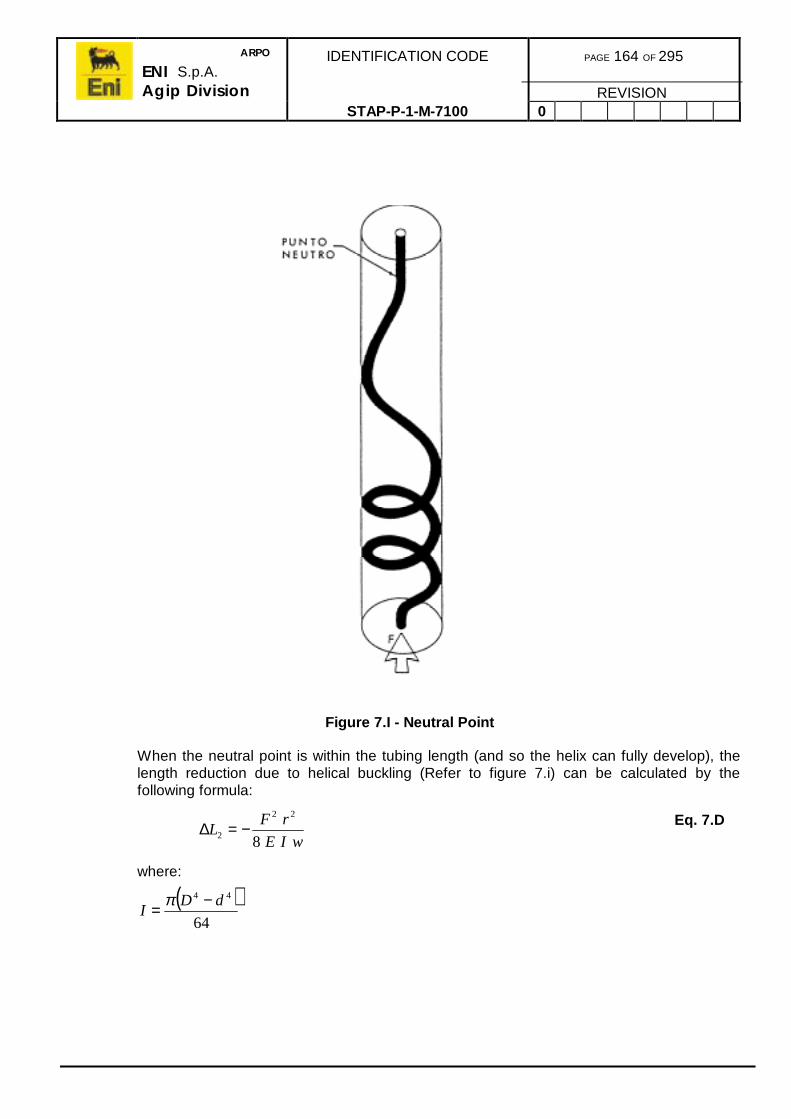
ARPO
ENI S.p.A.Agip Division
IDENTIFICATION CODE PAGE 164 OF 295
REVISIONSTAP-P-1-M-7100 0
Figure 7.I - Neutral Point
When the neutral point is within the tubing length (and so the helix can fully develop), thelength reduction due to helical buckling (Refer to figure 7.i) can be calculated by thefollowing formula:
wIE
rFL
8
22
2 −=∆ Eq. 7.D
where:
( )64
44 dDI
−= π

ARPO
ENI S.p.A.Agip Division
IDENTIFICATION CODE PAGE 165 OF 295
REVISIONSTAP-P-1-M-7100 0
Figure 7.J - Helical Buckling
If the tubing is very short (as happens for example on selective type completions betweentwo packer’s) all the string may be affected by buckling and there is no neutral point. In thiscase, the length reduction due to the buckling effect is dependant upon the entire length ofthe string and can be calculated by the following formula:
n L>
−−=∆
F
Lw
F
Lw
EIw
rFL 2
8
22
2
Eq. 7.E
As seen, the formulae for both piston effect and helicoidal buckling above has so far usedF, i.e. the change in the piston force acting on the bottom of the tubing. However, in order tocomplete the understanding of the effects which lead to variations in length due to buckling,we must also consider the effect caused by pressure differential across a pipe.
If the internal pressure in a pipe is greater than the external pressure, the tube remainsstraight only if it has an axially symmetric cross-section with no deformation to change itsshape. This configuration is unstable and any distortion can lead immediately to a stableequilibrium condition which is helicoidal buckling.
Helicoidal buckling is caused by the effect of the pressure which acts on the lateral surfaceof the pipe wall as the convex surface of the bend in a greater force is larger than theconcave surface (Refer to figure 7.k). The internal pressure will therefore exert a greaterforce on the convex side of the helix, than that exerted on the concave section of the samebend. The resulting force will, therefore, create the helicoidal buckling configuration.
The same occurs when the stable external pressure is greater than the internal pressurealso resulting in helical buckling.
F
∆L2

ARPO
ENI S.p.A.Agip Division
IDENTIFICATION CODE PAGE 166 OF 295
REVISIONSTAP-P-1-M-7100 0
Moreover, the effect of the external pressure on the tubing lateral surfaces is equivalent to atensile force applied at the tubing bottom of:
iiI
f PAF = Eq. 7.F
ooII
f PAF −= Eq. 7.G
Internal pressure External pressure
Figure 7.K - Pressure Induced Helical Buckling Effect
From this it can be concluded that the effect of the internal pressure on the tubing lateralsurfaces is equivalent to a compressive force applied at the bottom of the tubing.
Therefore the tubing will be buckled by the piston force and by the sum of Ff I and Ff
II . Thefictitious force Ff is obtained from the sum of the three elements:
aII
fI
ff FFFF ++= Eq. 7.H
by substitution:
( )oipf PPAF −= Eq. 7.I
If Ff is greater than zero it will cause helical buckling and hence, if it is less than zero thereis no deformation.
It is however important to relate that the only force actually applied at the bottom of thetubing is the piston force, while the fictitious force is used only to calculate the bucklingeffect.
R R
Pi Pi
Po Po

ARPO
ENI S.p.A.Agip Division
IDENTIFICATION CODE PAGE 167 OF 295
REVISIONSTAP-P-1-M-7100 0
It should be remembered that, to calculate the variations in length, the variations of theforces compared to initial conditions must be calculated. Therefore, to sum up:
• in the ∆L1 (Hooke’s law), the variation of the piston force Fa must be used;
• in the ∆L2 (buckling), the variation of the fictitious force Ff must be used when
this is positive, otherwise, being a tensile force, it cannot buckle the string and∆L
2 = 0.
The theory above was developed considering Pi = Po in the initial conditions, it thus followsthat the Ff is equal to zero and that the variation of fictitious force ∆Ff is therefore equal tothe final fictitious force.
7.4.3. Ballooning Effect
The third element which changes the length of a string, due to the changes to internal andexternal pressure, is caused by ballooning. This effect occurs when ∆P = Pi - Po is positiveand tends to swell the tubing which, contracts axially or shortens (Refer to figure 7.m ). Onthe other hand, when ∆P = Pi - Po is negative, the tubing is squeezed and, expands axiallyor elongates. This is termed reverse ballooning (Refer to figure 7.l ).
The normally used simplified formula to calculate the ballooning or reverse ballooning effectis:
LR
PRP
EL omim
1
22
2
3 −∆−∆
−=∆ ν Eq. 7.J
In this the average internal and external pressure variations are defined by the formulae:
( ) ( ) ( ) ( )
2bottomhole
initialifinalitophole
initialifinali
im
PPPP
P
−+
−
=∆
Eq. 7.K
( ) ( ) ( ) ( )
2bottomhole
initialofinalotophole
initialofinalo
om
PPPP
P
−+
−
=∆
Eq. 7.L
Again this is developed from Hooke’s law using Young’s Modulus of elasticity (already usedin the piston and buckling effect) and Poisson’ ratio.
Poisson’s ratio v as earlier expressed is:
LL
ttV
/
/
∆∆=

ARPO
ENI S.p.A.Agip Division
IDENTIFICATION CODE PAGE 168 OF 295
REVISIONSTAP-P-1-M-7100 0
Figure 7.L - Reverse Ballooning Figure 7.M - Ballooning
7.4.4. Temperature Effect
The final effect considered when calculating tubing length variations, is the temperatureeffect which usually induces the largest movement.
During a well operation, e.g. stimulation, the temperature of the tubing may be much lessthan that in, either, the initial or flow rate conditions. During well stimulations, significantquantities of fluids are pumped through the tubing at ambient surface temperature whichmay change the temperature of the tubing by several degrees.
The formula used to calculate the change of length due to temperature effect is:
LTL M∆=∆ α4
Eq. 7.M
where the average temperature variation in the string can be calculated as follows:
( ) ( )2
bottomholeinitialfinaltopholeinitialfinal
M
TTTTT
−+−=∆ .
Eq. 7.N

ARPO
ENI S.p.A.Agip Division
IDENTIFICATION CODE PAGE 169 OF 295
REVISIONSTAP-P-1-M-7100 0
In the formula α represents the material’s coefficient of thermal expansion. For steel thisvalue is: α = 6.9 x 10⁻⁶ in/in/°F.
figure 7.n shows typical geothermal temperature gradients during both stimulation andproduction conditions. It can be seen that the temperature variations to which the tubing issubjected may cause considerable changes to its length.
Figure 7.N - Typical Geothermal Gradients
7.5. EVALUATION OF TOTAL TUBING MOVEMENT
The sum of the length changes obtained from the changes in pressure induced forces andtemperature effects, gives the total shift of the bottom end of the string at the packer depthwhere it is free to move in the packer-bore. This sum is calculated:
4321 LLLLLtot ∆+∆+∆+∆=∆
Eq. 7.O
With free moving packer/tubing seals systems, the calculations are made for the selectionof an appropriate length of seal assembly, PBR or ELTSR with anchored packer/tubingsystems, this same calculation can be made to select the length of tubing movementdevices such as telescopic or expansion joints. However, if no movement is converted tostress in the tubing, the resultant is stress on the packer (Refer to section 7.6).
0 100 300T (°F)
2500
5000
7500D (feet)
PRODUCTION
GEOTHERMAL
INJECTION
200

ARPO
ENI S.p.A.Agip Division
IDENTIFICATION CODE PAGE 170 OF 295
REVISIONSTAP-P-1-M-7100 0
7.6. ANCHORED TUBING
In some completions the tubing is firmly fixed to the packer, preventing any movement ofthe string when well conditions vary (figure 7.o). In this situation the tubing-packer forcesgenerated by the presence of the anchoring must be determined so as to be able to confirmif the tubing-packer anchoring system and the packer have sufficient strength to safelywithstand all the forces exerted.
Moreover, once this force is known, the load on the tubing can be calculated to check if thecompletion components have sufficient strength.
Figure 7.O - Tubing Anchored To Packer
The tubing-packer force can be calculated by initially assuming that the tubing is free tomove in the packer seal-bore and it is possible to calculate the final total length change ofthe tubing under pressure and temperature variations of all conditions. Subsequently, theforce needed to re-anchor the tubing to the packer can be determined.
To understand this concept better, consider figure 7.p where it is presumed that the tubingcan move away from its anchored condition while maintaining the seal with the packer andthat the tubing undergoes only ∆L
4 contraction caused by the temperature effect. Since no
force is applied at the end of the tubing which could cause buckling, all the movement islinear and to restore to the tubing’s real anchored position, it is sufficient to impose a ∆L
4elongation by applying a force F
P which is obtained from Hooke’s law:
sEA
FLL −=∆ ⇒
L
EALF s
P 4∆−=
Eq. 7.P
However, in general the problem of identifying the tubing/packer reaction is not linear due tothe helical buckling effect and so, it is possible to use a graphical approach.

ARPO
ENI S.p.A.Agip Division
IDENTIFICATION CODE PAGE 171 OF 295
REVISIONSTAP-P-1-M-7100 0
The first step is to plot the characteristic strength/length variation of the system. This curve,shown in figure 7.p is determined by the size of tubing, on the material, radial distancebetween the tubing OD and casing ID and on the fluids in the well. This can be plotted usingthe following formulae:
sEA
FLL −=∆ ( for F < 0 )
EIw
rF
EA
FLL
s 8
22
−−=∆ ( for F > 0 )
Eq. 7.Q
The second step is to identify, on the curve, the tubing representative point in the well whenit is subjected to the fictitious force, even when this is negative. On the curve given in figure7.q this condition is identified by intersection point (Ff, ∆Lf). Indeed, if a force of Ff, wasapplied at the end of the tubing, the cause of the buckling would be eliminated and theneutral point would return to the bottom in the tubing.
The origin of the axis moves to the point found in this way (Ff ,∆Lf) and the diagramobtained has a total length variation of ∆L
P = -∆l
tot, so to position the tubing in the packer
after contracting the string must be elongated accordingly. As shown in figure 7.q the Fpforce, transferred between the tubing and packer, is then identified.
Figure 7.P - Graphical Representation Of Movement
Fp
∆L4
∆L
FFp
∆L4

ARPO
ENI S.p.A.Agip Division
IDENTIFICATION CODE PAGE 172 OF 295
REVISIONSTAP-P-1-M-7100 0
Figure 7.Q - Graphical Representation of Force
7.6.1. Tubing Permitting Limited Motion
Another method which may be used in some types of completions is that the tubing is fullyor partially limited in downhole movement. In this method, after the packer is set, some ofthe weight of the string is set down on the packer, putting the tubing into compression orslackened-off (Refer to figure 7.r).
Fp
∆Lp
∆L
F
Ff
∆Lf
Fp
∆Lp

ARPO
ENI S.p.A.Agip Division
IDENTIFICATION CODE PAGE 173 OF 295
REVISIONSTAP-P-1-M-7100 0
Figure 7.R - Limited Downward Movement
The shortening of the string caused by this, ∆Pso
, makes it possible to limit the lengthvariations of the string, for example, during an injection operation, therefore, ∆L
tot, i.e. the
total length variation calculated as the sum of the above described effects, is decreased by∆L
so. The ∆L
so value is determined using the following formula:
wIE
rF
AE
LFL so
s
soso
8
22
−−=∆
Eq. 7.R
where:
Fso
= slack-off force released on the packer.
With this type of anchoring it is, therefore, possible to limit the movements of the tubing withrespect to the packer and consequently the length of the packer seal-assembly. If ananchored type constraint is considered then the tubing-packer force with respect to theanchored tubing can be reduced, e.g. in an injection operation.
In practice, applying slack-off is the same as moving the packer upwards by ∆Lso
,compressing the string and thus causing part of the length variation which would occur inany case at a later stage due to the effects described above.
The same considerations can be made if ∆Ltot
< 0 during the operation while, on the otherhand, any elongation of the string would be prevented, causing a force on the packer whichwould be equal to that of the slack-off amount.

ARPO
ENI S.p.A.Agip Division
IDENTIFICATION CODE PAGE 174 OF 295
REVISIONSTAP-P-1-M-7100 0
7.6.2. Packer Setting
A particular problem arises in tubing tied to packer completions when using hydraulic setpackers, as pressure is applied to the tubing to set the packer, it changes the length of thetubing during the setting process. This in turn places stress in the tubing after the packer isset and the pressure is bled off.
This stress needs to be taken into account to determine the total stress applied to thetubing.
Hydraulic packers are set by plugging the tubing below the packer either by dropping asetting ball onto a shear out ball seat, or by installing a plug with wireline.
The formulae for determine this tubing length change are:
s
a
EA
LFL
∆−=∆ 1 (Hooke’s law)
LR
P
EL im
1
223 −
∆−=∆ ν
(ballooning)
where:
iia PAF ∆−=∆ and ∆Pim
=∆Pi
7.7. TUBING LOAD CONDITIONS
The load conditions of the tubing string during the well’s life causes stresses through thepressure, temperature and mechanical loads for each condition imposed.
It is therefore obvious why, when selecting the type of tubing for a completion, it is essentialto identify exactly what operations will be carried out in future to determine the consequentloads and thus the associated load conditions. A manual or computer programme is thenused to calculate and then ascertain whether the given tubing is able to withstand themaximum load with an acceptable safety level.
The operations normally carried out on a well for which the string control is necessary areillustrated below. These should be seen only as an example of load conditions as eachcase must be addressed individually as planned operations may vary.
It is important, in any case, to analyse the characteristics of each operation in order to beable to identify the heavier loads which may be imposed.
7.7.1. Pressure Testing
The very first load condition experienced during and after the installation of the completionstring is pressure testing. This involves applying predetermined test pressures to both thetubing and annulus. These pressures may be applied more than once during the installationoperation.
During the time taken to install the tubing, the completion will have warmed up to ambientwell conditions, therefore the only load applied is the pressure induced forces of pistoneffect buckling and ballooning. However, the designed test pressures should be equal to orgreater than any other subsequent pressures applied to the completion so the magnitude ishigh.
This may be of particular concern when using large bore tubing movement devices as theforces generated by the test pressure are greater than packer tubing seal arrangements.

ARPO
ENI S.p.A.Agip Division
IDENTIFICATION CODE PAGE 175 OF 295
REVISIONSTAP-P-1-M-7100 0
7.7.2. Acid Stimulation
Acid jobs are carried out to remove formation damage caused during drilling by the invasionof fluids and cuttings or to stimulate the formation by improving permeability. This operationis carried out by pumping a predetermined quantity of acid down the tubing to the formationat set pressures and flow rates.
From the point of view of the stresses exerted on the tubing string, the maximum pressureable to be applied at the well head must be considered in order to determine the rate of acidwhich can be applied, together with the temperature variations caused by the injection ofcolder fluid. It may be necessary in some cases, to reduce the loads on the tubing by pre-heating the acid in order to limit the thermal expansion and pressurising the annulus toreduce the tubing ballooning effect. Friction reducers may also be used to increase flow atthe same wellhead pressure, and decreasing the bottom hole pressure thus reducing theload.
It is important to monitor the pressure and temperature trends during the operation as theacid rate will probably increase due to the effect of the acid on the formation. This may leadto greater cooling down of the tubing with reduced pressures.
figure 7.s shows the pressure and temperature trends required to be known so as to ensurestress control of the string, according to the classical Lubinsky theory. Other data are oftenneeded for more complex calculations, using computer programmes, which, in Eni-AgipDivision and Affiliates case are in-house software which allows reproduction of the correcttemperature trend.
7.7.3. Fracturing
Fracturing involves the propagation of fractures in the formation for the improvement ofproductivity of hydrocarbons. These fractures reach from the well bore deep into reservoirand allows better drainage.
To carry out fracturing, the formation must be pressurised until one (or more) fractures arecreated. This entails obtaining in advance the injection parameters from various injectivitytests with increasing flow rates. The calculated flow rate is applied during the operation andthe pressure trend (which usually decreases when the fracture is created due to thereduction of load losses in the formation) is monitored.
With regard to the stresses on the string similar to acid stimulations, it is important to assessthe drop in temperature caused by the injection of colder fluid which, is carried out at highflow rates even though of short duration.
The pressures which can be attained, especially during the early injection stage, are higherthan that during acid jobs. At times during these early stages, in order to exceed thefracturing gradient, the maximum allowable pressure for some well head equipment may bereached. This equipment must therefore be protected using special isolating tools orprotection sleeves. To check the string design is suitable, the pressure and temperaturetrends can be plotted as shown by the previous example of the acid stimulation (figure 7.s),selecting the end of the operation as the final conditions but with a well head pressureequal to the maximum estimated.

ARPO
ENI S.p.A.Agip Division
IDENTIFICATION CODE PAGE 176 OF 295
REVISIONSTAP-P-1-M-7100 0
If during the initial stages of the operation, a significant break-down is forecast (by a markedreduction of pressure when the fracture is opened up in the formation). The latter conditionmay be too conservative, therefore two conditions should be checked; the first with highpressures without temperature variations, and the second with marked temperaturevariations and lower pressures.
Figure 7.S - Pressure and Temperature Trends During Fracturing
0
0
0 100 300
T (°F)
2500
5000
7500D (feet)
INITIAL CSG AND TBG - FINAL CSG
FINAL TBG
200
0 5000
P (psi)
2500
5000
7500D (feet)
FINAL TBG
INITIAL CSG
1500010000
FINAL CSG
INITIAL TBG

ARPO
ENI S.p.A.Agip Division
IDENTIFICATION CODE PAGE 177 OF 295
REVISIONSTAP-P-1-M-7100 0
7.7.4. Flowing
In this case it is not an operation carried out on the well but the normal flowing loadconditions to which the string is being subjected. It is therefore very important to establish,or at least approximate, the pressure and temperature profiles during the life of the well.
Different production situations will occur which cause changing load conditions; e.g.temperature differences between the beginning and end of the productive life or the need toincrease or decrease the flow rate for reasons external to the well.
Compared to the initial condition, the string undergoes temperature increases which causeelongation in the string. The resulting compressive forces may lead to the bucklingphenomena and even cause the tubing to exceed its elastic limit.
As shown in the diagrams of figure 7.t and figure 7.u, which give the pressure andtemperature bottom hole trends as a function of the depth at production start up and whenthe reservoir is depleted, external pressure may be greater than internal pressure, making itnecessary to ensure a collapse control of some sections.
7.7.5. Shut-In
Once a well is in production, it is necessary to interrupt production for maintenance or inorder to take some data measurements. This shut-in operation involves closing the wellduring which the well head pressure increases because the reservoir pressure rises to staticcondition, pressuring up the fluids in the tubing.
This load condition is considered critical as, at the moment of shut-in, the temperature ofthe string does not vary greatly due to the thermal inertia of the well. The situation is nowsimilar to that during production but with well head pressures which are greater and henceincrease the stresses on the string.
figure 7.u shows typical pressure and temperature trends after a shut-in.

ARPO
ENI S.p.A.Agip Division
IDENTIFICATION CODE PAGE 178 OF 295
REVISIONSTAP-P-1-M-7100 0
Figure 7.T - Pressure and Temperature Trends in Normal Production Conditions
0
0
0 100 300
T (°F)
2500
5000
7500D (feet)
FINAL TBG
INITIAL CSG E TBG - FINAL CSG
200
0 5000
P (psi)
2500
5000
7500D (feet)
FINAL TBG
INITIAL CSG - FINAL CSG
1500010000
INITIAL TBG

ARPO
ENI S.p.A.Agip Division
IDENTIFICATION CODE PAGE 179 OF 295
REVISIONSTAP-P-1-M-7100 0
Figure 7.U - Pressure and Temperature Trends in Depleted Reservoir Production Conditions
0
0
0 100 300
T (°F)
2500
5000
7500D (feet)
FINAL TBG
INITIAL CSG E TBG - FINAL CSG
200
0 5000
P (psi)
2500
5000
7500D (feet)
FINAL TBG
INITIAL CSG - FINAL CSG
1500010000
INITIAL TBG

ARPO
ENI S.p.A.Agip Division
IDENTIFICATION CODE PAGE 180 OF 295
REVISIONSTAP-P-1-M-7100 0
Figure 7.V - Pressure and Temperature Trends After Shut-In
0
0
0 100 300
T (°F)
2500
5000
7500D (feet)
FINAL TBG
INITIAL CSG AND TBG - CSG FINAL
200
0 5000
P (psi)
2500
5000
7500D (feet)
FINAL TBG
INITIAL CSG - FINAL CSG
1500010000
INITIAL TBG

ARPO
ENI S.p.A.Agip Division
IDENTIFICATION CODE PAGE 181 OF 295
REVISIONSTAP-P-1-M-7100 0
7.7.6. Load Condition Summary
The operations described above were chosen because they are the most common andshow which aspects of an operation must be known in order to determine which loads willhave to be considered to verify string design.
As shown in the examples above, it is important to be able to plot the pressure andtemperature trends of the casing and tubing on the two pressure/depth and temperature/depth diagrams for the moment before the packer is set (initial conditions) and at the end ofthis operation (final condition) or, in any case, during the stage considered most critical asregards the loads applied.
Using the above diagrams, and knowing the completion configuration, the relative loads onthe sections of the string can be calculated, generally this is greatest in the section abovethe packer and below the well head. If the string is tapered or has one, or more,intermediate packers, it will be necessary during the control stage to know the pressure andtemperature data of all the packers and of the tubing cross-section variations and is goodpractice to plot these data on diagrams.
7.8. TUBING SELECTION
The tubing string selection procedure and subsequent stress analysis is fundamental to thecompletion design process as it is during these two stages, that the optimum solution isfound through a sequence of approximations. By using an iterative method, i.e. by choosingand verifying the various possibilities, the correct safety factor for all the calculated loadconditions expected during the life of the well, can be obtained.
The Eni-Agip Division and Affiliates approach to choosing the tubing string is similar to thatfollowed when designing any other mechanical part. A draft design is considered based onthe expected well conditions and then this design is checked to obtain the safety factor(s).Alterations are then made to the draft completion until the ideal safety factor, which maydiffer depending on the local environmental conditions and on some parameters discussedbelow, is reached.
Since the economic factor plays a primary role of importance when selecting a completion,it is necessary to assess all the various possible solutions. A typical example is that of wellswith the presence of corrosive agents where either strings and down hole equipment can bemade in Corrosion Resistant Alloy (CRA) or carbon steel with inhibitors injected downholecan be used. In both cases the problem of completing the well is solved but it is necessaryto verify both cost and whether it is better to use on CRA, avoiding future workovers or if itis more economical to use carbon steel with an inhibition system and scheduled workovers.

ARPO
ENI S.p.A.Agip Division
IDENTIFICATION CODE PAGE 182 OF 295
REVISIONSTAP-P-1-M-7100 0
7.8.1. Critical Factors
The main factors driving the choice of the string are described below. Taking intoconsideration the well conditions, it is then possible to identify the optimum mechanicalsolutions.
Materials
The choice of material for the tubing string depends mainly on the well environment, interms of all the mechanical stresses and corrosivity of the fluids.
In general, the ideal material is determined by the results of corrosion studies carried outprior to the tubing design stage, especially when the severity of the conditions suggest theuse of expensive CRA materials (Refer to section 6).
With regard to corrosion studies, it is always necessary to determine, the exact quantities ofH
2S, CO
2, chlorides and water from production tests and to enter these data into an expert
system, or for a quicker choice, using the engineering diagrams supplied by manufacturers.
However, this method does not provide a solution to using carbon steel in conjunction withan inhibition system. In this case, it is best to base the choice on an appropriate corrosionstudy which takes into account many other parameters, e.g. thickness of the corrosionproduct, economics, frequency of workovers, etc.
Once the choice of materials has been identified, it will be necessary to take intoconsideration their mechanical properties to ensure that a suitable factor can be verified inthe subsequent stress analysis stage. Indeed, to complete a well with the presence ofcorrosive agents (H2S and/or CO2) the use carbon steel with controlled hardness and/ormartensitic steel, is often sufficient though these only reach a maximum grade of T95 (95ksi yield) therefore do not always meet with stress requirements in high pressures and greatdepth.
When CRA steels are used (which must be cold worked in order to obtain the requiredmechanical characteristics), the possibility of anisotropies must be checked into as theygenerally imply a lower compressive yield load than tensile yield load and correspondingreductions for their use at high temperatures. The presence of residual tension may inducestress corrosion and over-stressing problems which must also be taken into consideration.
7.8.2. Tubing Size And Weight
One of the main elements of the completion string design process, is the choice of the size,wall thickness and grade of tubing which is optimum to requirements, outlined below. Theinside and outside diameter of the tubing, and if the string has more than one size of tubingas in a tapered string, the length of each section needs to be determined at this point.
Given that the dimensions of the tubing and components of the string (safety valves,landing nipples, etc.) must fit inside the production casing and/or liner, it is essential toestablish the size in order to find out if it impacts on the casing design.
Note: It is vital that any detrimental impact caused by the casing programme isdiscussed with the drilling engineers to solve any problems, whether thisentails changes to either the casing programme or the completion design.

ARPO
ENI S.p.A.Agip Division
IDENTIFICATION CODE PAGE 183 OF 295
REVISIONSTAP-P-1-M-7100 0
The first indications of tubing size obtained is from tubing inflow performance analysis.These studies can generally be completed quickly using Eni-Agip Division and Affiliatessoftware which directly provides the diameters of tubing for the expected flow rates andprojected rates, which take into account the type of fluid, surface pressures, bottom holepressures and other parameters. Calculation of the tubing inflow performance is verycomplicated and time consuming in most cases and is not covered in this manual.
Once the projected size of the tubing is established for the required flow rate then in gas, orgas condensate wells, it is necessary to calculate the velocities in the string duringproduction. This rate must be lower than the rate at which erosion occurs. These thresholdvelocities can be found in API RP 14E.
The most important value to be decided on the selected tubing is its mechanical strength.As explained in the following section, the loads resulting from the various load conditions(acid jobs, production, etc.) applied to the selected string, the safety factor under theseloads against the yield strength are calculated. Once this calculation has been made, it maybe necessary to increase the weight or grade because the string is too weak. In someparticular situations non-traditional solutions must be chosen as some parameters, such ascost, limit the choices. In the case of a very expensive super austenitic steel string forexample, it may be more appropriate to choose more structurally efficient solutions whichuse a tapered string with different diameters thus reducing the amount of material neededand therefore the cost.
Wells in which hydrocarbons containing corrosive agents are produced are sometimescompleted using carbon steel and it is accepted that a certain amount of the material will belost through corrosion during the life of the well. The strings of these wells, which generallywill be equipped with a corrosion inhibitor injection system, should therefore have addedthickness so as to have sufficient material to last until the scheduled workover. The twocases; i.e. the new string (maximum thickness, maximum weight) and the workover stage(minimum thickness, minimum weight) must both be taken into consideration whencalculating the string’s stress resistance. It is prudent in such cases to reduce throughtubing interventions which knock off the corrosion exposing fresh material and, hence,faster wall thickness reduction.
When choosing the thickness of the tubing forming the string, it is useful to consider thethickness tolerance adopted by the manufacturer of the selected tubing. API standards forcarbon steels define a 12.5% eccentricity tolerance which means one point on the tubing’scircumference probably has less thickness. This value for CRA tubing’s is often only 10%.which provides a better safety factor under similar conditions. Another reduction ofthickness which must be taken into account on used tubing, may be due to repairs, bygrinding, carried out to remove tong marks.
The above factors can often lead to a variety of solutions, so it is necessary to evaluateeach one in order to obtain the most suitable solution in terms of cost, mechanical strengthand practical feasibility.

ARPO
ENI S.p.A.Agip Division
IDENTIFICATION CODE PAGE 184 OF 295
REVISIONSTAP-P-1-M-7100 0
7.8.3. Anchoring Systems
As illustrated earlier, the operations carried out during the life of a well cause movement ofthe tubing string which can depend on the type of tubing/packer seal system used betweenthe bottom of the tubing and the packer, will generate different loads in the string will begenerated.
From figure 7.w, which shows the three most common types of packer/tubing systems, it isclear from this that the least severe system is where the tubing seal assembly is free tomove in the packer bore. This system does, however, have some disadvantages which areoften unacceptable such as dynamic seals.
In very deep wells, with high pressures and temperatures the movements of the lower endof the tubing may reach several feet in magnitude and hence very long seal units wouldneed to be used in the packer which brings related assembly and protection problemsduring running in. Another important problem of free tubing, is the continuous movement ofthe seal elastomers which may become damaged due to wear or from the debris depositedin the annulus above the packer.
The best solution, due to the use of static seals, is systems to screw the tubing to thepacker using a threaded connection on retrievable packer systems or to a tubing anchor(which allows the packer to be released when necessary) on permanent packer systems.This type of anchoring provides the solution to seal life, but leads to greater stressing of thetubing string. In preference, the free moving system is the first choice and if the loads itcreates do not allow for a suitable safety factor during well operations are other systemsconsidered.
Free Movement Limited DownwardMovement
Attached
Figure 7.W - Tubing/Packer Systems
The second preference is where downward tubing movement is restricted i.e. using a No-Go locator shoulder fitted above the seal assembly where it is positioned to prevent theelongation of the string while leaving it free to shorten.
This will reduce movement of the packer seal assembly by eliminating downward movementand upward movement would only occur in certain limited lead conditions (stimulations orfracturing). This will extend seal life.

ARPO
ENI S.p.A.Agip Division
IDENTIFICATION CODE PAGE 185 OF 295
REVISIONSTAP-P-1-M-7100 0
7.9. TUBING CONNECTIONS
The Eni-Agip Division and Affiliates policy for tubing connections is that ‘the use of premiumconnections is mandatory’. In conjunction Eni-Agip Division and Affiliates alsorecommended that a premium connection be used for production casings and productionliners, especially when the annulus is to be used for gas lift or an underbalance fluid is usedas a completion fluid.
7.9.1. Policy
• The use of premium connections for tubing is mandatory.• The use of premium connections for production casing is advised but not
mandatory.
The connections to be used shall be qualified according to the requirements as set in theEni-Agip Division and Affiliates procedure ‘Connection Procedure Evaluation’.
7.9.2. Class of Service
According to the specification STAP M-1-M 5006 ‘Connection Procedure Evaluation’, thereare two service classes, I and II, termed Application Levels (AL). Application Level I appliesto the most severe service conditions.
To date three tubing connections have been qualified for the most severe conditions ALI.They are :
Coupled Connections
AMS 28 ( manufacturer Dalmine)
Vam ACE ( manufacturer Vallourec and Sumitomo)
Integral Connections
Eni-Agip Division and Affiliates A-DMS (Dual Metal Seal)
Other connections like Hydril CS, PJD Dalmine and Antares MS have not yet beensubjected to the complete qualification programme as per STAP M-1-M- 5006 or API 5C5.They have however been used successfully for years with good results. They may be usedfor all service condition where an Application Level II connection is required.

ARPO
ENI S.p.A.Agip Division
IDENTIFICATION CODE PAGE 186 OF 295
REVISIONSTAP-P-1-M-7100 0
7.9.3. Selection Criteria
The following are the selection criteria for connections used in different types of wells andoperating conditions.
Work string or well testing string:
Integral AL1 connection shall be used
Horizontal wells with Build up ≥ 20°/100 feet:
Integral AL1 connection should be used
Wells with TVD ≥ 4500m:
Integral AL1 connection shall be used
Producing Oil And Gas Wells (TVD < 4500m)
Criteria Requirement
NACE no no yes yes
Close Proximity yes no yes no
Differential WP 0 - 4000 psi AL II AL II AL I AL II
Differential WP 4000 - 8000 psi AL I AL II (*) AL I AL I
Differential WP over 8000 psi AL I AL I AL I AL I
(*) For Gas Injection wells, AL I
Table 7.A - Connection Specification
Storage/Injection Gas Wells (TVD < 4500m)
Criteria Requirement
Differential WP 0 - 4000 psi AL I
Differential WP 4000 - 8000 psi AL II
Table 7.B - Connection Specification

ARPO
ENI S.p.A.Agip Division
IDENTIFICATION CODE PAGE 187 OF 295
REVISIONSTAP-P-1-M-7100 0
Water Injection Wells (TVD < 4500m)
Criteria Requirement
Differential WP 0 - 4000 psi AL II
Differential WP 4000 - 8000 psi AL II
Table 7.C - Connection Specification
A flow chart reaffirming the above is shown in figure 7.x.
Note:
Section 7.9.4 explains the NACE and Close Proximity definitions.
Differential working pressure is the maximum differential pressure (internal and/or external)to which the production string is subjected during the life of the well.

ARPO
ENI S.p.A.Agip Division
IDENTIFICATION CODE PAGE 188 OF 295
REVISIONSTAP-P-1-M-7100 0
Figure 7.X - Connection Application Level Selection Flow Chart

ARPO
ENI S.p.A.Agip Division
IDENTIFICATION CODE PAGE 189 OF 295
REVISIONSTAP-P-1-M-7100 0
7.9.4. NACE And Proximity Definitions
NACE Requirement
This applies to the partial pressure of hydrogen sulphide (H2S) in the produced fluid asdefined by NACE Standard MR 01-75.
Close Proximity
A proximity assessment should be prepared to consider the potential impact of anuncontrolled well flow condition on the life of personnel and the environment around thewellhead. The following list of criteria can be used for determining this potential risk. Othercriteria for consideration should be included when necessary.
100ppm Radius of Exposure (ROE) of H2S is greater than 50ft. from the wellhead and in-cludes any part of a public area except a public road.
Public area shall mean a dwelling, place of business, church, school, hospital, school busstop, government building, a public road, all or any portion of a park, city, town, village, orother similar area that one can expect to be populated. Public road shall mean any federal,state, county or municipal street or road owned or maintained for public access or use.
500ppm ROE of H2S is greater than 50ft. from the wellhead and includes any part of apublic area including a public road.
• Well is located in any environmentally sensitive area such as parks, wildlifepreserve, city limits, etc.
• Well is located within 150ft. of an open flame or fired equipment.• Well is located within 50ft. of a public road (lease road excluded).• Well is located in state waters.• Well is located in or near inland navigable waters• Well is located in or near surface domestic water supplies.• Well is located within 350ft of any dwelling.
These conditions are recommended minimum considerations. It will be necessary to meetany other local regulatory requirements.
Texas Railroad Commission Rules
The following information is taken from Texas Railroad Commission Rule 36:
For determining the location of the 100ppm radius of exposure:
X = [(1.589) (mole fraction H2S) (Q)] 0.6258
For determining the location of the 500ppm radius of exposure:
X = [(0.4546) (mole fraction H2S) (Q)] 0.6258

ARPO
ENI S.p.A.Agip Division
IDENTIFICATION CODE PAGE 190 OF 295
REVISIONSTAP-P-1-M-7100 0
where: X = Radius of exposure in feet
Q = Maximum volume determined to be available for escape in cubic feet per day.
H2S = Mole fraction of hydrogen sulphide in the gaseous mixture which couldescape.
The volume used as the escape rate in determining the radius of exposure shall be thatspecified below, as is applicable:
For the new wells in developed areas, the escape rate shall be determined by using thecurrent adjusted open-flow rate of offset wells, or the field average current adjusted open-flow rate, whichever is the larger.
The escape rate used in determining the radius of exposure shall be corrected to standardconditions of 14.65psia and 60oF.
When a well is in an area where insufficient data exists to calculate a radius of exposure,but where hydrogen sulphide may be expected, a 100ppm radius of exposure equal to3,000ft shall be assumed.
7.9.5. CRA Connections
For steels with a high chrome content (>13%), there is a tendency to gall during make up.This requires special surface treatment in the connection’s pin and box. The anti-gallingtreatments (e.g. Bakertron or copper plating) is always applied to the couplings to ensurethe utmost coating, hence protection.
7.9.6. Connection Data
Data on tubing connections are available from API specifications and tables in industryhandbooks.
7.10. TUBING STRESS CALCULATIONS
The final stage of the completion string design is the calculation of stress in areas under thehighest loads. After these calculations are made, it is possible to determine how close thestresses are to the material’s yield strength.
At this point of the process all the possible elements needed for the design verification areavailable; i.e. information about the load conditions, the type of tubing and materials to beused to meet the requirements outlined in section 6.8.
Using the calculation theory illustrated previously, it is possible to calculate the forces actingon the packer, Fp, and consequently, the fictitious and piston forces in the string sections.
During the verification stage it may be seen that the loads on the string are unacceptablyhigh. The string or load conditions or the tubing strength must therefore be altered until thecalculation produces an appropriate safety factor (SF). Computer programmes are veryuseful in this phase as it is possible to make repeated calculations quickly with differentparameters.

ARPO
ENI S.p.A.Agip Division
IDENTIFICATION CODE PAGE 191 OF 295
REVISIONSTAP-P-1-M-7100 0
7.10.1. Calculation Methods
Taking, as an example, the type of completion shown in figure 7.y, the sections where thestring design must be verified are indicated by x-x at the well head and y-y at the downholejust above the packer. For other types of completions, string design must be verified at allthe appropriate sections where there are variations in diameter, have intermediate packersor other discontinuities.
With reference to figure 7.y, the tables below summarise the forces acting on the sectionsof the string which will be used for the design verifications. The asterix distinguishes theforces calculated in a completion with the string anchored to the packer verses thosecalculated for a string free to move in the seal bore.
Section Y-Y (Packer)
Tubing-Packer Mode Piston Forces Fictitious Forces
Free tubing Fa Ff
Tubing permitting limited motionand anchored
paa FFF +=*pff FFF +=*
Table 7.D - Forces at Y-Y
Section X-X (Well Head)
Tubing-Packer Mode Piston Forces Fictitious Forces
Free tubing LwFF satpa −= wLFF ftpf −=
Tubing permitting limited motionand anchored
LwFF satpa −= ** wLFF ftpf −= **
Table 7.E - Forces at X-X
As can be seen, the forces at the well head coincide with those at the packer depth if L = 0.Therefore, to calculate forces on intermediate sections between the well head and packerdepth, it is sufficient to use an intermediate length ‘l’ ( L > l > 0 ) measured from the packer,instead of ‘L’ of the previous formulae.

ARPO
ENI S.p.A.Agip Division
IDENTIFICATION CODE PAGE 192 OF 295
REVISIONSTAP-P-1-M-7100 0
Figure 7.Y - Example Completion #1
The piston forces obtained in this way are used to calculate the axial stress which is givenby the expression:
s
aa
A
F=σ
The fictitious force is used to calculate the axial stress caused by the tubing bending whenhelically buckled, it is given by the expression:
fb FI
Dr
4=σ
therefore, σb is calculated only if the section of the string to be verified is buckled.
Y Y
X X

ARPO
ENI S.p.A.Agip Division
IDENTIFICATION CODE PAGE 193 OF 295
REVISIONSTAP-P-1-M-7100 0
Now all the factors needed to determine the equivalent stress σa, σb, Po and Pi areavailable, i.e. the stress which, by applying suitable criterion (for the materials used in the oilindustry the most appropriate is Von Mises), allows comparison of the stresses due to thedifferent effects in a particular section of the string against the material yield stress rating.
In this case the equivalent force will be the greater of the two, calculated using theexpression below, which gives the equivalent stresses in the outside and inside wall of theconsidered tubing section.
2
2
22
2 113
±+
−−
+
−−
= baoioi
oR
PRP
R
PP σσσ
( ) 2
2
22
2
2
113
±+
−−
+
−−
=RR
PRP
R
PPR ba
oioii
σσσ
As stated above, if the section to be calculated is buckled, both calculations must be madeto determine the higher of the two values while, if there is no buckling σb = 0 and the greaterstress is that in the inside wall, the equivalent stress is σeq = σi
The higher of the stress values determined above will make it possible to obtain the SF ofthe string for the load conditions and the section considered:
eq
sn
σσ
=SF
The SF must be greater than the minimum dictated by policy and listed in section 7.1 whichgives the SF values to be used by Eni-Agip Division and Affiliates.
7.10.2. Safety Factor
A completion string’s safety factor is defined as the ratio between the yield stress and themaximum value of the stress obtained as described above. It, therefore, provides a quickreference parameter to evaluate the magnitude of the stresses present in the tubingcompared to the maximum acceptable.
To calculate the SF the yield limit values of the material are taken into consideration so thatthere is no permanent corkscrewing of the string which could jeopardise, even if onlyslightly, its functionality.
The Eni-Agip Division and Affiliates policy is to apply different types of material due to theirdifferent mechanical behaviours and resistance to corrosion.
Carbon and CRA Steels up to 13%Cr
The acceptable SF for these types of materials is:
1.25
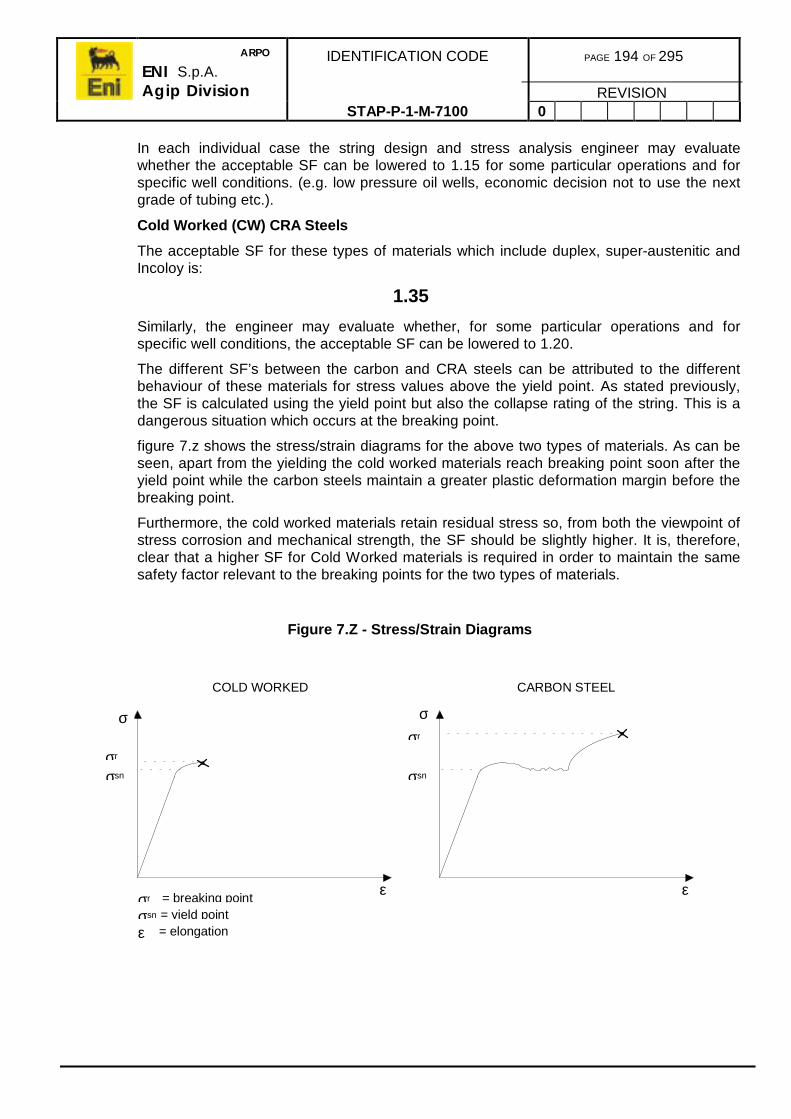
ARPO
ENI S.p.A.Agip Division
IDENTIFICATION CODE PAGE 194 OF 295
REVISIONSTAP-P-1-M-7100 0
In each individual case the string design and stress analysis engineer may evaluatewhether the acceptable SF can be lowered to 1.15 for some particular operations and forspecific well conditions. (e.g. low pressure oil wells, economic decision not to use the nextgrade of tubing etc.).
Cold Worked (CW) CRA Steels
The acceptable SF for these types of materials which include duplex, super-austenitic andIncoloy is:
1.35
Similarly, the engineer may evaluate whether, for some particular operations and forspecific well conditions, the acceptable SF can be lowered to 1.20.
The different SF’s between the carbon and CRA steels can be attributed to the differentbehaviour of these materials for stress values above the yield point. As stated previously,the SF is calculated using the yield point but also the collapse rating of the string. This is adangerous situation which occurs at the breaking point.
figure 7.z shows the stress/strain diagrams for the above two types of materials. As can beseen, apart from the yielding the cold worked materials reach breaking point soon after theyield point while the carbon steels maintain a greater plastic deformation margin before thebreaking point.
Furthermore, the cold worked materials retain residual stress so, from both the viewpoint ofstress corrosion and mechanical strength, the SF should be slightly higher. It is, therefore,clear that a higher SF for Cold Worked materials is required in order to maintain the samesafety factor relevant to the breaking points for the two types of materials.
Figure 7.Z - Stress/Strain Diagrams
ε
σ
ε
σ
COLD WORKED CARBON STEEL
σr
σsn
σr
σsn
σr = breaking point
σsn = yield point
ε = elongation
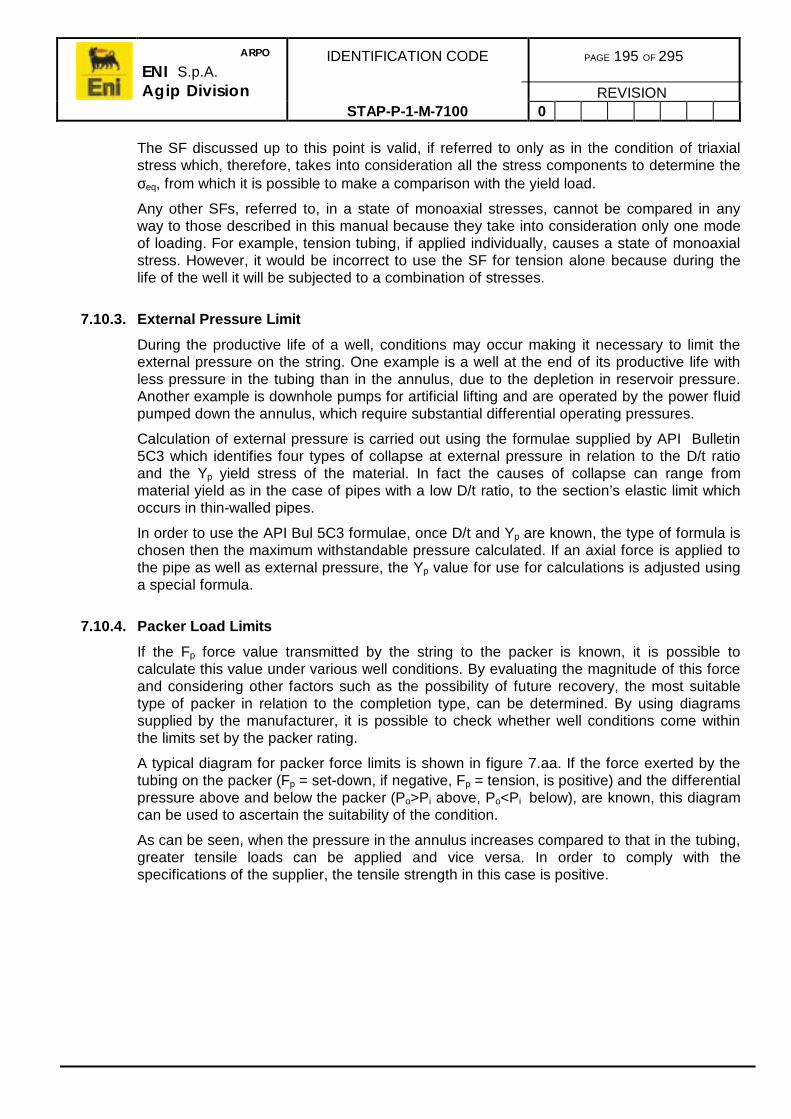
ARPO
ENI S.p.A.Agip Division
IDENTIFICATION CODE PAGE 195 OF 295
REVISIONSTAP-P-1-M-7100 0
The SF discussed up to this point is valid, if referred to only as in the condition of triaxialstress which, therefore, takes into consideration all the stress components to determine theσeq, from which it is possible to make a comparison with the yield load.
Any other SFs, referred to, in a state of monoaxial stresses, cannot be compared in anyway to those described in this manual because they take into consideration only one modeof loading. For example, tension tubing, if applied individually, causes a state of monoaxialstress. However, it would be incorrect to use the SF for tension alone because during thelife of the well it will be subjected to a combination of stresses.
7.10.3. External Pressure Limit
During the productive life of a well, conditions may occur making it necessary to limit theexternal pressure on the string. One example is a well at the end of its productive life withless pressure in the tubing than in the annulus, due to the depletion in reservoir pressure.Another example is downhole pumps for artificial lifting and are operated by the power fluidpumped down the annulus, which require substantial differential operating pressures.
Calculation of external pressure is carried out using the formulae supplied by API Bulletin5C3 which identifies four types of collapse at external pressure in relation to the D/t ratioand the Yp yield stress of the material. In fact the causes of collapse can range frommaterial yield as in the case of pipes with a low D/t ratio, to the section’s elastic limit whichoccurs in thin-walled pipes.
In order to use the API Bul 5C3 formulae, once D/t and Yp are known, the type of formula ischosen then the maximum withstandable pressure calculated. If an axial force is applied tothe pipe as well as external pressure, the Yp value for use for calculations is adjusted usinga special formula.
7.10.4. Packer Load Limits
If the Fp force value transmitted by the string to the packer is known, it is possible tocalculate this value under various well conditions. By evaluating the magnitude of this forceand considering other factors such as the possibility of future recovery, the most suitabletype of packer in relation to the completion type, can be determined. By using diagramssupplied by the manufacturer, it is possible to check whether well conditions come withinthe limits set by the packer rating.
A typical diagram for packer force limits is shown in figure 7.aa. If the force exerted by thetubing on the packer (Fp = set-down, if negative, Fp = tension, is positive) and the differentialpressure above and below the packer (Po>Pi above, Po<Pi below), are known, this diagramcan be used to ascertain the suitability of the condition.
As can be seen, when the pressure in the annulus increases compared to that in the tubing,greater tensile loads can be applied and vice versa. In order to comply with thespecifications of the supplier, the tensile strength in this case is positive.

ARPO
ENI S.p.A.Agip Division
IDENTIFICATION CODE PAGE 196 OF 295
REVISIONSTAP-P-1-M-7100 0
Figure 7.AA - Typical Packer Force Limit Diagram
7.10.5. Example Manual Calculation
As an example of applying the method detailed above, we can consider the singlecompletion in the well shown in figure 7.bb. During a cement squeeze operation, theanalysis of the possible packer/tubing configurations available in this set-up is free tubing topacker and fully anchored. This allows calculation of the variations in length and thereafterthe anchoring force in the packer.
Data:
Tubing 2 7/8in 6.5lb/ft : Ai = 4.68in2
Ao = 6.49in2
As = 1.81in2
R = 1.178ws = 0.542lb/inI = 1.61in4
σsn = 80,000psi
Casing 7in 32lb/ft: ID = 6.094inr = 1.61in
Packer bore: Dpb = 3.25inAp = 8.3in2
Length of string: L = 10,000ft = 120,000in
400
300
200
100
0
-100
-200
-20 -10 0 10 20
(set
-dow
n)
FO
RC
E
(te
nsio
n)(T
hous
ands
)
(Thousands)(above) PRESSURE DIFF. (below)
Safety zone

ARPO
ENI S.p.A.Agip Division
IDENTIFICATION CODE PAGE 197 OF 295
REVISIONSTAP-P-1-M-7100 0
Initial Conditions
Initially both the tubing and the annulus are filled with 30° API oil, while the temperature is60°F at the well head and 200°F at the bottom hole. figure 7.cc shows the pressure andtemperature variations against depth. It should be noted that 30° API corresponds to aspecific gravity of 0.0317lb/in3 and, therefore, to a pressure gradient of 0.38 psi/ft.
Final Conditions
Final conditions are cement displacement with a specific gravity of 15lb/gal, obtained bypressurising the tubing at 5,000psi and the casing at 1,000psi. This operation causes thestring to cool to 160°F at the bottom hole and creates the pressure and temperature trendshown in figure 7.cc (15lb/gal corresponds to a specific gravity of 0.0649lb/in3 and to apressure gradient of 0.7795psi/ft).
Figure 7.BB - Example Completion #2
Y Y
X X

ARPO
ENI S.p.A.Agip Division
IDENTIFICATION CODE PAGE 198 OF 295
REVISIONSTAP-P-1-M-7100 0
Figure 7.CC - Initial and Final Condition (Example #2)
Calculation Method
a) Calculation of variations in length
The variation in the piston force between initial and final conditions is expressed by:
( ) ( )opoipia AAPAAPF −∆−−∆=∆
( ) ( )lb9.30751
49.63.8100068.43.88995
=−−−=
P (psi) T (°F)O O
D (feet) D (feet)3800
10000 10000
CSG e TBG
P (psi)O 5000
10000
FINAL CONDITIONS
1000
4800 12795
D (feet)
60
200
T (°F)O
D (feet)
10000
60
160
GEOTERMICO
CSG
TBG
SQUEEZE

ARPO
ENI S.p.A.Agip Division
IDENTIFICATION CODE PAGE 199 OF 295
REVISIONSTAP-P-1-M-7100 0
so the variation in length according to Hooke’s Law (piston force) is given by:
in9667
811x30000000
120000x9307511
.
.
.
AE
LFL
s
a
−=
−=−=
The fictitious force, which is initially zero because Pi = Po, is given by:
( )( )
lb5.66358
480012795x3.8
=−=
−= oipf PPAF
As this value is positive, then the string is buckled, so it is necessary to determine theposition of the neutral point in order to calculate the ∆L2.
The weight of string, w, fully immersed in fluids, is calculated in the following way:
lb/in3037.0
0649.0x68.4
==
= fiifi Aw γ
lb/in2057.0
0317.0x49.6
==
= foofo Aw γ
lb/in640.0
20567.03037.0542.0
=−+=
−+= fofis wwww
The neutral point from the bottom hole is therefore:
in16.103685640.0
5.66358
=
=
=w
Fn
f
As this distance is less than the length of the string, not all the string is buckled.
The variation in length ∆L2, is calculated using the first of the two formulae in section 7.4.2.
( )
16.46
64.106.13000000085.6635861.1
wlE8rF
L
2
22
2
−=×××
×−−=
−=∆

ARPO
ENI S.p.A.Agip Division
IDENTIFICATION CODE PAGE 200 OF 295
REVISIONSTAP-P-1-M-7100 0
As regards the variation in length due to ballooning, the average variations in pressurealong the string can be calculated using the formulae in section 7.4.3:
( ) ( )
psi5.69972
38001279505000
=
−+−=∆ imP
( ) ( )
psi10002
3800480001000
=
−+−=∆ omP
Therefore, the variation in length caused by ballooning is as follows:
LR
PRP
EL omim x
1
xx
22
2
3 −∆−∆
−=∆ν
( )( )
120000x1178.1
1000x178.15.6997x
30000000
3.022
2
−−−= x
73.34−= in.
As regards the variation in length due to temperature, the formula in section 7.4.4, is usedto calculate the average variation in temperature along the string:
( ) ( )2
2001606060 −+−=∆ MT
20−= °F
The variation in length is therefore:
( ) 120000x20x10x9.6 6
4
−=
∆=∆−
LTL Mα
56.16−= in.
The variation in total length of the tubing, if the tubing can freely move in the packer-bore, istherefore given by
14321 LLLLLtot ∆+∆+∆+∆=∆
4.165−= in.

ARPO
ENI S.p.A.Agip Division
IDENTIFICATION CODE PAGE 201 OF 295
REVISIONSTAP-P-1-M-7100 0
b) Tubing Permitting Limited Motion
The variation in length calculated above, may sometimes be unacceptable, as it wouldcreate seal assembly lengths which are not practicable for the planned type of completion.One method for containing these elongations is to use a tubing permitting limited motion, asit off-loads weight on the packer after it is set (slack-off) and compresses the string. Theslack-off operation modifies the variations in length the string will undergo during thesubsequent cement squeeze stage as shown below.
During initial conditions, oil is the fluid inside the tubing and so:
0317.0x68.4=
= fiifi Aw γ
1483.0= lbs/in
fofis wwww −+=
20575.01483.0542.0 −+=
48.0= lbs/in.
Assuming that the slack-off force off loaded on the packer is 20,000lb, the neutral point islocated as:
in.4.41266485.0
20000
=
=
=w
Fn so
from the bottom of the string.
As this value is less than the total length of the string, it makes it possible to use the formulain section 7.6 in order to obtain:
( )
in.73.49
485.0x61.1x30000000x8
20000x61.1
81.1x30000000
120000x20000
82
22
−=
−−=
−−=∆wIE
rF
AE
LFL so
s
soso
The variation in the length of the string during the cement squeeze job, when there is atubing permitting limited motion is given by:
in.68.115
)73.49(41.165
−=−−−=
∆−∆=∆ sototsotot LLL
As can be seen, this value is lower than that calculated for a free tubing.

ARPO
ENI S.p.A.Agip Division
IDENTIFICATION CODE PAGE 202 OF 295
REVISIONSTAP-P-1-M-7100 0
c) Anchored tubing
If we assume a condition obtained with a tubing which only permits limited motion, giving∆Ltot
so = -115.68 in. This value may still be unacceptable so it is necessary to use anchoringin both directions. In this case as slack-off after setting the packer is present it is necessaryto determine the force required to position the end of the tubing in the packer (Fp), thussetting the elongation ∆Lp =-∆Ltot
so =115.68 in .
Figure 8.6 shows the diagram obtained using the formulae which supplies theforce/elongation characteristic for tension and compression. When the data of the exampleare replaced, the formulae below are obtained (the diagram can be quickly plotted byentering any F values and calculating the corresponding ∆L):
5.452
FL −=∆ [in] for F<0
954037275.452
2FFL −−=∆ [in] for F >0 .
If the diagram is plotted with the value of the fictitious force calculated previously(66358.5lbs), it is possible to identify the point where the origin of the axes has moved to.From this point, movement in the direction of elongation by a ∆Lp value is made in order tolocate the point which is distant from the curve by a Fp value. As figure 7.cc shows, Fp = -37000lbs, so the string is subject to stress at its lower end which is equal to 37,000lbs andthe packer is forced upwards by the same amount.
d) Tubing Stress Control
If we consider a tubing anchored to the packer during a cement squeeze operation, with aslack-off of 20,000lbs, the fictitious and piston forces, calculated according to section 7.6,are:
( ) ( )in.629
0
*
=
+−−−=
+=
popipi
paa
FAAPAAP
FFF
lb29358
*
=
+= pff FFF

ARPO
ENI S.p.A.Agip Division
IDENTIFICATION CODE PAGE 203 OF 295
REVISIONSTAP-P-1-M-7100 0
In the section above the packer (figure 7.bb), the forces at the well head are:
in.64371
10000x5.6629
x**
−=−=
−= LwFF satpa
in.47442
120000x64.029358
x**
−=−=
−= LwFF ftpf
Figure 7.DD - Anchored Tubing (Example #2)
-200 Ff
80 100
-20
-100
-50
-150
50
100
∆Lp
Fp
compressione[lbx1000]
compressione[lbx1000]
trazione[lbx1000]
allu
ngam
enti
[in]
acco
rcia
men
ti[in
]
allu
ngam
enti
[in]
-40
40 6020
4020

ARPO
ENI S.p.A.Agip Division
IDENTIFICATION CODE PAGE 204 OF 295
REVISIONSTAP-P-1-M-7100 0
Bottom Hole
The piston force generates an axial stress equal to:
psi34781.1
629
*
=
=
=s
aa
A
Fσ
the deformation due to buckling generates an axial stress equal to:
psi21095
61.1x4
29358x61.1x875.2
4*
=
=
= fb FI
rDσ
If we replace the σa e σb, values, along with Pi = 12795 psi e Po = 4800 psi, the valuesbelow are obtained using the formulae in section 7.10:
σo = 51688psi
σi = 60223psi ,
therefore, if we consider the highest value found as equivalent force, the result is σeq = σi,we can obtain the following bottom hole safety factor:
33.160223
80000
=
=
=eq
snSFσσ
Well Head
As Ff*tp < 0 the string at the well head is not buckled, σb = 0 and the greatest amount of
stress is generated on the inner wall of the tubing:
psi3556481.1
64371
*
−=
−=
=s
tpa
aA
Fσ

ARPO
ENI S.p.A.Agip Division
IDENTIFICATION CODE PAGE 205 OF 295
REVISIONSTAP-P-1-M-7100 0
If we replace the σa value obtained and as pi = 5,000psi and po = 1,000psi, the value belowis obtained using the formula in section 7.10:
σi = 36117 psi
therefore as σeq = σi, , the well head safety factor is:
21.236117
80000
=
=
=eq
snSFσσ
The safety factor for the cement squeeze operation results as the lowest of obtainedvalues, therefore:
SF = 1.33
This value is acceptable because the lower limit for a carbon steel string is 1.25.
7.10.6. Example Computation
As an example we have included two cases of string calculations, carried out using theWellcat programme supplied by Enertech. The first example is the same as that dealt withby Lubinsky. The second is a case history, analysed during completion studies for theVillafortuna-Trecate field. Particular attention should be paid to data entry and presentationof results in order to obtain knowledge of how the programme handles these two cases.For a description of the programme’s general functions, please refer to the notes inAppendix D and the user’s manual available in the Company’s library.
Examples done with the Vertubing programme, have been deliberately omitted as thisprogramme is no longer used by Eni-Agip Division and Affiliates. Therefore only a briefdescription has been given in Appendix D. For further information please refer to the user’smanual.

ARPO
ENI S.p.A.Agip Division
IDENTIFICATION CODE PAGE 206 OF 295
REVISIONSTAP-P-1-M-7100 0
8. SUB-SURFACE EQUIPMENT
8.1. PACKERS
The types of packer systems and applications have already been described in section 5.3.1.This section defines the series of criteria for choosing packer characteristics to apply tosingle and selective completions.
The packers considered are listed in table 8.a below. The proposed criteria for the choiceonly take into consideration general technical aspects and do not cover the individualcharacteristics of particular models or tools, while still reflecting the needs which lead toselection of the most commonly used models.
Once the packer type and model have been defined, the next stage is establish itsperformance to meet with all the expected operating conditions (applied force and pressuredifferences). For this reason regarding permanent packers, reference is made to theoperating ‘Envelopes’; i.e. operating diagrams for the packers supplied by the manufacturerof the particular packer and to the pressure ratings for retrievable packers.
Type Of Packer Setting Method Setting Tool Sealbore Features
Permanent Mechanical • Hydraulic setting tool
• Electric line
• Std/Large/Dual
• Std/Large/Dual
Hydraulic N/A Std/Dual
Permanent/Retrievable
Mechanical N/A Std/Large/Dual
Hydraulic N/A Std/Dual
Retrievable Hydraulic N/A
Hydrostatic N/A
Weight N/A
Table 8.A - Packer Types

ARPO
ENI S.p.A.Agip Division
IDENTIFICATION CODE PAGE 207 OF 295
REVISIONSTAP-P-1-M-7100 0
8.1.1. Selection Procedure
Packer selection has three stages:
1) Selection of type of packer
2) Selection of setting mechanism
3) Selection of main packer accessories including the tubing-packer connection
In stage 3, stress analysis is carried out to check the completion string (packer and tubing)under the stress to which they are exposed, refer to section 7.5 which describes theiterative process of tubing weight/grade/stress calculations.
8.1.2. Selection Criteria
Various representations can be used to describe the categories of criteria. This sectionillustrates the flow diagrams, identifying the standard procedures for each stage (Refer tofigure 8.a.).
The selection process includes the following categories of data:
General Well Data
This includes data which effects the configuration of the well to be completed, the mostimportant being:
• Location (on-shore/ off-shore platforms, off-shore under water)• Pressures and temperatures• Type of well (production, injection)• Type of fluid produced (oil, gas)• Deviation (max. deviation angle).
Completion Data
This includes the following parameters such as:
• Type and density of the completion fluid• Perforation of the casing using tubing-conveyed or wireline techniques• Use of a production liner.
These data also include type of packer chosen and setting, setting depth, etc.
Operational Data
The following operational data are required:
• Stimulations (planned, unplanned)• Type of de-compression operations, in particular:
a) removal of the tubing by itself
b) removal of the tubing and packer simultaneously
• Planned frequency of de-compression operations• Potential damage to the formation caused by the workover fluid.

ARPO
ENI S.p.A.Agip Division
IDENTIFICATION CODE PAGE 208 OF 295
REVISIONSTAP-P-1-M-7100 0
Figure 8.A - Selection Process Diagram

ARPO
ENI S.p.A.Agip Division
IDENTIFICATION CODE PAGE 209 OF 295
REVISIONSTAP-P-1-M-7100 0
8.1.3. Well Classification
An important parameter for defining the characteristics of a packer is the ‘degree of difficultyof the well to be completed’. To this end four classes of well have been identified which areused to analyse the various problems involved in the selection of the packer:
1) High corrosive wells
• The fluids have high corrosive problems.
2) Highly critical wells:
• Deep depths > 4500m.• High temperatures, SBHT > 130°C.• High pressures, SBHP > 700 atm.• Subsea well-head well.• Platform well having the risk of failure due to the potential collision from a vessel
with the structure.• Gas injection well with pressures, ITHP above 3,000psi.
3) Critical Well
• Temperatures between 100 and 130°C• Depths between 3,000 and 4,500m.
4) Non-critical well
• Depth of less than 3,000m.• Temperatures below 100 °C.
The depths indicated are true vertical depths.
8.1.4. Packer Selection For Single String Completion
Type Of Packer Procedure
The choice is mainly linked to the type of well:
1) In the case of a highly critical well, select a permanent packer.
2) If the well has high corrosive, select a permanent/retrievable or permanent packer,with priority be given to the former.
3) If the well is critical or non-critical, (Refer to figure 8.b).

ARPO
ENI S.p.A.Agip Division
IDENTIFICATION CODE PAGE 210 OF 295
REVISIONSTAP-P-1-M-7100 0
Figure 8.B - Type of Packer for Critical and Non-Critical Wells
Explanation of figure 8.b:
(A) High frequency of tubing pullout.
(B) High frequency of tubing-packer pullout.
(C) Use of TCP drilling techniques.
(D) Measured well depth ≥ 3000 m.
(E) The workover fluid damages the formation.
(F) The packer fluid is a high density mud (> 1.6 kg/l) with probable solid depositson the packer.
(G) Gas injection well with injection pressure > 3,000psi.

ARPO
ENI S.p.A.Agip Division
IDENTIFICATION CODE PAGE 211 OF 295
REVISIONSTAP-P-1-M-7100 0
At points A and B, high frequency of extraction corresponds to a completion life of less thanfive years.
The rectangle ‘Choose’ indicates the choice between the two alternatives, the priority isindicated by a number (‘1’ corresponds to a higher priority than ‘2’). For example, in thechoice is made on the basis of point (D) then there are no particular constraints (noworkovers, or requests due to the completion fluid characteristics).
The safety factor of using a retrievable packer or not depends on the criticality of the welland, in particular, on its depth.
Packer Setting Method
Permanent and Permanent/Retrievable Packers
The selection is dependent mainly on the well characteristics:
1) If the well is corrosive or very critical, choose hydraulic setting.
2) If the well is critical or not critical, (Refer to figure 8.c).
3) Reference (A) is only true if one of the following conditions are relevant:
• SBHT > 150 °C (= 270 °F).• Is a deviated well, with a maximum deviation angle > 50°.• The completion fluid = mud with density > 1.6 kg/l.• Gas a production liner with inclination > 30°.
Figure 8.C - Packer Setting Met hod for Critical and Non-Critical Wells
For a mechanical type permanent packer, the setting is defined by the conditionsdetailed in (A). The same procedure will also be used later for packers of the typeused in a selective type completion.

ARPO
ENI S.p.A.Agip Division
IDENTIFICATION CODE PAGE 212 OF 295
REVISIONSTAP-P-1-M-7100 0
Retrievable Packer Setting Method
The method of setting used for retrievable packers is made, following the diagram in figure8.d:
Figure 8.D- Retrievable Packer Setting Method
1) Check (A) is only true if one of the following conditions are relevant:
• The well is deviated with a maximum deviation angle of > 20°.• The bottom-hole temperature (SBHT) is > 60 °C.• The vertical depth of the packer setting is > 2,000m (this is true to definitive and
not test completions).• Stimulations are planned.
2) Check (B):
• Using TCP shooting techniques.
3) Check (C):
• There is high frequency of tubing pullout (life of the completion < 5 years).
4) Check (E):
• Completion fluid and damage to the formation
5) Check (F):
• The packer fluid is a high density mud (> 1.6 kg/l) with the probability that itleaves solid deposits on the packer.

ARPO
ENI S.p.A.Agip Division
IDENTIFICATION CODE PAGE 213 OF 295
REVISIONSTAP-P-1-M-7100 0
The decision of whether to use a hydraulic, or hydrostatic, set is left to the engineer. Themain consideration is the required setting pressure (lower for hydrostatic packers) whichinfluences the wellhead pressure rating.
The conditions at the moment of packer setting decides whether to use a retrievablepacker. If these are outwith the capacity of the retrievable packer, a permanent/retrievablepacker will be utilised and consequently, the corresponding setting procedure will have tobe adopted (see permanent packers above).
Permanent And Permanent/Retrievable Packers Setting Method
There are principally two aspects to analyse:
• The choice of the tubing-packer connection.• To integrate this choice with the stress analysis procedures.
If during the application of the stress analyses of the string gives negative results, aconfiguration which fulfils the stress analysis requirements must be considered for thepacker-tubing connection5.
The shear ring value is generally set by increasing the maximum force applied to the packerby 25%. The maximum force is determined using stress analysis (to take into account thetolerance of the nominal shear value ± 5 to 10%). The shear value is checked for the stressconditions at the wellhead section during the packer release stage.
Tubing-packer connections seal assembly elements will be of the moulded seal type whensubjected to alternating pressure cycles, e.g. gas injection wells where the IBHP is greaterthan the packer fluid pressure and SBHP is lower than the packer fluid pressure.
Highly Critical Well: Anchored Completion
For a highly critical well, the approach is the same as that for an anchored tubing-packer.defines the type of anchoring on the basis of the conditions for (A), in particular the choiceis made between a shear release or anchor seal assembly.
The type of anchor to be used can be defined during this first stage for an anchoredcompletion (without shear release):
• If the packer is set mechanically, the anchor will be a ratchet type or,alternatively, fixed.
If the stress analysis results are negative:
• If a shear release is needed, an anchor seal assembly is used.• If anchor is needed, a dynamic seal is used (Refer to figure 8.d).
5 If the failure of the stress analysis is due to the tension caused by the tubing-packer connection. At present the stress
analysis procedure is developed using the “Veritas “ software package .Veritas is the UNIX version of the VERTBG package.

ARPO
ENI S.p.A.Agip Division
IDENTIFICATION CODE PAGE 214 OF 295
REVISIONSTAP-P-1-M-7100 0
Figure 8.E - Anchored Completion Option
Check (A):
Deviated well:
• if it is an injection well it cannot be critical (see section 8.1.3).
For an anchor with shear release:
• If the stress analysis upon releasing is negative, an anchor will be used and thecheck will be carried out again.
Highly Critical Well: Dynamic Seal
This stage considers an anchored completion which fails the stress analysis calculationbecause of problems associated with the tubing-packer connection. In this case a dynamicseal is used (Refer to figure 8.f).
Figure 8.F - Dynamic Seal
Check (A)

ARPO
ENI S.p.A.Agip Division
IDENTIFICATION CODE PAGE 215 OF 295
REVISIONSTAP-P-1-M-7100 0
• The packer fluid is a high density mud (> 1.6 kg/l) which may leave soliddeposits on the packer.
Check (B):
• The packer is one trip installation, i.e. run on the tubing. This is only possiblewith hydraulically packers.
The procedure illustrated in figure 8.f gives a general description of the criteria behind thechoice of dynamic seal to be adopted. Reference will be made to this later and also forcases which are different to those described in highly critical wells above.
Here, following any failure of the stress analysis, no other rules are apply as, in general,when using dynamic seals, the stress analysis results are corrected using factors other thanthe seal element.
Critical, Non-Critical Well
The easiest solution in these cases is to choose a Standard Seal Locator.
This is the case with the following conditions:
• No stimulations are planned.• The well is not an injection well.• The packer is not set hydraulically.
If these conditions do not apply, the procedure illustrated in figure 8.g is followed.
Figure 8.G - Critical and Non-Critical Wells, Seal Element

ARPO
ENI S.p.A.Agip Division
IDENTIFICATION CODE PAGE 216 OF 295
REVISIONSTAP-P-1-M-7100 0
Check (A):
• the packer fluid is a high density mud (> 1.6 kg/l) which may leave solid depositson the packer.
(B):
• deviated well with max. deviation angle > 20.
(C):
• expected life of the completion < 5 years.
(D):
• the packer is set mechanically.
Again in figure 8.g, the outlet conditions included in the rectangle indicate, besides thechoice of tubing-packer connection, the need to use the packing setting procedurespecified.
In the case of a deviated well, anchored completion is not recommended. It is better to usea completion with a shear element which is more easily releasable, or a dynamic sealwhenever feasible.
No additional adaptation of the seal element is foreseen as a consequence of any stressanalysis.
Retrievable Packer Tubing-Packer C onnections
The choice of the tubing-packer connection for retrievable packers (hydraulic and set downweight) is made on the basis of that in figure 8.h.
Particular conditions raise questions over which type of retrievable packer to use. In thesecases, a permanent/retrievable packer is the priority or a permanent should be used andconsequently the associated setting procedure and seal assembly selected.

ARPO
ENI S.p.A.Agip Division
IDENTIFICATION CODE PAGE 217 OF 295
REVISIONSTAP-P-1-M-7100 0
Figure 8.H - Tubing-Packer C onnections for Retrievable Packers
8.1.5. Single Selective Completion Packers
The criteria illustrated here are valid for selective completions with 2 or 3 producing zones.The solutions given are for a case with only 2 zones and if a third zone is to be taken intoconsideration it is assumed that the selection made for the upper zone of the two zonescenario applies.
Packer Selection
The first case classifies the well on the basis of depth characteristics (≥ 4,000m) but moreon the basis of its complexity.

ARPO
ENI S.p.A.Agip Division
IDENTIFICATION CODE PAGE 218 OF 295
REVISIONSTAP-P-1-M-7100 0
Figure 8.I - Single Selective Packer For Complex Wells
if several different configurations are available, as for example in figure 8.i, the engineerhas a certain degree of freedom of choice but is, however, governed by the order of priorityspecified along with the choices.
If the conditions as of figure 8.i, are not applicable, these cases are classified by well depth:
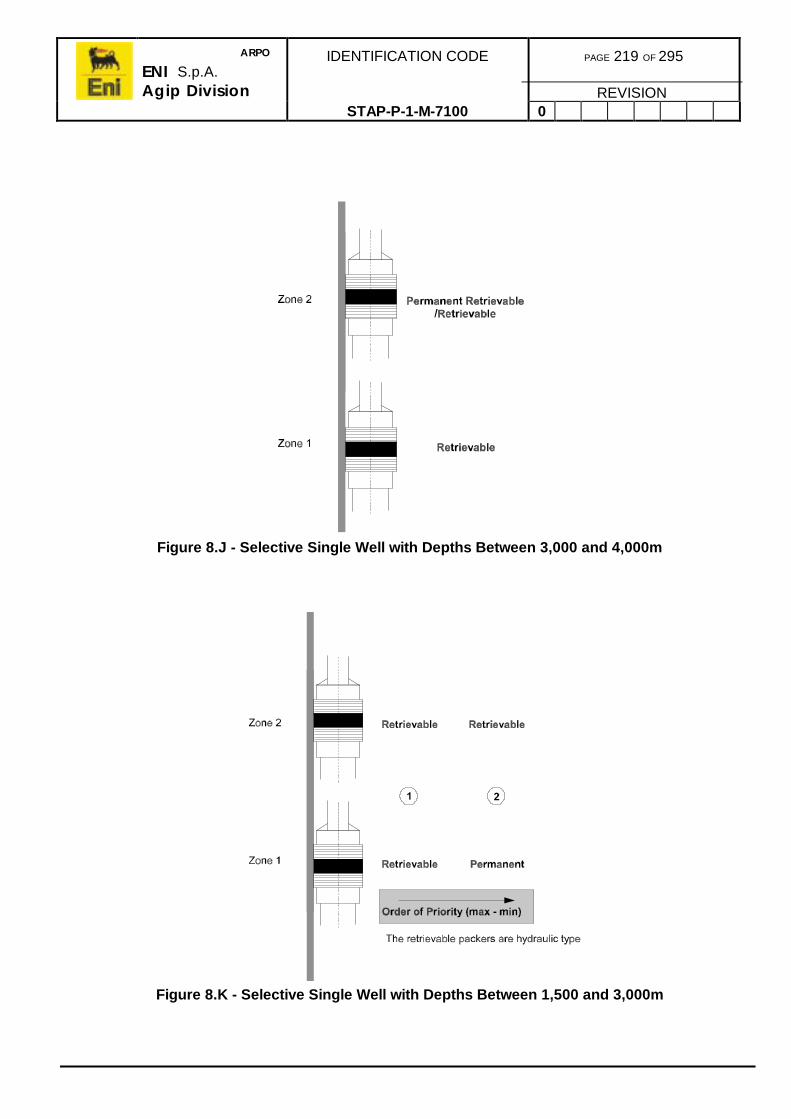
ARPO
ENI S.p.A.Agip Division
IDENTIFICATION CODE PAGE 219 OF 295
REVISIONSTAP-P-1-M-7100 0
Figure 8.J - Selective Single Well with Depths Between 3,000 and 4,000m
Figure 8.K - Selective Single Well with Depths Between 1,500 and 3,000m

ARPO
ENI S.p.A.Agip Division
IDENTIFICATION CODE PAGE 220 OF 295
REVISIONSTAP-P-1-M-7100 0
Figure 8.L - Selective Single Well with Depths Less Than 1,500m
In the case of depths less than 1,500m in a well not considered complex, it is stronglyrecommend that a retrievable type packer be used.
Application of the criteria illustrated in figure 8.i through figure 8.l is common with the onlyexception, in the case of multiple choices, being that the order of priority for the lower zonecan be changed by applying the following rules:
• If workovers are planned with removal of the tubing and packer, and aretrievable packer is one in the list of possible choices, then it should beselected.
• If the completion fluid is a mud with deposition problems, and a permanent orpermanent/retrievable packer are in the list of possible choices, then thepermanent/retrievable should be selected over of the retrievable.

ARPO
ENI S.p.A.Agip Division
IDENTIFICATION CODE PAGE 221 OF 295
REVISIONSTAP-P-1-M-7100 0
Packer Setting Method
The type of setting method proposed depends on the following factors:
• Type of packer• Setting distance between the packers.
The setting criteria of a mechanical permanent packer (on a workstring, or wireline) arethose already defined for the single completion described in section 8.1.4.
Permanent Stacked Packers:
Refer to figure 8.i with all permanent packers, if the setting distance between the packers is> 500m (check with the packer manufacturer), choose hydraulic setting for all the packers orelse mechanical setting.
Lower Permanent Packer With Upper Retrievable:
Refer to figure 8.j, figure 8.k and figure 8.l, in these cases the reference packer ispermanent and the other packers are the retrievable or permanent/retrievable type. Withthese type of packers, if the completion fluid is a brine, hydraulic type setting should beused or else the packers can be set mechanically.
Mechanical setting is preferred for the reference packer and the setting should be byelectric line when the distance between the packers is < 500 m.
If the reference packer is set by a workstring, a depth control procedure is necessary toverify the depth of the packer setting to ensure positioning of the blast joint across theupper zone which is open to production.
All packers are Retrievable
Refer to figure 8.k and figure 8.l where all packers are retrievable, hydraulic setting shouldbe used for this type of packer. It is essential to check with manufacturers that the distancebetween the packers is sufficient for the packers to be set.
Tubing-Packer C onnection Selection
The criteria continues by classifying the packers by type and setting with the zones treatedseparately. In some cases, three zones are assumed (upper, intermediate, lower). In caseswhere there is no specific mention of an Intermediate zone, it is treated with the samecriteria used for the upper zone.
Generally, the results of the stress analysis specifically identifies the packers with releasingproblems. Due to this, the zones are be treated separately; i.e. modifications are be madeonly to those packers which have the problems. It is recommended in any case to re-checkthe completion after having made the modifications.

ARPO
ENI S.p.A.Agip Division
IDENTIFICATION CODE PAGE 222 OF 295
REVISIONSTAP-P-1-M-7100 0
Upper packer
The rules described for the single completion are applied to the upper packer (Refer to8.1.4).
Lower or Intermediate Packer
There are three possible ways of treating the lower zones:
1) All the packers are of the permanent or permanent/retrievable types with hydraulicsetting. Initially an anchor with shear release should be selected. In the case of failureof the stress analysis on this packer, a dynamic seal will be used (anchor with PBR ortelescopic joint).
2) The lower zone packer is a permanent with mechanical setting. A dynamic seal shouldbe used; in particular, a standard length locator. In the case of failure of the stressanalysis, a longer locator with seal bore extension should be used. For theintermediate zone in the three zone case, an anchor or retrievable type packer will beused, for the intermediate packer.
3) The lower zone packer is a retrievable. In the case of failure in the stress analysis adynamic seal with telescopic joint will be used.
For the intermediate zone in the case of three zones, a telescopic joint should be usedwhen there is failure in the stress analysis.

ARPO
ENI S.p.A.Agip Division
IDENTIFICATION CODE PAGE 223 OF 295
REVISIONSTAP-P-1-M-7100 0
8.2. SUB-SURFACE SAFETY VALVES
This section provides the Eni-Agip Division and Affiliates policy and guidelines for theapplication and selection of Sub-Surface Safety Valves (SSSV). The policy defined shall beapplied to all Eni-Agip Division and Affiliates completion designs world-wide. Any variationto this policy and selection procedures herein, shall only be sanctioned by the Eni-AgipDivision and Affiliates Head Office.
8.2.1. Policy
All Eni-Agip Division and Affiliates completions shall incorporate a SSSV in thecompletion string to provide safety in the event of an uncontrolled well flow.
Surface controlled sub-surface safety valves (SCSSV’s) shall be used accordingly to thecriteria listed below in section 8.2.4.
8.2.2. Applications
The applications for SSSV’s are given in section 8.2.5.
The choice of SSSV for a particular development will depend on:
• Well location• Fluid properties• Required flow area• Well intervention capabilities.
This will determine whether the selected SSSV is Wireline Retrievable (WRSV) or TubingRetrievable (TRSV).
8.2.3. Wireline Retrievable Safety Valves
Wireline retrievable valves may be, either, sub-surface controlled sub-surface safety valves(SSCSSV) otherwise known as direct acting valves or surface controlled sub-surface safetyvalves (SCSSV).
SSCSSV’s are either pressure differential or ambient pressure operated valves. Both typesare generally referred to as ‘storm chokes’.
The use of these valves should be avoided as they are set up to operate on predeterminedconditions representing a major leak at surface, e.g. a flowline rupture, but under somecircumstances, when there is a leak of insufficient rate, the valve may fail to close. Inconjunction, flow erosion of the valve internals may alter the closure settings.
A derivative of the storm choke is the injection valve which is held open by water or gasinjection and closes when injection ceases.

ARPO
ENI S.p.A.Agip Division
IDENTIFICATION CODE PAGE 224 OF 295
REVISIONSTAP-P-1-M-7100 0
8.2.4. Surface Controlled Sub-Surface Safety Valves
These are designed for tubing retrievable, wireline retrievable or annulus safety valvesystems. They are controlled normally by surface applied hydraulic pressure through acontrol line clamped to the outside of the tubing string. Hydraulic pressure opens and thenretains the valve open. Removal of the pressure allows the valves to close. These valvesystems are fail safe and are preferred to SSCSSV’s.
The guidelines given in section 8.2.5 indicate in which applications WRSV’s and TRSV’sshould be used.
The following table 8.b specifies when SCSSV’s shall be used.
Well Type Criteria
Oil Producer • All new offshore development.• All wells onshore which can sustain natural flow.• All old wells in above categories which are to be
recompleted.• All isolated wells.
Gas producer • All new offshore development.• All old wells being recompleted.
Gas storage • All wells.
Gas injection • All wells.
Water injection • All wells.
Artificial lift • All wells on gas lift, tubing and annulus.• Electrical submersible pump, tubing and only
annulus if used for gas venting.
H2S in produced fluids • All wells.
Table 8.B - Criteria For Use of SCSSV's
8.2.5. Valve Type/Closure Mechanism Selection
This section gives recommendations on the choice of valve with the corresponding type ofclosure mechanism.
Note: All valves with ball type closure mechanisms are not recommended foruse as they are less reliable than flapper valves.

ARPO
ENI S.p.A.Agip Division
IDENTIFICATION CODE PAGE 225 OF 295
REVISIONSTAP-P-1-M-7100 0
Type of Valve Applications
Tubing Retrievable Flapper Valve • Offshore platform wells.• Subsea wells.• Wells with the presence of H2S or CO2.• Wells with surface flowing temperature greater
than 130°C.• Wells with shut-in surface.
Wireline Retrievable Surface ControlledFlapper Valve
• As on insert valve for tubing retrievableSCSSV’s.
Storm Chokes • As a backup to the WRSV above when there is acontrol line failure. Set in the next lowestwireline nipple.
Annular Safety Systems • Gas lift wells.• ESP wells with gas venting.• Jet pump wells, under the pump.
Wireline Retrievable Injection Valves • All waste wells.
Table 8.C - SSSV Closure Mechanism Applications
Gas or water injection wells may have either a tubing retrievable or wireline retrievableSCSSV.
8.3. CONTROL/INJECTION LINE SELECTION
The purpose of this sub-section is to define the basic criteria for the selection and the use ofsmall diameter tubes for SCSSV control line and injection line applications. These twodifferent cases will be considered separately below.
8.3.1. Control Lines
Tube used as ‘control line’ to operate downhole safety valves are installed along with theproduction string. In this case, SCSSV’s are usually set at shallow depths and, therefore,the length of line required is generally relatively short.
8.3.2. Injection Lines
Tube used as ‘injection lines’ to inject chemical products such as corrosion or scaleinhibitors down hole or as deep as possible in the well, are also installed with the tubingstring. The line length required in this case, will be considerably longer.

ARPO
ENI S.p.A.Agip Division
IDENTIFICATION CODE PAGE 226 OF 295
REVISIONSTAP-P-1-M-7100 0
8.3.3. Tube Specifications
Size
Small diameter tubes for control or injection line applications are manufactured either asseamless or seam-welded and sunk. They are usually available in a full range of materialsand sizes.
In the seamless tube manufacturing process, the raw material comes in the form ofextruded hollows, which are then reduced to the desired diameter and wall thickness by acold drawing operation. In the case of welded tube process, the raw material comes instrips which are first rolled into tube form which is fed through a welding head to perform afusion weld. The cycles of cold drawing with a floating plug drawing method is preferred andannealing operations performed to reach the desired dimensions and produce a weld zonehomogeneous with the rest of the tube material.
Welded tubes are considered the norm as opposed to seamless which are considerablymore expensive and limited in length (usually a max. of 1000 ft in length). Welded tubescan be produced in extra long coils more than 3200 ft by butt welding lengths of tubingstogether.
Both types of lines comply with ASTM specification A269 ‘Seamless and Welded AusteniticStainless Steel Tubing for General Service’ and ASTM-B751 specification ‘Generalrequirement for Ni and Ni alloy Seamless and Welded Tube’.
The standard size for both applications, control and injection line, is 1/4” OD and the wallthickness chosen from among the following sizes according to the pressure requirements:
• 1/4” OD x 0,035” wall thickness• 1/4” OD x 0,049” wall thickness• 1/4” OD x 0,065” wall thickness.
Control Line Working Pressures
A down hole safety valve is usually set at a relatively shallow depth, ranging about 30m to50m from well head for on-shore installations or from sub sea level in case of off-shoreactivity. For this reason the configuration of the control line is not effected by the welldeviation, therefore in most cases external encapsulation it is not recommended. Once theworking pressure has been defined as explained in the following paragraph, refer to table8.d for the selection of the size which most suits the requirements.
The working pressure (WP) is defined as follows:
WP = Safety Valve WP + Valve Opening Pressure
Safety Valve WP is as specified by the manufacturer.
Valve Opening Pressure, provided by the manufacturer, is the pressure required toovercome the closing force of the spring plus resistance due to friction effects. Usually itranges between 1,500 to 2,000psi depending on the manufacturer.

ARPO
ENI S.p.A.Agip Division
IDENTIFICATION CODE PAGE 227 OF 295
REVISIONSTAP-P-1-M-7100 0
Chemical Injection Line Working Pressures
Chemical injection lines are run to injection mandrels which are installed as close aspossible to the bottom of the tubing. The definition of working pressure is based on thefollowing considerations:
• Well configuration, therefore total vertical depth.• Injection fluid characteristics such as density and viscosity.• Injection rates to choose the correct diameter and evaluate friction losses.• Total pressure required to inject chemicals through the line.
Injection rates referred to in this application are always low, therefore the flow profile can beassumed to be laminar. Once the friction losses for laminar flow have been calculated thenthe diameter size can be determined accordingly. figure 8.n shows the graphs of pressurelosses per 100m versus flow rate plotted for various internal diameters and various valuesof fluid viscosity. Once the working pressure has been defined as explained below, (Referto table 8.d), the selection of the tubing size to meet with requirements can be made.
Working pressure is defined as follows:
WP BHSP P Pfr hd= + −Eq. 8.A
where:
WP = BHSP + Pfr - PhdBHSP= Bottom hole static pressure.Pfr = Friction losses (see figure 8.n).Phd = Hydrostatic pressure of injection fluid.
The pressures given in the table are computed with ultimate and yield tensile strengthvalues given in table 8.f and they are rated to temperatures between -20 and 100°F. Valuesobtained are based on the Lamè’s formula for thick section pipes using internal pressureonly and stress defined at the internal diameter face, combining radial and tangential stressto determine an equivalent resultant using the Von Mises Theory of Distortion Energy:
1x3
1
4
2
+
−
=
ID
OD
ID
ODYs
P
Eq. 8.B
Variables are defined as:
P = computed pressure (psi)Ys = ultimate tensile strength to compute ‘Burst Pressure’ (psi)Ys = yield strength (2% offset) to compute ‘Test Pressure’ (psi)WP = 80% of test pressure (psi)OD = outside diameter (in)ID = inside diameter (in)

ARPO
ENI S.p.A.Agip Division
IDENTIFICATION CODE PAGE 228 OF 295
REVISIONSTAP-P-1-M-7100 0
Type of alloy OD (inch) Wall (inch) WP (psi) Burst (psi) Test (psi)
AISI 316 L 0.250 0.035 5.328 18.646 6.659
0.250 0.049 7.118 24.914 8.898
0.250 0.065 8.809 30.831 11.011
0.375 0.035 3.651 12.780 4.564
0.375 0.049 5.004 17.515 6.255
Monel K400 0.250 0.035 5.967 18.646 7.459
0.250 0.049 7.972 24.914 9.965
0.250 0.065 9.866 30.831 12.333
0.375 0.035 4.089 12.780 5.112
0.375 0.049 5.605 17.515 7.006
Incoloy 825 0.250 0.035 7.459 22.642 9.323
0.250 0.049 9.965 30.252 12.457
0.250 0.065 12.333 37.438 15.416
0.375 0.035 5.112 15.518 6.390
0.375 0.049 7.006 21.268 8.757
Inconel 625 0.250 0.035 12.786 31.965 15.983
0.250 0.049 17.084 42.709 21.355
0.250 0.065 21.142 52.854 26.427
0.375 0.035 8.763 21.908 10.954
0.375 0.049 12.010 30.025 15.013
Table 8.D - Theoretical Working, Bursting and Testing Procedures(for welded stainless steel tubing at between -20°F to 100°F)
8.3.4. Material Selection
Among the stainless steels and nickel alloys available, the most commonly used for controlor injection line applications are listed in table 8.e together with their relative characteristics.Compatibility of packer or completion fluid with the selected material must be confirmed bymeans of condition specific laboratory testing. table 8.f shows the mechanical properties ofthese materials in the annealed condition.

ARPO
ENI S.p.A.Agip Division
IDENTIFICATION CODE PAGE 229 OF 295
REVISIONSTAP-P-1-M-7100 0
Type of Alloy Main Characteristics
AISI 316 L Is an austenitic stainless steel with reduced carbon content. Has good resistanceto grain boundary attack and improved resistance to pitting and crevice attack. Itis susceptible to chloride stress cracking when the presence of stress iscombined with a packer fluid containing chlorides.
Monel K400 Is a nickel-copper alloy resistant to corrosion and stress corrosion over a widerange of conditions.
Incoloy 825 Is an austenitic nickel-base alloy with good resistance to pitting in chloridesolutions and to stress corrosion has improved resistance to corrosion by manyacids.
Inconel 625 Is a Nickel-base alloy with a higher percentage of molybdenum to give thehighest resistance to chloride attack.
Table 8.E - Stainless Steels and Nickel Alloys Most Commonly Used
Once the type of material to be used has been defined, based on pressure ratings andworking environment, the corrosion department should be consulted to confirm compatibilitywith the packer fluids.
Control or Injection line made of the above material shall comply with the following ASTMspecifications:
AISI 316L - In accordance with ASTM specification A269 (TP316L).Monel K400 - In accordance with ASTM specification B165.Incoloy 825 - In accordance with ASTM specification B423.Inconel 625 - In accordance with ASTM specification B704.
Type of Alloy Tensile Strength (psi) Yield Strength at 0.2% Offset (psi)
AISI 316 L 70,000 25,000
Monel K400 70,000 28,000
Incoloy 825 85,000 35,000
Inconel 625 120,000 60,000
Table 8.F - Nominal Mechanical Properties in Annealed Conditions(For temperatures between -20 to 100°F)

ARPO
ENI S.p.A.Agip Division
IDENTIFICATION CODE PAGE 230 OF 295
REVISIONSTAP-P-1-M-7100 0
8.3.5. Fittings
Connections for either SCSSV control lines or chemical injection lines shall be performed asfollows:
• In case of pressure rating < 5000 psi, line connections shall be of the ‘Swagelok’type.
• In case of pressure rating > 5000 psi, line connections shall be of the‘Autoclave’ type as recommended by API Spec. 6A (Wellhead & Christmas TreeEquipment) at the paragraph ‘Equipment specification requirement’ under ‘testand gauge connections’.
It is suggested to avoid, as far as possible, any intermediate connections to reduce potentialleak paths.
8.3.6. Protectors
Control line protectors are designed to support and avoid (bare or encapsulated) crushing atwhere it is most exposed, e.g. where it crosses large offsets like couplings, downhole safetyvalves or gas lift mandrels. Protectors shall be designed for small annular clearancesallowing sufficient annulus flow area. They should be of the “one piece” type without looseparts and designed so as to be quickly installed and removed.
‘Across coupling tubing protectors’ are recommended for use with both SCSSV control andinjection lines applications. For control lines used on SCSSV’s installed at shallow depth(less than 250m), other types of protectors may be used. In general, ‘steel banding’ or‘banding straps’, ‘rubber based’ and ‘mid joint protectors’ shall be avoided at all costs.
The following technical requirements will identify protector performance:
• Material shall be of all metal construction. No structural welding shall be allowed.Lab corrosion tests shall be run to verify compatibility with annular environment.
• Capable of firmly supporting bare or encapsulated lines when performingcompletions and recovery during workover allowing control line and protector re-use.
• Force indicated in ‘l’ or ‘tons’ that the protector will support against axialdisplacement without failing or damaging the supported line.
• Force stated in ‘lb’ or ‘Kg’ that protector will resist as a direct pull on supportedline without any slippage.
• Maximum load expressed in ‘lb’ or ‘kg’ that protector will withstand whencontacting the casing wall without damage.

ARPO
ENI S.p.A.Agip Division
IDENTIFICATION CODE PAGE 231 OF 295
REVISIONSTAP-P-1-M-7100 0
8.3.7. Encapsulation
Encapsulation of this line is recommended only for chemical injection lines applications.Encapsulation increases crush resistance during installation, protects line against abrasion,pinching and improves clamping profile. Several encapsulation materials are available,covering a wide range of environmental conditions. table 8.g indicates the compatibility ofthe main encapsulation materials with the most commonly used packer/completion fluids. Insome cases, braided wire is placed alongside the injection line and bonded together by theencapsulation material, to further enhance resistance and strength avoiding any rolling andtwisting tendencies (Refer to table 8.h).
The following laboratory tests are suggested to confirm the lines mechanical characteristicsand compatibility of the encapsulation material with the packer fluid used:
• Immersion test of the encapsulated line in downhole conditions for a definedperiod of time. No evidence of a change in physical appearance should beobservable.
• Gas impregnation tests at various temperatures, pressures and with variousgasses for a fixed period of time. No evidence of cracking, blistering orembrittlement should be observable.
• Combined brine/sour gas exposure tests according to the operating conditions,as above.
• Combined crude oil/sour gas exposure tests according to operating conditionsas above.
• Abrasion resistance test to compare the resistance against abrasion betweenbare and encapsulated lines.
• Crush resistance test by loading the tube laterally, across the diameter,simulating various loading levels, until tube collapse is evident. Encapsulatedline results should be compared to bare line tests.
The following table 8.g shows the main properties of the most common types ofencapsulation material available. The choice of material, is mainly based on type of packerfluid, well deviation and working temperatures to be experienced and shall be confirmed bylaboratory tests for compatibility.

ARPO
ENI S.p.A.Agip Division
IDENTIFICATION CODE PAGE 232 OF 295
REVISIONSTAP-P-1-M-7100 0
Encapsulation Material Main properties
Nylon Compatible with diesel packer fluids containing high gaspercentages. Nylon should not be used with completion fluids thatcontain calcium chlorides, calcium bromides or zinc bromides athigh temperatures. Its maximum temperature rating is 250°F.
Santroprene Compatible with most packer fluids with the exception of diesel orfluid at high gas concentration. Maximum operating temperaturerating is 275°F - 300°F.
Halar Chemically resistant to almost all downhole fluids. Excellentmechanical strength and abrasion resistance. Compatible with highgas content environments. Recommended for highly deviated wells.Maximum operating temperature is 400°F.
Rislan II Chemically resistant to almost all downhole fluids. Excellentmechanical strength and abrasion resistance. Compatible with highgas content environments. Recommended for highly deviated wells.Maximum operating temperature is 212°F.
Foraflon PVDF Chemically resistant to almost all downhole fluids. Excellentmechanical strength and abrasion resistance. Compatible with highgas content environments. Recommended for highly deviated wells.Maximum operating temperature is 302°F.
Table 8.G - Compatibility and Characteristics of Encapsulation Materials
Halar (fluoropolymers) is a registered trademark of Ausimont USASantoprene (thermoplastics rubber) is a registered trademark of MonsantoRilsan II (polyamide thermoplastic)Foraflon PVDF (polyvinylidine fluoride thermoplastic material)
Samples of different types of encapsulated tubes have been tested under compressive,laterally applied, loading simulating possible damage arising during installation to determinethe tube crushing resistance and extend of polymer damage, (see Table below).

ARPO
ENI S.p.A.Agip Division
IDENTIFICATION CODE PAGE 233 OF 295
REVISIONSTAP-P-1-M-7100 0
Sample Size Applied load in metric tons(no damage detected)
Applied load in metric tons (linepartially crushed, fluid flow not
interrupted)100mm - 1/4” OD x 0.049”
Alloy 825 bare line2.45 3.5
100mm - 1/4” OD x 0.049”Alloy 625 bare line
2.65 3.8
100mm - 1/4” OD x 0.049”Alloy 825 encapsulated withForaflon: size 15mm x 12mm
7.0 9.0
Table 8.H - Crush Resistance Test For Encapsulated Injection Lines
8.3.8. SCSSV Hydraulic Control fluid
The criteria in this section is for SCSSV control line applications only.
Today hydraulic fluids are almost exclusively based on mineral oils. Other types of syntheticbased oils, are employed only when operating temperatures are very low and specialthermal standby properties are required. Most of the synthetic based oils used are of theflash fire resistant category as they have a very low pour floc point combined with a goodperformance at higher temperatures.
With regard to subsea completions, the control fluid is the same fluid as used for the Xmastree controls.
table 8.i shows the main properties of the recommended oils for control line applications.
8.13 and figure 8.n below shows typical friction losses of control line fluids.
Figure 8.M - Fluid Friction Loss with 5cP Fluid
Injected fluid viscosity = 5cP
0
10
20
30
40
50
60
70
80
90
100
0 1 2 3 4 5 6 7 8 9 10
Q injection - liters/hr
Fric.lossespsi/100m
w.t.= 0,035
w.t.= 0,049
w.t.= 0,065
O.D = 0,25 inches

ARPO
ENI S.p.A.Agip Division
IDENTIFICATION CODE PAGE 234 OF 295
REVISIONSTAP-P-1-M-7100 0
Figure 8.N - Fluid Friction Loss with 1cP Fluid
The above graphs are based on the following formula:
495.612
xLx
Di
QPf
µ=
Eq. 8.C
where:
Pf
Di
L
Q
= Friction losses (kPa)
= Internal diameter (inches)
= Length (meters)
= Viscosity (cP)
= Flow rate (lt / min)
µ
kPa X 0.145 = psi
Injected fluid viscosity = 1cP
0
2
4
6
8
10
12
14
16
18
20
0 1 2 3 4 5 6 7 8 9 10
Q injection - liters/hr
Fric
. los
ses
psi/1
00m
w.t.=0,035
w.t.=0,049
w.t.=0,065
O.D = 0,25 inches

ARPO
ENI S.p.A.Agip Division
IDENTIFICATION CODE PAGE 235 OF 295
REVISIONSTAP-P-1-M-7100 0
Oil Name/Properties Agip Arnica 32(Petroleum based)
Agip OSO 32(Paraffinic based)
Agip Betula S 32(Synthetic based)
Viscosity at 40° C cSt 32 30 29,4
Viscosity at 100° C cSt 6,4 5,3 5,1
Viscosity index 163 110 98
Pour Point °C -39 -30 -55
Flash point °C 202 204 206
Density at 15° kg/l 0,865 0,875 0,841
Floc point °C - - -60
Table 8.I - Properties of Recommended SCSSV Hydraulic Oils
* cSt x Density = cp
**Density variation = 0.00065 (kg/l) / °C
For standard applications Agip Arnica 32 is recommended as it has better theologicalproperties than OSO 32. Agip Betula 32 should be employed only when operatingtemperatures are very low as in Siberia where temperatures may reach -50°C.
In order to avoid plugging of the control line while running in hole, testing and runningprocedure must be carefully programmed and hydraulic fluid may have to be flushedthrough a filtration unit, if required (usually 5 micron absolute).

ARPO
ENI S.p.A.Agip Division
IDENTIFICATION CODE PAGE 236 OF 295
REVISIONSTAP-P-1-M-7100 0
8.3.9. Control/Injection Line Selection Procedure Flow Chart
Figure 8.O - Control/Injection Line Selection Flow Chart
ARPO
ENI S.p.A.Agip Division
IDENTIFICATION CODE PAGE 237 OF 295
REVISIONSTAP-P-1-M-7100 0
8.4. WIRELINE NIPPLE SELECTION
The nipples required for completion purposes are based on the results of the previousdesign stages. The aim of this section is to determine the type (selective or tapered) andconfiguration of the diameters in order to optimise access to the sump and prevent frictionpressure drop. This must take into consideration all the diameter constraints imposed by thecasing profile and completion characteristics.
The nipples are selected based on those most commonly used by the company; andinclude the following models:
Selective:
• Halliburton (previously Otis) X, XN, R, RNThe choice of the type of nipple is subject to the working pressure which characterises thecompletion (e.g. SCSSV or wellhead). X and XN nipples are used for working pressure <10,000 psi, while R and RN types are used on all higher pressures.
Tapered:
• Baker F top no-go (AF-HF-VF) and R bottom no-go (AR-HR-VR).Like the case in selective nipples, the choice depends on the working pressure of the stringconfiguration
AF, AR (WP < 10,000 psi)
HF, HR (WP between 10,000 and 15,000 psi)
VF, VR (WP > 15,000 psi).
The principal physical characteristics of a nipple are:
• Seal bore diameter• No-go diameter, if applicable• Lock mandrel OD (LMOD).
Data on all of these nipples can be found in the manufacturer’s current catalogue. Do notrely on data produced elsewhere or use old catalogues as changes to the nipple systemsmay have been made resulting in incompatibility.

ARPO
ENI S.p.A.Agip Division
IDENTIFICATION CODE PAGE 238 OF 295
REVISIONSTAP-P-1-M-7100 0
8.4.1. Tapered Nipple Configuration
The configuration of the nipples begins at the top of the string and moves downwardstowards the bottom or packer tailpipe. The following physical dimensional values arerequired:
• Running clearance (RC) = 0.050ins• No-go dimension (NGD)
= 0.050ins for tubing OD < 3.313ins
= 0.060ins for tubing OD < 5ins
= 0.080ins otherwise
The first nipple, generally in the tubing hanger, is always a Baker type F and is chosen withthe maximum diameter available for the size of the completion tubing below the hanger.
For the lower nipples, the minimum top and bottom restriction dimensions are determinedby the following procedure:
1) The top restriction (RA) is the minimum upper diameter of the nipple, chosen from oneof the following:
• ID of the packer• Drift of the tubing• ID of the safety valve• Vertical access of the wellhead• Sealbore diameter (top) or no-go ID (bottom) of the upper nipple.
2) The bottom restriction (RB) is determined by the ID of the SCSSV tubing-retrievable,and the only one used.
At this stage a hypothesis of seal bore diameter of the nipple (SB) is determined byanalysing the following conditions:
If RB is not defined, or:
RB > RA or (RA - RB > NGD + RC)
then:
LMOD = RA - RC
SB = LMOD - NGD
3) In other cases, the previous conditions are re-applied, decreasing the NGD to adjustthe calculations. The minimum values which can be reached by the NGD are:
• 0.042ins for tubing OD < 3.313ins• 0.050ins for tubing OD < 5ins• 0.070ins otherwise.
4) The data obtained are then used to match the nipple. To select the nipples to be ascompatible as possible with the available options in the suppliers catalogues, anapproximation of 1/100ins for SB is acceptable.

ARPO
ENI S.p.A.Agip Division
IDENTIFICATION CODE PAGE 239 OF 295
REVISIONSTAP-P-1-M-7100 0
1) In the event of achieving a good match, the nipple is compared with the data from thecatalogue. If there is no nipple with the characteristics required, there are two options:
• Produce a new nipple size• Select the maximum nipple diameter from the catalogue < SB.
2) The type of nipple (e.g. F) is obtained from the previous selection. If F is chosen, it isthen possible to use an R type nipple if the following conditions exist:
• The nipple in question is not required for the installation of a W/L retrievablebackup SCSSV
• The subsequent nipple must be type F with the following characteristics:
SB(F) < SB(R)
LMOD(F) + 0.050 < no-go ID(R).
8.4.2. Selective Nipple Configuration
Criteria similar to those detailed in the tapered nipple procedure are used to choose thetubing hanger nipple, i.e. the maximum diameter nipple which is compatible with the ratedpressure of the Christmas tree is selected.
For the subsequent nipples, the previous size is selected but only for a maximum of threenipples in series. After this it is necessary to reduce the diameter again.
It is a rule that if the spacing between two successive nipples is < 30m, a tapered nipple willbe used.

ARPO
ENI S.p.A.Agip Division
IDENTIFICATION CODE PAGE 240 OF 295
REVISIONSTAP-P-1-M-7100 0
9. PERFORATING
The objective of perforating a well is to establish communication between the wellbore andthe formation by making holes through the casing, cement and into formation in such amanner so as not to inhibit the inflow capacity of the reservoir.
To optimise perforating efficiency, it is not solely down to the perforating technique butrelies extensively on the planning and execution of the well completion which includesselection of the perforated interval, fluid selection, gun selection, applied pressuredifferential or underbalance, well clean-up, and perforating orientation.
One of the important aspects is the underbalance, which has been proven to significantlyhelp to achieve a post-perforating flow rate to effectively flush out gun debris and removethe crushed zone which surrounds every perforating tunnel. If this is not effective, increasedperforating skin can reduce production rates.
The advantages of perforated casing wells is already described in section 5.2.3 and offersselectivity, however the perforated volume in the pay is relatively small compared to openhole (+/- 25%), therefore perforation damage is an extremely important aspect. To this endit is necessary to obtain an adequate shot density with a sufficiently deep enoughpenetration to pass through the drilling damage and maximise flow through each tunnel.
9.1. SHAPED CHARGE PERFORATING
The principle of shaped charge perforating is available in any service providers sales andtechnical literature (Refer to figure 9.a). The important issues for the completion engineerare the charge selection to meet with the conditions and provide the maximum perforatingefficiency.
The explosives for use in most shaped charges up to 300oF is RDX (cyclonite) and abovethis temperature and depending on time exposed to the temperature, HMX, PS, HNS orPYX is used. The performance of each is available from the suppliers. The detonating cord,which couples all the charges to the detonator in the firing head, must match the explosiveselected.
The detonator is triggered by electrical heating when deployed on wireline systems or by afiring pin in mechanically or hydraulically operated firing head systems employed on tubingconveyed perforating (TCP) systems.

ARPO
ENI S.p.A.Agip Division
IDENTIFICATION CODE PAGE 241 OF 295
REVISIONSTAP-P-1-M-7100 0
Figure 9.A- Perforation Process
9.2. GUN TYPES
There are four main types of perforating guns:
• Wireline Conveyed Casing Guns• Through-tubing Hollow Carrier Guns• Through-tubing Strip Guns• Tubing Conveyed Perforating Guns.
9.2.1. Wireline Conveyed Casing Guns
These types of guns are generally run in the well before installing the tubing, therefore nounderbalance can normally be applied although in large size monobore type completionssome sizes can be run similar to through-tubing guns using an underbalance.
The advantage of casing guns over the other wireline guns are; high charge performance,minimal debris, low cost, highest temperature and pressure rating, high mechanical andelectrical reliability, minimal casing damage, instant shot detection, multi-phasing, variableshot densities of 1-12spf, speed and accurate positioning using CCL/Gamma Ray.

ARPO
ENI S.p.A.Agip Division
IDENTIFICATION CODE PAGE 242 OF 295
REVISIONSTAP-P-1-M-7100 0
Figure 9.B - Types of Guns

ARPO
ENI S.p.A.Agip Division
IDENTIFICATION CODE PAGE 243 OF 295
REVISIONSTAP-P-1-M-7100 0
9.2.2. Through-Tubing Hollow Carrier Guns
These are smaller versions of casing guns which can be run through tubing, hence havelower charge sizes and, therefore performance, than all other guns. They only offer 0o or180o phasing with a max. of 4spf on the 21/8” OD gun and 6spf on the 27/8” OD gun. Due tothe stand-off from the casing which these guns may have, they are usually fitted withdecentralising/orientation devices.
9.2.3. Through-Tubing Strip Guns
These are semi-expendable type guns and consist of a metal strip into which the chargesare mounted. The charges have higher performance and are much cheaper than through-tubing carriers guns, however they also cause more debris, casing damage and have lessmechanical and electrical reliability. They also provide 0o or 180o phasing.
A new version called the ‘pivot gun’ has even larger charges for deep penetration whichpivot out from a vertical controlled OD to the firing position.
Due to the potential of becoming stuck through strip deformation, they must have a safetyrelease connection so they can be left in the well.
They have a particular application for perforating through DST strings and reperforatingcompleted wells.
By being able to be run through the tubing, underbalance perforating can possibly beadopted but only for the first shot. Subsequent runs would need the well to be flowed tocause a differential pressure.
9.2.4. Tubing Conveyed Perforating
TCP guns are a variant of the casing gun which can be run on tubing, therefore, allowingmuch longer lengths to be installed. Lengths of over 1,000ft are possible (and especiallyuseful for horizontal wells) and perforating under exceedingly high drawdowns is possiblewith no risk to the guns being blown up the hole.
In completion operations, they may be deployed and hung-off in position before installationof the completion string, run on the bottom of the completion packer or run through thetubing on coiled tubing. Alternately they can be run in long lengths for overbalanceperforating before completion string installation.
Normally the completion is displaced to an underbalance fluid, then the guns detonated byeither:
• A bar dropped from surface• Hydraulic pressure applied from surface then subsequently reduced to the
planned underbalance pressure during a time delay.• Hydrostatic pressure reduction.• Impact by a wireline deployed tool.
Another version available, normally used on well tests, is where a differential is appliedbetween the annulus and the sump via porting through the test packer.

ARPO
ENI S.p.A.Agip Division
IDENTIFICATION CODE PAGE 244 OF 295
REVISIONSTAP-P-1-M-7100 0
The main problems associated with TCP are:
• Gun positioning is more difficult• The sump needs to be drilled deeper to accommodate the gun length if it is
dropped after firing• A misfire is extremely expensive• Shot detection is more unreliable.
Due to the longer exposure time because of the deployment, higher grade charges mayalso be required.
9.3. GUN PERFORMANCE
9.3.1. API And Performance Data
For most completion applications, API RP 43, which includes performance data producedby the suppliers, can be used as a qualitative comparison of charge performance. Thisprovides under two specific tests:
• Entrance hole size and penetration length into a 5ft diameter concrete target.• Entrance hole, penetration and flow efficiency in a Berea sandstone target at
elevated temperatures and an estimated 800psi effective stress.
The performances are listed in two sections I and II.
Section II is normally used for comparisons, however the performance in actual use maydiffer due to differences in rock strength, overburden stress and wellbore pressure andtemperatures. The variations for these reasons is non-linear and depends on the type ofcharge. The API tests are also unreliable as the targets have had differing strengths andporosities and there is no consistent quality control standard for production of the charges.
Ageing of explosives, charge alignment, moisture contamination, gun stand-off, thethickness of casing and cement or if multiple casings are to be perforated also has animpact on the gun performance.
It is necessary for engineers to obtain as much accurate data from the suppliers and useEni-Agip historic data in order to be able to make the best choice of gun.

ARPO
ENI S.p.A.Agip Division
IDENTIFICATION CODE PAGE 245 OF 295
REVISIONSTAP-P-1-M-7100 0
Guidelines
Gravel Pack Completions
Due to the problem of flow restriction discussed earlier in section 2.4.1, the importantfactors are:
• Hole diameter to achieve adequate flow area.• Shot density to achieve adequate flow area.• Debris removal.• Shot phasing.• Penetration.
This in conjunction with correct gravel pack procedures is essential for to prevent high skinfactors.
High Underbalanced TCP Perforating
High drawdowns over 500psi for production wells require, if possible:
• TCP methods• Deep penetrating charges.• High shot density over 8spf.• Minimum 90o phasing.
Underbalanced Perforating With Through-Tubing Guns
If TCP costs cannot be justified and if formation perforated skin factor is acceptable,underbalanced perforation can be carried out with through tubing systems. On the first run ahigh overbalance can be used but on subsequent runs the only means of producing adifferential is to flow the well at a rate governed not to blow the gun up the hole. This isaffected by the gun weight, type of fluid, bypass area and expected flow rate.
The use of these relatively smaller guns require contact with the casing wall, orientation at90o with 180o phased guns or in line with the contact point if 0o phased.
Shot Density
Shot density in homogeneous, isotropic formations should be a minimum of 8spf but mustexceed the frequency of shale laminations. If perforating with through-tubing guns, this willrequire multiple runs.
A shot density greater than this is required where:
• Vertical permeability is low.• There is a risk of sand production.• There is a risk of high velocities and hence turbulence.• A gravel pack is be conducted.

ARPO
ENI S.p.A.Agip Division
IDENTIFICATION CODE PAGE 246 OF 295
REVISIONSTAP-P-1-M-7100 0
Penetration
In general, the deeper the shot the better, but at the least it should exceed the drillingdamage area by 75mm. However, to obtain high shot density, the guns may be limited tothe charge size which can physically be installed which will impact penetration.
Phasing
Providing the stand-off is less than 50mm, 180o or less, 120o ,90o, 60o is preferable. If thesmallest charges are being used then the stand-off should not be more than 25mm. Iffracturing is to be carried out then 90o and lower will help initiate fractures.
Gun Stand-Off
Gun stand-off should be minimised for improved performance, especially at high pressures.If low phase angle, high density shots are preferred then TCP and casing guns should beused. As a general rule stand-off should never be more than 50mm.
Hole Size
The hole size obtained is a function of the casing grade and should be as follows:
• Between 6mm and 12mm for natural completions.• Between 15mm and 25mm in gravel packed completions.• Between 8mm and 12mm if fracturing is to be carried out and where ball sealers
are to be used.
Overbalanced Perforating
If a well is to be perforated overbalanced, then strict control over the fluid used to ensure itis compatible with the reservoir formation, formation fluids and must also be clean toprevent formation damage.
9.3.2. Underbalanced Perforating
To optimise the perforating clean up, an underbalance should be used. King et aldeveloped a recommended minimum level of drawdown based on a number of field studieswhere TCP perforating had been employed, (Refer to the Figures below). These guidelinesshould be used to select the appropriate drawdown for consolidated completions.
In unconsolidated sands, the intention is to cause perforation enlargement to remove thecrushed zone without collapsing the cavity or sanding in the guns. This requires that lessdrawdown is exerted during the well clean up.
The optimum clean up period is subjective and opinions range from 1gall to 5gall perperforation. The best method of clean up is to flow the well continually for several hoursafter perforating at normal offtake rates.

ARPO
ENI S.p.A.Agip Division
IDENTIFICATION CODE PAGE 247 OF 295
REVISIONSTAP-P-1-M-7100 0
9.3.3. Firing Heads
As described earlier, there are a number of different firing heads for various applications. .Wireline perforating systems are normally electrically trigger by passing an electrical signaldown the cable to the guns. However, in TCP systems there are a wide variety includingpressure operated, bar drop, wireline activated, etc.
Two very important considerations are safety during installation of TCP systems andredundancy in the event of a fault occurring in the primary firing system.
Safety
The use of tubing installed hydraulic actuated systems has the problem of how to conductpressure integrity tests on the completion with sufficient margin between the gun activationpressure and the highest test pressure applied. Obviously, it is undesirable to have a gunactuation pressure higher than the test pressure as a leak may occur while trying to triggerthe guns. Protecting the firing head from test pressure is a dangerous procedure as a plugmay leak will also cause premature detonation.
It is good practice to use a bar drop firing mechanism (deployed on wireline if possible asdropping the bar from surface may damage sensitive completion items) or wireline installedfiring heads which can be installed after the completion is set and tested. This provides fullsafety during gun deployment.
Redundancy
This is an important aspect, for if there is a firing head fault, gun recovery would be verycostly. Using wireline installed firing heads provides some redundancy in that the first headcan be retrieved and a second head deployed. There are other side-by-side systemsavailable which provide a tubing installed pressure activated firer with a secondaryreceptacle for a wireline installed firer.
9.3.4. Perforating Procedures
Refer to the ‘Completion Procedures Manual.

ARPO
ENI S.p.A.Agip Division
IDENTIFICATION CODE PAGE 248 OF 295
REVISIONSTAP-P-1-M-7100 0
Figure 9.C - Recommended Underbalance for Perforating Gas Zones in Stable Sandstones
Figure 9.D - Recommended Underbalance for Perforating Gas Zones in Stable Sandstones

ARPO
ENI S.p.A.Agip Division
IDENTIFICATION CODE PAGE 249 OF 295
REVISIONSTAP-P-1-M-7100 0
Figure 9.E - Recommended Underbalance for Perforating Shallow Unconsolidated Gas Sands
Figure 9.F - Recommended Underbalance for Perforating Shallow Unconsolidated Oil Sands

ARPO
ENI S.p.A.Agip Division
IDENTIFICATION CODE PAGE 250 OF 295
REVISIONSTAP-P-1-M-7100 0
10. ARTIFICIAL LIFT
The benefits and most commonly used artificial lift were described previously in section5.6.4. The application of artificial lift simply displaces the TPC curve downwards so that alower bottom-hole flowing pressure is achieved. In simple terms, the artificial lift injectsenergy into the system.
Energy can also be introduced by reservoir pressure maintenance. Reservoir developmentoptimisations studies are necessary to determine the relative technical and economicbenefits of the options and the timing of the investments.
In some fields, both pressure maintenance and artificial lift are used which defers theinstallation. In other cases, artificial lift from the outset is necessary to achieve theproduction and economic targets. Just as tubing size is critical to high PI wells, thenminimisation of the FBHP is critical to low PI, low pressure wells.
To summarise the reasons for the installation of artificial lift are to:
• Reduce the effects of declining bottom-hole pressures.• Offset the effects of increasing water production.• Overcome high friction effects of heavy viscous or waxy crudes.• Meet with targeted high offtake rates.• Kick off high GLR wells that die when shut-in.
The selection of the most appropriate artificial lift system involves a number of factors butmainly on specific well performance. Section 10.7 lists all the systems, their applications,design considerations, limitations and comparisons.
Selection of the method is also based upon operating costs and workover frequency costs.System life is difficult to predict as it is a function of operating conditions, e.g. ESP life canvary between days and five years depending on temperature, solids production, GLR andlack of particular experience with the system. Some systems are able to cope better withproduction problems than others which will obviously affect the choice.
Consideration of future artificial lift requirements must be taken during the planning stage,such as casing size, liner top setting, etc. These early decisions can save much expenselater, such as:
• Casing ID• Casing connection in on gas lift• Size and positioning of liners• Provision of a sump for rod pumpers• Pre-positioning of gas lift mandrels for gas lift and ASV system• Pre-installation of conduits for hydraulic pumps• Parallel bore for plunger lift• etc.

ARPO
ENI S.p.A.Agip Division
IDENTIFICATION CODE PAGE 251 OF 295
REVISIONSTAP-P-1-M-7100 0
10.1. GAS LIFT
The continuous gas lift method adds gas into the producing fluids which reduces thehydrostatic head and, hence the back-pressure on the formation.
The injection gas is supplied in a closed loop system in which it is taken from the separatorsand then compressed, dried if necessary and then delivered to the well (Refer to figure10.a).
The lift gas is normally pumped into the annulus and into the tubing through gas lift valvesinstalled in Side Pocket Mandrels (SPMs). Occasionally the gas is pumped into the tubingand the production taken up the annulus or in the annular space in a concentric completion.
Another less common application is Intermittent Gas Lift, also shown in figure 10.a, which isused to produce low volumes of liquid (<350stb/d) from wells with low BHFP (<0.1psi/ft).Due to the low liquid production, it must be produced in slugs by intermittently gas injectionthrough a motorised valve. A standing valve is sometimes necessary to prevent the gasfrom flowing into the formation.
In continuous gas lift, it is desirable to position the lower gas injection point as deep aspossible in the well, however this is limited by:
• available gas lift pressure• the flowing tubing pressure at the intended offtake rate• the depth of the packer and deepest gas lift mandrel• the differential required to close the upper valves closed (+/-20psi) and to
ensure that injection at the operating GLV is stable (between 50 and 500psi)
figure 10.b illustrates the fundamental principle of a gas lift design and operation. As can beseen the gas is injected down the annulus and into the tubing through the topmost valvelightening the fluid column in accordance with the total GLR curve shown. As the fluidgradient changes, the gas moves down to the next valve unloading the casing fluid and asthe reaches the second valve and lightens the fluid gradient from that point, the firstunloading valve closes so that all the gas passes through the second valve. This continuesin sequence for all other valves until reaching the operating valve where the casingpressure will drop below the initial kick-off pressure. During this process the well BHP willdrop to the point where the well will flow.
Production is determined by:
• reservoir pressure• PI• water cut• gas injection rate
Once the well reaches a stabilised rate, the injection is optimised to maximise production.As described in section 2.4.3, increasing GLR initially decreases the bottom-hole pressureon the TPC. There is an optimum GLR to produce stabilised flow for a particular tubing sizeand a minimum BHFP. As GLR requirements are subject to diminishing returns, most gas liftsystems are based on available gas supply volumes, Qi, or either the near optimum GLRwhich provides a BHFP within 20-50psi of the minimum.

ARPO
ENI S.p.A.Agip Division
IDENTIFICATION CODE PAGE 252 OF 295
REVISIONSTAP-P-1-M-7100 0
From this it is seen:
• Liquid rate, q, is dependent on the IPR and attainable BHFP.• Total GLR = Producing GLR + Injection GLR </= optimum GLR.• IGLR = Qi/q
Figure 10.A - Typical Gas Lift System

ARPO
ENI S.p.A.Agip Division
IDENTIFICATION CODE PAGE 253 OF 295
REVISIONSTAP-P-1-M-7100 0
Figure 10.B - Example Gas lift design
10.1.1. Impact On Completion Design
In recent times, much higher gas supply pressures have been used to enable deeper valvesto be reached or reduce the number of mandrels and valves required. This increasedpressure, however, applies more pressure on the annulus casing, hence gas tight orpremium connections are generally selected.
Modern gas lift systems usually now use SPMs with wireline GLVs to reduce servicingcosts. SPMs have relatively large ODs and this needs to be considered in the casingdesign. All mandrel depths are taken of the design as TVDs and these must be converted toMD. As the mandrels at deeper depths become increasingly closer, the spacing of them ismuch more critical.
Although gas lift valves incorporate check valves to prevent back flow, these are not reliableand as the annuli contain quite a considerable inventory of gas, an annulus safety system isinstalled for platform safety. This may again impact on the casing design.

ARPO
ENI S.p.A.Agip Division
IDENTIFICATION CODE PAGE 254 OF 295
REVISIONSTAP-P-1-M-7100 0
10.1.2. Common Problems
The worst problem that can arise is that the pressure losses in the gas injection system andslugging have been underestimated and that the valve spacing is too far apart.Operationally, the problems are usually inefficiency through upper gas lift valve or tubingleaks.
10.2. ELECTRICAL SUBMERISBLE PUMPS
ESPs greatest application is in moving large volume of low GOR (<100scf/stb) fluids. Theyare particularly popular for high rate undersaturated oil wells, high water cut wells and watersupply wells. Their main limitation is gas production but improved downhole separators andprocedures can now handle GORs up to 1,000scf/stb.
ESPs performance is best at stable conditions within +/-25% of the optimum rate. Versionswith variable frequency drives (VFD) are available or the use of surface chokes can be usedto increase the band of rate (50-190%) but incur higher capital and operating costs.
The construction of the ESP is a multi-staged centrifugal connected through a short shaft tothe downhole electric motor. Each stage consists of a rotating impeller and stationarydiffuser. The differential pressure or total dynamic head (TDH) developed by the pump is afunction of the pump flow rate which is relative to the head developed by each stage andobtainable from manufacturers publishing’s.
TDH=Ns Hs Eq. 10.A
where:
NS = number of stagesHS = head per stage
The pump characteristics are based on constant rotational speed which is dependent on theAC supply frequency, 3,500 rpm at 60 Hertz and 2,915 at 50 Hertz. Due to these highspeeds and pump construction it is obvious that sand production is very detrimental andthat emulsions are easily formed. To prevent sand production it is sometimes necessary toinstall a gravel pack or pre-packed screen for pump protection.
The ESP delivery capacity will vary according to:
• Well IPR• Reservoir pressure• Surface back-pressure• Electrical supply frequency
figure 10.c shows the most common types of ESP installations and the pump components.
Surface equipment usually includes a three phase transformer, motor controller and awellhead pack-off for the cable.
If possible, the installation should be designed to facilitate downhole separation of free gasand vented up the annulus which is necessary when the gas volume exceeds the pumpoperating limit (typically +/-10% of the total fluid volume). On offshore installations, gasproduction up the annulus may be a significant problem.

ARPO
ENI S.p.A.Agip Division
IDENTIFICATION CODE PAGE 255 OF 295
REVISIONSTAP-P-1-M-7100 0
As can be seen from the schematic, most pump installations are on the end of tubing andpositioned above the perforations or open hole. The motor is situated at the bottom of theassembly so that the well flow around the motor will dissipate the heat generated. If thepump has to be positioned below the interval, a shroud is used to draw the produced fluiddown past the motor. Bottom discharge pumps are used in powered dump flood wells.
Figure 10.C- Typical ESP Installations

ARPO
ENI S.p.A.Agip Division
IDENTIFICATION CODE PAGE 256 OF 295
REVISIONSTAP-P-1-M-7100 0
Other less common deployment methods are:
• Suspended on the cable and latched into a downhole receptacle.• On coiled tubing with the cable through the coil which is terminated with a
special wellhead arrangement.
Both of these suffer from some problems such as cable failures with the cable suspensionmethod and well control issues with the C/T mounted method (i.e. downhole safety systemsif the well can flow naturally). A recent development with the later is in Norway wheredownhole safety is satisfied by the installation of shear seal capability below the coiledtubing hanger.
10.2.1. ESP Performance
It is normal procedure to select the largest pump that will fit into the production casing(especially if this was catered for in the planning stage). Small casing or liners will obviouslylimit the pump size selection. ESP sizes and capacities are shown in table 10.j below.
Casing Size, ins Pump OD, ins Motor OD, ins Rate, stb/d Power, HP TDH, ft
41/2 3.375 3.750 100-1,900 50-125 5,000-12,000
51/2 4.000 4.500 200-5,000 100-300 5,000-12,000
7 5.625 5.437 1,000-16,000 200-650 5,000-12,000
85/8 6.750 7.375 4,000-26,000 400-850 3,000-10,000
103/4 8.625 N/A 12,000-33,000 500-1020 2,000-5,000
133/8 11.250 N/A 24,000-100,000 500-1030 500-3,500
Table 10.J - ESP Capacity Ranges
Two approaches are commonly used to evaluate an ESP system:
1) Pre-select the production target and corresponding BHFP and determine the TDH andpump size and depth required to meet this rate. This often carried out by plotting thepressure traverses above and below the pump (Refer to figure 10.d).
2) Pre-select the maximum pump horsepower, or number of stages, and determine theattainable pump rate with:
• a fixed IPR and various tubing sizes• a fixed tubing size and various IPR options
In this approach the pump performance curve is often plotted below the systemperformance curves. An example this to optimise the number of stages for amaximum pump HP is shown in figure 10.e.

ARPO
ENI S.p.A.Agip Division
IDENTIFICATION CODE PAGE 257 OF 295
REVISIONSTAP-P-1-M-7100 0
Figure 10.D - Example ESP Design for a Pre-selected Rate

ARPO
ENI S.p.A.Agip Division
IDENTIFICATION CODE PAGE 258 OF 295
REVISIONSTAP-P-1-M-7100 0
Figure 10.E- Example ESP Design for a Pre-selected HP
ARPO
ENI S.p.A.Agip Division
IDENTIFICATION CODE PAGE 259 OF 295
REVISIONSTAP-P-1-M-7100 0
10.2.2. Impact On Completion Design
The key to an efficient ESP design is heat removal and insulation material selection for theactual operating temperatures and environment, especially when temperatures are in theregion of 250oF. The clearance between the pump and the casing should be small enoughthat a flow velocity of a minimum of 1ft/sec is achieved. In large casings, a shroud must beused to provide this rate. Centralisation of the pump is also critical.
The pump should be set in a straight section of casing to avoid bending and the cableneeds to firmly attached to the tubing for support by cable clamps (two per joint).Centralisation and crush resistant clamps should be installed across doglegs.
When re-completing a ESP well the pump should be moved slightly from the originalposition to help minimise any casing corrosion due to eddy currents.
Casing design is obviously has a large impact on the completion design or in the case of anESP completion, vice versa. Also consideration must be given to the optimum tubing sizeand cable dimensions to ensure they can be accommodated in the casing.
The completion design is also affected if downhole separation is required in conjunctionwith downhole safety.
Tubing hanger and penetration systems for packers have been well developed now for fasteasy installation with the testing of the connections carried beforehand in the workshop. Ifproperly planned an ESP completion only requires one onsite termination.
10.2.3. Common Problems
The biggest problem with ESP completions is short running time before failure with the costimpact for re-completion. However, ESP systems are becoming evermore reliable. The mostcommon problems are due to:
• Bad installation procedures.• Inadequate system analysis leading to the system operating outside the range.• Unsuitable cable insulation material for the conditions.• Too much free gas and no enlarged intakes stages.• Sand production.• Too many frequent start ups when there is no soft start facilities.• Scaling up of the impellers.• Poor voltage supply stability.

ARPO
ENI S.p.A.Agip Division
IDENTIFICATION CODE PAGE 260 OF 295
REVISIONSTAP-P-1-M-7100 0
10.3. HYDRAULIC PUMPING SYSTEMS
Hydraulic pumping systems are attractive alternative to ESP systems where there is hightemperatures, depth, deviation or severe operating environments. The downside is therequirement for two reasonably large conduits to minimise fluid pressure losses, maintaininga clean solids free power fluid and the high capital and operating costs. It is also popularwhere there is insufficient gas for a gas lift system and is a viable alternative to rod pumpsfor deep (>8,000ft) wells.
The two simplest and common systems are the Jet Pump and the Piston Pump which areinterchangeable in most instances which provides great flexibility in coping with changeablewell conditions. The pumps can be installed and retrieved by wireline or pumping methodusing swab cups, hence providing lower servicing costs.
The conduits for the power fluid and returns can be the annulus with a single tubing,however this exposes the annulus to potential corrosion so, if this is a problem, dual tubingstrings can be used either parallel or concentric. The annulus is sometimes required for gasventing and in this case a dual string is required.
Piston Pump
The piston pump is a reciprocating pump operated with a drive piston which automaticallyshuttles backwards and forwards exhausting the spent power fluid into the returns.
In effect the piston pump is equivalent to the rod pump except that the pump drive issubsurface but can produce up to 8,000stb/d although it is normally used to produce<2,000stb/d. Their application is commonly for deviated wells between 8,000-18,000ftalthough high surface power fluid pressures are required below 12,000ft.
There is flexibility in the system as pump rates are controlled by controlling the power fluidsupply rate.
There is a large selection of pump sizes/stroke length available for a wide range ofoperating conditions.
Jet Pump
The jet pump uses no moving parts and imparts momentum into the fluid using the venturieffect with a jet, throat and diffuser. The size of the these can be varied to pump volumes of100-15,000stb/d although free pump systems are limited to 8,000stb/d with 41/2” tubing.
To prevent cavitation, it is recommended to submerge the pump by at least 20% of the TDHso is better suited to respectfully productive, or restricted offtake target wells.
As there is no moving parts, the pump is not as sensitive to damage and lower qualitypower fluids can be used and can be used in higher GOR wells up to 3,000scf/stb. Howeverpump efficiency is low at 33-66% and large production rates can only be achieved in highrate installations.
Pump performance is a complex function of GOR, pump intake pressure, supply pressureand rate. Optimisation is generally through using supplier’s computer software. Apreliminary calculation of the pump intake or output curve can be made by hand. Themaximum attainable performance have been summarised in table 10.k below.

ARPO
ENI S.p.A.Agip Division
IDENTIFICATION CODE PAGE 261 OF 295
REVISIONSTAP-P-1-M-7100 0
Head Ratio Flow Ratio
0.45 0.5
0.25 1.0
0.17 1.5
0.10 2.0
Table 10.K- Jet Pump Maximum Performance
In table 10.k above:
Head Ratiopump output pressure pump inlet pressure
downhole powerfluid pressure pump output pressure
Flow Ratioreservoir production rate
power fluid rate
= −−
=
Often the maximum power fluid supply pressure and rate is fixed by surface equipmentrating, e.g. p<5,000psi, qPF <4,500stb/d.
When calculating bottom hole pressures, the completion configuration and power fluid rateto the production to obtain the total discharge rate. The pump intake curve (PIC) can thenbe generated using table 10.k above plotted against well IPR (Refer to figure 10.f).
Figure 10.F- Example Jet Pump Design Curve

ARPO
ENI S.p.A.Agip Division
IDENTIFICATION CODE PAGE 262 OF 295
REVISIONSTAP-P-1-M-7100 0
Turbine Pumps
The hydraulic turbine pump developed by Weir Pumps is an alternative to the ESP forproducing very large volumes of fluid, 2,000-100,000stb/d. It has the same principle ofoperation as the ESP but the motor is replaced by a hydraulic turbine which rotate the shaftat 5,000-10,000rpm. This provides higher lift capacities (head and volume) per stage,therefore the units are much shorter approximately 10% of the ESP.
The operating range is much greater as the pump can be controlled by varying the supplypressure giving 10-100% rate and 20-50% TDH at reduced rates.
Their reliability is still suspect due to the high rotating speed and metallurgy problems.
10.3.1. Impact On Completion Design
The casing size is obviously important here to accommodate the pump size and perhapstwo tubing strings. Sometimes concentric completions are preferred or the annulus is usedbut consideration must be given to potential corrosion due to oxygen in the power fluid. Likethe piston pump solids free power fluid is essential.
Like the ESP, gas venting may be necessary which would require a third conduit (generallythe annulus). Occasionally the DHSV is controlled by pressure from the pump.
10.4. ROD PUMPS
The most common pumping system on low rate land wells is the rod or beam pumping. It isusually limited to shallow wells (<8,000ft) producing less than 500stb/d although they canproduce up to 2,000stb/d.
The system consists of three elements, the downhole pump assembly, the sucker rod andthe surface pumping unit.
The annulus is usually left open and used to vent any free gas that is separated downhole.Tubing is used as the production conduit and contains the rods preventing wear andcorrosion to the annulus. The tubing is usually anchored to the casing and pulled intotension to reduce tubing movement, buckling and, hence rod wear.
There are two versions of bottom-hole pump, the tubing retrievable barrel and the rodretrievable barrel. The tubing pump requires the tubing to be pulled to retrieve the barreland the rod pump barrel is retrieved when pulling the rods. The tubing pump has the largestcapacity but is more costly to repair than the rod pump which is the most common.
The pump displacement, PD, is defined by the plunger stroke, SP, and the pump speed, N,the plunger diameter, D and the amount of liquid fillage and/or slippage past the plunger, EP
= 0.7 to 9.5.
PD = Ct x Sp x N x D2 x Ep
Eq. 10.B
where:
EP = Pump efficiencyCt = Correction factor 0.1166 for oilfield units, (in, spm, in2, stb/d)
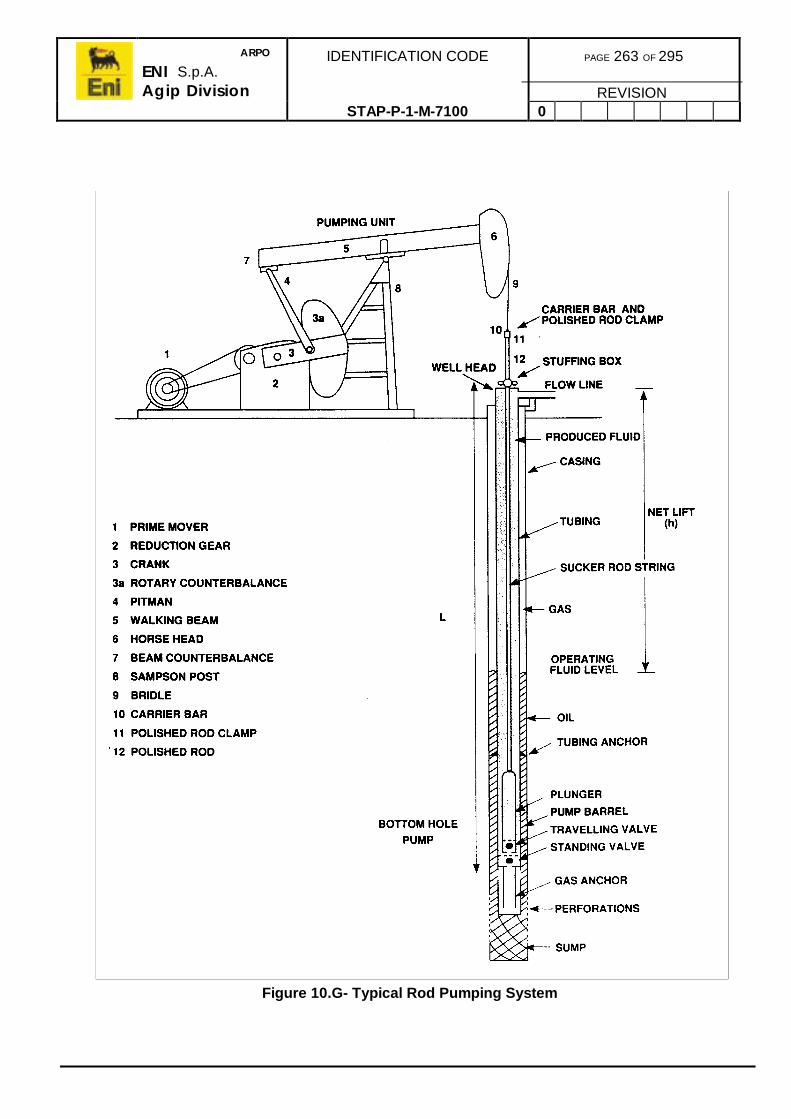
ARPO
ENI S.p.A.Agip Division
IDENTIFICATION CODE PAGE 263 OF 295
REVISIONSTAP-P-1-M-7100 0
Figure 10.G- Typical Rod Pumping System

ARPO
ENI S.p.A.Agip Division
IDENTIFICATION CODE PAGE 264 OF 295
REVISIONSTAP-P-1-M-7100 0
As the rod suffers from stretch and dynamic forces, SP will not be the same as the stroke atsurface, S, therefore load-displacement plot forms the basis for pump design and analysis.The fluid load, Fo, carried by the rods on the upstroke is dependent on the net lift, H, whichis the vertical distance from the operating fluid level (OFL) in the annulus to surface plus theequivalent head of any surface back-pressure. It also depends on fluid SG or density. APIrecommends ignoring the area of the rods when calculating this load:
Fo = Ct x SG x D2 x H
where:
Ct = 0.340 in oilfield units (SG, in2, ft, lbs)
This load can be estimated from dynamometer surveys, which measure the rod load versusdisplacement at the surface and serves the most effective means of diagnosing pumpproblems.
As the loads on the polished rod includes fluid load, dynamic forces and rod weight, the rodweights may be relatively large in deep wells and in these cases a tapered rod string ispreferred where the rod diameter is larger with increasing load. Buoyancy varies throughoutthe cycle but it is generally taken on the downstroke when the travelling valve is open.
Acceleration and friction are also factors in dynamic loading with the peak polished rod loadon the upstroke will be significantly higher than the sum of the rod and fluid loads. Similarly,on the downstroke, the minimum will be less than the buoyant weight of the rods. Pumpstroke efficiency is a function of pump speed and rod loading. The dynamics also cause therods to oscillate harmonically like a stiff spring.
Typical pumping speeds are 8 to 15spm which amounts to 4.2 to 7.9 million cycles per year,therefore the rod design must focus on minimising fatigue failures which is exacerbated bycorrosion in the operating environment.
The surface pump unit is usually a beam type although other concepts have beendeveloped. The surface prime mover and gearbox have been developed over the years tocater for the rod pump to reduce failures.
System design is very complex and is an iterative process normally carried out by computersoftware. API have produced a programme to generate a set of design curves published inAPI RP11L and provided some general results in Bulletins 11L3 and 11L4 which are auseful starting point for design. However, in 11L4, API used 100% efficiency and pumprates which are higher than those generally found in the field, therefore, it is advisable toenter a curve which is 100 to 200% of the intended target for scoping out the requiredequipment capacity. It is also not reliable for heavy oil wells (<20oAPI) unless correctionfactors are applied for fluid vicosities and lack of rod weight on the downstroke. Rod fallproblems often cut restrict pump rates to 1.5 to 2.5spm which lead the use of long strokepumps. Sand problems are often a problem with high viscous crudes which increase wearof the pump parts.

ARPO
ENI S.p.A.Agip Division
IDENTIFICATION CODE PAGE 265 OF 295
REVISIONSTAP-P-1-M-7100 0
10.4.1. Impact On Completion Design
If free gas is expected then a packer should not be installed to allow the gas to vent up theannulus if it is planned to convert a completion to rod pump lift within a few years unlessrequired for zonal isolation.
If a well has to be pumped which is below the bubble point, it is advised to set the pumpbelow the producing interval to aid gas separation, maximise drawdown and minimiseperforation blocking by fill. If a well is fractured, the pump must be set above theperforations as frac sand can damage the pump.
The casing geometry must be sufficient enough to enable the gas to percolate through thefluid column against the down-flow.
10.5. SCREW PUMP SYSTEMS
Screw or progressive cavity pump is a rotary positive displacement pump consisting of arubber stator and stainless steel rotor. The rotary drive to the downhole pump is throughsucker rods from a prime mover through a gearbox.
They rates of between 5 to 500stb/d, although in some circumstances capacities of1,500stb/d is possible, on heavy oil wells or viscous emulsions where conventional rodpumps are hindered by rod fall. They have an advantage in that they can handle some sandproduction and less costly.
The production rate is proportional to the rotary speed and are determined frommanufacturers charts, generally between 50-100rpm in heavy oil and 500rpm in light oils.
The selection of the material for the rubber stator is the key for operational life in the wellenvironment.
10.6. PLUNGER LIFT
Plunger lift are used on high GLR wells that produce liquids at relatively low rates(<500stb/d). The tubing/casing annulus is used to store gas energy provided to the tubingwhen the well is opened up. This energy is used to drive the plunger up to surface carryinga small slug of liquid. After production of the following tail gas when the liquid begins to killthe well the plunger is dropped again and the cycle repeated.
It is particularly useful for de-watering gas wells. Operating requirements are:
• GLR >500scf/stb• PI <1stb/d/psi• Plunger velocity 700 to 1,000ft/min
Efficiency of this system decreases with depth and PI but increases with tubing size. It isessential that the completion tubing is parallel and drifted to ensure correct operation of theplunger.

ARPO
ENI S.p.A.Agip Division
IDENTIFICATION CODE PAGE 266 OF 295
REVISIONSTAP-P-1-M-7100 0
Figure 10.H- Typical Screw Pump Installation

ARPO
ENI S.p.A.Agip Division
IDENTIFICATION CODE PAGE 267 OF 295
REVISIONSTAP-P-1-M-7100 0
Figure 10.I - Typical Plunger Lift Installation

ARPO
ENI S.p.A.Agip Division
IDENTIFICATION CODE PAGE 268 OF 295
REVISIONSTAP-P-1-M-7100 0
10.7. SUMMARY ARTIFICIAL LIFT SELECTION CHARTS
10.7.1. Design Considerations And Comparisons
Consideration Rod Pumping Screw Pumping ESP HydraulicPiston
Pumping
Hydraulic JetPumping
ContinuousGas Lift
IntermittentGas Lift
Plunger Lift
Capital Cost Low tomoderateincrease withdepth and largerunits.
Low increasewith depth andlarger rates.
Relatively lowcapital cost ifcommercialelectric poweravailable. Costsincrease ashorsepowerrises.
Varies but oftencompetitive withrod pumps.Multiple well,central systemsreduce cost perwell but is morecomplicated.
Competitive withrod pump. Costincreases withhigherhorsepower.
Low wellequipment costsbut lines andcompressioncosts may behigh. Centralcompressionsystem reducescost per well.
Same ascontinuous flowgas lift.
Very low, onlylow cost wellequipment ifno compressorrequired.
DownholeEquipment
Reasonablygood rod designand operatingpracticesneeded. Databank of rod andpump failuresbeneficial. Goodselection,operating andrepair practicesneeded rodsand pump.
Good designand operatingpracticesneeded. Mayhave problemswith selection ofappropriatestatorelastomer.
Requires propercable in additionto motor,pumps, seats,etc. Gooddesign plusgood operatingpracticesessential.
Proper designplus goodoperatingpracticesessential.requirespowerfulconductor. Freepump andchoose powerfuloption.
Requirescomputerdesignprogramme forsizing. tolerantto moderatesolids in powerfluid. No movingparts in pump.Long service lifeand simplerepairprocedures.
Good valvedesign andspacingessential.Moderate costfor wellequipment(valves andmandrels).Choice ofwirelineretrievable orconventionalvalves.
Unload tobottom with gaslift valves.Considerchamber or highPI and low BHPwells.
Operatingpractices haveto be tailoredto each well foroptimisation.Someproblems withstickingplungers.
Efficiency(outputhydraulic HPdivided byinput HP)
Excellent totalsystemefficiency. Fullpump fillageefficiencytypically about50-60% feasibleif well is notover-pumped.
Excellent. Mayexceed rodpumps for idealcases. Reportedsystemefficiency 50-70%. Moreoperating dataneeded.
Good for highrate wells butdecreasessignificantly for<1,000 BFPD.Typically totalsystemefficiency isabout 50% forhigh rate wellbut for <1,000BID, efficiencytypically is 40%.
Fair to good, notas good as rodpumping owingto GLR, frictionand pump wear.Efficienciesrange from 30-40% with GLR>100. May behigher withlower GLR.
Fair to poor.Maximumefficiency only30%. Heavilyinfluenced bypower fluid plusproductiongradient.Typicallyoperatingefficiencies of10-20%.
Fair increasesfor wells thatrequire smallinjection GLRs.Low wells forwells requiringhigh GLRs.Typicalefficiencies at20% but rangefrom 5-30%.
Poor, normallyrequires a highinjection gasvolume/bbl fluid.Typical liftefficiency is 10-50% improvedwith plungers.
Excellent forflowing wells.No inputenergyrequiredbecause ituses the well.Good evenwhen smallsupplementarygas is added.
Flexibility Excellent, canalter strokespeed, length,plunger size andrun time tocontrolproduction rate.
Fair, can alterspeed.Hydraulic unitprovidesadditionalflexibility but atadded cost.
Poor. Pumpsusually run at afixed speed.Requires carefulsizing. VSDprovides moreflexibility butadded costs.Time cyclingnormallyavoided. Mustsize pumpproperly.
Good toexcellent. Powerfluid rate andspeed ofdownholepump.Numerouspump sizes andpump/engineratios adapt toproduction anddepth needs.
Good toexcellent. Canvary power fluidrate andpressure adjuststhe productionrate and liftcapacity.Selection ofthroat andnozzle sizesextend range ofvolume andcapacity.
Excellent. Gasinjection ratevaried to changerates. Tubingneeds to besized correctly.
Good, mustadjust injectiontime and cyclesfrequently.
Good for lowvolume wells.Can adjustingestion timeand frequency.
Miscellaneousproblems
Stuffing boxleakage may bemessy and apotential hazard.Anti-pollutionstuffing boxesare available.
May havelimited servicein some areas.Because this anewer method,field knowledgeand experienceare limited.
Requires ahighly reliableelectric powersystem. Methodsensitive to ratechanges.
Power fluidsolids controlessential. Need15ppm of 15µmparticle sizemax. to avoidexcessiveengine wear.Must addsurfactant to awater powerfluid forlubrication.Triplex plungerleakage controlrequired.
More tolerant ofpower fluidsolids, 200ppmof 25µm particlesize acceptable.Dilutents maybe added ifrequired. Powerwater (fresh,produced orseawater)acceptable.
A highly reliablecompressor with95+% run timerequired. Gasmust bedehydratedproperly to avoidgas freezing.
Labour intensiveto keep timetuned otherwisepoorperformance.maintainingsteady gasshow oftencauses injectiongasmeasurementand operatingproblems.
Plunger hang-up or stickingmay be amajor problem.
Table 10.L - Design Considerations and Overall Comparisons (pg1)

ARPO
ENI S.p.A.Agip Division
IDENTIFICATION CODE PAGE 269 OF 295
REVISIONSTAP-P-1-M-7100 0
Consideration Rod Pumping Screw Pumping ESP HydraulicPiston
Pumping
Hydraulic JetPumping
ContinuousGas Lift
IntermittentGas Lift
Plunger Lift
OperatingCosts
Very low forshallow tomedium depth(<7,500ft) andlocations withlow production(,400BFPD).
Potentially lowbut short run lifeon stator or rotorfrequentlyreported.
Varies, if HP ishigh, energycosts are high.High pullingcosts resultfrom short runlife. Other repaircosts are high.
Often higherthan rod pumpeven for freesystems. Shortrun lifeincreases totaloperating costs.
High cost owingto HPrequirement.Low pumpmaintenancecost typical withproperly sizedthroat and nose.
Well costs low.Compressioncosts vary onfuel cost andcompressormaintenance.Key is to injectas deeply aspossible withoptimum GLR.
Same ascontinuous flowgas lift.
Usually verylow,
Reliability Excellent. Runtime efficiency>95% if goodoperatingpractices areadopted andcorrosion, waxasphaltenes,solids,deviations, etc.,are controlled.
Good. Normallyover-pumpingand lack ofexperiencedecreases runtime.
Varies.Excellent forideal gas liftcases, poor forproblem areas.Very sensitive tooperatingtemperaturesand electricalmalfunctions.
Good with acorrectlydesigned andoperatedsystem.Problems orchanging wellconditionsreducedownhole pumpreliability.Frequentdowntimeresults fromoperationalproblems.
Good withproper throatand nose sizingfor the operatingconditions. Mustavoid operatingin cavitationrange of jetpump throat,related to pumpintake pressure.More problemsif pressures>4,000psig.
Excellent ifcompressionsystem isproperlydesigned andmaintained.
Excellent if thereis an adequatesupply ofingestion gasand adequatelow pressurestorage volumefor injection gas.System must bedesigned for theunstable gasflow rates.
Good if wellproduction isstable.
Salvage Value Excellent, easilymoved andgood market forusedequipment.
Fair to poor.Easily movedand somecurrent marketfor usedequipment
Fair. Sometrade in value.Poor openmarket values.
Fair market fortriplex pumps,good value forwellsite systemthat crane canmove easily.
Good. Easilymoved. Sometrade in value.Fair market fortriplex pump.
Fair. Somemarket for goodusedcompressorsand some tradein value formandrels andvalves.
Same ascontinuous flowgas lift.
Fair. Sometrade in value.Poor openmarket value.
System (total) Straightforwardand basic.procedures todesign, installand operatesfollowing APIspecificationsandrecommendedpractices. Eachwell needs anindividualsystem.
Simple to installand operate.Limited provendesign,installation andoperatingspecificationsEach well needsan individualsystem.
Fairly simple todesign butrequires goodrate data.System notforgiving.Requiresexcellentoperatingpractices.Follow APIrecommendedpractices indesign, testingand operation.Typically eachwell is anindividualproducer usinga commonelectric system.
Simple manualor computerdesign, typicallyused. Freepump easilyretrieved forservicing.Individual wellunit very flexiblebut extra cost.Requiresattention.Central plantmore complex,usually resultsin test andtreatmentproblems.
Computerprogrammetypically usedfor design.Basic operatingproceduresneeded fordownhole pumpand wellsiteunit. Free pumpeasily retrievedfor onsite repairor replacement.Downhole jetoften requirestrial and error toarrive atbest/optimumjet.
An adequatevolume, highpressure, drynon-corrosiveand clean gassupply source isneededthroughout theentire life.Systemapproachneeded. Lowback-pressurebeneficial. Gooddata needed forvalve designand spacing.APIspecificationsanddesign/operating recommendedpractices shouldbe followed.
Same ascontinuous flowgas lift.
Individual wellor system.Simple todesign, installand operate.Requiresadjusting andplungermaintenance.
Usage/ Outlook Excellent. Usedon about 85% ofUS artificial liftwells. Thenormal standardartificial liftmethod.
Limited torelativelyshallow wellswith low rates.Used on lessthan 0.5% of USlifted wells.Used primarilyon gas well de-watering.
An excellenthigh rateartificial liftsystem. Bestsuited for<200oF and>1,000BFPDrates. Mostoften used onhigh water cutwells.
Often used as adefault artificiallift system.Flexibleoperation, widerate rangesuitable forrelatively deep,high volume,hightemperaturedeviated oilwells. Used on<2% of US liftedwells.
GOR try highervolume wellsrequiring flexibleoperation.System willtolerate widedepth ranges,hightemperatures,corrosive fluids,high GOR andsignificant sandproduction.Used on <1% ofUS lifted wells.Sometimesused to testwells that willnot flowoffshore.
Good, flexible,high rateartificial liftsystem for wellswith highbottom-holepressures. Mostlike a flowingwell. Used onabout 10% ofUS lifted wells,mostly offshore.
Often used as adefault artificiallift method inlieu of suckerrod pumps. Alsoa default for lowbottom-holepressure wellson continuousgas lift. Used on<1% of US liftedwells.
Essentially alow liquid rate,high GLR liftmethod. Canbe used forextending flowlife orimprovingefficiency.Ample gasvolume and/orpressureneeded forsuccessfuloperation.Used on <1%of US liftedwells.
Table 10.M - Design Considerations and Overall Comparisons (Pg2)

ARPO
ENI S.p.A.Agip Division
IDENTIFICATION CODE PAGE 270 OF 295
REVISIONSTAP-P-1-M-7100 0
10.7.2. Operating Conditions Summary
Consideration Rod Pumping Screw Pumping ESP HydraulicPiston
Pumping
Hydraulic JetPumping
ContinuousGas Lift
IntermittentGas Lift
Plunger Lift
Casing sizelimits (restrictstubing size)
Problems onlyin high ratewells requiringlarge plungerpumps. Smallcasing size (4.5and 5.5ins) maylimit free gasseparation.
Normally noproblem for4.5ins casingand larger butgas separationmay be limited.
Casing size willlimit use of largemotor andpumps. Avoid4.5ins casing.Reducedperformanceinside 5.5inscasingdepending ondepth and rate.
Larger casingrequired forparallel free orclosed systems.Small casing(4.5 and 5.5ins)mat result inexcessivefriction lossesand limitsproduction rate.
Small casingsize often limitsproducing rateowing to high(unacceptable)friction losses.Larger casingmay be requiredif dual stringsrun.
The use of 4.5and 5.5inscasing with 2insnominal tubingnormally limitsrates to<1,000stb/d. Forrates>5,000stb/d use>7ins casingand >3.5instubing needed.
Small casing(4.5 and 5.5ins)normally is not aproblem for thisrelatively lowvolume lift.
Small casingsuitable for thislow volume lift.Annulus musthave adequategas storagevolume.
Depth limits Good, rods ofstructure maylimit rate atdepth.Effectively about500stb/d at7,500ft and150stb/d at15,000ft.
Poor, limited torelativelyshallow depths,possibly 5,000ft.
Usually limitedto motor HP ortemperature.Practical depthabout 10,000ft.
Excellent,limited by powerfluid pressure(5,000psi) orHP. Lowvolume, high lifthead pumpsoperating atdepths to17,000ft
Excellent,similar limits asreciprocatingpump. Practicaldepth of20,000ft.
Controlled bysystem injectionpressure andfluid rates.Typically for1,000stb/d with2.5ins nominaltubing. 1,440psilift system andlift system and1,000 GLR, hasan injectiondepth of about10,000ft.
Usually limitedby fallback, fewwells >10,000ft.
Typically<10,000ft.
IntakeCapability
Excellent,<25psig feasibleprovidedadequatedisplacementand gas venting.Typically about50 to 100psig.
Good, <100psiprovidedadequatedisplacementand gas venting.
Fair. if little freegas (i.e.>250psi pumpintakepressure). Poorif must handle>5% free gas.
Fair but not asgood as rodpumping. Intakepressure<100psigusually resultsin frequentpump repairs.Free gasreducesefficiency andservice life.
Poor to fair,>350psig to5,000ft with lowGLR. Typicaldesign targets25%submergence.
Poor restrictedby the gradientof the gas liftedfluid. Typicallymoderate rate islimited to about100psi/1,000ftinjected depth.Thus the back-pressure on10,000ft wellmay be>1,000psig.
Fair when usedwithoutchambers. PIP>250psi for10,000ft well.Good whenused withchamber. PIP of<250psi feasibleat 10,000ft.
Good, bottom-hole pressures<150psi at10,000ft forlow rate, highGLR wells.
Noise Level Fair, moderatelyhigh for urbanareas.
Good with thesurface primemover causingthe only noise.
Excellent withlow noise. Oftenpreferred inurban areas ifproduction rateis high.
Good low wellnoise. Wellsitepower fluid unitscan be soundproofed.
Same as pistonpump.
Low at well butnoisy atcompressor.
Same ascontinuous flow.
Low.
Obtrusiveness Size andoperation aredrawbacks inpopulated andfarming areas.Special lowprofile units areavailable.
Good low profilesurfaceequipment.
Good low profilebut requirestransformerbank.Transformermay causeproblems inurban areas.
Fair to goodwellheadequipment haslow profile.Requiressurface treatingand highpressurepumpingequipment.
Same as pistonpump.
Good low profilebut must providefor compressor.Safetyprecautionsmust be takenfor highpressure gaslines..
Same ascontinuous flow.
Low.
Prime moverflexibility
Good, bothengines ormotors can beused easily.Motors are morereliable andflexible.
Good, bothengines ormotors can beused.
Fair, requires agood powersource withoutspikes orinterruptions.Higher voltagescan reduce I2Rlosses
Excellent. Primemover can beelectric motor,gas or dieselfired engines ormotors.
Same as pistonpump.
Good, engines,turbines ormotors can beused forcompression.
Same ascontinuous flow.
None normallyrequired.
Surveillance Excellent, canbe easilyanalysed basedon well test,fluid levels, etc.Analysisimproved by useofdynamometersand computers.
Fair, analysiscan be basedon productionand fluid levelsonly. Notpossible to usedynamometersand pump-offcards.
Fair based onelectricalchecks butspecialequipmentneededotherwise.
Good to fair.Downhole pumpperformancecan be analysedfrom surfacepower fluid rateand pressure,speed andproducing rate.Bottom-holepressureobtained withfree pumps.
Same as pistonpump.
Good toexcellent. Canbe analysedeasily. Bottom-hole pressureand productionlog surveyseasily obtained.Optimisationand computercontrol beingtried.
Fair butcomplicated bystanding valveand fallback.
Good butdepends ongood well testand pressurecharts.
Table 10.N - Operating Conditions Summary

ARPO
ENI S.p.A.Agip Division
IDENTIFICATION CODE PAGE 271 OF 295
REVISIONSTAP-P-1-M-7100 0
Consideration Rod Pumping Screw Pumping ESP HydraulicPiston
Pumping
Hydraulic JetPumping
ContinuousGas Lift
IntermittentGas Lift
Plunger Lift
Testing Good, Welltesting is simplewith fewproblems usingstandardavailableequipment andprocedures.
Good, same asrod pumping.
Good, Welltesting is simplewith fewproblems. Highwater cut andhigh rate wellsmay require afree waterknock-out.
Fair. Welltesting withstandardindividual wellunits presentsfew problems.Well testingwith a centralsystem is morecomplexrequiringaccurate powerfluidmeasurement.
Same as pistonpump. Threestageproduction testscan beconducted byadjustingproduction steprates. Apressurerecorder mustbe used tomonitor intakepressures.
Fair. Welltestingcomplicated byinjection gasvolume/rate.Formation GLRobtained bysubtractinginjected gasfrom totalproduced gas.Gasmeasurementerrors arecommon.
Poor. Welltestingcomplicated byinjection gasvolume/rate..Measurement ofboth input andoutflow gas is aproblem.Intermittent flowcan causeoperatingproblems withseparators.
Well testing issimple withfew problems.
Time cycle andpump-offcontroller’sapplication
Excellent if wellcan be pumped-off.
Good. Avoidshutdown inhighviscosity/sandproducers.
Poor. Soft startand improvedseals andprotectorsrecommended.
Poor, ispossible but notnormally used.Usuallycontrolled onlyby displacementchecks. Pump-off control notdeveloped.
Poor. Does notappearapplicableowing to intakepressurerequirementhigher thanpump-off.
Not applicable. Poor. Cyclemust beperiodicallyadjusted.Labour intensive
Not applicable.
Table 10.O - Operating Conditions Summary (Pg2)

ARPO
ENI S.p.A.Agip Division
IDENTIFICATION CODE PAGE 272 OF 295
REVISIONSTAP-P-1-M-7100 0
10.7.3. Artificial Lift Considerations
Consideration Rod Pumping Screw Pumping ESP HydraulicPiston
Pumping
Hydraulic JetPumping
ContinuousGas Lift
IntermittentGas Lift
Plunger Lift
Corrosion/scale handlingability
Good toexcellent.frequently forboth corrosionand scalecontrol.
Good. Batchtreatmentinhibitor useddown annulusfeasible.
Fair. Batchinhibitiontreatment onlyto intake unlessshroud is used.
Good toexcellent. Batchor continuousinhibitiontreatment canbe circulatedwith power fluidfor effectivecontrol.
Good toexcellent.Inhibitor mixedwith power fluidmixes withproduced fluidsat entry of jetpump throat.Batch treatdown annulus isfeasible.
Good. Inhibitorin the injectiongas and/orbatch inhibitingdown tubingfeasible. Stepsmust be takento avoidcorrosion ininjection gaslines.
Same ascontinuous flow.
Fair. Normalproductioncycle must beinterrupted tobatch treat thewell.
Crooked/deviated holes
Fair, increasedload and wearproblems. Highangle deviatedholes (>70o) andhorizontal wellsare beingproduced. Somesuccess inpumping15o/100ft usingrod guides.
Poor to fair.Increased loadand wearproblems.Currently veryfew knowninstallations.
Good. Fewproblems.Limitedexperience inhorizontal wells.Requires longradius wellborebends to getthrough.
Excellent iftubing can berun in the well.Pump willnormally passthrough thetubing. Freepump retrievedwithout pullingtubing. Feasibleoperation inhorizontal wells.
Excellent, shortpump can passthrough doglegsup to 24o/100ftin 2ins nominaltubing. Samecondition ashydraulic pistonpump.
Excellent. Fewwirelineproblems up to70o deviation forwirelineretrievablevalves.
Same ascontinuous flow.
Excellent.
Dualapplication
Fair. Parallel2x2ins low ratedual feasibleinside 7inscasing. Dualinside 5inscasing currentlynot in favour.Gas is aproblem forlower zone.Increasedmechanicalproblems.
No knowninstallations.
No knowninstallations.Larger casingwould beneeded.Possiblerunning andpullingproblems.
Fair. Threestring non-ventedapplicationshave beenachieved withcompleteisolation ofproduction andpower fluid fromeach zone.Limited to lowGLRs andmoderate rates.
Same as pistonpump except itcan possiblyhandle higherGLRs but atreducedefficiency.
Fair. Dual gaslift is commonbut goodoperating ofdual lift iscomplicated andinefficientresulting inreduced rates.Parallel 2x2insnominal tubinginside 7inscasing and3x3ins tubinginside 95/8inscasing feasible.
Same ascontinuous flow.
No noneinstallations.
Gas handlingability
Good if can ventand use naturalgas anchor withproperlydesigned pump.Poor if mustpump >50% freegas.
Poor if it mustpump any freegas..
Poor for freegas >5%through pump.Rotary gasseparatorshelpful if solidsnot produced.
Good to fair.Concentric fixedpump or parallelfree permits gasventing withsuitabledownhole gasseparator belowpump intake.Casing freepump limited tolow GLRs.
Similar to pistonpump. Free gasreducesefficiency buthelps lift. Ventfree gas ifpossible. Use agas anchor.
Excellent.Produced gasreduces needfor injection gas.
Same ascontinuous flow
Excellent.
Offshoreapplication
Poor. Mustdesign for unitsize, weight andpulling unitspace. Mostwells aredeviated andtypicallyproduce sand.
Poor. May havesome specialapplicationoffshore,however apulling unit isneeded.
Good. Mustprovideelectrical powerand servicepulling unit.
Fair. Feasibleoperation inhighly deviatedwells. Requiresdeck space fortreatment tanksand pumps.Water powerfluid can beused. Power oila fire and safetyproblem.
Good. Producedwater orseawater maybe used as apower fluid withwellsite typesystem or powerfluid separationbeforeproductiontreating system.
Excellent and isthe mostcommonmethod ifadequateinjection gasavailable.
Poor in wellsneeding sandcontrol. Use ofstanding valvesrisky. Headingcausesoperatingproblems.
Excellent forcorrectapplication.
Paraffinhandlingcapacity
Fair to good.Hot water/oiltreating and/oruse of scraperspossible butthey increaseoperatingproblems andcosts.
Fair. Tubingmay requiretreatment. Rodscrapers notused. Possibleto unseat pumpand circulate hotfluids.
Fair to good.Hot water/oiltreatments,mechanicalcutting, batchinhibitionpossible.
Good toexcellent.Circulate heat todownhole pumpto minimisebuild-up.Mechanicalcutting andinhibitionpossible.Soluble plugsavailable. Freepumps can besurfaced on aschedule.
Same as pistonpump.
Goodmechanicalcuttingsometimesrequired.Injection gasmay aggravateexistingproblem.
Same ascontinuous flowgas lift.
Excellent as itcuts paraffinand removessmall deposits.
Table 10.P - Artificial Lift Considerations (Pg1)

ARPO
ENI S.p.A.Agip Division
IDENTIFICATION CODE PAGE 273 OF 295
REVISIONSTAP-P-1-M-7100 0
Consideration Rod Pumping Screw Pumping ESP HydraulicPiston
Pumping
Hydraulic JetPumping
ContinuousGas Lift
IntermittentGas Lift
Plunger Lift
Slim-holecompletions(27/8insproductioncasing string)
Feasible for lowrates <100stb/dand low GOR<250. Typicallyare used with1.5ins nominaltubing.
Feasible if lowrates, low GORsand shallowdepths but noknowninstallations.
No knowninstallations.
Possible butmay have highfriction losses orgas problems.Suitable for lowrates and lowGLRs.
Same as pistonpump.
Feasible but canbe troublesomeand inefficient.
Same ascontinuous flow.
Good. Similarto casing liftbut must haveadequateformation gas.
Solids/sandhandling ability
Poor to fair forlow viscosity<10cPproduction.Improvedperformance forhigh viscosity>200cP cases.May be able tohandle up to0.1% sand withspecial pumps.
Excellent up to50% sand withhigh viscosity>200cP crude.Decreases to<10% sand forwaterproducers.
Poor. Requires<200ppmsolids. Improvedwear resistantmaterialsavailable atpremium cost.
Poor. Requires<10ppm solidspower fluid forgood run life.Also producedfluids must havelow solids<200ppm of15µm particlesfor reasonablelife. Use freshwater injectionfor salt build-upformations.
Fair to good. Jetpumps areoperating with3% sand inproduced fluids.Power fluid tojet pump cantolerate 200ppmof 25µm particlesize. Freshwater treatmentfor saltformations.
Excellent. Limitis inflow andsurfaceproblems.Typical limit is0.1% sand forinflow andoutflowproblems.
Fair butstanding valvemay causeproblems. Sameas continuousflow.
Sand can stickplunger,however itwipes tubingclean.
Temperaturelimitation
Excellent andcurrently used inthermaloperations.550oF.
Fair but limitedby statorelastomer. Atpresentnormally below250oF.
Limited to about<250oF forstandard and<325oF withspecial motorsand cables.
Excellent.Standardmaterials up to300oF+ and to500oF+ feasiblewith specialmaterials.
Excellent andpossible tooperate to 500oFwith specialmaterials.
Excellent.Typically amaximum ofabout 350oF.Need to knowtemperatures todesign bellowscharged valves.
Same ascontinuous flow.
Excellent.
High viscosityfluid handlingcapability
Good for<200cP fluidsand low rates400stb/d. Rodfall problems forhigh rates.Higher ratesmay requireddilutent to lowerviscosity.
Excellent forhigh viscosityfluids with nostator/rotorproblems.
Fair, limited toabout 200cP.Increases HPand reduceshead. Potentialsolution is touse ‘core flow’with 20% water.
Good in >8o APIproduction with<500cPpossible. Powerfluid can beused to dilutelow gravityproduction.
Good toexcellent.Production withup to 800cPpossible. Poweroil of oil >24o
API and ,50cPviscosity orwater powerfluid reducesfriction losses.
Fair. Fewproblems for>16 o API. orbelow 20cPviscosity.Excellent forhigh water cutlift even withhigh viscosityoil.
Same ascontinuous flow
Normally notapplicable.
High volume liftcapacity
Fair butrestricted toshallow depthsusing largeplungers . max.rate about4,000stb/d from1,000ft and1,000stb/d from5,000ft.
Poor. Restrictedto relativelysmall rates.Possibly2,000stb/d from2,000ft and200stb/d from5,000ft.
Excellent.limited byneeded HP andcan berestricted bycasing size. In5.5ins casingcan produce4,000stb/d from4,000ft with 240HP. Tandemmotors can beused but willincrease costs.
Good. Limitedby tubular andHP. Typically3,000stb/d from4,000ft and1,000stb/d from10,000ft with3,500psisystem.
Excellent. Up to15,000stb/d withadequateflowing bottom-hole pressure,tubular size andHP.
Excellent.Restricted bytubing size andinjection gasrate and depth.Depending onreservoirpressure and PIwith 4insnominal tubing,rates of5,000stb/d from10,000ft feasiblewith 1,440psiinjection gasand GLR of1,000.
Poor. Limited bycycle volumeand number ofpossibleinjection cycles.Typically about200stb/d from10,000ft with<250psi pumpintake pressure.
Poor. Limitedby number ofcycles.Possibly200stb/d from10,000ft.
Low volume liftcapabilities
Excellent. Mostcommonly usedmethod for wellsproducing<100stb/d.
Excellent for<100stb/dshallow wellsthat do notpump-off.
Generally poor.Lower efficiencyand highoperating costsfor <400stb/d.
Fair. Not asgood as rodpumping.Typically 100 to300stb/d from4,000 to10,000ft,>75stb/d from12,000ftpossible.
Fair, >200stb/dfrom 4,000ft.
Fair. Limited byheading andslippage. Avoidunstable flowrange. Typicallylower limit is200stb/d for2ins tubingwithout heading,400stb/d for2.5ins and700stb/d for3.5ins tubing.
Good. Limitedby efficiencyand economiclimit. Typically0.5 to 4stb/cyclewith up to 48cycles/d
Excellent forlow flow ratesof 1 to 2stb/dwith highGLRs.
Table 10.Q - Artificial Lift Considerations (Pg2)

ARPO
ENI S.p.A.Agip Division
IDENTIFICATION CODE PAGE 274 OF 295
REVISIONSTAP-P-1-M-7100 0
11. USE OF UNDERBALANCE COMPLETION FLUIDS
11.1. POLICY
The purpose of this section is to provide the basic criteria when ‘non-kill weight packerfluids’ can be used in completion design.
The use of non-kill weight packer fluid has been thoroughly evaluated and is permitted forthe wells which have pressure gradients above 1.30kg/Lt/10m, i.e. high pressure and hightemperature (HP/HT) wells.
This policy does not refer to gradients below 1.30kg/Lt/10m where it is still considered goodpractice to use overbalance completion fluids.
11.2. BARRIER PRINCIPLES
Eni-Agip Division and Affiliates has determined that a packer fluid, regardless of the density,cannot be considered as a barrier.
The main reasons are:
• The integrity of the annulus, with regard to double barrier protection ismechanically obtained by means of the wellhead, the tubulars (tubing andcasing) and packer system and, therefore, does not require the presence of anoverbalance fluid.
• A hydrostatic overbalance fluid can only be considered a barrier on a long termbasis if it is fully maintained, however tubing leaks and deterioration of the fluidcannot be guaranteed. This being the case, it should not be classified as abarrier.
• Over and above this, some completion types such as High Rate liners using aliner PBR may be some considerable distance from the formation, therefore isnot a practical barrier.
11.3. APPLICATION
The use of non-kill weight packer fluid will be considered in the following situations:
• When a brine with a gradient lower than the formation gradient has alreadybeen used as completion fluid, i.e. through tubing perforation after packersetting.
• When it is necessary to replace a completion fluid containing solids insuspension, i.e. high density oil mud.
• The re-use of the completion fluid is envisaged when it is opportune or costeffective.

ARPO
ENI S.p.A.Agip Division
IDENTIFICATION CODE PAGE 275 OF 295
REVISIONSTAP-P-1-M-7100 0
11.4. RISK ASSESSMENT
11.4.1. Well Testing
For exploration wells, prior to commencing a well test using non-kill weight packer fluid, arisk analysis evaluation (HAZOP) must be carried out by the District Drilling & CompletionEngineering Department, in order to identify and evaluate the operative risks associatedwith downhole equipment functionality.
11.4.2. Completions
Similar to above, a risk assessment should be carried out to ensure, if an underbalancecompletion fluid is to be used, that the completion design will keep the formation pressureoff the production casing.
However, as contingency against a tubing/packer envelope leak, the casing design must beable to withstand full well pressure in conjunction with the completion fluid hydrostaticpressure at respective depth. The worst possible case being immediately above thepacker.

ARPO
ENI S.p.A.Agip Division
IDENTIFICATION CODE PAGE 276 OF 295
REVISIONSTAP-P-1-M-7100 0
APPENDIX A - REPORT FORMS
To enable the contents of this completion manual and other operating procedures manualsto be improved, it is essential that ENI - Agip Division and Affiliates obtain feed-back fromthe field. To this end a feed-back reporting system is in use which satisfies this requirement.
Feed-back reports for drilling, completion, workover and well testing operations areavailable and must be filled in and returned to head office for distribution to the relevantresponsible departments as soon as possible as per instructions.
The forms relevant to completion operations are:
• ARPO 01 Initial Activity Report
• ARPO 02 Daily Report
• ARPO 06 Waste Disposal Management Report
• ARPO 07 Perforating Report
• ARPO 08 Gravel Pack Report
• ARPO 09 Matrix Stimulation/Hydraulic fracturing Report
• ARPO 11 Wireline Report
• ARPO 12 Pressure/Temperature Survey Report
• ARPO 13 Well Problem Report
• ARPO 20 Well Situation Report
Behind each report form are instructions on how to fill in the forms. As the first section isgeneric to all the forms it is only shown in ARPO 01 instructions.

ARPO
ENI S.p.A.Agip Division
IDENTIFICATION CODE PAGE 277 OF 295
REVISIONSTAP-P-1-M-7100 0
A.1. INITIAL ACTIVITY REPORT (ARPO 01)
WELL NAME
FIELD NAME District/Affiliate Company
DATE: ARPO 01 Cost center
Permit/Concession N° Well Code
General Data Depth Above S.L . Joint venture
On shore Off shore Ground Level[m] AGIP: % %
Latitude: Water Depth [m] % %
Longitude Rotary Table Elev.[m] % %
Reference First Flange[m] Type of Operation
Rig Name Top housing [m]
Rig Type Reference Rig Program TD (Measured) [m]
Contractor Ref. Rig RKB - 1st Flange Program TD (Vertical) [m]
Rig Heading [°] Cellar Pit Rig Pump
Offset FROM the proposed location Depth [m] Manufacturer
Distance [m] Length [m] Type
Direction [°] Width [m]: Liner avaible [in]
Major Contractors
Type of Service Company Contract N° Type of Service Company Contract N°
Mud Logging
D. & C. Fluids
Cementation
Waste treatment
Operating Time Jack-up leg Penetration Supply Vessel for Positioning
Moving [gg:hh] Leg Air gap Penetration N° Name Horse Bollard pull
Positioning [hh:min] N° [m] [m] Power [t]
Anchorage [hh:min]
Rig-up [hh:min]
Delay [hh:min]
Lost-time Accidents [hh:min]
Rig Anchorage
Anchor Mooring Line Piggy Back Mooring Line Tension Operative Total
Bow Weight Length Weight Chain Cable [Tested] Tension Time
N° Angle Type & Manufacturer [t] Cable Chain N° [t] Length Ø Length Ø [t] [t] [hh:min]
[m] [m] [m] [mm] [m] [mm]
1
2
3
4
5
6
7
8
9
10
11
12
Note: Supervisor
Superintendent
INITIAL ACTIVITY REPORT

ARPO
ENI S.p.A.Agip Division
IDENTIFICATION CODE PAGE 278 OF 295
REVISIONSTAP-P-1-M-7100 0
A.2. DAILY REPORT (ARPO 02)
WELL NAME
FIELD NAME District/Affiliate Company
DATE: ARPO 02 Cost center
Rig Name RT Elevation [m] Well Code
Type of Rig Ground Lelel / Water Depth [m] Report N° of
Contractor RT - 1st flange / Top Housing [m] Permit / Concession N°
Well Last casing Next Casing BOP Type Ø w.p. [psi] M.D. (24:00) [m]
Ø nom.[in] Stack T.V.D. (24:00) [m]
Top [m] Diverter Total Drilled [m]
Bottom [m] Annular Rotating Hrs [hh:mm]
Top of Cmt [m] Annular R.O.P. [m / h]
Last Survey [°] at m Upper Rams Progressive Rot. hrs [hh:mm]
LOT - IFT [kg/l] at m Middle Rams Back reaming Hrs [hh:mm]
Reduce Pump Strockes Pressure Middle Rams Personnel Injured
Pump N° 1 2 3 Middle Rams Agip Agip
Liner [in] Lower Rams Rig Rig
Strokes Last Test Others Other Press. [psi] Total Total
Lithology
Shows
From (hr) To (hr) Op. Code OPERATION DESCRIPTION
Operation at 07:00
Mud type Bit N° Run N° N° Run N° Bottom Hole Assembly N° __________ Rot. hours Density [kg/l] Data Description Ø Part. L Progr.L Partial Progr. Viscosity [s/l] Manuf. P.V. [cP] Type Y.P. [g/100cm2] Serial No. Gel 10"/10' / IADC Water Loss [cc/30"] Diam. HP/HT [cc/30"] Nozzle/TFA Press. [kg/cm2] From [m] Temp. [°C] To [m] Cl- [g/l] Drilled [m] Salt [g/l] Rot. Hrs. pH/ES R.P.M. MBT [kg/m3] W.O.B.[t]
Solid [%] Flow Rate Stock Quantity UM Supply vessel Oil/water Ratio. Pressure Sand [%] Ann. vel. pm/pom Jet vel. pf HHP Bit mf HSI Total Cost Supervisor:
Daily Losses [m3] I O D L I O D L Daily Progr. Losses [m3] B G O R B G O R Progr.
DAILY REPORT Drilling

ARPO
ENI S.p.A.Agip Division
IDENTIFICATION CODE PAGE 279 OF 295
REVISIONSTAP-P-1-M-7100 0
A.3. WASTE DISPOSAL MANAGEMENT REPORT (ARPO 06)
WELL NAME
FIELD NAMEDistrict/Affiliate Company
DATE: ARPO-06 Cost center
Report N° Depth (m) Mud Type
From [m] Interval Drilled (m) Density (kg/l)
To [m] Drilled Volume [m3] Cl- concentration (g/l )
Phase size [in] Cumulative volume [m3]
Water consumption Phase /Period [m3] Cumulative [m
3]
Usage Fresh water Recycled Total Fresh water Recycled Total
Mixing Mud
Others
Total
Readings / Truck Fresh water [m3] Recycled [m
3]
Mud Volume [m 3] Phase Cumulative Service Company Contract N°
Mixed Mud Company
Lost Waste Disposal
Dumped Transportation
Transported IN Trans orted OUT
Waste Disposal Period Cumulative Remarks Water base cuttings [t] Oil base cuttings [t]
Dried Water base cuttings [t]
Dried oil base cuttings [t]
Water base mud [t]
Oil base mud transported IN [t]
Oil base mud transported OUT [t]
Drill potable water [t]
Dehidrated water base mud [t]
Dehidrated oil base mud [t]
Sewage water [t]
Transported Brine [t]
Remarks
Supervisor
Superintendent
WASTE DISPOSALManagement Report

ARPO
ENI S.p.A.Agip Division
IDENTIFICATION CODE PAGE 280 OF 295
REVISIONSTAP-P-1-M-7100 0
A.3. PERFORATING REPORT (ARPO 07)
WELL NAME
FIELD NAMEDistrict/Affiliate Company
DATE: ARPO-07 Cost center
Well location Formation name: Pool:
Onshore Lithology
Offshore
Total Depth [m] Rotary Table Measurement [m] Final Completion Report [date]
Well Type M.D. Drilling Rig RKB - 1st Flange Final Workover Report [date]
Vertical T.V.D. Workover Rig RKB - 1st Flange Reference Logs:
Deviated Max. inclination [°] Workover Rig RKB - Sea Level
Horizontal at [m] Workover Rig RKB - Sea Bottom Recorded on:
Well Size [Ø] Steel Thickness Measured Depth Vertical Depth Cement Top
Situation Grade [lb/ft] Top [m] Bottom [m] Top [m] Bottom [m] M.D. [m] T.V.D. [m]
Liner
Casing
Casing
Tubing Service Company
Packer
Tubing shoe
Perforation System
Wireline Overbalance Completion fluid Density [kg/l]
TCP Underbalance Fluid in front of Perforation Density [kg/l]
Thru Tubing Differential Pressure [kg/cm2] Fluid Losses after Perforation [m3]
Data Gun Gun Gun Charge S.P.F Measured Depth Vertical Depth Pool Remarks
Type Specific. Ø Type Top [m] Bottom [m] Top [m] Bottom [m]
Note:
Supervisor Superintendent
PERFORATING REPORT

ARPO
ENI S.p.A.Agip Division
IDENTIFICATION CODE PAGE 281 OF 295
REVISIONSTAP-P-1-M-7100 0
A.4. GRAVEL PACK REPORT (ARPO 08)
Cannot Load File form supplied Eni-Agip Excel

ARPO
ENI S.p.A.Agip Division
IDENTIFICATION CODE PAGE 282 OF 295
REVISIONSTAP-P-1-M-7100 0
A.5. MATRIX STIMULATION/HYDRAULIC FRACTURE REPORT (APRO 09)
WELL NAME
FIELD NAMEDistrict/Affiliate Company
DATE: ARPO - 09 Cost center
Well Location General Data Interval to be Treated
Onshore M.D. [m] Open hole Tot. net perf.:
Offshore T.V.D. [m] Perfor. interval Formation name:
Well Type Open hole Ø Slotted liner Vertical Prod. casing / liner Ø From [m] Pool:
Deviated Shoe M.D. [m] To [m] Lithology: Horizontal Top liner [m]
Treatment Type Reservoir Parameters Treatment Data Completion Data
Matrix stimulation Reservoir fluid Service Company Bottom hole gauge [Y / N]
Acid Density [Kg/l] HHP avaible Type
Solvent Gradient [Kg/cm2/10 m.] Initial Shut-in pressure [psi] Wellhead type
Other Fracturing gradient [calculated] Annulus pressure [psi] Packer type
Hydraulic Fracturing Fracturing gradient [tested] Pressure test [psi] Packer fluid
Foam Porosity % Max. injection rate [bpm] Density
Water base SBHT [°C] at m Max. injection pressure [psi] Fluid in well at operation beginning
Oil base SBHP [kg/cm2] at m Pumping time [min]
Other Pumping time [min] String O.D. [in]
Acid Fracturing Main Frac Treatment Equipment String capacity [l]
Acid Proppant type: Coiled Tubing [Y / N] Packer - Top perforation Volume [l]
Gelled acid API Mesh Size Ø
Acid + Gel Amount of Propant [t] Stimulation vessel / Other equipment
Other Total Frac Fluid Vol. [m3]
Operation Description
Fluid Fluid ScheduleRef. Fluid Type Fluid Composition Density [kg/l] Mixed Volume [m3]
1
2
3
4
5
6
7
8
910
Pumping Parameter
N° Starting Pumping Volume Progr. Progr.Vol. Proppant Initial Final Injection Casing Notes
Fluid Time Rate Volume Entering in Concentr. Press. Press. Index Press.
Ref. [bbl/1'] [m3] [m3]Formation
[lb/gal] [psi] [psi] [bbl/day/psi] [psi]
Notes / Remarks:
Supervisor
Superintendent
Inje
cted
Circ
ulat
ed
MATRIX STIMULATION HYDRAULIC FRACTURING

ARPO
ENI S.p.A.Agip Division
IDENTIFICATION CODE PAGE 283 OF 295
REVISIONSTAP-P-1-M-7100 0
A.6. WIRELINE REPORT (ARPO 11)
WELL NAME
FIELD NAMEDistrict/Affiliate Company
DATE: ARPO - 11 Cost center
SINGLE COMPLETION SELECTIVE SHORT STRING Well Code
DUAL COMPLETION LONG STRING
General Data Flanges
RKB Elevation @ m. Base Flange Tbg Spool Top Flange Ø Psi
Tubing Size OD Weight [lb/ft] @ m. Flowing Flange Ø Psi
Tubing Size OD Weight [lb/ft] @ m. Kill Line Flange Ø Psi
Tubing Shoe Ø @ m. BPV Type Ø
Packer data @ m.
@ m. Wellhead Pressure Check
Minimum I.D. String THP [Kg/cm2] CHP [Kg/cm2]
Previous Bottom Hole @ m. Annulus / P [Kg/cm2]
Annulus / P [Kg/cm2]
Request Operation Annulus / P [Kg/cm2]
POOL
Perforated Zones Open Hole
From [m] To [m]
Note
Operation Description
Situation After the Job
NO TOOLS IN HOLE SCSSV Actual Bottom Hole:
TSV BPV PLUG OTHER TOOLS Max Size Run in Hole Ø @ m
Note Supervisor
Superintendent
WIRE LINE REPORT

ARPO
ENI S.p.A.Agip Division
IDENTIFICATION CODE PAGE 284 OF 295
REVISIONSTAP-P-1-M-7100 0
A.7. PRESSURE/TEMPERATURE SURVEY REPORT (ARPO 12)
Cannot Load File form supplied Eni-Agip Excel

ARPO
ENI S.p.A.Agip Division
IDENTIFICATION CODE PAGE 285 OF 295
REVISIONSTAP-P-1-M-7100 0
A.8. WELL PROBLEM REPORT (ARPO 13)
FIELD NAME
WELL NAMEDistrict/Affiliate Company
DATE: ARPO -13 Cost center
Problem Top [m] Start date
Code Bottom [m] End date
Well Ø Measured Depth Vertical Depth KOP [m] Mud in hole
Situation Top [m] Bottom [m] Top [m] Bottom [m] Max inclination [°] Type
Open hole @ m Dens.[kg/l]:
Last casing DROP OFF [m]
Well problem Description
Solutions Applied: Results Obtained:
Solutions Applied: Results Obtained:
Solutions Applied: Results Obtained:
Solutions Applied: Results Obtained:
Supervisor Supervisor Supervisor
Remarks at District level:
Superintendent
Lost Time hh:mm Loss value [in currency]
Remarks at HQ level Pag.
Of
WELL PROBLEM REPORT

ARPO
ENI S.p.A.Agip Division
IDENTIFICATION CODE PAGE 286 OF 295
REVISIONSTAP-P-1-M-7100 0
A.9. WELL SITUATION REPORT (ARPO 20)
FIELD NAME
WELL NAMEDistrict/Affiliate Company
DATE: ARPO 20 / E Cost center
SINGLE COMPLETION DUAL COMPLETION SHORT STRING LONG STRING
Joint m Progr. Note Joint m Progr. Note Joint m Progr. Note
n° m n° m n° m
Remarks: Supervisor
Superintendent
pag.: of:
WELL SITUATION(COMPLETION TALLY )

ARPO
ENI S.p.A.Agip Division
IDENTIFICATION CODE PAGE 287 OF 295
REVISIONSTAP-P-1-M-7100 0
APPENDIX B - NOMENCLATURE FOR TUBING CALCULATIONS
Ai = Area inside tubingAo = Area outside tubingAp = Packer-bore areaAs = Resistant tubing area (Ao - Ai)D = External diameter of tubingd = Internal diameter of tubingDpb = Packer-bore diameterE = Young’s module (3⋅107 psi for steel)F = Generic force applied to the tubing endFa = Piston force at the packer depthFa
* = Piston force above the packer with anchored tubingFa tp = Piston force at well head conditionsFa
*tp = Piston force at well head conditions with anchored tubing
Ff = Fictitious forceFf
* = Fictitious force above the packer with anchored tubingFf
I = Fictitious force due to the effect of internal pressureFf
II = Fictitious force due to the effect of external pressureFf tp = Fictitious force at well head conditionsFf
*tp = Fictitious force at well head conditions with anchored tubing
Fp = Tubing-packer forceFso = Slack-off forceI = Moment of inertia of the resistant tubing sectionL = Tubing lengthn = Distance between the lower end of the tubing and the neutral
pointPi /pi = Pressure inside the tubing at packer depth / well headPo /po = Pressure outside the tubing at packer depth / well headR = Ratio between the external and internal diameters of the tubingr = Tubing-casing radial distance (Douter casing -D)/2t = Tubing wall thicknessTfinal = Final temperature of tubingTinitial = Initial temperature of tubingw = Linear weight of the tubing immersed in fluidws = Linear weight of the tubing in airwfi = Linear weight of fluid inside the tubingwfo = Linear weight of fluid outside the tubingα = Coefficient of thermal expansion (6.9⋅ 10-6 in/in/°F for steel)γfi = Specific gravity of fluid inside the tubingγfo = Specific gravity of fluid outside the tubing∆Fa = Variation in the piston force∆Ff = Variation in the fictitious force∆L = Generic variation in the tubing length∆L1 = Variation in length due to Hooke’s Law∆L2 = Variation in length due to buckling∆L3 = Variation in length due to ballooning∆L4 = Variation in length due to thermal effects

ARPO
ENI S.p.A.Agip Division
IDENTIFICATION CODE PAGE 288 OF 295
REVISIONSTAP-P-1-M-7100 0
∆Lp = Total variation in length prevented by the packer∆Lf = Variation in length generated by fictitious force∆lso = Variation in length generated by slack-off force∆ltot = Total variation in length of the tubing (= - ∆Lp)
∆Pi = Variation in pressure inside the tubing∆pim = Average variation in pressure inside the tubing∆pom = Average variation in pressure outside the tubing∆TM = Average variation in tubing temperatureν = Poisson’s coefficient (0.3 for steel)σa = Axial stress in the tubing sectionσb = Axial stress in the tubing section due to bucklingσeq = Equivalent axial stressσi = Equivalent axial stress on the inner wall of the tubingσo = Equivalent axial stress on the outer wall of the tubingσsn = Material yield axial stressYp = σsn

ARPO
ENI S.p.A.Agip Division
IDENTIFICATION CODE PAGE 289 OF 295
REVISIONSTAP-P-1-M-7100 0
APPENDIX C - ABBREVIATIONS
API American Petroleum InstituteBHA Bottom Hole AssemblyBHP Bottom Hole PressureBHT Bottom hole temperatureBOP Blow Out PreventerBPD Barrel Per DayBPM Barrels Per MinuteBPV Back Pressure ValveBSW Base Sediment & WaterBUR Build Up RateC/L Control LineCBL Cement Bond LogCCL Casing Collar LocatorCET Cement Evaluation ToolCGR Condensate Gas RatioCRA Corrosion Resistant AlloyC/T Coiled TubingDC Drill CollarDE Diatomaceous EarthDHSV Down Hole Safety ValveD&CM Drilling & Completion ManagerDP Drill PipeDST Drill Stem TestE/L Electric LineECD Equivalent Circulation DensityECP External Casing PackerEMW Equivalent Mud WeightESD Electric Shut-Down SystemESP Electrical Submersible PumpETA Expected Arrival TimeFBHP Flowing Bottom Hole PressureFBHT Flowing Bottom Hole TemperatureFTHP Flowing Tubing Head PressureFTHT Flowing Tubing Head TemperatureGLR Gas Liquid RatioGOC Gas Oil ContactGOR Gas Oil RatioGP Gravel PackGPM Gallon (US) per MinuteGPS Global Positioning SystemGR Gamma RayHAZOP Hazard and OperabilityHP/HT High Pressure - High TemperatureIADC International Drilling ContractorID Inside Diameter

ARPO
ENI S.p.A.Agip Division
IDENTIFICATION CODE PAGE 290 OF 295
REVISIONSTAP-P-1-M-7100 0
IPR Inflow Performance RelationshipJAM Joint Make-up Torque AnalyserKOP Kick Off PointLAT Lowest Astronomical TideLCM Lost Circulation MaterialsLMRP Low Marine Riser PackageLOT Leak Off TestLWD Log While DrillingMAASP Max Allowable Annular Surface PressureMD Measured DepthMLH Mud Line HangerMLS Mud Line SuspensionMMS Magnetic Multi ShotMODU Mobile Offshore Drilling UnitMPI Magnetic Particle InspectionMSL Mean Sea LevelMSS Magnetic Single ShotMWD Measurement While DrillingNACE National Association of Corrosion EngineersNDT Non Destructive TestNSG North Seeking GyroNTU Nephelometric Turbidity UnitOBM Oil Base MudOD Outside DiameterOIM Offshore Installation ManagerORP Origin Reference PointOWC Oil Water ContactP&A Plugged & AbandonedPBR Polished Bore ReceptaclePDC Polycrystalline Diamond CutterPDM Positive Displacement MotorPGB Permanent Guide BasePI Productivity IndexPLT Production Logging ToolPOB Personnel On BoardPPB Pounds per Barrelppg Pounds per Gallonppm Part Per MillionPVT Pressure Volume TemperatureQ Flow RateQ/AQ Quality Assurance, Quality ControlRFT Repeat Formation TestRKB Rotary Kelly BushingROE Radius of ExposureROP Rate Of PenetrationROU Radios Of UncertaintyROV Remote Operated Vehicle

ARPO
ENI S.p.A.Agip Division
IDENTIFICATION CODE PAGE 291 OF 295
REVISIONSTAP-P-1-M-7100 0
RPM Revolutions Per MinuteRT Rotary TableS/N Serial NumberSAFE Slapper Activated Firing EquipmentSBHP Static Bottom Hole PressureSBHT Static Bottom Hole TemperatureSCC Stress Corrosion CrackingSCSSV Surface Controlled Subsurface Safety ValveSDE Senior Drilling EngineerSF Safety FactorSG Specific GravitySICP Shut-in Casing PressureSIDPP Shut-in Drill Pipe PressureSPM Stroke per MinuteSSC Sulfide Stress CrackingSSD Sliding Sleeve Door ValveSSSV Sub Surface Safety ValveSTHP Static Tubing Head PressureSTHT Static Tubing Head TemperatureTCP Tubing Conveyed PerforationsTD Total DepthTOC Top of CementTOL Top of LinerTRSV Tubing Retrievable Safety ValveTVD True Vertical DepthUHF Ultra High FrequencyVBR Variable Bore Rams (BOP)VDL Variable Density LogVHF Very High FrequencyVSP Velocity Seismic ProfileW/L Wire LineWBM Water Base MudWC Water CutWHP Well Head PressureWHSIP Well Head Shut-in PressureWOB Weight On BitWOC Wait On CementWOW Wait On WeatherWP Working PressureYP Yield Point

ARPO
ENI S.p.A.Agip Division
IDENTIFICATION CODE PAGE 292 OF 295
REVISIONSTAP-P-1-M-7100 0
APPENDIX D - BIBLIOGRAPHY
Document: STAP Number
Drilling Design Manual STAP P-1-M-6100
Connection Procedures Manuals. STAP M-1-M 5006
Other References:
Ansari, A ‘ A Comprehensive Mechanistic Model For Multiphase Flow In Wells’, MS Thesis,The University Of Tulsa (1988)
API BUL 5C3 Sixth Edition: ‘Formulas and Calculations for Casing Tubing Drill Pipe, andLine Pipe Properties’, October 1, 1994.
API RP 14E ‘Recommended Practices For Design And Installation Of Offshore ProductionPlatform Piping Systems, 3rd edition (Dec 1981)
API RP 14E Fourth Edition: ‘Recommended Practice for Design and Installation of OffshoreProduction Platform Piping System’, April 15, 1984.
Arthur Lubinsky: ‘Helical Buckling of Tubing Sealed in Packers’, 36th Annual Fall Meeting ofSPE, Dallas, October 8-11, 1961.
Aziz, K, Covier, GW and Fogarasi, M : ‘ Pressure drop in wells producing oil and gas’ (July -Sept 1972), 38-48
Beggs, H D and Brill, J P : ‘ A study of two-phase flow in inclined pipes’ (May 1973), 607-617
Blount, E M, Jones, L G and Glaze, O H : ‘Use of short term multirate flow tests to predictperformance of wells having turbulence’ (1976)
Brown, K E : The Technology Of Artificial Lift Methods, Vols 1 And 4, Ponwell PublishingCompany, Tulsa, OK, 1977
Bruist, E HY : ‘ Better performance of Gulf Coast wells’( 1974)
D. J. Hammerlind: ‘Basic Fluid and Pressure Forces on Oilwell Tubulars’, 53th annual FallTechnical Conference and Exhibition, Houston, October 1-4, 1978.
D. J. Hammerlind: ‘Movement, Forces and Stresses Associated With Combination TubingStrings Sealed in Packers’, Journal of Petroleum Technology, February, 1977.
Duns, H JR and Ros, N C J : ‘ Vertical flow of gas and liquid mixtures in wells’ (1963), 451
Earlougher, R C JR and Kersch K M : ‘ Analysis of short-time transient test data by type-curve matching’ (July 1974) 793
Eickmeier, J R : ‘ How To Accurately Predict Future Well Productivities’ ( May 1968) 99-106
Fetkovich, M J : ‘ The Isochronal Testing Oil Wells’ (1973)
Forcheimer, P ;P ‘ Wasserbewegung Durch Boden’ (1901) 45, 1781-1788 (in german)
Gilbert, W.E: ‘Flowing and Gas-Lift Well Performance’ API Drill and Prod Pract (1954), 126
Golan, M and Whiston, C H: Well Performance, International Human ResourceDevelopment Corporation, Boston, NY (1986)

ARPO
ENI S.p.A.Agip Division
IDENTIFICATION CODE PAGE 293 OF 295
REVISIONSTAP-P-1-M-7100 0
Gray, H E : ‘ Vertical Flow Correlation-Gas Wells’ API Man 14BM; API 14B, SSCSSV SizingComputer Program, 38-40
H. D. Beggs: ‘Production Optimisation Using NODAL Analysis’, OGCI, Tulsa, 1991.
Hagedoorn, A R and Brown, K E: ‘ Experimental study of pressure gradients occurringduring continuous two-phase flow in small diameter vertical conduits’ ( April 1965) 475-484
Hagedorn and Brown (1967)
Horner, D R : ‘ Pressure build up in wells’ (1951)
Hurst, W : ‘ Establishment of skin effect and its impediment to fluid flow into a wellbore’(Oct 1953)
King, G E, Anderson, A R and Bingham, M D ‘ A field study of underbalance pressurenecessary to obtain clean perforations using tubing-conveyed perforating’ ( June 1986) 662
Lea, J F JR and Tighe, R E : ‘ Gas Well Operations With Liquid Production’ ( 1983)
Milner, E E and Warren D A JR : ‘ Drill stem test analysis utilising McKinley system of afterflow dominated pressure build up’ (Oct. 1972)
Orkiszewski, J : ‘ Predicting Two-Phase Pressure Drops In Vertical Pipes’ (June 1967), 829-838
Ramey, H J JR : ‘ Short-Time Well Test Data Interpretation In The Presence Of Skin EffectAnd Wellbore Storage, (Jan 1970) 97
Rawlins, E L and Schellhardt, M A : ‘ Back-Pressure Data On Natural Gas Wells And TheirApplication To Production Practices’ US Bureau Of Mines, (1936)
Reinicke, K M, Remer, R J and Hueni, G : ‘ Comparison Of Measured And PredictedPressure Drops In Tubing For High-Water-Cut Gas Wells’ (Aug 1987) 165-177
Saucier, R J : ‘ Gravel pack design consideration’ (Feb 1974)
Standing, M B : ‘ Concerning The Calculation Of Inflow Performance Of Wells ProducingFrom Solution Gas Drive Reservoirs’ (Sept 1971) 1141-1142
Texas Railroad Commission Rule 36
Turner, R G, Hubard, M G and Duckler, A E : ‘ Analysis And Predictions Of Minimum FlowRate For The Continuous Removal Of Liquid From Gas Wells’ (Nov 1969)
Van Everdingen, F : ‘ The Skin Effect And Its Influence On The Productive Capacity Of AWell’ (Oct 1953)
Van Poollen, H K : ‘ Radius-Of-Drainage And Stabilisation Time Equations’ (Sept 1964) Vol62. No 37
Vogel, J V : ‘ Inflow Performance Relationships For Solution Gas Drive Wells’, (Jan 1968)83-93

ARPO
ENI S.p.A.Agip Division
IDENTIFICATION CODE PAGE 294 OF 295
REVISIONSTAP-P-1-M-7100 0
APPENDIX E - TUBING MOVEMENT/STRESS COMPUTER PROGRAMMES
E.1. ‘VERTUBING’ PROGRAMME
The need to fast computing to carry out tubing movement/stress calculations led AGIP toproduce the ‘Vertubing’ programme in 1989. This application was based on a previousversion designed by a company named ‘Tubmov’ which was run on Hewlett Packard 41CVcomputers.
The ‘Vertubing’ programme provided a calculation tool which significantly reduced times forengineers involved in string calculations. The programme also enabled users to find anoptimal solution by means of the iterative process using a number of approximations andproducing results which were more reliable.
The programme is supported by VAX/VMS computer systems and is currently available atHead Office and in the Districts on the Company computer network. The application carriesout all functions for tubing control in vertical or deviated wells, with a string and a highnumber of packer’s as well (multiple zone completions) and takes into account the fact thatpacker setting can be mechanical or hydraulic.
It is also possible to check stress tubing’s with varying diameters (tapered string) and toconsider materials with anisotropic characteristics. It is not, however, possible to take intoaccount the reduction in the performance of some CRA type steels, caused by temperatureincreases.
The programme does not incorporate a library or collection of data on commonly usedtubing material, which would enable users to design the string starting from an existingmaterial.
The programme’s architecture defines a rigid sequence for data entry, which results inextremely accurate results. The application does not enable the user to independentlyassess dynamic situations such as with production or injection operations. It is necessary tocalculate load losses during the relative operation and obtain the resulting fictitioushydrostatic gradient which then lets the user obtain the correct pressures for the variousstring sections.
‘Vertubing’ produces the results as numerical files, without any graphic display.
The programme is generally considered to be reliable because the results of three yearsuse have consistently matched actual well applications.

ARPO
ENI S.p.A.Agip Division
IDENTIFICATION CODE PAGE 295 OF 295
REVISIONSTAP-P-1-M-7100 0
E.2. ‘WELLCAT’ PROGRAMME
Eni-Agip Division and Affiliates recently acquired Enertech’s (1994) ‘Wellcat’ programmewhich is an application integrating the most specialised software, ranging from drilling, tocompletion and other various well operations. The brief description below only describes theparts of the application concerning tubing.
The need to use an in-house company programme which was more complex compared to‘Vertubing’, is due to this application’s limitations in terms of obtaining the trend oftemperatures the string is subject to during various well operations, and the inability toanalyse dual completions. As ‘Vertubing’ had to be integrated with software in ENI-AgipDivision and Affiliates expert system (Welcome) it seemed more appropriate to use amodern design programme such as ‘Wellcat’.
The programme incorporates five modules. The WT-Drill module lets the user evaluate thetemperatures and pressures during drilling and the casing installation stages, while theresulting stresses the casing is subject to are calculated using the WS-Casing module. TheWT-Circ and WT-Prod modules let the user evaluate the temperatures during standardproduction and circulation operations and the WS-Tube module lets the user calculatetubing movement and stress.
‘Wellcat’ can be used for single completions, selective completions with a maximum of fivepackers, dual completions with a maximum of two packer’s and dual selective completions.The programme also assesses the installation of a hanger in the completion as well ashydraulic or mechanical packer setting. It is possible to evaluate the reduction in materialrating due to temperature and any anistropy of materials. The calculation of load losses andthe hydraulic conditions can be carried out using different correlations which are valid fortwo-stage flow (Beggs & Brill, Orkiszewski, Gray, Hagedorn & Brown, Duns & Ross), whilethe Govier-Aziz formula is used for single stage fluids.
The most interesting feature of the programme is its capability to evaluate temperaturesduring and after well operations. During testing the results were compared to actual fielddata and a good match was obtained. It is also possible to calibrate the averagecoefficients for thermal exchange and specific heat, once the temperature profile andlithology of the formations are known.
‘Wellcat’ produces results in ASCII format, which can be read, printed or exported asgraphic files. During processing it is also possible to display and print a simple drawing ofthe well and the completion.
The ‘Wellcat’ programme was initially tested with the most typical cases (discussed inpublications) and appropriate comparisons were made with data previously obtained usingthe ‘Vertubing’ programme with reasonable results. The programme is now used in thecompany for completion string design and at present available in PC, VAX Mainframe andUNIX versions.