Embed Size (px)
Citation preview

7269 MODELING ITEM RESPONSES NEN DIFFERENT SUBJECTS EMPLOY 1/1lDIFFRNT SOLUTION.. (U) EOUCNTIONFKL TESTING SERVICEPRINCETON NJ It J NISI.EVY ET AL OCT 8?
WICLNSSIFIEOD ETS-R-9-4-N NW14-5-K-6 3 F/ 5/ M
M ENNENmhmm
Iw
1.8
III
I- 2
w w ,w w w w w"
Jr.-

, RR-87-47-ONR
AD-A 190 269O/€ FILE COP.
MODELING ITEM RESPONSES WHEN DIFFERENT SUBJECTSEMPLOY DIFFERENT SOLUTION STRATEGIES
Robert J. Mislevy
and
Norman Verhelst
c,,o DTIC(National Institute for Educational Measurement) ELECTEArnhem, The Netherlands S JAN 06 1988 D
c H
This research was sponsored in part by theCognitive Science ProgramPsychological Sciences DivisionOffice of Naval Research, underContract No. N00014-85-K-0683
Contract Authority Identification No.NR 150-539
Robert J. Mislevy. Principal Investigator
, Educational Testing ServicePrinceton. New Jersey
October 1987
Reproduction in whole or in part is permittedfor any purpose of the United States Government.
Approved for public release, distribution unlimited.
S
,€ J' .. 'o -

UnclassifiedSECURITY CLASSIFICATION OF THIS PAGE
REPORT DOCUMENTATION PAGE
la REPORT SECURITY CLASSIFICATION lb RESTRICTIVE MARKINGS
Unclassified
2a SECURITY CLASSIFICATION AUTHORITY 3 DISTRIBUTION, AVAILABILITY OF REPORT
Approved for public release;
2b DECLASSIFICATION, DOW NGRADiNG SCHEDULE disro butio n u nli citeddistribution unlimited
4 PERFORMING ORGANIZATION REPORT NUMBER(S) S MONITORING ORGANIZATION REPORT NUMBER(S)
RR-87-47-ONR
6a NAME OF PERFORMING ORGANIZATION 6b OFFICE SYMBOL 7a NAME OF MONITORING ORGANIZATONCognitive ScienceEducational Testing Service (If applicable) Program, Office of Naval Research (Code 1142CS)
1 800 North Ouincv Street
6c ADDRESS (City, State, and ZIPCode) 7b ADDRESS (City, State, and ZIP Code)
Princeton, NJ 08541 Arlington, VA 22217-5000
Ba NAME OF FUNDING SPONSORING Bb OFFICE SYMBOL 9 PROCUREMENT INSTRUMENT DENTIFiCATiON NUMBER
ORGANIZATION (If applicable)I N00014-85-K-0683
8c. ADDRESS (City, State, and ZIP Code) 10 SOURCE OF FUNDING NUMBERS
PROGRAM PROJECT ITASK WORK UNITELEMENT NO NO NO ACCESSION NO
61153N RR04204 RR04204-01 NR 150-539
11 TITLE (Include Security Classification)
Modeling Item Responses When Different Subjects Employ Different Solution Strategies(Unclassified)
12 PERSONAL AUTHOR(S)
Robert J. Mislevy and Norman Verhelst
13a TYPE OF REPORT 13b TIME COVERED 14 DATE OF REPORT (Year, Month, Day) 15 PAGE COUNT
Technical FROM ____ TO October 1987 45
16 SUPPLEMENTARY NOTATION
17 COSATI CODES 18 SUBJECT TERMS (Continue on reverse if necessary and identify by block number)
FIELD GROUP SUB-GROUP Differential strategies Linear logistic test model
05 10 Item response theory Mixture modelsU ,
19 ABSTRACT (Continue on reverse if necessary and identify by block number)
A model is presented for item responses when different examinees employ
different strategies to arrive at their answers, and when only those answers,
not choice of strategy or subtask results, can be observed. Using
substantive theory to differentiate the likelihoods of response vectors under
a fixed set of solution strategies, we model responses in terms of item
parameters associated with each strategy, proportions of the population
employing each, and the distributions of examinee parameters within each.
Posterior distributions can then be obtained for each examinee, giving the
probabilities that they employed each of the strategies and their proficiency
under each. The ideas are illustrated with a conceptual example about
response strategies for spatial rotation items, and a numerical example
resolving a population of examinees into subpopulations of valid responders
and random guessers.
20 DISTRIBUTION/AVAILABILITY OF ABSTRACT 2' ABSTRACT SECURITY CLASSIFICAIiON
rUNCLASSIFIED/UNLIMITED C1 SAME AS RPT EIDTIC USERS Unclassified
22a NAME OF RESPONSIBLE INDIVIDUAL 22b TELEPHONE (Include Area Code) 22c OFFCE SYMBOL
Dr. James Lester 202-696-450) I)NR '142 (S
DO FORM 1473, 84 MAR 83 APR edton may be used unti' et~asted SECUJRITY CLASSIFCAT'ON OF THIS PAGE
All other ed tons.are osolete hjc . -. " i - . . - . .
%I
Modeling Item Responses When Different Subjects
Employ Different Solution Strategies
Robert J. Mislevy
Educational Testing Service
and
Norman Verhelst
CITO(National Institute for Educational Measurement)
Arnhem, The Netherlands
October 1987
Aaoession For
NTIS GRjFDTIC TAB ElUnannounced
Justification
,,. 'c .D13tributoo/
Availability Codes
NSPLCTED Avail and/cr6 :Dist SpecIal
IThe first author's work was supported by Contract No. .N00014-85-K-0683, Project Designation No. NR 150-539, fromthe Cognitive Science Program, Psychological SciencesDivision, Office of Naval Research. Reproduction in whole or
in part is permitted for any purpose of the United StatesGovernment. We are grateful to Isaac Bejar, Neil Dorans,Norman Frederiksen, and Marilyn Wingersky for their comments %
and suggestions.
V *~'* ~ *~.....%. ~ ~ . i.. .. . . . . . .. .. ,-% V,," ' .%% ':- _ , .- ',%-.i ,.-. .. _ ..v... -",, " , - %% ., .'' % ' , - ow- 1 1

at..
I
iS
*44'
Copyright ®) 1I7. Educational Testing Service. All rights ro~or, oi.
'*5%-- -- -- - -- --. ,, '' . t - _ - ,; . . '. -" l " ' '. | , " " " i -'" " " " V"

Modeling Item Responses When Different Subjects
Employ Different Solution Strategies
Abstract
A model is presented for item responses when different
examinees employ different strategies to arrive at their answers, I
and when only those answers, not choice of strategy or subtask
results, can be observed. Using substantive theory to
differentiate the likelihoods of response vectors under a fixed'r' 5
set of solution strategies, we model responses in terms of item
parameters associated with each strategy, proportions of the
population employing each, and the distributions of examinee
parameters within each. Posterior distributions can then be
obtained for each examinee, giving the probabilities that they
employed each of the strategies and their proficiency under each.
The ideas are illustrated with a conceptual example about response
strategies for spatial rotation items, and a numerical example
resolving a population of examinees into subpopulations of valid
responders and random guessers.
Key Words: Differential strategiesItem response theory'
Linear logistic test modelMixture models
,*5
.'J ..
~" ~ ~ 5 *5-.~*"Y -.f \-.-f/v - ~i.A' # . '' 5

- -' - - - -
A,I' A
(.a,
-q.J-S
'p
A'-
-'A
'A--
'p..
AU,'p
'I
.5.
5.
S.
* - .d' .,.ef 9 r~p C~d * ~- .- ,.:.~ w ~ w%...,.'5 .wq-..~,- ~ r ~- ~ " - ~ I

Different StrategiesI
Introduction
The standard models of item response theory (IRT), such as
the 1-, 2-, and 3-parameter normal and logistic models,
characterize examinees in terms of their propensities to makeI
correct responses. Consequently, examinee parameter estimates
are strongly related to simple percent-correct scores (adjusted
for the average item difficulties, if not all examinees have been
presented the same items). Item parameters characterize the
regression of a correct response on this overall propensity toward
correctness.
These models lend themselves well to tests in which all
examinees employ the same strategy to solve the items.
Comparisons among estimates of examinees' ability parameters areI
meaningful comparisons of their degrees of success in implementing
the strategy. Item parameters reflect the number or complexity of
the operations needed to solve a given item (Fischer, 1973).I
The same models can prove less satisfactory when different
examinees employ different strategies. The validity of using
scores that convey little more than percent-correct to compare
examinees who have used different strategies must first be called
into question. And item parameters keyed only to a generalized
propensity toward correctness will not reveal how a particular
kind of item might be easy for examinees who follow one line of
attack, but difficult for those who follow another. i-Um
uI

Different Strategies
2
Extensions of IRT to multiple strategies have several
potential uses. In psychology, such a model would provide a
rigorous analytic framework for testing alternative theories
about cognitive processing (e.g., Carter, Pazak, and Kail, 1983).
In education, estimates of how students solve problems could be
more valuable than how many they solve, for the purposes of
diagnosis, remediation, and curriculum revision (Messick, 1984).
And even when a standard IRT model would provide reasonable
summaries and meaningful comparisons for most examinees, an
extended model allowing for departures along predetermined lines
(e.g., malingering) would reduce estimation biases for the
parameters in the standard model.
In contrast to standard IRT models, and, for that matter, to
the "true score" models of classical test theory, a model that
accommodates alternative strategies must begin with explicit
statements about the processes by which examinees arrive at their
answers. For example, items may be characterized in terms of the
nature, number, and complexity of the operations required for
their solution under each strategy that is posited.
The recent psychometric literature contains a few
implementations of these ideas. Tatsuoka (1983) has studied
performance on mathematics items in terms of the application ofP%
correct and incorrect rules, locating response vectors in a two- 5-
dimensional space based on an ability parameter from a standard
IRT model and an index of lack of fit from that model. Paulson
* I0.
-N%*

Different Strategies
3
(1985), analyzing similar data but with fewer rules, uses latent
class models to relate the probability of correct responses on an
item to the features it exhibits and the rules that examinees
might be following. Yamamoto (1987) combines aspects of both of
these models, positing subpopulations of IRT respondents and of
non-scalable respondents associated with particular expected
response patterns. Samejima's (1983) and Embretson's (1985)
models for alternative strategies are expressed in terms of
subtasks whose results are observed, in addition to the overall
correctness or incorrectness of the item.
The present paper describes a family of multiple-strategy
IRT models that apply when each examinee belongs to one of a
number of exhaustive and mutually-exclusive classes that
correspond to an item-solving strategy, and the responses from
all examinees in a given class are in accordance with a standard
IRT model. It is further assumed that for each item, its
parameters under the IRT model for each strategy class can be
related to known features of the item through psychological or
pedagogical theory.
The next section of the paper gives a general description of
the model. It is followed by a conceptual example that
illustrates the key ideas. A two-stage estimation procedure is
then presented. The first stage estimates structural parameters:
basic parameters for test items, examinee population
distributions, and proportions of examinees following each
? ...-

Different Strategies
4
strategy. The second stage estimates posterior distributions for
individual examinees: the probability that they belong to each
strategy class and the conditional distribution of their ability
for each class. A numerical example resolves examinees into
classes of valid responders and random guessers. The final
section discusses some implications of the approach for
educational and psychological testing.
The Response Model
This section lays out the basic structure for a mixture of
constrained item response models. Discussion will be limited to
dichotomous items for notational convenience, but the extensions
to polytomous and continuous observations are straightforward.
We begin by briefly reviewing the general form of an IRT
model. The probability of response xi (1 if correct, 0 if not)i
from person i to item j is given by an IRT model as
X.. 1-X..P(Xijt~i,/ j ) = [f(Oi,j)J 'J[l-f(OiB.)] il (i)
where 0. and /3 are real (and possibly vector-valued) parameters
associated with person i and item j respectively, and f is a
known, twice-differentiable, function whose range is the unit
interval. Under the usual IRT assumption of local independence,
the conditional probability of the response pattern x. -1
(xil .... xin) of person i to n items is the product of n
expressions like (1):
NN
%A

Different Strategies
N5
nP(Xii, 1 IT P(x ij li
It may possible to express item parameters as functions of
some smaller number of more basic parameters a - (aI ... M) that
reflect the effects of M salient characteristics of items; i.e.,
= .(a). An important example of this type is the Linear
Logistic Test Model (LLTM; Fischer, 1973, Schieblechner, 1972).
Under the LLTM, the item response function is the one-parameter
logistic (Rasch) model, or
P[Xi.j0.i l ( a ) ] - exp[xij(9i-0j )]/[l+exp(O i- j)],
1 3 13 1 3 1-O 3 )1
and the model for item parameters is linear:
M
( =iQ m (aQ3ZQQi - m a
.4
The elements of a are contributions to item difficulty associated
with the M characteristics of items, presumably related to the
number or nature of processes required to solve them. The
elements of the known vector Q_ indicate the extent to which item
j exhibits each characteristic. Fischer (1973), for example,
models the difficulty of the items in a calculus test in terms of
the number of times an item requires the application of each of
seven differentiation rules. Qj is the number of times that rule 4
m n
m must be employed in order to solve Item j.

Different Strategies
6
Consider now a set of items that may be answered by means of
K different strategies. It need not be the case that all are
equally effective, nor even that all generally lead to correct
responses. Not all strategies need be available to all
examinees. We make the following assumptions.
1. Each examinee is applying the same one of these strategies
for all the items in the set. (In the final section, we
discuss prospects for relaxing this assumption to allow for
strategy-switching).
2. The responses of an examinee are observed but the strategy
he or she has employed is not.
3. The responses of examinees following Strategy k conform to
an item response model of a known form.
4. Substantive theory posits relationships between observable
features of items and the probabilities of success enjoyed by MImembers of each strategy class. The relationships may be
known either fully or only partially (as when the Q matrices %
in LLTM-type models are known but the basic parameters are
not).
I

Different Strategies
7
Let the kth element in the K-dimensional vector 4i take the
value one if examinee i follows Strategy k, and zero if not. I
Extending the notation introduced above, we may write the
conditional probability of response pattern xi as 1
X- 1-1xijl-x ij ik
ilii,) kj fk(ikjk) [ k(ikijk)
kj
where jkPjk(a) gives the item parameter(s) for Item j under
Strategy k.
It will be natural in certain applications to partition basic
parameters for items in accordance with strategy classes; that is,
a = (i . a K). When there are K versions of the LLTM, for
example, differences among strategies are incorporated into the
model by K different vectors Q.k' k-i,... ,K, that relate Item j to
each of the strategies: %
Ojk Qj km mk Jk k
The item difficulty parameter for Item j under Strategy k, then,
is a weighted sum of elements in ak, the basic parameter vector
associated with Strategy k; the weights Qjkm indicate the degree
to which each of the features m, as relevent under Strategy k, are
present in Item j. This situation will be illustrated in the
following example. N
U. ~ - * ~ *~*~U ~ % ~ *~*,~ -:. '

Different Strategies
8
Example 1: Alternative strategies for spatial tasks
The items of certain tests intended to measure spatial
visualization abilities admit to solution by nonspatial analytic
strategies (French, 1965; Kyllonen, Lohman, and Snow, 1984;
Pelligrino, Mumaw, and Shute, 1985). Consider items in which
subjects are shown a drawing of a three-dimensional target
object, and asked whether a stimulus drawing could be the same
object after rotation in the plane of the picture. In addition
to rotation, one or more key features of the stimulus may differ
from the those of target. A subject may solve the item either by
rotating the target mentally the required degree and recognizing
the match (Strategy 1), or by employing analytic reasoning to
detect feature matches without performing rotation (Strategy 2).
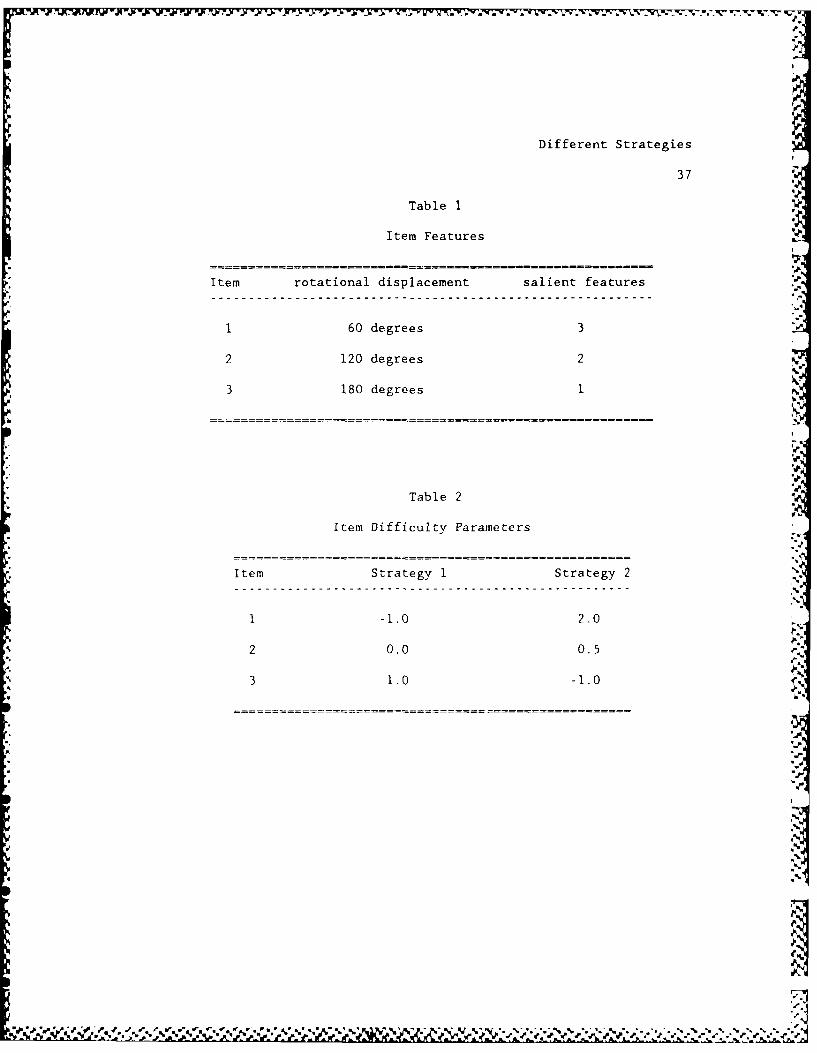
Consider further a hypothetical three-item test comprised of
such items. Each item will be characterized by (1) rotational
displacement, of 60, 120, or 180 degrees, and by (2) the number of
features that must be matched. Table 1 gives the features of the
items in the hypothetical test.
Insert Table 1 about here
Each subject i. will be characterized by two vectors. In the
first, .i "(ii)' ik takes the value I if Subject i employs
i ill i2 i

0
Different Strategies
9
Strategy k and 0 if not. In the second, 0 - il,0i2), aik
characterizes the proficiency of Subject i if he employs Strategy
k. Only one of the elements of 6. is involved in producing %
Subject i's responses, but we do not know which one.
Suppose that for subjects employing a rotational strategy,
probability of success is given by the one-parameter logistic
(Rasch) item response model:
P(X ij 0iljl,o 1I ) - exp[xi (9-0ij)]/[l+exp(Oil-p 4 l ) ]
iJ ±Lj iJ ji ij
Here 0 il is the proficiency of Subject i at solving tasks by
0means of the rotational strategy, and Oil is the difficulty of
Item j under the rotational strategy.
It is usually found that the time required to solve mental
rotation tasks is linearly related to rotational displacement. To
an approximation, so are log-odds of success (Tapley and Bryden,
1977). We assume that under the rotational strategy, item
parameters take the following form:
jl = ll 1iI + 12 '[05
where Qil encodes the rotational displacement of Item j--l for 60
degrees, 2 for 120 degrees, and 3 for 180 degrees--and aII is the
incremental increase in difficulty for each increment in rotation;
and a 1 2 is a constant term, for which a coefficient QjI2- 1 is
implied for all items. If a11-I and a1 2--2, the item parameters
q-.

Different Strategies
10
Pi that are in effect under Strategy 1 are as shown in the
second column of Table 2.
Insert Table 2 about here
A Rasch model will also be assumed for subjects employing
Strategy 2, the analytic strategy, but here the item parameters
depend on the number of features that must be matched:
)j2 - Qj2l '2 1 + '22
where Qj 2 1 is the number of salient features, a 2 1 is the
incremental contribution to item difficulty of an additional
feature, a2 2 is a constant term, and QJ22-1 implicitly for all
items. If a2 1-1.5 and a2 2--2.5, we obtain the item parameters
that are in effect under Strategy 2. They appear in the third
column of Table 2.
Note that the items have been constructed so that items that
are relatively hard under one strategy are easy under the other.
Strategy choice cannot be inferred from observed response patterns
unless patterns are more likely under some strategies and less
likely under others.
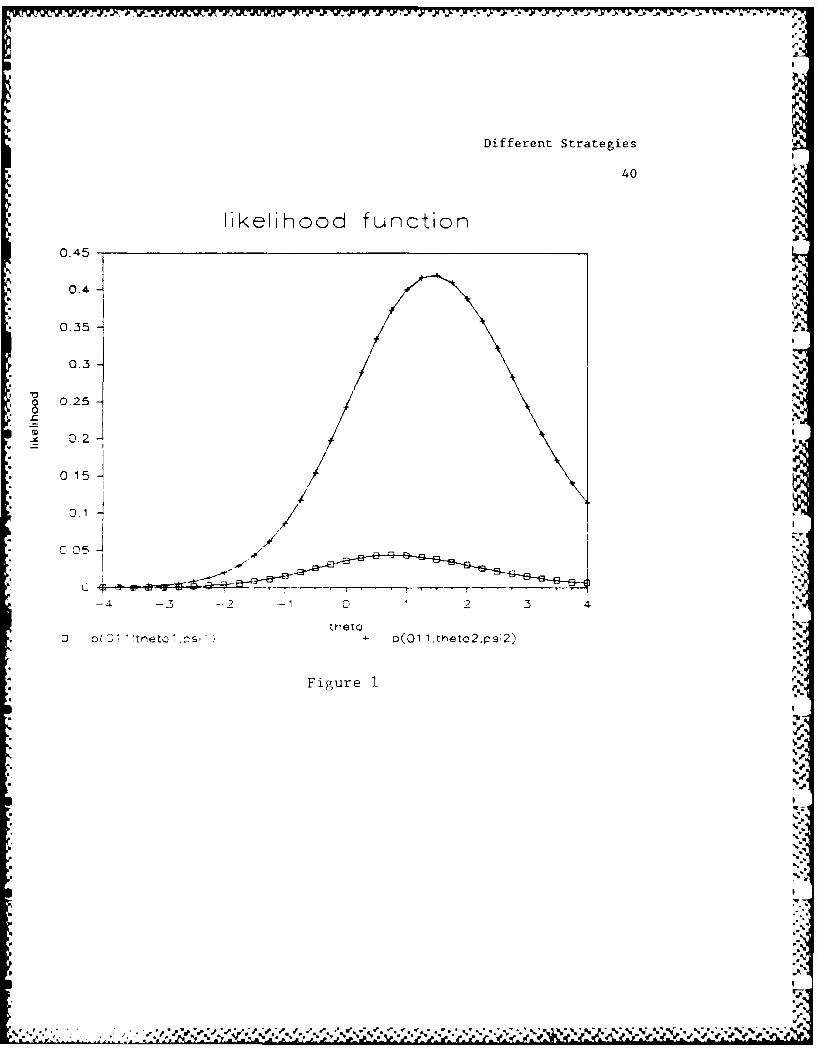
The response pattern 011, for example, has a correct answer
to an item that is easy under the Strategy 2 but hard under b
Strategy 1, and an incorrect answer to an item that is hard under
?Ib

Different Strategies
Strategy 2 but easy under Strategy 1. Figure 1 plots the
likelihood function for the response vector 011 under both
strategies; that is, plx=(011)Iktk-I] for k-l,2 as a function of V
81 and 02 respectively. The maximum of the likelihood under
Strategy 2 is about eight times as high as the maximum attained
under Strategy 1.
Insert Figure I about here
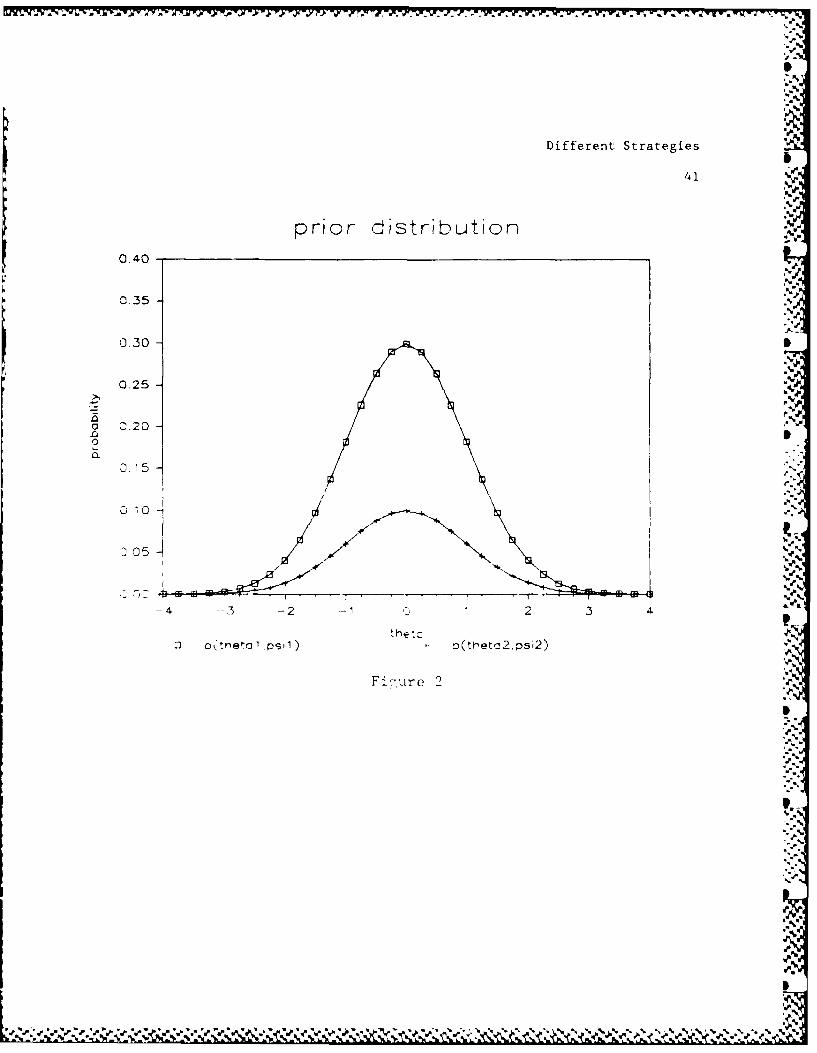
We can make probabilistic statements about individual
subjects if we know the proportions of people who choose each
strategy, or r k = P(Ok= I ) , and the distributions of proficiency
of those using each strategy class, or gk(Ok)= P(Oklk-l).
Suppose that (i) I and B2 both follow standard normal
distributions among the subjects that have chosen to follow them,
and (ii) three times as many subjects follow Strategy 1 as follow 'a
Strategy 2--i.e., x 1 3/4 and r2 1/4. This joint prior
distribution is pictured in Figure 2.
Insert Figure 2 about here
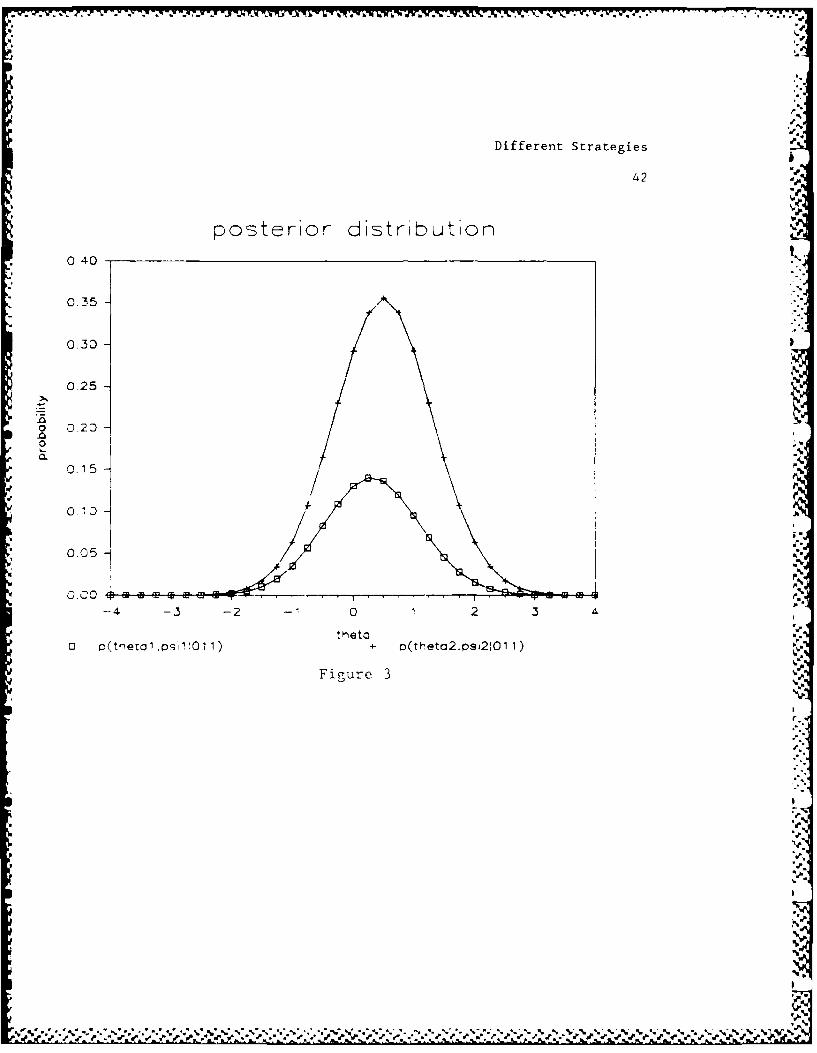
Routine application of Bayes theorem then yields the joint ° ,
posterior density function for 0 and Ok0kk-i for k-l....K: 1
p~xI~-1,O l (a]
P(OC k=O l x ' ' ) a P[XlOk-l1O,0k(a)] k 9k (0 ) (3)
V .r ,,o .. . .. .,. ... .. . .,.. o .. , ... .... ... . .. . .,. -. ft

Different Strategies
12
where
Sp~xI4kl,6, 8k(a)] H explxij[e- k( )]/(l+[e-.k(a)])jllk k. Jj kjk
The reciprocal of the constant of proportionality required to
normalize (3) is the marginalization of the right side, or
i k J P[XIOk l,0,0 gka) ( 0 ) dOk
The posterior distribution induced by (011) is shown in Figure 3.
Marginalizing with respect to 6k amounts to summing the area under
the curve for Strategy k, and gives the posterior probability that
U"
Ok=1--that is, that the subject has employed Strategy k. The
resulting values for this response pattern are P(O 1-llx-Oll)-.28
and P(O 2 =llx=011)=.72. The prior probabilities favoring Strategy
1 have been revised substantially in favor of Strategy 2. The
conditional posterior for 0, given 01-1 has a mean and standard
deviation of about .32 and .80. Corresponding values for the
distribution of 02 given 02-1 are .50 and .81.
-------- -------
Insert Figure 3 about here
Parameter Estimation
This section discusses estimation procedures for mixtures ofV.
IRT models. A two-stage procedure is described. The first stage21,
S 2 " - -,2 .. p p -N€ .- " " .' " m,,. ,

-- S b S - |_ _ - * -
"K
Different Strategies
13
integrates over 0 and distributions to obtain a so-called
marginal likelihood function for the structural parameters of the
problem--the basic parameters for items, the proportions of
subjects employing each strategy, and the parameters of the 6
distributions of subjects employing each strategies. Maximum
likelihood estimates are obtained by maximizing this likelihood
function. If preferred, Bayes modal estimates can be obtained by
similar numerical procedures by multiplying the likelihood by
prior distributions for the structural parameters. The second
stage takes the resulting point estimates of structural parameters
as known, and calculates aspects of the posterior distribution of
an individual examinee--e.g., p(Ok- lx) and P(O klk-l,x).
Stage 1: Estimates of Structural Parameters
Equation 2 gives the conditional probability of the response
vector x given 6 and 4, or p(xO,4,,a). Consider a population in
which strategies are employed in proportions wrk and within-
strategy proficiencies have densities gk(6kI~k) among the e.K-.
examinees using them. The marginal probability of x for an
examinee selected at random from this population is
p(xla'n n) = Z 7 k f P(XI k '4k )gkOlk dOk (4) %
k
For brevity, let denote the extended vector of all structural %
parameters, namely (mi,,). The loglikelihood for induced by

%.
"'a
Different Strategies
14
the observation of the response vectors X - (xI ... ,xN) of N
subjects is a constant plus the sum of the logs of terms like (4)
for each subject:
N= log P(xi)i-1
= E 0 ik log f pixil Ok -l,Rk(c)] gk(oklk) d9kik
+ E E ik log 7k (5)
ik
Let S be the vector of first derivatives, and H the matrix of
second derivatives, of A with respect to . Under regularity I
conditions, the maximum likelihood estimates solve the
likelihood equation S=O, and a large-sample approximation of the
matrix of estimation errors is given by the negative inverse of H 'a
evaluated at .
A standard numerical approach to solving likelihood
equations is to use some variation of Newton's method. Newton-
Raphson iterations, for example, improve a provisional estimate
.0 by adding the correction term -H-I S 0. Fletcher-Powell
iterations avoid computing and inverting H by using an
approximation of H that is built up from changes in S from one
cycle to the next.
These solutions have the advantage of rapid convergence if
starting values are reasonable--often fewer than 10 iterations
'a.

.7 7 A- IC %W I ' W
Different Strategies
15
are necessary. S and H can be difficult to work out, however,
and all parameters must be usually be dealt with simultaneously
because the off-diagonal elements in H needn't be zero. For these
reasons, a computationally simpler but slower-converging solution
based on Dempster, Laird, and Rubin's (1977) EM algorithm will now
be described as well. The approximation uses discrete
representations for the gks , so the relatively simple "finite
mixtures" case obtains (Dempster, Laird, and Rubin, 1977)
Suppose that for each k, subject proficiency under Strategy k
can take only the L(k) values 8 kl e kL(k)' The density gk is
thus characterized by these points of support and by the weights
associated with each, gk(8k2ik). Define the subject variable i
Si)KL(K)) a vector of length Zk L(k) where the element
Oik is 1 if the proficiency of Subject i under Strategy k is 8kf
and 0 if not. There are a total of K Is in i, one for each
strategy--though again, only only of them is involved in producing
x. --the one associated with the strategy that Subject i happens to1
employ. Summations replace integrations in the loglikelihood,
which can now be written as
Z Z 0 ik Z 0ik2 log P[xil'k-SkOk-,k()]ik I
+ 7, Z 0 ik Z 0 iki gk (E)kllk )
i.k I
+ Z Z ik log r k (6)
ik

-I TV -NV VI V-. 16% . -- - - - - - -S~w-7
p
Different Strategies
16
If values of 0 and 0 were observed along with values of x, ML
estimation of from (6) would be simpler. The basic parameter a
appears only in the first term on the right side of (6), so that
maximizing with respect to a need address that term only. When a
consists of distinct subvectors for each strategy, even these
subvectors lead to distinct maximization problems of lower order.
The subpopulation parameters n appear in only the second term,
separating them in ML estimation; they too lead to even smaller
separate subproblems if n consists of distinct subvectors for each
strategy. The population proportions x appear in only the last
term. Unless they are further constrained, their ML estimates are
simply observed proportions. The values of 8 may be either
specified a priori (as in Mislevy, 1986) or estimated from the
data (as in de Leeuw and Verhelst, 1986). In the latter case,
their likelihood equations have contributions from both the first
and second terms, but the equations for the points of support
under Strategy k involve data from only those subjects using
Strategy k. Their cross second derivatives with points
corresponding to other strategies are zero, although their cross
derivatives with elements of a and n that are involved with the ?
same strategy need not be.
The M-step of an EM solution requires solving a maximization
prohlem of exactly this type, with one exception: the unobserved
values of each 4i and 0i are replaced by their conditional
expections given x. and provisional estimates of , say 0 The
1%

Different Strategies
17
E-step calculates these conditional expectations as follows.
Denote by Ilik2 the following term in the marginal likelihood
associated with Subject i, Strategy k, and proficiency value 8kI
within Strategy k:
lik2 - P[Xie0k=ek2 'k'l'8k(a)] gk("klIk) 'k
The required conditional expectations are obtained as
0k =
0 0
ik2 ik2'2'
and
o)ik = (iklxi ' = 0 )
0 01Ik. / ik (8)
The EM formulation makes it clear how each subject
contributes to the estimation of the parameters in all strategy
classes, even though it is assumed that only one of them was
relevant to the production of his responses. His data contribute
to estimation for each strategy class is in the proportion to the

Different Strategies
18
probability that that strategy was the one he employed, given his
observed response pattern.
In addition to its simplicity, the EM solution has the
advantage of being able to proceed from even very poor starting
values. The slowness with which it converges can be a serious
drawback, however. Its rate of convergence depends on how well x
determines examinees' 9 and 0 values. Accelerating procedures
such as those described by Ramsay (1975) and Louis (1982) can be
used to hasten convergence.
'I
Stage 2: Posteriors for Individual Examinees
When the population parameters are accurately estimated,
the posterior density of the parameters of examinee i is
approximately
AI
P(O~~ik 8'iklxi ) [ilk-l'"'k(a)] wk gk(61nk ) '
where the reciprocal of the normalizing constant is obtained by
first integrating the expression on the right over 9 within each
k, then summing over k. The posterior probability that Subject i
used Strategy k is approximated by
P(¢ik-llxi, ) - S P(ik-,ikllxi,) dO1k I ik I

Xn~ J . Y d
Different Strategies
19
The examinee's posterior mean and variance for a given strategy
class, given that that was the strategy employed, are approximated
by
P,
0 ik = 0 P(o ik= 0,45ik-llxi, ) d8 P(O ik- llxi, )
and 2 -
-2-2
ik ik p( ik 0,ik llxi,) dO / P( ik -llxi,) i""
If the discrete approximation has been employed, (7) and (8) .$
apply.
Example 2: A Mixture of Valid Responders and Random Guessers
Given appropriate instructions, examinees will omit .
multiple-choice test items when they don't know the answers P,
rather than guess at random. The Rasch model may provide a good
fit to such data if omits are treated as incorrect. If a small
percentage of examinees responds at random to all items, however, ".
their responses will bias the estimation of the item parameters ""
that pertain to the majority of the examinees."
We may posit a two-class model, under which an examinee %
responds either in accordance with the Rasch model or guesses,
totally at random. For examinees in the latter class, "':.e
probabilities of correct response are constant, e.g., at the
reciprocal of the number of response alternatives to each item.
IIII I-
J.0
Ifth dscet aprxmaio hs ee epoyd,(7 ad 8)V

Different Strategies
20
Using the procedures described in the preceding sections, it is
possible to free estimates of the item parameters that pertain to
the valid responders from biases due to random guessers, even
though it is not known with certainty who the guessers are.
A mixture model for the (marginal) probability of response
pattern x in this situation is
2P~Il = ~ilok= I' ) k
k=l
where Strategy Class I is the Rasch model and Class 2 is random
guessing. The composition of is now described. It includes p
first the strategy proportions rI and i2 " For the Rasch class, the
basic parameters of are item difficulty parameters b. for
j=l,...,n. Suppose the distribution g, of proficiencies of p
subjects following the Rasch model is discrete, with L points of
support 8 = (E1 . e L) and associated weights w = (w W
The (marginal) probability of response pattern x under Strategy 1
is -
P(xll=l, 9 le,) - W I exp[x.(82 -b.)I/[l+exp(e2 -bj)]
a.*
Under the random guessing strategy, the basic parameters a2 are
the probabilities c. of responding correctly to each item j. All3
subjects following this strategy are assumed to have the same
probabilities of correct response, so no distribution g2 entersg24

.k
Different Strategies
21
the picture. For such subjects, the probability of response
pattern x is simply
x. l-x.I JP(XIO2 =l,a 2 ) = I c J (1-c.)
An artificial dataset was created for four items under this
model in accordance with the following specifications. Of 1200
simulees in all, 1000 followed the Rasch model and 200 were random
* guessers, implying 33 and N 167. The Rasch item
parameters were aI (bI. b4 ) = (-.511,-.l05,.182,.405). A
discrete density with six points of support was used to create the
data for the Rasch class. The points and their corresponding
proportions were as follows:
Point Proportion
-1.204 .08-.357 .17
.095 .25
.262 .25
.470 .17
.642 .08
The rates of correct response for the random guessers on the fourA
items were (c c) = (.30, .35, .20, .15). The
probability of each of the sixteen possible response patterns was
calculated within each class, multiplied by the number of simulees
in that class, summed over classes, and rounded to the nearest
integer. The resulting data are shown in Table 3.
14|4
:r

' w i* , -S . ,,* . - .4
Different Strategies
22
Insert Table 3 about here
A standard Rasch model was first fit to the data using the
two-step marginal maximum likelihood procedures described by de
Leeuw and Verhelst (1986). Conditional maximum likelihood (CML)
estimates were first obtained for item parameters. Setting their
scale by centering them around zero like the true item parameters
for the Rasch class, the resulting values were (- .324. -.053,
.127, .252). Note that these values are biased toward their
center; the presence of random guessers blurs the distinctions
among the differences in item difficulties. A three-point
discrete distribution--the greatest number of points leading to an
identified model for a four-item test--was next estimated for
subjects. The expected counts of response patterns under this
model are also shown in Table 3. A chi-square of 7.16 with 8
degrees of freedom results, indicating an acceptable fit for a
sample of the size we have employed.
A mixture model of the generating form was then fit to the
data, with two exceptions. First, the multiplicative form of the 10.0%
Rasch model was emploved during calculations. Since maximum
likelihood estimates are invariant under transformations, the
estimates of the structural parameters obtained under the
multiplicative form need merely be transformed back to the usual
OQU 4'

1
Z
Different Strategies
23
additive form shown above. Second, a three-point discrete
distribution was again employed for the Rasch class, with the
lowest point fixed at zero in the multiplicative scale. This
corresponds to 81 - -0 in the additive scale, implying incorrect
responses to all items with probability one. (As it turns out,
the estimated weight associated with this point will be zero.)
The total number of parameters to be estimated, then, was 13:
o 2 free points in the Rasch distribution: 8 2 and e3.
o 2 free values for weights at the three points in the Rasch
distribution: wI' W2' and w 3' where Z = I.
o item parameters for the Rasch class: al-(b I. -b 4).
0 4 item parameters for the guessing class: c c2). ( *
o 1 relative proportion for class representation: ir22'
In light of the fact that only 15 degrees of freedom are
available from the data, in the form of 16 response pu:terns whose
counts that must sum to 1200, an unaccelerated EM solution
1%.converged painfully slowly. Fletcher-Powell iterations were N
employed instead, and they converged rapidly. The Rasch-only "%
estimates described above were used as starting values for the
Rasch class item parameters and population distribution. For the
c's, a common value midway among the true values was used. For
I2' starting values of .10, .15. and .20 were used in three
different runs. All runs converged to the same solution
2a J' ,

Different Strategies
24
a1 = (-.501,-.091,.193,.398);
E = (- , .534, .354);
-10w = (<10 , .319, .681);
C2 = (.287, .230, .179, .139);
= .164.
Although the c's are slightly underestimated, the structure of
the data has been reconstructed quite well. The expected counts
of response patterns are also shown in Table 3. As they should,
they yield a nearly perfect fit: a chi-square of .008 on 3 degrees
of freedom. The improvement in chi-square is dramatic if not
significant--it would be for larger samples or longer tests--but
the removal of the bias in the Rasch item parameter estimates is
the point of the exercise.
Table 4 shows conditional likelihoods of each response
pattern given that an examinee is a guesser, a member of the
Rasch class with 0=-.534, and a member of the Rasch class with
0=.354. The estimated proportions of the population in these
categories are .164, .267, and .569 respectively. Multiplying
these population probabilities times a pattern's corresponding
likelihood terms, then normalizing, gives the posterior
probabilities that also appear in the table. Posterior
probabilities are given for membership in the guessing class, and
for 0=-.534 and 9=.354 given membership in the Rasch class.
-4
K-I, % 'f~*-:: .~,V'~~f .- : ~.-,*

- - - .-. _,-'.1 , - . - .. .,,. ft b - - -r i q~ tL i .i i i ,
VX
Different Strategies
25
Insert Table 4 about here
Recall from the description of the EM solution that the data
from an examinee is effectively distributed among strategy
classes to estimate the item parameters within that class. This
means that the responses of all examinees play a role in both
estimating both b's and c's--but with weights in proportion to the
posterior probabilities shown in Table 4. From responses to only
four items, we never have overwhelming evidence that a particular
examinee is a guesser. Only those with all incorrect responses
can be judged more likely than not to have guessed. Had only ,
those respondents been treated as guessers--and that would be the
Bayesian modal estimate of strategy class--estimated c's would all
have been zero. But employing a proportion of data from all .
patterns, even those with all items correct, yields estimated c'si
that essentially recover the generating values.
As a consequence of using the Rasch model for Strategy 1,
the conditional posterior distributions given that a subject
belongs to this class, or p(lx,1I=l) , are identical for all 'N
response patterns x with the same total score. The probability
that an eh:mine( Ielongs to the Rasch class vary considerably
within patterns with the same score, however. For any given
response pattero , the posterior probabilitv of being in the Rasch
-' l

Different Strategies
26
class can be inferred from Table 4 as I - P(O2-Ijx). For patterns
with exactly one correct response, these probabilities are, for
Items 1-4 in turn, .869, .800, .687, and .519.
Discussion
Theories about the processes by which examinees attempt to
solve test items play no role in standard applications of test
theory, including conventional item response theory. Only a data
matrix of correct and incorrect responses is addressed, and items
and examinees are parameterized strictly on the basis of
propensities toward correct response. When all that is desired is
a simple comparison of examinees in terms of a general propensity
of this nature, IRT models suffice and in fact offer many
advantages over classical true-score test theory.
Situations for which standard IRT models prove less
satisfactory involve a desire either to better understand the
cognitive processes that underlie item response, or to employ S-J
theories about such processes to provide more precise or more 'S
valid measurement. Extensions of item response theory in this
direction are exemplified by the Linear Logistic Test Model
*(Schieblechner, 1972; Fischer, 1973), Embretson's (1985)
multicomponent models, Samejima'a (1983) model for multiple Z
strategies, and Tatsuoka's (1983) "rule space" analyses.
The approach offered in this paper concerns situations in
which different persons may choose different strategies from a
%,.
SWI

Different Strategies
27
number of known alternatives, but overall proficiencies provide
meaningful comparisons among persons employing the same strategy.
We suppose that strategy choice is not directly observed but can
be inferred (with uncertainty) from response patterns on
theoretical bases. Assuming that substantive theory allow us to
differentiate our expectations about response patterns under
different strategies, and that a subject applies the same strategy
on all items, it is possible to estimate the parameters of IRT
models for each strategy. It is further possible to calculate the
probabilities that a given subject has employed each of the
alternative strategies, and estimate his proficiency under each
given that that was the one he used.
Assuming that a subject uses the same strategy on all items
is obviously undesirable for many important problems. In a
technical sense, the approach can be extended to allow for
strategy-switching by defining additional strategy classes that
are in effect comhinations of different strategies for different
items. Based on .ust and Carpenter's (1985) finding that subjects
sometimes apply whichever strategy is easier for a given problem,
we might define three strategy classes for items like those in our
Example 1:
o Always apply the rotat i oTn I strategy;
o Alwavs apply the analt ic stritegv:
o Apply whichver strategv is better suite.d to an it em
"7.

Different Strategies
28
If items were constructed to run from easy to hard under the 'V
rotational strategy and hard to easy under the analytic, subjects
using the third "mixed" strategy would find them easy, then
harder, then easier again.
There are limitations to how far these ideas can be pressed
in applications with binary data. Our second example showed that
the misspecified Rasch model fit a four-item test acceptably well
with a sample of 1200 subjects; in one way or another, more
information would be needed to attain a sharper distinction
between strategy classes and, correspondingly, more power to
differentiate among competing models for the data. One source of
information is more binary items. Fifty items rather than four,
including some that are very hard under the Rasch strategy, would
do. A different source of information available in other settings t
would be to draw from richer observational possibilities.
Examples would include response latencies as well as correctness,
eye-fixation patterns, and choices of incorrect alternatives that
are differentially likely under different strategies.
Differentiating the likelihood of response patterns under
different strategies is the key to successful applications of the
approach. Its use would be recommended when identifying strategy
classes is of primary importance to the selection or placement
decision that must be made, and overall proficiency is ofI
secondary importance. The items in the test must then be
constructed to maximize strategy differences, e.g., using items
I
. *.*-0 o.2 . e " ' ' P " ° ". - . " """" . . % ," '.' ' ', ."J " % % %.,°- '.,% % -.2

% P.
Different Strategies
29
that are hard under one strategy but easy under another. Most
tests in current use with standard test theory are not constructed
with this purpose in mind; indeed, they are constructed so as to
minimize differentiation among strategies, since it lowers the
reliability of overall-propensity scores. When strategy class
decisions are of interest, a conventional tests is not likely to
provide useful information. (Although a battery of conventional
tests might; differences in score profiles are analogous to
differential likelihoods of item response patterns, but at a
higher level of aggregation.)
In addition to the applications used in the preceding
examples, a number of other current topics in educational and
psychological research are amenable to expression in terms of
mixtures of IRT models. We conclude by mentioning three.
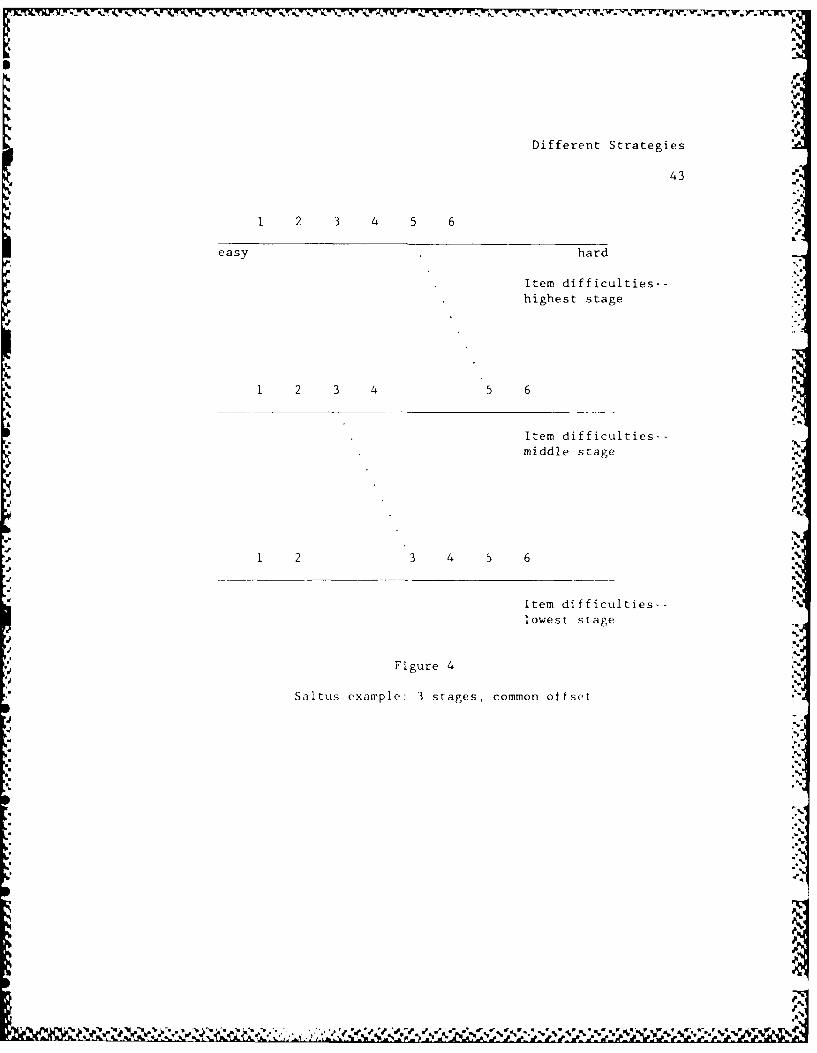
Hierarchical development. Wilson's (1984, 1985) "saltus"
model (Latin for "leap") extends the Rasch model to developmental
patterns in which capabilities increase in discrete stages, by
including stage parameters as well as abilities for persons, and
stage parameters as well as difficulties for items. Examples
would include Piaget's (1960) innate developmental stages and
Gagne's (1962) learned acquisition of rules. Suppose that K
stages are ordered in ttrms of increasing and cumulative
competence. In our notation, 0 would indicate the stage
membership of a subject In the highest stage, item responses
follow a Rasch model with parameters h.. Rasch models fit lower
1

Different Strategies
30
stages as well, but the item parameters are offset by amounts that
depend on which stage the item can first be solved. Our basic
parameters a would correspond to the item parameters for the
highest stage and the offset parameters for particular item types
at particular lower stages. Figure 4 gives a simple illustration
in which items associated with higher stages have an additional
increment of difficulty for subjects at lower stages. In
applications such as Siegler's (1981) balance beam tasks, subjects
at selected lower stages tend to answer certain types of higher-
stage items correctly for the wrong reasons. In these cases, the
offset works to give easier item difficulty parameters to those
items in those stages.
.* Insert Figure 4 about here
Mental models for problem solving. In the introduction to
their experimental study on mental models for electricity,
Gentner and Gentner (1983) state
Analogical comparisons with simple or familiar systems oftenoccur in people's descriptions of complex systems, sometimes
as explicit analogical models, and sometimes as implicitanalogies, in which the person seems to borrow structure fromthe base domain without knowing it. Phrases like "currentbeing routed along a conductor" and "stopping the flow" ofelectricitv are examples (p. 99).-:%
Mental models are important as a pedagogical device and as a
guide to problem-solving. Inferring which models a person is
bb
%C
k-A-64L.U

Different Strategies
31
using, based on a knowledge of how conceivable analogues help or
hinder the solution of certain types of problems, provides a
guide to subsequent training. In Gentner and Gentner's
experiment, the problems concerned simple electrical circuits with
series and parallel combinations of resistors and batteries.
Popular analogies for electricity are flowing waters (Strategy 1)
and "teeming crowds" of people entering a stadium through a few
narrow turnstiles (Strategy 2). The water flow analogy
facilitates battery problems, but does not help with resistor
problems; indeed, it suggests an incorrect solution for the
current in circuits with parallel resistors. The teeming crowd
analogy facilitates problems on the combination of resistors, but
is not informative about combinations of batteries. If a Rasch
model holds for items within strategies, Gentner and Gentner's
hypotheses correspond to constraints on the order of item
difficulties with the two strategies. If each item type were
replicatated enough times, it would be possible to make inferences
about which model a particular examinee was using, in order to .
plan subsequent instruction.
Changes in intelligence over age. An important topic in the
field of human development is whether, and how, intelligence
changes as people age (Birren, Cunningham, and Yamamoto, 1983).
Macrae (n.d.) identifies a weakness of most studies that employ
psychometric tests to measure aging effects: total scores fail to
reflect important differences in the strategies different subjects
! ?M
Z~P' ~ '& #,' a * '~ ~. 4S4~J * '~' ~>' ~ '9~~ ".i~ ~~vJ "

Different Strategies
32
bring to bear on the items they are presented. Total score '
differences among age and educational-background groups on Raven's
matrices test were not significant in the study she reports. But
analyses of subjects' introspective reports on how they solved
items revealed that those with academically oriented background
* were much more likely to have used the preferred "algorithmic"
strategy over a "holistic" strategy than those with vocationallyA
oriented backgrounds. Since the use of algorithmic strategies was
found to increase probabilities of success differentially on
distinct item types, this study would be amenable to IRT mixture
modeling. Inferences could then be drawn about problem-solving
approaches without resorting to more expensive and possibly
unreliable introspective evidence.
I.
!A
A.,
-.,-
Different Strategies
33 *ul..
References
Birren, J.E., Cunningham, W.R., and Yamamoto, K. (1983).
Psychology of adult development and aging. Annual Review of
Psychology, 34, 543-575.
Carter, P., Pazak, B., and Kail, R. (1983). Algorithms for I
processing spatial information. Journal of Experimental
Child Psychology, 36, 284-304. V
Dempster, A.P., Laird, N.M., and Rubin, D.B. (1977). Maximum
likelihood from incomplete data via the EM algorithm. %
Journal of the Royal Statistical Society (Series B), 39, 1-
38.
Embretson, S.E. (1985). Multicomponent latent trait models for
test design. In S.E. Embretson (Ed.), Test Desi 'n:
Developments in Psychology and Psychometrics. Orlando:
Academic Press.
Fischer, G.H. (1973). The linear logistic test model as an
instrument in educational research. Acta Psvchologica, 36,
359-374.
French, J.W. (1965). The relationship of problem-solving styles
to the factor composition of tests. Educational and
Psycholopgical Measurement, 25, 9-28.
Gagne, R.M. (1962). The acquisition of knowledge. P.chological
Review ,0 ) i55-36',.
Gentner. )., and Gentner, DR. (1983). Flowing waters or teeming
,4,,,
po'.
C j -v'-~:-.'y~a ~'a-*- a-,-y ~ .~~.~ ~ - -9I'

Different Strategies
34
crowds: Mental models of electricity. In D. Gentner and
A.L. Stevens (Eds.), Mental Models. Hillsdale, NJ: Erlbaum.
Just, M.A., and Carpenter, P.A. (1985). Cognitive coordinate V
systems: Accounts of mental rotation and individual
differences in spatial ability. Psychological Review 92,
137-172.
Kvllonen, P.C., Lohman, D.F., and Snow, R.E. (1984). Effects of
aptitudes, strategy training, and task facets on spatial
task performance. Journal of Educational Psychology, 76,
130-145.
de Leeuw, J., and Verhelst, N. (1986). Maximum likelihood
estimation in generalized Rasch models. Journal of
Educational Statistics, 11 183-196.
Louis, T.A. (1982). Finding the observed information matrix when
using the EM algorithm. Journal of the Royal Statistical -
Society, Series B. 44. 226-233.
Macrae, K.S. (nd.). Strategies underlying psychometric test
responses in young and middle-aged adults of varying
educational background. La Trobe University, Australia.
Messick, S. (1984). The psychology of educational measurement.
Journal of Educational Measurement, 21, 215-237.
Mislevy, R.J. (1986). Bayes modal estimation in item response .41
models. Ptvch wetrika, 51, 177-195.
Paulson, J. (1985). Latent class representation of svstematic
patterns in test responses. ONR Technical Report.

Different Strategies
35
Portland: Portland State University. Pelligrino, J.W.,
Mumaw, R.J., and Shute, V.J. (1985) Analysis of spatial
aptitude and expertise. In S.E. Embretson (Ed.), Test
Design: Developments in Psychology and Psychometrics.
Orlando: Academic Press.
Piaget, J. (1960). The general problems of the psychological
development of the child. In J.M. Tanner and B. Inhelder
(Eds.), Discussions on Child Developement: Vol. 4. The
fourth meeting of the World Health Organization Study Group
on the Psychological Developement of the child, Geneva, 1956.
Ramsay, J.O. (1975). Solving implicit equations in psychometric
data analysis. Psychometrika, 40, 361-372.
Samejima, F. (1983). A latent trait model for differential
strategies in cognitive processes. Office of Naval Research
Technical Report ONR/RR-83-1. Knoxville TN: University of
Tennessee.
- Schieblechner, 11. (1972). Das lernen und losen lomplexer
denkaufgaben. Zeitschrift fur experimentelle und Angewandte
Psvchologie, IQ 476-506.
Siegler, R.S. i1 )8 1 ). Developmental sequences within and between
concepts. M(,nograph of the Society for Research in Child
Development, Serial No. 189, 46(2).
Taplev. SM., rind Brvden, M.P. fl77). An investigation of sex
differences n spatial ahility: Mental rotation of three-
0.

Different Strategies
36
dimensional objects. Canadian Journal of Psychology, I1,3
122-130.
Tatsuoka, K.K. (1983). Rule space: An approach for dealing with
misconceptions based on item response theory. Journal of',
Educational Measurement, 20, 345-354.
Wilson, M.R. (1984). A Psychometric Model of Hierarchical
Development. Doctoral dissertation, University of Chicago.
Wilson, M.R. (1985). Measuring Stages of Growth: A Psychometric
Model of Hierarchical Development. Occasional Paper No. 19.
Hawthorne, Austrailia: Australian Council for Educational
Research.
Yamamoto, K. (1987). A hybrid model for item responses. Doctoral
dissertation, University of Illinois.
%p
.,:
-?,
"1
""p
S
Different Strategies
37
Table 1
Item Features
Item rotational displacement salient features
1 60 degrees 3
2 120 degrees 2
3 180 degrees 1
N
Table 2
Item Difficulty Parameters
Item Strategy I Strategy 2 44
1 -1.0 2.0
% 2 0.0 0.5 .4
3 1.0 -1.0
.- r

Different StrategiesI
38
Table 3
Observed and Fitted Response Pattern Counts for Example 2
e
observed expected frequencies expected frequencies
x frequencies (Rasch model only) (2-class model)
0000 143 143.00 143.08 L
0001 94 98.66 93.95 10010 83 87.12 83.110011 101 90.55 101.090100 73 72.75 72.780101 78 76.62 77.750110 65 66.77 65.26
0111 106 93.20 105.981000 64 55.46 63.91
1001 54 57.65 54.16 N
1010 47 50.91 46.75
1011 71 71.06 70.941100 39 42.51 39.301101 54 59.34 54.071110 45 52.40 44.801111 83 83.00 83.07
- - - -------------------------------------------------- -- - - - -.
6
%
%

Different Strategies
39 1 V,'_'-S
Table 4
Response Pattern Likelihoods and Posterior Probabilities
--- - - -- - - -- - - -- - - - - -
..
x L(xI0 2) L(xIe 2,0) L(xle 2,4I) P(@2Ix) P(e2Ix,4I) P(e3Ix,O1) " -
0000 .388 .150 .027 .534 .719 .2810001 .063 .131 .058 .131 .513 .487 I0010 .085 .107 .047 .200 .513 .4870011 .014 .093 .100 .027 .303 .6970100 .116 .080 .036 .313 .513 .4870101 .019 .070 .076 .047 .303 .6970110 .025 .057 .062 .076 .303 .6970111 .004 .050 .131 .008 .151 .849 01000 .156 .053 .024 .481 .513 .4871001 .025 .047 .050 .092 .303 .6971010 .034 .038 .041 .143 .303 .6971011 .005 .033 .087 .015 .151 .8491100 .047 .029 .031 .234 .303 .6971101 .008 .025 .065 .027 .151 .8491110 .010 .020 .053 .045 .151 .849i111 .002 .018 .113 .004 .068 .932
Note: 0i denotes membership in the class of Rasch responders; I
2 denotes membership in the class of random guessers;82 denotes membership in the class of Rasch responders,with 0=-.534;
e3 denotes membership in the class of Rasch responders,with 6=. 354.
% .
I.
%' '.
Different Strategies
40
likelihood function
0.45 - _ _ _ _ _ _ _ _ _ _ _ _ _ _ _ _ _ _ _ _ _ _ _ _ _ _ _ _ _
0.4
0.35 -
0.3 /~//
'a %0 0.25 -0
0.2-
0 0151I / '
C, 05-
-3 -- 2 --1 0 1 2 3 4
tretaZ) i k 0 .(01 1 thetc2,p92)
Figure I
VO
*i
S 4
I %
[-.
Different Strategies
i
prior- distribution0.40
0. 35 .-,
0.30
0.25 ,,
0 .20 -
0 . 1 5 " .-
-4 -- -2 -1 2 3 4
Fi'ure 2
'.,"
*:'r-
N
Different Strategies
4 2 4 0
posterior distribution040-
0.35
0.30
025 -
Zo 0.20
0
0.15
0.10- ;'-
a-
-4 -3 -2 - 0 1 2 3 4.
thetao o(teco ,ps1!0 0 l) 1 o(theta2.psi201 1)
Figure 3
..
owe
IIADifferent Strategies
43
1 2 3 4 5 6
easy hard
Item difficulties--
highest stage
1 2 3 4 5 6
Item difficulties--middle stage -I
.. J.
1 2 3 4 5 6
Item difficulties--lowest stage
Figure 4
Saltus example: 3 stages, common offset
'p,;
,',5-

- - - -' - R. ~ -
-p
II
I
a,.
I
\'S
I5-
-S
-p
-- p
'5
I-5.
'--p5-5,.
5.
5,.
PS ~P5-
5.S.
I
5-.
~5 * S. ~ -. -' -. - - '*5
~ 5. .- .i ? -. .- .V~ j.F',r.r,~ '&.'.'d'.' '.~ a~~' 's'.~ '* ~w" \A'&' '5 ' '*'5 %~.S,. 5-55~ S~5 5~5
* 198/10/16
Educational resting Service/Mislevy
Dr. rerry Ackerman Dr. R. Darrell BockAmerican College Testing Programs University of ChicagoP.O. Box 168 NORCIowa City, IA 52243 6030 South Ellis
Chicago, IL 60637
Dr. Robert AhlersCode N/11 Cdt. Arnold BohrerHuman Factors Laboratory Sectie Psychologisch Onderzoek
Naval Training Systems Center Rekruterings--En SelectiecentrumOrlando, F-L 32813 Kwartier Koningen Astrid
Bruijnstraat
Dr. James Algina 1120 Brussels, BELGIUMUniversity of FloridaGainesville, FL 32605 Dr. Robert Breaux
Code N-095R
Dr. Erling B. Andersen Naval Training Systems CenterDepartment of Statistics Orlando, FL 32813Studiestraede 61455 Copenhaqen Dr. Robert BrennanDENMARK American College Testing
ProgramsDr. Eva L. Baker P. 0. Box 168UCLA Center for the Study Iowa City, IA 52243
of Evaluation145 Moore Hall Dr. Lyle D. Broemeling
.r. University of California ONR Code 1111SP
Los Angeles, CA 90024 800 North Quincy StreetArlington, VA 22217
Dr. Isaac BejarEducational Testing Service Mr. James W. CareyPrinceton, NJ 08450 Commandant (G-PTE)
U.S. Coast Guard
Dr. Menucha Birenbaum 2100 Second Street, S.W.School of Education Washington, DC 20593Tel Aviv UniversityTel Aviv, Ramat Aviv 699/8 Dr. James CarlsonISRAEL American College lesting
ProgramDr. Arthur S. Blaiwes P.O. Box 168Code N/11 Iowa City, IA 52243Naval Fraining Systems CenterOrlando, l-L 32813 Dr. John B. Carroll
409 Llliott Rd.Dr. Bruce Bloxom Chapel Hill, NC 27514
Defense Manpower Data Center550 Camino El Estero, Or. Robert Carroll
Suite 200 OP 0187Monterey, CA 93943-3231 Washington, OC 20370
Mr. Raymond E. ChristalAFHPL/MOE
Brooks AFB, IX /8235 I~ ~.~uj - 'Pb" '.P ~sJ - * ~ ~ \.;. .~; K!
1987/10/16
Educational Testing Service/Mislevy
Dr. Norman Lliff Dr. Hei -Ki Dong
Department of Psychology Bell Communications Research
Univ. of So. California 6 Corporate Place
University Park PYA-I1k226
Los Anqeles, GA 9000/ Piscataway, NJ 0B854
Director, Dr. Fritz DrasgowManpower Support and University of Illinois
Readiness Proqram Department of Psycholoqy
Center for Naval Analysis 603 E. Daniel St.
2000 North Beaureqard Street Champaign, IL 61820
Alexandria, VA 22311Defense lechnical
Dr. Stanley Collyer Information Center
Office of Naval lechnoloqy Cameron Station, Bldg 5
Code 222 Alexandria, VA 22314
800 N. Ouincv Street Attn: TCArlington, VA 22211-5000 (12 Copies)
Dr. Hans Crombag Dr. Stephen DunbarUniversity of Leyden Lindquist Center
Education Research l-enter for MeasurementBoerhaavelaan 2 University of Iowa
2334 EN Leyden Iowa City, IA 52242The NEFHlPLANDS
Dr. James A. F.arlesMr. Iimothy Davey Air Force Human Resources Lab
iJniversity of Illinois Brooks AFB, TX 78235
Educational PsychologyUrbana, IL 61801 [r. Kent Eaton
Army Research Institute
Dr. C. M. Dayton 5001 Eisenhower Avenue
Department of Measurement Alexandria, VA 22333
Statistics & EvaluationCo lege of Education Dr. John M. EddinsUn versity of Maryland University of Illinois
Col leqe Park, MU 20/42 (b2 Enqineering Research'..e Laboratory
Dr. Ralph J. DeAyala 103 South Mathews StreetMeasurement, Statistics, UJrbana, IL 61801
and EvaluationBenjamin Building Dr. Susan Emhretson
University of Maryland University of Kansas
Colleqe Park, MD 20142 Psychology Department426 Fraser
Dr. Dattprasad Divqi Lawrence, KS 66045
Center for Naval Analysis
4401 ford Avenue Dr. Georqe Enqiehari, Ir.P.O. Box 16268 Division of Educational S iidi sAlexandria, VA 2230 -0?_8 Emory University
201 F ishhurne Bldg.Atlanta, GA 30322
"'r ., -- r F . - %

1'3 ;.10 16
Educational V esting Service/Mislevy
Dr. Benjamin A. Iairbank Dr. Janice GiffordPerformance Metrics, Inc. University of Massachusetts5825 Callaghan School of LducationSuite 225 Amherst, MA 01003San Antonio, VX /8228
Dr. Robert GlaserDr. Pat Iederico Learning ResearchCode 51I & Development CenterNPROC lniversity of PittsburghSan Diego, CA 92152-6800 3939 U'Hara Street
Pittsburgh, PA 15260Dr. Leonard veldtLindquist Center Dr. Bert Green
for Measurement Johns Hopkins UniversityUniversity of Iowa Department of PsychologyIowa City, IA 52242 Charles & 34th Street
Baltimore, MD 21218Dr. Richard L. F ergusonAmerican Colleqe Testing DipI. Pad. Michael W. Habon
Program Univers i tat DusseldorfP.O. Box Ib8 ErziehungswissenschaftlichesIowa City, IA 52240 Universitatsstr. I
D-4000 Dusseldorf 1Dr. Gerhard 1- scher Wli3T GCRMANYLiebiggasse 5/3A 1010 Vienna Dr. Ronald K. HambletonAUSiRIA Prof. of Education & Psychology
University of MassachusettsDr. Myron Fischl at AmherstArmy Research Institute Hills House
5001 Eisenhower Avenue Amherst, MA 01003Alexandria, VA 22333
Dr. Delwvn IlarnischProf. Donald FVitzgerald University of IIlinoisUniversity of New England 51 Gerty DriveDepartment of Psychology Champaign, IL 61820Armidale, New South Wales 2351AUSTRALIA Ms. Rebecca Hetter
%: Navy Personnel R&D Center
4.. Mr. Paul Foley Code 62Navy Personnel R&D Center 13an Dieqo, CA 92152-6800San Diego, CA 92152-6800
MIA Dr. Piul W. Hol landDr. Alfred R. [reqlv Educational lesting ServiceAFOSR/NL Rosedale RoadBollinQ A4, DC 20332 Princeton, NJ 08'541
Dr. Robert D. Gibbons Prof. Lutz . HornkeIllinois State Psychiatric Inst. Institut tur PsychologiePm )29W PWIH Aachen1601 W. raylor Street Jaegerstrasse 17/1qChicago, IL 60612 D-5100 Aachen
WESI GERMANY
N.%

1987/10/16
Educational Festing Service/Mislevy
AIM
Dr. Paul Horst Prof. John A. Keats r677 6 Street, #184 Department of Psychology
Chula Vista, CA 90010 University of NewcastleN.S.W. 2308
Mr. Dil, Hoshaw AUSTRALIA
OP- 13-Arl .nqton Annex Dr. G. Gage Kingsbury
Room 28 4 Portland Public Schools
Washington, Dk 20350 Research and Evaluation Department501 North Dixon Street
9r. L Ioyd Humofirevs P. 0. Box 3107Jriversitv of Illinois Portland, OR 9/209-3107
Department of Psychology603 Last Daniel Street Dr. William Koch
Champaign, IL 61820 University of lexas-AustinMeasurement and Evaluation
D Jr. '.-teven Hunka Center
Derartment c:, Lducatton Austin, rX /8703-Jniversity oif Alberta
Edmonton, Alberta Dr. James Kraatz
' CANADA C omputer-based EducationResearch Laboritory
. Dr. H.j n , Huyn Iu niversity of Illinois
"-c e of Lducation Urbana. IL 61801inr v. of "outh carol -ina
j mba, i. lb Dr. Leonard KroekerNavy Personnel R&D Center
Dr. Pote-t Jannarine San Dieo, CA 92152-6800
Jepartn-ent of Psvchologvjnversitv of South Carolina Dr. Daryll Lang
C',umt,a, 5(L .'_9206 Navy Personnel R&D Center ?
San Diego, CA 92152-6800
Dr. Lenn i s E. Jerin inqs.r Department of 'Statistics Dr. Jerry Lehnus
.Jnterstv of Illinois Defense Manpower Data Center140q West treen Street Suite 400iJrbana, IL b1HO1 1'00 Wilson Blvd
Rosslyn, VA O2209
Dr. L)ouqlas H. Jones"Thatcher Jones Associates Dr. lhomas LeonardP.C.). Box 6b40 University of Wisconsin
* 10 rrafalqar Court Department of Statistics
Lawrencevi lIe, NJ 00648 1,.'10 West Dayton StreetMadison, W1 ')3705 ,
Dr. M, ton S. Katz
Army Research Institute )r. Michael Levine W,5001 L-senhower Avenue Kducational Psychology
A lenxandria, VA 2A-'33 210 Education Bidg.
LIniversity of IllinoisCha npa iqi n, IL b18 01
,I
Educational Testing Service/Mislevy
Dr. Charles Lewis Dr. George B. MacreadyEducational lesting Service Department of MeasurementPrinceton, NJ 08541 Statistics & Evaluation
College of EducationDr. Robert Linn University of MarylandColIleQ Education College Park, MD 20742Univr-s i , of IllinoisUrba..:, il 61801 Dr. Robert McKinley
Educational [esting Service
Dr. Robert Lockman 20-PCenter for Naval Analysis Princeton, NJ 08541 -.-
4401 Vord AvenueP.O. Box 16268 Dr. James McMichaelAlexandria, VA 22302-0268 lechnical Director
Navy Personnel R&D CenterDr. Frederic M. Lord San Diego, CA 92152Educational Festing ServicePrinceton, NJ 08b41 Dr. Barbara Means
Human ResourcesDr. Milton Maier Research OrganizationCenter for Naval Analysis 1100 South Washinqton k,%
4401 Ford Avenue Alexandria, VA 22314 PP.O. Box 16268Alexandria, VA 22302-0268 Dr. Robert Mislevy
Educational lesting Service Ti
Dr. William L. Maloy Princeton, NJ 08541Chief of Naval Education
and Training Dr. William MontagueNaval Air Station NPRDC Code 13Pensacola, fL 32508 San Diego, CA 92152-6800
Dr. Gary Marco Ms. Kathleen MorenoStop 31-E Navy Personnel R&D Center %Educational lesting Service Code 62Princeton, NJ 084b1 San Diego, CA 921b2-6800
Dr. Clessen Martin Headquarters, Marine CorpsArmy Research Institute Code MPI-205001 Eisenhower Blvd. Washington, DC 20380Alexandria, VA 22333 r%
Dr. W. Alan Nicewander P
Dr. James McBride .Iriversity of OklahomaPsychological lorporation Department of Psychologyc/o Harcourt, Brace, Oklahoma City, OK /3069
Javanovich Inc.1250 West 6th Street Deputy lechnical DirectorSan DieQo, CA 92101 NPRDC Code O1A
San Diego, CA 92'52-6800Dr. Clarence McCormickHO, MEPCOM Director, Training Laboratory,MEPCI-P NPRDC (Code 05)
2500 Green Bay Road San Diego, CA 92152-6800North Chicago, I 60064
A A a
1987/10/16
Educational resting Service/Mislevy
Director, Manpower arid Personnel Dr. Judith Orasanu
Laboratory, Army Research Institute %
NPRDC (Code 06) 5001 Eisenhower AvenueSan Diego, CA 92152-6800 Alexandria, VA 22333
Director, Human Factors Dr. Jesse Orlansky -I
& Organizational Systems Lab, Institute for Defense Analyses
NPRL)C (Code 0/) 1801 N. Beauregard St.
San Diego, CA 92152-6800 Alexandria, VA 22311 ,.
Fleet Support Office, Dr. Randolph ParkNPPDC (Code 301) Army Research Institute -
San Diego, CA 921S2--6800 5001 Eisenhower Blvd.Alexandria, VA 22333
Library, NPRDC
Code P2O1L Wayne M. Patience
San Diego, CA 921b2-6800 American Council on Education
GED Testing Service, Suite 20
Commandinq Oft icer, One Dupont Circle, NW
Naval Research Laboratory Washington, DC 20036
Code 2627Washinqton, DC 20390 Dr. James Paulson
Department of Psychology
D-. Harold F. O'Neili, Jr. Portland State University
School of Education - WPH 801 P.O. Box 751
Department of Educational Portland, OR 97207
Psychology & fechnology
University of Southern California Administrative Sciences Department, %
Los Angeles, C-A 90089 0031 Naval Postgraduate SchoolMonterey, CA 93940
Dr. James OlsonWICAI, Inc. Department of Operations Research,
1875 South State Street Naval Postgraduate School
Orem, LII 84057 Monterey, CA 93940
Office of Naval Research, Dr. Mark D. Reckase
Code 1142CS ACT -
800 N. Quincy Street P. 0. Box 168 "N
ArIinqton, VA 22 1 5000 Iowa City, IA 52243 6
(6 Copies)Dr. Malcolm Ree
Office of Naval Research, AIFHRL/MPCode 125 Brooks AFB, rX 18235
800 N. Quincy Street
Arl ington, VA 2221/-5000 Dr. Barry RiegelhauptHumPRO
Assistant for MPf Research, 1100 South Washington Street
Development and St-,dies Alexandria, VA 22314
OP 0187 0Washinqton, DC 203/0 Dr. Carl Ross %
CNE1-PDCDBuilding 90
Great Lakes NIL, IL 60088p
198Y/ 10/ 16
Educational resting Service/Mislevy
Dr. J. Ryan Dr. Richard E. SnowDepartment of Education Department of PsychologyUniversity of South Carolina Stanford UniversityColumbia, SC 29208 Stanford, CA 94306
Dr. Fumiko Samejima Dr. Richard SorensenDepartment of Psychology Navy Personnel R&D CenterUniversity of fennessee San Diego, CA 92152-68003108 AustinPeay Bldg.Knoxville, IN 37916-0900 Dr. Paul Speckman
University of MissouriMr. Drew Sands Department of StatisticsNPRDC Code 62 Columbia, MO 65201San Diego, CA 92152-6800
Dr. Judy SprayLowell Schoer ACTPsychological & Quantitative P.O. Box 168
Foundations Iowa City, IA 52243College of EducationUniversity of Iowa Dr. Martha StockingIowa City, IA 52242 Educational Testing Service
Princeton, NJ 08541Dr. Mary Schratz
Navy Personnel R&D Center Dr. Peter StoloffSan Diego, CA 92152-6800 Center for Naval Analysis
200 North beauregard StreetDr. Dan Segall Alexandria, VA 22311Navy Personnel R&D CenterSan Diego, CA 92152 Dr. William Stout
University of IllinoisDr. W. Steve Sellman Department of StatisticsOASD(MRA&L) 101 Illini Hall28269 The Pentagon /25 South Wright St.Washington, DC 20301 Champaign, IL 61820
Dr. Kazuo Shigemasu Maj. Bill Strickland7-9-24 Kugenuma-Kaigan AF/MPXOAFujusawa 251 4E168 PentagonJAPAN Washington, DC 20330
Dr. William Sims Dr. Hariharan SwaminathanCpnter for Naval Analysis Laboratory of Psychometric and4401 Ford Avenue t'valuation ResearchP.O. Box 16268 School of EducationAlexandria, VA 22302-0268 University of Massachusetts
Amherst, MA 01003
Dr. H. Wallace SinaikoManpower Research Mr. Brad Sympson
and Advisory Services Navy Personnel R&D CenterSmithsonian Institution San Diego, CA 92152-6800801 North Pitt StreetAlexandria, VA 22314
pp ~ *.N., ~p.........................&L~

1987/10/16
Educational lesting Service/Mislevy
Dr. John Tangney Dr. Howard Wainer
AFOSR/NL Division of Psychological Studies
Bolling AFB, DC 20332 Educational Testing ServicePrinceton, NJ 08541
Dr. Kikumi latsuoka
CERL Dr. Ming-Mei Wang
252 Engineering Research Lindquist CenterLaboratory for Measurement
Urbana, IL 61801 University of iowaIowa City, IA 52242
Dr. Maurice latsuoka
220 Education Bldg Dr. Thomas A. Warm
1310 S. Sixth St. Coast Guard Institute
Champaign, IL 61820 P. 0. Substation 18Oklahoma City, OK 73169
Dr. David [hissen
Department of Psychology Dr. Brian Waters -
University of Kansas Program Manager
Lawrence, KS 66044 Manpower Analysis ProgramHumRRO
Mr. Gary Ihomasson 1100 S. Washington St.
Jniversity of Illinois Alexandria, VA 22314
Educational PsychologyChampaign. IL 61820 Dr. David J. Weiss
N660 Elliott Hall "
Dr. Robert rsutakawa University of Minnesota
Un.iversitv of Missouri /t E. River Road
Department of Statistics Minneapolis, MN 55455
222 Math. Sciences Bldg. =
Columbia, MO 65211 Dr. Ronald A. Weitzman
NPS, Code 54Wz
Dr. Ledyard lucker Monterey, CA 92152-6800
University of Illino is ,
Department ot Psychology Major John Welsh
603 E. Daniel Street Af-HRL/MOAN
Champaign. IL 618-0 Brooks AFB, IX 78223
Dr. Vern W. Urry Dr. Douglas WetzelPersonnel R&D Center Code 12
Office of Personnel Management Navy Personnel R&D Center
1900 E. Street, NW San Diego, CA 92152-6800Washinoton, DC 20415
Dr. Rand R. Wilcox
Dr. David Vale University of' Southern
Assessment Systems Corp. California .
2233 Iniversity Avenue Department of Psychology
Suite 310 Los Angeles, CA 90007 P,
St. Paul, MN 55114 p
Dr. Frank VicinoNavy Personnel R&D Center I
San Diego, CA 92152--6800
1387/10,16 -
Educational Testing Service/Mislevy
German Military Representative Dr. Anthony R. ZaraATTN: Wolfgang Wildegrube National Council of State
Streitkraefteamt Boards of Nursing, Inc.D-5300 Bonn 2 625 North Michigan Ave.
4000 Brandywine Street, NW Suite 1544Washington, DC 20016 Chicago, IL 60611
Dr. Bruce WilliamsDepartment of Educational
PsychologyUniversity of IllinoisUrbana, IL 61801
Dr. Hilda WingNRC GF-176
2101 Constitution AveWashington, DC 20418
'1: Dr. Martin F. WiskoffNavy Personnel R & D CenterSan Diego, CA 92152--6800
Mr. John H. WolfeNavy Personnel R&D CenterSan Diego, CA 92152-6800
Dr. George WongBiostatistics LaboratoryMemor i al Sloan-Kettering
Cancer Center1275 York AvenueNew York, NY 10021
Dr. Wallace Wulfeck, IIINavy Personnel R&D CenterSan Diego, CA 92152-6800
Dr. Kentaro YamamotoComputer-based Education
Research LaboratoryJniversity of IllinoisUrbana, IL 61801
Dr. Wendy YenCTB/McGraw HillDel Monte Research ParkMonterey, CA 93940
Dr. Joseph L. YoungMemory & Cognitive
ProcessesNational Science FoundationWashington, DC 20550

II