Embed Size (px)
Citation preview

ENRICHED MESOCOSM EXPERIMENTS TO STUDY THE
PRODUCTION OF MARINE OIL SNOW IN THE PRESENCE OF BP
SURROGATE OIL AND COREXIT 9500A
A Thesis
by
MAYA ERIN MORALES-MCDEVITT
Submitted to the Office of Graduate and Professional Studies of Texas A&M University
in partial fulfillment of the requirements for the degree of
MASTER OF SCIENCE
Chair of Committee, Anthony H. Knap Co-Chair of Committee, Terry L. Wade Committee Members, Antonietta Quigg Head of Department, Shari Yvon-Lewis
May 2017
Major Subject:Oceanography
Copyright 2017 Maya Erin Morales-McDevitt

ii
ABSTRACT
During the Deepwater Horizon (DWH) oil spill, profuse marine snow with
associated oil, termed marine oil snow (MOS) was observed but quickly
disappeared. This research tested the hypothesis that in water with nutrients and
microbes MOS formed in the presence of oil and oil plus dispersant. Four
mesocosm experiments were undertaken as part of the ADDOMEx Consortium.
Water was collected from near-shore (mesocosom 1, 2 and 4) or off-shore
(mesocosm 3) in the Gulf of Mexico. Oil (Macondo surrogate oil) and oil plus
dispersant (using Corexit 9500) mixtures known as water accommodated
fraction (WAF), chemically enhanced water accommodated fraction (CEWAF)
were generated in specially designed 170 L baffled recirculation tanks. WAF and
CEWAF were then transferred to 106 L mesocosm tanks for the experiment as
well as mesocosm control tanks (sea water only) and 10 times diluted CEWAF
(DCEWAF) mesocosm tanks. Concentrated phytoplankton were added to
mesocosm experiment 1 and 2. Nutrients were added to mesocosum 3 and 4.
Estimated oil equivalents (EOE), Total petroleum hydrocarbons (TPH), including
n-alkanes and pristine and phytane, NO3-, NO2-, NH4 and HPO4 concentrations
of mesocosms were measured over time. Exopolyomeric substances formed
within 24 hrs in all treatments including the controls. EOE concentrations
decreased at similar rates in all treatments. Oil components were removed by
iii
formation and then sedimentation of MOS. Preferential removal of normal
alkanes compared to branched alkanes (isoprenoid hydrocarbons) show that
biodegradation was also occurring. Study results document that concentrations
decreased partially due to sedimentation and biodegradation, although other
weathering processes such as evaporation and photo-oxidation may also be
responsible for the decrease in hydrocarbons in the mesocosms oil. Correlation
between decrease in concentrations of EOE and nutrients indicate growth of
microbes is important to MOS formation. The use of mesocosm studies provide
a useful tool in understanding the mechanisms of MOS formation and transfer of
oil from the water column to sediments.

iv
DEDICATION
A mi padre,
Mi alma, mi fortuna
“To my father,
My soul, my fortune”

v
ACKNOWLEDGEMENTS
I want to thank my committee co-chairs, Drs. Anthony H. Knap, Terry L.
Wade, and my committee member, Dr. Antonietta Quigg for their constant
guidance and support throughout the course of this research at Texas A&M
University. Thanks also to all the ADDOMEx members. It took a village to make
this happen.
Special thanks to Stephen Sweet, Piers Chapman, Stephen DiMarco,
José Sericano, Gerardo Gold-Bouchot and Jason Sylvan. I would not have been
able to make it without your advice. Thanks to Kusumica Mitra for her help in the
laboratory work. To my Oceanography family, thank you for being there for me.
Thanks to Thomas Lumpkin for his unconditional love and support. Finally,
I thank my mother, Katharine McDevitt for being my eternal source of inspiration.

vi
CONTRIBUTORS AND FUNDING SOURCES
Contributors
This work was supported by my committee co-chairs, Drs. Anthony H.
Knap, Terry L. Wade, and my committee member, Dr. Antonietta Quigg.
Instrumental analysis was done in assistance of Stephen Sweet, Piers Chapman,
and Kusumica Mitra. Collaborations were done by Stephen DiMarco, José
Sericano, Gerardo Gold-Bouchot and Jason Sylvan.
All other work conducted for the thesis was completed by the student
independently.
Funding Sources
This research was made possible by a grant from The Gulf of Mexico
Research Initiative to support consortium research entitled ADDOMEx
(Aggregation and Degradation of Dispersants and Oil by Microbial Exopolymers)
Consortium. Data is publicly available through the Gulf of Mexico Research
Initiative Information and Data Cooperative (GRIIDC) at
http://data.gulfresearchinitative.org (doi:10.7266/N7XG9P60,
doi:10.7266/N7FF3QCP, doi:10.7266/N72805NC)

vii
NOMENCLATURE
ADDOMEx: Aggregation and Degradation of Dispersants and Oil by Microbial
Exopolymers
BRT: Baffled Recirculation Tanks
CDOM: Dissolved Organic Matter
CEWAF: Chemically Enhanced Water Accommodated oil Fraction
CRM: Certified Reference Material
CROSERF: Chemical Response to Oil Spills Ecological Effects Research Forum
DCEWAF: Diluted Chemically Enhanced Water Accommodated oil Fraction
DCM: dichloromethane
DO: Dissolved Oxygen
DWH: Deepwater Horizon
EOE: Estimated Oil Equivalent
EPS: ExoPolymeric Substances
FGB: Flower Garden Bank
FLH: Fluorescent Line Height
GC/FID: Gas chromatography/Flame Ionization Detector
GERG: Geochemical and Environmental Research Group
HPO4: Phosphate
LMWH: Low Molecular Weight Hydrocarbons

viii
M1: Mesocosm 1
M2: Mesocosm 2
M3: Mesocosm 3
M4: Mesocosm 4
MC252: Macondo oil
MOS: Marine Oil Snow
Mt: Megatons
N: Nitrogen
NE: North East
NGOM: North Gulf of Mexico
NOAA: National Oceanic and Atmospheric Administration
NO3-: nitrate
NO2-: nitrite
NH4: ammonia
P: Phosphorous
PAH: Polycyclic Aromatic Hydrocarbons
ppm: parts per million
RCM: total resolved mixtures
rpm: revolutions per minute
SOP: Standard Operating Procedures
T: Time
TEP Transparent ExoPolymeric substances
ix
TIN: Total Inorganic Nitrogen
TIP: Total Inorganic Phosphorous
UCM: Unresolved Complex Mixtures
WAF: Water Accommodated oil Fraction
TPH: total petroleum hydrocarbons
QC: Quality Control

x
TABLE OF CONTENTS
Page
ABSTRACT .......................................................................................................... ii
DEDICATION ...................................................................................................... iv
ACKNOWLEDGEMENTS .................................................................................... v
CONTRIBUTORS AND FUNDING SOURCES .................................................. vi
NOMENCLATURE ............................................................................................. vii
LIST OF FIGURES ............................................................................................. xii
LIST OF TABLES .............................................................................................. xiv
INTRODUCTION ................................................................................................ 1
LITERATURE REVIEW ...................................................................................... 6
Marine Snow .................................................................................................... 6 Transparent Exopolymeric Particles ................................................................ 8 Bacteria, Marine Snow, and Degradation of Oil ............................................. 10
QUESTIONS AND ASSOCIATED HYPOTHESIS ........................................... 14
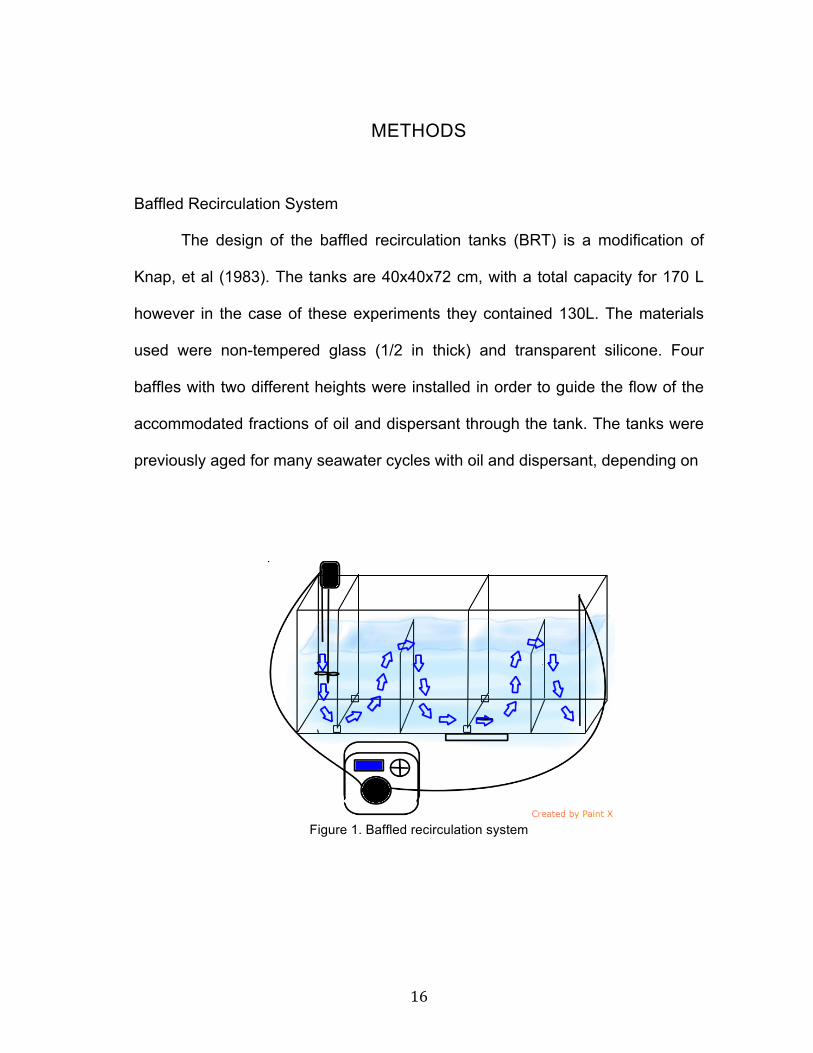
METHODS ........................................................................................................ 16
Baffled Recirculation System ......................................................................... 16 WAF and CEWAF Generation ....................................................................... 17 Sample Collection .......................................................................................... 19 Mesocosm Experiments ................................................................................. 20 Estimated Oil Equivalents .............................................................................. 21 Alkane Analysis .............................................................................................. 22 Dissolved Nutrients ........................................................................................ 23

xi
RESULTS AND DISCUSSION ......................................................................... 25
Transparent Exopolymeric Substances ......................................................... 25 Estimated Oil Equivalent ................................................................................ 25 Alkanes .......................................................................................................... 30 Nutrients ......................................................................................................... 48
Dissolved inorganic nitrogen ...................................................................... 48 Total inorganic phosphorous ...................................................................... 50 N:P ratio ...................................................................................................... 51 Oil correlations with DIN and phosphate .................................................... 53 Nitrate, nitrite and ammonia ....................................................................... 56
CONCLUSIONS ................................................................................................ 61
REFERENCES .................................................................................................. 63

xii
LIST OF FIGURES
Page
Figure 1. Baffled recirculation system ................................................................ 16 Figure 2. Modified Map of TABS buoys. Sample sites of mesocosm 2, 3
and 4 are marked in red box. M2: mesocosm 2; M3: mesocosm 3; M4: mesocosm 4 (Credit: GERG) .................................................................. 20
Figure 3. Estimated Oil Equivalence (EOE) of the averaged triplicated of
water accommodated fraction (WAF), diluted-chemically-enhanced- water-accomodated-fraction (DCEWAF) and chemically-enhanced- water-accomodated-fraction (CEWAF) of mesocosm 2, 3 and 4. ........... 27
Figure 4. Macondo surrogate oil abundance ..................................................... 30 Figure 5. N-alkane abundances of the Control, WAF, DCEWAF and CEWAF
treatments of mesocosm 3. Error bars refer to the standard deviation between triplicates .................................................................................. 32
Figure 6. N-alkane abundances of the Control, WAF, DCEWAF and CEWAF
treatments of mesocosm 4. Error bars refer to the standard deviation between triplicates .................................................................................. 34
Figure 7. N-alkanes of control, WAF, DCEWAF and CEWAF of mesocosm 3
normalized to their respective total petroleum hydrocarbon (TPH) concentration .......................................................................................... 37
Figure 8. N-alkanes of control, WAF, DCEWAF and CEWAF of mesocosm 4
normalized to their respective total petroleum hydrocarbons (TPH) concentration .......................................................................................... 39
Figure 9. Dissolved inorganic nitrogen (DIN) of the averaged triplicates of water –accommodated-fraction (WAF), diluted-chemically-enhanced-
water-accommodated-fraction (DCEWAF) and chemically-enhanced-water-accommodated-fraction (CEWAF) of mesocosm 2, 3 and 4 ......... 49
Figure 10. Phosphate concentration in CEWAF treatments of mesocosm 3 and 4. Concentration is given in uM. ....................................................... 52

xiii
Figure 11. N:P ratios over time of control, WAF, DCEWAF and CEWAF from mesocosm 2 ............................................................................................ 53
Figure 12. Estimated oil equivalent (EOE) and dissolved inorganic nitrogen (DIN) correlations of control, WAF, DCEWAF and CEWAF from
mesocosm 2, 3 and 4. ............................................................................. 54 Figure 13. Estimated oil equivalent (EOE) and phosphate correlations of control, WAF, DCEWAF and CEWAF from mesocosm 2, 3 and 4. ........ 55 Figure 14. Nitrate, nitrite and ammonia concentration of chemically-enhanced-
water-accommodated-fraction (CEWAF) of mesocosm 3 and 4 over time. Concentration is given in uM. ......................................................... 59

xiv
LIST OF TABLES
Page
Table 1. Estimated oil equivalent (EOE) measurements over time of WAF, DCEWAF and CEWAF of mesocosm 2, 3 and 4. ................................... 26
Table 2. EOE percent change per hour in WAF, DCEWAF and CEWAF
treatments of M2, M3 and M4 ................................................................. 28 Table 3. n-C17/Pristane ratios of WAF, DCEWAF and CEWAS of
mesocosm 3 and 4 .................................................................................. 41 Table 4. Pristane/Phytane ratio of WAF, DCEWAF and CEWAF of
mesocosm 3 and 4 .................................................................................. 44 Table 5. Chemical composition of the oil and oil/dispersant in WAF,
DCEWAF and CEWAF of mesocosm 3. ................................................. 46 Table 6. Chemical composition of the oil and oil/dispersant in WAF,
DCEWAF and CEWAF of mesocosm 4 .................................................. 47 Table 7. Rate of change per hpur of DIN concentrations in control, WAF,
DCEWAF and CEWAF treatments. ........................................................ 50 Table 8. Rate of change per hour of PO4
3- concentrations in control, WAF, DCEWAF and CEWAF treatments ......................................................... 51
Table 9. Percent of change per hour of NO3-, NO2- and NH4 in control, WAF,
DCEWAF and CEWAF of mesocosm 2, 3 and 4 .................................... 57

1
INTRODUCTION
On April 20, 2010, in the northern Gulf of Mexico, the deep-sea
petroleum-drilling rig Deepwater Horizon (DwH), owned by British Petroleum
(BP), exploded, and released over the next 87 days, an estimated 3.19 (by a
court decree) to 4.1 million barrels of Sweet Louisiana Crude Oil and 205,000 Mt
of methane into the water column at a depth of 1500m (Graham et al, 2010;
Harlow et al, 2011; Bælum et al, 2012). Both were expelled from the wellhead
under considerable pressure, which lead to the formation of small oil-droplets
(Socolofsky et al, 2011). Additionally, the depth and high pressure at which the
release occurred, along with factors such as the interaction between oil and gas,
and the solubility of each component, facilitated the formation of a deep-water oil
plume ranging from 900 to 1200 m deep (Camilli et al, 2010; Socolofsky et al,
2011). Some of this oil also reached the seawater surface.
Only about 25% of the spill was successfully removed from the water
using immediate response methods such as pumping, skimming, and burning
(NOAA, 2017). The other 75% was left to settle or disperse and potentially
undergo chemical and/or natural degradation (Graham et al, 2010). It is
important to mention that of all interventions, chemical dispersion is considered
the most effective (Bælum et al, 2012). Hence, 37,500 barrels of COREXIT 9500
and in lesser amounts COREXIT 9527, were sprayed on the surface of the

2
ocean and directly into the wellhead at a depth of 1500 m (Bælum et al, 2012).
However, little is known about the effects and persistence of this dispersant/oil
mixture and the polycyclic aromatic hydrocarbon (PAH) fraction of oil on the
marine environment (Diercks et al, 2010; Bælum, 2012). Shortly after the DwH
oil spill, profuse flocs of mucus-abundant marine snow with oil droplet inclusions
were observed floating on the surface of the impacted region (Passow, 2014).
The mucus associated within the marine snow is defined as transparent
exopolymeric substances (TEP), and is produced by microbes (Passow, et al,
2012). Less than a month after the event, the marine snow had disappeared
from the surface water (Passow, et al, 2012; Ziervogel, et al, 2014). This led to
the hypothesis that the marine snow was formed in situ in the presence of oil,
and eventually sunk into deeper waters (Passow, et al, 2012). If this is the case,
this phenomenon could be an important contributor to the removal by
sedimentation and degradation of oil.
Considering that marine snow is largely of biological origin, it is possible
that a profuse marine snow formation near the spill site was due to a microbial
bloom. Throughout the summer during the DwH oil spill, large volumes of
nutrient rich fresh water from the Mississippi River were transported into the
Northern Gulf of Mexico (Hu et al, 2011; Walsh et al, 2015). During this time,
strong northeasterly winds caused this river plume to reach the area of the spill.
Hu et al (2011) used MODIS satellite observations from July 2002 to January

3
2011 to determine if there had been a significant change in surface
phytoplankton biomass in the north eastern Gulf of Mexico before and after the
DwH spill. Due to the interference of colored dissolved organic matter (CDOM)
with the chlorophyll algorithm measurements, they used fluorescence line height
(FLH) as a proxy for phytoplankton biomass over a period of nine years (2002-
2011). They compared the patch FLH values from April 22nd to September 30th
of 2010 with previous years in order to see if the norther Gulf of Mexico had
become “greener” after the DwH spill. They discovered that in early August of
2010 there was a large and continuous patch of approximately 11,100 km2 of a
significant positive anomaly which disappeared by early September of the same
year. Hence, they concluded that at that time there was a phytoplankton bloom,
which started in early August and disappeared by early September. Based on
Government reports, there was no visible surface oil after August 3rd, 2010
(Wade et al, 2011). Therefore, an increase in the sunlight penetration due the
disappearance of the surface oil after this date could have triggered the reported
phytoplankton bloom that may have been unrelated to the DWH oil spill.
It is well known that for mid latitudes, surface open-ocean waters usually
have low nutrients due to the strong thermocline, and therefore plankton
populations remain low. During wintertime however, surface water temperature
decreases, weakening the thermocline and allowing nutrient rich deep-water to
rise to the surface. With temperatures rising and sun incidence increasing
4
throughout the spring, phytoplankton communities will bloom and rapidly
consume the nutrients that had been previously upwelled. Zooplankton will
follow the phytoplankton bloom and graze on it. This last factor plus the
depletion of nutrients by the strengthening of the thermocline will make the
phytoplankton population crash by the end of the spring. However, the seasonal
northeasterly wind patterns in Gulf of Mexico from March to mid-June (Hetland &
DiMarco, 2008; Fennel et al, 2011), are likely to have deflected the nutrient rich
Mississippi flow east towards area of the spill. It has been suggested that the
nutrients introduced by the Mississippi River may have led to enhanced
productivity (Hu et al, 2011) and potentially to increased TEP formation (Quigg
et al, 2016; Passow & Ziergovel, 2016) and consequently, produced enough
marine snow to remove a portion of the DWH surface oil (Passow et al, 2012).
Hence, it is imperative to understand the pathways by which oil was weathered
(Overton et.al 2016) during the spill. Therefore, the Gulf of Mexico Research
Initiative (GOMRI) funded the Aggregation and Degradation of Oil and
Dispersants by Microbial Exopolymers (ADDOMEx) consortium as an effort to
understand the role of TEP in the aggregation (sedimentation) and degradation
of oil. The ADDOMEx consortium has put in place a series of experiments that
will potentially explain how the production of TEP by specific phytoplankton and
bacteria in the presence of hydrocarbons will simultaneously protect these
organisms and contribute to the degradation of oil.

5
The objective of this consortium is to establish a mechanistic
understanding for the interactions of the Macondo surrogate oil and Macondo
surrogate oil/dispersant (COREXIT 9500) with TEP under various environmental
conditions. It hypothesizes that bacteria and phytoplankton respond to oil and
COREXIT 9500 by producing exopolymeric substances, which interact with
minerals, organic particles and organisms; and consequently influence the fate,
distribution and potential effects of these hydrocarbon. In addition, it proposes
that in the presence of oil and/or COREXIT 9500, some members of the
microbial community will break down hydrocarbons as a means of obtaining their
source of carbon and energy.
This research hypothesizes that the addition of nutrient rich water in WAF
and CEWAF could influence microbial activities that lead to the formation of
MOS in the surface water. It proposes that some of the surface oil was removed
by sedimentation of MOS. In addition the TEP/oil/microbe association enhanced
biodegradation of the oil. The ADDOMEx consortium undertook a series of
experiments with the objective of explaining the process of TEP formation
leading to the sedimentation and degradation of oil.

6
LITERATURE REVIEW
Marine Snow
In order to understand the bacterial degradation of oil, it is important to
define marine snow, its components, and its role in the marine environment. In
1941, Rachel Carson described in her book titled “Under the Sea”, the presence
of negatively buoyant particles in the ocean as “stupendous snowfall”. However,
it was not until 1953 that Suzuki and Kato made a broader description of these
particles and, in honor of Carson, named them marine snow. Marine snow is
composed of all particles, organic and inorganic, larger than 500 µm in diameter,
and as it settles, it is one of the most important mechanisms by which surface
derived materials reach deep water and the ocean floor (Alldredge & Silver, et al,
1988). It is formed when lysed plankton cells are aggregated by bacteria and
detritus suspended in the water (Kato & Suzuki, 1953).
The aggregates forming marine snow serve as microhabitats, which are
usually nutrient rich and have complex microbial assemblages (DeLong, et al.,
1993). These marine aggregates are composed of two major groups: The first
one includes large fecal pellets, zooplanktonic carcasses, and gelatinous
phytoplanktonic sheaths, which aggregate once they start to decay. In this
category, zooplankton is the major component of marine snow. Some
zooplankton groups, such as appendicularians, feed by secreting a sticky

7
gelatinous “house” that can collect phytoplankton, bacteria, and detritus
(Alldredge & Silver, 1988). The second group is smaller in diameter, and
includes phytoplankton, especially diatoms, bacteria, small fecal pellets,
microaggregates, and inorganic particles (Alldredge & Silver, 1988). They are
aggregated by TEP secreted by diatoms and bacteria (DeLong, et al, 1993).
However, the formation process of marine snow occurring during an oil
spill is still not clear. To this date, two hypotheses have prevailed because both
situations have been observed in multiple experiments. The first one includes
the formation of mucus threads that hang from a microbially produced biofilm
associated with the surface oil layer. The mucus is made of extracellular
polymers, and is mainly produced by oil-degrading bacteria (Passow, et al,
2012). These organisms are thought to produce sufficient amounts of
transparent exopolymeric particles (TEP) that will emulsify oil. The latter will
allow them to target easily metabolized, soluble compounds, ergo low molecular
weight hydrocarbons, which they will uptake. The marine snow produced
through this process is extremely sticky and any particle that collides with it will
adhere to it. Hence, it will become a rich substrate that can be continuously
colonized by bacteria, increasing in biomass and dimensions over time (Passow,
et al, 2012; Ziervogel, et al, 2012).

8
The second hypothesis is more physical since it involves a direct
formation due to collision and cohesion of particles. The oil components in this
particular process will be limited to polar, heavy, persistent hydrocarbons such
as asphaltenes and resins (Passow, et al, 2012; Ziervogel, et al, 2012). This is
due to their resistance to biodegradation and weathering, which allows them to
accumulate in the system (Passow, et al, 2012). Asphaltenes and resins
generate a stable emulsion that serves as a coagulation core, and this
generates oil aggregates (Ziervogel, et al, 2012). In this case, bacteria will
secrete transparent exopolymeric substances (TEP) as a response to the
presence of these particles, and incorporate the polar hydrocarbons into the
marine snow flocs (Passow, et al, 2012). Despite the significant efforts made by
these authors, much of the relationship of the bacteria with the oil and the
formation of MOS remains uncertain. These hypotheses have not been tested in
a biogeochemical study targeting the fate of single hydrocarbon compounds.
Transparent Exopolymeric Particles
Transparent exopolymeric particless (TEP) are highly sticky, large gels (<
500 µm) formed by polysaccharides (Passow, 2002). They are formed in surface
waters, especially during phytoplankton blooms, and particularly by diatoms
(Passow, et al, 1994), and bacteria (DeLong, et al, 1993). This process can
occur either naturally during their growth cycle and lysis (Alldredge, et al, 1993;
Passow, et al, 1994), under high nutrient concentrations or under stressful

9
conditions such as light deficiency (DeLong, et al, 1993). On a broader scope,
the existence of TEP has an important impact in the dynamics of marine snow
as a whole. TEP may be used as a food source by grazing zooplankton species,
and they can also serve as a substrate and attachment surface for diatoms and
bacteria (Passow, et al, 2012).
Experiments done by Passow, et al (1994) compared the number of
diatom and bacterial cells associated with TEP, versus free-living cells. In both
cases, the percentage of cells associated with TEP was low before the
communities bloomed. This is due to the fact that at the start of the experiment
(before bloom), cell numbers were too low to produce a significant amount of
TEP. Once the cell numbers started increasing, TEP were secreted, and a
higher percentage of both diatoms and bacteria were found attached to the
exopolymer compared to free-living cells. The maximum number of cells
associated with TEP for the two groups was reached in their late bloom, and by
the time their population crashed, most cells were attached to the TEP. In the
control treatment for this experiment neither the diatoms nor the bacteria
bloomed, and hence there was not sufficient TEP to serve as attachment
surface. The researchers demonstrated that microbes attached to TEP will
increase in number and succeed better than free-living organisms. Some
reasons may be that residence on the substrate increases their feeding
efficiency and protection from predators (Alldredge, et al, 1993).

10
Furthermore, as diatoms and bacteria increase in cell number, and
subsequently secrete more TEP, the smaller aggregates will tend to coagulate,
increasing in diameter (Alldredge, et al, 1993). In 2010, Passow, et al (2012)
took MOS samples from the DWH site and measured their size and sinking
velocity under a dissecting scope and in a settling column. The excess density of
each marine snow particle was calculated from its sinking velocity and its
equivalent spherical diameter. There seemed to be a close relationship between
the diameter size of the aggregates and their sinking velocity. This indicates that
there was not only an increase in size, but also an increase in density, which
was most likely due to the incrusted oil droplets and the biodegradation
processes that occurred within the aggregates (Passow, et al, 2012).
Bacteria, Marine Snow, and Degradation of Oil
Oil seeps occur naturally on the ocean’s floor. For millions of years, an
estimated 600,000 tons year-1 of oil has entered the ocean from subseafloor
seeps (Prince, 2005). Specific annual rates for the Gulf of Mexico suggest that at
least 20,000 m3 yr-1 of oil spilled into this basin come from natural seeps
(Macdonald et al, 1993). Therefore, many microorganisms, such as bacteria
have evolved to obtain their carbon and energy from this source. In 2005, more
than 75 genera belonging to the domain Bacteria had been described to be able
to grow on petroleum (Prince, 2005). Several authors have demonstrated an

11
increase in bacterial and diatom density in the presence of oil (Bælum, et al,
2012; Jung, et al, 2010; Passow, et al, 2014). In the latter experiments there was
a decrease in oil concentration with time resulting from the combination of
mixing, dispersion, and biodegradation by microbes, such as indigenous
bacteria residing in the water column (Figure 4) (Lu, et al, 2012). To some extent,
microbes’ energy metabolism may be enhanced as a result of oil degradation
and/or using the oil as a carbon substrate (Bælum, et al, 2012; Jung, et al, 2010),
which will thus induce changes in the microbial community (Acosta-González, et
al, 2013). In 2010, Bælum, et al (2012), isolated a strain of Colwelliaceae to
determine its capacity for oil degradation. They incubated it in an oil and
dispersant dilution, then transferred it to Marine Broth agar plates, and finally
placed it in a liquid medium containing 100 ppm of MC252 oil and 60 ppm
COREXIT. After 10 days of incubation, the bacteria had degraded approximately
75% of the oil. This demonstrates the potential importance of bacteria in the
degradation of oil.
Around 75 known marine and land bacteria genera, including
Cyanobacteria, Proteobacteria, and others, are capable of growing and feeding
on and as a result, degrading hydrocarbons. However, only a few of them have
been proven capable of using oil as their sole source of nutrition and energy
(Prince, 2005). The bacterial bloom that follows a spill is quickly limited by the
shortage of other essential nutrients such as nitrogen, phosphorous, or iron, and
12
other physiochemical necessities such as dissolved oxygen, which when
deficient may generate anaerobic conditions (Magot, 2005; Prince, 2005). The
reason for this is that crude oils and refined fuels are relatively uncommon
substrates that supply extremely high concentrations of carbon, but none of the
other essential nutrients. Therefore, in the event of an oil spill, where the oil
covers a large portion of the surface water, biodegradation will usually be limited
by the shortage of these nutrients (Prince, 2005). Hence, the planktonic bloom
and following formation of marine snow during the DwH spill was unexpected.
The relatively high availability of vital nutrients such as N and P followed by an
over-abundance of an oil C-source, could likely be the sequence creating such a
dramatic microbial bloom in the vicinity of the DwH spill which then led to the
profuse formation of marine snow. Following the addition of chemical
dispersants such as COREXIT, an oil slick can be broken into small droplets to
increase the dilution of the hydrophobic fraction of oil, and make the ambient
concentrations of nitrogen and phosphorous sufficient to allow effective
biodegradation (Prince, 2005).
Even though the natural and anthropogenic input of crude oil into the sea
is substantial, its components are dispersed throughout the water column
(MacDonald et al, 1993). Hence, excepting the immediate waters to the oil
seeps and spills, the hydrocarbon concentrations in the oceans are quite low.
Oil-degrading bacteria are adapted to this pattern (Prince, 2005), and have
13
extremely low abundances in marine environments (Harayama, et al, 2004;
Prince, 2005). Microbial oil degraders are widespread, but they will only be
quantitatively dominant in regions where there is a large input of oil (Prince,
2005). Therefore, an oil spill of whatever magnitude may stimulate the growth –
up to a 1000 fold increase - of oil degrading organisms, and cause changes in
the structure of microbial communities in the contaminated area (Harayama, et
al, 2004; Prince, et al, 2005; Jung, et al, 2010).
Not only did the DwH release a large amount of oil into the ocean, it also
released substantial amounts of methane. Therefore, the microbial populations
in the contaminated water quickly shifted to both a methanotrophes and oil-
degrader dominated community. Also, the temperature differences between the
surface waters (~20˚C), and deep waters (~4˚C) had a direct effect on the
bioavailability of oil and microbial physiology, which thus modifies microbial
composition and density (Redmond & Valentine, 2012).

14
QUESTIONS AND ASSOCIATED HYPOTHESIS
One of the ADDOMEx hypotheses suggests that bacteria and
phytoplankton respond to oil and COREXIT 9500 by producing exopolymeric
substances, which interact with the oil, minerals, organic particles, and
organisms; and consequently affect the fate, distribution and potential impacts of
the oil. Additionally, it proposes that in the presence of oil and/or COREXIT 9500,
the microbial community will break down hydrocarbons as a means of obtaining
its source of carbon and energy.
For this thesis research, I hypothesize that the addition nutrient rich water
can promote a microbial bloom in WAF and CEWAF treatments. I propose that
CEWAF can facilitate the adhering of a fraction of oil and its components (n-
alkanes) to TEP, and thus this oil can be removed from the water column by
sedimentation and biodegradation.
In order to test these hypotheses the following questions were addressed
in this research:
1) Is MOS formed in WAF, DECWAF and CEWAF treatments?
2) Does MOS and its associated microbes remove oil from the water column
by biodegradation and/or sedimentation?

15
3) Does the addition of nutrients enhance the formation of MOS?
4) Does the concentration and composition of the oil change over time?
5) Does degradation of aliphatics in treatments with COREXIT differ from
treatments without dispersant?
6) Does the addition of microbes enhance the formation of MOS?
16
METHODS
Baffled Recirculation System
The design of the baffled recirculation tanks (BRT) is a modification of
Knap, et al (1983). The tanks are 40x40x72 cm, with a total capacity for 170 L
however in the case of these experiments they contained 130L. The materials
used were non-tempered glass (1/2 in thick) and transparent silicone. Four
baffles with two different heights were installed in order to guide the flow of the
accommodated fractions of oil and dispersant through the tank. The tanks were
previously aged for many seawater cycles with oil and dispersant, depending on
Figure 1. Baffled recirculation system

17
the purpose of tank, in order to saturate the silicone and prevent absorption of
hydrocarbons or contamination of silicone compounds during the actual
experiments.
A Masterflex PTFE-Diaphragm Pump with Teflon heads and tubing were
used to recirculate the water. The Teflon tubes were connected to two stainless
steel tubes for better stability in the system. The inflow was placed in the first
chamber (left to right), and the outflow in the last (Figure 1). In addition to the
diaphragm pump, mixing was aided with one Thermo Scientific electromagnetic
stirrer and one Arrow 1750 electric stirrer.
WAF and CEWAF Generation
The objective of this part of the experiment was to generate reproducible
amounts of WAF, CEWAF and DCEWAF at a specific concentration that were
later transferred into the mesocosm tanks. The Chemical Response to Oil Spills
Ecological Effects Research Forum (CROSERF) has defined water-
accommodated fraction (WAF) as “a laboratory-prepared medium derived from
low energy (no vortex) mixing of oil, which is essentially free of particles of bulk
material” (Singer, et al, 2000). In most cases the CROSERF method is used to
provide WAF, however our needs were hundreds of liters at a time so we used
the BRT. The oil used in this project was the Macondo surrogate oil from the
Marlin Platform Dorado, which has a similar specific gravity of 0.86 as the

18
Louisiana Sweet Crude Oil spilled during the BP incident in 2010. The
dispersant used was COREXIT 9500A.
Approximately 120 L of the filtered seawater was transferred to each
baffled recirculation tank where the WAF and CEWAF were produced. The BRT
physically dispersed Macondo surrogate oil and dispersant (COREXIT 9500)
with the flow generated by the PTFE-Diaphragm pump that recirculated the
seawater at 250 rpm (or 333 ml min-1); however mesocosm 1 used higher a
higher stirring rate. In addition, the electromagnetic stirring plate (only for
mesocosm 1 and 2) and the electric stirrer, at rates no higher than 200 rpm to
avoid creating a vortex in the water, were used as mixing energy sources. By
using low energy mixing, dispersion and emulsification of the oil was easily
prevented (Singer, et al, 2000).
Under common production procedures, WAF concentrations in laboratory
studies can range from 1 to 20 mg/l (Knap, et al, 1983). When using BRT,
concentrations ranged from 0.2 to 1 mg/L for WAF, 2-8 mg/L in the DCEWAF
and 20 to 80 mg/L in the CEWAF. However, since the specific gravity of the
Macondo surrogate oil is of 0.86, 23 mg/L of the oil were added to the WAF-BRT.
In the case of the CEWAF recirculation tank, a premixed 1:20 (1 mL dispersant:
20 ml oil) dilution was added to its corresponding BRT. The oil is added in

19
excess to the amount of oil required for WAF in the 170L baffled recirculation
tank.
By adding aliquots of oil and dispersant, and measuring the oil
concentration in the WAF, CEWAF and DCEWAF in a Horiba Scientific Aqualog
fluorometer, it was possible to calibrate the addition of oil with its concentration
over time. The oil content of water (or water accommodated fraction of oil) was
measured every three hours for a period of 24 h. For each measurement, five
milliliters of water was extracted from each BRT and diluted in 5ml of
dichloromethane (DCM). Approximately 2 ml of the DCM fraction was
transferred into cuvettes and analyzed for estimated oil equivalent (EOE) by
fluorescence using a Horiba Aqualog spectrofluorometer. Optimum wave-
lengths for EOE were λ: 260 nm and λ: 358.29 nm. After 24 hours it was
assumed that the oil concentration in the water had reached its maximum, and
therefore, the generation process had been completed (Knap et al, 1983).
Sample Collection
During the last week of July and third week of October of 2015, ~1000 L
of seawater from the NOAA National Marine Fisheries Laboratory in Galveston.
For the third experiment, during the second week of July 2016, the Trident
vessel collected ~1500 L of seawater from the coral reef system called “the
Flower Garden National Sanctuary” (27° 53.4180'N; 94° 2.2020'W) which is

20
located ~120 miles off the coast of Galveston (TX). Finally, for the fourth
experiment, the same vessel collected 2000 L of sea water off the coast of
Texas, near the TGLO (Texas General Land Offices) Texas Automated Buoy
System (TABS) buoy R (Figure 2).
Figure 2. Modified Map of TABS buoys. Sample sites of mesocosm 2, 3 and 4 are marked in red box. M2: mesocosm 2; M3: mesocosm 3; M4: mesocosm 4 (Credit: GERG)
Mesocosm Experiments
During the first experiment setup, four 130 L mesocosm tanks were filled
with 81 L of oil only water accommodated fraction (WAF) or oil plus dispersant
fraction (CEWAF and DCEWAF). The first tank used as the control was filled

21
with untreated seawater, the second tank with WAF, the third with DCEWAF,
and the last one with CEWAF. For the second, third, and fourth experiments
each treatment was done in triplicate, having a total of 12 mesocosm tanks. F/20
media nutrients prepared according to the specifications of Guillard and Ryther
(1962) and Guillard (1975) were added at the beginning of mesocosm 3 and 4,
Additionally, artificial light was used to simulate 12 h light/12 h dark periods.
Estimated Oil Equivalents
Before each experiment, a calibration curve was generated using a
Macondo surrogate standard at five different concentrations and run through the
Horiba Scientific Aqualog fluorometer. The fluorometer was used to find the
maximum fluorescence and then the concentrations in the samples to be
analyzed were calculated. Every 24 h five milliliters were taken out of each
treatment and its triplicates, and diluted in 5ml of dichloromethane (DCM).
Approximately 2 ml of the DCM fraction of each experiment were transferred into
cuvettes and analyzed for EOE by fluorescence using a Horiba Aqualog
spectrofluorometer. Optimum wave-lengths for EOE were λ: 260 nm and λ:
358.29 nm. In order to accurately determine the EOE, all samples were
compared to the calibration curve.

22
Alkane Analysis
A Macondo surrogate oil (Marlin oil) standard and samples taken every 24
hours from the control, WAF, DCWAF and CEWAF treatments of mesocosm 3
and 4 were analyzed in a GC/FID. The targeted alkanes were from C10 to C35.
The SOP-0008 was followed in order to quantitate the n-alkanes, pristine,
phytane, total resolved (RCM) and unresolved complex mixtures (UCM), and
total petroleum hydrocarbons (TPH). Samples previously extracted in DCM were
analyzed using a high resolution capillary gas chromatograph with flame
ionization detector (GC/FID). Each sample and QC extract had an adequate
amount of its internal standard. Then the analytical run sequence for the extracts
was entered. A calibration check was run between every ten samples.
The individual sample concentrations were determined with the following
formula:
𝐶 = (!! ! !!" ! !)(!!" ! !" ! !!)
where:
C = Concentration in sample (ng/g)
AS = Area of the peak to be measured
ASU = Area of the surrogate standard (deuterated
n-C20)
CSU = Amount of surrogate standard added to each
extract (ng)

23
RF = Average response factor for an alkane
based on the initial calibration
WS = The original weight of dried sample extracted
(g)
UCM and RCM calculations were made using the average response
factor of all n-alkanes, and the sum of all the unresolved peaks minus all the
surrogate and internal standard peak areas respectively. The TPH concentration
was calculated using the sum of the total UCM and RCM concentrations.
Dissolved Nutrients
In order to conduct a duplicate analysis of each sample, a volume of
30mL was necessary. For the duration of each experiment, 30mL of each
treatment were collected as triplicates and filtered under vacuum with a 45 µm
Milipore filter and kept frozen until its analysis at Geochemical Environmental
Research Group (GERG). All nutrient samples were analyzed with an Astoria
Pacifica Auto-Analyzer. The nutrient analysis followed the GERG ARM-SOP-
0702. Five standards prepared with specific ranges, a NO2-, NO3-, and a
Certified Reference Material (CRM) were run before each sample run. The CRM
was also analyzed between each batch of 12 samples with a blank
determination. To determine the spike recovery percent, a CRM and a replicate
sample were utilized.

24
Peak heights were analyzed and converted into µmol/l concentrations
using the Flow Analyzer Software Package II (FASPACII); which controls,
collects and processes data from six digital channels and one analog channel
simultaneously from the Astoria Pacifica auto-analyzer. Dissolved inorganic
nitrogen was calculated by adding NH4, NO2 and NO3 values. Redfield ratios
were also made for each mesocosm. Comparisons between treatments and
mesocosms were made, as well as correlations to the other measurements
taken.

25
RESULTS AND DISCUSSION
Transparent Exopolymeric Substances
Transparent exopolymeric substances (TEP) formed within 24 hours in all
experiments. The presence of dispersants can lead to an increase in the surface
friction and collision among particles, aiding in the formation MOS (Fu et al
2014). Dispersants are known to compress the diffuse layer between particles
and promote the increased aggregation rates of particles (Hayworth & Clement,
2012). Particularly, COREXIT 9500A, which consists of nonionic and anionic
surfactants, can facilitate the aggregation mechanisms due to the hydrophobic
tails and hydrophilic heads (Hayworth & Clement, 2012). In addition, oil and
dispersants can enhance the formation of bacterial TEP because they serve as
an additional carbon source (Gutierrez et al, 2013). The TEP can also emulsify
oil, increasing the bioavailability of hydrocarbons (McGenity, 2014).
Estimated Oil Equivalent
Estimated oil equivalent (EOE) measurements of the WAF, DCEWAF and
CEWAF of mesocosms 2, 3 and 4 are provided in Table 1. Measurements from
mesocosm 1 were not considered for this analysis as it was a pilot experiment
and the variability exceeded confidence intervals. M2, 3 and 4 had slightly
different initial concentrations. However, the EOE increase with the addition of
oil and oil/dispersant was consistent between the mesocosms (Figure 3).

26
Mesocosm2
M
esocosm3
M
esocosm4
WAF
DC
EWAF
CE
WAF
WAF
DC
EWAF
CE
WAF
WAF
DC
EWAF
CE
WAF
Time
(hr)
mg/L
mg/L
mg/L
mg/L
mg/L
mg/L
mg/L
mg/L
mg/L
00.26(±0.01)2.74(±0.47)41.53
(±3.44)
0.74(±0.52)
6.17(±1.34)39.07
(±0.78)
0.29(±0.03)
8.13(±0.97)81.06
(±20.5)
24
0.09(±0.01)1.59(±0.12)19.45
(±4.11)
0.43(±0.22)
5.65(±0.32)24.20
(±2.80)
0.14(±0.04)
5.40(±0.91)38.77
(±3.56)
48
0.07(±0.03)1.33(±0.09)25.78
(±4.58)
0.30(±0.15)
4.21(±0.61)19.63
(±2.53)
0.09(±0.01)
4.00(±1.04)33.17
(±4.64)
72
0.06(±0.01)1.03(±0.09)17.31
(±5.95)
0.46(±0.51)
3.20(±0.81)12.39
(±1.97)
0.03(±0.01)
1.84(±1.12)19.83
(±1.31)
96
-
-
-
0.07(±0.05)
2.71(±0.16)
8.21(±2.57)
-
--
Tabl
e 1.
Est
imat
ed O
il Eq
uiva
lent
(EO
E) m
easu
rem
ents
with
tim
e of
WA
F, D
CEW
AF
and
CEW
AF
of m
esoc
osm
s 2,
3 a
nd 4
±: s
tand
ard
devi
atio
n; -:
no
data
take
n at
that
tim
e po
int
Tabl
e 1.
Est
imat
ed o
il eq
uiva
lent
(EO
E) m
easu
rem
ents
ove
r tim
e of
WA
F, D
CEW
AF a
nd C
EWA
F of
mes
ocos
m 2
, 3 a
nd 4
.

27
Nonetheless, EOE decreased with time in all treatments and at a similar
rate per hour (Table 2). These rates were calculated from the exponential
equations used to measure the decreasing EOE. The percent change per hour
in all treatments and mesocosms ranged from -0.9 to 3.2%. At the end of the
experiments only 31, 37 and 33% of the oil remained in the WAF, DCEWAF and
CEWAF tanks respectively.
Figure 3. Estimated Oil Equivalence (EOE) of the averaged triplicated of water accommodated fraction (WAF), diluted-chemically-enhanced-water-accomodated-fraction (DCEWAF) and chemically-enhanced-water-accomodated-fraction (CEWAF) of mesocosm 2, 3 and 4.
y = 0.2e-0.02x R² = 0.83
0
0.5
1
1.5
2
0 24 48 72
Con
cent
ratio
n (m
g/L)
y = 2.5e-0.013x R² = 0.94
0
5
10
15
0 24 48 72
Con
cent
ratio
n (m
g/L)
y = 34.82e-0.01x R² = 0.6
0
30
60
90
120
0 24 48 72
Con
cent
ratio
n (m
g/L)
Time (hr)
WA
F
DC
EW
AF
CE
WA
F
M2nonutrients M3nutrientsadded M4nutrientsadded
y = 0.8e-0.02x R² = 0.66
0
0.5
1
1.5
2
0 24 48 72 96
y = 6.51e-0.009x R² = 0.98
0
5
10
15
0 24 48 72 96
y = 38.4e-0.016x R² = 0.99
0
30
60
90
120
0 24 48 72 96 Time (hr)
y = 0.31e-0.032x R² = 0.95
0
0.5
1
1.5
2
0 24 48 72
y = 8.66e-0.02x R² = 0.96
0
5
10
15
0 24 48 72
y = 73.14e-0.018x R² = 0.94
0
30
60
90
120
0 24 48 72 Time (hr)
A
B
C
D G
IF
HE

28
EOE concentrations of the controls in mesocosms 2 and 3 were below
detection limits; however during mesocosm 4, a larger water sample was
extracted and solvent evaporated to provide lower detection limits .The control
triplicates had an average initial concentration of only 0.04 mg/L. This is
reasonable for coastal waters (Wade et al 2016). Measurements for the water-
accommodated-fraction (WAF) in mesocosm 2, 3 and 4 were below 1 mg/L
(Figure 3A, D, G). However, in mesocosm 3 (Figure 3D) the standard deviations
(shown as error bars) of all time points are considerably higher, indicating
elevated variability in the triplicates. Many factors need to be taken into
consideration when preparing WAF, including if filtrations and sterilization will be
needed, as well as the mixing energy and duration (Singer et al 2000). In
addition, previous studies have proven consistent absence of oil droplets,
indicating that those concentrations, even if truly dissolved into solution, were
Table 2. EOE percent change per hour in WAF, DCEWAF and CEWAF treatments of M2, M3 and M4
M2 (%) M3 (%) M4 (%)
WAF -2.0 -2.0 -3.2
DCEWAF -1.3 -0.9 -2.0
CEWAF -1.0 -1.6 -1.8
*Negative values indicate the percent loss per hour

29
highly variable (Sandoval et al, 2017). While other WAF generation procedures,
such as the CROSERF technique,have less variable measurements (Singer et
al 2000), they fail to produce large enough quantities for mesocosm experiments.
The variability in concentration was higher the WAF treatments than in the
DCEWAF and CEWAF but it is important to take into consideration the lesser
concentrations of oil dissolved in the water, which made it easier to
remove/degrade.
All DCEWAF treatments had strong linear relationships with time (R2
>0.90). The starting EOE concentrations ranged from 2.74 to 8.13 mg/L (Figure
3B, E, H). CEWAF concentrations from the three mesocosms ranged from 39.07
to 81.06 mg/L. This was expected because the introduction of chemical
dispersants reduces the surface tension of the oil creating small droplets and
increases the concentration of oil (Singer et al 2000; Wang et al, 2016).
DCEWAF and CEWAF correlations with time in mesocosm 3 and 4 (Figure 3)
had higher R2 compared to mesocosm 2. Also, the rates of change per hour of
mesocosm 3 and 4 (Table 2) were slightly higher than in mesocosm 2. This
suggests that the addition of an external source of nutrients may have
accelerated the degradation of oil (Coulon et al, 2005). The EOE concentration
at time zero in mesocosm 4 was a factor of 2 higher than that of mesocosm 2
and 3. This shows the variability of the process of producing large volumes of
WAF and CEWAF.

30
Alkanes
From the aliphatic fraction, n-alkanes are saturated, straight chain
hydrocarbons with single bonds that can be easily biodegraded. This
biodegradation is done mainly by oxidation of the terminal carbon atom, hence
aerobic conditions are needed (Turner et al, 2014a; Turner et al, 2014b). The
composition and abundance of the Macondo surrogate oil used in these
Figure 4. Macondo surrogate oil abundance
experiments was determined in order to have an established fingerprint for oil
and oil plus dispersant treatments. The DwH oil and its homologue, the
Macondo surrogate oil, have unique qualities. In the first place, as typical light
Louisiana crude oils, they are composed of saturated n-alkanes, polycyclic
0
10000
20000
30000
40000
50000
60000
70000
80000
n-C1
0n-
C11
n-C1
2n-
C13
n-C1
4n-
C15
n-C1
6n-
C17
Prist
ane
n-C1
8Ph
ytan
en-
C19
n-C2
0n-
C21
n-C2
2n-
C23
n-C2
4n-
C25
n-C2
6n-
C27
n-C2
8n-
C29
n-C3
0n-
C31
n-C3
2n-
C33
n-C3
4n-
C35
ng/L
nC17/Pristane: 1.9 nC18/Phytane: 2.6 Pristane/Phytane: 1.6

31
aromatic hydrocarbons (PAH) and alkylated PAH (Liu et al, 2012). Figure 4
shows higher abundances of the shorter chain alkanes, which coincides with the
nature of most light Louisiana crude oils where low molecular weight (LMW)
hydrocarbons (C2-C11) contribute more than 50% of the oil (Liu et al, 2012).
This composition makes this oil subject to rapid weathering such as evaporation,
dissolution, photoxidation and biodegradation (Leahy & Colwell 1990; Ryerson
et al, 2011).
The n-alkane analyses were only done for mesocosm 3 and 4 and only
the n-alkane compounds from nC10 to nC35 were quantitated to understand
their role in biodegradation. In both experiments the n-alkane concentrations
varied significantly within treatments, as expected due to the dispersing effect
COREXIT has on oil. The concentrations in the control treatments of mesocosm
3 remained extremely low and in some cases below the detection limits (<50
ng/L) of the GC/FID. However, the concentrations of the heavier even alkanes,
such as nC24 and nC30, were higher than the rest and increased with time,
even after considering the wide variability within samples (Figure 5A). It is
noteworthy to mention that this pattern did not happen in the oil itself. N-Alkane
profiles with predominant even carbon-number homologs ranging from n-C22 to
n-C30, such as the one in mesocosm 3, have been associated with saline and
carbonate rich environments (Grimalt & Albaiges, 1987; Aghadadashi et al,
2017).

32
Figure 5. N-alkane abundances of the Control, WAF, DCEWAF and CEWAF treatments of mesocosm 3. Error bars refer to the standard deviation between triplicates
In the case of the WAF treatments, the concentrations were also low but
highly variable within the triplicates (Figure 5B), and its fingerprint pattern
matches the Macondo surrogate oil (Figure 4). The n-alkane concentrations
were low due to their hydrophobic nature (Liu et al, 2012). Nevertheless, it was
possible to observe an overall rate of change of 86%. It is possible that the
Cont
rol
CEW
AF
DCEW
AF
WAF
0
1000
2000
3000
4000
5000
ng/L
C0
C24
C48
C72
C96
0
1000
2000
3000
4000
5000
ng/L
O0
O24
O48
O72
0
5000
10000
15000
20000
25000
30000
ng/L
DM0
DM24
DM48
DM72
DM96
0
30000
60000
90000
120000
150000
180000
ng/L
M0
M24
M48
M72
M96
A
B
C
D

33
concentrations of the lower molecular weight group were low even at time zero
because they were already being consumed during the WAF preparation.
The DCEWAF (Figure 5C) and CEWAF (Figure 5D) treatments also
match the Macondo surrogate fingerprint (Figure 4), although they are one and
two orders of magnitude respectively higher than the WAF. The low-molecular
weight (LMW) n-alkanes (<C14) decreased rapidly in the DCEWAF and CEWAF
treatments relative to the Macondo surrogate oil, indicating that processes such
as evaporation and biodegradation took place. It has been previously reported
that a consortium of microorganisms can degrade petroleum components in
aerobic marine environments, preferentially medium-chain n-alkanes (C10-C22)
(Liu et al, 2012). This event was seen more clearly in the DCEWAF treatments
than in the CEWAF. However, due to the higher concentrations of dispersant
(Garr et al, 2014) CEWAF concentrations were orders of magnitude larger and it
may be taking longer for the oil-degrading bacteria to consume them.
The rate of change for DCEWAF was above 95% in contrast with the
CEWAF, which changed only 44%. The latter is not surprising since the
concentrations in the CEWAF treatments were at least twice as high as the
DCEWAF, therefore biodegradation processes took twice as much time.
However, degradation of alkanes is a widespread phenomenon, where diverse
prokaryotic and eukaryotic microorganisms easily obtain carbon and

34
Figure 6. N-alkane abundances of the Control, WAF, DCEWAF and CEWAF treatments of
mesocosm 4. Error bars refer to the standard deviation between triplicates
energy (Wentzel et al, 2007). As reference, it is important to point out the
differences in the degradation patterns of Pristane and Phytane in these two
treatments. These compounds were degraded slowly but at a constant rate in
the CEWAF treatments, which is characteristic of hypoxic environments
(Koopmans et al, 1999). In contrast, in the DCEWAF tanks these two
compounds remained unchanged within experimental variability. This could
0
1000
2000
3000
4000
5000
ng/L
C0
C24
C48
C72
0
1000
2000
3000
4000
ng/L
O0
O24
O48
O72
0
10000
20000
30000
ng/L
DM0
DM24
DM48
DM72
0
100000
200000
300000
400000
500000
ng/L
M0
M24
M48
M72
Cont
rol
CEW
AF
DCEW
AF
WAF
A
D
C
B

35
possibly be a reflection of the lower concentrations of hydrocarbons in the
DCEWAF solution. In this treatment, the bulk of the straight-chained alkanes
was consumed within the first 24 hr, forcing the bacteria to consume the more
complex branched n-alkanes. In the case of the CEWAF, the concentrations
were so high that the preferred straight-chained compounds never were
completely consumed.
The composition of the control (Figure 6A) and WAF (Figure 6B)
treatments from mesocosm 4 differed considerably from mesocosm 3 (Figure 5).
The concentrations from nC10-nC15 were extremely low or below detection
limits. It is possible that these alkanes were consumed during the WAF
preparation. However, neither treatment matches those of the MC252 fingerprint
(Figure 4),and even-number alkanes from group C14-C24 were predominant.
These distributions are typical of coastal oxygenated systems and could point to
a biological origin (Grimalt and Albaiges, 1987). The increase of phytane in both
treatments corroborates this assumption since bacteria can consume the OH
group from phytol, a common compound present in chlorophyll, transforming it
into phytane (Grossi et al, 1998; Rontani & Bonin, 2011).
In the DCEWAF (Figure 6C) treatments of mesocosm 4, the
concentrations of all compounds decreased 95% from their initial concentration.
Coulon et al (2005) reports similar losses and suggests that nutrient fertilization

36
was a key factor in the degradation of oil. The concentrations of the heavy
molecular weight groups were lower than the low molecular weight, which is
expected due to the increasing hydrophobicity with the length of the alkanes. As
a consequence of the hypoxic levels in the treatments (Rontani & Bonin, 2011),
the degradation of the branched alkanes was slower than the straight-chained
alkanes. However, the fact that there was constant degradation of Pristane and
Phytane although slow, speaks of the speed the straight-chained alkanes were
degraded.
The rate of change of the n-alkanes in the CEWAF treatment (Figure 6D)
was 91%. The data contrasts with the results reported by Pi et al (2017), where
after 30 days only 43% of the oil was removed. In the CEWAF, the remaining
alkanes were considerably higher than those in the DCEWAF treatment;
however it is important to take into consideration the larger amounts of
dispersant in this treatment. It then appears necessary to increase the length of
future experiments to measure the further evolution of biodegradation. Similarly
with the DCEWAF treatments, hypoxia could have accelerated the degradation
of the Pristane and Phytane (Rontani & Bonin, 2011).
In order to see which n-alkane group was being degraded first, it is
important to normalize them to a compound resistant to biodegradation.
Historically, hopane has been a widely used compound for this purpose (Prince

37
Figure 7. N-alkanes of control, WAF, DCEWAF and CEWAF of mesocosm 3 normalized to their
respective total petroleum hydrocarbon (TPH) concentration
et al,1994). However, recent research has shown that hopane is in fact subject
to biodegradation. Therefore, n-alkanes in each treatment were normalized to
their respective total petroleum hydrocarbon (TPH) at time zero. The normalized
n-alkanes of the control treatment in mesocosm 3 (Figure 7A) showed a
predominance of the higher molecular weight compounds. In the case of the
WAF treatment (Figure 7B), most alkanes were consumed within 24 hours,
Cont
rol
CEW
AF
DCEW
AF
WAF
051015202530
C0
C24
C48
C72
C96
0
3
6
9
12
O0
O24
O48
O72
OC96
0
3
6
9
12
DM0
DM24
DM48
DM72
DM96
0
3
6
9
12
M0
M24
M48
M72
M96
A
B
C
D

38
except for the branched n-alkanes. The fingerprint of these n-alkanes indicates a
biological origin (Grimalt & Albaiges, 1987) and possibly low doses of the
Macondo surrogate oil used in the experiment. The DCEWAF treatment of
mesocosm 3 (Figure 7C) showed a predominant degradation of n-C10 within 24
hr. On the other hand, the bulk degradation of the n-C11-nC16 and the n-C19-
nC22 groups occurred after 48h. These results are in agreement with those
reported by Coulon et al (2005) who state that the degree of degradation of short
chain n-alkanes, was higher than the ones with longer chains, independently of
the initial level of contamination. It was apparent that the longer, heavier straight-
chain alkanes were consumed after the lighter compounds were depleted.
Pristane and Phytane remained unaltered for the first 24 h and decreased
slightly by hour 72 and 96. There was an unexpected and abrupt decrease of
both branched alkanes by hour 48, the reason for which remains unknown;
however analytical errors should not be discarded. There was preferential
consumption in the CEWAF treatment (Figure 7D) of the shorter n-C10, followed
by the n-C11 to n-C16 group. However, after 48 hours the concentrations of the
latter group changed minimally. Similar results were reported by Pi et al (2017),
which they attribute to toxic effects of COREXIT 9500A on bacterial populations.
Nonetheless, it is likely that since the hydrocarbon concentration was so
elevated, the duration of the experiments was insufficient to observe significant
changes in the n-alkane abundance.

39
Biodegradation rates depend mostly on the composition, weathering and
concentration of oil. However, factors such as temperature, oxygen, and
nutrients also have strong roles in the degradation of oil. A reason for this is that
the initial steps in the catabolism of aliphatic, cyclic and aromatic hydrocarbons
by bacteria involve oxidation (Leahy & Colwell, 1990; Wetzel et al 2007).
Figure 8. N-alkanes of control, WAF, DCEWAF and CEWAF of mesocosm 4 normalized to their
respective total petroleum hydrocarbons (TPH) concentration
Cont
rol
CEW
AF
DCEW
AF
WAF
0
100
200
300
400
C0
C24
C48
C72
0
3
6
9
12
O0
O24
O48
O72
0
3
6
9
12
DM0
DM24
DM48
DM72
0
3
6
9
12
M0
M24
M48
M72
A
B
C
D

40
Experiments measuring bioremediation rates in fertilized experiments
showed a complete removal of the resolved n-alkanes (Roling et al 2002) over
longer timescales, usually ranging from 30 to 90 days (Singh et al, 2014). In
addition, toxic effects on the microbial community from the high concentrations
of COREXIT 9500A (Pi et al, 2017) should not be discarded. Therefore, toxicity
tests should be included in future work.
The normalized values of the control treatment in mesocosm 4 show an
increase in all alkanes by hour 72 (Figure 8A); however this may be due to the
high variability between samples and to their low concentrations of alkanes. The
WAF treatments (Figure 8B) showed a decrease with time of all alkane groups;
yet a preference for any particular n-alkane group is not visible. It is possible that
the absence of surfactants in the mixture impeded the availability of these
compounds for microbial degradation. The bulk consumption of all the straight-
chain n-alkanes in the DCEWAF treatments of mesocosm 4 (Figure 8C)
occurred within the first 24 hours. Both branched alkanes appear to have taken
longer to degrade due to their resistance to microbial feeding (Atlas, 1981; Balba,
et al, 1998). Similar to the CEWAF treatment of mesocosm 3 (Figure 7D), most
straight-chain n-alkanes of mesocosm 4 (Figure 8D) were consumed within 48
hours from the beginning of the experiment. It is likely that microorganisms
present in these treatments took longer than in the DCEWAF to consume these
compounds due to their elevated concentration.

41
The n-C17:Pristane and n-C18:Phytane ratios are well known indicators
of biodegradation and evaporation patterns in a system (Liu et al, 2012; Singh et
al, 2014; Turner et al, 2014). The reason behind this is that both n-C17 and n-
C18 are straight-chain alkanes, while Pristane and Phytane are branched. Most
oil-degrading bacteria prefer using the straight-chain alkanes as their primary
source of C because they are easier to break down (Turner et al, 2014). Hence,
a decreasing rate of any of these ratios indicates biodegradation. The ratio given
for the MC252, depending on the study consulted, ranges between 1.8-2.0
(Wade et al, 2011; Liu et al, 2012; Singh et al, 2014); therefore it was expected
Table 3. n-C17/Pristane ratios of WAF, DCEWAF and CEWAS of mesocosm 3 and 4
Mesocosm 3 Mesocosm 4
Time (hr) WAF DCEWAF CEWAF WAF DCEWAF CEWAF
0 1.0 (±0.2) 1.7 (±0.01) 1.7 (±0.02) 0.6 (±0.1) 1.8 (±0.2) 2.0 (±0.0)
24 0.2 (±0.2) 1.7 (±0.06) 1.7 (±0.01) 3.2 (±1.5) 0.3 (±0.0) 1.0 (±0.2)
48 0.3 (±0.1) 1.6 (±0.05) 1.7 (±0.07) 8.3 (±4.5) 0.3 (±0.1) 1.0 (±0.0)
72 0.3 (±0.08) 1.5 (±0.03) 1.7 (±0.01) 3.4 (±0.0) 0.6 (±0.0) 0.6 (±0.2)
96 0.3 (±0.01) 1.4 (±0.05) 1.7 (±0.01) - -
*± values indicate standard deviations between the triplicates of each treatment.

42
to find a similar ratio in these treatments. The Macondo surrogate chromatogram
(Figure 4) shown in this study matched other fingerprints reported by the
aforementioned studies, and additionally it had a n-C17:Pristane ratio of 1.9.
Analytical mistakes have been discarded; therefore it is safe to conclude that the
Macondo surrogate oil fingerprint reported in this study is accordance with the
other reports.
In the case of the WAF treatments of mesocosm 4 (Table 3), the ratios
were highly variable with time and had elevated standard deviations. It is
important to consider that their total oil concentrations were low or below
detection limits, and the alkane origin could have partially been biological
(Wentzel et al, 2007). After considering the low abundance of n-alkanes in these
treatments, it was not surprising to find such an erratic pattern. On the other
hand, the decreasing ratios of the DCEWAF treatments of mesocosms 3 and 4
were clear evidence of biodegradation (Liu et al, 2012). Their initial ratios were
below the one reported for the Macondo surrogate oil which suggests that during
the accommodated fractions preparation some of the alkanes could have been
biodegraded. The n-C17/Pristane ratio showed a much faster decrease with time
in mesocosm 4 than in mesocosm 4, which could indicate stronger microbial
activity in these experiments.

43
CEWAF treatments of mesocosm 3 and 4 had opposite patterns. CEWAF
in mesocosm 3 presented no apparent changes through time (Table 3). This
apparent lack of change in these ratios may indicate that the loss of the
individual alkanes was happening at a similar rate (Turner et al, 2014b). This
data was in agreement with the TPH-normalized alkane distribution (Figure 7D;
Figure 8D). The latter suggests that high concentrations of COREXIT 9500A and
oil could have inhibited to some extent biological degradation (Pi et al, 2017). A
few other possibilities could explain this event; the first being that the n-alkanes,
due to their hydrophobicity, precipitated out of solution. The second possibility is
that the oil was strongly associated with the marine snow and was being
removed from the water column. A combination or all of these reasons could
have been occurring in the CEWAF treatments. However, little can be proven
due to the difficulty of measuring marine oil snow (MOS). In contrast, CEWAF
ratios in the coastal water experiment (mesocosm 4) show a clear decrease with
time that implies constant biodegradation throughout the experiment (Turner et
al, 2014b) and reflects the different bacterial communities represented in the two
mesocosms.
The TPH-normalized n-alkane distribution suggested that there could
have been some degradation of the branched alkanes. Therefore, a correlation
between Pristane and Phytane was made to determine the veracity of this

44
statement. The degradation of alkanes was expected to result in an increasing
Pr: Ph ratio due to the hypoxic conditions (Koopmans et al, 1999), and the less
Table 4. Pristane/Phytane ratio of WAF, DCEWAF and CEWAF of mesocosm 3 and 4
Mesocosm 3 Mesocosm 4
Time
(hr)
WAF DCEWAF CEWAF WAF DCEWAF CEWAF
0 2.4 (±0.5) 1.7 (±0.01) 1.7 (±0.02) 1.8 (±0.05) 1.6 (±0.08) 1.5 (±0.03)
24 1.6 (±0.2) 1.7 (±0.06) 1.7 (±0.01) 1.4 (±0.16) 1.6 (±0.02) 1.7 (±0.04)
48 1.3 (±0.005) 1.6 (±0.05) 1.7 (±0.07) 0.6 (±0.46) 1.7 (±0.1) 1.8 (±0.05)
72 1.7 (±0.2) 1.5 (±0.03) 1.7 (±0.01) 0.7 (±0.09) 1.4 (±0.5) 1.7 (±0.2)
96 1.6 (±0.2) 1.5 (±0.05) 1.7 (±0.01) - -
*± values indicate standard deviations between the triplicates of each treatment.
recalcitrant nature of LMW compounds, which makes them degrade at a faster
rate than the heavier ones (Turner et al, 2014b). On the other hand, the absence
of change indicates a slow degradation rate (Turner et al, 2014b).
The WAF and DCEWAF treatments (Table 4) of both mesocosms showed
a low decrease of the Pristane to Phytane ratio over time, which indicates that

45
since the straight-chain alkanes were consumed so rapidly, the microbial
community was forced to consume the branched group (Koopmans et al, 1999;
Turner et al, 2014b). The CEWAF treatments remained unchanged, which
agrees with the previous data and indicates slower degradation rates (Turner et
al, 2014b). In addition, the elevated concentration of the straight-chain alkanes
deterred organisms from consuming Pristane or Phytane.
Finally, comparisons between the estimated oil equivalence (EOE), the
total petroleum hydrocarbons (TPH), total resolved, total unresolved complex
mixture (UCM), and total alkanes were made in order to see their concentration
differences (Table 5; Table 6). The gross chemical composition of crude oil
varies greatly; however light crude oils usually contain a large proportion of light
components with nearly half of resolved peaks in which <C16 hydrocarbons
account for about 70% of TPHs (Yang et al, 2015). The total resolved fraction in
both mesocosms and in all treatments accounted for less than 50% of the TPHs,
yet as mentioned before, as a typical light Louisiana crude oil, more than half of
the total resolved peaks were LMW hydrocarbons. Given the fact that aromatics
comprise only 13.3% in weathered light Louisiana crude oil (Wang et al, 2003), it
was surprising to find that EOE values were consistently higher than the rest of
the other oil components at time zero and throughout the length of the
experiments in all treatments. This could indicate a preferential dissolution of
hydrocarbons, meaning that hydrophobic compounds such as the n-alkanes do

46
Table 5. Chemical composition of the oil and oil/dispersant in WAF, DCEWAF and CEWAF of mesocosm 3.
Mesocosm 3
Time
(hr) Treatment
Total
Resolved
(ug/L)
Total
TPH
(ug/L)
Total
UCM
(ug/L)
Total
Alkanes
(ug/L)
EOE
(ug/L)
0 WAF 75 233 158 2 739
24 WAF 17 111 94 4 427
48 WAF 5 62 57 2 301
72 WAF 45 143 97 3 460
96 WAF 16 85 67 0 67
0 DCEWAF 598 2790 2192 14 6170
24 DCEWAF 235 2297 2062 2 5653
48 DCEWAF 33 911 878 2 4213
72 DCEWAF 137 1621 1484 2 3198
96 DCEWAF 87 1320 1233 2 2710
0 CEWAF 2889 9366 6477 358 39067
24 CEWAF 1453 7454 6001 136 24200
48 CEWAF 1535 6268 4733 29 19630
72 CEWAF 1412 6421 5009 25 12386
96 CEWAF 1770 9282 7511 21 8212

47
not tend to dissolve in water (Barron et al, 1999). This proves that in nature the
dissolved fraction of oil is different from oil itself.
Table 6. Chemical composition of the oil and oil/dispersant in WAF, DCEWAF and CEWAF of mesocosm 4
Mesocosm 4
Time
(hr) Treatment
Total
Resolved
(ug/L)
Total
TPH
(ug/L)
Total
UCM
(ug/L)
Total
Alkanes
(ug/L)
EOE
(ug/L)
0 WAF 115 249 134 8 290
24 WAF 40 118 77 5 136
48 WAF 69 366 296 11 92
72 WAF 63 282 219 8 26
0 DCEWAF 721 2250 1529 313 8134
24 DCEWAF 201 1303 1103 35 5403
48 DCEWAF 121 1292 1171 26 4003
72 DCEWAF 95 907 812 17 1843
0 CEWAF 10056 29726 19670 4174 81060
24 CEWAF 4198 15855 11657 1551 38767
48 CEWAF 4124 16688 12563 1456 33167
72 CEWAF 1334 8808 7474 367 19833

48
Nutrients
Availability of inorganic nutrients, particularly nitrogen and phosphorous, has
been proven to be an important factor in the degradation of hydrocarbons in
marine environments (Singh et al 2014). Therefore, an unenhanced (no
additional nutrients added) mesocosm experiment (mesocosm 2) was performed
to contrast the enhanced (nutrient media added) coastal and open ocean
experiments. Unsurprisingly, initial nutrient concentrations of mesocosm 2 were
significantly lower than mesocosms 3 and 4, and the evolution of the
experiments were likewise significantly different because the first had only
ambient constituents, while the other two were spiked with the f/20 media
nutrients.
Dissolved inorganic nitrogen
Dissolved inorganic nitrogen (DIN) is the sum of nitrate, nitrite and
ammonium. The DIN concentrations in the coastal unenriched experiment
(mesocosm 2) were lower than the other two experiments because mesocosm 2
only contained ambient nutrients (Figure 9), yet these concentrations were not
environmentally low. The percent of change per hour was calculated by using
the exponential rate, and they indicate a higher consumption of DIN in
mesocosm 2 than in the other two experiments (Table 7). However it is
important to take into consideration that changes over time in M3 and M4 may

49
Figure 9. Dissolved inorganic nitrogen (DIN) of the averaged triplicates of water –accommodated-fraction (WAF), diluted-chemically-enhanced-water-accommodated-fraction (DCEWAF) and chemically-enhanced-water-accommodated-fraction (CEWAF) of mesocosm 2, 3 and 4
not be as obvious due to their high DIN concentrations. The trend of the DIN to
be increasing with time in the control treatments of mesocosm 3 and 4 (Table 7)
may only be a reflection of the marked standard deviations in the triplicates. In
the open ocean experiment (mesocosm 3) the decrease of DIN was low (Table
7) and it did not appear to have a well-defined linear relationship with time
y = 20.69e-0.018x R² = 0.97
0
20
40
60
0 24 48 72 Con
cent
ratio
n (u
M)
Con
trol
W
AF
D
CE
WA
F
CE
WA
F
y = 15.32e-0.031x R² = 0.72
0
20
40
60
0 24 48 72 Con
cent
ratio
n (u
M)
M2 no nutrients added M3 nutrients added M4 nutrients added
y = 110.32e0.003x R² = 0.53
0 50
100 150 200
0 24 48 72 96
y = 149.52e-0.001x R² = 0.53
0
50
100
150
200
0 24 48 72 96
y = 116.04e-0.001x R² = 0.81
0
50
100
150
200
0 24 48 72 96
y = 106.23e-0.004x R² = 0.66
0
50
100
150
200
0 24 48 72 96 Time (hr)
y = 147.06e-0.018x R² = 0.92
0
50
100
150
200
0 24 48 72 Time (hr)
y = 139.63e0.0008x R² = 0.14
0
50
100
150
200
0 24 48 72
y = 147.68e-9E-04x R² = 0.7
0
50
100
150
200
0 24 48 72
y = 14.36e-0.002x R² = 0.99
0
50
100
150
200
0 24 48 72
A IE
JFB
KGC
D H Ly = 12.34e-0.03x R² = 0.71
0
20
40
60
0 24 48 72 Con
cent
ratio
n (u
M)
Time (hr)
y = 19.34e-0.041x R² = 0.95
0
20
40
60
0 24 48 72
Con
cent
ratio
n (u
M)

50
Table 7. Rate of change per hpur of DIN concentrations in control, WAF, DCEWAF and CEWAF treatments.
Dissolved inorganic nitrogen
M2 (%) M3 (%) M4 (%)
Control -1.8 0.3* 0.08*
WAF -4.1 -0.1 -0.09
DCEWAF -3.1 -0.1 -0.2
CEWAF -4.9 -0.4 -1.8
*Positive values indicate an increase in the DIN concentrations with time
(Figure 9E, F, G, H). The coastal enriched experiment (mesocosm 4) also had a
low decrease of DIN in the control, WAF and DCEWAF (Table 7) treatments.
However, the CEWAF treatment (Table 7) had a percent loss per hour of 1.8%;
therefore by the last time point it lost 73% of its initial concentration.
Total inorganic phosphorous
Phosphate (PO43-) in all treatments of mesocosm 2 remained unchanged
throughout the experiment and at concentrations below 1 uM. Although with
higher concentrations (~10 uM), all treatments in mesocosm 3 and 4 had also an
extremely low rate of change per hour with the exception of the CEWAF
treatments (Table 8). The latter (Figure 10) showed a decrease of almost half

51
their initiaconcentration. This demonstrates the enhancement of PO43- uptake in
oil and dispersant mixtures (Ptanik et al, 2010).
Table 8. Rate of change per hour of PO43- concentrations in control, WAF, DCEWAF and
CEWAF treatments Phosphate
Mesocosm 2 (%) Mesocosm 3 (%) Mesocosm 4 (%)
Control -0.04 -0.003 -0.01
WAF -0.06 -0.02 -0.003
DCEWAF -0.05 -0.1 -0.3
CEWAF -0.02 -0.5 -0.8
N:P ratio
As previously stated, mesocosm 2 was coastal water with only ambient
nutrients. The ratios within each treatment vary significantly because nutrients
were probably beginning to be utilized during the WAF making procedure. Only
the DCEWAF treatment (Figure 11C) had an estimated threshold N:P ratio
similar to the Redfield ratio at time zero. In any case, the N:P ratio decreased
with time in all treatments (Figure 11)., which indicated a N limitation as
frequently found in the Gulf of Mexico during the summer (Fennel et al, 2011;
Quigg et al, 2011).

52
Figure 10. Phosphate concentration in CEWAF treatments of mesocosm 3 and 4. Concentration is given in uM.
In mesocosm 2, WAF (Figure 11B) and CEWAF (Figure 11D) had high
N:P ratios. This could also indicate several events. The first being that the
phytoplankton and bacterial communities could have been different from the
other two tanks and have different N:P requirements (Redfield, 1958; Ptacnik et
al, 2010). Also, there could have been a large scale die off of the phytoplankton
community during transport of the water from the sampling site to the TAMUG
facilities or during WAF preparation, and the subsequent oxidation of this new
organic matter by bacteria that would then form dissolved inorganic nitrate. An
apparently stable 16:1 N:P ratio in mesocosm 3 and 4 was observed for the
WAF and DCEWAF treatments, which indicates these nutrients were never
limited. On the other hand, the N:P ratio of the CEWAF of mesocosm 4
decreased with time, which indicates N limitation.
M3nutrientsadded M4nutrientsadded
CE
WA
F
y = 4.83e-0.005x R² = 0.78
0
3
6
9
12
15
0 24 48 72 96
Time (hr)
y = 10.25e-0.008x R² = 0.90
0
3
6
9
12
15
0 24 48 72
Time (hr)
AB
uM

53
Figure 11. N:P ratios over time of control, WAF, DCEWAF and CEWAF from mesocosm 2
Oil correlations with DIN and phosphate
The correlations between the dissolved inorganic nitrogen (DIN) with the
estimated oil equivalent (EOE) were very high. In mesocosm 2, all treatments
had an R2 value above 0.80 (Figure 12A, B, C), while in mesocosm 3 the highest
correlation was in the WAF treatment (Figure 12D) and its R2 value decreased
with the addition of dispersants. This implies that oil degradation was enhaced
by the addition of nutrients (Singh et al, 2014). In contrast, in mesocosm 4 the
highest correlations were found in the DCEWAF (Figure 12H) and CEWAF
(Figure 12I) treatments. The consumption of ambient nutrients was in agreement

54
with the degradation of oil (Figure 12A, B, C). On the other hand, opposite
trends in the coastal and open-ocean enhanced experiments suggest that both
environments have different microbial communities that react in unique ways to
the presence of oil. In fertilized coastal environments, microbial communities
reacted positively to high concentrations of hydrocarbons and chemical
Figure 12. Estimated oil equivalent (EOE) and dissolved inorganic nitrogen (DIN) correlations of control, WAF, DCEWAF and CEWAF from mesocosm 2, 3 and 4.
y=0.05e0.0825xR²=0.84
0
0.2
0.4
0.6
0.8
1
0 5 10 15 20
y=1.04e0.0517xR²=0.89
0
2
4
6
8
10
0 5 10 15 20
y=20.137e0.0081xR²=0.80641
0
20
40
60
80
100
0 20 40 60 80 100
y=1E-07e0.1055xR²=0.98
0
0.2
0.4
0.6
0.8
1
125 135 145 155
WA
F D
CE
WA
F C
EW
AF
y=0.005e0.0612xR²=0.81
0
2
4
6
8
10
105 108 111 114 117
y = 1.23e0.0269x R² = 0.48
0
20
40
60
80
100
80 90 100 110 120 130
M2 no nutrients M3 nutrients added M4 nutrients added
y=2E-11e0.1571xR²=0.63
0
0.2
0.4
0.6
0.8
1
135 140 145 150 155
y=7E-05e0.0852xR²=0.96
0
2
4
6
8
10
120 125 130 135 140
y = 11.47e0.0138x R² = 0.93
0
20
40
60
80
100
20 60 100 140
EO
E (m
g/L)
E
OE
(mg/
L)
EO
E (m
g/L)
Total N (umol/L) Total N (umol/L) Total N (umol/L)
A D
HEB
C F I
G

55
surfactants. DIN consumption was better correlated to oil degradation in coastal
environments (mesocosm 4) than in open-ocean (mesocosm 3). Within the
coastal experiments, the DCEWAF treatments had the best correlations.
Increased concentrations of dispersants decreased the linear relationship of
EOE with DIN. Perhaps high concentrations of dispersants affect the
consumption of nitrogen.
Figure 13. Estimated oil equivalent (EOE) and phosphate correlations of control, WAF, DCEWAF and CEWAF from mesocosm 2, 3 and 4.
PO43- and EOE had higher linear relationships with the addition of
dispersant (Figure 13). In mesocosm 2, the R2 value in DCEWAF (Figure 13A)
CE
WA
F D
CE
WA
F
M2 no nutrients M3 nutrients added M4 nutrients added
y = 0.01e1.1x R² = 0.84
0
2
4
6
8
5 5.2 5.4 5.6 5.8 6 y = 2.05e0.56x
R² = 0.75
0
10
20
30
40
50
2 3 4 5 6 HPO4 (umol/L)
y = 0.01e0.63x R² = 0.7
0
3
6
9
12
8 9 10 11 y = 4.85e0.26x
R² = 0.93
0
30
60
90
4 6 8 10 12 HPO4 (umol/L)
y = 0.19e2.65x R² = 0.87
0
1
2
3
4
0.6 0.7 0.8 0.9 1
EO
E (m
g/L)
y = 474.75e-4.88x R² = 0.19
0
10
20
30
40
50
0.55 0.6 0.65 0.7
EO
E (m
g/L)
HPO4 (umol/L)
A
F
E
D
C
B

56
was similar to the other two mesocosms. However, in the CEWAF treatment
(Figure 13B) there was no relationship between the EOE and the consumption
of HPO4. In mesocosm 3 (Figure 13C) and 4 (Figure 13E), the R2 values of the
DCEWAF treatments were also statistically. On the other hand, this linear
relationship was even stronger in the CEWAF treatments (Figure 13F, I). Of
these two treatments, the coastal enriched (mesocosm 4) treatment that had the
highest correlations. Phosphate is now a commonly used nutrient in
bioremediation activities because it is thought to stimulate biodegradation of
hydrocarbons (Siciliano et al, 2016). In fact, it has been suggested that most
degradation measurements are phosphate adsorption dependent (Siciliano et al,
2016). Provided that nitrate and oxygen are not exhausted, phosphate has been
proven to have strong stimulating effects on aerobic and denitrifying rates of oil
degradation (Ponsin et al, 2014).
Nitrate, nitrite and ammonia
In order to understand the DIN uptake and the geochemical processes
occurring in the systems, each of its components was analyzed separately. The
primary source of nitrogen, i.e. nitrate, in all treatments of mesocosm 2 was
lower than mesocosms 3 and 4 because they were not enhanced with the f/20
media nutrients. The initial concentration of NO3- in M2 for control, WAF and
DCEWAF was ~17.75 uM (±3.11), however their loss rates differed greatly
between each other (Table 9). On the other hand, CEWAF had an average

57
concentration at time zero of 87.18 uM with a standard deviation that ranged
from 19 to 166 uM. After 24 hours, the nitrate concentration in CEWAF
plummeted to an average concentration of 2.58 uM and stabilized at that range
until the end of the experiment. Nitrate concentrations showed little change in
Table 9. Percent of change per hour of NO3-, NO2- and NH4 in control, WAF, DCEWAF and CEWAF of mesocosm 2, 3 and 4
Mesocosm 2 (%) Mesocosm 3 (%) Mesocosm 4 (%)
C O DM M C O DM M C O DM M
NO3- -2.2 -4.1 -4.6 -6.4 -0.3 -0.1 -0.1 -1.0 -0.08 -0.03 -0.2 -2.5
NO2- NA NA NA NA 0.6 0.4 0.04 5.02 1.2 1.4 0.003 3.1
NH4 0.5 -5.7 0.6 0.02 0.4 -0.1 -0.2 -0.1 NA NA NA NA
C= control, O= WAF, DM= DCEWAF, M= CEWAF. NA= no data or below detection limits.
Negative values refer to loss of concentration per hour.
the control, WAF and DCEWAF triplicates of mesocosms 3 and 4, however the
loss of the nutrient occurred at a faster rate in M3 (Table 9). In the case of the
CEWAF treatments, both M3 and M4 showed a rapid loss of the nutrient with
time (-1% and -2.5% per hour respectively), yet NO3- was never exhausted
(Figure 14). QA/QC values in the three mesocosms passed inspection; therefore

58
instrumental error was discarded and the variability that was presented was
attributed to environmental factors in each tank.
All nitrite (NO2-) concentrations remained below 1 uM, except for the
CEWAF treatments of mesocosms 3 and 4. During mesocosm 3, NO2- increased
at a rate of ~5% per hour, reaching a maximum concentration of 33.03 uM
(Figure 14A). The standard error was not significant at any time point. On the
other hand, in mesocosm 4, nitrite increased at a slightly lower rate (3.1% per
hour); however the concentration in each triplicate varied considerably at every
time point (Figure 14B). Lastly, ammonia (NH4) measurements were taken only
for mesocosm 2 and 3. In all treatments of both mesocosms 2 and 3, except
CEWAF of mesocosm 3, the NH4 concentrations remained below 6 uM and over
all unchanged. The CEWAF treatment had an abnormally high pulse of NH4 at
48 hours in its “C” triplicate tank (72.55 uM) (Figure 14).
In aerobic conditions, the dominant form of nitrogen is nitrate, while nitrite
and ammonia remain low or absent (Francis et al, 2007). This was the overall
case for the control, WAF and DCEWAF in all mesocosms. However in the
CEWAF treatments of mescosms 3 and 4, nitrate decreased rapidly while nitrite
conversely increased. As stated before, hypoxic conditions were reported in the
CEWAF experiments (Kamalanathan, in prep). Theoretically, under redox
conditions there is an initial rapid consumption of oxygen followed by a complete

59
nitrate reduction (Ponsin et al 2014), where the nutrient is transformed into nitrite
(denitrification).
Figure 14. Nitrate, nitrite and ammonia concentration of chemically-enhanced-water-
accommodated-fraction (CEWAF) of mesocosm 3 and 4 over time. Concentration is given in uM.
Facultative heterotrophic bacteria utilize nitrate as a substitute terminal
electron acceptor in oxygen limiting environments and convert it into N2- (Leahy
& Colwell, 1990). Nitrate can also be reduced to ammonia, however can only be
performed by specific organisms. Additionally, oil can inhibit the penetration of
dissolved oxygen, and labile hydrocarbons can stimulate the consumption of
dissolved oxygen by bacteria. The presented experiments were only mixed
during the preparation of the accommodated oil fractions (WAF and CEWAF);
therefore it is likely that with time they became oxygen limited. Since it is mostly
0
40
80
120
160
0 24 48 72 96 Time (hr)
0
40
80
120
160
0 24 48 72 Time (hr)
CEWAF
M4nutrientsaddedM3nutrientsadded
NO3- NH4NO2-
uM

60
heterotrophic bacteria that perform denitrification, it was suggested that this
group of organisms predominated in the CEWAF treatments of mesocosms 3
and 4. However, some authors (Shi & Yu, 2014; Pietroski et al, 2015; Pi et al,
2017) report that dispersants inhibit afore mentioned process.
On the other hand, Ribeiro et al (2016) found that denitrification rates
were stimulated under diverse crude oil treatments. These authors found a 30-
fold increase of nitrite in those treatments enriched with crude oil. It is important
to mention that most of these studies have focused on the impacts of oil and
dispersant in sediments where the geochemical conditions are extremely
different from those in surface water. The basic difference between these two
environments is that oxygen has never been a limiting element in the upper
layers of the water column (Leahy & Colwell, 1990). One study, however, found
an increase in the heterotrophic populations in fresh water experiments enriched
with dispersants (Dutka & Kwan, 1984). The authors did not measure oxygen
and nutrient consumption, but the dominance of heterotrophic populations could
have perhaps been triggered by hypoxic conditions such as the ones thought to
be present in the current experiments. Lastly, the enhancement with high
concentrations of bioavailable nutrients could have caused the CEWAF
treatments to become eutrophic with cascading consequences such as oxygen
deficits (Paerl et al, 1990; Ptanik et al, 2010; Singh et al 2014).

61
CONCLUSIONS
The baffled recirculation system has proven to be an efficient technique
for the generation of large quantities of WAF and CEWAF. The variability seen in
the WAF, DCEWAF and CEWAF treatments was a reflection of the high
hydrophobicity of the oil and the difficulty to generate a stable mixture. However,
a variety of factors could have affected the homogeneity in the mixtures. First, it
is likely that oil droplets were associated with the marine snow (MOS), and could
have contributed to misleading readings. Second, weathering processes such as
sedimentation, evaporation, biodegradation and evaporation could have
occurred at different rates within the triplicates and treatments. Third, the results
presented in this study make it apparent that the coastal and open-ocean
communities are different from each other, and as such the decay of oil and
changes in availability of nutrients occur at different rates. This last statement
could also explain the variability in the nutrient measurements. Similarly,
biodegradation of the n-alkanes by the different bacterial populations may have
been species specific.
Oil decreased with time in all treatments; however, it occurred at a faster
rate in nutrient enhanced water. This underlines the importance of nutrients in
supporting the biology and hence a greater degradation of oil in these
62
mesocosms. . In nutrient enhanced experiments, it was the dispersant
treatments that had the highest rate of loss.
Contrary to other studies (Shi & Yu, 2014; Pietroski et al, 2015; Pi et al,
2017), oil plus COREXIT 9500A appeared to enhance consumption of DIN and
HPO4 in these experiments. It is still unknown why denitrification occurred only
in the CEWAF treatments and this will be investigated further by ADDOMEx. It is
likely that lack of mixing thus leading to low oxygen concentrations played a role.
The results reported in this study suggest that small additions of
dispersant increase the biodegradation rates of the n-alkanes. Coastal water
and open-ocean experiments had different biodegradation rates in the CEWAF
treatments, which implies that their respective microbial communities react
differently to COREXIT 9500A. However, for further studies to corroborate these
results should be undertaken.

63
REFERENCES
Acosta-González, A.; R. Rosselló-Móra, S. Marqués. 2013.
Characterization of the anaerobic microbial community in oil-polluted subtidal
sediments: aromatic biodegradation potential after the Prestige oil spill.
Environmental Microbiology. 15(1): 77-92
Aghadadashi, V.; A. Mehdinia, S. Molaei. 2017. Origin, toxicological and
narcotic potential of sedimentary PAHs and remarkable even/odd n-alkane
predominance in Bushehr Peninsula, the Persian Gulf. Marine Pollution Bulletin.
http://dx.doi.org/10.1016/j.marpolbul2016.10.013
Alldredge, A.; M. Silver. 1988. Characteristics, dynamics and significance
of marine snow. Progress in Oceanography. 20: 41-82
Alldredge, A.; U. Passow, B. Logan. 1993. The abundance and
significance of a class of large, transparent organic particles in the ocean. Deep-
Sea Research 40(6): 1131-1140
Atlas, R. 1981. Microbial degradation of Petroleum hydrocarbons: an
environmental perspective. Microbiological Reviews. 45(1):180-209

64
Bælum, J.; S. Borglin, R. Chakraborty, J. Fortney, R. Lamendella, O.
Mason, M. Auer, M. Zemla, M. Bill, M. Conrad, S. Malfatti, S. Tringe, H. Holman,
T. Hazen, J. Jansson. 2012. Deep-sea bacteria enriched by oil and dispersant
from the Deepwater Horizon spill. Environmental Microbiology. 14 (9): 2405-
2416
Balba, M.; N. Al-Awadhi, R. Al-Daher. 1998. Bioremediation of oil-
contaminated soil: microbiological methods for feasibility assessment and field
evaluation. Journal of Microbiological Methods. http://dx.doi.org/10.1016/S0167-
7012(98)00020-7
Caldwell, M.; R. Garrett, R. Prince, J. Suflita. 1998. Anaerobic
biodegradation of long-chain n-Alkanes under sulfate-reducing conditions.
Environmental Science and Technology. 32(14): 2191-2195
Camilli, R.; C. Reddy, D. Yoerger, B. Van Mooy, M. Jakuba, J. Kinsey, C.
McIntyre, S. Sylva, J. Maloney. 2010. Tracking hydrocarbon plume transport and
biodegradation at Deepwater Horizon. Science. 330: 201-204
Carson, R. 1941. Under the Sea. Simon and Schuster. New York. 316 pp

65
DeLong, E.; D. Franks, A. Alldredge. 1993. Phylogenetic diversity of
aggregate-attached vs. free-living marine bacterial assemblages. Limnological
Oceanography. 38(5): 924-934
Coulon, F.; E. Pelletier, L. Gourhant, D. Delille. 2005. Effects of nutrient
and temperature on degradation of petroleum hydrocarbons in contaminated
sub-Antarctic soil. Chemosphere. doi:10.1016/j.chemosphere.2004.10.007
DeLong, E.; D. Franks, A. Alldredge. 1993. Phylogenetic diversity of
aggregate-attached vs. free-living marine bacterial assemblages. Limnology and
Oceanography. Doi: 10.4319/lo.1993.38.5.0924
Diercks, A.R.; R. C. Highsmith, V.L. Asper, D. Joung, Z. Zhou, L.Guo, A.
M. Shiller, S. B. Joye, A. Teske, N. Guinasso, T. Wade, S. E. Lohrenz. 2010.
Characterization of subsurface polycyclic aromatic hydrocarbons at the
Deepwater Horizon site. Geophysical Research Letters. 37 L20602, doi:
10.1029/2010GL045046
Dugdale, R. 1967. Nutrient limitation in the sea: dynamics, identification,
and significance. Limnology and Oceanography. 12(4): 685-695

66
Dunstan, W.; L. Atkinson, J. Natoli. 1975. Stimulation and inhibition of
phytoplankton growth by low molecular weight hydrocarbons. Marine Biology.
doi: 10.1007/BF00392087
Dutka, B.; K. Kwan. 1984. Study of long term effects of oil and oil-
dispersant mixtures on freshwater microbial populations in man made ponds.
The Science of the Total Environment. 35: 135-148
Eppley, R.; J. Rogers, J. McCarthy. 1969. Half-saturation constants for
uptake of nitrate and ammonium by marine phytoplankton. Limnology and
Oceanography. 14(6):912-920
Fennel, K.; R. Hetland, S. DiMarco. 2011. A coupled physical-biological
model of the Northern Gulf of Mexico shelf: model description, validation and
analysis of phytoplankton variability. Biogeosciences. doi: 10.5194/bg-8-1881-
2011
Francis, C,; M. Beman, M. Kuypers. 2007. New processes and players in
the nitrogen cycle: the microbial ecology of anaerobic and archaeal ammonia.
The ISME Journal. doi: 10.1038/ismej.2007.8
67
Fu, J.; Y. Gong, X. Zhao, S. O’Reilly, D. Zhao. 2014. Effects of oil and
dispersant on formation of marine snow and transport of hydrocarbons.
Environmental Science & Technology. http://dx.doi.org/10.1021/es5042157
Garr, A.; S. Laramore, W. Krebs. 2014. Toxic effects of oil and dispersant
on marine microalgae. Bulletin of Environmental Contamination and Toxicology.
doi: 10.1007/s00128-014-1395-2
Graham, W.; R. Condon, R. Carmichael, I. D’Ambra, H. Patterson, L. Linn,
F. Hernandez Jr. 2010. Oil carbon entered the coastal planktonic food web
during the Deepwater Horizon oil spill. Environmental Research Letters. 5
(045301) doi: 10.1088/1748-9326/5/4/045301
Grimalt, J.; J. Albaiges. 1987. Sources and occurrence of C12-C22 n-
alkane distributions with even carbon-number preference in sedimentary
environments. Geochimica et Cosmochimica Acta. 51: 1379-1384
Grossi, V.; A. Hirschler, D. Raphel, J. Rontani, J. De Leeuw, J. Bertrand.
1998. Biotransformation pathways of phytol in recent anoxic sediments. Organic
Chemistry. http:dx.doi.org/10.1016/S0146-6380(98)00118-1

68
Gutierrez, T.; D. Berry, T. Yang, S. Mishamandani, L. McKay, A. Teske, M.
Aitken. 2013. Role of bacterial exopolysaccharides (EPS) in the fate of the oil
released during the Deepwater Horizon oil spill. PLoS ONE. doi.
10.1371/journal.pone.0067717
Hanaki, K.; C. Wantawin, S. Ohgaki. 1990. Nitrification at low levels of
dissolved oxygen with and without organic loading in a suspended-growth
reactor. Water Research. 24(3): 297-302
Harayama, S.; Y. Kasai, A. Hara. 2004. Microbial communities in oil-
contaminated seawater. Biotechnology. 15: 205-214
Harlow, W.; B. Brantley; R. Harlow. 2011. BP initial image repair
strategies after the Deepwater Horizon spill. Public Relations. 37: 80-83
Hayworth, J.; P. Clement. 2012. Provenance of Corexit-related chemical
constituents found nearshore and inland Gulf coast waters. Marine Pollution
Bulletin. http://dx.doi.org/10.1016/j.marpolbul.2012.06.031
Hetland, R.; S. DiMarco. 2008. How does the character of oxygen
demand control the structure of hypoxia on the Texas-Louisiana continental
shelf? Marine Systems. 70: 49-62

69
Hu, C; R. Weisberg, Y. Liu, L.Zheng, K.Daly, D. English, J. Zhao, G.Vargo.
2011. Did the northeastern Gulf of Mexico become greener after the Deepwater
Horizon oil spill? Geophysical Research Letters. doi:10.1029/2011GL047184
Jung, S.; J. Park, O. Kown, J. Kang, W. Shim, Y. Kim. 2010. Effects of
crude oil on marine microbial communities in short term outdoor microcosms.
The Journal of Microbiology. 48(5): 594-600
Kato, K. ; N. Suzuki. 1953. Studies on suspended materials marine snow
in the sea: Part I. Sources of marine snow. Bulletin of the Faculty of Fisheries
Hokkaido University. 4(2): 132-137
Knap, A.; T. Sleeter, R. Dodge, S. Wryers, H. Frith, S. Smith. 1983. The
effects of oil spills and dispersant use on corals. A review and multidisciplinary
experimental approach. Oil & Petrochemical Pollution. 1(3):157-167
Koo, H.; N. Mojib, R. Thacker, A. Bej. 2014. Comparative analysis of
bacterial community-metagenomics in coastal Gulf of Mexico sediment
microcosms following exposure to Macondo oil (MC252). Antonie van
Leeuwenhoek. doi:10.1007/s10482-014-0268-3

70
Koopmans, M.; I. Rijpstra, M. Klapwijk, J. de Leeuw, M. Lewan, J. Damste.
1999. A thermal and chemical degradation approach to decipher pristine and
phytane precursors in sedimentary organic matter. Organic Geochemistry.
http://dx.doi.org/10.1016/S0146-6380(99)00088-1
Leahy, J.; R. Colwell. 1990. Microbial degradation of hydrocarbons in the
environment. Microbiological Reviews. 54(3):305-315
Liu, Z.; J.Liu, Q. Zhu, W. Wu. 2012. The weathering of oil after the
Deepwater Horizon oil spill: insights from the chemical composition of the oil
from the sea surface, salt marshes and sediments. Environmental Research
Letters. doi:10.1088/1748-9326/7/3/035302
Lu, Z.; Y. Deng, J. Van Nostrand, Z. He, J. Voordeckers, A. Zhou, Y.Lee,
O. Mason, E. Dubinsky, K. Chavarria, L. Tom, J. Fortney, R. Lamendella, J.
Jansson, P. D’haeseleer, T. Hazen, J. Zhou. 2012. Microbial gene functions
enriched in the Deepwater Horizon deep-sea oil plume. International Society for
Microbial Ecology. 6: 451-460
Macdonald, I,; N. Guinasso Jr, S. Acklesin, J. Amos, R. Duckworth, R.
Sassen, J. Brooks. 1993. Natural oil slicks in the Gulf of Mexico visible from
space. Journal of Geophysical Research. doi: 10.1029/93JCO1289

71
Magot, M. 2005. Indigenous microbial communities in oil fields. 21-33 pp.
In: Petroleum Microbiolgy. Editors: Ollivier, B, and M. Magot. American Society
for Microbiology. 365 pp.
McGenity, T. 2014. Hydrocarbon biodegradation in intertidal wetland
sediments. Current Opinion in Biotechnology.
http://dx.doi.org/10/1016/j.copbio.2013.10.010
Paerl, H.; J. Rudek, M. Mallin. 1990. Stimulation of phytoplankton
production in coastal waters by natural rainfall inputs: nutritional and trophic
implications. Marine Biology. 107: 247-254
Passow, U.; A. Alldredge, B. Logan. 1994. The role of particulate
carbohydrate exudates in the flocculation of diatom blooms. Deep-Sea Research.
41(2): 335-357
Passow, U. 2002. Transparent exopolymer particles (TEP) in aquatic
environments. Progress in Oceanography. 55: 287-333
Passow, U.; K. Ziervogel, A. Dierks. 2012. Marine snow formation in the
aftermath of the Deepwater Horizon oil spill in the Gulf of Mexico. Environmental
Research Letters. 7: 035301

72
Passow, U. 2014. Formation of rapidly-sinking, oil-associated marine
snow. Deep-Sea Research II. http://dxdoi.org/10.1016/j.dsr2.2014.10.001
Passow, U.; K. Ziergovel. Marine snow sedimented oil released during the
Deepwater Horizon spill. Oceanography 29(3):118-125
Parsons, T.; W. Li, R. Waters. 1976. Some preliminary observations on
the enhancement of phytoplankton growth by low levels of mineral hydrocarbons.
Hydrobiologia. 51(1): 85-89
Pi, Y.; B. Chen, M. Bao, F. Fan, Q. Cai, L. Ze, B.Zhang. 2017. Microbial
degradation of four crude oil by biosurfactant producing strain Rhosococcus sp.
Bioresource Technology. http://dx.doi.org/10.1016/j.biortech.2017.02.007
Pietroski, J.; J. White, R. DeLaune. 2015. Effects of dispersant used for
oil spill remediation on nitrogen cycling in Louisiana coastal salt marsh soil.
Chemosphere. http://dx.doi.org/10.1016/j.chemosphere.2014.07.050
Ponsin, V.; O. Mouloubou, P. Prudent, P. Hohener. 2014. Does
phosphate enhance the natural attenuation of crude oil in groundwater under
defined redox conditions? Journal of Contaminant Hydrology. http://
dx.doi.org/10.1016/j.jconhyd.2014.04.003
Prince, R.; D. Elmendorf, J. Lute, C. Hsu, C. Haith, J. Senius, G. Dechert,
G. Douglas, E. Butler. 1994. 17[alpha](H),21[beta](H)-Hopane as a conserved

73
internal marker for estimating the biodegradation of crude oil. Environmental
Science and Technology. doi:10.1021/es00050a019
Prince, R. 2005. The microbiology of marine oil spill bioremediation. 317-
335 pp. In: Petroleum Microbiolgy. Editors: Ollivier, B, and M. Magot. American
Society for Microbiology. 365 pp.
Ptanik, R; T. Andersen, T. Tamminen. 2010. Performance of the Redfield
ratio and a family of nutrient limitation Iidicators as thresholds for phytoplankton
N vs. P limitation. Ecosystems. Doi:10.1007/s10021-010-9380-z
Quigg, A., J. Sylvan, A. Gustafson, T. Fisher, R. Oliver, S. Tozzi, J.
Ammerman. 2011. Going west: nutrient limitation of primary production in the
northern Gulf of Mexico and the importance of the Atchafalaya River. Aquatic
Geochemistry. doi. 10.1001/s10498-011-9134-3
Quigg, A.; U. Passow, W.Chin, C. Xu, S. Doyle, L. Bretherton, M.
Kamalanathan, A. Williams, J. Sylvan, Z. Finkel, A. Knap, K. Schwehr, S. Zhang,
L. Sun, T. Wade, W. Obeid, P. Hatcher, P. Santschi. 2016. The role of microbial
exopolymers in determining the fate of oil and chemical dispersants in the ocean.
Limnology and Oceanography Letters. doi: 10.1002/lol2.10030

74
Redfield, A. 1958. The biological control of chemical factors in the
environments. Ambient Science. 46:205-21
Redmond, M.; D. Valentine. 2012. Natural gas and temperature
structured a microbial community response to the Deepwater Horizon oil spill.
PNAS. 109(50): 20292-20297
Ribeiro, H.; A. Mucha, I. Azevedo, P. Salgado, C. Teixeira, M. Almeida, S.
Joye, C. Magalhaes. 2016. Differential effects of crude oil on denitrification and
anammox, and the impact on N2O production. Environmental Pollution.
http://dx.doi.org/10.1016/j.envpol.2016.05.045
Roling, W.; M. Milner, M. Jones, K. Lee, F. Daniel, R. Swannell, I. Head.
2002. Robust hydrocarbon degradation and dynamics of bacterial communities
during nutrient-enhanced oil spill bioremediation. Applied and Environmental
Microbiology. 68(11):5537-5548
Rontani, J.F.; P. Bonin. 2011. Production of pristine and phytane in the
marine environment: role of prokaryotes. Research in Microbiology.
doi:10.1016/j.resmic.2011.01.012

75
Ryerson,T.; K. Aikin, W. Angevine, E. Atlas, D. Blake, C. Brock, F.
Fehsenfeld, R. Gao, J. de Gouw, D. Fahey, J. Holloway, D. Lack, R. Lueb, S.
Meinardi, D. Murphy, J. Neuman, J. Nowak, D. Parrish, J. Peischl, A. Perring,
I.Pollack, A. Ravishankara, J. Roberts, J. Schwars, J. Spackman, H. Stark, C.
Warneke, L. Watts. 2011. Atmospheric emissions from the Deepwater Horizon
spill constrain air-water partitioning, hydrocarbonnfate, and leak rate.
Geophysical Research Letters. doi: 10.1029/2011GL046726
Sandoval, K.; Y. Ding, P. Gardinali. 2017. Characterization and
environmental relevance of oil water preparations of fresh and weathered MC-
252 Macondo oils used in toxicology testing. Science of the Total Environment.
http://dx.doi.org/10.1016/j.scitotenv.2016.09.171
Siciliano, S.; T. Chen, C. Phillips, J. Hamilton, D. Hilger, B. Chartrand, J.
Grosskleg, K. Bradshaw, T. Carlson, D. Peak. 2016. Total phosphate influences
the rate of hydrocarbon degradation but phosphate mineralogy shapes microbial
community composition in cold-region calcareous soils. Environmental Science
and Technology. doi: 10.1021/acs.est.5b05911
Singer, M.; D. Aurand, G. Bragin, J. Clark, G. Coelho, M. Sowby, R.
Tjeerdema. 2000. Standardization of the preparation and quantification of water-

76
accommodated fractions of petroleum for toxicity testing. Marine Pollution
Bulletin. 40(11): 1007-1016
Singh, A.; A. Sherry, N. Gray, M. Jones, B. Bowler, I. Head. 2014. Kinetic
parameters for nutrient enhanced crude oil biodegradation in intertidal marine
sediments. Frontiers in Microbiology. doi: 10.3389/fmicb.2014.00160
Shi, R.; K. Yu. 2014. Impact of exposure of crude oil and dispersant
(COREXIT EC 9500A) on denitrification and organic matter mineralization in a
Louisiana salt marsh sediment. Chemosphere.
http://dx.doi.org/10.1016/j.chemosphere.2014.01.055
Socolofsky, S.; E. Adams, C. Sherwood. 2011. Formation dynamics of
subsurface hydrocarbon intrusions following the Deepwater Horizon blowout.
Geophysical Research Letters. doi: 10.1029/2011GL047174
Turner, E.; E. Overton, B. Meyer, S. Miles, G. McClenachan, L. Hooper-
Bui, A. Engels, E. Swenson, J. Lee, C. Milan, H. Gao. 2014. Distribution and
trajectory of Macondo (Mississippi Canyon 252) oil in Louisiana coastal wetlands.
Marine Pollution Bulletin. http://dx.doi.org/10.1016/j.marpolbul.2014.08.011

77
Turner, E.; E. Overton, B. Meyer, M. Miles, L. Hooper-Bui. 2014. Changes
in the concentration and relative abundances of alkanes and PAHs from the
Deepwater Horizon oil spill of coastal marshes. Marine Pollution Bulletin.
http://dx.doi.org/10.1016/j.marpolbul.2014.07.003
U.S. EPA. 2008. National Coastal Condition Report III. EPA-620/R-03/002.
U.S. Environmental Protection Agency, Office of Research and Development
and Office of Water, Washington, D.C. 300 p. http://epa.gov/nccr/
Wade, T.; S. Sweet, J. Sericano, N. Guinasso, A. Diercks, R. Highsmith,
V. Asper, D. Joung, A. Shiller, S. Lohrenz, S. Joye. 2011. Analyses of water
samples from the Deepwater Horizon oil pill: Documentation of the Subsurface
Plume. Geophysical Monograph Series. doi: 10.1029/2011GM001103
Walsh, J.; J. Lenes, B. Darrow, A. Parks, R. Weisberg, L. Zheng. C. Hu, B.
Barnes, K. Daly, S. Shin, G. Brooks, W. Jeffrey, R. Snyder, D. Hollander. 2015.
A simulation analysis of the plankton fate of the Deepwater Horizon oil spills.
Continental Shelf Research. http://dx.doi.org/10/1016/j.csr.2015.07.002
Wang, Z.; B Hollebone, M. Fingas, B. Fieldhouse, L. Sigouin, M.
Landriault, P. Smith, J. Noonan, G. Thouin. 2003. Characteristics of Spilled oil,

78
fuels and petroleum products: 1. Composition and properties of selected oils.
EPA-600-R03-072
Wang, J.; K. Sandoval, Y. Ding, D. Stoeckel, A. Minard-Smith, G.
Andersen, E. Dubinsky, R. Atlas, P. Gardinali. 2016. Biodegradation of
dispersed Macondo crude oil by indigenous Gulf of Mexico microbial
communities. Science of the Total Environment.
http://dx.doi.org.1016j.scitotenv.2016.03.015
Wentzel, A.; T. Ellingsen, H. Kotlar, S. Zotchev, M. Throne-Holst. 2007.
Bacterial metabolism of long-chain n-alkanes. Applied Microbiology and
Biotechnology. doi:10.1007/s00253-007-1119-1
Widdel, F.; R. Rabus. 2001. Anaerobic degradation of saturated and
aromatic hydrocarbons. Current Opinion in Biotechnology.
http://dx.doi.org/10.1016/S0958-1669(00)00209-3
Yang, C.; Z. Wang, B. Hollebone, C. Brown, Z. Yang, M. Landriault. 2015.
Chromatographic fingerprinting analysis of crude oils and petroleum products.
In: Handbook of Oil Spill Science and Technology. Ed: Fingas, M. 2015. Wiley
692 pp.

79
Ziervogel, K.; L. McKay, B. Rhodes, C. Osburn, J. Dickson-Brown, C.
Arnosti, A. Teske. 2012. Microbial activities and dissolved organic matter
dynamics in oil-contaminated surface seawater from the Deepwater Horizon oil
spill site. PLos ONE. 7(4): e34816. doi:10.1371/journal.pone.0034816
Ziervogel, K.; N. D’souza, J. Sweet, B. Yan, U. Passow. 2014. Natural oil
slicks fuel surface water microbial activities in the northern Gulf of Mexico.
Frontiers in Microbiology. doi: 10.3389/fmicb.2014.00188

![Chemical Engineering Journal · [23] Mesocosm Meat processing wastewater Glyceria maxima TN: 46–49 New Zealand [24] Mesocosm Nutrient solution Canna sp., Calamus sp. TN: 76.94;](https://img.pdfslide.net/doc/110x75/60948f4f85c3c96d7a4daeca/chemical-engineering-journal-23-mesocosm-meat-processing-wastewater-glyceria-maxima.jpg)