Embed Size (px)
Citation preview
Abstract—Major objectives of this study are to evaluation the
enrichment, accumulation, and potential ecological risk of
cadmium (Cd) in the sediments of Jen-Gen River estuary,
Taiwan. Eleven sampling locations were installed near the
mouth of Jen-Gen River to collect sediment samples for
analyzing Cd. Results of laboratory analyses show that contents
of Cd in the sediments are between 0.20 and 4.65 mg/kg with an
average of 1.26±1.23 mg/kg. The spatial distribution of Cd
reveals that the Cd concentration is relatively high in front of
the river mouth. This indicates that upstream industrial and
municipal wastewater discharges along the river bank are
major sources of pollution. Results from the enrichment factor
analysis imply that the sediments can be characterized as minor
to severe degree of Cd enrichment. Results of geo-accumulation
index analysis indicate that the sediments can be characterized
as none to strong degree of Cd accumulation. Results of
potential ecological risk index indicate that the sediments at
Jen-Gen River estuary have high ecological potential risk.
Index Terms—Cadmium, ecological risk, enrichment factor,
geo-accumulation index, sediment.
I. INTRODUCTION
The metals generated by anthropogenic activities cause
more environmental pollution than naturally occurring
metals. After entering a water body, heavy metals will be
carried over to sea so that the river estuary and regions along
seashore become the ultimate resting place for these metals
being transported in the environment. Hence, the river
estuary region, harbor and seashore with dense population
and industries usually become heavily polluted by toxic
metals.
Cadmium (Cd) is extremely toxic to most plants and
animal species [1]; its presence threatens the water ecological
environment. Therefore, much research effort has been
directed toward the distribution of Cd in water environment.
Anthropogenic activities including municipal wastewater
discharges, agriculture, mining, fossil fuels, and discharges
of industrial wastewater are the major source of Cd pollution
[2]. Cadmium has low solubility in aqueous solution; it is
Manuscript received August 31, 2012; revised November 26, 2012.
C. D. Dong, C. F. Chen, and C. W. Chen are with the Department of
Marine Environmental Engineering, National Kaohsiung Marine University, Kaohsiung 81157, Taiwan, R.O. C. (e-mail: [email protected],
[email protected], [email protected]).
M. S. Ko is with the Institute of Mineral Resources Engineering, National
Taipei University of Technology, Taipei 10608, Taiwan, R.O. C. (e-mail:
easily adsorbed on water-borne suspended particles. After a
series of natural processes, the water-borne Cd finally
accumulates in the sediment, and the quantity of Cd
contained in the sediment reflect the degree of pollution for
the water body [3], [4].
Jen-Gen River flows through a southern Taiwan industrial
city (Kaohsiung City). In previous years, the river received
untreated municipal and industrial wastewater discharges
causing serious deterioration of the river water quality and
the environmental quality near the river mouth to threaten the
water environmental ecological system seriously. The
objective of this study is to investigate the Cd distribution in
the surface sediment near Jen-Gen River estuary so that the
degree of Cd enrichment, accumulation and potential
ecological risk can be evaluated.
II. MATERIALS AND METHODS
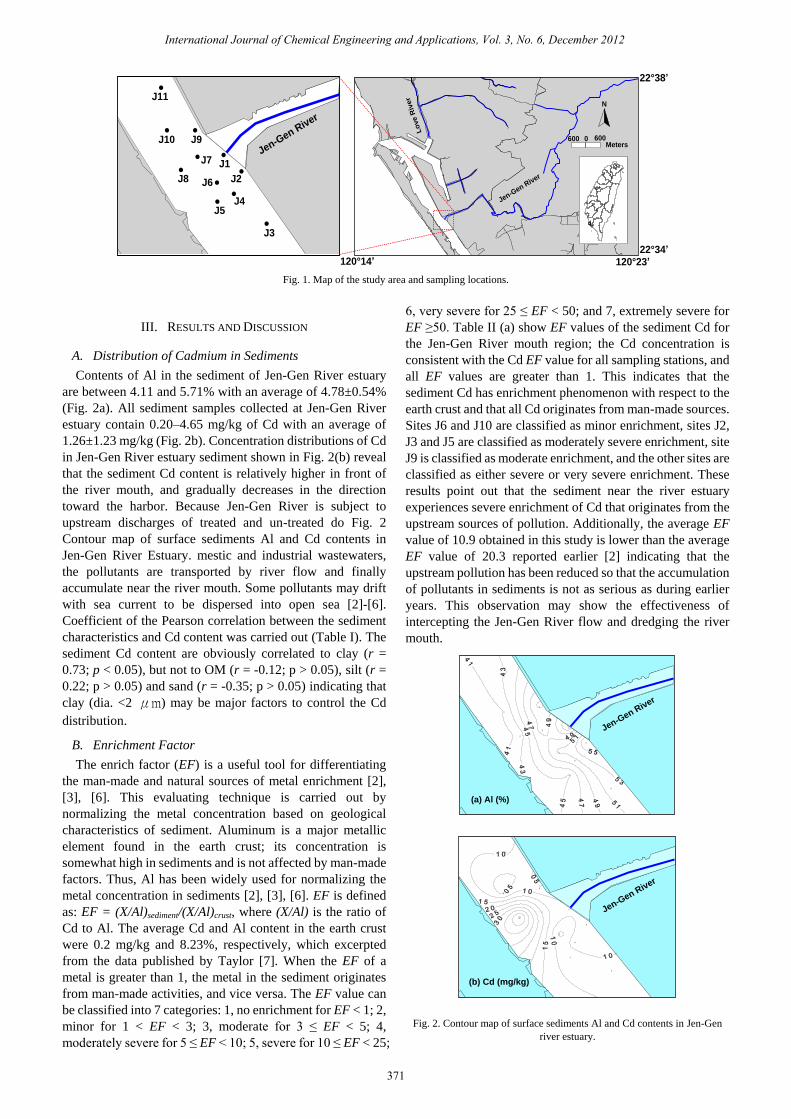
Surface sediment samples were collected from 11
sampling sites near Jen-Gen River mouth (Fig. 1) in May
2009 using an Ekman Bridge Grab Sampler (6" × 6" × 6")
manufactured by Jae Sung International Co., Taiwan. The
sampling locations, sample collection and characteristics of
the sediment (e.g. particle size and organic matter) have been
reported in detail previously [5].
For Al and Cd analyses, the sediments were screened
through 1 mm nylon net to remove particles with diameters
larger than 1 mm. 0.5 g dry weight of the sediment sample
was mixed with a mixture of ultra-pure acids (HNO3:HCl:HF
= 5:2:5), and was then heated to digest. The digested sample
was filter through 0.45 μm filter paper; the filtrate was
diluted with ultra-pure water to a pre-selected final volume.
The Al and Cd contents were determined using a flame
atomic absorption spectrophotometry (Hitachi Z-6100,
Japan).
Each batch of analyses was accompanied with a standard
reference (marine sediment (PACS-2)) and a blank. For
every 5 samples analyzed, the examination of standard
solutions was carried out to assure the stability of the
instrument used. The standard reference of marine sediment
(PACS-2) was found to contain 2.01±0.18 mg/kg in our lab
that is close to the certified values of 2.11±0.0.15 mg/kg
(n=3).
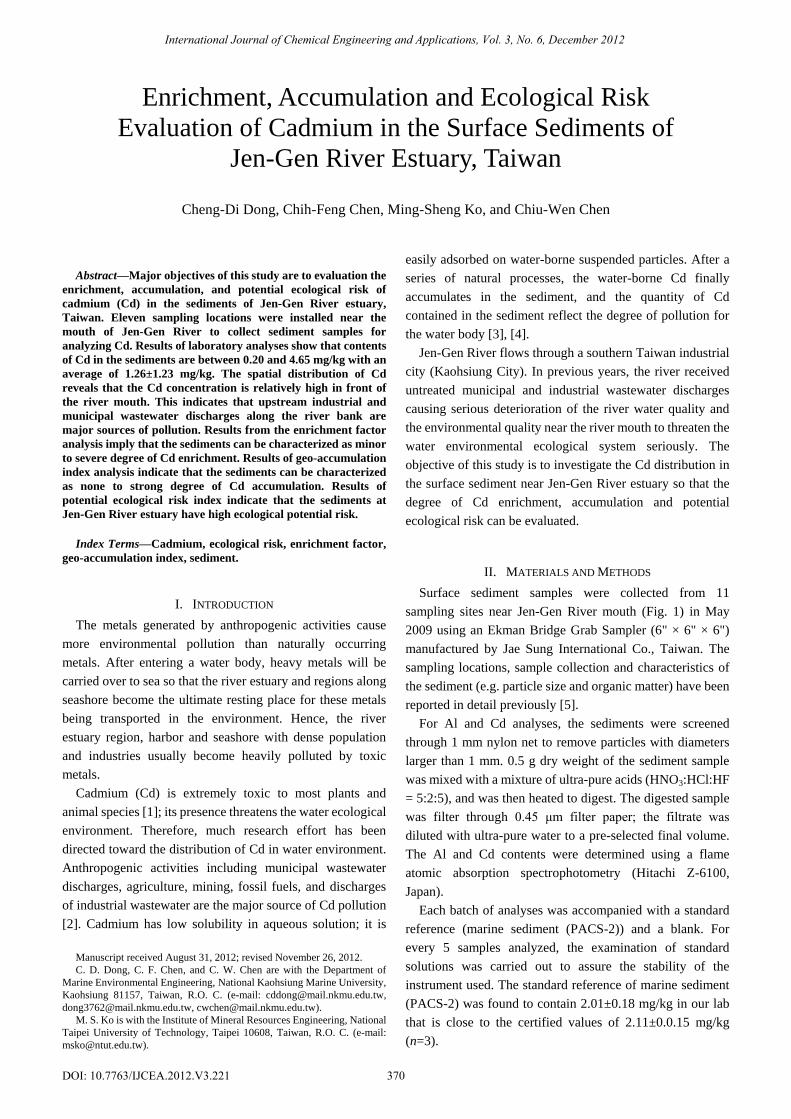
Enrichment, Accumulation and Ecological Risk
Evaluation of Cadmium in the Surface Sediments of
Jen-Gen River Estuary, Taiwan
Cheng-Di Dong, Chih-Feng Chen, Ming-Sheng Ko, and Chiu-Wen Chen
International Journal of Chemical Engineering and Applications, Vol. 3, No. 6, December 2012
370DOI: 10.7763/IJCEA.2012.V3.221
N
600 0 600 Meters
120°14’ 120°23’
22°38’
22°34’
●
●
● ●
●●
●
●●
●●
J11
J10
J8
J5
J9
J3
J7
J6
J1
J4
J2
Jen-Gen R
iver
Lo
ve R
iver
Jen-Gen R
iver
N
600 0 600Meters
Fig. 1. Map of the study area and sampling locations.
III. RESULTS AND DISCUSSION
A. Distribution of Cadmium in Sediments
Contents of Al in the sediment of Jen-Gen River estuary
are between 4.11 and 5.71% with an average of 4.78±0.54%
(Fig. 2a). All sediment samples collected at Jen-Gen River
estuary contain 0.20–4.65 mg/kg of Cd with an average of
1.26±1.23 mg/kg (Fig. 2b). Concentration distributions of Cd
in Jen-Gen River estuary sediment shown in Fig. 2(b) reveal
that the sediment Cd content is relatively higher in front of
the river mouth, and gradually decreases in the direction
toward the harbor. Because Jen-Gen River is subject to
upstream discharges of treated and un-treated do Fig. 2
Contour map of surface sediments Al and Cd contents in
Jen-Gen River Estuary. mestic and industrial wastewaters,
the pollutants are transported by river flow and finally
accumulate near the river mouth. Some pollutants may drift
with sea current to be dispersed into open sea [2]-[6].
Coefficient of the Pearson correlation between the sediment
characteristics and Cd content was carried out (Table I). The
sediment Cd content are obviously correlated to clay (r =
0.73; p < 0.05), but not to OM (r = -0.12; p > 0.05), silt (r =
0.22; p > 0.05) and sand (r = -0.35; p > 0.05) indicating that
clay (dia. <2 μm) may be major factors to control the Cd
distribution.
B. Enrichment Factor
The enrich factor (EF) is a useful tool for differentiating
the man-made and natural sources of metal enrichment [2],
[3], [6]. This evaluating technique is carried out by
normalizing the metal concentration based on geological
characteristics of sediment. Aluminum is a major metallic
element found in the earth crust; its concentration is
somewhat high in sediments and is not affected by man-made
factors. Thus, Al has been widely used for normalizing the
metal concentration in sediments [2], [3], [6]. EF is defined
as: EF = (X/Al)sediment/(X/Al)crust, where (X/Al) is the ratio of
Cd to Al. The average Cd and Al content in the earth crust
were 0.2 mg/kg and 8.23%, respectively, which excerpted
from the data published by Taylor [7]. When the EF of a
metal is greater than 1, the metal in the sediment originates
from man-made activities, and vice versa. The EF value can
be classified into 7 categories: 1, no enrichment for EF < 1; 2,
minor for 1 < EF < 3; 3, moderate for 3 ≤ EF < 5; 4,
moderately severe for 5 ≤ EF < 10; 5, severe for 10 ≤ EF < 25;
6, very severe for 25 ≤ EF < 50; and 7, extremely severe for
EF ≥50. Table II (a) show EF values of the sediment Cd for
the Jen-Gen River mouth region; the Cd concentration is
consistent with the Cd EF value for all sampling stations, and
all EF values are greater than 1. This indicates that the
sediment Cd has enrichment phenomenon with respect to the
earth crust and that all Cd originates from man-made sources.
Sites J6 and J10 are classified as minor enrichment, sites J2,
J3 and J5 are classified as moderately severe enrichment, site
J9 is classified as moderate enrichment, and the other sites are
classified as either severe or very severe enrichment. These
results point out that the sediment near the river estuary
experiences severe enrichment of Cd that originates from the
upstream sources of pollution. Additionally, the average EF
value of 10.9 obtained in this study is lower than the average
EF value of 20.3 reported earlier [2] indicating that the
upstream pollution has been reduced so that the accumulation
of pollutants in sediments is not as serious as during earlier
years. This observation may show the effectiveness of
intercepting the Jen-Gen River flow and dredging the river
mouth.
176000 176200 176400 176600 176800 177000 177200 177400 177600 177800
2497800
2498000
2498200
2498400
2498600
2498800
2499000
2499200
#
#
#
#
#
#
#
#
#
#
#
(a) Al (%)
Jen-Gen R
iver
#
#
#
#
#
#
#
#
#
#
#
(b) Cd (mg/kg)
Jen-Gen R
iver
176000 176200 176400 176600 176800 177000 177200 177400 177600 177800
2497800
2498000
2498200
2498400
2498600
2498800
2499000
2499200
Fig. 2. Contour map of surface sediments Al and Cd contents in Jen-Gen
river estuary.
International Journal of Chemical Engineering and Applications, Vol. 3, No. 6, December 2012
371
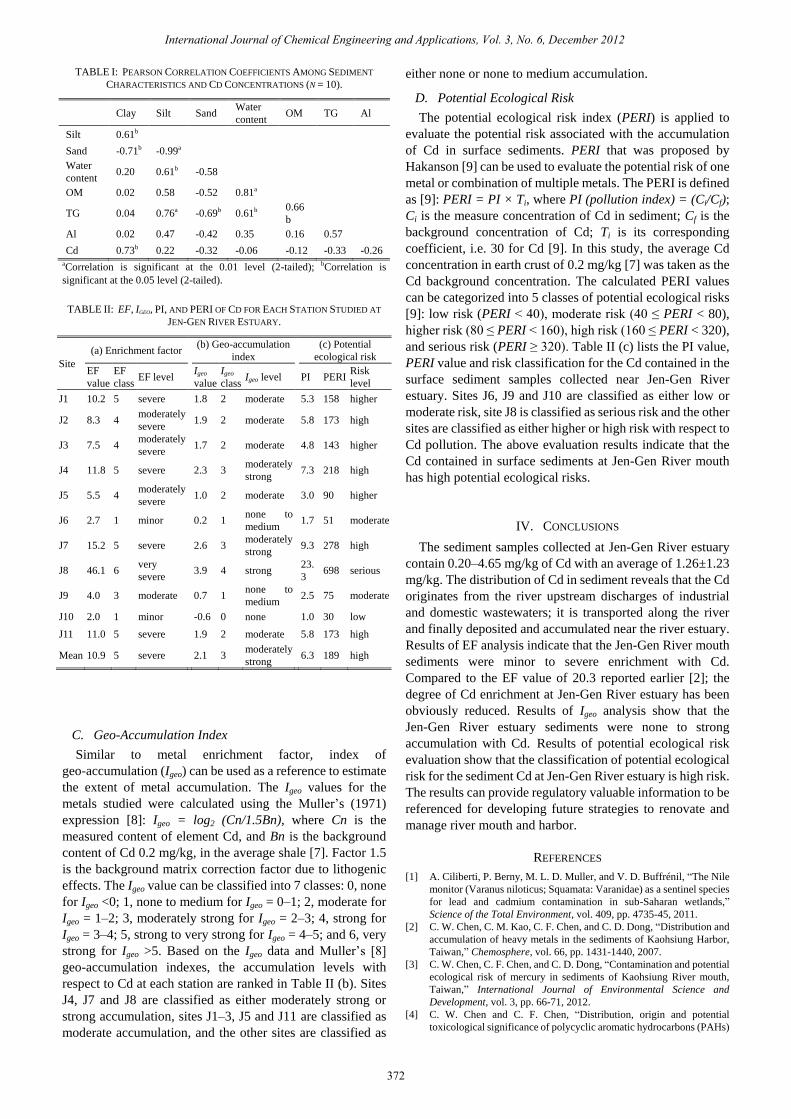
TABLE I: PEARSON CORRELATION COEFFICIENTS AMONG SEDIMENT
CHARACTERISTICS AND CD CONCENTRATIONS (N = 10).
Clay Silt Sand Water
content OM TG Al
Silt 0.61b
Sand -0.71b -0.99a
Water
content 0.20 0.61b -0.58
OM 0.02 0.58 -0.52 0.81a
TG 0.04 0.76a -0.69b 0.61b 0.66
b
Al 0.02 0.47 -0.42 0.35 0.16 0.57
Cd 0.73b 0.22 -0.32 -0.06 -0.12 -0.33 -0.26 aCorrelation is significant at the 0.01 level (2-tailed); bCorrelation is
significant at the 0.05 level (2-tailed).
TABLE II: EF, IGEO, PI, AND PERI OF CD FOR EACH STATION STUDIED AT
JEN-GEN RIVER ESTUARY.
Site
(a) Enrichment factor (b) Geo-accumulation
index
(c) Potential
ecological risk
EF
value
EF
class EF level
Igeo
value
Igeo
class Igeo level PI PERI
Risk
level
J1 10.2 5 severe 1.8 2 moderate 5.3 158 higher
J2 8.3 4 moderately
severe 1.9 2 moderate 5.8 173 high
J3 7.5 4 moderately
severe 1.7 2 moderate 4.8 143 higher
J4 11.8 5 severe 2.3 3 moderately
strong 7.3 218 high
J5 5.5 4 moderately
severe 1.0 2 moderate 3.0 90 higher
J6 2.7 1 minor 0.2 1 none to
medium 1.7 51 moderate
J7 15.2 5 severe 2.6 3 moderately
strong 9.3 278 high
J8 46.1 6 very
severe 3.9 4 strong
23.
3 698 serious
J9 4.0 3 moderate 0.7 1 none to
medium 2.5 75 moderate
J10 2.0 1 minor -0.6 0 none 1.0 30 low
J11 11.0 5 severe 1.9 2 moderate 5.8 173 high
Mean 10.9 5 severe 2.1 3 moderately
strong 6.3 189 high
C. Geo-Accumulation Index
Similar to metal enrichment factor, index of
geo-accumulation (Igeo) can be used as a reference to estimate
the extent of metal accumulation. The Igeo values for the
metals studied were calculated using the Muller’s (1971)
expression [8]: Igeo = log2 (Cn/1.5Bn), where Cn is the
measured content of element Cd, and Bn is the background
content of Cd 0.2 mg/kg, in the average shale [7]. Factor 1.5
is the background matrix correction factor due to lithogenic
effects. The Igeo value can be classified into 7 classes: 0, none
for Igeo <0; 1, none to medium for Igeo = 0–1; 2, moderate for
Igeo = 1–2; 3, moderately strong for Igeo = 2–3; 4, strong for
Igeo = 3–4; 5, strong to very strong for Igeo = 4–5; and 6, very
strong for Igeo >5. Based on the Igeo data and Muller’s [8]
geo-accumulation indexes, the accumulation levels with
respect to Cd at each station are ranked in Table II (b). Sites
J4, J7 and J8 are classified as either moderately strong or
strong accumulation, sites J1–3, J5 and J11 are classified as
moderate accumulation, and the other sites are classified as
either none or none to medium accumulation.
D. Potential Ecological Risk
The potential ecological risk index (PERI) is applied to
evaluate the potential risk associated with the accumulation
of Cd in surface sediments. PERI that was proposed by
Hakanson [9] can be used to evaluate the potential risk of one
metal or combination of multiple metals. The PERI is defined
as [9]: PERI = PI × Ti, where PI (pollution index) = (Ci/Cf);
Ci is the measure concentration of Cd in sediment; Cf is the
background concentration of Cd; Ti is its corresponding
coefficient, i.e. 30 for Cd [9]. In this study, the average Cd
concentration in earth crust of 0.2 mg/kg [7] was taken as the
Cd background concentration. The calculated PERI values
can be categorized into 5 classes of potential ecological risks
[9]: low risk (PERI < 40), moderate risk (40 ≤ PERI < 80),
higher risk (80 ≤ PERI < 160), high risk (160 ≤ PERI < 320),
and serious risk (PERI ≥ 320). Table II (c) lists the PI value,
PERI value and risk classification for the Cd contained in the
surface sediment samples collected near Jen-Gen River
estuary. Sites J6, J9 and J10 are classified as either low or
moderate risk, site J8 is classified as serious risk and the other
sites are classified as either higher or high risk with respect to
Cd pollution. The above evaluation results indicate that the
Cd contained in surface sediments at Jen-Gen River mouth
has high potential ecological risks.
IV. CONCLUSIONS
The sediment samples collected at Jen-Gen River estuary
contain 0.20–4.65 mg/kg of Cd with an average of 1.26±1.23
mg/kg. The distribution of Cd in sediment reveals that the Cd
originates from the river upstream discharges of industrial
and domestic wastewaters; it is transported along the river
and finally deposited and accumulated near the river estuary.
Results of EF analysis indicate that the Jen-Gen River mouth
sediments were minor to severe enrichment with Cd.
Compared to the EF value of 20.3 reported earlier [2]; the
degree of Cd enrichment at Jen-Gen River estuary has been
obviously reduced. Results of Igeo analysis show that the
Jen-Gen River estuary sediments were none to strong
accumulation with Cd. Results of potential ecological risk
evaluation show that the classification of potential ecological
risk for the sediment Cd at Jen-Gen River estuary is high risk.
The results can provide regulatory valuable information to be
referenced for developing future strategies to renovate and
manage river mouth and harbor.
REFERENCES
[1] A. Ciliberti, P. Berny, M. L. D. Muller, and V. D. Buffrénil, “The Nile
monitor (Varanus niloticus; Squamata: Varanidae) as a sentinel species
for lead and cadmium contamination in sub-Saharan wetlands,”
Science of the Total Environment, vol. 409, pp. 4735-45, 2011.
[2] C. W. Chen, C. M. Kao, C. F. Chen, and C. D. Dong, “Distribution and
accumulation of heavy metals in the sediments of Kaohsiung Harbor,
Taiwan,” Chemosphere, vol. 66, pp. 1431-1440, 2007.
[3] C. W. Chen, C. F. Chen, and C. D. Dong, “Contamination and potential
ecological risk of mercury in sediments of Kaohsiung River mouth,
Taiwan,” International Journal of Environmental Science and
Development, vol. 3, pp. 66-71, 2012.
[4] C. W. Chen and C. F. Chen, “Distribution, origin and potential
toxicological significance of polycyclic aromatic hydrocarbons (PAHs)
International Journal of Chemical Engineering and Applications, Vol. 3, No. 6, December 2012
372
in sediments of Kaohsiung Harbor, Taiwan,” Marine Pollution Bulletin
vol. 63, pp. 417-423, 2011.
[5] C. W. Chen, C. F. Chen, C. D. Dong, and Y. T. Tu, “Composition and
source apportionment of PAHs in sediments at river mouths and
channel in Kaohsiung Harbor, Taiwan,” Journal of Environmental
Monitoring, vol. 14, pp. 105-115, 2012.
[6] C. W. Chen, C. F. Chen, and C. D. Dong, “Copper Contamination in
the Sediments of Love River Mouth, Taiwan,” International Journal of
Chemical Engineering and Applications, vol. 3, pp. 58-62, 2012
[7] S. R. Taylor, “Abundance of chemical elements in the continental crust:
a new table,” Geochimica et Cosmochimica Acta, vol. 28, pp.
1273-1285, 1964.
[8] G. Müller, “Schwermetalle in den sediments des Rheins-
Veränderungen seit 1971,” Umschan, vol. 79, pp. 778-783, 1979.
[9] L. Hakanson, “An ecological risk index for aquatic pollution control, a
sediment-ecological approach,” Water Research, vol. 14, pp. 975-1001
1980.
International Journal of Chemical Engineering and Applications, Vol. 3, No. 6, December 2012
373
Cheng-Di Dong was born in Kaohsiung, Taiwan on
May 15, 1963. Educational Background: Ph.D.
(Environmental Engineering). He got her Ph.D.
degree in 1993 in the area of advanced oxidation
process. He is working as a professor in Department of
Marine Environmental Engineering, National
Kaohsiung Marine University, Taiwan since August,
1992. Present position: Professor in NKMU Taiwan.
Dong works in the area of Marine Environmental Engineering. He is having
57 numbers of journal Publications and 70 numbers of Conference
publications.
Chih-Feng Chen was born in Kaohsiung, Taiwan on
October 4, 1977. Educational Background: Ph.D.
(Environmental Engineering). He got her Ph.D.
degree in 2010 in the area of sediment contamination.
He is working as an assistant research fellow in
Department of Marine Environmental Engineering,
National Kaohsiung Marine University, Taiwan since
August, 2010. Chen works in the area of Marine Environmental Engineering.
He is having 13 numbers of journal Publications and 22 numbers of
Conference publications.
Ming-Sheng Ko was born in Kaohsiung, Taiwan on
October 29, 1967. Educational Background: Ph.D.
(Environmental Engineering). He got her Ph.D.
degree in 1999 in the area of waste treatment. He is
working as a professor in Institute of Mineral
Resources Engineering, National Taipei University
of Technology, Taiwan since August, 2005. Present
position: Professor in NTUT Taiwan. Ko works in
the area of Environmental Engineering. He is having
7 numbers of journal Publications and 23 numbers of Conference
publications.
Chiu-Wen Chen was born in Kaohsiung, Taiwan on
1st October 1963. Educational Background: Ph.D.
(Environmental Engineering). She got her Ph.D.
degree in 2006 in the area of sediment metal
contamination. She is working as a professor in
Department of Marine Environmental Engineering,
National Kaohsiung Marine University, Taiwan since
August, 1992. Present position: Professor in NKMU
Taiwan. Chen works in the area of Marine Environmental Engineering. She
is having 56 numbers of journal Publications and 66 numbers of Conference
publications.