Embed Size (px)
Citation preview

A collection of mathematics and reading activities for Grades 7-9 that explore the Sun-Earth System.
Enrichment Problems in
Space Science II
Educational Product Educators & Students
Grades 7-9
National Aeronautics and Space Administration
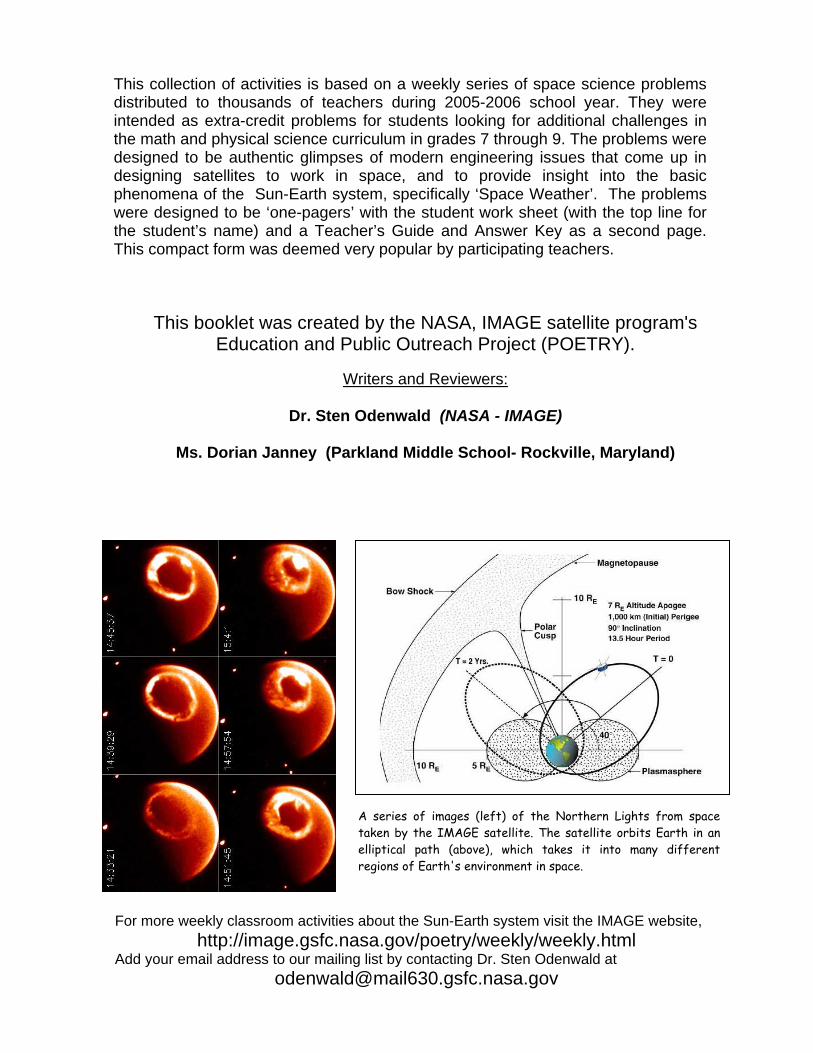
This collection of activities is based on a weekly series of space science problems distributed to thousands of teachers during 2005-2006 school year. They were intended as extra-credit problems for students looking for additional challenges in the math and physical science curriculum in grades 7 through 9. The problems were designed to be authentic glimpses of modern engineering issues that come up in designing satellites to work in space, and to provide insight into the basic phenomena of the Sun-Earth system, specifically ‘Space Weather’. The problems were designed to be ‘one-pagers’ with the student work sheet (with the top line for the student’s name) and a Teacher’s Guide and Answer Key as a second page. This compact form was deemed very popular by participating teachers.
This booklet was created by the NASA, IMAGE satellite program's Education and Public Outreach Project (POETRY).
Writers and Reviewers:
Dr. Sten Odenwald (NASA - IMAGE)
Ms. Dorian Janney (Parkland Middle School- Rockville, Maryland)
For more weekly classroom activities about the Sun-Earth system visit the IMAGE website, http://image.gsfc.nasa.gov/poetry/weekly/weekly.html
Add your email address to our mailing list by contacting Dr. Sten Odenwald at [email protected]
A series of images (left) of the Northern Lights from space taken by the IMAGE satellite. The satellite orbits Earth in an elliptical path (above), which takes it into many different regions of Earth's environment in space.

Table of Contents
Acknowledgments …………………………………………...………… Background Reading ………………………………………………….. Alignment with Standards …………………………………………….. Solar storm timeline. ………………………………………………….. Solar energy in space………………………………………….….…… Why do stars rise in the east?………………………………………… An Interplanetary shock wave……………………………….……….. Calculating star distances…………………………………...….….…. A sine of the times………………………..………………………….... Counting the stars in the sky…………………………..…….…….… Measuring speed in the universe………………………………...…. Applications of scientific notation………….………………………. Exploring a galaxy called NGC-1232…………………..…..…….…. The Doppler Shift and the speed of galaxy Q2125-431……….…. Star clusters up close: The case of the Pleiades…………..……. A Glimpse of the most distant galaxies in the universe…..…….. Solar surface details……………………………………...…….……… A galaxy close up: Messier-104………………….………..………... Asteroids between Mars and the Sun…………………….....…….... Exploring the Dwarf Planet Eris!...................................................... Searching for company in the universe……………………..….….. Counting the stars in Draco………………………….………..……… Astronomy in the round………………………….…………...………. Star Light….Star Bright……………………………..………..….….…. A bit of satellite math………………………………………..….…….... Theories, Hypothesis, Laws, Facts and Beliefs…………..….….… Solar storms in the news……………………………………...……… A few comments from the Author………………………..…….…… Useful web links for additional resources………………………….
i ii iii 1 2 3 4 5 6 7 8 9 10 11 12 13 14 15 16 17 18 19 20 21 22 23 24 25 27

We live next to a very stormy star, the Sun, but you would hardly notice anything unusual most of the time. Its constant sunshine hides spectacular changes. Only the dazzling glow of the Northern Lights suggests that invisible forces are clashing in space. These forces may cause all kinds of problems for us, and our expensive technology. It doesn't take long for 'solar storms' to get here, either. X-rays from flares make the trip to Earth in just under 9 minutes, while the fastest moving plasma can make the journey in only 17 hours. Solar flares disrupt Earth’s ionosphere and can cause satellite malfunctions, while the plasma clouds can change Earth's magnetic field. This leads to the displays of the aurora that humans have marveled at for thousands of years. Aurora light up the sky with billions of watts of power and cover millions of square kilometers. Why does all this happen? (Photo- Auroral curtain by Jan Curtis)
It has to do with Earth's magnetic field and
how it is disturbed by solar storms and the solar wind. The wind carries its own magnetic field with it, and travels at speeds of millions of kilometers per hour. Scientists keep track of this interplanetary storminess using numbers that follow its ups and downs just like meteorologists follow a storm's speed, pressure and humidity. Periods of increased and decreased solar activity come and go every 11 years. Solar flares also have their own story to tell just like flashes of lightning in a bad storm. (Photo - Coronal Mass Ejection seen by SOHO satellite)
Scientists have to keep track of many
different kinds of phenomena in the universe, both big and small. That's why they have invented a way to write very big and very small numbers using 'scientific notation. They also have to master how to think in three-dimensions and how to use mathematical models. Once they find the right models, they can use them to make better predictions of when the next solar storm will arrive here at Earth, and what it will do when it gets here! (Sketch of Earth's magnetic field)
Background
Space Weather
Models and Forecasting

The following table connects the activities in this booklet to topics commonly covered in Grade 7, 8 and 9 pre-algebra and algebra textbooks. The specific national math and science education standards (NSF ‘Project 2061’) targeted by this product are: Grade 6-8 Most of what goes on in the universe involves some form of energy being transformed into another form Graphs can show a variety of possible relationships between two variables A system can include processes as well as things Locate information in reference books, and computer data bases Understand writing that incorporates circle charts, bar graphs line graphs, tables, diagrams and symbols Grade 9-12 Find answers to problems by substituting numerical values in simple algebraic formulas. Use tables, charts and graphs in making arguments and claims in oral and written presentations. Distances and angles inconvenient to measure directly can be found by using scale drawings.
Topic Problem Number in the Book 1 2 3 4 5 6 7 8 9 1
0 11
12
13
14
15
16
17
18
19
20
21
22
23
24
Reading to be Informed
x x x x x x x x x x x x x x x x
Scale x x x x x x x x
drawings Triangle Properties
x x
Speed x
Distance, time
Solving for X x
Equations and substitution
x x x
Calculating Areas of polygons
x x
Positive & negative numbers
x
Decimal math.
x x x x x x x x x x x
Time calculations
x x
Percentages x
Unit Conversions
x x
WWW Research
x x x x
Graphing x
Open Inquiry x x x x
Histograms x
Geometry x x
Scientific Notation
x

The sun is an active star that produces explosions of matter and energy. The space between the planets is filled with invisible clouds of gas that sometimes collide with Earth. Scientists call them Coronal Mass Ejections. They can travel at millions of miles per hour and carry several billion tons of gas called a plasma. When ‘CMEs’ collide with Earth, they produce the Northern Lights and magnetic storms. In this exercise, you will examine one of these ‘solar storm’ events by examining a timeline of events that it caused. The picture to the right was taken by the SOHO spacecraft showing a spectacular CME. The white circle is the size of the sun.
Solar Storm Timeline
Day Time What Happened Tuesday 4:50 PM Gas eruption on Sun Thursday 3:36 AM Plasma storm reaches Earth. Thursday 5:20 AM Storm at maximum intensity. Thursday 5:35 AM Auroral power at maximum. Thursday 11:29 AM Aurora power at minimum. Thursday 2:45 PM Space conditions normal
1) How much time passed between the solar gas eruption and its detection near Earth?
2) How long after the plasma storm reached Earth did the aurora reach their maximum power? 3) How long did the storm last near Earth from the time the plasma was detected, to the time when space conditions returned to normal? Extra for Experts! If the Earth is 150 million kilometers from the sun, how fast did the storm travel from the Sun in kilometers per hour? How long will the trip to Pluto take is Pluto is 40 times farther away from the sun than Earth?
1 Name ________________________________
Exploring Space Mathematics http://image.gsfc.nasa.gov/poetry

Teacher’s Guide to Solar Storm Timeline 1
Day Time What Happened Tuesday 4:50 PM Gas eruption on Sun Thursday 3:36 AM Plasma storm reaches Earth. Thursday 5:20 AM Storm at maximum intensity. Thursday 5:35 AM Auroral power at maximum. Thursday 11:29 AM Aurora power at minimum. Thursday 2:45 PM Space conditions normal
Goal: Students will interpret a timeline table to extract information about a solar storm using time addition and subtraction skills.
1) How much time passed between the solar gas eruption and its detection near Earth? Answer: There are various ways to do this problem. You want to subtract the final time from the initial time so: (Tuesday 4:50 PM ) – (Thursday, 3:36 AM) = (Thursday – Tuesday) + ( 3:36 AM – 4:50 PM) = 48 hrs – (4:50PM – 3:36AM) = 48h – 13h 14m = 34hours and 46minutes. 2) How long after the plasma storm reached Earth did the aurora reach their maximum power? Answer: Storm arrived at 3:36 AM. Aurora at maximum at 5:35AM. Difference in time is 1 hour and 59 minutes. 3) How long did the storm last near Earth from the time the plasma was detected, to the time when space conditions returned to normal? Answer: On Thursday, the storm started at 3:36 AM and ended at 2:45 PM, so the storm effects at Earth lasted from 03:36 to 14:45 so the difference is 14:45 – 03:36 = 11 hours and (45-36 =) 9 minutes. Extra for Experts! If the Earth is 150 million kilometers from the sun, how fast did the storm travel from the Sun in kilometers per hour? How long will the trip to Pluto take is Pluto is 40 times farther away from the sun than Earth? Answer: The answer to Problem 1 is 34hours and 46minutes, which in decimal form is 34 + (46/60) = 34.8 hours with rounding. The speed is therefore 150 million km/34.8 hours or 4.3 million km/h. The trip to Pluto would take 40 x 34.8 hours = 1,392 hours or about 58 days. Note, the Space Shuttle is our fastest manned spacecraft and travels at 44,000 km/h so it would take about 58 x (4.3 million/44,000) = 5668 days to make this trip, which equals 15.5 years!!!! Of course, the Space Shuttle will be out of fuel and supplies within a week.
Exploring Space Mathematics http://image.gsfc.nasa.gov/poetry

2 Name ________________________________
Question 1: What is the usable area of the satellite’s face shown below? Question 2: What electrical power can be generated by the panel? Question 3: If there are 8 similar panels on the satellite, what is the approximate total power that can be generated if all faces are fully illuminated, and have about the same number of solar cells?
Satellites use electricity to run their various systems and experiments. Since the dawn of the Space Age, engineers have used solar cells to generate this energy from sunlight. In this exercise, you will calculate how much power the IMAGE satellite can generate from one of its 8 hexagonal faces, allowing for the areas lost by instrument windows and other blank areas on the satellite. Note: The solar cells used by the IMAGE satellite can generate 0.03 watts per square centimeter of area.
IMAGE satellite Face 1
The panel above is 136 centimeters long and 90 centimeters wide. The solar cells that generate the electricity are shown in black. The brown-colored areas do not generate electricity. Come up with a plan to determine the sizes of the black areas from the given information and image, then answer the three questions above after performing the required calculations.
Exploring Space Mathematics http://image.gsfc.nasa.gov/poetry

Goal: Students will calculate the area of a satellite solar panel and estimate the total electrical power that can be generated. Students will use the images and dimensions provided to create a scaled drawing of each satellite face, and from this determine the scaled dimensions of the dark solar cell areas. Note: If you want to make a full-sized model of the satellite visit the IMAGE Satellite Scaled Model page at
http://image.gsfc.nasa.gov/poetry/workbook/page14.html
Teacher’s Guide to Solar Energy in Space 2
Question 1: What is the usable area of the satellite’s face? Answer: Add A-L areas to get 47.4 sq cm, then subtract the areas of the 15 non-celled rectangles (15 x 0.15 = 2.3) and get 47.4 – 2.3 = 45.1 square cm in image units. Convert to actual area by multiplying by 13.4 x 13.4 = 179.6. The total area of the solar cells is then 45.1 x 179.6 = 8100 sq. cm. Note, the maximum panel area is 12,240 sq. cm, so (8100/12240)x100% = 66% of the panel is covered by solar cells. Question 2: What electrical power can be generated by the panel? Answer: 0.03 W/sq.cm x 8100 sq. cm = 243 watts. Question 3: If there are 8 similar panels on the satellite, what is the approximate total power that can be generated if 4 faces are fully illuminated at a given time, and have about the same number of solar cells? Answer: 4 x (243 W) = 972 Watts.
ID W L A ID W L A ID W L A A 6.0 3.5 21.0 E 0.7 0.5 0.4 I 0.4 0.5 0.2 B 0.5 3.2 1.6 F 0.5 0.5 0.3 J 0.9 0.5 0.5 C 1.0 1.7 1.7 G 1.4 0.5 0.7 K 3.7 4.0 14.8 D 1.0 2.3 2.3 H 0.2 0.5 0.1 L 1.9 2.0 3.8
W, L = image width and height in cm A = image area in sq.cm.
A B,C D,E,F G,H I J K,L
As a benchmark: The maximum possible area of the panel is 136 cm x 90 cm = 12,240 sq cm. The maximum power is therefore (0.03 watts/sq cm) x 12,240 sq cm = 367 watts if the panel is fully illuminated. The scale factor of the students image is 137 cm (actual) / 10.2 cm (picture) or 13.4 Suggested Method: Determine the black area by breaking the panel into rectangles as indicated by the letters from left to right. Subtract from each rectangle the area of the non-black regions. There are 15 small rectangles within the boxed black regions. Each have the same size = 0.3cmx0.5cm (image). Note, perform all area calculations in ‘image’ units, then convert final area answer to actual units by multiplying by (13.4)^2.
Exploring Space Mathematics http://image.gsfc.nasa.gov/poetry

3 Name ________________________________
Construction: 1 Draw a circle with center O 2 Draw the vertical radius OA 3 Draw radius OB to the right of OA such that AOB is an acute angle 4 Draw a ray tangent to radius OA 5 Draw a ray tangent to radius OB intersecting the tangent ray to OA at point C 6 Extend radius OB so that it intersects the tangent to radius OA at point D 7 Draw segment DF where point F is on the tangent to radius OB 8 Draw a ray, parallel to AD that intersects the circle at point B, and the segment DF at
point E 9 Extend ray BE so that it intersects radius AO at point G Givens: AD parallel to GE CD perp DE BE perp DF
The Earth rotates from west to east, but the sun, moon, stars and planets rise in the east and set in the west. In this exercise you will prove that this must happen using geometric skills. Follow the Construction instructions in Part 1 to draw the figure and label the relevant points, line segments and angles, then answer the accompanying questions and construct the Proof.
Problem 1: Prove Triangle ADO is congruent to Triangle CDF Problem 2: Prove Angle AOB equals angle EBF Problem 3: Draw a second diagram similar to the one in Problem 1 but in which mAOB is increased. Re-perform the Proof in Problem 1. Prove that, as mAOB increases that mEBF remains equal to mAOB and increases as well. Suppose that the circle represents Earth, and you are looking down at it from above the north pole. Earth rotates from west to east in the diagram. Suppose that the tangent line CF represents the horizon line for Observer B, and that a few hours later, Earth has rotated eastwards so that Observer B is now located at Point A with a local horizon defined by ray AD. Suppose that Observer B sees the sun located along the ray direction BE Problem 4: Prove that the direction of the sun from Observer Bs location is in the western sky. Problem 5: Prove that the direction of the sun aster a few hours at Point A is at the western horizon. Problem 6: Explain how the observation that objects rise in the east and set in the west require that Earth rotate from west to east.
Exploring Space Mathematics http://image.gsfc.nasa.gov/poetry

Teacher’s Guide Why do stars rise in the East? 3
Goal: Students will use geometric knowledge to prove that, though Earth rotates from west to east, the sun, moon, stars and planets will appear to rise in the east and set in the west.
Part 1: Students will follow the step-by-step instructions in the Construction Phase and draw the figure to the left.
Problem 1: Prove Triangle ADO is congruent to Triangle CDF. Answer: Angle OAD= Angle CDF= right angle; ADB cong DBE; BDE cong EBF; BEF = right angle; EBF compl. BFE; so BFE = CDB; so AOD = BDF; annd so Triangle ADO cong. CDF. Students should provide supporting postulate citations for each step. Problem 2: Prove Angle AOD equals angle EBF. Answer: Angle ADO is congruent to Angle BFD. Since BEF is a right angle, EBF must be equal to ADO. Problem 3: Prove that, as mAOB increases that mEBF increases as well. Answer: Students draw a second diagram, but one in which mAOB is larger, then perform the proof in Problem 1 over again to demonstrate, by deduction, that AOB = EBF so that again their measures remain equal. Problem 4: Prove that the direction of the sun from Observer Bs location is in the western sky. Answer: This requires visual thinking. Given the information provided by the list of suppositions, the two parallel rays represent the light from a star fixed at infinity in the direction BE (ie the sun). This direction is to the west as viewed by someone standing on the Earth at point B. Problem 5: Prove that the direction of the sun after a few hours at Point A is at the western horizon. Answer: The observer is now at point A since the circle has rotated coun6terclockwise from west to east. The ray AD still points to the sun ‘at infinity’, which is now on the western horizon defined by the tangent line AD at point A. Problem 6: Explain how the observation that objects rise in the east and set in the west require that Earth rotate from west to east. Answer: Because if the opposite were true, the object in the sky would appear to rise in the west and set in the east, as the observer moved from Point A to point B.
Exploring Space Mathematics http://image.gsfc.nasa.gov/poetry

4 Name ________________________________
Sun - CME Earth - Aurora Saturn - Aurora
On November 8, 2000 the sun ejected a blast of plasma called a coronal mass ejection or CME. On November 12, the CME collided with Earth and produced a brilliant aurora detected from space by the IMAGE satellite. On December 8, the Hubble Space telescope detected an aurora on Saturn. During the period from November to December, 2000, Earth, Jupiter and Saturn were almost lined-up with each other. Assuming that the three planets were located on a straight line drawn from the sun to Saturn, with distances from the sun of 150 million, 778 million and 9.5 billion kilometers respectively, answer the questions below: 1 – How many days did the disturbance take to reach Earth and Saturn? 2 – What was the average speed of the CME in its journey between the Sun and Earth in millions of km per hour? 3 – What was the average speed of the CME in its journey between Earth and Saturn in millions of km per hour? 4 – Did the CME accelerate or decelerate as it traveled from the Sun to Saturn? 5 – How long would the disturbance have taken to reach Jupiter as it passed Earth’s orbit? 6 – On what date would you have expected to see aurora on Jupiter?
Exploring Space Mathematics http://image.gsfc.nasa.gov/poetry

Teacher’s Guide Interplanetary Shock Wave 4
On November 8, 2000 the sun ejected a blast of plasma called a coronal mass ejection or CME. On November 12, the CME collided with Earth and produced a brilliant aurora detected from space by the IMAGE satellite. On December 8, the Hubble Space telescope detected an aurora on Saturn. During the period from November to December, 2000, Earth, Jupiter and Saturn were almost lined-up with each other. Assuming that the three planets were located on a straight line drawn from the sun to Saturn, with distances from the sun of 150 million, 778 million and 9.539 billion kilometers respectively, answer the questions below: 1 – How many days did the disturbance take to reach Earth and Saturn? Answer: Earth = 3 days; Saturn = 30 days. 2 – What was the average speed of the CME in its journey between the Sun and Earth in millions of km per hour? Answer: Sun to Earth = 150 million km. Time = 4 days x 24 hrs = 96 hrs so Speed = 150 million km/96hr = 1.5 million km/hr. 3 – What was the average speed of the CME in its journey between Earth and Saturn in millions of km per hour? Answer: Distance = 9539 – 150 = 9,389 million km. Time = 30 days x 24h = 720 hrs so Speed = 9389 million km/720hrs = 13.0 million km/hr. 4 – Did the CME accelerate or decelerate as it traveled from the Sun to Saturn? Answer: The CME accelerated from 1.5 million km/hr to 13 million km/hr. 5 – How long would the disturbance have taken to reach Jupiter as it passed Earth’s orbit? Answer: Jupiter is located 778 million km from the Sun or (778 – 150 = ) 628 million km from Earth. Because the CME is accelerating, we it is important that students realize that it is more accurate to use the average speed of the CME between Earth and Saturn which is (13 – 1.5)/2 = 6 million km/hr. The travel time to Jupiter is then 628/6 = 104 hours. 6 – On what date would you have expected to see aurora on Jupiter? Answer: Add 104 hours ( ~ 4 days) to the date of arrival at Earth to get November 16. According to radio observations of Jupiter, the actual date of the aurora was November 20. Note: If we had used the Sun-Earth average speed of 1.5 million km/hr to get a travel time of 628/1.5 = 418 hours, the arrival date would have been November 29, which is 9 days later than the actual storm. This points out that the CME was accelerating after passing Earth, and its speed was between 1.5 and 6 million km/hr. For more details about this interesting research, read the article by Renee Prange et al. “An Interplanetary Shock Traced by Planetary Auroral Storms from the Sun to Saturn” published in the journal Nature on November 4, 2004, vol. 432, p. 78. Also visit the Physics Web online article “Saturn gets a shock” at http://www.physicsweb.org/articles/news/8/11/2/1
Exploring Space Mathematics http://image.gsfc.nasa.gov/poetry

5 Name ________________________________
Stars are spread out through space at many different distances from our own Sun and from each other. In this problem, you will calculate the distances between some familiar stars using the 3-dimensional distance formula in Cartesian coordinates. Our own Sun is at the origin of this coordinate system, and all distances are given in light-years. The distance formula is given by:
Star Distance from Sun
Constellation X Y Z Distance from
Polaris Sun 0.0 0.0 0.0
Sirius -3.4 -3.1 7.3 Alpha Centauri -1.8 0.0 3.9
Wolf 359 4.0 4.3 5.1 Procyon -0.9 5.6 -9.9 Polaris 99.6 28.2 376.0 0.0
Arcturus 32.8 9.1 11.8 Tau Ceti -6.9 -8.6 2.5
HD 209458 -94.1 -120.5 5.2 Zubenelgenubi 64.6 -22.0 23.0
Question 1: Within which constellations are these stars located? Question 2: What are the distances of these stars from the Sun in light-years? Question 3: If you moved to the North Star, Polaris, how far would the Sun and other stars be from you? Enter the answer in the table above. Question 4: Which of these stars is the closest to Polaris? Question 5: What does your answer to Question 4 tell you about the stars you see in the sky from Earth?
Exploring Space Mathematics http://image.gsfc.nasa.gov/poetry

Teacher’s Guide Calculating Star Distances 5
Star Distance from Sun
Constellation X Y Z Distance from
Polaris Sun 0.0 None 0.0 0.0 0.0 390
Sirius 8.68 Canis Major -3.4 -3.1 7.3 384 Alpha Centauri 4.34 Cantaurus -1.8 0.0 3.9 387
Wolf 359 7.8 Leo 4.0 4.3 5.1 384 Procyon 11.45 Canis Minor -0.9 5.6 -9.9 399 Polaris 390 Ursa Minor 99.6 28.2 376.0 0
Arcturus 36 Bootes 32.8 9.1 11.8 371 Tau Ceti 11.35 Cetus -6.9 -8.6 2.5 390
HD 209458 153 Pegasus -94.1 -120.5 5.2 444 Zubenelgenubi 72 Libra 64.6 -22.0 23.0 358
Question 1: Within which constellations are these stars located? Answer: Students may use books or GOOGLE to enter the answers in the table. Question 2: What are the distances of these stars from the Sun in light-years? Answer: Use the formula provided with X1=0, y1=0 and z1 = 0. Example for Sirius where x2 = -3.4, y2 = -3.1 and z2=7.3 yields, D = ((-3.4)^2 + (-3.1)^2 + (7.3)^2)^0.5 = 8.7 light-years. Question 3: If you moved to the North Star, Polaris, how far would the Sun and other stars be from you? Enter the answer in the table. Answer: To do this, students select the new origin at Polaris and fix x1 = 99.6, y1=28.2 and z1 = 376.0 in the distance formula. They then insert the X, Y and Z coordinates for the other stars and compute the distance. Example, for the Sun, the distance will be 390 light years, because that is how far Polaris is from the Sun. For HD 209458, the distance formula gives D = ((-94.1 – 99.6)^2 + (-120.5 – 28.2)^2 + (5.2 – 376)^2)^0.5 = (37519 + 22111 + 137492)^0.5 = 444 light years. Question 4: Which of these stars is the closest to Polaris? Answer: Zubenelgenubi! Question 5: What does your answer to Question 4 tell you about the stars you see in the sky from Earth? Answer: This is a great lesson in 3-d space visualization. Even though Polaris and HD 209458 are close in the sky as viewed from Earth (they are in Ursa Minor and Pegasus respectively as a star chart will show) they are actually the farthest apart of any two stars in this list.
Exploring Space Mathematics http://image.gsfc.nasa.gov/poetry

6 Name ________________________________
h
R
R
You are here !
Aurora
A
Your friend ishere
You are standing on Earth looking due-North. A friend tells you by phone that she is seeing a beautiful aurora, right now, located directly over her head at an altitude, h, of 500 kilometers. You know that the radius, R, of Earth is 6,378 kilometers. In this problem, you will determine whether the aurora will be visible above your horizon as you look North. This same mathematics will also let you answer many other problems too. Can you think of a few?
Problem 1: Show that, in the diagram, the line connecting ‘You’ to the aurora is your horizon line. Draw a line that represents the direction of ‘straight up’, also called your Zenith. Problem 2 – The angle, A, represents the difference in latitude between where you are, and where your friend is located, as she views the aurora. Describe, in terms of sines or cosines, the trigonometric relationship between this angle, A, and the height of the aurora, h. Problem 3 – The aurora was located at an altitude of 500 km, and your friend is located at a latitude of 65 degrees North. At what latitude southward of your friend will the aurora be just at your northern horizon? Will you be able to see it? Problem 4 – At the same time as the aurora, your friend sees a bright meteor flash over head at an altitude of 90 kilometers. Could you see this meteor from your latitude calculated in Problem 3?
Exploring Space Mathematics http://image.gsfc.nasa.gov/poetry

Teacher’s Guide A Sine of the Times 6
h
R
R
This problem is solved by using a simple geometric relationship, along with the definition of the ‘cosine’ of angle A in the right-triangle. The diagram above shows the relevant lengths and angles for an object located ‘h’ kilometers above the Earth, and with the radius of Earth, R, defined as 6,378 kilometers. The first problem has the student determine the formula that relates the height, h, and the sine of the angle, A . The angle, A, is the critical angle A you need to be at to just see some object above the horizon. At smaller angles, the object appears higher up in the sky. Note, the two tangent lines in the figure represent the ‘horizons’ of two observers viewing the same object, O.
Suppose there was a plane that was just over your head from one location on Earth. At the same time, another observer located some distance away says that she can see the same plane at the same time, but it is located just above her horizon from where she is standing? This simple geometric problem lets you determine how far away from some object (an aurora, a meteor, a plane) you will be if you are just seeing it above the horizon.
Problem 1: This is your horizon line because it is a line that is exactly tangent to Earth’s surface at your location. The line drawn 90 degrees to this line points to your Zenith ‘directly over head’. Problem 2: From the properties of the indicated right triangle: cos(A) = R/(R + h) Problem 3: cos(A) = 6378/(6378 + 500) so cos(A) = 0.9273 and so A = 22 degrees. Your friend was at 65 degrees North, so your latitude would be 65 – 22 = 43 degrees North. You will not see the aurora at your latitude because it is exactly AT the horizon. Problem 4 – No, because h is smaller than for the aurora. This means that you would have to be much farther north of where you were standing to see it above the horizon. The critical latitude where you see it AT the horizon would be 65 degrees – arccosine (6378/(6378+90)) = 55.5 degrees North. This is 9.5 degrees North of where you are, which corresponds to a viewing spot (9.5/360)*2 π (6,378 km) = 1,057 kilometers north of your location.
A
Exploring Space Mathematics http://image.gsfc.nasa.gov/poetry

7 Name ________________________________
On a clear night in the city, you can see hundreds of stars across the sky. From a location in the distant countryside, you can see thousands of much fainter stars. With a telescope you can see millions of stars. In this activity, you will use a recent photograph of a small part of the sky to estimate how many stars could be seen by astronomers using a modern telescope to photograph the entire sky. In 1999, the 2-Micron Astronomical Sky Survey (2MASS) photographed a small section of sky in the constellation Hercules. Follow the step-by-step procedure to estimate from this photograph about how many stars there are in the sky that are one million times fainter than what the human eye can detect.
1 – This image is 0.15 degrees wide and 0.29 degrees long. How many square degrees in size is this picture? 2 – The sky has an area of 41,260 square degrees. How many of these picture ‘tiles’ would be needed to cover the entire sky? 3 – How many bright stars do you see in the picture? 4 – How many faint stars do you see in the picture? 5 – If this picture were typical of the tiles in Question 2, about how many bright stars would you expect to find across the entire sky? 6 – How many of the faint stars you counted in Question 4 would you expect to see across the entire sky? 7 – The human eye should be able to see about 8,000 stars across the entire sky. Based on the numbers you estimated in questions 5 and 6, are any of the stars in the picture to the left likely to be visible to the eye?
Exploring Space Mathematics http://image.gsfc.nasa.gov/poetry

Teacher’s Guide Counting the Stars in the Sky 7
1 – This image is 0.15 degrees wide and 0.29 degrees long. How many square degrees in size is this picture? Answer: 0.15 x 0.29 = 0.044 square degrees. 2 – The sky has an area of 41,260 square degrees. How many of these picture ‘tiles’ would be needed to cover the entire sky? Answer: 41,260/0.0435 = 948,500 tiles. 3 – How many bright stars do you see in the picture? Answer: Estimates may vary. The arrows indicate the four reasonable choices.
4 – How many faint stars do you see in the picture? Answer: Students will have to count by hand all of the ‘spots’ in this photograph. Answers may vary, but should be in the range from 500 to 600. Break the photograph into 4 x 8 equal-sized patches and count the number of stars in one of these, then multiply by the number of patches (32) to get an estimate. For example, in the patch I highlighted in the picture above, I counted 17 stars. There are 32 of these patches covering the picture, so I estimate that there are 32 x 17 = 544 stars in this picture. 5 – If this picture were typical of the tiles you estimated in Question 2, about how many bright stars would you expect to find across the entire sky? Answer: It the picture is typical, with 4 bright stars in its field of view, the number of similar stars would be 4 x 948,500 = 3.8 million. 6 – How many of the faint stars you counted in Question 4 would you expect to see across the entire sky? Answer: If we chose an average of 550 stars in this picture, then for 948,500 fields there would be about 550 x 948,500 = 521 million stars covering the entire sky. 7 – The human eye should be able to see about 8,000 stars across the entire sky. Based on the numbers you estimated in questions 5 and 6, are any of the stars in the picture to the left likely to be visible to the eye? Answer: No, because even the brightest stars seen in the photograph, if present across the sky, are far more common (there are 3.8 million of them!) than the stars you can see with the eye (about 8,000!), so they must be much fainter.
Exploring Space Mathematics http://image.gsfc.nasa.gov/poetry
8 Name ________________________________
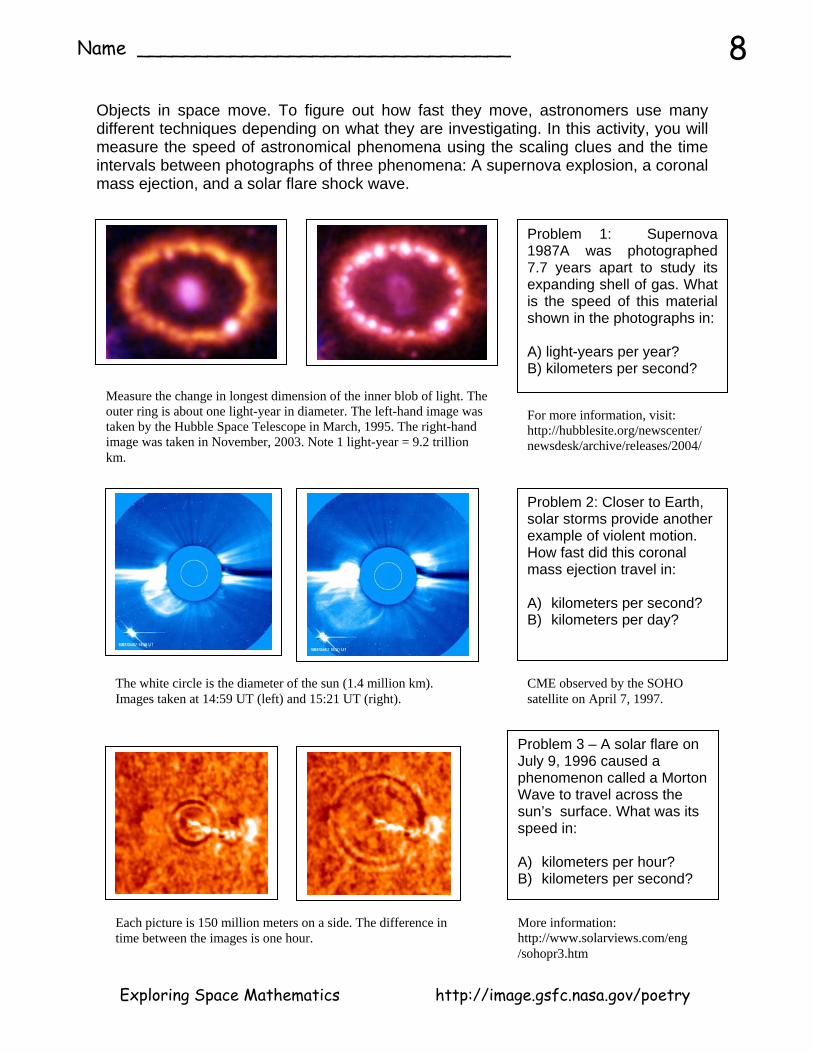
Objects in space move. To figure out how fast they move, astronomers use many different techniques depending on what they are investigating. In this activity, you will measure the speed of astronomical phenomena using the scaling clues and the time intervals between photographs of three phenomena: A supernova explosion, a coronal mass ejection, and a solar flare shock wave.
Problem 1: Supernova 1987A was photographed 7.7 years apart to study its expanding shell of gas. What is the speed of this material shown in the photographs in: A) light-years per year? B) kilometers per second?
Measure the change in longest dimension of the inner blob of light. The outer ring is about one light-year in diameter. The left-hand image was taken by the Hubble Space Telescope in March, 1995. The right-hand image was taken in November, 2003. Note 1 light-year = 9.2 trillion km.
For more information, visit: http://hubblesite.org/newscenter/newsdesk/archive/releases/2004/
Problem 2: Closer to Earth, solar storms provide another example of violent motion. How fast did this coronal mass ejection travel in: A) kilometers per second? B) kilometers per day?
The white circle is the diameter of the sun (1.4 million km). Images taken at 14:59 UT (left) and 15:21 UT (right).
CME observed by the SOHO satellite on April 7, 1997.
Problem 3 – A solar flare on July 9, 1996 caused a phenomenon called a Morton Wave to travel across the sun’s surface. What was its speed in: A) kilometers per hour? B) kilometers per second?
Each picture is 150 million meters on a side. The difference in time between the images is one hour.
More information: http://www.solarviews.com/eng/sohopr3.htm
Exploring Space Mathematics http://image.gsfc.nasa.gov/poetry

Teacher’s Guide Measuring Speed in the Universe 8
Problem 1: Supernova 1987A was photographed 7.7 years apart to study its expanding shell of gas. What is the speed of this material shown in the photographs in: A) light-years (LY) per year? B) kilometers per second? Answer: Using a millimeter ruler and the stated size of the image, the scale is about 30mm = 1 LY. The central ‘blob’ which is the supernova shell has an initial diameter of 5mm and a final largest diameter of 10mm, so its radius has increased by 2.5mm which equals (2.5mm/30mm)x 1LY = 0.085 LY. The difference in time between the images is 7.7 years so A) 0.085 LY/7.7 yrs = 0.010 Light-years/year, and for 3.1 x 10⁷ seconds in a year, B) 9.2 x 1012 x 0.010/3.1x 107 = 3,100 km/sec. Problem 2: Closer to Earth, solar storms provide another example of violent motion. How fast did this coronal mass ejection travel in: A) kilometers per second? B) kilometers per day? Answer: The scale of the prints is about 7 mm = 1.4 million km. If you measure the distance from the center of the sun circle to the outer edge of the CME in the lower left corner of each picture, you get about 13.5 mm and 19 mm respectively. This equals a change in distance of (5.5mm/7mm) x 1.4 million km = 1.1 million km. The difference in time between the two images is 22 minutes or 1320 seconds, so A) the speed is about 1.1 million km/1320 sec = 833 km/sec. There are 24x60x60 = 86400 seconds in a day, so B) is about 833 x 86400 = 72 million km/day. Problem 3 – A solar flare on July 9, 1996 caused a phenomenon called a Morton Wave to travel across the sun’s surface. What was its speed in: A) kilometers per second? B) kilometers per hour? Answer: The image scale is 37 mm = 150 million meters. The circles represent the shock wave, and the outer ring radius has increased from 7mm to 12mm in one hour. This is a distance change of (5mm/37mm)x 150 million meters = 20 million meters or 20,000 kilometers. A) 20,000 kilometers/hour. B) There are 3600 seconds in an hour so 20,000/3600 = 5.6 km/sec.
Exploring Space Mathematics http://image.gsfc.nasa.gov/poetry

9 Name ________________________________
Scientific notation is an important way to represent very big, and very small, numbers. Here is a sample of astronomical problems that will test your skill in using this number representation.
Problem 1: The sun produces 3.9 x 1033 ergs per second of radiant energy. How much energy does it produce in one year (3.1 x 10⁷ seconds)? Problem 2: One gram of matter converted into energy yields 3.0 x 10²⁰ ergs of energy. How many tons of matter in the sun is annihilated every second to produce its luminosity of 3.9 x 1033 ergs per second? (One metric ton = 106 grams) Problem 3: The mass of the sun is 1.98 x 1033 grams. If a single proton has a mass of 1.6 x 10⁻²⁴ grams, how many protons are in the sun? Problem 4: The approximate volume of the visible universe (A sphere with a radius of about 14 billion light years) is 1.1 x 1031 cubic light-years. If a light-year equals 9.2 x 10¹⁷ centimeters, how many cubic centimeters does the visible universe occupy? Problem 5: A coronal mass ejection from the sun travels 1.5 x 10¹³ centimeters in 17 hours. What is its speed in kilometers per second? Problem 6: The NASA data archive at the Goddard Space Flight Center contains 25 terabytes of data from over 1000 science missions and investigations. (1 terabyte = 1015 bytes). How many CD-roms does this equal if the capacity of a CD-rom is about 6x108 bytes? How long would it take, in years, to transfer this data by a dial-up modem operating at 56,000 bits/second? (Note: one byte = 8 bits). Problem 7: Pluto is located at a distance of 5.9 x 10¹⁴ centimeters from Earth. At the speed of light (2.99 x 1010 cm/sec) how long does it take a light signal (or radio message) to travel to Pluto and return? Problem 8: The planet HD209458b, now known as Osiris, was discovered by astronomers in 1999 and is at a distance of 150 light-years (1 light-year = 9.2 x 10¹² kilometers). If an interstellar probe were sent to investigate this world up close, traveling at a maximum speed of 700 km/sec (about 10 times faster than our fastest spacecraft: Helios-1), how long would it take to reach Osiris?
Exploring Space Mathematics http://image.gsfc.nasa.gov/poetry

Teacher’s Guide Applications of Scientific Notation 9
Problem 1: The sun produces 3.9 x 1033 ergs per second of radiant energy. How much energy does it produce in one year (3.1 x 10⁷ seconds)? Answer: 3.9 x 1033 x 3.1 x 107 = 1.2 x 1041 ergs. Problem 2: One gram of matter converted into energy yields 3.0 x 10²⁰ ergs of energy. How many tons of matter in the sun is annihilated every second to produce its luminosity of 3.9 x 1033 ergs per second? (One metric ton = 106 grams). Answer: 3.9 x 1033/3.0 x 1020 = 1.3 x 10¹³ grams per second, or 1.3 x 10¹³/106 = 1.3 x 10⁵ metric tons of mass. Problem 3: The mass of the sun is 1.98 x 1033 grams. If a single proton has a mass of 1.6 x 10⁻²⁴ grams, how many protons are in the sun? Answer: 1.98x1033/1.6 x 10-24 = 1.2 x 1057 protons. Problem 4: The approximate volume of the visible universe (A sphere with a radius of about 14 billion light years) is 1.1 x 1031 cubic light-years. If a light-year equals 9.2 x 10¹⁷ centimeters, how many cubic centimeters does the visible universe occupy? Answer: 1 cubic light year = (9.2 x 10¹⁷)3 = 7.8 x 1053 cubic centimeters, so the universe contains 7.8 x 1053 x 1.1 x 1031
= 8.6 x 1084 cubic centimeters. Problem 5: A coronal mass ejection from the sun travels 1.5 x 10¹³ centimeters in 17 hours. What is its speed in kilometers per second? Answer: 1.5 x 10¹³ / (17 x 3.6 x 103 ) = 2.4 x108 cm/sec = 2,400 km/sec. Problem 6: The NASA data archive at the Goddard Space Flight Center contains 25 terabytes of data from over 1000 science missions and investigations. (1 terabyte = 1015 bytes). How many CD-roms does this equal if the capacity of a CD-rom is about 6x108 bytes? How long would it take, in years, to transfer this data by a dial-up modem operating at 56,000 bits/second? (Note: one byte = 8 bits). Answer: 2.5 x 10¹⁶ / 6x108 = 4.2 x 10⁷ Cdroms. It would take 2.5 x 10¹⁶/7,000 = 3.6 x 10¹² seconds or about 1.1 x 10⁵ years. Problem 7: Pluto is located at a distance of 5.9 x 10¹⁴ centimeters from Earth. At the speed of light (2.99 x 1010 cm/sec) how long does it take a light signal (or radio message) to travel to Pluto and return? Answer: 2 x 5.98 x 1014/2.99 x 1010 = 4.0 x 10⁴ seconds or 11 hours. Problem 8: The planet HD209458b, now known as Osiris, was discovered by astronomers in 1999 and is at a distance of 150 light-years (1 light-year = 9.2 x 10¹² kilometers). If an interstellar probe were sent to investigate this world up close, traveling at a maximum speed of 700 km/sec (about 10 times faster than our fastest spacecraft: Helios-1), how long would it take to reach Osiris? Answer: 150 x 9.2x 1012/700 = 1.9 x 10¹² seconds or about 64,000 years!
Exploring Space Mathematics http://image.gsfc.nasa.gov/poetry

10 Name ________________________________
The galaxy NGC-1232 was photographed by the ESA, Very Large Telescope in May, 2003. From resources at your library or the Internet, fill-in the following information: 1) Type of galaxy ---------- Number of arms ---------- 2) Name of galaxy cluster it is a member of -------- 3) Distance in parsecs and in light-years ---------- 4) Right Ascension ------- Declination------ 5) Constellation --------- 6) Diameter in light years ------ 7) Diameter in arcminutes ----- 8) Apparent visual magnitude ---------- From the photograph below, and an assumed diameter of 200,000 light years, answer these questions: 9) Diameter of nuclear region in light years --------------- 10) Average width of arms in light years ---------- 11) Average spacing between arms in light years-------- 12) Diameter of brightest star clusters (bright knots) in light years ------------ 13) Describe in 500 words why this galaxy is so interesting.
Exploring Space Mathematics http://image.gsfc.nasa.gov/poetry

1) Type of galaxy ---------- Spiral ‘Sc’ Number of arms ---------- About 5 2) Name of galaxy cluster it is a member of -------- Eridanus Galaxy Group 3) Distance in light-years ---------- 70 to 100 million Light-years
This question introduces students to the many different values that can be cited, especially on the internet. Earlier estimates (70 million) sometimes are given even though more recent estimates (100 million) are available. For research purposes, astronomers will always use the most current estimate and will state why they do so.
4) Right Ascension ------- 3h 9m 45s Declination------ -20d 34’ 5) Constellation ----- Eridanus 6) Diameter in light years ------ 100,000 light years (or 200,000 lightyears)
The diameter is based on the angular sized (which is fixed) and the distance (which depends on whether you use the 70 or 100 million light year estimate). At a distance of 100 million light years, the diameter is about 200,000 light years. At 70 million light years, the diameter is (70/100)*200,000 = 140,000 light years. Students may find articles where authors cite either 100,000 or 200,000 light years. This might be a good time to ask students which resources preferred one estimate over another, and why there is such uncertainty. How do astronomers measure the distances to galaxies?
7) Diameter in arcminutes ----- 7 arc minutes (moon is 30 arcminutes!) This is the diameter of the galaxy as you would see it in the sky from Earth. The moon is 30 arcminutes in diameter, so NGC-1232 is about ¼ the diameter of the full moon. Students may need to be reminded that there are 360 degrees in a full circle, and each degree consists of 60 minutes of arc.
8) Apparent visual magnitude ---------- +10.6 This is a measure of how bright the galaxy appears in the sky. The faintest stars you can see in a rural dark sky are about +6, while in an urban setting this limit is about +3. Because each magnitude corresponds to a brightness factor of 2.5, the galaxy is about 8 magnitudes fainter than the brightest star you can see in a city, or a factor of 2.5 x 2.5 x 2.5 x 2.5 x 2.5 x 2.5 x 2.5 x 2.5 = 1500 fainter.
From the photograph, and an assumed diameter of 200,000 light years, answer these questions: The diameter of the galaxy photograph is about 100 millimeters, so the scale of the photograph is 200,000 light years / 100 mm = 2,000 light years per millimeter. 9) Diameter of nuclear region. About 10 millimeters or 20,000 light years. 10) Average width of arms. Students will find that the arm widths near the nucleus are
narrower than in the more distant regions. They vary from about 4mm ( 8,000 light years) to 10 mm (20,000 light years).
11) Average spacing between arms. As for the arm widths, this can vary from 4mm (8,000 light years) to 25 mm ( 50,000 light years).
12) Diameter of brightest star clusters (bright knots). About 2 mm ( 4,000 light years). 13) Describe in 500 words why this galaxy is so interesting. Students may cite many
features, including its similarity to the Milky Way, the complexity of its arms, the many star clusters, the complexity and shape of the nuclear region.
Teacher’s Guide Exploring a Galaxy : NGC-1232 10
Exploring Space Mathematics http://image.gsfc.nasa.gov/poetry

11 Name ________________________________
The Doppler Shift is an important physical phenomenon that astronomers use to measure the speeds of distant stars and galaxies. When an ambulance approaches you, its siren seems to be pitched higher than normal, and as it passes and travels away from you, the pitch becomes lower. A careful measurement of the pitch change can let you determine the speed of the ambulance once you know the speed of the sound wave. A very similar method can be used when analyzing light waves from distant stars and galaxies. The basic formula for slow-speed motion (that is, speeds much slower than the speed of light) is:
The speed of the object in km/s can be found by measuring the wavelength of the signal that you observe (Wo), and knowing what the rest wavelength of the signal is (Wr), with wavelength measured in units of Angstroms (1.0 x 10⁻¹⁰ meters).
This is a small part of the spectrum of the Seyfert galaxy Q2125-431 in the constellation Microscopium. An astronomer has identified the spectral lines for Hydrogen Alpha (Wr = 6563 Angstroms), and Beta (Wr = 5007 Angstroms). Question 1: From the graph of the spectrum above, use you millimeter ruler to determine the scale of the figure in angstroms per millimeter. Question 2: What are the observed wavelengths of the Hydrogen-Alpha and Hydrogen-Beta lines? Question 3: What are the rest wavelengths of the Hydrogen-Alpha and Hydrogen-Beta lines? Question 4: If Wr is defined by your answers to question 3, and Wo is defined from your answers to question 2, what velocity do you calculate for each line from the formula above? Question 5: From your answer to question 4, what is the average of the two velocities? Question 6: Is the galaxy moving towards or away from the Milky Way? Explain.
Exploring Space Mathematics http://image.gsfc.nasa.gov/poetry

Teacher’s Guide The Speed of Galaxy Q2125-431 11
This figure was obtained from the paper “Naked Active Galactic Nuclei” by M. Hawkins, University of Edinburg, Scotland. (Astronomy and Astrophysics, 2004, vol. 424, p. 519)
This is a small part of the spectrum of the Seyfert galaxy Q2125-431 in the constellation Microscopium. An astronomer has identified the spectral lines for Hydrogen Alpha (Wr = 6563 Angstroms), and Beta (Wr = 5007 Angstroms). Question 1: From the graph of the spectrum, use you millimeter ruler to determine the scale of the figure in angstroms per millimeter. Answer: On the Student’s page, the wavelength scale from 4000 to 7000 Angstroms measures 100 millimeters, so the scale is (7000-4000)/100 = 30 Angstroms/mm. Question 2: What are the observed wavelengths of the Hydrogen-Alpha and Hydrogen-Beta lines? Answer: Alpha: 7000 A + 30 x (11.5mm) = 7345 A. Beta: 5000 A + 30 x (14.5 mm) = 5435 A. Question 3: What are the rest wavelengths of the Hydrogen-Alpha and Hydrogen-Beta lines? Answer: Alpha = 6563 Angstroms; Beta = 5007 Angstroms. Question 4: If Wr is defined by your answers to Question 3, and Wo is defined from your answers to question 2, what velocity do you calculate for each line from the formula above? Answer: For the Alpha line; Wr=6563 A, Wo = 7345 A. so from the formula Speed = 299792 x (7345-6563)/6563 = 35721 km/s. For the Beta line: Wr = 5007 A, Wo = 5435 A. so Speed = 299792 x (5435-5007)/5007 = 25626 km/s. Question 5: From your answer to Question 4, what is the average of the two velocities? Answer: (35721 + 25626)/2 = 30,700 km/s. Note to Teacher: Because it is hard to measure the wavelengths of these lines to less than 1 mm accuracy, the line wavelengths will be uncertain to about 30 Angstroms. This works out to a speed uncertainty of 299792 x (30/5007) = 1,800 km/sec. The actual difference in the two speeds is 35721-25626 = 10,095 km/sec which is much higher than the measurement uncertainty, and may mean that the regions of gas producing the H-Alpha and H-Beta emission are not moving at the same speeds within the galaxy. Question 6: Is the galaxy moving towards or away from the Milky Way? Explain. Answer: Because the observed wavelength of each line is LONGER then the wavelength for the gas at rest, the source is moving away from the observer (just as the pitch of an ambulance siren is lower as it moves away from you).
Exploring Space Mathematics http://image.gsfc.nasa.gov/poetry

12 Name ________________________________
This is the Pleiades star cluster. From resources at your library or the Internet, fill-in the following information: 1) Type of cluster ---------- Number of stars ---------- 2) Alternate Names ----- 3) Distance in light-years ---------- 4) Right Ascension ------- Declination------ 5) Constellation --------- 6) Diameter in light years ------ 7) Diameter in arcminutes ----- 8) Apparent visual magnitude ---------- 9) How old is the star cluster? ----------- 10) What kinds of stars can you find in the cluster? ------ 11) What are some of the names of the stars? -------- From the photograph below, and the cluster’s diameter light years, answer these questions: 12) How many stars are probably members of the cluster? -------- 13) What is the average distance between the brightest stars? ----- 14) What is the typical distance between the stars you counted in question 12? ------ 15) Why do the stars have spikes? -------- 16) Describe in 500 words why this star cluster is so interesting.
Exploring Space Mathematics http://image.gsfc.nasa.gov/poetry

1) Type of cluster ---------- Open, Galactic Cluster Number of stars ----------500 2) Alternate Names -------- Seven Sisters; Messier-45 3) Distance in light-years ---------- 425 light years. 4) Right Ascension ------- 3h 47m Declination------ +24d 00’ 5) Constellation --------- Taurus 6) Diameter in light years ------ About 12 light years. 7) Diameter in arcminutes ----- 110’ or about 3 times the diameter of the full moon! 8) Apparent visual magnitude ---------- Between +5 and +6. 9) How old is the star cluster? ----------- About 100 million years. 10) What kinds of stars can you find in the cluster? – Mostly type-B main sequence 11) What are some of the names of the stars? Pleione, Atlas, Merope, Alcyone,
Electra, Maia, Asterope, Taygeta, Celeano. From the photograph below, and the cluster’s diameter light years, the size of the cluster is about 120 mm which equals 12 light years for a scale of 10 millimeters to one light year. 12) How many stars in the photo are probably members of the cluster?
Students should notice that there is a distinct gap between the bright stars and the faint stars in the photo. The faint stars are mostly background stars in the Milky Way unrelated to the cluster. By squinting at the photo, students should be able to find about 100-120 stars.
13) What is the average distance between the brightest stars? ----- The seven bright stars are about 25 mm or 2.5 light years apart.
14) What is the typical distance between the stars you counted in question 12? – With a millimeter ruler, students can measure the spaces between a few dozen stars in the picture and find an average, or they can squint at the picture and use their ruler to estimate the answer. Answers between 5 and 10 mm are acceptable and equal 0.5 to 1 light year.
15) Why do the stars have spikes? -- Students may need to investigate this question by using books or the web. Generally, reflecting telescopes produce stellar spikes because the secondary mirror diffracts some of the starlight. The spikes are the four ‘legs’ used to support the smaller mirror inside the telescope. Refractors do not have spikes and produce round images. In no case do the round images suggest that the star is actually being resolved.
16) Describe in 500 words why this star cluster is so interesting.
Students will find many items on the web to form the basis for their essay including: The Pleiades cluster has a long history in mythology. There are many names for this cluster throughout many civilizations and languages. Astronomically, it is the closest open cluster to the sun. It is very young, and contains many stars that are 100 to 1000 times more luminous than the sun. This cluster will eventually fade away in about 250 million years as its brightest stars evolve and die. The cluster still contains the gas left over from its formation, which can be seen as the nebula surrounding the six brightest stars.
Teacher’s Guide Star clusters up close 12
Exploring Space Mathematics http://image.gsfc.nasa.gov/poetry

13 Name ________________________________
In 2004, astronomer Immo Appenzeller and his colleagues from Germany and the United States used the FORS camera at the ESA-VLT observatory in Chile to create a Deep Field image of a small piece of the sky. The goal of this research was to find the most distant, and therefore youngest, galaxies possible so that they could study how the earliest generations of stars in the universe were formed. They obtained the photograph below, and the redshifts are noted for some of the galaxies they were later able to identify and obtain spectra. (http://www.lsw.uni-heidelberg.de/users/jheidt/fdf/pics/pics.html).
Question 1: The numbers indicate the redshifts of the galaxies identified in the field. What does the histogram of the redshifts look like if you bin the number of galaxies at intervals of 0.5 in Z? Question 2: What is the largest redshift seen for any galaxy in this field? What is the smallest? What is the average redshift? What are the mode and median redshifts? Question 3: Use the redshift calculator at http://sa1.star.uclan.ac.uk/~cph/redshift.html to determine the time into the past (look-back time) that each galaxy image represents. For instance, the look-back time for our sun is 8.5 minutes, and the nearest star is 4.3 years. Use Omega-M = 0.3 and Lambda =0.7 with H0 = 71 km/sec/mpc which are the parameters that define our universe. Calculate from your answers to Question 2 the corresponding look-back times. Note that at 13.7 billion years, you are looking back to the formation of the universe in the Big Bang. Question 4: Our best model for the universe indicates an age of 13.7 billion years. What is the longest look-back time you found for a galaxy in Question 3? How long after the Big Bang did this galaxy form?
Exploring Space Mathematics http://image.gsfc.nasa.gov/poetry

Teacher’s Guide A Glimpse of the Most Distant Galaxy 13
Question 1: The numbers indicate the redshifts of the galaxies identified in the field. What does the histogram of the redshifts look like if you bin the number of galaxies at intervals of 0.5 in Z? Answer: Count the number of galaxies in each interval of Z, and plot the histogram (bar graph). Z Number of galaxies -------------------------------------------------------
0.0 < Z < 0.5 6 0.5 < Z < 1.0 15 1.0 < Z < 1.5 8 1.5 < Z < 2.0 3 2.0 < Z < 2.5 3 2.5 < Z < 3.0 3 3.0 < Z < 3.5 2 3.5 < Z < 4.0 2 4.0 < Z < 4.5 3 4.5 < Z < 5.0 4 5.0 < Z < 5.5 1
Question 2: What is the largest redshift seen for any galaxy in this field? What is the smallest? What is the average redshift? What are the mode and median redshifts? Answer: Largest redshift z= 5.16. Smallest redshift z= 0.30. Question 3: Use the redshift calculator at http://sa1.star.uclan.ac.uk/~cph/redshift.html to determine the time into the past (look-back time) that each galaxy image represents. For instance, the look-back time for our sun is 8.5 minutes, and the nearest star is 4.3 years. Use Omega-M = 0.3 and Lambda-=0.7 with H0 = 71 km/sec/mpc to represent our universe. Calculate from your answers to Question 2 the corresponding look-back times. Note that at 13.7 billion years, you are looking back to the formation of the universe in the Big Bang. Answer: Largest redshift of z=5.16 yields a look-back time of 12.2 billion years. Smallest redshift z=0.30 yields a look-back time of 3.4 billion years. Question 4: Our best model for the universe indicates an age of 13.7 billion years. What is the longest look-back time you found for a galaxy in Question 3? How long after the Big Bang did this galaxy form? Answer: The longest look-back time was 12.2 billion years. This galaxy would have formed about 13.7-12.2 = 1.5 billion years after the Big Bang. Note to Teacher. The age of our Milky Way galaxy is between 12.0 and 12.8 billion years, so this distant galaxy formed about the same time as the Milky Way did. The age of our Earth, 4.5 billion years, and the light we are seeing from galaxies with a redshift of Z = 0.45 is about this old! Astronomers use the redshift and light travel age interchangeably. Teachers: Have your students play with the online redshift calculator by trying different universes than our own (values for Lambda, Omega and Hubble constant) and see how a galaxy’s estimated distance and look-back time depends on the kind of universe model you select. This is why, according to general relativity, you cannot determine distances INDEPENDENTLY of first assuming a geometry for the universe.
Exploring Space Mathematics http://image.gsfc.nasa.gov/poetry

14 Name ________________________________
The sun is our nearest star. From Earth we can see its surface in great detail. The images below were taken with the 1-meter Swedish Vacuum Telescope on the island of La Palma, by astronomers at the Royal Swedish Academy of Sciences (http://www.astro.su.se/groups/solar/solar.html). The image to the right is a view of sunspots on July 15, 2002. The enlarged view to the left shows never-before seen details near the ‘penumbral’ edge of the largest spot. Use a millimeter ruler and the fact that the dimensions of the left image are 19,300 km x 29,500 km to determine the scale of the photograph, and then answer the questions.
Question 1 - What is the scale of the image in km/mm? Question 2 – What is the smallest feature you can see in the image? Question 3 – What is the average size of a Solar Granulation region? Question 4 – How long and wide are the Dark Filaments? Question 5 – How large are the Bright Spots? Question 6 – Draw a circle centered on this picture that is the size of Earth (radius = 6,378 km). How big are the features you measured compared to familiar Earth features?
Solar Granulation
Dark Filament Bright Spot Granulation Boundary
Exploring Space Mathematics http://image.gsfc.nasa.gov/poetry

Teacher’s Guide Solar Surface Details 14
Question 1 - What is the scale of the image in km/mm? Answer: the image is about 108mm x 164mm so the scale is 19300/108 = 179 km/mm. Question 2 – What is the smallest feature you can see in the image? Answer: Students should be able to find features, such as the Granulation Boundaries, that are only 0.5 mm across, or 0.5 x 179 = 90 km across. Question 3 – What is the average size of a Solar Granulation region? Answer: Students should measure several of the granulation regions. They are easier to see if you hold the image at arms length. Typical sizes are about 5 mm so that 5 x 179 is about 900 km across. Question 4 – How long and wide are the Dark Filaments? Answer: Students should average together several measurements. Typical dimensions will be about 20mm x 2mm or 3,600 km long and about 360 km wide. Question 5 – How large are the Bright Spots? Answer: Students should average several measurements and obtain values near 1 mm, for a size of about 180 km across. Question 6 – Draw a circle centered on this picture that is the size of Earth (radius = 6,378 km). How big are the features you measured compared to familiar Earth features? Answer: See below.
Granulation Region – Size of a large US state.
Bright Spot – Size of a small US state or
Hawaii Filament – As long as the USA, and as
narrow as Baja California or Florida.
Exploring Space Mathematics http://image.gsfc.nasa.gov/poetry

15 Name ________________________________
The Sombrero Galaxy (a.k.a Messier-104 and NGC-4594) is an elliptical galaxy located 28 million light years from the Milky Way in the direction of the constellation Virgo, and contains over 800 billion stars. It is the most massive galaxy in the Virgo Cluster, which itself contains over 2,000 galaxies spanning a volume of space 10 million light years in diameter. M-104 is about the same age as the Milky Way (10-13 billion years), but instead of only having about 130 globular clusters, M-104 has about 2,000; each cluster contains about 100,000 stars. Its diameter is about 50,000 light years. The infrared and optical photographs below were taken with the Spitzer Infrared Telescope (main) and the Hubble Space Telescope (inset). The optical image shows mainly the locations of stars (whitish haze) and absorption of starlight by the dust disk. The infrared image shows mainly the dust (colored red) heated by starlight (colored blue), and can penetrate deeper into the interior of a galaxy that visible light.
Question 1 – What is the scale of the image in light years per millimeter? Question 2 – What is the radius of the stellar (blue) component to the galaxy in light years? Question 3 – What is the inner and outer radius of the ring of dust in light years? Question 4 - What is the thickness of the dust disk in light years? Question 5 – What is the radius of the faint inner disk in light years? Question 6 – What is the diameter of the bright nuclear core containing the black hole? Question 7 – How many globular star clusters (the star-like spots) can you count in this image? Question 8 - How big, in light years, is the smallest dust cloud you can see in the outer disk? Question 9 – Compare the infrared and optical photographs, and describe their similarities and differences.
Why would an astronomer want to study the infrared photograph?
Exploring Space Mathematics http://image.gsfc.nasa.gov/poetry

Teacher’s Guide A Galaxy Up Close 15
You can obtain much higher resolution (and gorgeous!!!) images of M-104 from the Spitzer website http://www.spitzer.caltech.edu/Media/releases/ssc2005-11/release.shtml and from Hubble website http://hubblesite.org/newscenter/newsdesk/archive/releases/2003/28/image/a The following answers are relevant to the large ‘Spitzer’ image. Note, the smallest detail you can reliably measure with a millimeter ruler will be about 0.5 mm or 330x0.5 = 160 light years across. The above, enlarged photos will let you see features less than 50 light years (about 2 image pixels) across. Question 1 – What is the scale of the image in light years per millimeter? Answer: Galaxy diameter 50,000 lys = 150 mm so the scale is about 330 light years per millimeter. Question 2 – What is the radius of the stellar (blue) component to the galaxy in light years? Answer: Depending on the quality of your laser printer, the distance from center to the outer edge of the blue haze (stars!!) will be about 40 to 60 mm, for a radius of 40x330 = 13,000 ly to 60x330 = 19,800 light years. The distance from our sun to the center of the Milky Way is about 25,000 light years. Question 3 – What is the inner and outer radius of the ring of dust in light years? Answer: The inner radius is about 45mm or 15,000 light years. The outer radius is about 70mm or 23,000 light years. Question 4 - What is the thickness of the dust disk in light years? Answer: The thickness of the dust disk can be estimated from the smallest width of the ring which is near the center of the picture. This width is about 3 mm or 1,000 light years. This is similar to the width of the disk of the Milky Way. Question 5 – What is the radius of the faint inner disk in light years? Answer: It may be difficult to see this inner disk depending on the quality of the photocopy. Its radius is about 25 mm or 8,000 light years. Question 6 – What is the diameter of the bright nuclear core containing the black hole? Answer: This is the star-like bright spot at the center of the Spitzer image. It is about 3 mm in diameter or 1,000 light years across. This is similar to the inner core region of our Milky Way which also contains a massive black hole. In both cases, the black hole size is 0.0001 light years and cannot be seen in photographs like this. Question 7 – How many globular star clusters can you count in this image? Answer: This may depend on the quality of the photocopy. Students should count all the star-like spots in the photo that are ‘faint’. There are a few bright stars in the field, like the one in the lower right corner. Answers may range from 100 to 300. More can be seen in higher quality data. Question 8 - How big, in light years, is the smallest dust cloud you can see in the outer disk? Answer: Look in the dust ring and find the smallest ‘blob’. You should be able to see interstellar clouds only 0.5 millimeters across or 160 light years. As a comparison, the Orion Nebula is about 40 light years across. Question 9 – Compare the infrared and optical photographs, and describe their similarities and differences. Why would an astronomer want to study the infrared photograph? Answer: Both show stars, but the infrared image shows the dust ring more clearly, including a clearer view of the core region and inner disk. The optical photo shows the globular star clusters more clearly, and also the details inside the dust ring, which appear black. Astronomers would want the infrared photo because it lets them see more details in the dust clouds, especially when looking deep inside a galaxy where the stars would usually ‘white out’ the entire field and hide these details. Optical instruments can resolve finer details, so these images give better views of star clusters and the outsides of dust clouds.
Exploring Space Mathematics http://image.gsfc.nasa.gov/poetry

16 Name ________________________________
Astronomers have catalogued and determined orbits for 30,000 minor planets in the solar system (asteroids, comets etc). Over 150,000 bodies larger than a few hundred meters across have been spotted and remain to have their orbits exactly determined. Below is a plot made on November 30, 2005 of the locations of all known objects (white dots) within the orbit of Mars whose path skirts the inner edge of the asteroid belt (green dots).
Question 1 – How many minor planets are located inside the orbit of Mercury? Venus? Earth? Mars? Question 2 – If the radius of Earth’s orbit is 150 million km, what is the scale of this figure in millions of km per millimeter? Question 3 – About how far apart are the minor planets from each other on this particular day? Would they be a hazard for space travel? Question 4 – How many asteroids crossed Earth’s orbit on November 30, 2005?
Exploring Space Mathematics http://image.gsfc.nasa.gov/poetry

Teacher’s Guide Asteroids Between Mars and the Sun 16
The plot of the minor planets was obtained from the IAU, Minor Planets Center (http://cfa-www.harvard.edu/iau/lists/InnerPlot2.html). It shows the location of the known asteroids, comets and other ‘minor planets’ for November 30, 2005. The plot shows the orbits of Mercury, Venus, Earth and Mars. Objects that have parahelias (closest orbit location to the sun) less than 1.3 AU are shown in white circles. More details can be found at http://www.space.com/scienceastronomy/solarsystem/asteroid_toomany_011019-1.html Question 1 – How many minor planets are located inside the orbit of Mercury? Venus? Earth? Mars? Answer: Students should count the plotted symbols within (or on) the first inner ring (Mercury’s orbit) and get 13 symbols ( don’t include the sun!). For the space between Venus and Mercury, I count 119 spots which makes the total 132 minor planets inside the orbit of Venus. Between Earth and Venus there are about 280 for a total of 412 minor planets inside Earth’s orbit. Between Mars and Earth, a careful student may be able to count about 833 which means there are 833+412 = 1245 minor planets inside the orbit of Mars. Question 2 – What is the scale of this figure in millions of km per millimeter? Answer: The radius of Earth’s orbit is 150 million kilometers, which corresponds to 70 millimeters, so the scale is 2.1 million km per millimeter. Question 3 – About how far apart are the minor planets from each other on this particular day? Would they be a hazard for space travel? Answer: Although the asteroids are only plotted as though they are located in the same 2-D plane, we can estimate from the average ‘eyeball’ separation between asteroids of about 2 millimeters, that they are about 4.2 million kilometers apart. A spacecraft would not collide with a typical asteroid unless it was directed to specifically target an asteroid for investigation…or impact. It is a popular myth about space travel that astronauts have to dodge asteroids when traveling to Mars or the outer solar system. Interplanetary dust grains and micro-meteoroids are, however, a much bigger hazard!! Question 4 – How many asteroids crossed Earth’s orbit on November 30, 2005? Answer: Just count the number of white spots that touch the line that represents the orbit of Earth. There are about 70 spots that touch the orbit line. Could the Earth collide with them? Each dot is about 1 mm in radius, so this represents a distance of 2 million kilometers. Since Earth is only 12,000 km across and a typical asteroid is only 1 km across, collision is extremely unlikely even when the diagram seems to show otherwise. There is another way that this diagram makes the situation look worse than it is. Because the asteroid orbits can be several million miles above or below the orbit of Earth as the asteroids cross this location, there are very few close calls between Earth and any given asteroid in the current catalog. Astronomers call the ones that get close ‘Near-Earth Asteroids’ and there are about 700 of these known. Only one of these known NEAs may get close enough to Earth in the next 30 years to be a potential collision problem, but astronomers are still finding dozens more NEAs every year.
Exploring Space Mathematics http://image.gsfc.nasa.gov/poetry

17 Name ________________________________
Dr Michael Brown, of the California Institute of Technology, and the team who discovered the new solar system planet Eris, formerly nicknamed it Xena, after the warrior played by New Zealand actor Lucy Lawless in the TV series, "because we always wanted to name something Xena". The International Astronomical Union officially named this remote object Eris since it is considered bad taste to name a celestial body after a TV cult figure. Also, Pluto had been demoted by the IAU to the status of the largest-known dwarf planet, but with the discovery of Eris, it has been further demoted to the second-largest dwarf planet!
The new planet is incredibly cold. On a good day, it might reach a sweltering minus-240 Centigrade. At a distance of 97 Astronomical Units, its year is about 560 Earth years long. Eris is in a highly elliptical orbit inclined about 45 degrees from the main plane of our Solar System. Currently it’s near aphelion at some 9 billion miles from the center of the Solar System. Its perihelion distance is 38 A.U., or some 3.5 billion miles, during a 557-year orbit. By contrast, Pluto’s average distance from the Sun is just 39 A.U., or 3.6 billion miles, and it orbits in just 248.5 years. The new world is thought to be about 2,800 miles in diameter, roughly 1.5 times as large as Pluto. Infrared observations indicate that, like Pluto, it has methane ice on its surface. Like Pluto, the new planet is a member of the Kuiper Belt, a swarm of icy bodies beyond Neptune in orbit around the sun. The discovery of a moon officially named Dysnomia means Eris has at least enough mass to keep a satellite. Dysnomia is estimated to orbit close to Eris, making a circuit perhaps every 14 days. The picture below shows this new planet and its estimated orbit, and is courtesy John Chumak at the DIRAS Observatory.
Diagram showing orbits of Pluto and Eris (red) and Jupiter, Saturn, Uranus, Neptine (black)
Define the terms highlighted in the article above. Question 1 – How are planets and other astronomical objects named? Question 2 – How many different definitions for a planet can you find in textbooks or on the internet? Question 3: What have astronomers now done to re-classify the planets in our solar system?
Exploring Space Mathematics http://image.gsfc.nasa.gov/poetry

Teacher’s Guide Exploring the Dwarf Planet Eris 17
Define the terms highlighted in the article. International Astronomical Union – An official community of astronomers who make decisions about naming stars, planets and features on planets and satellites, and who also organize international research programs in astronomy. Astronomical Unit – The distance from Earth to the Sun defined as 1.00 but equal to 149 million kilometers. elliptical orbit – The path that a planet or other small body takes as it orbits the sun. main plane – The orbits of the planets are located very close to an imaginary plane that slices the sun in half along its equator. This is the main or ‘principal’ plane of the solar system. aphelion – A body’s farthest distance from the sun. perihelion – A body’s closest distance to the sun. methane ice – Methane is normally found in a gaseous state on Earth, but when cooled to below -182 Centigrade, it freezes into ice form. Kuiper Belt – A large population of small to planet-sized bodies orbiting the sun at distances beyond the orbit of Neptune. planet – A large body at least as big as Pluto, that orbits its star, that was formed soon after its star out of the same primordial material, and that is not found within regions where ‘rubble’ currently exists ( i.e. asteroid belt or Kuiper Belt). Question 1 – How are planets and other astronomical objects named? Answer: IAU rules specify themes for naming planetoids: for example, all planetoids in Pluto-like orbits ("plutinos") are to be named after creation deities (such as 50000 Quaoar, named after the god Quaoar of the Native American Tongva people, and 90377 Sedna, named after the god Sedna in Inuit mythology). Under IAU rules, all asteroid names must be no more than 18 letters long and preferably one word (like 5535 Annefrank). Military and political leaders must be dead for over 100 years before their names can be used. Question 2 – How many different definitions for a planet can you find in textbooks or on the internet? Sample answers may include: 1- Orbits the sun as an independent body 2- Shines only by reflected sunlight. 3- Is larger than the smallest established planet: Pluto 4- Orbits the sun in the same orbital plane as the other planets. Question 3 – What have astronomers now done to re-classify the planets in our solar system? Answer: Students can research this question online. They will need to state the new definition for a planet and a dwarf planet, and recognize that as of 2005 there are now only 8 officially defined planets in our solar system, Pluto and objects similar to it in the outer solar system, are now defined to be Dwarf Planets in a separate and rapidly growing category that includes Quaoar, Sedna, and now Eris.
Exploring Space Mathematics http://image.gsfc.nasa.gov/poetry

18 Name ________________________________
In 1961, astronomer Frank Drake devised an ingenious equation that has helped generations of scientists estimate how many intelligent civilizations may exist in the Milky Way. The ‘Drake Equation’ looks like this: N = S x P x E x C x I x A x L Where: S = Number of stars in the Milky Way P = Fraction of stars with planets E = Number of planets per star in the right temperature zone C = Fraction of planets in E actually able to support life I = Fraction of planets in C where intelligent life evolves A = Fraction of planets in I that communicate with radio wave technology L = Fraction of a stars lifetime when communicating civilization exists
On Earth, bacteria have existed for nearly 4 billion years. Insects for 500 million years. Modern humans for 20,000 years. Which lifeform is the most likely to be found on a distant planet?
Known values: S = 500 billion P = 0.1 For our solar system: E = 2 (Earth and Mars) C = 0.5 (Earth) I = 1.0 (Earth) A = 1.0 (Earth) L = 0.00000002 (100 yrs/4.5 billion yrs)
The great challenge is to determine from direct or indirect measurements what each of these factors might be. Fortunately, there are at least a few of these factors that we have pretty good ideas about, especially for our own planet. The estimate based on the solar system as a model is the sum of the products in the sample table N = 500 billion x 0.1 x 2 x 0.5 x 1.0 x 1.0 x 0.00000002 = 1000 civilizations existing right now. Question 1: Based on your internet research, what do you think are the possible ranges for the factors P, E, and C? Remember to cite your sources and use only primary sources by astronomers or other scientists, not opinions by non-scientists. Question 2: Which factors are the most uncertain and why? Question 3: What kinds of astronomical observations might help decide what the values for E and C? Question 4: Using the evolution of life on Earth as a guide, what could you conclude about I? What is the most likely form of life in the Milky Way? Question 5: How would you try to estimate A using a radio telescope? Question 6: What would the situation have to be for the value of L to be 0.000002 or 0.000000002? Question 7: Using the Drake Equation, and a Milky Way in which 1 million intelligent civilizations exist, work backwards to create a ‘typical’ scenario for each factor so that a) N = 1 million. B) N = 1. Make sure you can defend your choices of the different factors.
Exploring Space Mathematics http://image.gsfc.nasa.gov/poetry

Teacher’s Guide Searching for Company in the Universe 18
Question 1: Based on your internet research, what do you think are the possible ranges for the factors P, E, and C? Answer: Students may cite the following approximate ranges, or plausible variations after providing the appropriate bibliographic reference: P probably between 1% and 10% based on local planet surveys; E between 1 and 3 based on planet surveys and our own solar system; C between 0.1 and 0.5; Question 2: Which factors are the most uncertain and why? Answer: I , A and L. These depend on the details of evolution on non-Earth planets and it is basically anyone’s guess what these numbers might be. Students may consult various internet resources or essays on the Drake Equation to get an idea of what ranges are the most talked about. Question 3: What kinds of astronomical observations might help decide what the values for E and C? Answer: Our best tool is to conduct surveys of nearby stars and attempt to detect earth-sized planets, not the much larger Jupiter-sized bodies that astronomers currently study. Question 4: Using the evolution of life on Earth as a guide, what could you conclude about I? What is the most likely form of life in the Milky Way? Answer: Bacteria were the first life forms on Earth and have survived for nearly 4 billion years. Statistically, they should be the most common life forms in the universe. Also, alien life forms are much more likely to be simple rather than complex. This is favored by the distribution of life on Earth, in which there are very few complex organisms compared to simple ones, especially if you rank them by the total mass of the species and use this to set probabilities. For example, for every billion pounds of bacteria, there are perhaps only 1 thousand pounds of species larger and more complex than insects. Question 5: How would you try to estimate A using a radio telescope? Answer, by measuring the radio output of thousands of stars every year and looking for signs of intelligent ‘modulation’ like a morse-code signal. Stars don’t normally emit radio signals that vary in a precise way in time. The SETI program is continuing to conduct these kinds of surveys. Question 6: What would the situation have to be for the value of L to be 0.000002 or 0.000000002? Answer: A star like the sun lives for about 10 billion years. L would then be 10 billion x 0.000002 = 20,000 years or as little as 10 billion x 0.000000002 = 20 years. In the first case, a civilization has learned to survive its technological ‘Childhood’ and prosper. In the second case, the civilization may have perished after learning how to use radio technology, or it may still be a thriving civilization that no longer uses radio communication. Question 7: Using the Drake Equation, and a Milky Way in which 1 million intelligent civilizations exist, work backwards to create a ‘typical’ scenario for each factor so that a) N = 1 million. B) N = 1. Answer: This will depend on the values that students assign to the various factors. Make sure that each student can defend their choice. This may also be opened to class discussion as a wrap-up.
Exploring Space Mathematics http://image.gsfc.nasa.gov/poetry

19 Name ________________________________
One of the earliest methods used by astronomers to study the Milky Way galaxy was to count stars. They would photograph a particular piece of the sky, and count the number of stars they found in a range of apparent magnitude bins. From these ‘star gauging’ histograms across the sky, they created mathematical models of the shape of the Milky Way that fit the collection of histograms. In this activity, you will learn how to construct a histogram for the stars in a star field, bin them according to their apparent magnitude, and answer a few questions.
Compare the size of each star in the chart with the legend using a millimeter ruler. Count the number of stars with the same magnitude, entering them in the table below.
Magnitude Tally Total
+0.0
+1.0
+2.0
+3.0
+4.0
+5.0
+6.0
+7.0
From the tabulated data, construct a histogram of the number of stars in each magnitude bin, versus the apparent magnitude of the star. Question 1) How many stars are there in the Draco Field that are fainter than apparent magnitude +0.0? Question 2) The area of the Draco Field is 17 degrees x 20 degrees. How many square degrees does the field cover? Question 3) If the total area of the sky is 41,266 square degrees, about how many stars are there in the sky brighter than magnitude +7.0? Question 4) Using the histogram, what would you predict as the number of stars with a magnitude of +8.0? +9.0? Question 5) From your answer to Question 4, how many stars are there in the sky brighter than magnitude +8.0?
Exploring Space Mathematics http://image.gsfc.nasa.gov/poetry

0
20
40
60
80
100
120
1 2 3 4 5 6 7 8 9 10
Magnitude
Num
ber
of S
tars
Teacher’s Guide Counting the Stars in Draco 19
Question 1) How many stars are there in the Draco Field that are fainter than apparent magnitude 0.0? Answer: Add the histogram bins for all of the magnitudes to get 6+8+23+5+7+23+22 = 139 stars in the Draco Field. Note, counting is a statistical process so have students average their numbers for each bin to get a ‘class average’ histogram. This also teaches students about averaging, and observer biases. Question 2) The area of the Draco Field is 17 degrees x 20 degrees. How many square degrees does the field cover? Answer: The Draco Field covers an area of 340 square degrees.
Magnitude Tally Total
0.0
0 0
1.0
I I I I I I 6
2.0 I I I I I I I I 8
3.0 I I I I I I I I I I I I I I I I I I I I I I I
23
4.0
I I I I I 5
5.0
I I I I I I I 7
6.0
I I I I I I I I I I I I I I I I I I I I I I I
23
7.0
I I I I I I I I I I I I I I I I I I I I I I
22
Question 3) If the total area of the sky is 41,266 square degrees, about how many stars are there in the sky brighter than magnitude 7.0? Answer: There are 41,266/340 = 121.4 patches of the size of the Draco Field across the sky, so if the Draco star counts are typical of all these patches, there are 121.4 x 139 stars = 2,306 stars. Note: This is smaller that the commonly cited 6,000 stars because the Draco Field actually has fewer stars than the average sky patch. Question 4) Using the histogram, what would you predict as the number of stars with a magnitude of +8.0? +9.0? Answer: Each student will extrapolate the trend seen in the bins in a slightly different way. There would be, perhaps 50, +8.0 stars and 100, +9.0 stars. The trend should be that there is a rapid increase in the number of faint stars. Question 5) From your answer to Question 4, how many stars are there in the sky brighter than magnitude +9.0? Answer: Add up the estimate for the stars in the +8.0 and +9.0 bins to your answer to Question 1. Typical answers might be about 250 brighter than +9.0. Based on the answer to question 4, you can estimate about 121.4 x 250 or about 30,000 stars. This estimate will vary depending on how students decide to extrapolate the histogram from apparent magnitudes +5.0 to +6.0 to predict the fainter bin values.
Exploring Space Mathematics http://image.gsfc.nasa.gov/poetry

20 Name ________________________________
Why are many astronomical bodies round? Here is an activity in which you use astronomical photographs of various solar system bodies, and determine how big a body has to be before it starts to look round. Can you figure out what it is that makes a body round?
The images show the shapes of various astronomical bodies, and their sizes: Dione (560 km), Hyperion (205 x 130 km), Tethys (530 km), Amalthea (130 x 85 km), Ida (56 x 24 km), Phobos (14 x 11 km). Question 1) How would you define the roundness of a body? Question 2) How would you use your definition of roundness to order these objects from less round to round? Question 3) Can you create from your definition a number that represents the roundness of the object? Question 4) On a plot, can you compare the number you defined in Question 3 with the average size of the body? Question 5) Can you use your plot to estimate the minimum size that a body has to be in order for it to be noticeably round? Does it depend on whether the body is mostly made of ice, or mostly of rock?
Exploring Space Mathematics http://image.gsfc.nasa.gov/poetry

Teacher’s Guide Astronomy in the round 20 The images show the shapes of various astronomical bodies, and their sizes: Dione (560 km), Hyperion (205 x 130 km), Tethys (530 km), Amalthea (130 x 85 km), Ida (56 x 24 km), Phobos (14 x 11 km). Question 1) How would you define the roundness of a body? Answer: Students may explore such possibilities as the difference between the longest and shortest dimension of the object; the ratio of the longest to the shortest diameter; or other numerical possibilities.
Question 2) How would you use your definition of roundness to order these objects from less round to round? Answer. The order should look something like Ida, Amalthea, Hyperion, Phobos, Tethys and Dione. Question 3) Can you create from your definition a number that represents the roundness of the object? Answer: If we select the ratio of the major to minor axis length, for example, we would get Dione = 1.0; Hyperion = 1.6; Tethys=1.0; Amalthea=1.5; Ida = 2.3 and Phobos = 1.3 Question 4) On a plot, can you compare the number you defined in Question 3 with the average size of the body? Answer: See plot below for the numerical definition selected in Question 3. We have used the average size of each irregular body defined as (L + S)/2. so Hyperion = (205+130)/2 = 167 km; Amalthea = (130+85)/2 = 107 km; Ida = (56+24)/2 = 40 km; Phobos = (14+11)/2 = 13 km. Question 5) Can you use your plot to estimate the minimum size that a body has to be in order for it to be noticeably round? Does it depend on whether the body is mostly made of ice, or mostly of rock? Answer: By connecting a smooth curve through the points (you can do this by eye), the data suggests that a body becomes noticeably round when it is at a size between 200-400 km. Students can obtain pictures of other bodies in the solar system and see if they can fill-in the plot better with small moons of the outer planets, asteroids (Ceres, etc) or even comet nuclei. Note, inner solar system bodies are mostly rock. Outer solar system bodies are mostly ice, so students might notice that by labeling the points as ‘rocky bodies’ or ‘icy bodies’ that they may see two different trends because ice is more pliable than rock. Students should investigate what the size (mass) has to do with roundness, and see that larger bodies have more gravity to deform their substance with.
0
100
200
300
400
500
600
0 0.5 1 1.5 2 2
Roundness Ratio
Size
(km
)
.5
Exploring Space Mathematics http://image.gsfc.nasa.gov/poetry

21 Name ________________________________
In ca 130 BC, Hipparchos created the first detailed star catalog of thousands of naked-eye stars. He ranked them according to their brightness with the brightest being assigned the First Rank, the next brightest the Second Rank, and so on. Today, astronomers use this same brightness scaling for stars which they call the apparent magnitude scale. As it turns out, the human eye can discern a brightness change of 2.5122-times, and that is why the star brightness rankings have such a specific pattern. For example, a star with a magnitude of +2.0 is 2.51 times brighter than a star of magnitude +3.0. The difference in brightness between a +6.0 magnitude star and a +3.0 star is 3.0 magnitudes, which corresponds to a brightness change of 2.512 x 2.512 x 2.512 = 15.9 times. A magnitude difference of 5.0 corresponds to a change of 100 times. Now, let’s do some star math!! (Note; In the following problems we have stated star magnitudes to the nearest integer to simplify the math!) Question 1) The star Sirius has a magnitude of -1.0 while the star Kruger 60B has a magnitude of +11.0. What is the magnitude difference between these stars? How many times fainter is Kruger 60B than Sirius? Question 2) The apparent magnitudes of the sun and moon are -26.0 and -18.0. How many magnitudes brighter is the sun than the moon? How many magnitudes brighter is the sun than Kruger 60B? By what factor is Kruger 60B fainter then the sun? Question 3) If the brightest object the human eye can observe (just short of instant blindness!) is the sun with a magnitude of -26.0, and if the faintest star we can see with the naked eye has a magnitude of +7.0, by what factor is the faintest object less discernable than the brightest object we can see? In other words, complete this sentence: “The sun is ……….. times brighter than the faintest star we can see with the naked-eye.” Question 4) The Palomar Sky Survey was a photographic survey of the northern sky performed during the 1940’s. Nearly 1 billion objects have been identified in these photographs. The faintest stars have apparent magnitudes of +20.0. How many magnitudes fainter than the faintest naked-eye star ( magnitude +7.0) are the stars in the Palomar Survey? By what factor are these stars fainter than naked-eye stars? (http://www-gsss.stsci.edu/gsc/gsc2/GSC2home.htm) Question 5) In 1996, the Hubble Space Telescope photographed a small piece of the sky with a time-exposure lasting over 10 days. Although only 1,500 galaxies were detected, the faintest of these have a magnitude of +30.0, how many magnitudes fainter than the sun are these faint galaxies? By what factor are these galaxies fainter than the dimmest stare we can see with the human eye? (http://www.stsci.edu/ftp/science/hdf/hdf.html) Question 6) The Sloan Digital Sky Survey is mapping ¼ of the entire sky. It has performed detailed studies on over 200 million stars and other objects. The faintest objects have magnitudes of +22.0. How much fainter are the galaxies in the Hubble Deep Field in terms of magnitudes? In terms of brightness? (http://www.sdss.org/tour/index.html) Question 7) Compare the magnitude of the sun with the magnitude of the faintest objects astronomers have detected with the Hubble Space Telescope. How many magnitudes fainter are the Hubble objects than the sun? By what factor is the sun brighter than the faintest known astronomical objects?
Exploring Space Mathematics http://image.gsfc.nasa.gov/poetry

Teacher’s Guide Star Light….Star Bright…. 21
Hint: use the relationships that a difference of 5 magnitudes is a factor of 100 in brightness. So, 8 magnitudes = 5 + 3 magnitudes or a factor of 100 x 2.512 x 2.512 x 2.512. Question 1) The star Sirius has a magnitude of -1.0 while the star Kruger 60B has a magnitude of +11.0. What is the magnitude difference between these stars? How many times fainter is Kruger 60B than Sirius? Answer: a) +11 – (-1) = +12 magnitudes. B) 12 = 5 + 5 + 2 so the factors are 100 x 100 x 2.512 x 2.512 = 63,000 times fainter than Sirius. Question 2) The apparent magnitudes of the sun and moon are -26.0 and -18.0. How many magnitudes brighter is the sun than the moon? How many magnitudes brighter is the sun than Kruger 60B? By what factor is Kruger 60B fainter then the sun? Answer: -26 – (-18) = -8 magnitudes or ‘ 8 magnitudes brighter’ because the sign is negative. This is a factor of 100 x 2.512 x 2.512 x 2.512 = 1,600. Question 3) If the brightest object the human eye can observe (just short of instant blindness!) is the sun with -26.0, and if the faintest star we can see with the naked eye is +7.0, by what factor is the faintest object less discernable than the brightest object we can see? In other words, complete this sentence: “The sun is ……….. times brighter than the faintest star we can see with the naked-eye.” Answer: The magnitude difference is 26.0 + 7.0 = 33.0. The brightness difference is 33 = 5+5+5+5+5+5+3 or 100x100x100x100x100x100x2.512x2.512x2.512 = 16 trillion times. “The sun is 16 trillion times brighter than the faintest star we can see with the naked eye”. Question 4) The Palomar Sky Survey was a photographic survey of the northern sky performed during the 1940’s. Nearly 1 billion objects have been identified in these photographs. The faintest stars have apparent magnitudes of +20.0. How many magnitudes fainter than the faintest naked-eye star ( magnitude +7.0) are the stars in the Palomar Survey? By what factor are these stars fainter than naked-eye stars? (http://www-gsss.stsci.edu/gsc/gsc2/GSC2home.htm). Answer: 20-7 = 13 magnitudes fainter or a brightness of 100 x 100 x 2.512 x 2.512 x 2.512 = 160,000 times. Question 5) In 1996, the Hubble Space Telescope photographed a small piece of the sky with a time-exposure lasting over 10 days. Although only 1,500 galaxies were detected ,the faintest of these have a magnitude of +30.0 ,how many magnitudes fainter than the sun are these faint galaxies? By what factor are these galaxies fainter than the dimmest stare we can see with the human eye? (http://www.stsci.edu/ftp/science/hdf/hdf.html) .Answer: 30 – 7 = 23 magnitudes or 5+5+5+5+3 magnitudes or a brightness of 100 x 100 x 100 x 100 x 2.512 x 2.512 x 2.512 = 1.6 billion times. Question 6) The Sloan Digital Sky Survey is mapping ¼ of the entire sky. It has performed detailed studies on over 200 million stars and other objects. The faintest objects have magnitudes of +22.0. How much fainter are the galaxies in the Hubble Deep Field in terms of magnitudes? In terms of brightness? (http://www.sdss.org/tour/index.html) Answer: 30 – 22 = 8 magnitudes or a brightness of 100 x 2.512 x 2.512 x 2.512 = 1600. Question 7) Compare the magnitude of the sun with the magnitude of the faintest objects astronomers have detected with the Hubble Space Telescope. How many magnitudes fainter are the Hubble objects than the sun? By what factor is the sun brighter than the faintest known astronomical objects? Answer: -26 – (30) = -56 magnitudes .The brightness factor is
100x100x100x100x100x100x100x100x100x100x100 x 2.512 = 2.5 x10²²
times or 25,000 billion billion times fainter.
Exploring Space Mathematics http://image.gsfc.nasa.gov/poetry

22 Name ________________________________
Name LifespanIn years
Number of Transponders
Cost (million $)
Retire year
Revenue (million $)
Break even year
Hotbird-7A 15 38 200 Arabsat 4A 15 40 200
AMC-12 16 72 280 StarOne C2 13 44 150
Insat-4A 12 24 67 Intelsat IA-8 13 64 320 Spaceway-2 13 48 250 DirecTV-8 12 32 260 AMC-23 15 38 280 Anik F1R 15 56 250
Echostar 10 15 32 250 Chinasat-8 15 52 100 Telkom-2 15 24 150
Thaicom-4 12 38 400 Galaxy-14 15 24 270 Galaxy-15 15 24 270 Apstar-6 14 50 225 Asiasat-6 12 50 200
Express AM3 12 28 290 Express AM2 12 28 290
Measat-3 15 48 132
Question 1) A) What is the total number of transponders carried by these satellites? B) How many analog satellite TV channels can be supported by these satellites? C) How many digital TV channels can be supported by these satellites? Question 2) In Column 4, determine the retirement year of the satellite given its launch year and lifespan. A) What is the earliest year when this group of satellites will begin to retire? B) What year will the oldest satellites retire? C) How old will you be when the last satellite is retired? Question 3) Satellite transponders are rented by the satellite owner to TV companies to carry their programs. A typical transponder costs $1.2 million to lease each year, and this represents income to the satellite owner. In Column 6, calculate the annual revenue from each satellite’s transponders in millions of dollars. A) What is the total revenue each year from these satellites? B) Which satellite makes the most money each year? C) Which satellites make the least money each year? Question 4) For each satellite, by what year will its cumulative revenue equal the cost of the satellite? This is the ‘break even’ year when the satellite has paid for itself and from this year on is producing a net profit to the owner. Enter the break-even year in Column 7. For Experts: A) If the Hotbird-7A satellite actually loses 3% of its transponders each year, how much money will the satellite have lost by the break-even year because of space weather? Assume it loses the same number of transponders each year beginning with its first year.
In the table below you will find information about the communication satellites that were launched in 2005. Assume that each satellite will survive until the year when its lifespan expires. Most are designed to last 15 years before needing replacement. Solar storms and cosmic rays damage the satellite solar panels and cause a 2% decrease in electrical power. Assume that this means that the satellite loses 2% of its transponders each year. Each satellite transponder can carry 2 channels of regular (analog) TV programs, or 6 channels of digital TV programs.
Exploring Space Mathematics http://image.gsfc.nasa.gov/poetry

Exploring Space Mathematics http://image.gsfc.nasa.gov/poetry
Question 1) A) What is the total number of transponders carried by these satellites? B) How many analog satellite TV channels can be supported by these satellites? C) How many digital TV channels can be supported by these satellites? Answer; A) 854 transponders; B) About 854 x 2 = 1708 analog TV channels. C) About 854 x 6 = 5124 digital TV channels. Question 2) In Column 4, determine the retirement year of the satellite given its launch year and lifespan. A) What is the earliest year when this group of satellites will begin to retire? B) What year will the oldest satellites retire? C) How old will you be when the last satellite is retired? Answer: A) The year 2017. B) The year 2020 C) For a 14-year old student in 2005, you will be 14+15 = 29 years old when the oldest satellite retires. Question 3) Satellite transponders are rented by the satellite owner to TV companies to carry their programs. A typical transponder costs $1.2 million to lease each year, and this represents income to the satellite owner. In Column 6, calculate the annual revenue from each satellite’s transponders in millions of dollars. A) What is the total revenue each year from these satellites? B) Which satellite makes the most money each year? C) Which satellite makes the least money each year? Answer: A) 1.0248 billion dollars. B) AMC-12, C) Insat-4A, Telkom-2, Galaxy-14 and Galaxy-15. Question 4) For each satellite, by what year will its cumulative revenue equal the cost of the satellite? This is the ‘break even’ year when the satellite has paid for itself and from this year on is producing a net profit to the owner. Enter the break-even year in Column 7. Answer Example: Hotbird-7a makes $45.6 million each year. It cost $200 million, so it will take (200/45.6) = 4.4 years. Rounding-up, it was launched in 2005, so by 2005+5 = 2010 it will have paid for itself. Rounding-down, students may also use 2005+4 = 2009. For Experts. A) If the Hotbird-7A satellite loses 3% of its transponders each year how much money will the satellite have lost by its break-even year because of space weather? Assume it loses the same number of transponders each year beginning with its first year. Answer: Hotbird-7A reaches its break-even year 4 years after launch. It will lose 38 x 0.03 = 1 transponder the first year, and the same number for each of the remaining 3 years. The cumulative transponder loss for each year is 1 ,2, 3 ,4. for a cumulative loss of 1.2 + 2.4 + 3.6 + 4.8 = $12 million. Select some other satellites to do the same calculation. You may also want to do this on a spreadsheet! What will be the total loss of revenue due to space weather for this entire collection of satellites?
Name Lifespan In years
Number of Transponders
Cost (million $)
Retire year
Revenue (million $)
Break even year
Hotbird-7A 15 38 200 2020 45.6 2010 Arabsat 4A 15 40 200 2020 48.0 2010
AMC-12 16 72 280 2021 86.4 2009 StarOne C2 13 44 150 2018 52.8 2008
Insat-4A 12 24 67 2017 28.8 2008 Intelsat IA-8 13 64 320 2018 76.8 2010 Spaceway-2 13 48 250 2018 57.6 2010 DirecTV-8 12 32 260 2017 38.4 2012 AMC-23 15 38 280 2020 45.6 2012 Anik F1R 15 56 250 2020 67.2 2009
Echostar 10 15 32 250 2020 38.4 2012 Chinasat-8 15 52 100 2020 62.4 2007 Telkom-2 15 24 150 2020 28.8 2011
Thaicom-4 12 38 400 2017 45.6 2014 Galaxy-14 15 24 270 2020 28.8 2015 Galaxy-15 15 24 270 2020 28.8 2015 Apstar-6 14 50 225 2019 60.0 2009 Asiasat-6 12 50 200 2017 60.0 2009
Express AM3 12 28 290 2017 33.6 2014 Express AM2 12 28 290 2017 33.6 2014
Measat-3 15 48 132 2020 57.6 2008
Teacher’s Guide A Bit of Satellite Math 22

23 Name ________________________________
One of the most difficult things for students and non-scientists to get ‘straight’ are the terms: Theory, Hypothesis, Law, Fact and Belief. This exercise consists of a series of statements, which you will mark as a statement of a Theory (T), Hypothesis (H), Fact (F), Law (L) or Belief (B). Fact: A basic statement established by experiment or observation. All facts are true under specific conditions. Some facts may be false when re-tested with better instruments. Law: A logical relationship between two or more things that is based on a variety of facts and proven hypothesis. It is often a mathematical statement of how two or more quantities relate to each other. Hypothesis: A tentative statement such as ‘if A happens then B must happen’ that can be tested by direct experiment or observation. A proven hypothesis can be expressed as a law or a theory. A disproven hypothesis can sometimes be re-tested and found correct as measurements improve. Theory: An explanation for why certain laws and facts exist that can be tested to determine its accuracy. Belief: A statement that is not scientifically provable in the same way as facts, laws, hypotheses or theories. Scientifically disproven beliefs can still be held to be true. 1 – For every action, there is an equal and opposite reaction. 2 - F = ma 3 – Water freezes at 32 F 4 – The Earth is a sphere. 5 – The universe is expanding. 6 – Humans were created separately from all other life on Earth. 7 – Humans and gorillas evolved from a common ancestor species. 8 – Light is an electromagnetic phenomenon described by Maxwell’s Laws 9 – Matter is comprised of atoms. 10 –The sun will die in 7.5 billion years. 11 – Earth’s magnetic field is generated by a conducting fluid in its core. 12 – Sunspots are colder than the surface of the Sun. 13 – There are such things as ghosts. 14 - The solar system formed from a primordial disk of gas and asteroidal material. 15 - Matter can be converted into energy. 16 – Energy can be converted into matter. 17 – The positions of the planets can cause humans to act in specific ways. 18 - Momentum is the product of a body’s mass and its velocity. 19 – The core of the Sun has a temperature of 14.5 million Centigrade. 20 – We will never know how life started on Earth. 21 – The Milky Way is a spiral-type galaxy. 22 – Black holes exist. 23 – The sun will rise tomorrow morning. 24 – The Earth is older than 10,000 years. 25 – Genetic mutations cause organisms to change over time. 26 – Primitive human-like creatures existed 2 million years ago. 27 – If I jump out a window I will die. 28 – The universe was created at the Big Bang. 29 – The first generations of stars appeared about 100 million years after the Big Bang. 30 – Space exists in 10-dimensions not just 3. 31 – Some numbers are more lucky than others 32 – More babies are born, and crimes take place, during the full moon. 33 – The Coriolus Force makes water go down a drain counterclockwise. 34 - The first multi-cellular organisms appeared on Earth about 560 million years ago. 35 – The inverse-square law for gravity and Newton’s laws of motion explain why orbits are ellipses
Exploring Space Mathematics http://image.gsfc.nasa.gov/poetry

L L F F F B F T F H T F B H F F B L F B F F H F F F F H H H B H B F T
1 – For every action, there is an equal and opposite reaction. 2 - F = ma 3 – Water freezes at 32 F 4 – The Earth is a sphere. 5 – The universe is expanding. 6 – Humans were created separately from all other life on Earth. 7 – Humans and gorillas evolved from a common ancestor species. 8 – Light is an electromagnetic phenomenon described by Maxwell’s Laws 9 – Matter is comprised of atoms. 10 – The sun will die in 7.5 billion years. 11 – Earth’s magnetic field is generated by a conducting fluid in its core. 12 – Sunspots are colder than the surface of the Sun. 13 – There are such things as ghosts. 14 - The solar system formed from a primordial disk of gas and asteroidal material. 15 - Matter can be converted into energy. 16 – Energy can be converted into matter. 17 – The positions of the planets can cause humans to act in specific ways. 18 - Momentum is the product of a bodies mass and its velocity. 19 – The core of the Sun has a temperature of 14.5 million Centigrade. 20 – We will never know how life started on Earth. 21 – The Milky Way is a spiral-type galaxy. 22 – Black holes exist. 23 – The sun will rise tomorrow morning. 24 – The Earth is older than 10,000 years. 25 – Genetic mutations cause organisms to change over time. 26 – Primitive human-like creatures existed 2 million years ago. 27 – If I jump out a window I will die. 28 – The universe was created at the Big Bang. 29 – The first generations of stars appeared about 100 million years after the Big Bang. 30 – Space exists in 10-dimensions not just 3. 31 – Some numbers are more lucky than others. 32 – More babies are born, and crimes take place, during the full moon. 33 – The Coriolus Force makes water go down a drain counterclockwise. 34 - The first multi-cellular organisms appeared on Earth about 560 million years ago. 35 – The inverse-square law for gravity and Newton’s Laws of motion explain why orbits are ellipses.
Teacher’s Guide Theories, Hypothesis, Laws, Facts & Beliefs 23
Notes and topics for discussion: The distinction between a theory, a law, a fact and an hypothesis is subtle. Theories, laws and facts can start out as hypothesis when they are first proposed and before they are rigorously tested. Can facts be about events in the future? Generally, a Fact is a very elementary statement based on some measurement such as ‘Humans are about 6 feet tall’ or ‘Water boils at 212 F’. A Law is based on a collection of individual facts ,and is at attempt (usually with mathematics) to relate one set of measurable quantities to another (mass, speed, temperature, viscosity). Example, F=ma, V = d/t, PV = nkT. A Theory is an attempt to explain why certain laws exist, and why certain facts are true under specific conditions. Example 1: Planetary orbits are elliptical (A Law) because gravity is an inverse-square force (A Law) and matter operates under Newton’s Laws of Motion. Example 2: Matter is comprised of atoms, and this explains how gases behave (Laws) , why we have specific chemical reactions (Laws), and why the Periodic Table exists (Facts). Are some facts more certain than others? Water always boils at 212 F at sea level, but at higher altitudes it boils at lower temperatures. So every fact depends on the specific circumstances under which it was measured.
Exploring Space Mathematics http://image.gsfc.nasa.gov/poetry

24 Name ________________________________
Newspaper articles are a great resource for studying how scientific ideas change through time. Aurora and other ‘space weather’ phenomena have been described in newspapers since at least the early-1800s. In this activity, you will examine an archive of newspaper stories and investigate how scientific theories and hypothesis about the terrestrial effects of solar activity have changed over time. You will find this resource at:
http://www.solarstorms.org
1. What kinds of human impacts are covered by the discussions at this website?
2. How credible do you think this resource is?
3. Where did you find the newspaper archive?
4. How many significant solar storm events were covered by this archive?
5. What were the five most significant storms reported since 1850?
6. Examine the newspaper accounts. Briefly describe each of the ‘new’ ideas about aurora and solar storms that were mentioned by reporters. Can you give examples of ideas that became popular but then stopped being quoted? What do you think was the reason for this change?
7. Compare a proposed explanation for aurora from 1850-1880, and compare it with ideas from a much later time from 1950-1980. In what ways are the ideas similar? In what ways are they different? Why do you think the older idea stop being used?
Exploring Space Mathematics http://image.gsfc.nasa.gov/poetry

Goal: Students will use an Internet resource to answer questions about space weather events, and how our explanations for them have changed in time. They will use actual newspaper reports, and distill from what they read, how our explanations have changed. They will also evaluate the website for its credibility, and veracity. This later issue is an important one that all students have to address as they continue to use the internet in their academic research.
Teacher’s Guide to Solar Storms in the News 24
1) What kinds of human impacts are covered by the discussions at this website? Answer: Satellite damage, electrical blackouts, human radiation exposure, etc. 2) How credible do you think this resource is? Answer: The site appears to be written by
a professional astronomer who has written a book on the subject ‘The 23rd Cycle’. His resume lists his affiliation with NASA, and his research papers in astronomical journals.
3) Where did you find the newspaper archive? Answer: It was found under the
Resources tab, and then by following the links for ‘History’ and ‘Newspaper Archives’. 4) How many significant solar storm events were covered by this archive? Answer: A
direct count of the number of dates gives 99 storm events. 5) What were the five most significant storms reported since 1850? Answer: Based on
the number of newspaper descriptions the largest storms were on August 28, 1859; November 18, 1882; November 1, 1902; March 9, 1918; May 13, 1921; January 25, 1938; July 6, 1941; September 18, 1941; February 11, 1958; November 13, 1960; March 13, 1989.
6) Examine the newspaper accounts. Briefly describe each of the ‘new’ ideas about
aurora and solar storms that were mentioned by reporters. Can you give examples of ideas that became popular but then stopped being quoted? What do you think was the reason for this change? Answer: This may vary depending on the particular examples chosen by the student. Students need to provide proper citations for the examples found, (i.e. New York Times, August 29, 1859, page 3).
7) Compare a proposed explanation for aurora from 1850-1880, and compare it with
ideas from a much later time from 1950-1980. In what ways are the ideas similar? In what ways are they different? Why do you think did older idea stop being used? Answer: For example, auroras as sunlight reflected from glaciers [ca 1850s] versus electrons from space colliding with atoms of oxygen and nitrogen. Students may reply by saying ‘They are similar in that they both produce light. They are different because the first one involves reflected light from ice while the second involves emitted light by atoms. The older idea stopped being used because it was replaced by a newer idea that was more often used by scientists, probably based on new data collected by them over a span of100 years.’ Students may also uncover specific reasons in the articles themselves, if debates between the two ideas are mentioned by reporters.
Exploring Space Mathematics http://image.gsfc.nasa.gov/poetry

25 A few comments from the Author.
Hi! My name is Dr. Sten Odenwald, and thank you for using this resource! Like you, I am deeply concerned about science and math education in the United States. Believe me, it is no fun reading the infamous TIMSS survey results and seeing just how fragile the US world ranking in science and math has become. I have read various studies that show how children stop thinking of science as a career prospect around 8th or 9th grade. Not just because in some adolescent groups it is not 'cool' to be interested in science and math, but because many students feel that science is too much like math, and no one professes to like, do well in, math…not even your average parent! This expectation of failure, and boredom with the increasingly technical aspects of physical and biological science, probably helps reinforce the idea that science is only for Brainiacs and Geeks. Can a series of math problems like the ones in this booklet make a big difference? I honestly don't know. But I think for some students it can, because as a scientist I was once deeply challenged to learn mathematics too! In the 1960's, we didn't have 'enrichment problems' or even especially interesting 'word problems' that could make the connection between sterile mathematics and the real world that I was passionately interested in as a young scientist. So now, as a scientist who is interested in helping teachers inspire the next generation of scientists and educated citizens, I have taken on what is for me the fun task of creating math-science problems that I think can help some students better see these connections. I know that these problems work, because I keep getting emails from the teachers on my Spacemath listserve that say so. Here are a few of my favorites! I just looked at your latest problem. It was very timely for some of my students. I have three girls working on sunspots and magnetic fields. Little things like what you provide help me get kids interested in this stuff. Chris DeWolf, Chippewa Hills High School, Remus, MI Your problems are great fillers as well as sources of interesting questions. I have even given one or two of your problems on a test! You certainly have made the problems a valuable resource! Debbie Soltis, Chuguiak High School ,Alaska. I love your problems, and thanks so much for offering them! I have used them for two years, and not only do I love the images, but the content and level of questioning is so appropriate for my high school students, they love it too. I have shared them with our math and science teachers, and they have told me that their students like how they apply what is being taught in their classes to real problems that professionals work on. Beth Leavitt, Wade Hampton High School, Greenville ,SC I recently found the Weekly Math Problems website and I must tell you it is wonderful! I teach 8th grade science and this is a blessed resource for me. We do a lot of math and I love how you have taken real information and created reinforcing problems with them. I have shared the website with many of my middle and high school colleagues and we are all so excited. The skills summary allows any of us to skim the listing and know exactly what would work for our classes and what will not. I cannot thank you enough. I know that the science teachers I work with and I love the graphing and conversion questions. The "Are U Nuts" conversion worksheet was wonderful! One student told me that it took doing that activity (using the unusual units) for her to finally understand the conversion process completely. Thank you! Lisa Tobias, St. Mary's Hall, San Antonio ,TX
Exploring Space Mathematics http://image.gsfc.nasa.gov/poetry

So, we are making a difference, and if you find these math problems helpful in keeping just a few more students engaged in science, I would be thrilled!! All we need to do is get one student per school district each year to keep their focus on their passion to learn science and math, and we can indeed make a big difference! Enjoy!
A few comments from the Author (cont'd) 26 There is another thing you should realize about mathematics and our students. Please look at this article! SAT Scores in Mathematics Reach a Record High "This year's [June, 2005] graduating high-school students set a record for the highest average mathematics score on the SAT, the College Board announced in late August, with the 1.5 million students who took the test earning an average of 520, two points higher than last year." (The Chronicle of Higher Education, September 9, 2005) The National average SAT score for math has increased by about 25 points since 1992. But even what appears to be an insignificant annual change hides another important fact. Between 1994 and 2004, the ten-year math scores increased for nearly every population group (Higher Education, September 23, 2004): American Indian, Alaskan Native 470 to 488 …… +18 points Asian, Asian American, Pacific Islander 553 to 577 …… +24 points African American/Black 421 to 427 ….... + 6 points Hispanic 464 to 465 ….....+ 1 points Puerto Rican 442 to 452 ……. +10 points White 519 to 531 ….... +12 points All College-Bound Seniors 504 to 518 …... +14 points
This also supports an upward trend in bachelor's degrees in science and math, which are the gateways to more advanced degrees. (American Institute of Physics Report, 2005)
Exploring Space Mathematics http://image.gsfc.nasa.gov/poetry

Useful Internet Resources
The human and technological impacts of solar storms and space weather: http://www.solarstorms.org
Newspaper accounts of aurora and technology impacts from 1800-2001:
http://www.solarstorms.org/SRefHistory.html Space weather and satellite failures
http://www.solarstorms.org/Ssatellites.html NOAA space weather forecasting center
http://www.noaa.sec.gov/SWN Space weather summaries and daily updates:
http://www.spaceweather.com NASA Student Observation Network –Tracking a Solar Storm
http://son.nasa.gov/tass/index.htm Archive of NASA TV programs about space weather for grades 6-10
http://www.solarstorms.org/STV.html Movies and animations about space weather
http://www.solarstorms.org/SMovies.html Frequently Asked Questions about space weather
http://www.solarstorms.org/SFAQs.html Additional classroom activities
http://image.gsfc.nasa.gov/poetry/activities.html Exploring Space Science Mathematics pre-algebra problem book
http://image.gsfc.nasa.gov/MathDocs/spacemath.html Exploring Earth’s Magnetic Field primer
http://image.gsfc.nasa.gov/poetry/magnetism/magnetism.html IMAGE, Student’s Guide to Sun-Earth Science topics
http://image.gsfc.nasa.gov/poetry/educator/students.html The IMAGE, Soda Bottle Magnetometer
http://image.gsfc.nasa.gov/poetry/workbook/magnet.html The Mysterious Van Allen Radiation Belts
http://radbelts.gsfc.nasa.gov/outreach/outreach.html

A stylized artistic rendering of the interaction of the sun with Earth’s magnetic field. None of the features are drawn to scale. Created by K. Endo, and courtesy of Prof. Yohsuke Kamide.