Embed Size (px)
Citation preview
Research Article
Ensembles of Bayesian-regularized Genetic NeuralNetworks for Modeling of AcetylcholinesteraseInhibition by Huprines
Michael Fernandez and Julio Caballero*
Molecular Modeling Group, Center for Biotechnological Studies,University of Matanzas, Matanzas, C.P. 44740, Cuba*Corresponding author: Julio Caballero, [email protected],[email protected]
Acetylcholinesterase inhibition was modeled for aset of huprines using ensembles of Bayesian-regu-larized Genetic Neural Networks. In the Bayesian-regularized Genetic Neural Network approach theBayesian regularization avoids overfitted regres-sions and the genetic algorithm allows exploring awide pool of three-dimensional descriptors. Thepredictive capacity of our selected model wasevaluated by averaging multiple validation setsgenerated as members of neural network ensem-bles. When 60 members are assembled, the neuralnetwork ensemble provides a reliable measure oftraining and test set R2-values of 0.945 and 0.850respectively. In other respects, the ability of thenonlinear selected genetic algorithm space for dif-ferentiate the data were evidenced when totaldata set was well distributed in a Kohonen self-organizing map. The analysis of the self-organizingmap zones allows establishing the main structuralfeatures differentiated by our vectorial space.
Key words: acetylcholinesterase inhibitors, Bayesian-regularizedGenetic Neural Networks, huprines, neural network ensemble, quantita-tive structure–activity relationship, self-organizing maps
Received 29 August 2006, revised 19 September 2006 and accepted forpublication 24 September 2006
The neurodegenerative Alzheimer's disease (AD) is a degenerativedisorder characterized by a progressive impairment of cognitivefunction which seems to be associated with deposition of amyloidprotein and neuronal loss, as well as with altered neurotransmis-sion in the brain (1,2). The loss of the basal forebrain cholinergicsystem is the most significant aspect of neurodegeneration in thebrains of AD patients, and it is thought to play a central role inproducing the cognitive impairments (3). Therefore, enhancement ofcholinergic transmission has been regarded as one of the mostpromising methods for treating AD patients.
One promising therapeutic strategy for activating central cholinergicfunctions has been the use of inhibitors of acetylcholinesterase
(AChE). This enzyme catalyzes the hydrolysis of the neurotransmitteracetylcholine at nerve–nerve synapses and neuromuscular junctions(4); therefore, its inhibitors lead to the restoration of the levels ofacetylcholine. The prototype for the centrally acting AChE inhibitorswas tacrine (9-amino-1,2,3,4-tetrahydroacridine, THA; 5), the firstdrug to be approved in the United States (Cognex, Alzheimer's Cor-poration, Albuquerque, NM, USA) for the treatment of AD. However,there are several deficiencies of THA as a drug related to liver toxic-ity and peripheral cholinomimetic actions (6). In order to reduce theseundesirable side-effects, many analogs of THA have been reported(7–12), most of these are structurally closely related to the parentcompound and retain the aminopyridine or aminoquinoline moiety.
Huprines (9–12) are promising AChE inhibitors that combine the4-aminoquinoline moiety of THA with the carbobicyclic substructureof ())-huperzine A, an alkaloid isolated from Huperzia serrata whichalso shows a potent AChE inhibitory activity (13). Huprines share allof the features that modulate the binding of THA to AChE and addi-tionally they partially share the same binding pocket of ())-huper-zine A (14). As a result, the additional contacts of huprines canaccount for their greatly increased inhibitory activities relative tothe parent compounds, indeed, the so-called huprine Y has one ofthe highest affinities for the active site of AChE yet reported.
Computational-based rational design of drugs has increased in thelast decade. Most of those approaches are focused on quantitativestructure–activity relationship (QSAR) studies, using different kindsof molecular descriptors for encoding chemical information (15).After computing a set of descriptors, multivariate linear or/and non-linear relationships are established between a reduced subset ofvariables and the inhibitory activity, leading to a mathematicalmodel. AChE inhibitors have been approached by many kinds ofcomputational strategies. A serious source of information about thistopic is offered by Dimoglo et al. (16). In this study, the authorsmade a comprehensive review of the 'state of the art' concerningthe modeling of AChE inhibition. In general, previous SAR andQSAR studies have identified that hydrophobicity and the presenceof ionizable nitrogen are essential features for the inhibitors tointeract with AChE (16). In addition, docking and molecular dynam-ics approaches confirm that the three-dimensional (3D) positioningof the inhibitor in the active site of the enzyme, i.e. the mode ofinteraction, varies among different chemical classes. However, onlythe report of Mart�n-Santamar�a et al. includes huprines in a QSARmodeling study (17).
In this work, a detailed correlation study was accomplished by non-linear two-dimensional (2D)-QSAR analysis using artificial neural
201
Chem Biol Drug Des 2006; 68: 201–212 ª 2006 The AuthorsJournal compilation ª 2006 Blackwell Munksgaard
doi: 10.1111/j.1747-0285.2006.00435.x
networks (ANNs). ANNs arose from attempts to model the function-ing of the human brain (18). In chemistry and related fields ofresearch-like biochemistry, chemical engineering, and pharmacy,interest in ANN computing has grown rapidly. In the last decade,ANNs have encountered successful applications in QSAR studies.ANNs usually overcome methods limited to linear regression mod-els, such as multiple linear analyses or partial least square (19–22).Contrary to these methods, ANNs can be used to model complexnonlinear relationships. As biologic phenomena are complex by nat-ure, this ability has promoted the employment of ANNs in drugdesign studies.
In the present study, the main objective was to model the AChEinhibitory activity of a set of huprines (9–12). The data set includes40 huprines and the parent THA with the biologic activity reportedas IC50 values. The characteristics of the inhibitors were represen-ted by relevant 3D descriptors extracted by genetic algorithm (GA)feature selection using Bayesian-regularized ANNs (BRANNs) aspredictors. The model was carried out by neural network ensemble(NNE) approach that provides reliable statistics. In addition, self-organizing maps (SOMs) trained by competitive learning was devel-oped for analyzing the meaning of the descriptors according to thestructural feature (s.f.) they encode.
Material and Methods
Data set and molecular descriptorsAcetylcholinesterase inhibitory activities [log(105/IC50)] of 40 hup-rines and the THA were taken from the literature (9–12). The chem-ical structures and experimental activities are shown in Table 1.IC50 values represent the micromolar concentration that inhibits50% of AChE activity from bovine erythrocytes. Three-dimensionalstructures of the studied compounds were built by HYPERCHEM soft-ware (23). Prior to molecular descriptor calculations, 3D structureswere geometrically optimized using the semiempirical quantum-chemical method PM3 (24) implemented in the MOPAC 6.0 (25) com-puter software.
The 3D descriptors from the DRAGON software (26) were calculatedfor each compound: aromaticity indices (27,28), Randic molecularprofiles (29), geometrical descriptors (30), radial distribution function(RDF) descriptors (31), 3D-MoRSE (molecule representation of struc-tures based on electron diffraction) descriptors (32), weighted holis-tic invariant molecular (WHIM) descriptors (33), and GEometry,Topology, and Atom-Weight AssemblY (GETAWAY) descriptors (34).In all, 721 descriptors were calculated. Descriptors that stayed con-stant or almost constant were eliminated, and pairs of variableswith a correlation coefficient >0.95 were classified as intercorrelat-ed, and only one of these was included in the model. Finally, 267descriptors were obtained.
Artificial neural network regression procedureBayesian-regularized Genetic Neural Network (BRGNN) is a frame-work that combines BRANNs with GA feature selection (35). OurBRGNN approach is a version of the So and Karplus GA featuresection method (36) incorporating Bayesian regularization.
Bayesian networks are optimal devices for solving learning prob-lems. They diminish the inherent complexity of ANNs, being gov-erned by Occam's Razor, when complex models are automaticallyself-penalizing under Bayes' rule. The Bayesian approach to ANNmodeling considers all possible values of network parametersweighted by the probability of each set of weights. The BRANNmethod was designed by Mackay (37,38) for overcoming the defici-encies of ANNs. Only a brief summary will be provided here. Baye-sian approach yields a posterior distribution of network parametersP(w|D,H) from a prior probability distribution P(w|H) according toupdates provided by the training set D using the BRANN model H.Predictions are expressed in terms of expectations with respect tothis posterior distribution. Bayesian methods can simultaneouslyoptimize the regularization constants in ANNs, a process that isvery laborious using cross-validation. Instead of trying to find theglobal minimum, the Bayesian approach finds the (locally) mostprobable parameters.
Bayesian approach produces predictors that are robust and wellmatched to the data. These properties become BRANNs in accuratepredictors for QSAR analysis (39,40). They give models, which arerelatively independent of ANN architecture, above a minimum archi-tecture, as the Bayesian regularization method estimates the num-ber of effective parameters. The concerns about overfitting andovertraining are also eliminated by this method so that the produc-tion of a definitive and reproducible model is attained. The joiningof BRANN and GA feature selection (BRGNN) increases the possi-bilities of BRANNs for modeling as we indicated in previous studies(20,21,35). This method is relatively fast and considers the wholedata set in training process. For other hybrids of ANN and GA theuse of the mean square error (MSE) as fitness function could leadto undesirable well fitted but poor generalized networks as algo-rithm solutions. In this connection, BRGNN avoids such results bytwo aspects: (i) keeping network architectures as simplest as poss-ible inside the GA framework and (ii) implementing Bayesian regula-tion in the network training function.
Fully connected, three-layer BRANNs with back-propagation trainingwere implemented in the MATLAB environment (41). In these nets,the transfer functions of input and output layers were linear andthe hidden layer had neurons with a hyperbolic tangent transferfunction. When constant and correlated variables were eliminated,only a subset of the available pool of 267 descriptors is statisticallysignificant in terms of correlation with the modeled AChE inhibitoryactivity. Inputs and targets took the values from independent varia-bles selected by the GA and log(105/IC50) values, respectively, bothwere normalized prior to network training. BRANN training was car-ried out according to the Levenberg-Marquardt optimization (42).The initial value for l was 0.005 with decrease and increase fac-tors of 0.1 and 10, respectively. The training was stopped when lbecame larger than 1010.
The GA implemented in this study keeps the same characteristicsof the previously reported in earlier work (35). Initially, a set of 50chromosomes was randomly generated. The population fitness wasthen calculated and the members were rank ordered according tofitness. The two best scoring models were automatically retainedas members for the next round of evolution. More progeny models
Fernandez and Caballero
202 Chem Biol Drug Des 2006; 68: 201–212

Table 1: Experimental and predicted acetylcholinesterase (AChE) inhibitory activities [log(105/IC50)] of huprinesa
Compoundb X[C(Ranti)Rsyn] R(Rexo,Rendo) R1 R2 R3 y z
log(105/IC50)c
Experimental Training Test
1 (THA) – – – – – – – 5.89 5.88 5.882 CH2 H,H H H H s s 3.38 3.72 4.123 CH2 OH,H H H H s s 4.79 4.84 4.844 CH2 H H H H d s 4.31 4.29 4.255 C(CH3)OCH3 CH3 H H H d s 4.87 4.73 4.516 C(OCH3)CH3 CH3 H H H d s 4.17 4.37 4.597 CO CH3 H H H d s 4.68 4.56 4.508 (E)-C(¼CH-CH3) CH3 H H H d s 4.94 5.17 5.239 (Z)-C(¼CH-CH3) CH3 H H H d s 5.49 5.26 5.17
10 o-Phenylene H,H H H H s s 4.59 4.48 4.2211 o-Phenylene CH3 H H H d s 4.68 4.67 4.5812 CH2 H,OH H H H s s 4.37 4.16 4.0813 o-Phenylene H,OH H H H s s 3.82 4.14 4.5514 CH2 CH2CH2CH3 H H H d s 5.37 5.95 6.0615 CH2 CH(CH3)2 H H H d s 5.99 5.79 5.7316 CH2 CH2CH¼CH2 H H H d s 5.82 5.82 5.8317 CH2 CH2CH2CH2CH3 H H H d s 5.55 5.98 6.1718 CH2 C(CH3)3 H H H d s 5.57 5.63 5.6719 CH2 C6H5 H H H d s 5.90 5.74 5.6720 CH2 CH3 H H H d s 6.19 5.80 5.7321 CH2 CH3 H H CH3 d s 6.91 6.73 6.6722 CH2 CH3 F H H d s 6.50 6.75 6.8323 CH2 CH3 H H F d s 7.07 6.95 6.9424 CH2 CH3 F H F d s 7.61 7.59 7.6325 CH2 CH3 H H Cl d s 7.37 6.77 6.4226 CH2 CH2CH3 H H H d s 6.41 6.41 6.4127 CH2 CH2CH3 CH3 H H d s 6.53 6.26 6.1828 CH2 CH2CH3 H H CH3 d s 6.92 6.80 6.7429 CH2 CH2CH3 CH3 H CH3 d s 7.44 7.01 6.6830 CH2 CH2CH3 F H H d s 6.33 6.42 6.4431 CH2 CH2CH3 H H F d s 7.13 7.31 7.3332 CH2 CH2CH3 F H F d s 7.58 7.63 7.6533 CH2 CH2CH3 Cl H H d s 6.79 6.88 6.9234 CH2 CH2CH3 H Cl H d s 5.59 5.97 6.0635 CH2 CH2CH3 H H Cl d s 7.56 7.31 7.2236 CH2 CH2CH3 Cl H Cl d s 6.40 6.51 6.6837 CH2 CH3 H H H s d 5.29 5.68 5.7538 CH2 CH3 H H H s d 5.78 5.11 4.7839 CH2 CH3 – – – d – 4.25 4.71 5.3140 o-Phenylene O – – – s – 4.53 4.36 4.1741 CH2 H,OH – – – s – 3.87 4.14 4.49
aCompounds 1–13, 20, 26, and 30–41 are from Ref. (9); 14–19, 21–23, and 27–28 are from Ref. (10); 24–25 and 29–36 are from Ref. (11); and 37–38
are from Ref. (12).bRacemic mixtures.cIC50: micromolar concentration that inhibits 50% of AChE activity from bovine erythrocytes.
Ensembles of BRGNN
Chem Biol Drug Des 2006; 68: 201–212 203

were then created for the next generation by preferentially matingparent models with higher scores. Crossover operator and single-point mutations were used in the evolution process until the bestMSE scoring model remains constant for at least 10 generations.Our GA was programmed within the MATLAB environment usingthe GA and neural networks toolboxes (41). The predictors areBRANNs with a simple architecture (two or three neurons in a solehidden layer). We tried the MSE of data fitting for BRANN models,as the case may be, as the individual fitness function. The bestmodels according to R-value (R > 0.8) were selected, and they weretested in cross-validation experiments for avoiding chance correla-tions.
The predictive power of the model was measured by an externalvalidation process that consists of predicting the activity ofunknown compounds forming the test set. To avoid the influence ofcasual external sets, NNEs were employed; building all members bythe random partition of the whole data set into training (80%) andtest sets (20%) following the Agrafiotis et al. proposition (43). As aresult, averaging external predictions were obtained. The qualityand reliability was settled by examining the correlation coefficientR and the MSE of the test set fitting.
Assembling multiple versions of a predictor provides 'smoother'more stable predictions (44). Ensemble averaging minimizes uncer-tainty and produces more stable and accurate predictors. Recently,our group demonstrated the advantages of the ensemble solutionfor QSAR validation (45). The robustness of this method lies on theadequacy of many external predictions; therefore, it can replace thetraditional validation processes.
Kohonen self-organizing mapsThe Kohonen SOMs (46) are ANNs related to classic clusteringalgorithms, in that they generate groupings of data points taken tobe described by a single vector of typical values. However, theSOMs are distinct from standard clustering methods in that they donot operate with separate clusters: rather, they allocate data pointsto groups which are related (47).
Kohonen SOMs are networks of spatially related nodes each ofwhich represents a 'prototype' of a particular region of data (input)space. Each node comprises a set of weights corresponding to thedimensions of the data. Their characteristic feature is their abilityto map nonlinear relations in multidimensional data sets into easilyvisualizable 2D grids of neurons displaying the topology of a dataset. Essentially, SOMs permit the perception of similarities inobjects.
To settle structural similarities among the modeled AChE inhibitors,a Kohonen SOM was built. The 3D descriptors selected by GA wereused for unsupervised training of 8 · 8 neuron maps. SOMs wereimplemented in the MATLAB environment (41). Neurons were ini-tially located in a grid topology. The ordering phase was developedin 1000 steps with a 0.9 learning rate until a tuning neighborhooddistance (1.0) was achieved. The tuning-phase learning rate was0.02. Training was performed for a period of 2000 epochs in anunsupervised manner.
Results and Discussion
Model and molecular descriptorsBayesian-regularized Genetic Neural Network methodology wasapplied for evaluating nonlinear relationships between the inhibitoryactivity and molecular descriptors. We found a five descriptor spaceable to explain the AChE inhibition. The selected space includesthe geometrical descriptor G(N…O), the RDF descriptor RDF085u,the 3D-MoRSE descriptor Mor08m, and two GETAWAY descriptors(HATS7v and R6m). The analysis of the correlations showed thatonly two pairs of descriptors can be considered correlated with oneanother (R2 > 0.5): Mor08m-R6m (R2 ¼ 0.636) and HATS7v-R6m(R2 ¼ 0.578). A test was made to see if both members of each cor-related pair are needed in significant models (48). The results aregiven in Table 2. If one selected descriptor of each of the two pairsis deleted from the initial basis set, a poor model results: individualremoval of R6m cannot be tolerated, while removal of Mor08m, orremoval of HATS7v, is marginally acceptable. Overall, it appearsthat each member of the correlated pairs individually providesunique information to the model.
Geometrical descriptor G(N…O) (30) accounts for the geometricaldistances between N and O atoms. In our data, this descriptor sug-gest a negative effect of oxygen-containing substituents, as themost active compounds do not contain oxygen atoms and G(N…O)takes a null value for them. The effectiveness of huprines is modu-lated by the changes in the bicyclo[3.3.1]nonene substructure, char-acteristic of huperzine A. Regarding this substructure, Badia et al.found that polar substituents (oxygen-containing substituents) atpositions 9 and 13 of huprines give compounds less active thanTHA (9).
Radial distribution function descriptors (31) are calculated from theRDF of an ensemble of N atoms that can be interpreted as theprobability distribution of finding an atom in a spherical volume ofradius r. eqn 1 represents the RDF code:
gðrÞ ¼ fXN�1
i
XNj>1
AiAje�Bðr�rij Þ2 ð1Þ
where f is a scaling factor, N is the number of atoms, Ai and Aj
are atomic properties of atoms i and j, rij represents the interatomicdistances, and B is an smoothing parameter that defines the prob-ability distribution of the individual distances. g(r) was calculated ata number of discrete points with defined intervals. Different atomicproperties Ai were used, such as atomic mass, atomic van der
Table 2: R2-values and cross-validation analysis (Q2 and SCV) formodels generated by excluding correlated descriptors
Variable excludedTotal number ofvariables in model R2 Q2 SCV
a
None 5 0.933 0.842 0.462Mor08m 4 0.824 0.643 0.700HATS7v 4 0.746 0.614 0.722R6m 4 0.526 0.272 1.000
aStandard deviation of the LOO cross-validation.
Fernandez and Caballero
204 Chem Biol Drug Des 2006; 68: 201–212

Waals volumes, atomic Sanderson electronegativities, and atomicpolarizabilities. The possibility for choosing an appropriate atomicproperty gives great flexibility to the RDF space for adapting it tothe problem under investigation. RDF085u takes into account theatoms around 8.5 � without any weighting scheme. Consideringthat the most separated atoms in THA are around 9.5 �, thisdescriptor accounts for atoms at both sides of the huprine's topolo-gies. In this sense, RDF085u can be related to the length of themolecules.
The 3D-MoRSE (32) code considers the molecular informationderived from an equation used in electron diffraction studies. Elec-tron diffraction does not directly yield atomic co-ordinates but pro-vides diffraction patterns from which the atomic co-ordinates arederived by mathematical transformations. 3D-MoRSE code is appliedby eqn 2:
IðsÞ ¼XNi¼2
Xi�1
j¼1
AiAjsin srij
srijð2Þ
In this equation, Ai and Aj are atomic properties of atoms i and j,rij represents the interatomic distances, and s measures the scatter-ing angle. The value of s (0,…, 31.0 �)1) is considered only at dis-crete positions within a certain range. Values of I(s) are defined at32 evenly distributed values of s in the range of 0–31.0 �)1. These32 values constitute the 3D-MoRSE code of the 3D structure of amolecule. Like in RDF approach, atomic properties Ai were used(atomic masses, atomic van der Waals volumes, atomic Sandersonelectronegativities, and atomic polarizabilities). In this study,3D-MoRSE descriptor Mor08m was selected. In our context, thisdescriptor represents a restricted 3D space, which captures relevantmolecular information, regarding molecular mass, which is relatedto the modeled AChE inhibitory activity.
GETAWAY descriptors (34) are based on the molecular influencematrix (MIM). They match the 3D molecular geometry provided bythe MIM and atom relatedness by molecular topology, with chem-ical information. The diagonal elements hii of the MIM, called lever-ages, encode atomic information and represent the 'influence' ofeach molecule atom in determining the whole shape of the mole-cule; in fact, mantle atoms always have higher hii values thanatoms near the molecule center. Each off-diagonal element hij rep-resents the degree of accessibility of the jth atom to interactionswith the ith atom. Specifically, HATS7v comes from H-GETAWAYdescriptors based on Moreau-Brotto autocorrelation descriptors (49).In such descriptors, geometrical information provided by leveragevalues is combined with atomic weightings, accounting for specificphysicochemical properties of molecule atoms. HATS indices consi-der the MIM diagonal elements. Like in the Moreau–Broto autocor-relations, HATSk(w) descriptors are defined as:
HATSkðwÞ ¼XA�1
i¼1
Xj>1ðwi � hiiÞ � ðwj � hjjÞ � dðk ; dijÞ ð3Þ
where k (1, 2, …, d) is the path length (lag) in the molecular graph,dij is the topological distance between atoms i and j, while wi andwj are the A-dimensional property vector of the atoms i and j. Thefunction d(k;dij) is a Dirac-delta function defined as:
d ¼ ðk ; dijÞ ¼1 if dij ¼ k0 if dij 6¼ k
�ð4Þ
On the other hand, R6m belong to R-GETAWAY descriptors whichcombine the information provided by the MIM with geometry matrixG. This junction leads to the influence/distance matrix R whose ele-ments resemble the single terms in the sums of gravitational indi-ces (50). In analogy with the H-GETAWAY, the autocorrelationR-GETAWAY descriptors [Rk(w)] are based on the R matrix and aredefined as:
RkðwÞ ¼XA�1
i¼1
Xj>1
ffiffiffiffiffiffiffiffiffiffiffiffiffiffiffihii � hjj
prij
�wi �wj � dðk ; dijÞ ð5Þ
The information contained in 3D-MoRSE and GETAWAY-selecteddescriptors is related to distributions of atomic van der Waals vol-umes and atomic masses across the entire molecules. In this sense,the elucidation of the molecular key features of the modeled dataset from our proposed space is a difficult task. However, we canconclude that the nonlinear structural information here obtainedshowed that an adequate distribution of atomic masses and vander Waals atomic volumes has a great influence on the AChE inhib-itory activities of the huprines. It suggests that molecular size,shape, and atomic constitution of huprines play an important role inthe modeled activity. These facts agree well with reports where theaccess of the inhibitors to the AChE buried active site are stronglylimited for the presence of a long and narrow gorge or channelleading from the surface of the enzyme (51); this aspect imposesshape and size-related constraints for AChE inhibitors.
In order to gain a deeper inside on the relative effects of each 3Ddescriptor in our model, a recently reported weight-based inputranking scheme was carried out. Black-box nature of three layerANNs has been 'deciphered' in a recent report of Guha et al. (52).Their method allows understanding how an input descriptor is cor-related with the predicted output by the network and consists oftwo parts. First, the nonlinear transform for a given neuron is linea-rized. Afterward, the magnitude in which a given neuron affects thedownstream output is determined. Further, a ranking scheme forneurons in the hidden layer is developed. The ranking scheme iscarried out by determining the Square Contribution Values (SCV) foreach hidden neuron [see Ref. (52) for details]. This method for ANNmodel interpretation is similar in manner to the partial leastsquares interpretation method for linear models described by Stan-ton (53).
Results of the ANN deciphering study presented in Table 3. Thereported effective weight matrix for our model shows that the sec-ond hidden neuron has the major contribution to the model with aSCV value 13.5-fold higher in comparison with the other hiddenneuron. On this neuron, G(N…O) and RDF085u descriptors have thehighest impacts equal to )0.670 and 0.611, respectively. On theother hand, the first hidden neuron exhibits a major contribution ofMor08m, HATS7v, and R6m, but the poor SCV value for this neuronindicates that these descriptors have less importance for our model.From this analysis we can also derived the approximate effect ofthe selected descriptors. According to the effective weight matrix,
Ensembles of BRGNN
Chem Biol Drug Des 2006; 68: 201–212 205
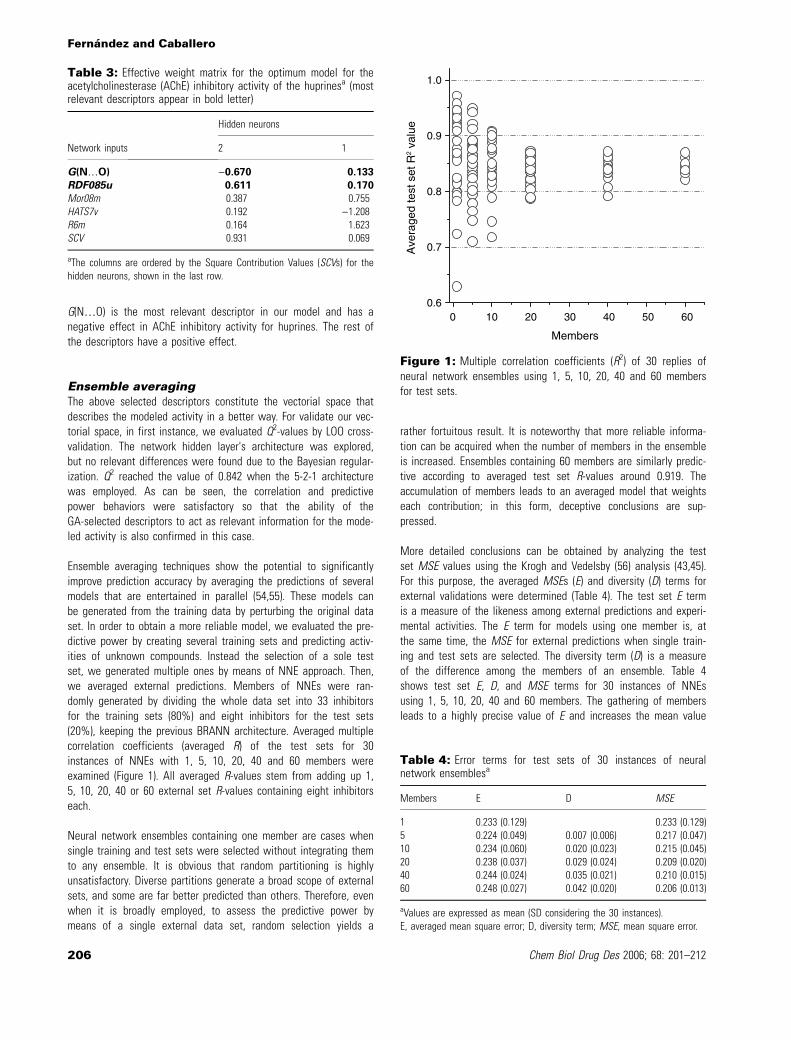
G(N…O) is the most relevant descriptor in our model and has anegative effect in AChE inhibitory activity for huprines. The rest ofthe descriptors have a positive effect.
Ensemble averagingThe above selected descriptors constitute the vectorial space thatdescribes the modeled activity in a better way. For validate our vec-torial space, in first instance, we evaluated Q2-values by LOO cross-validation. The network hidden layer's architecture was explored,but no relevant differences were found due to the Bayesian regular-ization. Q2 reached the value of 0.842 when the 5-2-1 architecturewas employed. As can be seen, the correlation and predictivepower behaviors were satisfactory so that the ability of theGA-selected descriptors to act as relevant information for the mode-led activity is also confirmed in this case.
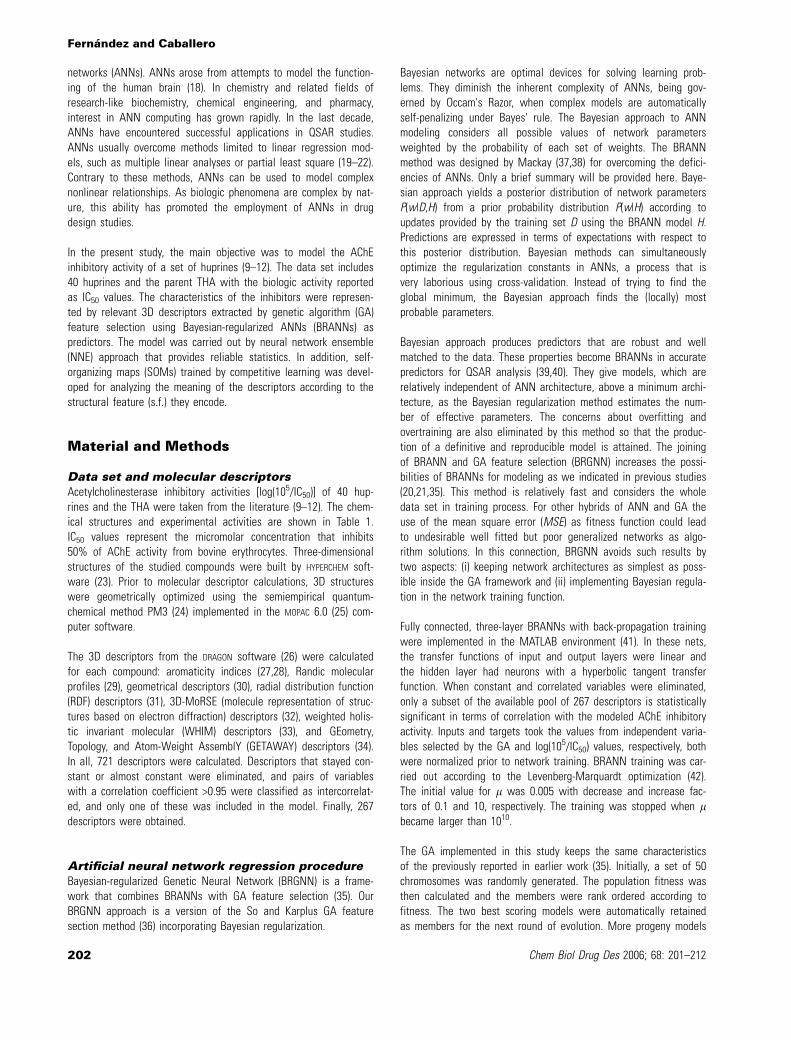
Ensemble averaging techniques show the potential to significantlyimprove prediction accuracy by averaging the predictions of severalmodels that are entertained in parallel (54,55). These models canbe generated from the training data by perturbing the original dataset. In order to obtain a more reliable model, we evaluated the pre-dictive power by creating several training sets and predicting activ-ities of unknown compounds. Instead the selection of a sole testset, we generated multiple ones by means of NNE approach. Then,we averaged external predictions. Members of NNEs were ran-domly generated by dividing the whole data set into 33 inhibitorsfor the training sets (80%) and eight inhibitors for the test sets(20%), keeping the previous BRANN architecture. Averaged multiplecorrelation coefficients (averaged R) of the test sets for 30instances of NNEs with 1, 5, 10, 20, 40 and 60 members wereexamined (Figure 1). All averaged R-values stem from adding up 1,5, 10, 20, 40 or 60 external set R-values containing eight inhibitorseach.
Neural network ensembles containing one member are cases whensingle training and test sets were selected without integrating themto any ensemble. It is obvious that random partitioning is highlyunsatisfactory. Diverse partitions generate a broad scope of externalsets, and some are far better predicted than others. Therefore, evenwhen it is broadly employed, to assess the predictive power bymeans of a single external data set, random selection yields a
rather fortuitous result. It is noteworthy that more reliable informa-tion can be acquired when the number of members in the ensembleis increased. Ensembles containing 60 members are similarly predic-tive according to averaged test set R-values around 0.919. Theaccumulation of members leads to an averaged model that weightseach contribution; in this form, deceptive conclusions are sup-pressed.
More detailed conclusions can be obtained by analyzing the testset MSE values using the Krogh and Vedelsby (56) analysis (43,45).For this purpose, the averaged MSEs (E) and diversity (D) terms forexternal validations were determined (Table 4). The test set E termis a measure of the likeness among external predictions and experi-mental activities. The E term for models using one member is, atthe same time, the MSE for external predictions when single train-ing and test sets are selected. The diversity term (D) is a measureof the difference among the members of an ensemble. Table 4shows test set E, D, and MSE terms for 30 instances of NNEsusing 1, 5, 10, 20, 40 and 60 members. The gathering of membersleads to a highly precise value of E and increases the mean value
0 10 20 30 40 50 600.6
0.7
0.8
0.9
1.0
Ave
rage
d te
st s
et R
2 va
lue
Members
Figure 1: Multiple correlation coefficients (R2) of 30 replies ofneural network ensembles using 1, 5, 10, 20, 40 and 60 membersfor test sets.
Table 4: Error terms for test sets of 30 instances of neuralnetwork ensemblesa
Members E D MSE
1 0.233 (0.129) 0.233 (0.129)5 0.224 (0.049) 0.007 (0.006) 0.217 (0.047)10 0.234 (0.060) 0.020 (0.023) 0.215 (0.045)20 0.238 (0.037) 0.029 (0.024) 0.209 (0.020)40 0.244 (0.024) 0.035 (0.021) 0.210 (0.015)60 0.248 (0.027) 0.042 (0.020) 0.206 (0.013)
aValues are expressed as mean (SD considering the 30 instances).E, averaged mean square error; D, diversity term; MSE, mean square error.
Table 3: Effective weight matrix for the optimum model for theacetylcholinesterase (AChE) inhibitory activity of the huprinesa (mostrelevant descriptors appear in bold letter)
Network inputs
Hidden neurons
2 1
G(N…O) )0.670 0.133
RDF085u 0.611 0.170
Mor08m 0.387 0.755HATS7v 0.192 )1.208R6m 0.164 1.623SCV 0.931 0.069
aThe columns are ordered by the Square Contribution Values (SCVs) for thehidden neurons, shown in the last row.
Fernandez and Caballero
206 Chem Biol Drug Des 2006; 68: 201–212

of D. According to Krogh and Vedelsby (56) analysis, MSE value forNNEs should be smaller than the averaged MSE of the componentpredictors (56). In this sense, NNEs containing 60 members havesimilar test set MSE values around 0.206, which represents adecrease of a 12% in comparison with the mean E value. As novaluable difference was evidenced in the MSE values when therewere 60, 40 or 20 members assembled in the ensemble, 20 mem-bers seem to be enough to get a precise statistic of the validation.
As our test set consists of 20% of the whole data set, the prob-ability that an inhibitor will be selected as part of a test set islow. When a new partition is carried out, the new test set cancontain elements from the original test set and new elements.The assemblage of successive members allows storage of predic-tions for each compound. Whereas higher is the number of mem-bers, most replies of predictions can be collected; therefore, wecan establish a test set prediction for the ensemble by averagingthem, which includes all compounds when the number of membersis sufficiently large. The NNE provides a reliable measure of train-ing and test set R2-values. According to this, we report trainingset R2 ¼ 0.945 and test set R2 ¼ 0.850 when 60 members areassembled. The plots of training and external predictions versusexperimental activities employing 60-member NNEs are illustratedin Figure 2.
The described validation procedure is conceptually similar to aleave-several-out cross-validation process and can be considered asinternal validation. In recent studies, some criticism has been direc-ted to the use of internal validation (cross-validation) in QSAR lit-erature as a measure of predictability (57,58). However, Doweyko(58) also suggests that the fact of fitting well an external set doesnot necessarily mean that the model is predictive. A high R2-valueof external predictions may be attributed to the care taken to
choose a test set that was well within the descriptor space utilizedby the training set. The test set in these cases loses its independ-ence and should be considered a special extension of the trainingset, as information from the training set was used in its selection.The predictivity should be evaluated for compounds of the externalset contributing with new features. Our method illustrates that, ifwe split the data set in several training and test sets, the worsttest set prediction is not too bad (R2 ¼ 0.63; Figure 1, one memberensemble) while the application of other split can lead to a verygood test set prediction (R2 ¼ 0.97). However, the real quality ofthe model should be evaluated when several splits are averaged,i.e. when members of the ensemble increase.
Kohonen self-organizing neural networkanalysisIn order to achieve data differentiation, a Kohonen SOM with 8 · 8neurons was mapped with GA-selected descriptors as input vectors.In a self-organizing neural network, if two input data vectors aresimilar, they will be mapped into the same neuron or into veryclose neurons in the 2D map. Therefore, either group in the mapcan be interpreted as a set of analogs defined by the vectorialspace.
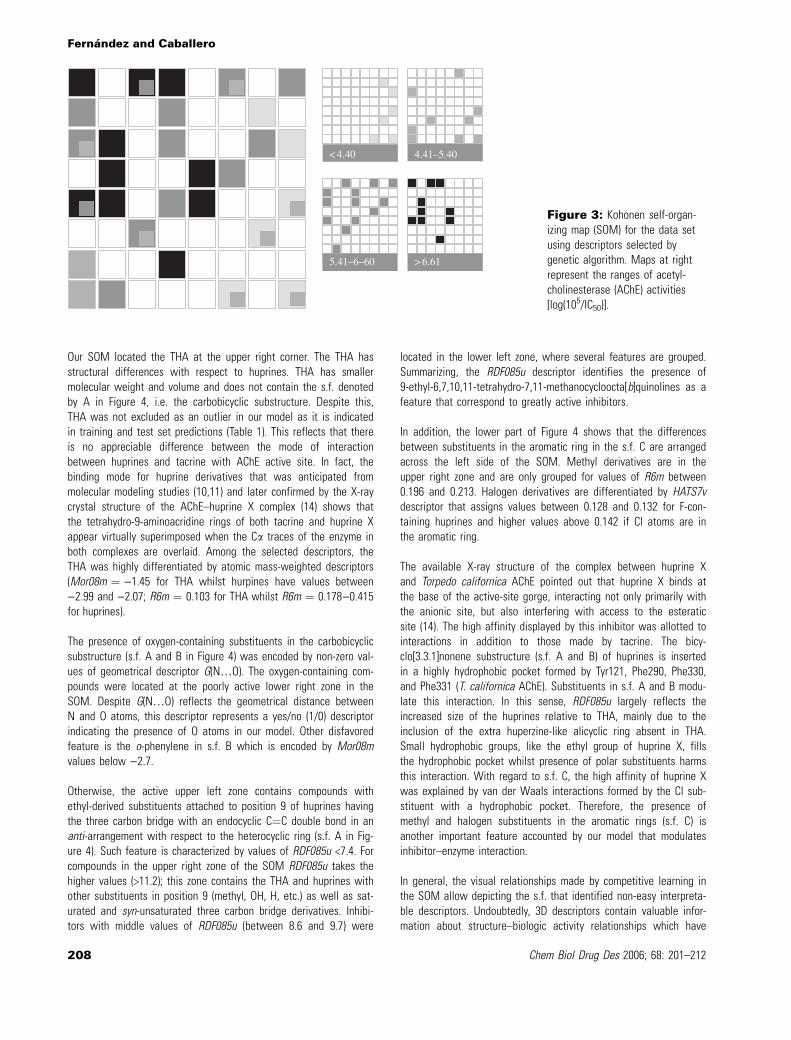
Figure 3 depicts a Kohonen SOM for the 41 AChE modeled inhibi-tors. It is clearly visible that compounds are adequately distributedacross the entire map: 29 of a total of 64 neurons were occupied.As it is observed, compounds with a similar range of activities weregrouped into neighboring areas. It is noteworthy that there is a kindof gradient from the less active compounds at the lower right zoneto the most active compounds at the upper left zone. As a conse-quence, this map can be used to carry out qualitative predictions.The position in the map would be able to assign an approximaterange of activity for unknown compounds.
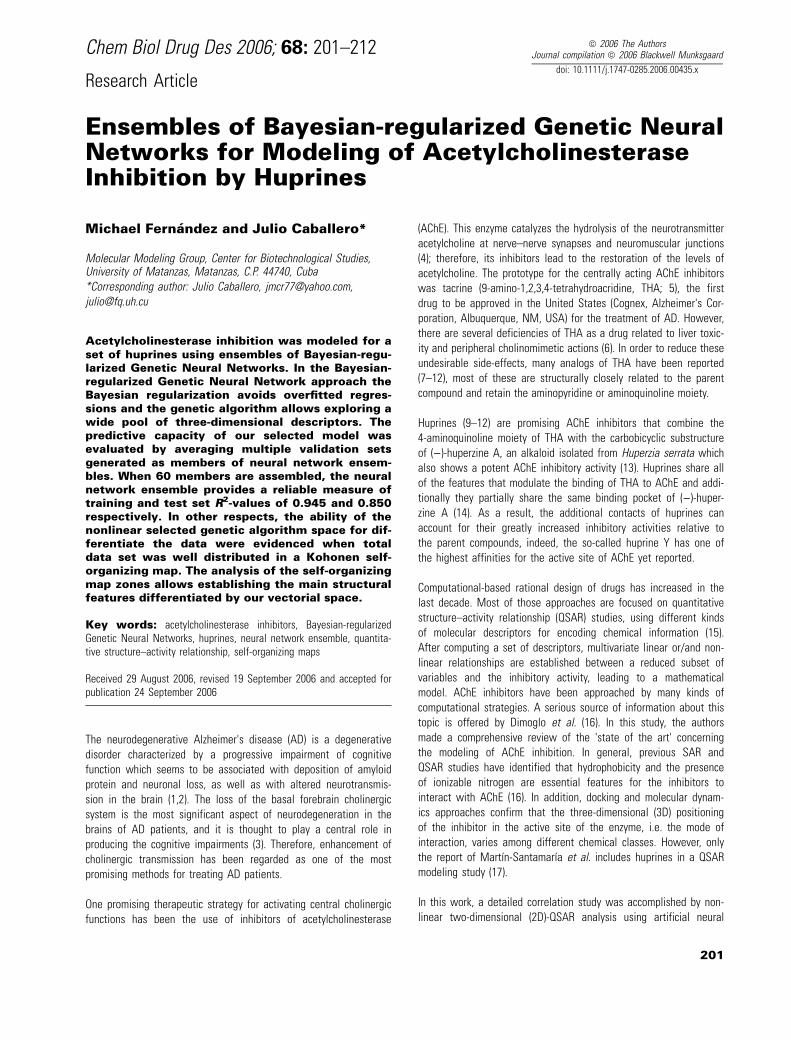
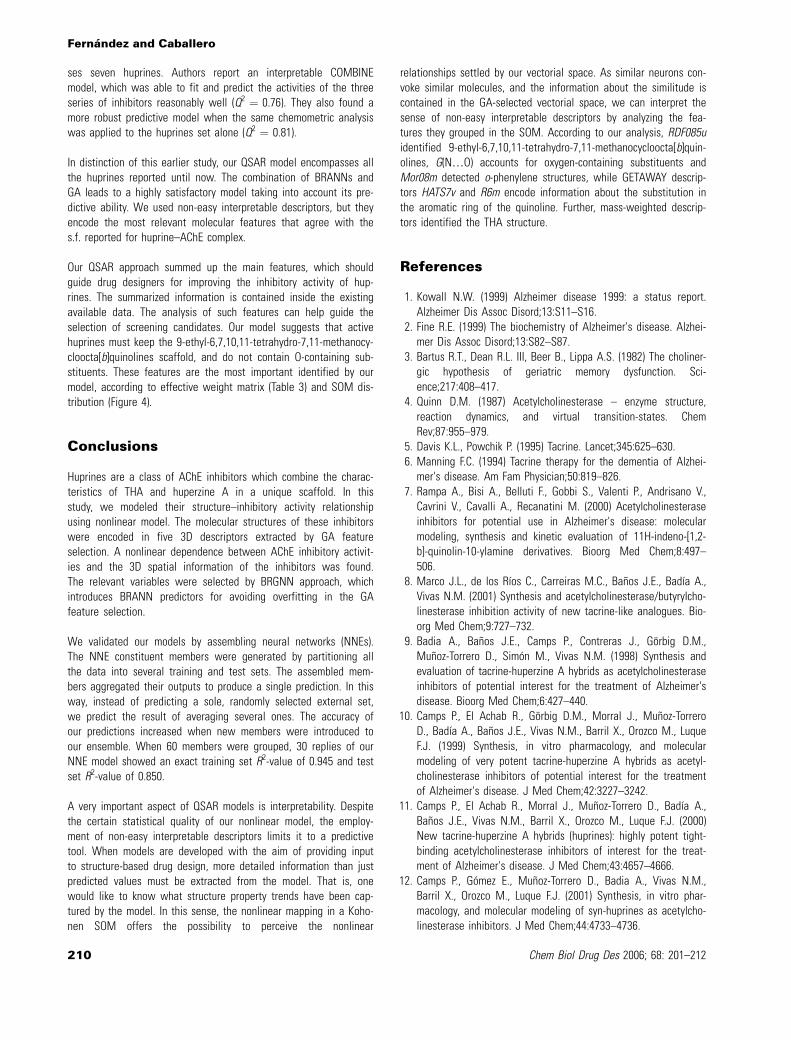
Artificial neural networks are generally more accurate predictorsthan other classes of models; however, they do not offer anyinformation regarding how the inputs values correlate with theoutput value. In other respect, the exploration of an extensivepool of variables allows the finding of relevant features that dis-tinguish the details of important substructural differences. Gener-ally, the GA find well-fitted models, but the exploration of anextensive pool can provoke the selection of descriptors with infor-mation not so easy to interpret. The lack of interpretability forcesthe use of QSAR models as purely predictive tools rather than asan aid in the understanding of structure property trends. In ourapproach, we established a nonlinear relationship that involvesnon-easy interpretable 3D descriptors. Despite the unclear physico-chemical sense of these descriptors, they encode s.f., such as thepresence of substituents, rings, and branching patterns. In thissense, we inspected the Kohonen SOM for establishing the maincharacteristics differentiated by our vectorial space (Figure 4). Thes.f. grouped by Kohonen SOM were examined and related to therange of the variables for each compound. Each compound hassix variables for such analysis: the dependent variable [log(105/IC50)], and the five independent variables [G(N…O), RDF085u,Mor08m, HATS7v, and R6m]. The inspection of the values of thesevariables in each zone allows finding some rules.
3 4 5 6 7 8
3
4
5
6
7
8
Pre
dict
ed lo
g (1
05 /IC
50)
Experimental log (105 /IC50)
(•) training set R2 = 0.945
(o) test set R2 = 0.850
Figure 2: Plot of predicted versus experimental log(105/IC50) val-ues for acetylcholinesterase (AChE) inhibition by huprines using60-member NNEs [(•) training predictions; (s) external predictions].
Ensembles of BRGNN
Chem Biol Drug Des 2006; 68: 201–212 207
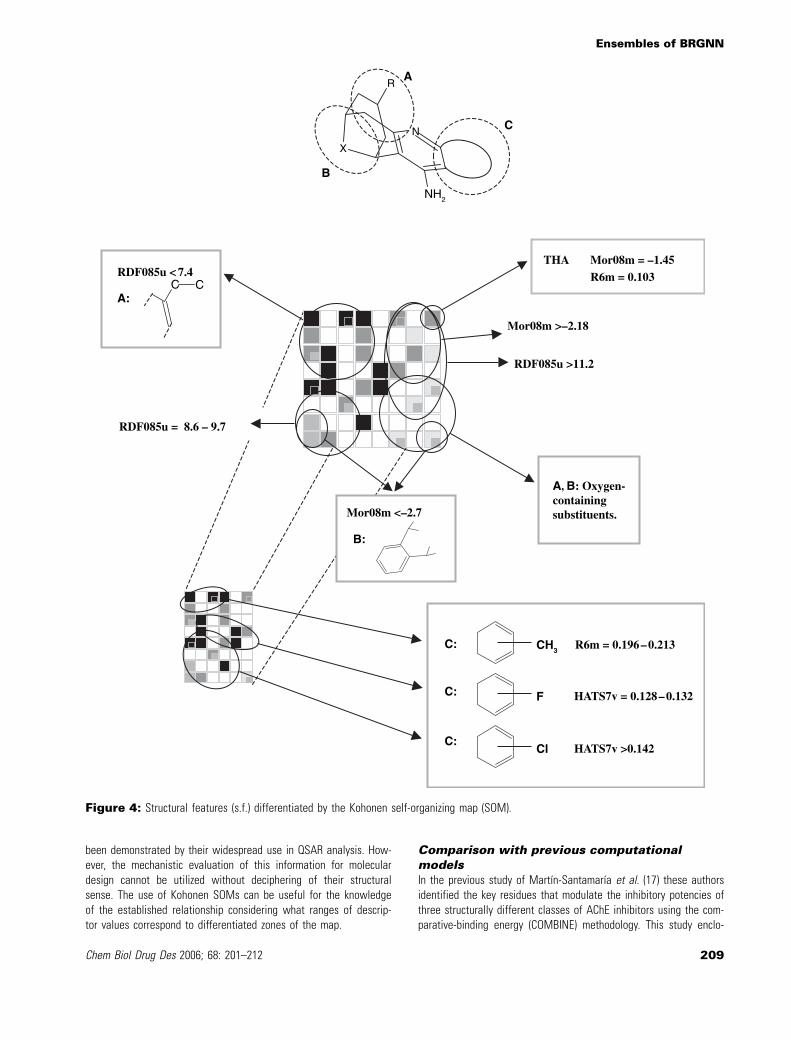
Our SOM located the THA at the upper right corner. The THA hasstructural differences with respect to huprines. THA has smallermolecular weight and volume and does not contain the s.f. denotedby A in Figure 4, i.e. the carbobicyclic substructure. Despite this,THA was not excluded as an outlier in our model as it is indicatedin training and test set predictions (Table 1). This reflects that thereis no appreciable difference between the mode of interactionbetween huprines and tacrine with AChE active site. In fact, thebinding mode for huprine derivatives that was anticipated frommolecular modeling studies (10,11) and later confirmed by the X-raycrystal structure of the AChE–huprine X complex (14) shows thatthe tetrahydro-9-aminoacridine rings of both tacrine and huprine Xappear virtually superimposed when the Ca traces of the enzyme inboth complexes are overlaid. Among the selected descriptors, theTHA was highly differentiated by atomic mass-weighted descriptors(Mor08m ¼ )1.45 for THA whilst hurpines have values between)2.99 and )2.07; R6m ¼ 0.103 for THA whilst R6m ¼ 0.178)0.415for huprines).
The presence of oxygen-containing substituents in the carbobicyclicsubstructure (s.f. A and B in Figure 4) was encoded by non-zero val-ues of geometrical descriptor G(N…O). The oxygen-containing com-pounds were located at the poorly active lower right zone in theSOM. Despite G(N…O) reflects the geometrical distance betweenN and O atoms, this descriptor represents a yes/no (1/0) descriptorindicating the presence of O atoms in our model. Other disfavoredfeature is the o-phenylene in s.f. B which is encoded by Mor08mvalues below )2.7.
Otherwise, the active upper left zone contains compounds withethyl-derived substituents attached to position 9 of huprines havingthe three carbon bridge with an endocyclic C¼C double bond in ananti-arrangement with respect to the heterocyclic ring (s.f. A in Fig-ure 4). Such feature is characterized by values of RDF085u <7.4. Forcompounds in the upper right zone of the SOM RDF085u takes thehigher values (>11.2); this zone contains the THA and huprines withother substituents in position 9 (methyl, OH, H, etc.) as well as sat-urated and syn-unsaturated three carbon bridge derivatives. Inhibi-tors with middle values of RDF085u (between 8.6 and 9.7) were
located in the lower left zone, where several features are grouped.Summarizing, the RDF085u descriptor identifies the presence of9-ethyl-6,7,10,11-tetrahydro-7,11-methanocycloocta[b]quinolines as afeature that correspond to greatly active inhibitors.
In addition, the lower part of Figure 4 shows that the differencesbetween substituents in the aromatic ring in the s.f. C are arrangedacross the left side of the SOM. Methyl derivatives are in theupper right zone and are only grouped for values of R6m between0.196 and 0.213. Halogen derivatives are differentiated by HATS7vdescriptor that assigns values between 0.128 and 0.132 for F-con-taining huprines and higher values above 0.142 if Cl atoms are inthe aromatic ring.
The available X-ray structure of the complex between huprine Xand Torpedo californica AChE pointed out that huprine X binds atthe base of the active-site gorge, interacting not only primarily withthe anionic site, but also interfering with access to the esteraticsite (14). The high affinity displayed by this inhibitor was allotted tointeractions in addition to those made by tacrine. The bicy-clo[3.3.1]nonene substructure (s.f. A and B) of huprines is insertedin a highly hydrophobic pocket formed by Tyr121, Phe290, Phe330,and Phe331 (T. californica AChE). Substituents in s.f. A and B modu-late this interaction. In this sense, RDF085u largely reflects theincreased size of the huprines relative to THA, mainly due to theinclusion of the extra huperzine-like alicyclic ring absent in THA.Small hydrophobic groups, like the ethyl group of huprine X, fillsthe hydrophobic pocket whilst presence of polar substituents harmsthis interaction. With regard to s.f. C, the high affinity of huprine Xwas explained by van der Waals interactions formed by the Cl sub-stituent with a hydrophobic pocket. Therefore, the presence ofmethyl and halogen substituents in the aromatic rings (s.f. C) isanother important feature accounted by our model that modulatesinhibitor–enzyme interaction.
In general, the visual relationships made by competitive learning inthe SOM allow depicting the s.f. that identified non-easy interpreta-ble descriptors. Undoubtedly, 3D descriptors contain valuable infor-mation about structure–biologic activity relationships which have
5.41–6–60 > 6.61
4.41–5.40< 4.40
Figure 3: Kohonen self-organ-izing map (SOM) for the data setusing descriptors selected bygenetic algorithm. Maps at rightrepresent the ranges of acetyl-cholinesterase (AChE) activities[log(105/IC50)].
Fernandez and Caballero
208 Chem Biol Drug Des 2006; 68: 201–212
been demonstrated by their widespread use in QSAR analysis. How-ever, the mechanistic evaluation of this information for moleculardesign cannot be utilized without deciphering of their structuralsense. The use of Kohonen SOMs can be useful for the knowledgeof the established relationship considering what ranges of descrip-tor values correspond to differentiated zones of the map.
Comparison with previous computationalmodelsIn the previous study of Mart�n-Santamar�a et al. (17) these authorsidentified the key residues that modulate the inhibitory potencies ofthree structurally different classes of AChE inhibitors using the com-parative-binding energy (COMBINE) methodology. This study enclo-
C
B
A
X
N
NH2
R
RDF085u = 8.6 – 9.7
RDF085u < 7.4
.
C CA:
Mor08m <–2.7
B:
RDF085u >11.2
Mor08m >–2.18
A, B: Oxygen-containingsubstituents.
THA Mor08m = –1.45 R6m = 0.103
C:
C:
C:
CH3
F
Cl
HATS7v = 0.128–0.132
HATS7v >0.142
R6m = 0.196–0.213
Figure 4: Structural features (s.f.) differentiated by the Kohonen self-organizing map (SOM).
Ensembles of BRGNN
Chem Biol Drug Des 2006; 68: 201–212 209
ses seven huprines. Authors report an interpretable COMBINEmodel, which was able to fit and predict the activities of the threeseries of inhibitors reasonably well (Q2 ¼ 0.76). They also found amore robust predictive model when the same chemometric analysiswas applied to the huprines set alone (Q2 ¼ 0.81).
In distinction of this earlier study, our QSAR model encompasses allthe huprines reported until now. The combination of BRANNs andGA leads to a highly satisfactory model taking into account its pre-dictive ability. We used non-easy interpretable descriptors, but theyencode the most relevant molecular features that agree with thes.f. reported for huprine–AChE complex.
Our QSAR approach summed up the main features, which shouldguide drug designers for improving the inhibitory activity of hup-rines. The summarized information is contained inside the existingavailable data. The analysis of such features can help guide theselection of screening candidates. Our model suggests that activehuprines must keep the 9-ethyl-6,7,10,11-tetrahydro-7,11-methanocy-cloocta[b]quinolines scaffold, and do not contain O-containing sub-stituents. These features are the most important identified by ourmodel, according to effective weight matrix (Table 3) and SOM dis-tribution (Figure 4).
Conclusions
Huprines are a class of AChE inhibitors which combine the charac-teristics of THA and huperzine A in a unique scaffold. In thisstudy, we modeled their structure–inhibitory activity relationshipusing nonlinear model. The molecular structures of these inhibitorswere encoded in five 3D descriptors extracted by GA featureselection. A nonlinear dependence between AChE inhibitory activit-ies and the 3D spatial information of the inhibitors was found.The relevant variables were selected by BRGNN approach, whichintroduces BRANN predictors for avoiding overfitting in the GAfeature selection.
We validated our models by assembling neural networks (NNEs).The NNE constituent members were generated by partitioning allthe data into several training and test sets. The assembled mem-bers aggregated their outputs to produce a single prediction. In thisway, instead of predicting a sole, randomly selected external set,we predict the result of averaging several ones. The accuracy ofour predictions increased when new members were introduced toour ensemble. When 60 members were grouped, 30 replies of ourNNE model showed an exact training set R2-value of 0.945 and testset R2-value of 0.850.
A very important aspect of QSAR models is interpretability. Despitethe certain statistical quality of our nonlinear model, the employ-ment of non-easy interpretable descriptors limits it to a predictivetool. When models are developed with the aim of providing inputto structure-based drug design, more detailed information than justpredicted values must be extracted from the model. That is, onewould like to know what structure property trends have been cap-tured by the model. In this sense, the nonlinear mapping in a Koho-nen SOM offers the possibility to perceive the nonlinear
relationships settled by our vectorial space. As similar neurons con-voke similar molecules, and the information about the similitude iscontained in the GA-selected vectorial space, we can interpret thesense of non-easy interpretable descriptors by analyzing the fea-tures they grouped in the SOM. According to our analysis, RDF085uidentified 9-ethyl-6,7,10,11-tetrahydro-7,11-methanocycloocta[b]quin-olines, G(N…O) accounts for oxygen-containing substituents andMor08m detected o-phenylene structures, while GETAWAY descrip-tors HATS7v and R6m encode information about the substitution inthe aromatic ring of the quinoline. Further, mass-weighted descrip-tors identified the THA structure.
References
1. Kowall N.W. (1999) Alzheimer disease 1999: a status report.Alzheimer Dis Assoc Disord;13:S11–S16.
2. Fine R.E. (1999) The biochemistry of Alzheimer's disease. Alzhei-mer Dis Assoc Disord;13:S82–S87.
3. Bartus R.T., Dean R.L. III, Beer B., Lippa A.S. (1982) The choliner-gic hypothesis of geriatric memory dysfunction. Sci-ence;217:408–417.
4. Quinn D.M. (1987) Acetylcholinesterase – enzyme structure,reaction dynamics, and virtual transition-states. ChemRev;87:955–979.
5. Davis K.L., Powchik P. (1995) Tacrine. Lancet;345:625–630.6. Manning F.C. (1994) Tacrine therapy for the dementia of Alzhei-
mer's disease. Am Fam Physician;50:819–826.7. Rampa A., Bisi A., Belluti F., Gobbi S., Valenti P., Andrisano V.,
Cavrini V., Cavalli A., Recanatini M. (2000) Acetylcholinesteraseinhibitors for potential use in Alzheimer's disease: molecularmodeling, synthesis and kinetic evaluation of 11H-indeno-[1,2-b]-quinolin-10-ylamine derivatives. Bioorg Med Chem;8:497–506.
8. Marco J.L., de los R�os C., Carreiras M.C., BaÇos J.E., Bad�a A.,Vivas N.M. (2001) Synthesis and acetylcholinesterase/butyrylcho-linesterase inhibition activity of new tacrine-like analogues. Bio-org Med Chem;9:727–732.
9. Badia A., BaÇos J.E., Camps P., Contreras J., Gçrbig D.M.,MuÇoz-Torrero D., Sim�n M., Vivas N.M. (1998) Synthesis andevaluation of tacrine-huperzine A hybrids as acetylcholinesteraseinhibitors of potential interest for the treatment of Alzheimer'sdisease. Bioorg Med Chem;6:427–440.
10. Camps P., El Achab R., Gçrbig D.M., Morral J., MuÇoz-TorreroD., Bad�a A., BaÇos J.E., Vivas N.M., Barril X., Orozco M., LuqueF.J. (1999) Synthesis, in vitro pharmacology, and molecularmodeling of very potent tacrine-huperzine A hybrids as acetyl-cholinesterase inhibitors of potential interest for the treatmentof Alzheimer's disease. J Med Chem;42:3227–3242.
11. Camps P., El Achab R., Morral J., MuÇoz-Torrero D., Bad�a A.,BaÇos J.E., Vivas N.M., Barril X., Orozco M., Luque F.J. (2000)New tacrine-huperzine A hybrids (huprines): highly potent tight-binding acetylcholinesterase inhibitors of interest for the treat-ment of Alzheimer's disease. J Med Chem;43:4657–4666.
12. Camps P., G�mez E., MuÇoz-Torrero D., Badia A., Vivas N.M.,Barril X., Orozco M., Luque F.J. (2001) Synthesis, in vitro phar-macology, and molecular modeling of syn-huprines as acetylcho-linesterase inhibitors. J Med Chem;44:4733–4736.
Fernandez and Caballero
210 Chem Biol Drug Des 2006; 68: 201–212

13. Kozikowski A.P., Thiels E., Tang X.-C., Hanin I. (1992) HuperzineA – a possible lead structure in the treatment of Alzheimer'sdisease. Adv Med Chem;1:175–205.
14. Dvir H., Wong D.M., Harel M., Barril X., Orozco M., Luque F.J.,MuÇoz-Torrero D., Camps P., Rosenberry T.L., Silman I., SussmanJ.L. (2002) 3D Structure of Torpedo californica acetylcholinest-erase complexed with huprine X at 2.1 � resolution: kinetic andmolecular dynamic correlates. Biochemistry;41:2970–2981.
15. Hansch C., Leo A. (1995) Exploring QSAR: Fundamentals andApplications in Chemistry and Biology. Washington, DC: Ameri-can Chemical Society.
16. Dimoglo A.S., Shvets N.M., Tetko I.V., Livingstone D.J. (2001)Electronic-topological investigation of the structure – acetylcholi-nesterase inhibitor activity relationship in the series of N-ben-zylpiperidine derivatives. Quant Struct-Act Relat;20:31–45.
17. Mart�n-Santamar�a S., MuÇoz-Muriedas J., Luque F.J., Gago F.(2004) Modulation of binding strength in several classes of act-ive site inhibitors of acetylcholinesterase studied by comparativebinding energy analysis. J Med Chem;47:4471–4482.
18. Zupan J., Gasteiger J. (1991) Neural networks: a new methodfor solving chemical problems or just a passing phase? AnalChim Acta;248:1–30.
19. Fern�ndez M., Tundidor-Camba A., Caballero J. (2005) 2D Auto-correlation modeling of the activity of trihalobenzocycloheptapy-ridine analogues as farnesyl protein transferase inhibitors. MolSimul;31:575–584.
20. Gonz�lez M.P., Caballero J., Tundidor-Camba A., Helguera A.M.,Fern�ndez M. (2006) Modeling of farnesyltransferase inhibitionby some thiol and non-thiol peptidomimetic inhibitors using gen-etic neural networks and RDF approaches. Bioorg MedChem;14:200–213.
21. Fern�ndez M., Caballero J. (2006) Modeling of activity of cyclicurea HIV-1 protease inhibitors using regularized-artificial neuralnetworks. Bioorg Med Chem;14:280–294.
22. Guha R., Jurs P.C. (2004) Development of linear, ensemble, andnonlinear models for the prediction and interpretation of thebiological activity of a set of PDGFR inhibitors. J Chem Inf Com-put Sci;44:2179–2189.
23. HyperChem 7.0 (2002) Hypercube, Inc., Gainsville, FL, USA.24. Stewart J.J.P. (1989) Optimization of parameters for semi-empir-
ical methods I-method. J Comput Chem;10:210–222.25. Stewart J.J.P. (1993) MOPAC, version 6. Colorado Springs, CO:
Frank J. Seiler Research Laboratory, US Air Force Academy.26. Todeschini R., Consonni V., Mauri A., Pavan M. (2003) Dragon,
version 3.0. Milan: Milano Chemometrics and QSAR ResearchGroup.
27. Kruszewski J., Krygowski T.M. (1972) Harmonical oscillatorapproach to the definition of aromaticity. TetrahedronLett;36:3839–3842.
28. Jug K. (1983) A bond order approach to ring current and aroma-ticity. J Org Chem;48:1344–1348.
29. Randic M. (1995) Molecular shape profiles. J Chem Inf ComputSci;35:373–382.
30. Kier L.B., Hall L.H. (1986) Molecular Connectivity in Structure-Activity Analysis. Chichester, UK: RSP-Wiley.
31. Hemmer M.C., Steinhauer V., Gasteiger J. (1999) Deriving the3D structure of organic molecules from their infrared spectra.Vib Spectrosc;19:151–164.
32. Schuur J., Selzer P., Gasteiger J. (1996) The coding of thethree-dimensional structure of molecules by molecular trans-forms and its application to structure-spectra correlations andstudies of biological activity. J Chem Inf Comput Sci;36:334–344.
33. Todeschini R., Lansagni M., Marengo E. (1994) New moleculardescriptors for 2D and 3D structures theory. J Chemo-metr;8:263–272.
34. Consonni V., Todeschini R., Pavan M. (2002) Structure/responsecorrelations and similarity/diversity analysis by GETAWAY de-scriptors: 1. Theory of the novel 3D molecular descriptors.J Chem Inf Comput Sci;42:682–692.
35. Caballero J., Fern�ndez M. (2006) Linear and nonlinear modelingof antifungal activity of some heterocyclic ring derivatives usingmultiple linear regression and Bayesian-regularized Neural Net-works. J Mol Model;12:168–181.
36. So S.S., Karplus M. (1996) Evolutionary optimization in quantita-tive structure-activity relationship: an application of geneticneural networks. J Med Chem;39:1521–1530.
37. Mackay D.J.C. (1992) Bayesian interpolation. Neural Com-put;4:415–447.
38. Mackay D.J.C. (1992) A practical Bayesian framework for Back-prop networks. Neural Comput;4:448–472.
39. Burden F.R., Winkler D.A. (1999) Robust QSAR models usingBayesian-regularized Neural Networks. J Med Chem;42:3183–3187.
40. Winkler D.A., Burden F.R. (2004) Bayesian neural nets for mode-ling in drug discovery. Biosilico;2:104–111.
41. MATLAB, version 7.0. (2004) The MathWorks, Inc., Natick, MA,USA. Available at: http://www.mathworks.com.
42. Foresee F.D., Hagan M.T. (1997) Gauss-Newton approximation toBayesian learning. Proceedings of the 1997 International JointConference on Neural Networks, IEEE, Houston;p. 1930–1935.
43. Agrafiotis D.K., CedeÇo W., Lobanov V.S. (2002) On the use ofneural network ensembles in QSAR and QSPR. J Chem Inf Com-put Sci;42:903–911.
44. Hansen L.K., Salamon P. (1990) Neural network ensembles. IEEETrans Pattern Anal Mach Intell;12:993–1001.
45. Fern�ndez M., Tundidor-Camba A., Caballero J. (2005) Modelingof cyclin-dependent kinase inhibition by 1H-pyrazolo[3,4-d]pyrim-idine derivatives using artificial neural network ensembles.J Chem Inf Model;45:1884–1895.
46. Kohonen T. (1982) Self-organized formation of topologically cor-rect feature maps. Biol Cybern;43:59–69.
47. Mangiameli P., Chen S.K., West D. (1996) A comparison of SOMneural network and hierarchical clustering methods. Eur J OperRes;93:402–417.
48. Hopfinger A.J., Wang S., Tokarski J.S., Jin B., Albuquerque M.,Madhav P.J., Duraiswami C. (1997) Construction of 3-D QSARmodels using the 4-D QSAR formalism. J Am ChemSoc;119:10509–10524.
49. Moreau G., Broto P. (1980) Autocorrelation of molecular struc-tures: application to SAR studies. Nouv J Chim;4:757–764.
50. Katritzky A.R., Mu L., Lobanov V.S., Karelson M. (1996) Correla-tion of boiling points with molecular structure: I. A training setof 298 diverse organics and a test set of 9 simple inorganics.J Phys Chem;100:10400–10407.
Ensembles of BRGNN
Chem Biol Drug Des 2006; 68: 201–212 211

51. Sussman J.L., Harel M., Frolow F., Oefner C., Goldman A., TokerL., Silman I. (1991) Atomic structure of acetylcholinesterase fromTorpedo californica: a prototypic acetylcholine-binding protein.Science;253:872–879.
52. Guha R., Stanton D.T., Jurs P.C. (2005) Interpreting computa-tional neural network QSAR models: a detailed interpretation ofthe weights and biases. J Chem Inf Model;45:1109–1121.
53. Stanton D.T. (2003) On the physical interpretation of QSAR mod-els. J Chem Inf Comput Sci;43:1423–1433.
54. Tetko I.V., Livingstone D.J., Luik A.I. (1995) Neural network stud-ies: 1. Comparison of overfitting and overtraining. J Chem InfComput Sci;35:826–833.
55. Baumann K. (2005) Chance correlation in variable subset regres-sion: influence of the objective function, the selection mechan-ism, and ensemble averaging. QSAR Comb Sci;24:1033–1046.
56. Krogh A., Vedelsby J. (1995) Neural network ensembles, cross-validation and active learning. In: Tesauro G., Touretzky D., LeanT., editors. Advances in Neural Information Processing Systems7. Cambridge, MA: MIT Press;p. 231–238.
57. Golbraikh A., Tropsha A. (2002) Beware of q2! J Mol GraphModel;20:269–276.
58. Doweyko A.M. (2004) 3D-QSAR illusions. J Comput Aided MolDes;18:587–596.
212 Chem Biol Drug Des 2006; 68: 201–212
Fernandez and Caballero