Embed Size (px)
Citation preview

ENSO and India Precipitation using SODA and 20CRv2
SULAGNA RAY BENJAMIN GIESE
TEXAS A&M UNIVERSITY
ACRE 2010, Baltimore, 3-5 Nov. 2010

El Niño – Indian Summer Monsoon

Difference in Composite SST anomaly during JJAS of Drought and Non Drought El Niño years
Kumar et al. 2006
Literature:

• El Niño Modoki vs. El Niño - Ashok et al. (2007)
• Central Pacific El Niño – Kao and Yu (2009)
• Warm Pool El Niño – Kug et al. (2009)
Different flavors of El Niño
Literature:

• Precipitation from 20CRv2
• SST from SODA 2.2.4
• 20CRv2 in surface boundary condition
• HADISST in surface boundary condition
• Anomalies are calculated
Data used in the analysis:
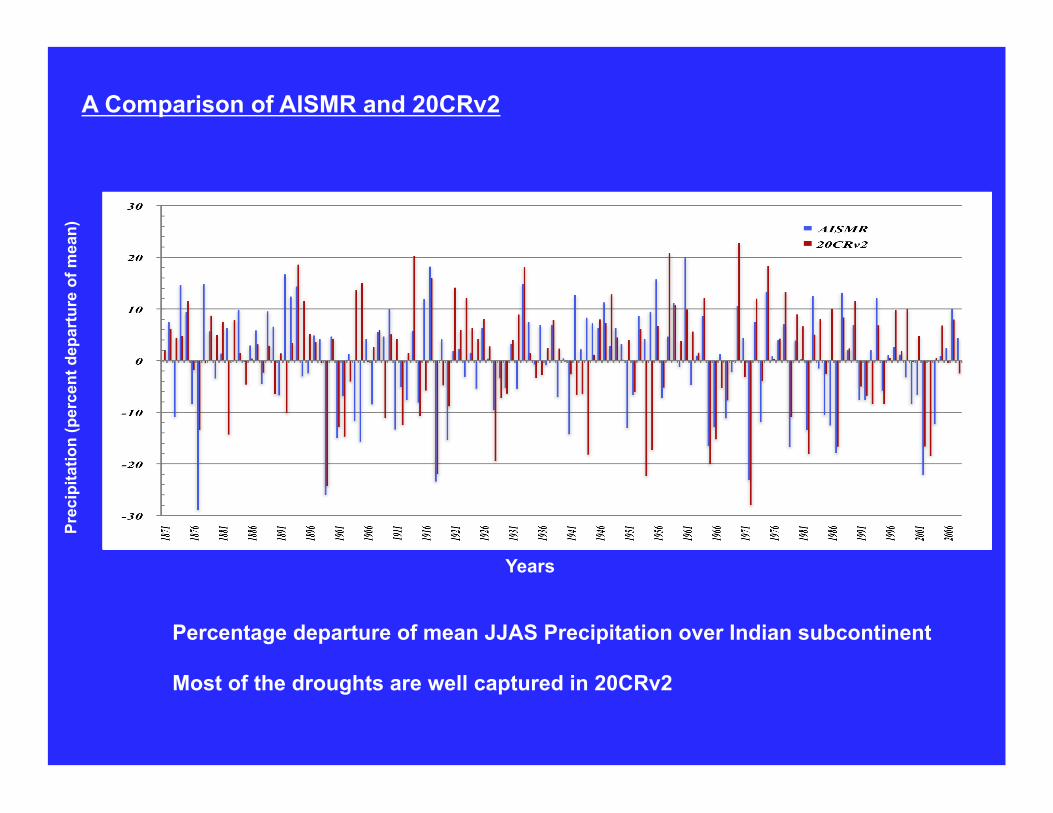
A Comparison of AISMR and 20CRv2 Pr
ecip
itatio
n (p
erce
nt d
epar
ture
of m
ean)
Years
Percentage departure of mean JJAS Precipitation over Indian subcontinent
Most of the droughts are well captured in 20CRv2

Standard Measure of El Niño : NINO-3.4 SST anomaly
NINO-3.4 SST anomaly from SODA 2.2.4 (Red) and HADISST (Black)
Stronger El Niños in SODA compared to HADISST
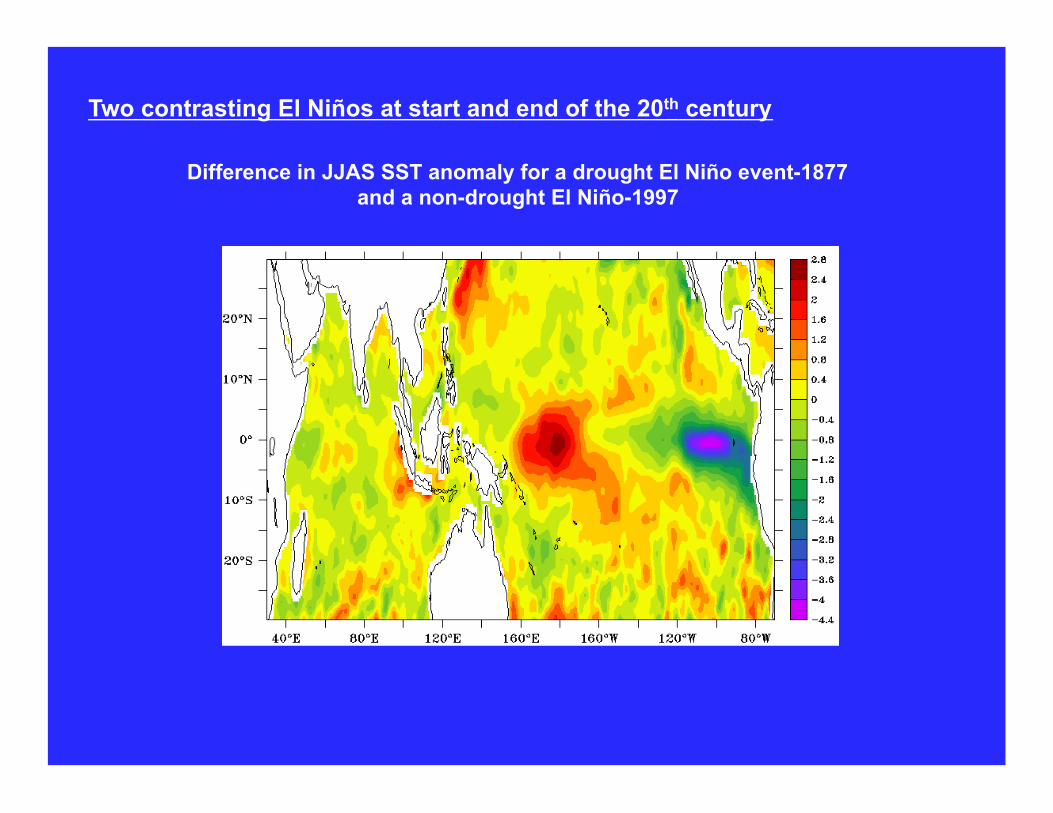
Difference in JJAS SST anomaly for a drought El Niño event-1877 and a non-drought El Niño-1997
Two contrasting El Niños at start and end of the 20th century

• Locates the longitude of center of heat of anomalously warm waters
• SST anomaly must be greater than 0.5°C
• Area must be greater or equal to the NINO-3.4 region
NINO-3.4 Index
Center of Heat Index : CHI
1997-98

CHI : A measure for El Niño
Strength of El Niños
Position of warmest anomaly on equatorial Pacific
Area of warmest anomaly on equatorial Pacific
Am
plitu
de °C
Lo
ngitu
de °E
A
rea ×1
0 6
Km
Years

Precipitation departure from mean (AISMR and 20CRv2) vs. CHI-DJF Amplitude of ENSO
CHI-amplitude (°C)
Prec
ipita
tion
depa
rtur
e fr
om m
ean
(%)
ENSO (CHI) – Indian Monsoon Precipitation

Composite of Precipitation anomaly during JJAS and DJF of El Niño years from 20CRv2
JJAS (mm/month) DJF (mm/month)
Composites : Precipitation

Comparison of Composites of Precipitation anomaly for Drought and Non-Drought ENSO years, JJAS
Composites : Precipitation
Drought El Niño (JJAS, mm/month) Non-Drought El Niño (JJAS, mm/month)

Composites : SST
Comparison of Composites of SST anomaly for Drought and Non-Drought ENSO years, JJAS
Drought El Niño (JJAS, ° C) Non-Drought El Niño (JJAS, ° C)

Composite difference of JJAS SST anomaly for Drought and Non-Drought ENSO years based on Kumar et al.’s methodology
Post-1950 period warmer central equatorial Pacific seen in SODA similar to Kumar et al.’s analysis
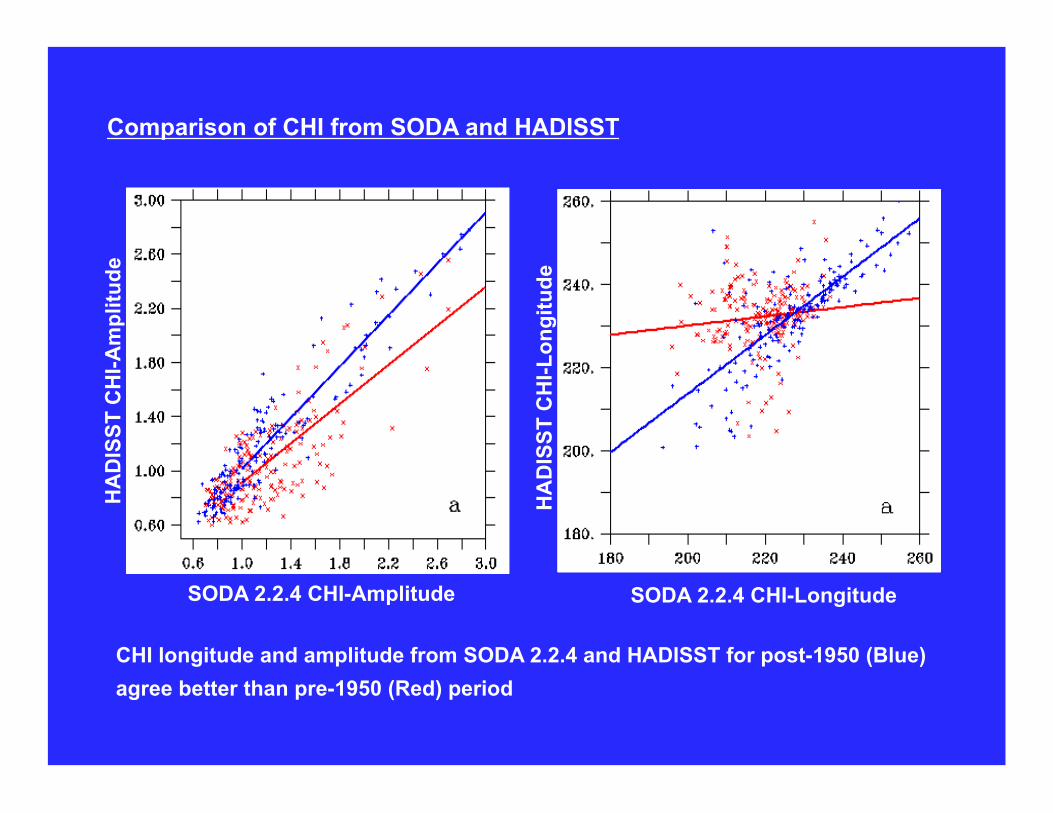
Comparison of CHI from SODA and HADISST H
AD
ISST
CH
I-Am
plitu
de
SODA 2.2.4 CHI-Amplitude SODA 2.2.4 CHI-Longitude
HA
DIS
ST C
HI-L
ongi
tude
CHI longitude and amplitude from SODA 2.2.4 and HADISST for post-1950 (Blue) agree better than pre-1950 (Red) period

Center of Heat Index is used to explore El Niños over 138-year period
• El Niños of the late 19th century as strong as late 20th century
• Late 20th century strong El Niños are smaller compared that of late 19th century
Drought and Non-drought El Niños show only a weak difference in the composite
SST anomaly pattern as compared to the strong difference in Kumar et al. (2006)
SODA agrees better with HADISST in post-1950 than pre-1950
Conclus ions