Embed Size (px)
Citation preview
ENSO Prediction and Policy
• What information do predictions offer?
• What to do with this information?
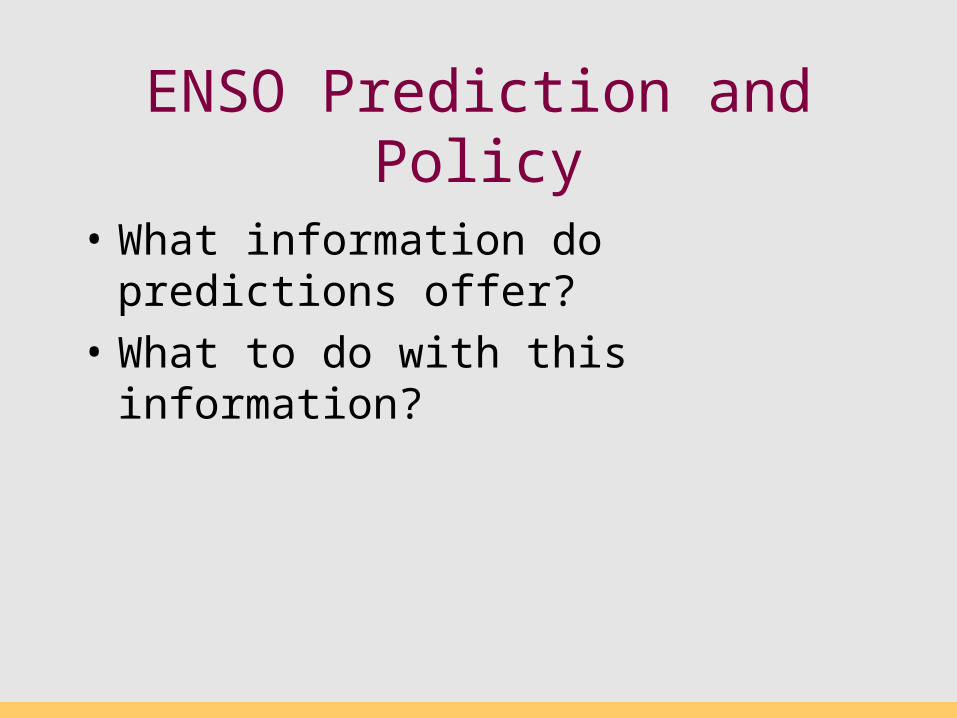
Real Time Ocean ObservationsARGO floats
XBT (eXpandable BathiThermograph)
Moorings
Satellite
SST
Sea Level
M.A. Balmaseda ( ECMWF)
60°S 60°S
30°S30°S
0° 0°
30°N30°N
60°N 60°N
60°E
60°E
120°E
120°E
180°
180°
120°W
120°W
60°W
60°W
0°
0°
X B T p r o b e s : 9 3 7 6 p r o f i l e sOBSERVATION MONITORING Changing observing
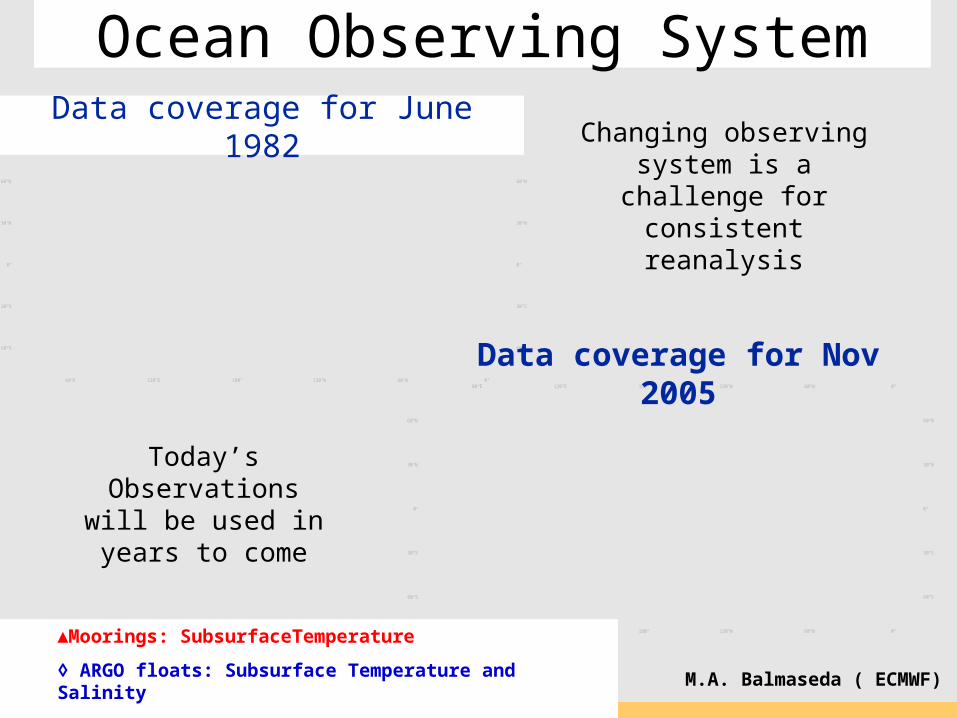
system is a challenge for consistent reanalysis
Today’s Observations will be used in years
to come
60°S 60°S
30°S30°S
0° 0°
30°N30°N
60°N 60°N
60°E
60°E
120°E
120°E
180°
180°
120°W
120°W
60°W
60°W
0°
0°▲Moorings: SubsurfaceTemperature
◊ ARGO floats: Subsurface Temperature and Salinity
+ XBT : Subsurface Temperature
Data coverage for June 1982
Ocean Observing System
M.A. Balmaseda ( ECMWF)
Data coverage for Nov 2005
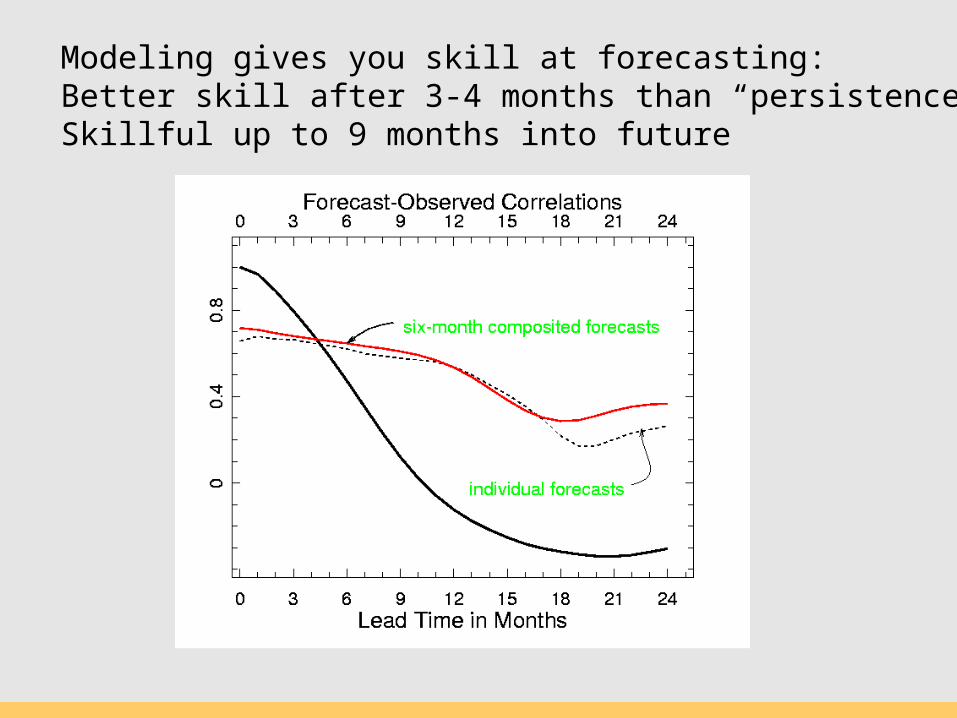
Modeling gives you skill at forecasting: Better skill after 3-4 months than “persistence”Skillful up to 9 months into future
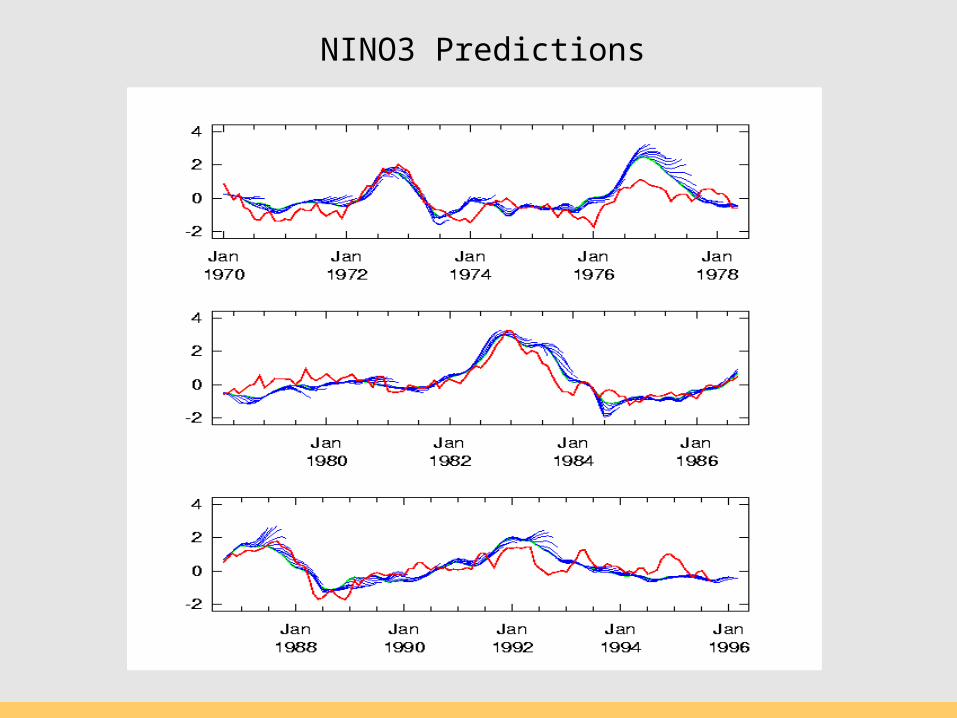
NINO3 Predictions
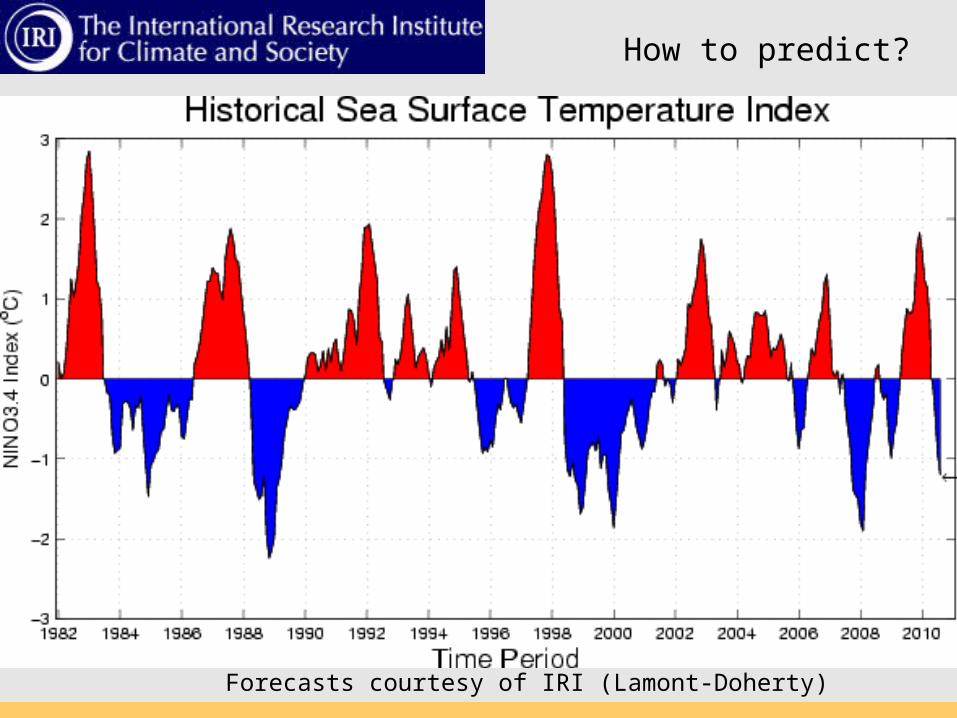
How to predict?
Forecasts courtesy of IRI (Lamont-Doherty)
Problems of the scientific community in communicating with non-scientific users of needed climate information
O Scientist needs to express probabilistic aspect of climate forecasts understandably.
O Media sometimes seek to stimulate customers (for marketing pur- poses), rather than educate/enlighten them. This may involve deemphasizing probabilistic aspects, while emphasizing simple, straightforward, and attention-grabbing aspects. This latter emphasis often encompasses the most extreme or dyer possibilities (e.g. “This La Nina is a major disaster for…”).
O Users at all levels want information that is simple and clear.
O Decision-makers desire high odds in order to rationalize taking special and costly mitigation action.
Problems of the scientific community in communicating with non-scientific users of needed climate information
O Scientists need to help clarify, especially for “middle” players like met service representatives, the difference between the state of ENSO using a definition of the phenomenon itself, and a modified set of ENSO parameters relevant to the climate effects of a particular region.
For example, for northwestern Peru rainfall during Feb-April, the ENSO state based on a basin-wide definition clearly is not what matters most. The original definition of El Nino (based on SST anomaly near the coastline) is clearly more relevant.
Can the northwestern Peruvians accept a distinction between the basin-wide ENSO state and the more local SST state, which they have originally called El Nino?
Problems of the scientific community in communicating with non-scientific users of needed climate information
O If scientists were assigned to make a societal decision, they would likely use mathematics as part of their determination, and would usually also need to learn many details about the particular applica- tion. This would be impractical, as would having the non-scientists learn the mathematical methods. So scientists need to express their knowledge of cause-and-effect, and of the relevant mathematical tools, in some understandable fashion. Possible? O Because of the special orientation of many media representatives, the general public sometimes might receive a more representative set of information if the meteorologists in the service organizations were a “translator” between the scientists and the media and general public. For example, scientists might focus on the unique aspects of a current ENSO episode and how it modulates the canonical probabilities for certain climate outcomes, while the service organization meteorologist would write the equivalent in somewhat simpler, more everyday terms that are a bit closer to what the general public can digest, including the probabilistic aspects. The media could greatly help disseminate the information at this stage.
What do we do with this information?
The same models that predict ENSO state can be used to predict climate changes, globally.
Some regions warm/cold, some wet/dry.
Critical is being able to say “how unusual” climate will be.
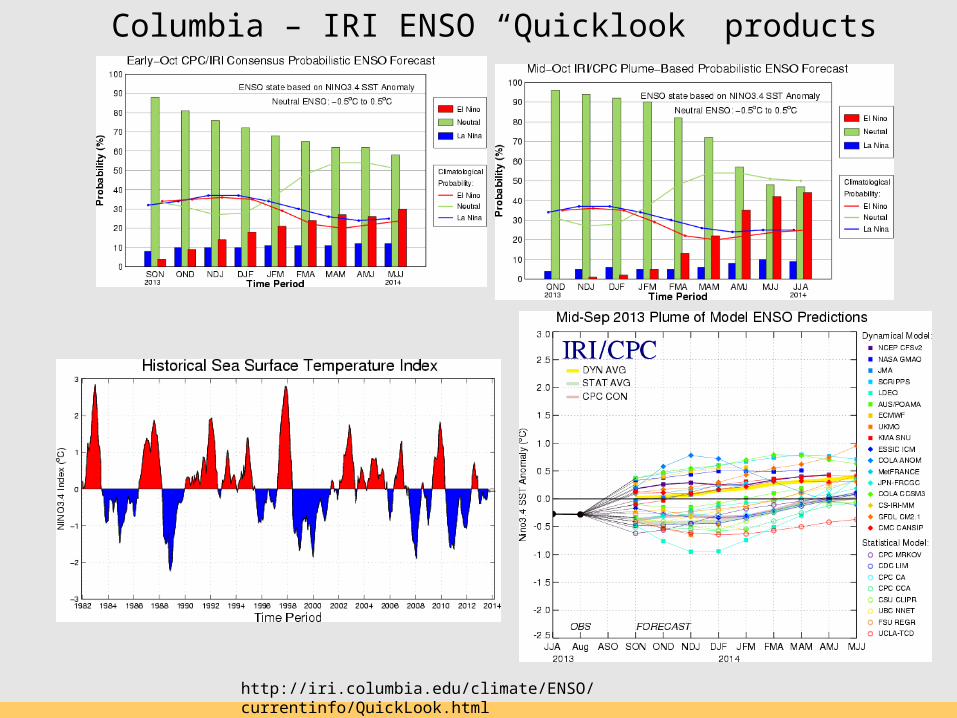
Columbia – IRI ENSO “Quicklook” products
http://iri.columbia.edu/climate/ENSO/currentinfo/QuickLook.html
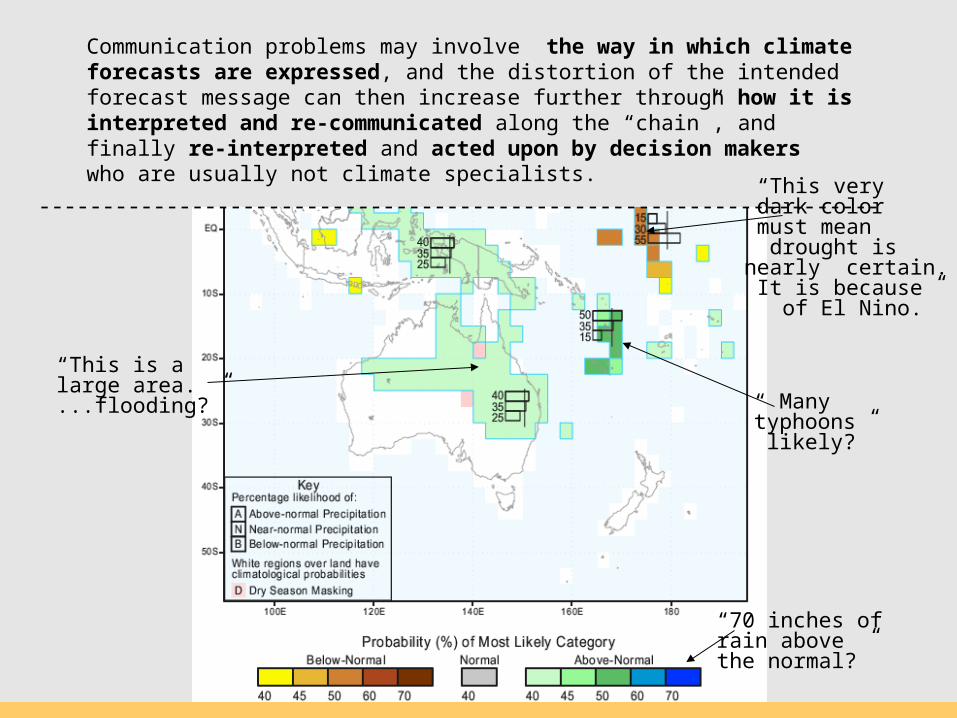
Communication problems may involve the way in which climateforecasts are expressed, and the distortion of the intendedforecast message can then increase further through how it isinterpreted and re-communicated along the “chain”, andfinally re-interpreted and acted upon by decision makerswho are usually not climate specialists.
------------------------------------------------------------------
“ Manytyphoons likely?”
“This is alarge area....flooding?”
“70 inches ofrain abovethe normal?”
“This very dark color must mean drought isnearly certain. It is because of El Nino.”
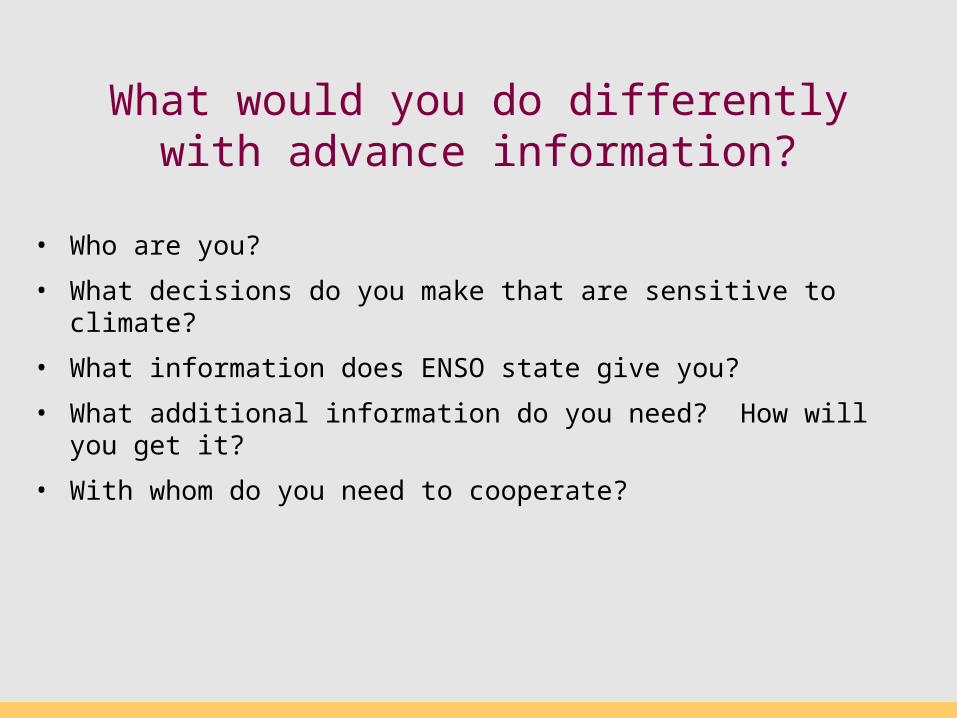
What would you do differently with advance information?
• Who are you?
• What decisions do you make that are sensitive to climate?
• What information does ENSO state give you?
• What additional information do you need? How will you get it?
• With whom do you need to cooperate?
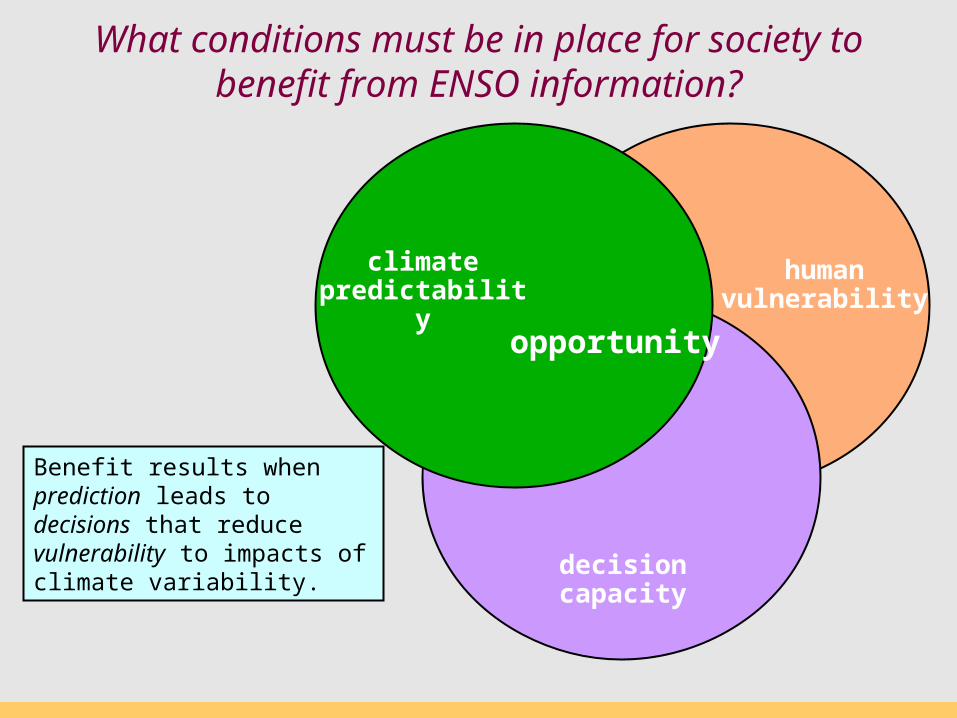
What conditions must be in place for society to benefit from ENSO information?
human vulnerability
decision capacity
climate predictability
opportunity
Benefit results when prediction leads to decisions that reduce vulnerability to impacts of climate variability.
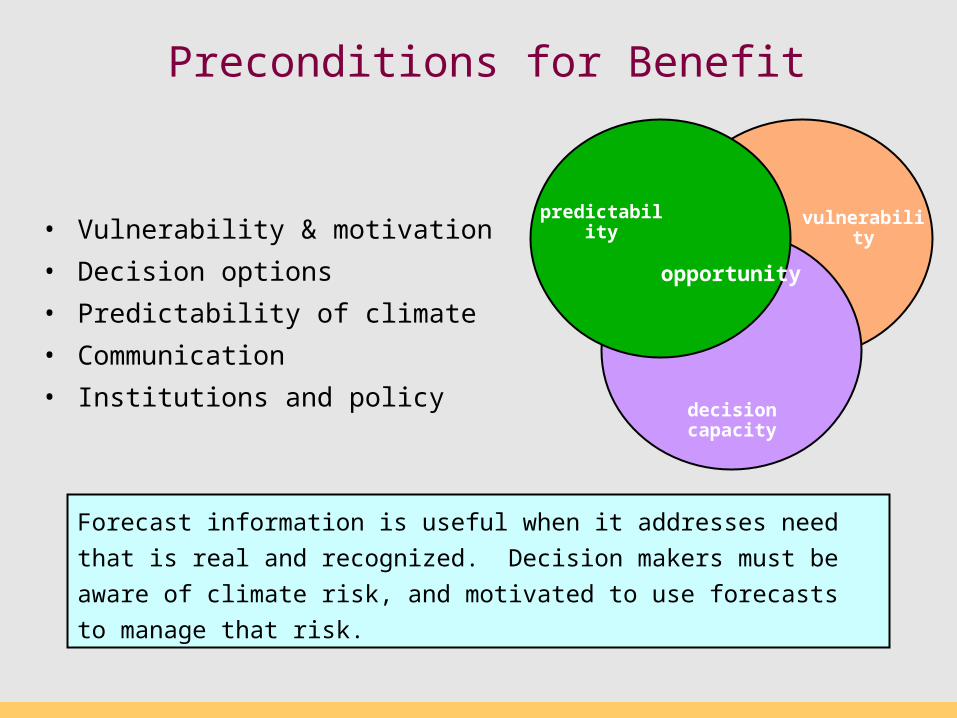
Preconditions for Benefit
• Vulnerability & motivation
• Decision options
• Predictability of climate
• Communication
• Institutions and policy
vulnerability
decision capacity
predictability
opportunity
Forecast information is useful when it addresses need that is real and
recognized. Decision makers must be aware of climate risk, and motivated
to use forecasts to manage that risk.
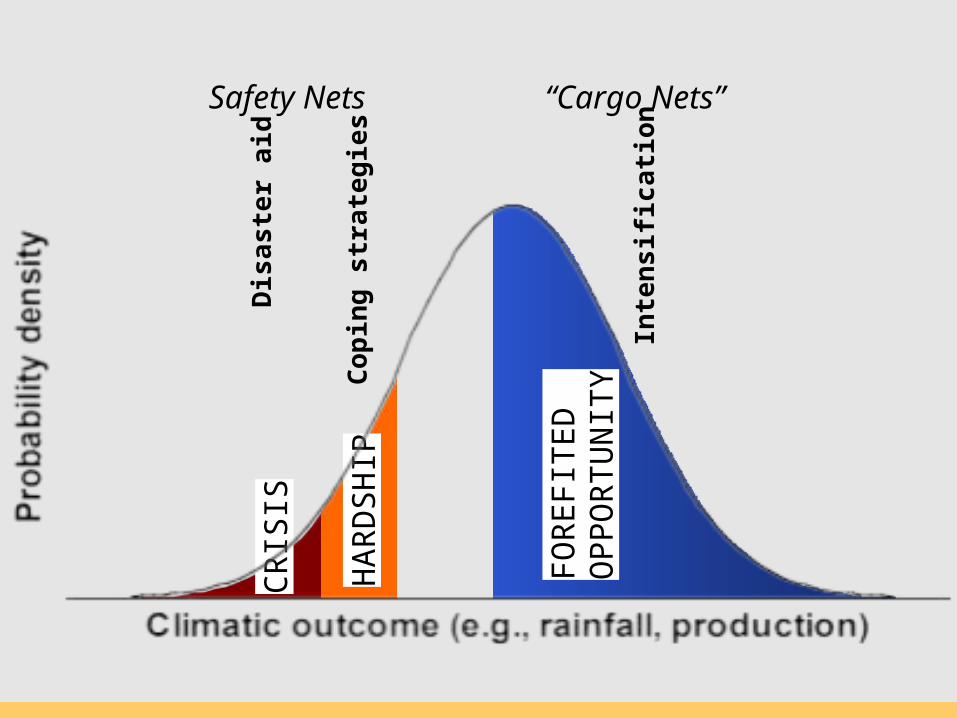
FOR
EFI
TED
O
PPO
RTU
NIT
Y
CR
ISIS
HA
RD
SH
IP
Inte
ns
ific
ati
on
“Cargo Nets”
Dis
aste
r ai
d
Co
pin
g s
tra
teg
ies
Safety Nets
Index Insurance for Drought in Africa
Science in the service of humanity
Dan Osgoode & Eric Holthaus
International Research Institute for Climate and Society
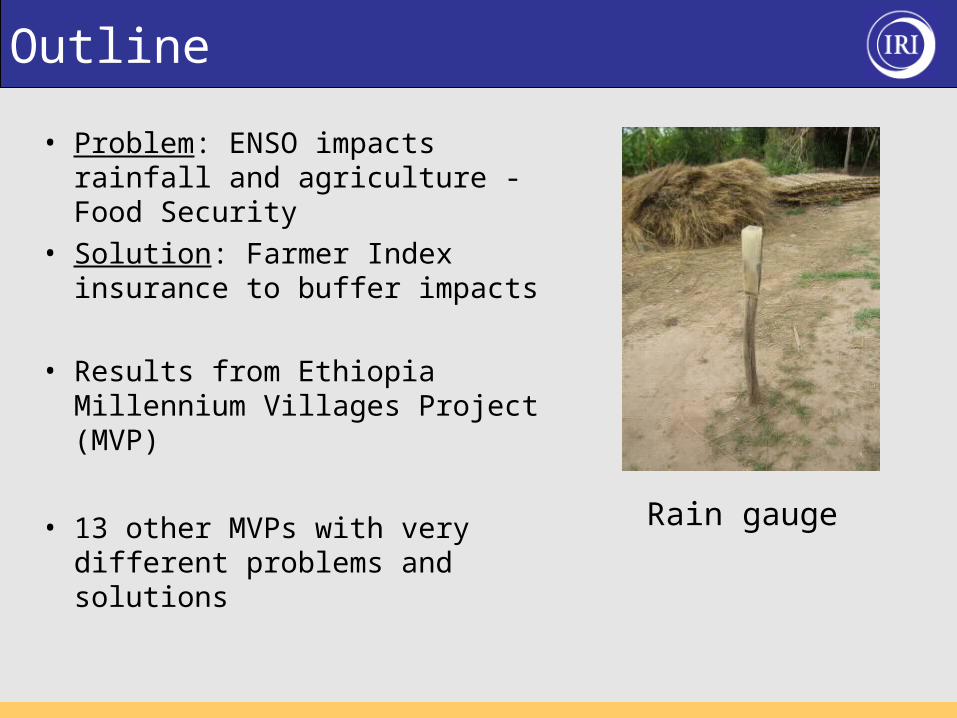
Outline
• Problem: ENSO impacts rainfall and agriculture - Food Security
• Solution: Farmer Index insurance to buffer impacts
• Results from Ethiopia Millennium Villages Project (MVP)
• 13 other MVPs with very different problems and solutions
Rain gauge
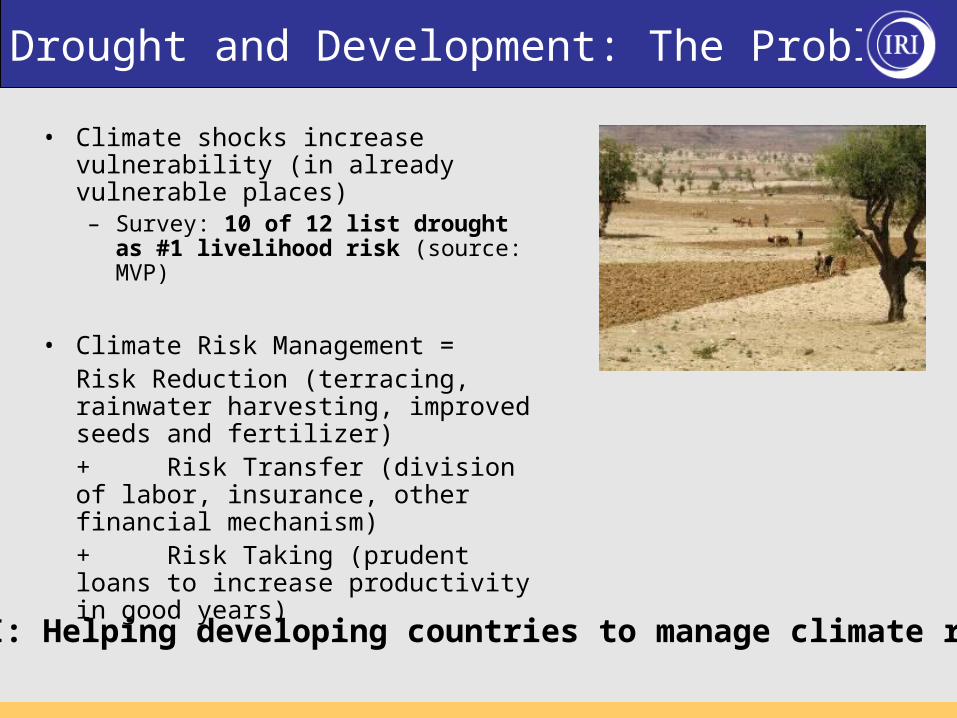
Drought and Development: The Problem
• Climate shocks increase vulnerability (in already vulnerable places)– Survey: 10 of 12 list drought as #1
livelihood risk (source: MVP)
• Climate Risk Management = Risk Reduction (terracing,
rainwater harvesting, improved seeds and fertilizer)+ Risk Transfer (division of labor, insurance, other financial mechanism)+ Risk Taking (prudent loans to increase productivity in good years)
IRI: Helping developing countries to manage climate risk.
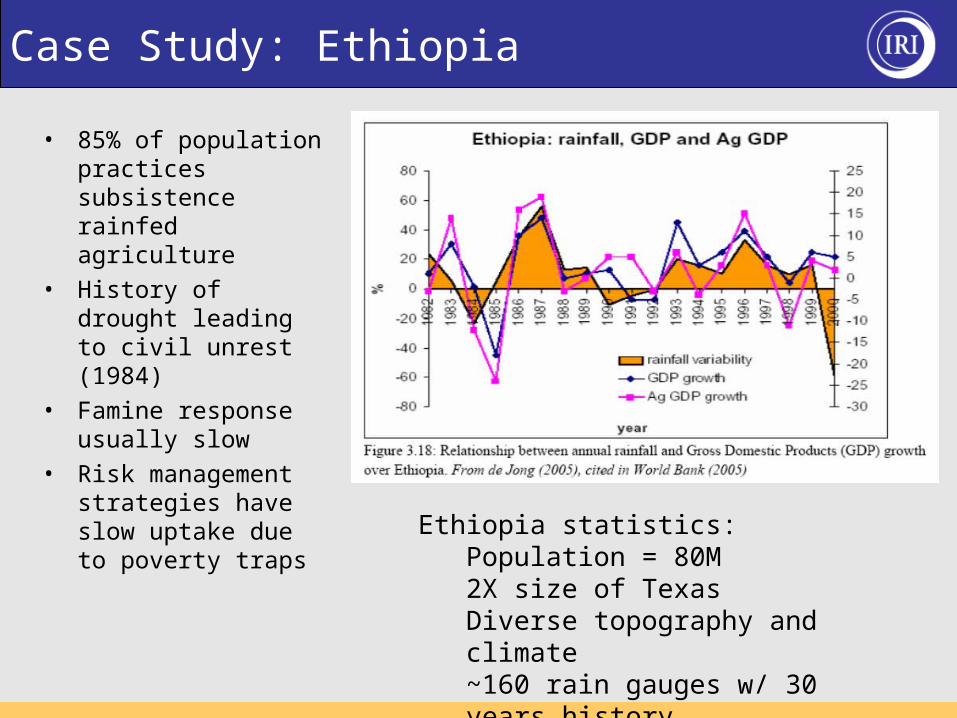
Case Study: Ethiopia
• 85% of population practices subsistence rainfed agriculture
• History of drought leading to civil unrest (1984)
• Famine response usually slow
• Risk management strategies have slow uptake due to poverty traps
Ethiopia statistics: Population = 80M2X size of TexasDiverse topography and climate~160 rain gauges w/ 30 years historyGDP per capita: $700/yr
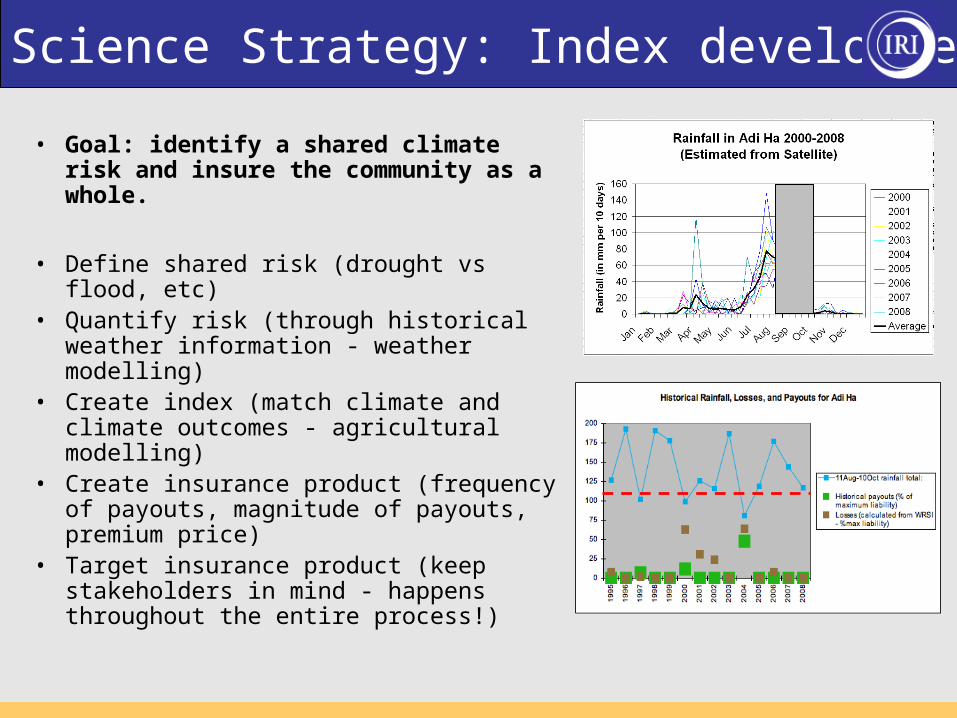
Science Strategy: Index development
• Goal: identify a shared climate risk and insure the community as a whole.
• Define shared risk (drought vs flood, etc)• Quantify risk (through historical weather
information - weather modelling)• Create index (match climate and climate
outcomes - agricultural modelling)• Create insurance product (frequency of
payouts, magnitude of payouts, premium price)
• Target insurance product (keep stakeholders in mind - happens throughout the entire process!)
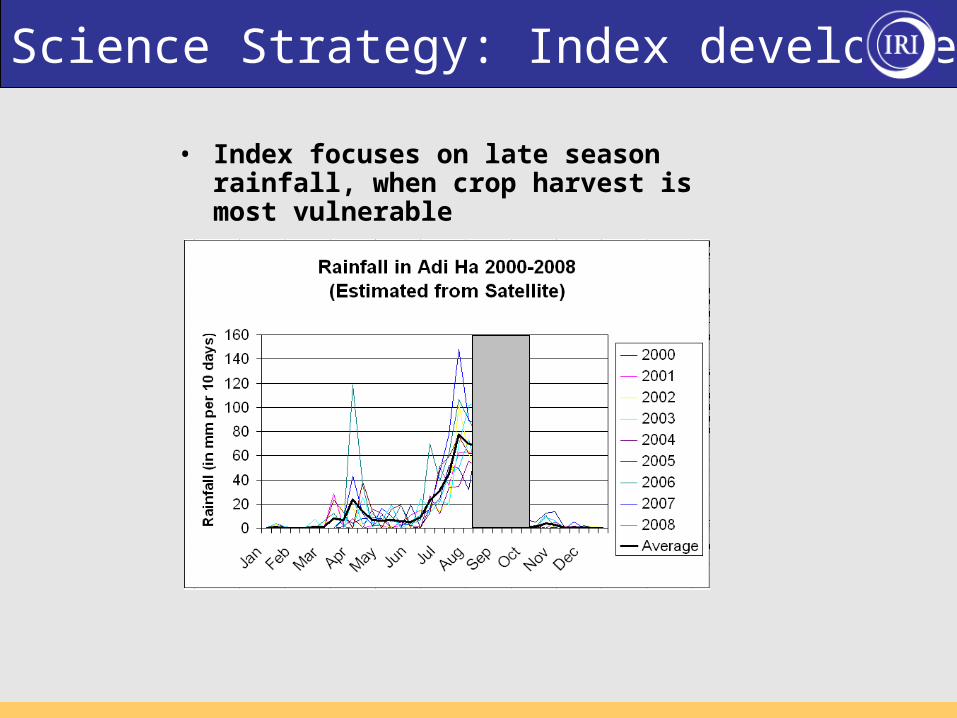
Science Strategy: Index development
• Index focuses on late season rainfall, when crop harvest is most vulnerable
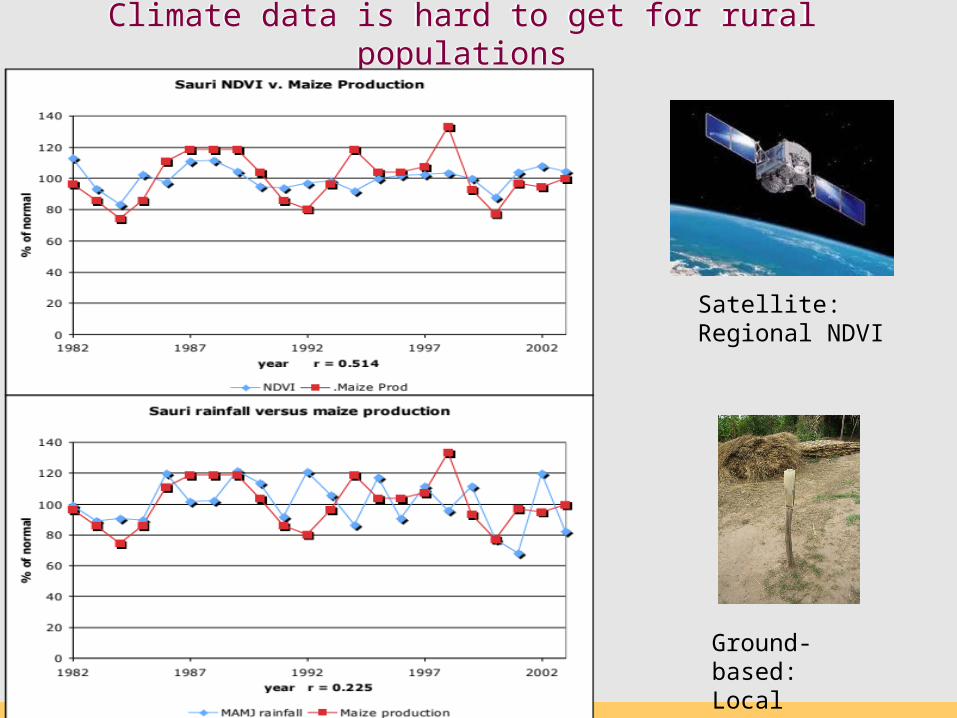
Ground-based:Local Rainfall
Climate data is hard to get for rural populationsClimate data is hard to get for rural populations
Rainfall
Satellite:Regional NDVI
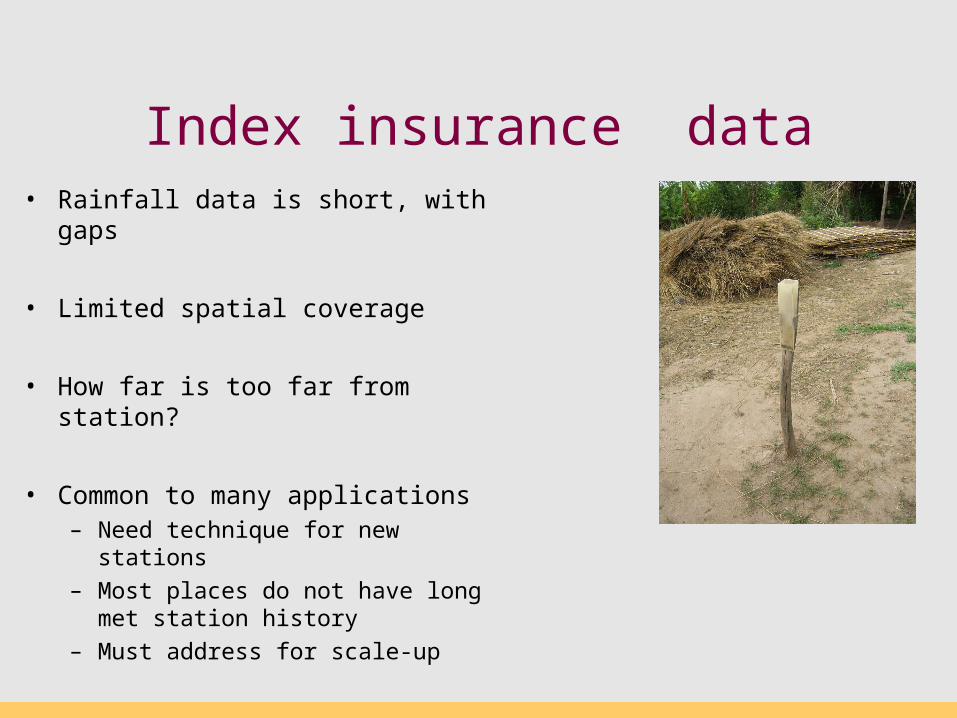
Index insurance data• Rainfall data is short, with gaps
• Limited spatial coverage
• How far is too far from station?
• Common to many applications– Need technique for new stations
– Most places do not have long met station history
– Must address for scale-up
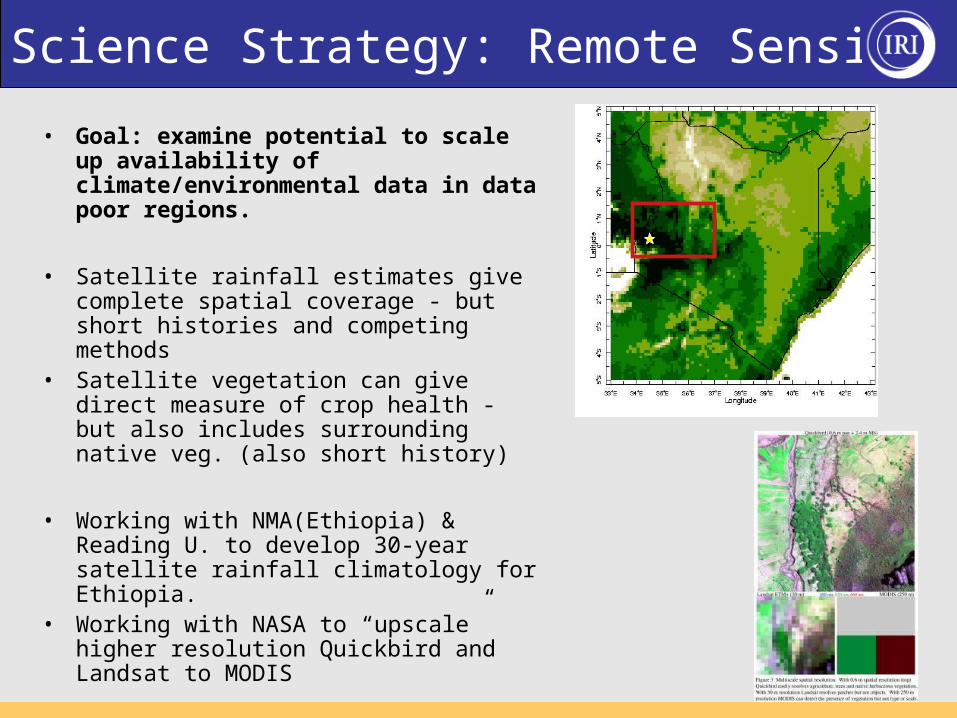
Science Strategy: Remote Sensing
• Goal: examine potential to scale up availability of climate/environmental data in data poor regions.
• Satellite rainfall estimates give complete spatial coverage - but short histories and competing methods
• Satellite vegetation can give direct measure of crop health - but also includes surrounding native veg. (also short history)
• Working with NMA(Ethiopia) & Reading U. to develop 30-year satellite rainfall climatology for Ethiopia.
• Working with NASA to “upscale” higher resolution Quickbird and Landsat to MODIS
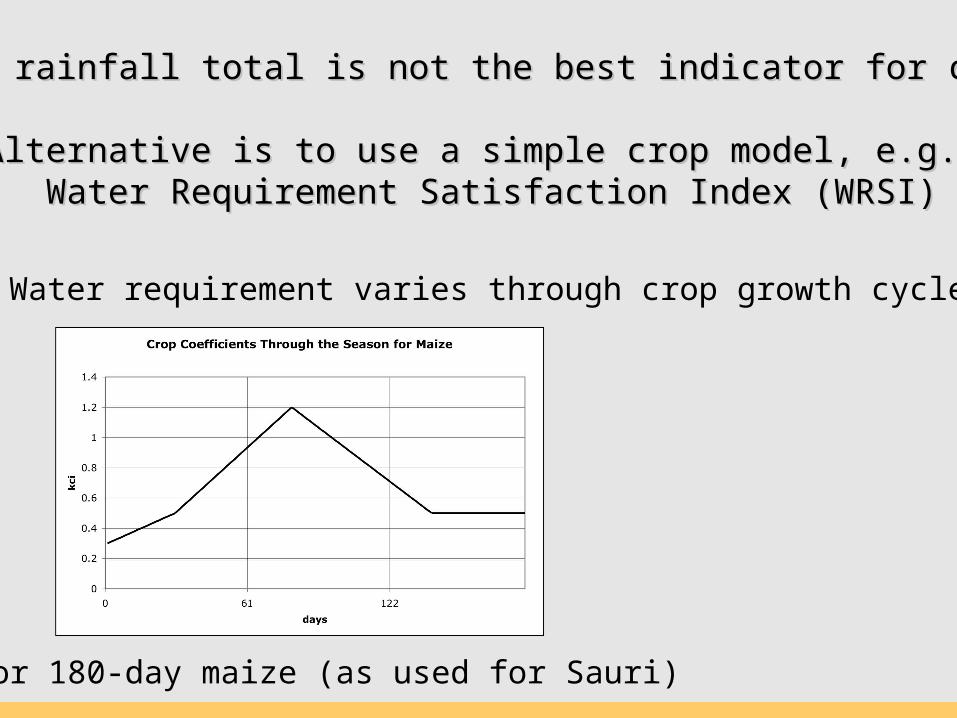
Water requirement varies through crop growth cycle
Seasonal rainfall total is not the best indicator for crop yieldSeasonal rainfall total is not the best indicator for crop yield
Alternative is to use a simple crop model, e.g.: Alternative is to use a simple crop model, e.g.: Water Requirement Satisfaction Index (WRSI)Water Requirement Satisfaction Index (WRSI)
Eg for 180-day maize (as used for Sauri)
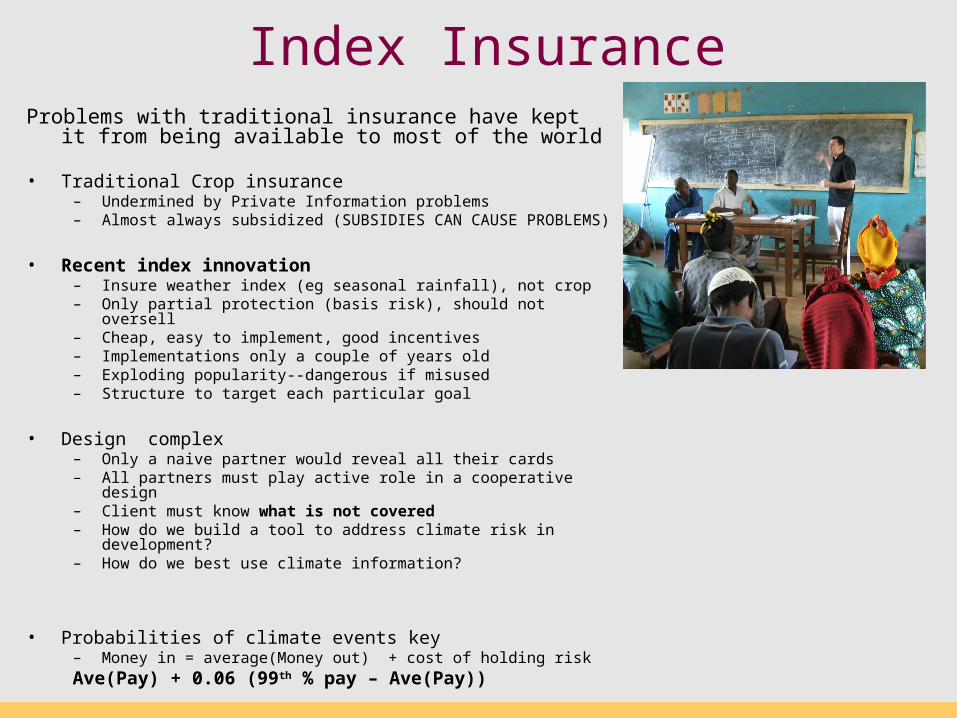
Index InsuranceProblems with traditional insurance have kept it from being
available to most of the world
• Traditional Crop insurance – Undermined by Private Information problems – Almost always subsidized (SUBSIDIES CAN CAUSE PROBLEMS)
• Recent index innovation– Insure weather index (eg seasonal rainfall), not crop– Only partial protection (basis risk), should not oversell– Cheap, easy to implement, good incentives– Implementations only a couple of years old– Exploding popularity--dangerous if misused– Structure to target each particular goal
• Design complex – Only a naive partner would reveal all their cards– All partners must play active role in a cooperative design– Client must know what is not covered– How do we build a tool to address climate risk in development?– How do we best use climate information?
• Probabilities of climate events key – Money in = average(Money out) + cost of holding riskAve(Pay) + 0.06 (99th % pay – Ave(Pay))
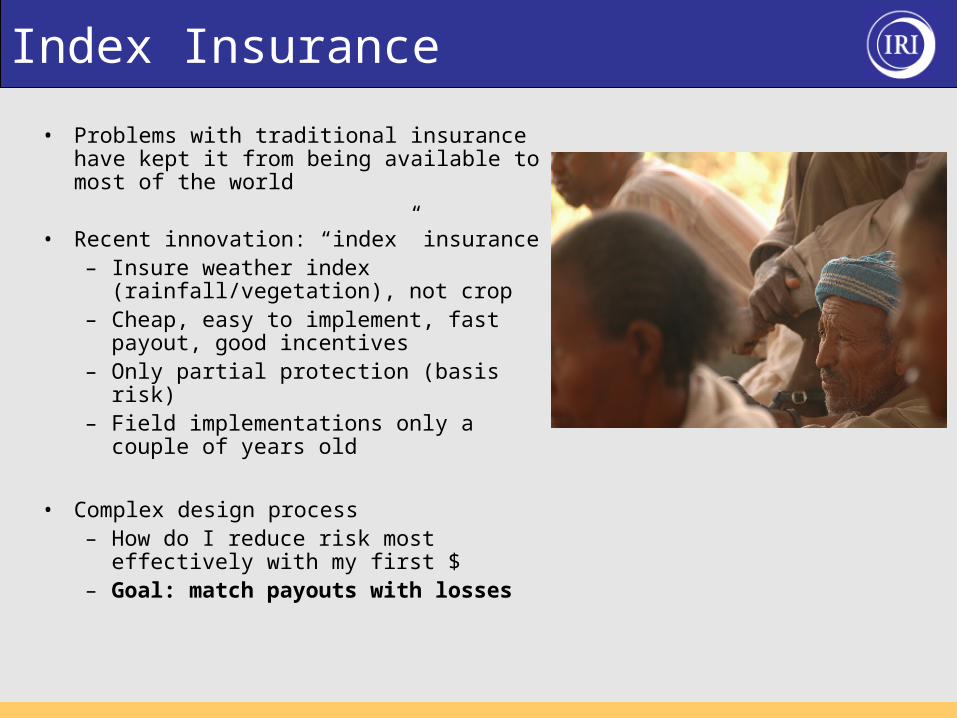
Index Insurance
• Problems with traditional insurance have kept it from being available to most of the world
• Recent innovation: “index” insurance– Insure weather index
(rainfall/vegetation), not crop– Cheap, easy to implement, fast payout,
good incentives– Only partial protection (basis risk)– Field implementations only a couple of
years old
• Complex design process– How do I reduce risk most effectively
with my first $– Goal: match payouts with losses
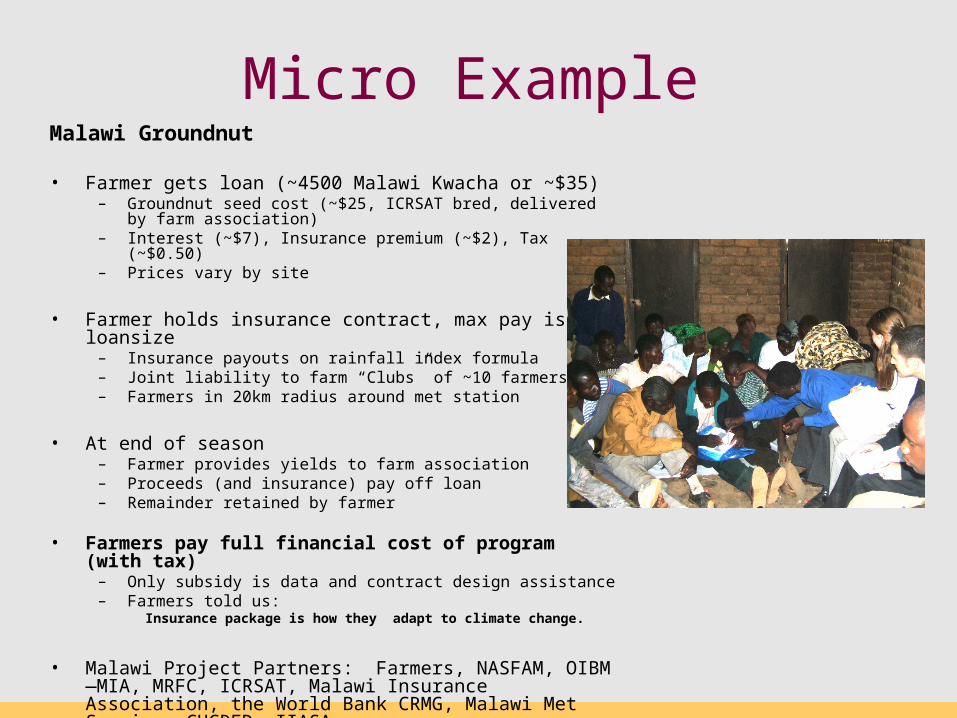
Micro ExampleMalawi Groundnut
• Farmer gets loan (~4500 Malawi Kwacha or ~$35)– Groundnut seed cost (~$25, ICRSAT bred, delivered by farm
association)– Interest (~$7), Insurance premium (~$2), Tax (~$0.50)– Prices vary by site
• Farmer holds insurance contract, max pay is loansize– Insurance payouts on rainfall index formula– Joint liability to farm “Clubs” of ~10 farmers– Farmers in 20km radius around met station
• At end of season– Farmer provides yields to farm association– Proceeds (and insurance) pay off loan– Remainder retained by farmer
• Farmers pay full financial cost of program (with tax)– Only subsidy is data and contract design assistance– Farmers told us:
Insurance package is how they adapt to climate change.
• Malawi Project Partners: Farmers, NASFAM, OIBM—MIA, MRFC, ICRSAT, Malawi Insurance Association, the World Bank CRMG, Malawi Met Service, CUCRED, IIASA
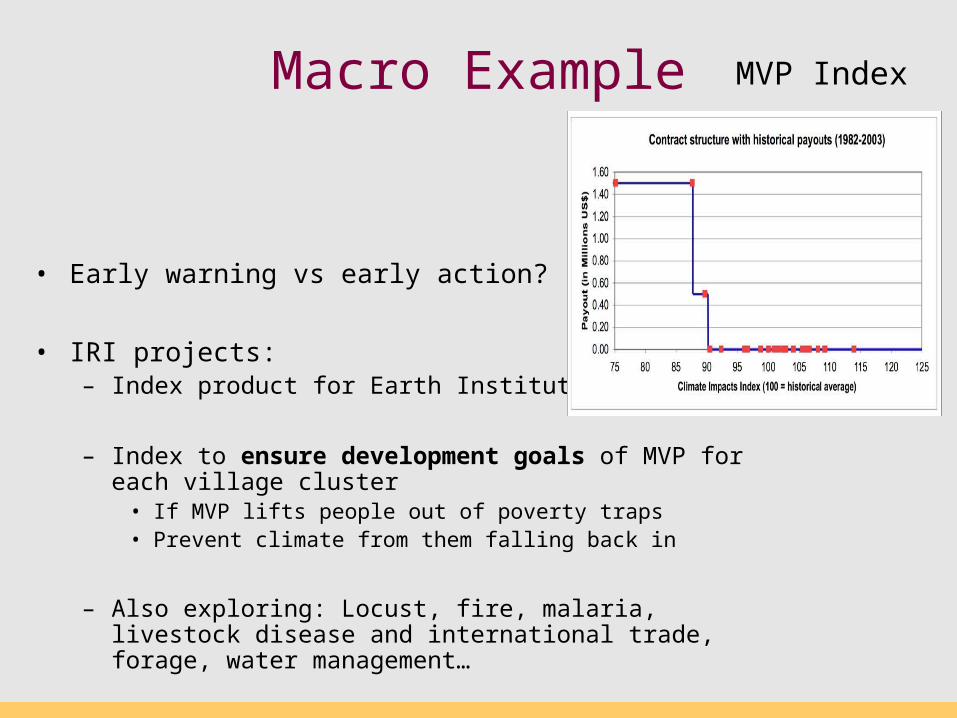
Macro Example
• Early warning vs early action?
• IRI projects: – Index product for Earth Institute MVP
– Index to ensure development goals of MVP for each village cluster
• If MVP lifts people out of poverty traps• Prevent climate from them falling back in
– Also exploring: Locust, fire, malaria, livestock disease and international trade, forage, water management…
MVP Index
Multiple poverty challenges, multiple index strategies
Insurance is not for its own sake—it is to reduce poverty, improve food security, and encourage development
Implementation strategy driven by context, type of riskA. Damage dropping people into poverty traps
B. Risk preventing people from moving forward
C. Immediate damage
http://iri.columbia.edu/publications/search.php?id=556