Embed Size (px)
Citation preview
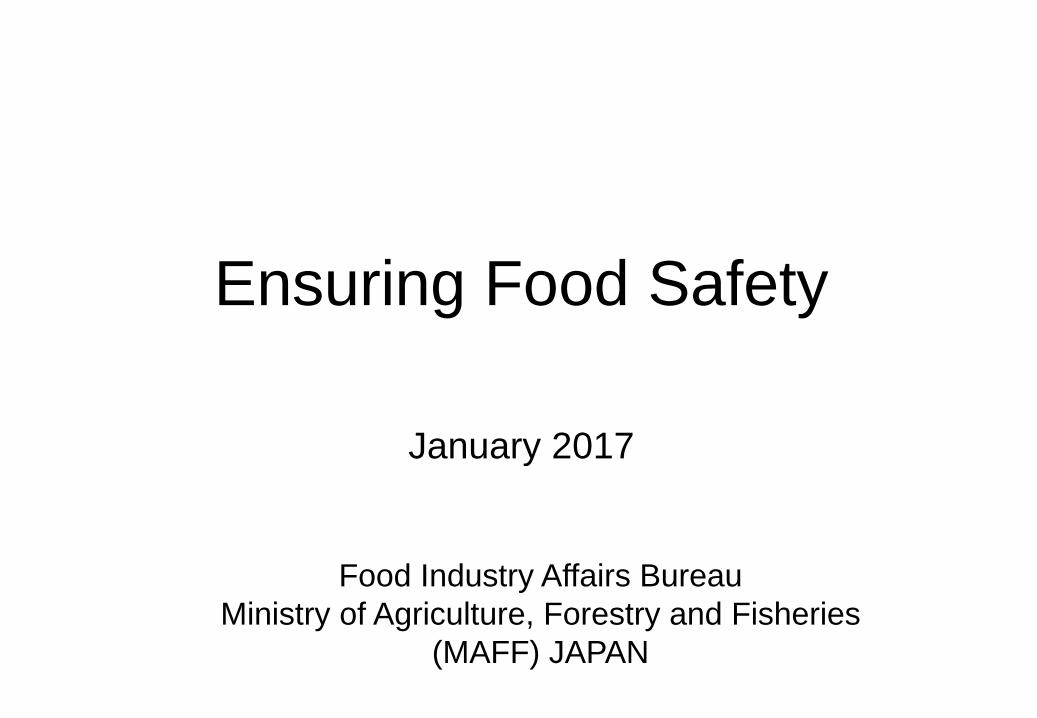
Food Industry Affairs Bureau Ministry of Agriculture, Forestry and Fisheries
(MAFF) JAPAN
Ensuring Food Safety
January 2017
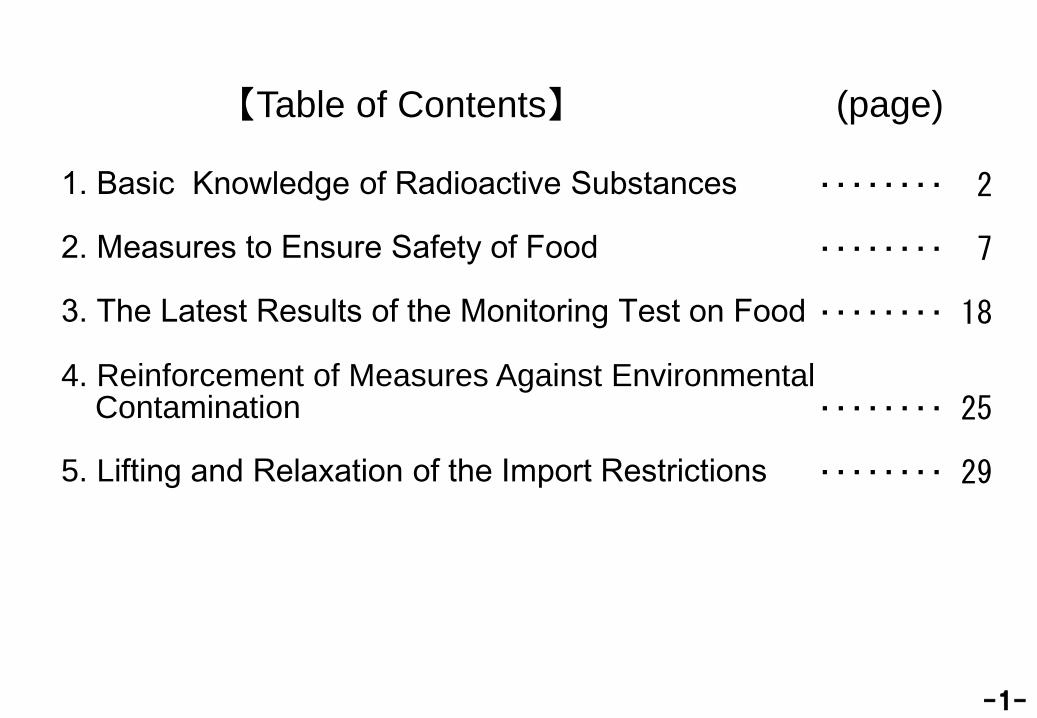
1. Basic Knowledge of Radioactive Substances
2. Measures to Ensure Safety of Food
3. The Latest Results of the Monitoring Test on Food
4. Reinforcement of Measures Against Environmental Contamination
5. Lifting and Relaxation of the Import Restrictions
【Table of Contents】
・・・・・・・・ 2
・・・・・・・・ 7
・・・・・・・・ 18
・・・・・・・・ 25
・・・・・・・・ 29
(page)
-1-
1. Basic Knowledge of Radioactive Substances
-2-
-3-
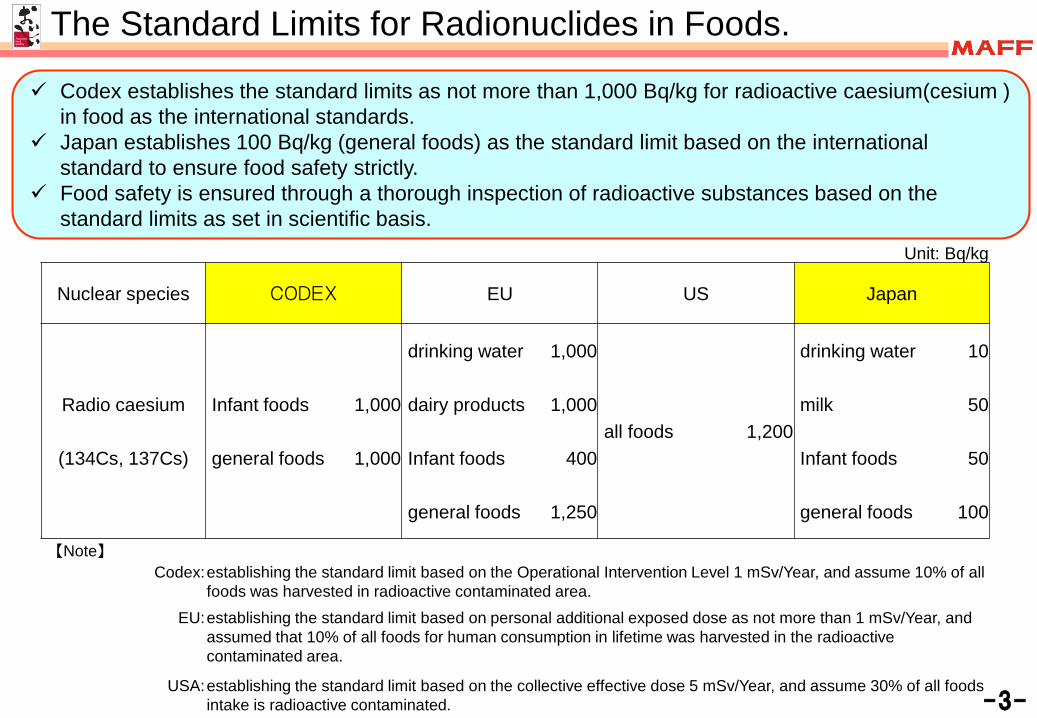
Codex establishes the standard limits as not more than 1,000 Bq/kg for radioactive caesium(cesium ) in food as the international standards.
Japan establishes 100 Bq/kg (general foods) as the standard limit based on the international standard to ensure food safety strictly.
Food safety is ensured through a thorough inspection of radioactive substances based on the standard limits as set in scientific basis.
The Standard Limits for Radionuclides in Foods.
Unit: Bq/kg
Nuclear species CODEX EU US Japan
drinking water 1,000 drinking water 10
Radio caesium Infant foods 1,000 dairy products 1,000all foods 1,200
milk 50
(134Cs, 137Cs) general foods 1,000 Infant foods 400 Infant foods 50
general foods 1,250 general foods 100
【Note】Codex:establishing the standard limit based on the Operational Intervention Level 1 mSv/Year, and assume 10% of all
foods was harvested in radioactive contaminated area.EU:establishing the standard limit based on personal additional exposed dose as not more than 1 mSv/Year, and
assumed that 10% of all foods for human consumption in lifetime was harvested in the radioactive contaminated area.
USA:establishing the standard limit based on the collective effective dose 5 mSv/Year, and assume 30% of all foods intake is radioactive contaminated.
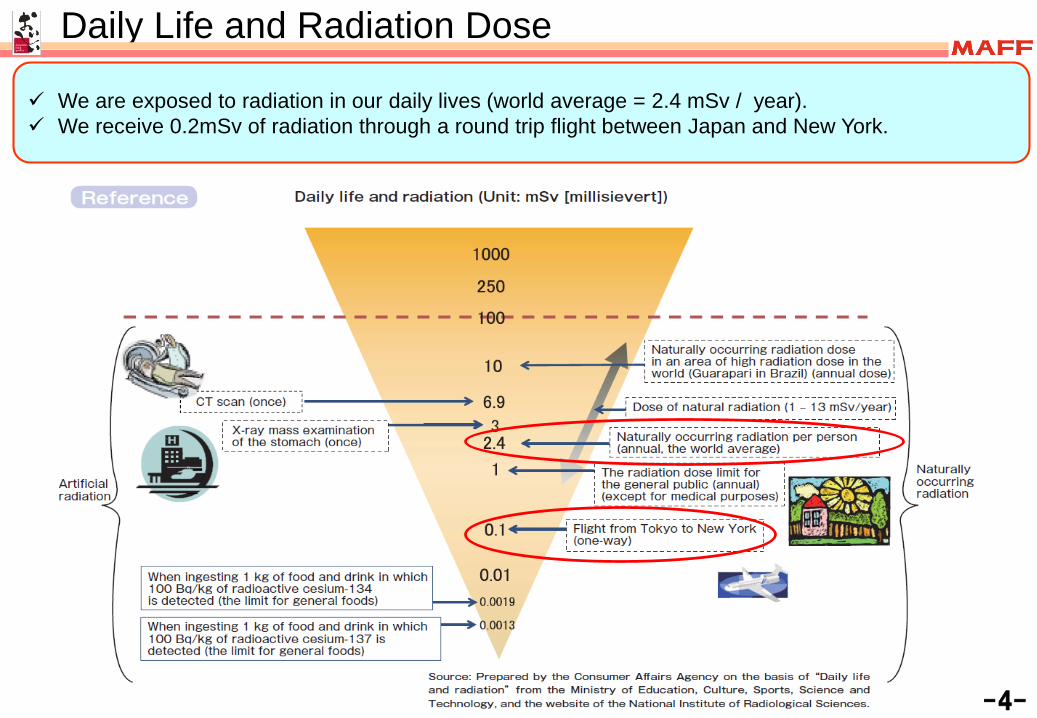
Daily Life and Radiation Dose
We are exposed to radiation in our daily lives (world average = 2.4 mSv / year). We receive 0.2mSv of radiation through a round trip flight between Japan and New York.
-4-
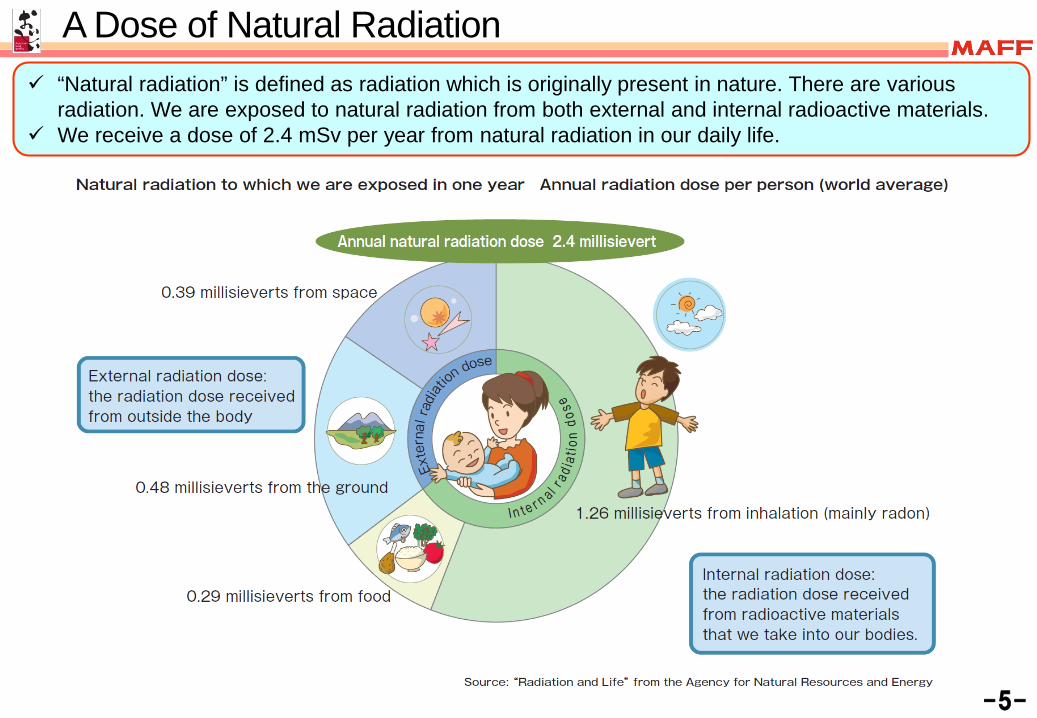
A Dose of Natural Radiation
-5-
“Natural radiation” is defined as radiation which is originally present in nature. There are various radiation. We are exposed to natural radiation from both external and internal radioactive materials.
We receive a dose of 2.4 mSv per year from natural radiation in our daily life.
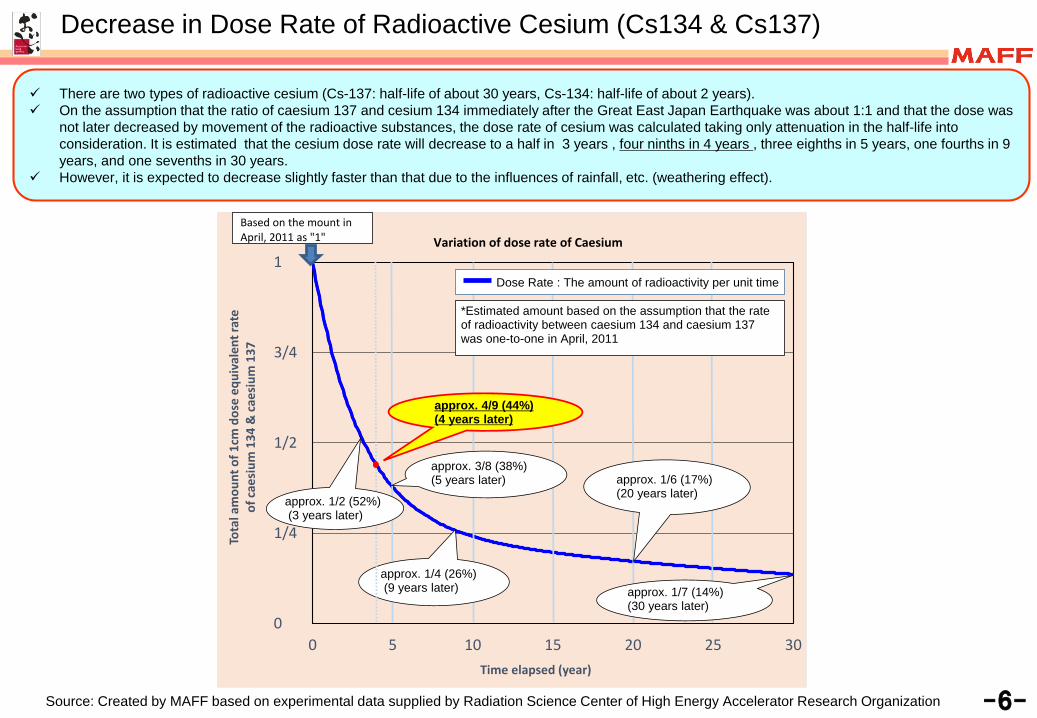
Decrease in Dose Rate of Radioactive Cesium (Cs134 & Cs137)
There are two types of radioactive cesium (Cs-137: half-life of about 30 years, Cs-134: half-life of about 2 years). On the assumption that the ratio of caesium 137 and cesium 134 immediately after the Great East Japan Earthquake was about 1:1 and that the dose was
not later decreased by movement of the radioactive substances, the dose rate of cesium was calculated taking only attenuation in the half-life into consideration. It is estimated that the cesium dose rate will decrease to a half in 3 years , four ninths in 4 years , three eighths in 5 years, one fourths in 9 years, and one sevenths in 30 years.
However, it is expected to decrease slightly faster than that due to the influences of rainfall, etc. (weathering effect).
-6-Source: Created by MAFF based on experimental data supplied by Radiation Science Center of High Energy Accelerator Research Organization
0
1/4
1/2
3/4
1
0 5 10 15 20 25 30
Tota
l am
ount
of 1
cmdo
se e
quiv
alen
t rat
e
of c
aesi
um 1
34 &
cae
sium
137
Time elapsed (year)
approx. 1/4 (26%)(9 years later) approx. 1/7 (14%)
(30 years later)
approx. 3/8 (38%) (5 years later) approx. 1/6 (17%)
(20 years later)
*Estimated amount based on the assumption that the rate of radioactivity between caesium 134 and caesium 137 was one-to-one in April, 2011
approx. 1/2 (52%)(3 years later)
approx. 4/9 (44%) (4 years later)
Variation of dose rate of Caesium
Dose Rate : The amount of radioactivity per unit time
Based on the mount in April, 2011 as "1"
2. Measures to Ensure Safety of Food
-7-
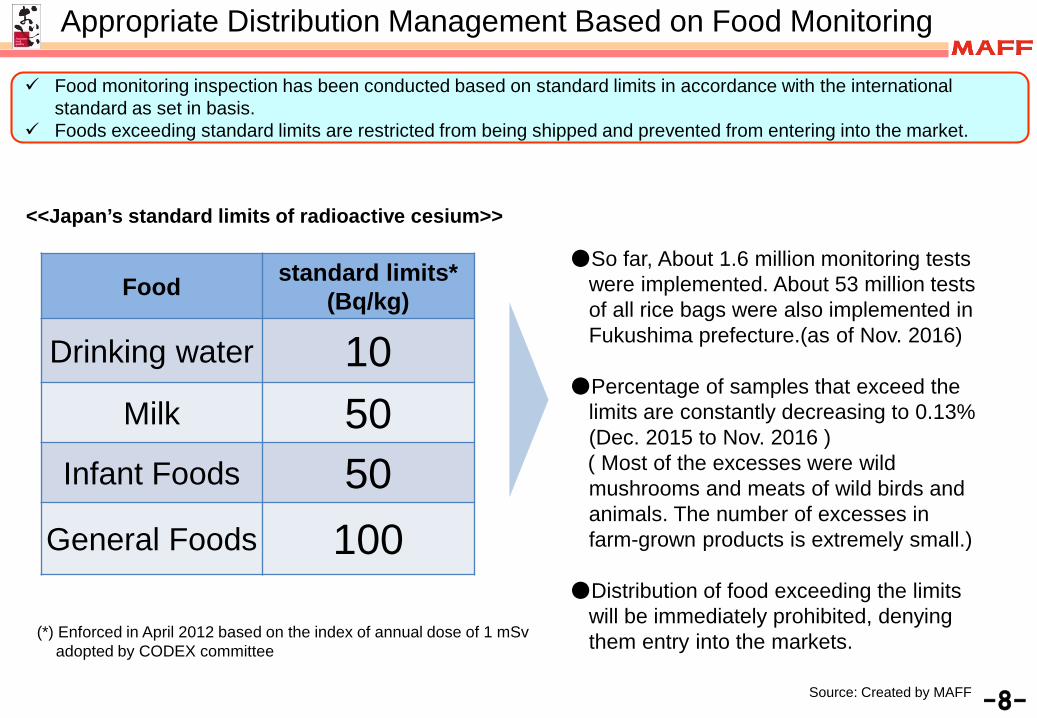
Appropriate Distribution Management Based on Food Monitoring
Food monitoring inspection has been conducted based on standard limits in accordance with the international standard as set in basis.
Foods exceeding standard limits are restricted from being shipped and prevented from entering into the market.
-8-
Food standard limits*(Bq/kg)
Drinking water 10Milk 50
Infant Foods 50General Foods 100
<<Japan’s standard limits of radioactive cesium>>
(*) Enforced in April 2012 based on the index of annual dose of 1 mSvadopted by CODEX committee
Source: Created by MAFF
●So far, About 1.6 million monitoring tests were implemented. About 53 million tests of all rice bags were also implemented in Fukushima prefecture.(as of Nov. 2016)
●Percentage of samples that exceed the limits are constantly decreasing to 0.13% (Dec. 2015 to Nov. 2016 )( Most of the excesses were wild mushrooms and meats of wild birds and animals. The number of excesses in farm-grown products is extremely small.)
●Distribution of food exceeding the limits will be immediately prohibited, denying them entry into the markets.
Monitoring Exceed the limits
Restriction of Distribution
Restriction of Consumption
■ Restriction of Distribution and/or Consumption of Foods
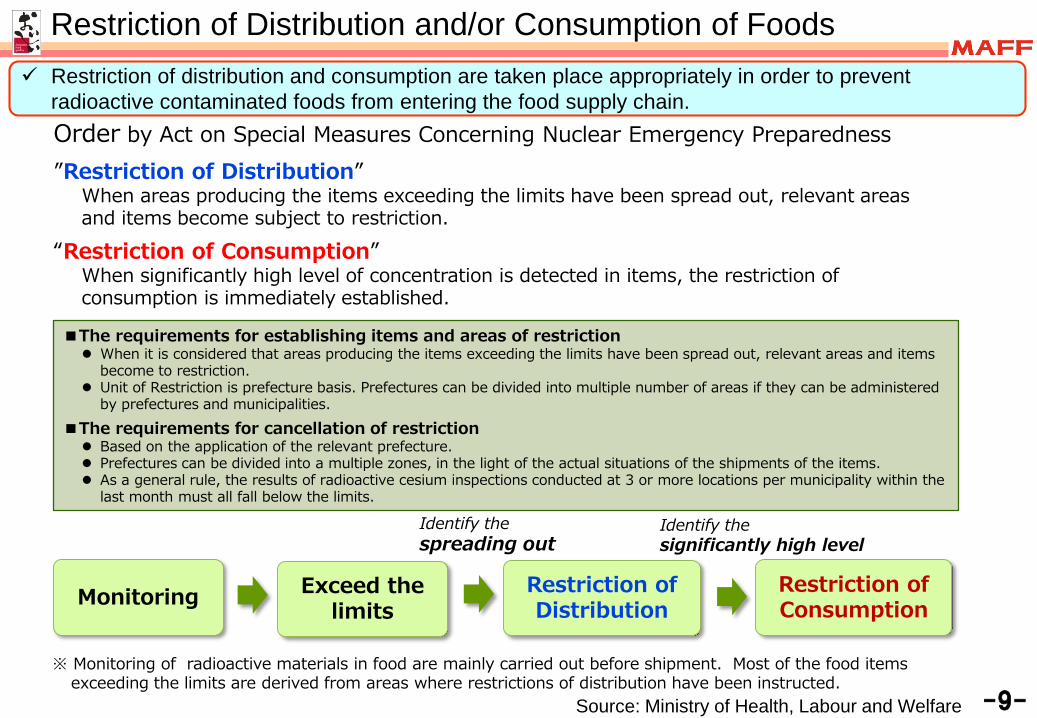
Order by Act on Special Measures Concerning Nuclear Emergency Preparedness
Identify the spreading out
Identify thesignificantly high level
■The requirements for establishing items and areas of restriction When it is considered that areas producing the items exceeding the limits have been spread out, relevant areas and items
become to restriction. Unit of Restriction is prefecture basis. Prefectures can be divided into multiple number of areas if they can be administered
by prefectures and municipalities.■The requirements for cancellation of restriction Based on the application of the relevant prefecture. Prefectures can be divided into a multiple zones, in the light of the actual situations of the shipments of the items. As a general rule, the results of radioactive cesium inspections conducted at 3 or more locations per municipality within the
last month must all fall below the limits.
”Restriction of Distribution”When areas producing the items exceeding the limits have been spread out, relevant areas and items become subject to restriction.
“Restriction of Consumption”When significantly high level of concentration is detected in items, the restriction of consumption is immediately established.
※ Monitoring of radioactive materials in food are mainly carried out before shipment. Most of the food items exceeding the limits are derived from areas where restrictions of distribution have been instructed.
Restriction of Distribution and/or Consumption of Foods
Source: Ministry of Health, Labour and Welfare -9-
Restriction of distribution and consumption are taken place appropriately in order to prevent radioactive contaminated foods from entering the food supply chain.
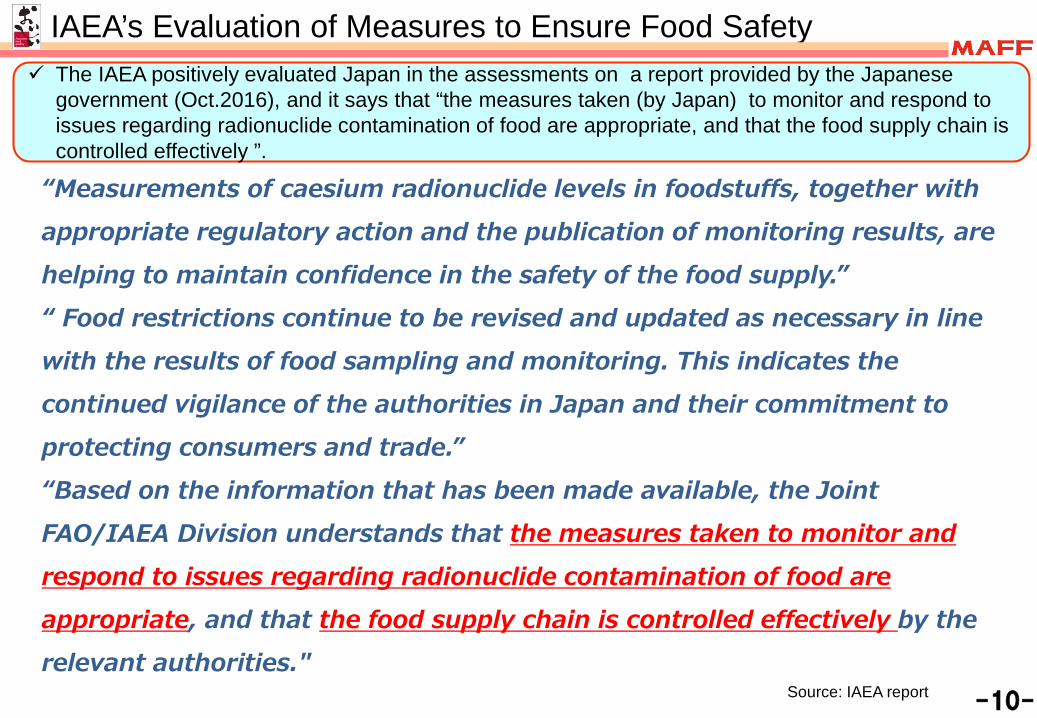
IAEA’s Evaluation of Measures to Ensure Food Safety The IAEA positively evaluated Japan in the assessments on a report provided by the Japanese
government (Oct.2016), and it says that “the measures taken (by Japan) to monitor and respond to issues regarding radionuclide contamination of food are appropriate, and that the food supply chain is controlled effectively ”.
Source: IAEA report
“Measurements of caesium radionuclide levels in foodstuffs, together with appropriate regulatory action and the publication of monitoring results, are helping to maintain confidence in the safety of the food supply.”“ Food restrictions continue to be revised and updated as necessary in line with the results of food sampling and monitoring. This indicates the continued vigilance of the authorities in Japan and their commitment to protecting consumers and trade.”“Based on the information that has been made available, the Joint FAO/IAEA Division understands that the measures taken to monitor and respond to issues regarding radionuclide contamination of food are appropriate, and that the food supply chain is controlled effectively by the relevant authorities."
-10-
G7 Niigata Agriculture Ministers' Meeting Declaration
-11-
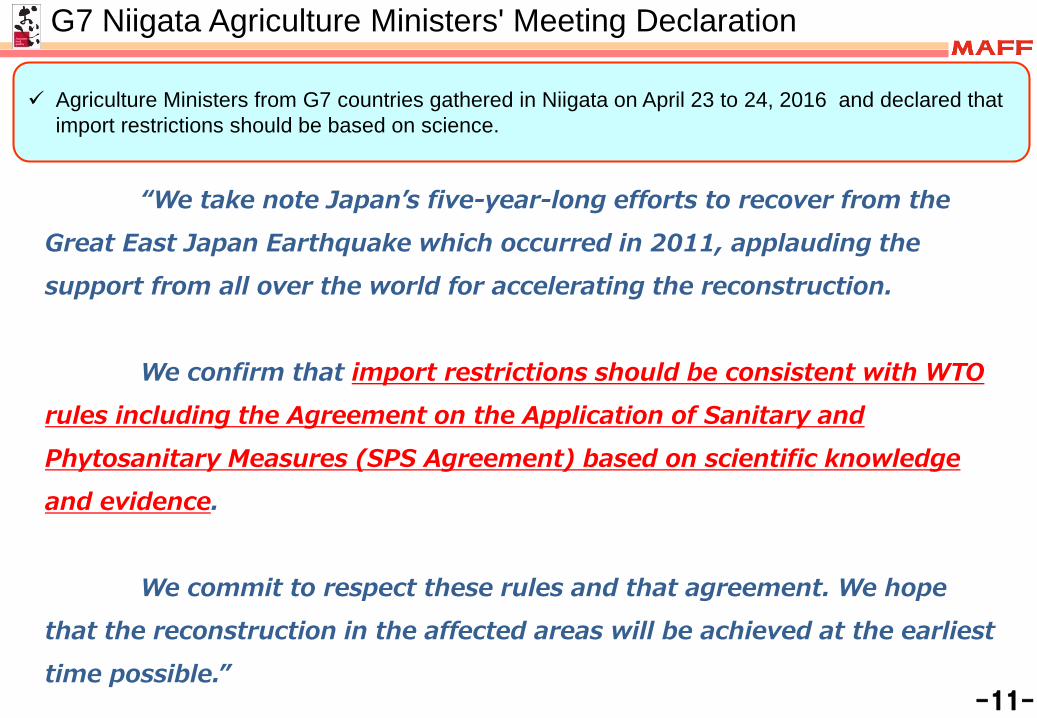
Agriculture Ministers from G7 countries gathered in Niigata on April 23 to 24, 2016 and declared that import restrictions should be based on science.
“We take note Japan’s five-year-long efforts to recover from the Great East Japan Earthquake which occurred in 2011, applauding the support from all over the world for accelerating the reconstruction.
We confirm that import restrictions should be consistent with WTO rules including the Agreement on the Application of Sanitary and Phytosanitary Measures (SPS Agreement) based on scientific knowledge and evidence.
We commit to respect these rules and that agreement. We hope that the reconstruction in the affected areas will be achieved at the earliest time possible.”
The Efforts by Fukushima Prefecture (Rice)
-12-Source: Fukushima Prefectural Government
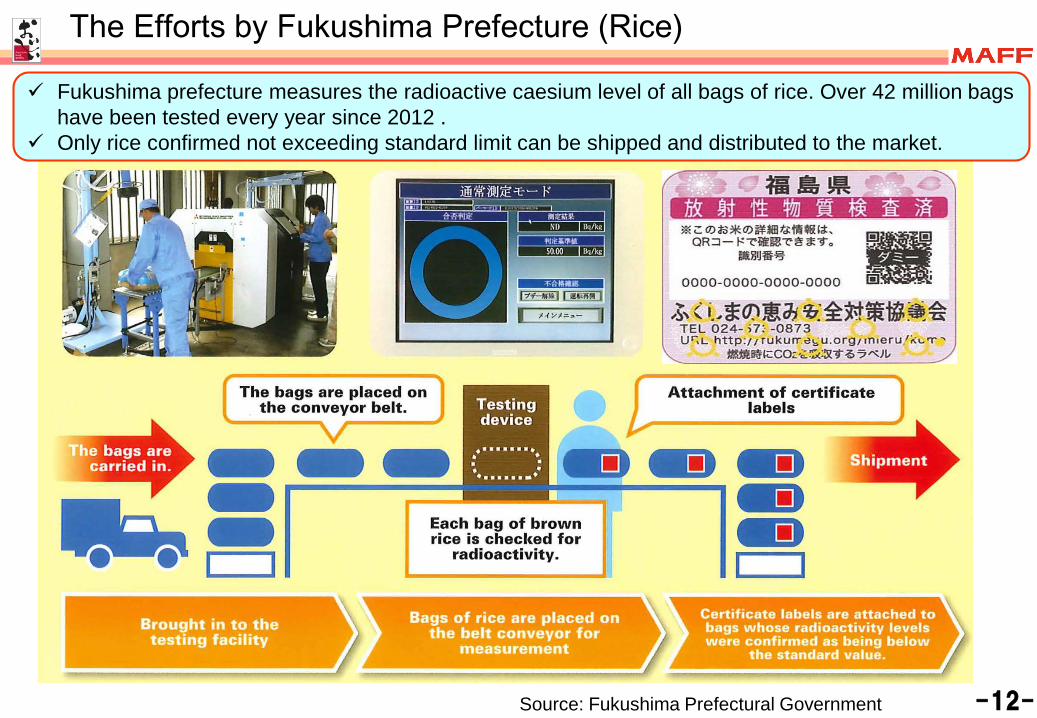
Fukushima prefecture measures the radioactive caesium level of all bags of rice. Over 42 million bags have been tested every year since 2012 .
Only rice confirmed not exceeding standard limit can be shipped and distributed to the market.
Result of Test of All Bags of Rice Produced in Fukushima (2012 to 2016)
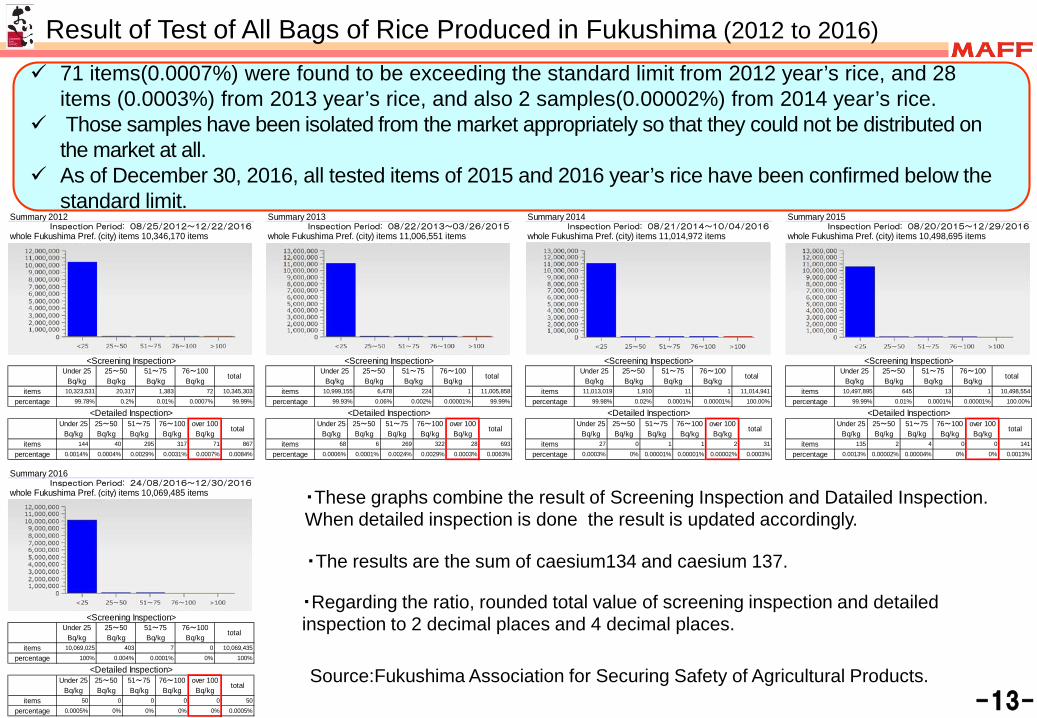
71 items(0.0007%) were found to be exceeding the standard limit from 2012 year’s rice, and 28 items (0.0003%) from 2013 year’s rice, and also 2 samples(0.00002%) from 2014 year’s rice.
Those samples have been isolated from the market appropriately so that they could not be distributed on the market at all.
As of December 30, 2016, all tested items of 2015 and 2016 year’s rice have been confirmed below the standard limit.
-13-
・These graphs combine the result of Screening Inspection and Datailed Inspection. When detailed inspection is done the result is updated accordingly.
・The results are the sum of caesium134 and caesium 137.
Source:Fukushima Association for Securing Safety of Agricultural Products.
・Regarding the ratio, rounded total value of screening inspection and detailed inspection to 2 decimal places and 4 decimal places.
Summary 2012 Inspection Period: 08/25/2012~12/22/2016
whole Fukushima Pref. (city) items 10,346,170 items
itemspercentage
itemspercentage
<Screening Inspection>Under 25 25~50 51~75 76~100
totalBq/kg Bq/kg Bq/kg Bq/kg
99.78% 0.2% 0.01% 0.0007% 99.99%10,323,531 20,317 1,383 72 10,345,303
<Detailed Inspection>Under 25 25~50 51~75 76~100 over 100
totalBq/kg Bq/kg Bq/kg Bq/kg Bq/kg
144 40 295 317 710.0014% 0.0004% 0.0029% 0.0031% 0.0007%
8670.0084%
Summary 2013 Inspection Period: 08/22/2013~03/26/2015
whole Fukushima Pref. (city) items 11,006,551 items
itemspercentage
itemspercentage
<Screening Inspection>Under 25 25~50 51~75 76~100
totalBq/kg Bq/kg Bq/kg Bq/kg
99.93% 0.06% 0.002% 0.00001% 99.99%10,999,155 6,478 224 1 11,005,858
<Detailed Inspection>Under 25 25~50 51~75 76~100 over 100
totalBq/kg Bq/kg Bq/kg Bq/kg Bq/kg
68 6 269 322 280.0006% 0.0001% 0.0024% 0.0029% 0.0003%
6930.0063%
Summary 2014 Inspection Period: 08/21/2014~10/04/2016
whole Fukushima Pref. (city) items 11,014,972 items
itemspercentage
itemspercentage
310.0003%0.0003% 0% 0.00001% 0.00001% 0.00002%
27 0 1 1 2
<Detailed Inspection>Under 25 25~50 51~75 76~100 over 100
totalBq/kg Bq/kg Bq/kg Bq/kg Bq/kg
11,013,019 1,910 11 1 11,014,94199.98% 0.02% 0.0001% 0.00001% 100.00%
<Screening Inspection>Under 25 25~50 51~75 76~100
totalBq/kg Bq/kg Bq/kg Bq/kg
Summary 2015 Inspection Period: 08/20/2015~12/29/2016
whole Fukushima Pref. (city) items 10,498,695 items
itemspercentage
itemspercentage
<Screening Inspection>Under 25 25~50 51~75 76~100
totalBq/kg Bq/kg Bq/kg Bq/kg
99.99% 0.01% 0.0001% 0.00001% 100.00%10,497,895 645 13 1 10,498,554
<Detailed Inspection>Under 25 25~50 51~75 76~100 over 100
totalBq/kg Bq/kg Bq/kg Bq/kg Bq/kg
135 2 4 0 00.0013% 0.00002% 0.00004% 0% 0%
1410.0013%
Summary 2016 Inspection Period: 24/08/2016~12/30/2016
whole Fukushima Pref. (city) items 10,069,485 items
itemspercentage
itemspercentage
<Screening Inspection>Under 25 25~50 51~75 76~100
totalBq/kg Bq/kg Bq/kg Bq/kg
100% 0.004% 0.0001% 0% 100%10,069,025 403 7 0 10,069,435
<Detailed Inspection>Under 25 25~50 51~75 76~100 over 100
totalBq/kg Bq/kg Bq/kg Bq/kg Bq/kg
50 0 0 0 00.0005% 0% 0% 0% 0%
500.0005%
-14-
Measures Toward Ensuring Food Safety in Fukushima (Vegetables and Fruits)
Source: Fukushima Prefectural Government
-15-
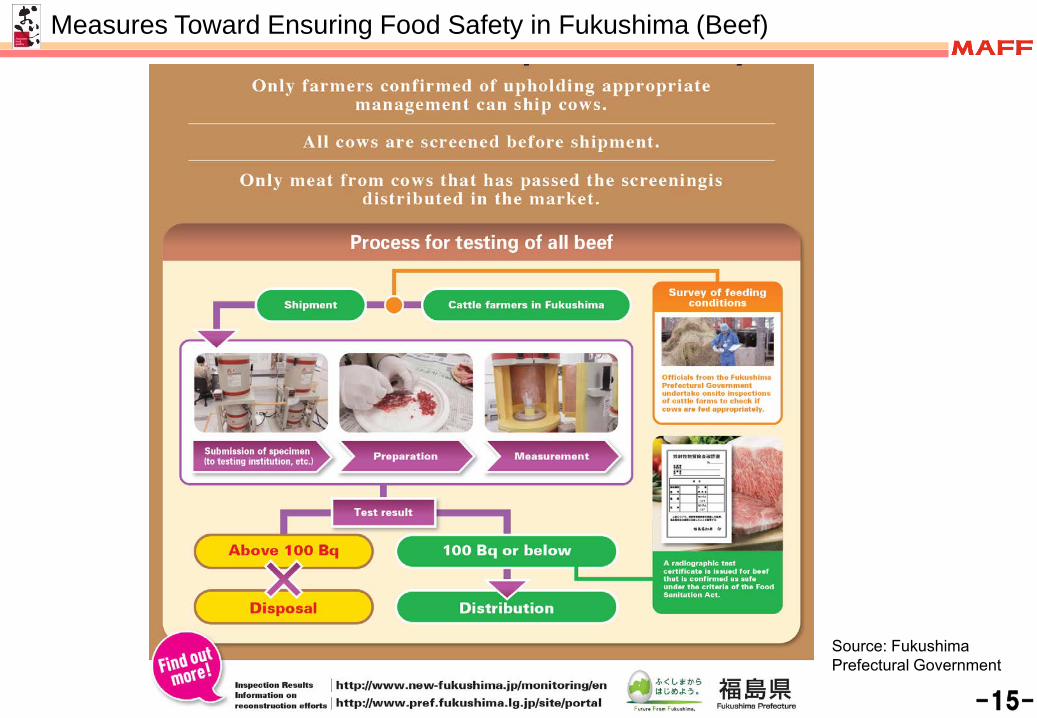
Measures Toward Ensuring Food Safety in Fukushima (Beef)
Source: Fukushima Prefectural Government
Fisherman : fishing vessel
Periodical inspection at the same sampling point
Target species and fishing method appropriately selected for each fishing season
Research vessel of prefecture 200 samples per week(seawater species)
Inspection of Radioactive Cs level(Fukushima Agricultural Technology Center)
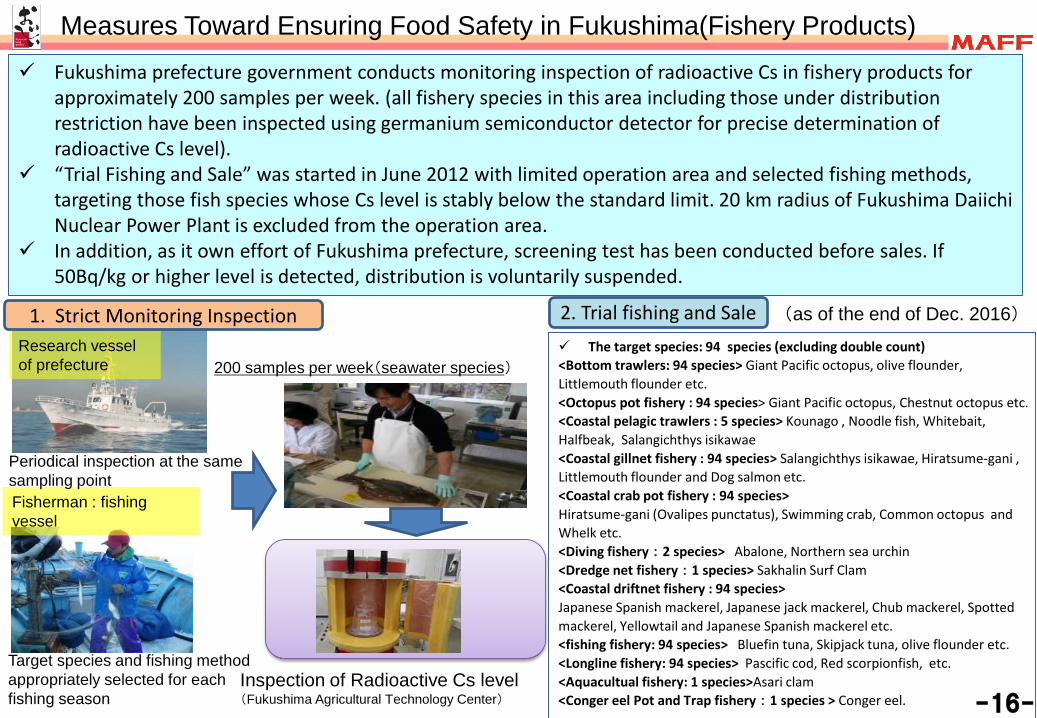
Fukushima prefecture government conducts monitoring inspection of radioactive Cs in fishery products for approximately 200 samples per week. (all fishery species in this area including those under distribution restriction have been inspected using germanium semiconductor detector for precise determination of radioactive Cs level).
“Trial Fishing and Sale” was started in June 2012 with limited operation area and selected fishing methods, targeting those fish species whose Cs level is stably below the standard limit. 20 km radius of Fukushima Daiichi Nuclear Power Plant is excluded from the operation area.
In addition, as it own effort of Fukushima prefecture, screening test has been conducted before sales. If 50Bq/kg or higher level is detected, distribution is voluntarily suspended.
1. Strict Monitoring Inspection 2. Trial fishing and Sale (as of the end of Dec. 2016)
The target species: 94 species (excluding double count)<Bottom trawlers: 94 species> Giant Pacific octopus, olive flounder, Littlemouth flounder etc.<Octopus pot fishery : 94 species> Giant Pacific octopus, Chestnut octopus etc.<Coastal pelagic trawlers : 5 species> Kounago , Noodle fish, Whitebait, Halfbeak, Salangichthys isikawae<Coastal gillnet fishery : 94 species> Salangichthys isikawae, Hiratsume-gani , Littlemouth flounder and Dog salmon etc.<Coastal crab pot fishery : 94 species>Hiratsume-gani (Ovalipes punctatus), Swimming crab, Common octopus and Whelk etc.<Diving fishery : 2 species> Abalone, Northern sea urchin<Dredge net fishery : 1 species> Sakhalin Surf Clam<Coastal driftnet fishery : 94 species>Japanese Spanish mackerel, Japanese jack mackerel, Chub mackerel, Spotted mackerel, Yellowtail and Japanese Spanish mackerel etc. <fishing fishery: 94 species> Bluefin tuna, Skipjack tuna, olive flounder etc.<Longline fishery: 94 species> Pascific cod, Red scorpionfish, etc.<Aquacultual fishery: 1 species>Asari clam <Conger eel Pot and Trap fishery : 1 species > Conger eel. -16-
Measures Toward Ensuring Food Safety in Fukushima(Fishery Products)
-17-
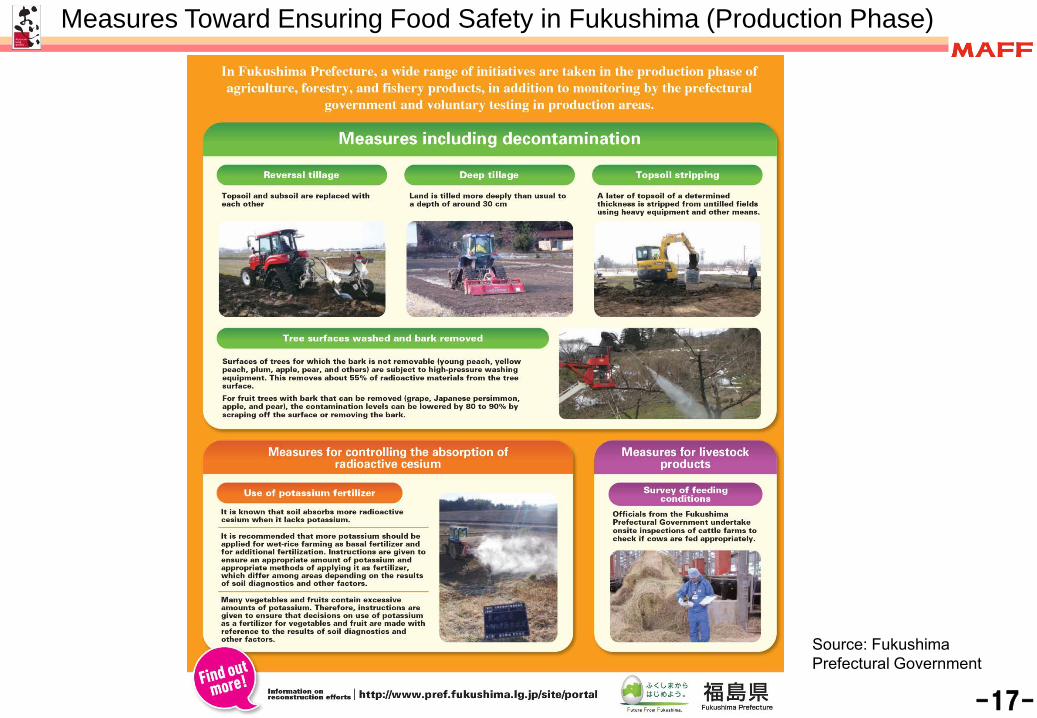
Measures Toward Ensuring Food Safety in Fukushima (Production Phase)
Source: Fukushima Prefectural Government
3. The Latest Results of the Monitoring Test on Food
-18-
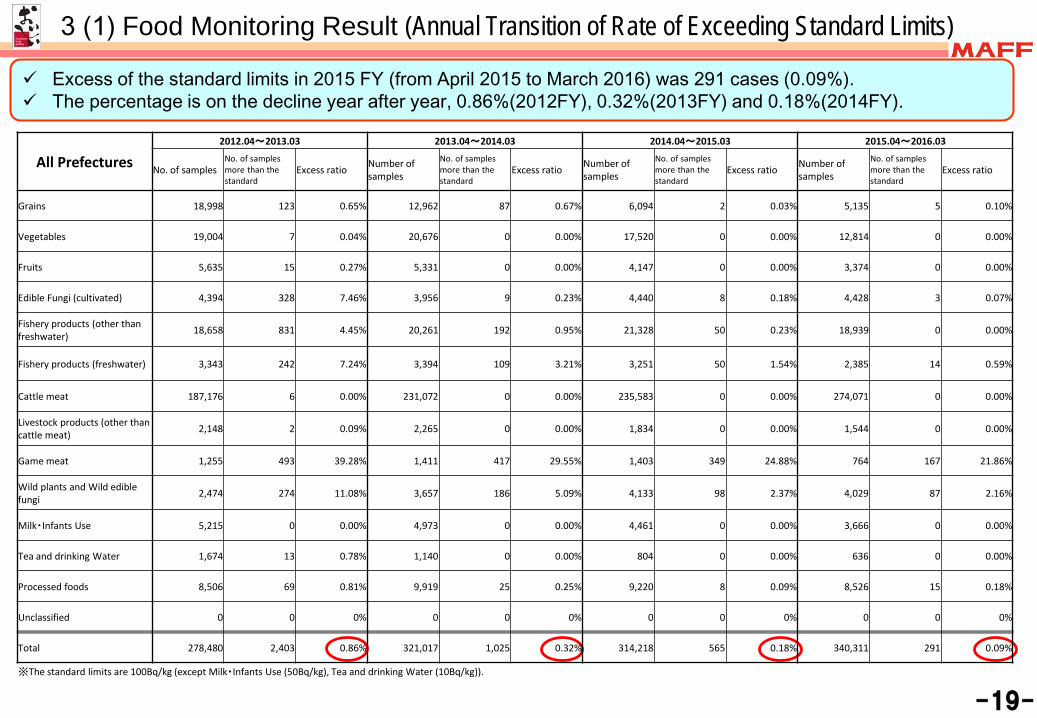
3 (1) Food Monitoring Result (Annual Transition of Rate of Exceeding Standard Limits)
-19-
Excess of the standard limits in 2015 FY (from April 2015 to March 2016) was 291 cases (0.09%). The percentage is on the decline year after year, 0.86%(2012FY), 0.32%(2013FY) and 0.18%(2014FY).
All Prefectures2012.04~2013.03 2013.04~2014.03 2014.04~2015.03 2015.04~2016.03
No. of samplesNo. of samples more than the standard
Excess ratio Number of samples
No. of samples more than the standard
Excess ratio Number of samples
No. of samples more than the standard
Excess ratio Number of samples
No. of samples more than the standard
Excess ratio
Grains 18,998 123 0.65% 12,962 87 0.67% 6,094 2 0.03% 5,135 5 0.10%
Vegetables 19,004 7 0.04% 20,676 0 0.00% 17,520 0 0.00% 12,814 0 0.00%
Fruits 5,635 15 0.27% 5,331 0 0.00% 4,147 0 0.00% 3,374 0 0.00%
Edible Fungi (cultivated) 4,394 328 7.46% 3,956 9 0.23% 4,440 8 0.18% 4,428 3 0.07%
Fishery products (other than freshwater) 18,658 831 4.45% 20,261 192 0.95% 21,328 50 0.23% 18,939 0 0.00%
Fishery products (freshwater) 3,343 242 7.24% 3,394 109 3.21% 3,251 50 1.54% 2,385 14 0.59%
Cattle meat 187,176 6 0.00% 231,072 0 0.00% 235,583 0 0.00% 274,071 0 0.00%
Livestock products (other than cattle meat) 2,148 2 0.09% 2,265 0 0.00% 1,834 0 0.00% 1,544 0 0.00%
Game meat 1,255 493 39.28% 1,411 417 29.55% 1,403 349 24.88% 764 167 21.86%
Wild plants and Wild edible fungi 2,474 274 11.08% 3,657 186 5.09% 4,133 98 2.37% 4,029 87 2.16%
Milk・Infants Use 5,215 0 0.00% 4,973 0 0.00% 4,461 0 0.00% 3,666 0 0.00%
Tea and drinking Water 1,674 13 0.78% 1,140 0 0.00% 804 0 0.00% 636 0 0.00%
Processed foods 8,506 69 0.81% 9,919 25 0.25% 9,220 8 0.09% 8,526 15 0.18%
Unclassified 0 0 0% 0 0 0% 0 0 0% 0 0 0%
Total 278,480 2,403 0.86% 321,017 1,025 0.32% 314,218 565 0.18% 340,311 291 0.09%
※The standard limits are 100Bq/kg (except Milk・Infants Use (50Bq/kg), Tea and drinking Water (10Bq/kg)).
※The number of samples of “Grain” is not including the result of all bags testing of rice originating from Fukushima.
-20-
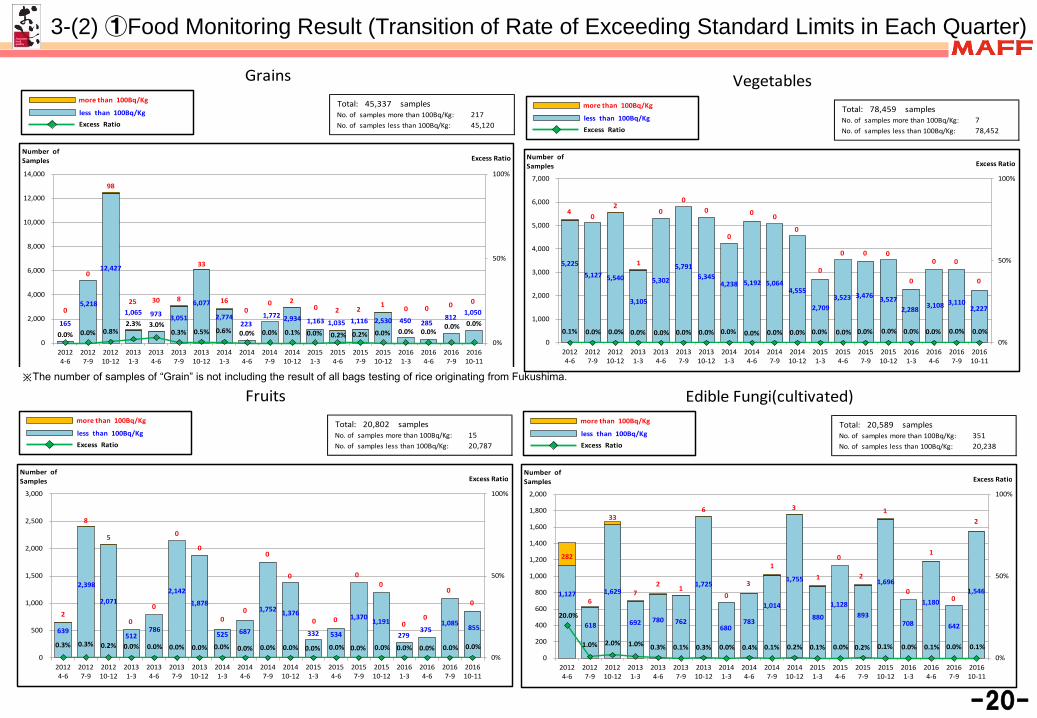
3-(2) ①Food Monitoring Result (Transition of Rate of Exceeding Standard Limits in Each Quarter)
Total: 45,337 samples No. of samples more than 100Bq/Kg: 217 No. of samples less than 100Bq/Kg: 45,120
Grains
165
5,218
12,427
1,065 973 3,051
6,077
2,774 223
1,772 2,934 1,163 1,035 1,116 2,530 450 285 812
1,050 0
0
98
25 30 8
33
160
0 20 2 2
1 0 0 0 0
0.0% 0.0% 0.8%2.3% 3.0%
0.3% 0.5% 0.6% 0.0% 0.0% 0.1% 0.0% 0.2% 0.2% 0.0% 0.0% 0.0%0.0% 0.0%
0%
50%
100%
0
2,000
4,000
6,000
8,000
10,000
12,000
14,000
20124-6
20127-9
201210-12
20131-3
20134-6
20137-9
201310-12
20141-3
20144-6
20147-9
201410-12
20151-3
20154-6
20157-9
201510-12
20161-3
20164-6
20167-9
201610-11
Number of Samples Excess Ratio
more than 100Bq/Kg
less than 100Bq/KgExcess Ratio
Total: 78,459 samples No. of samples more than 100Bq/Kg: 7 No. of samples less than 100Bq/Kg: 78,452
Vegetables
5,225 5,127 5,540
3,105
5,302
5,791 5,345
4,238 5,192 5,064 4,555
2,709 3,523 3,476 3,527
2,288 3,108 3,110 2,227
40
2
1
00
0
0
0 0
0
0
0 0 0
0
0 0
0
0.1% 0.0% 0.0% 0.0% 0.0% 0.0% 0.0% 0.0% 0.0% 0.0% 0.0% 0.0% 0.0% 0.0% 0.0% 0.0% 0.0% 0.0% 0.0%0%
50%
100%
0
1,000
2,000
3,000
4,000
5,000
6,000
7,000
20124-6
20127-9
201210-12
20131-3
20134-6
20137-9
201310-12
20141-3
20144-6
20147-9
201410-12
20151-3
20154-6
20157-9
201510-12
20161-3
20164-6
20167-9
201610-11
Number of Samples Excess Ratio
more than 100Bq/Kg
less than 100Bq/KgExcess Ratio
Total: 20,802 samples No. of samples more than 100Bq/Kg: 15 No. of samples less than 100Bq/Kg: 20,787
Fruits
639
2,398
2,071
512 786
2,142
1,878
525 687
1,752 1,376
332 534
1,370 1,191
279 375
1,085 855
2
8
5
0
0
0
0
00
0
0
0 0
00
00
0
0
0.3% 0.3% 0.2% 0.0% 0.0% 0.0% 0.0% 0.0% 0.0% 0.0% 0.0% 0.0% 0.0% 0.0% 0.0% 0.0% 0.0% 0.0% 0.0%0%
50%
100%
0
500
1,000
1,500
2,000
2,500
3,000
20124-6
20127-9
201210-12
20131-3
20134-6
20137-9
201310-12
20141-3
20144-6
20147-9
201410-12
20151-3
20154-6
20157-9
201510-12
20161-3
20164-6
20167-9
201610-11
Number of Samples Excess Ratio
more than 100Bq/Kg
less than 100Bq/KgExcess Ratio
Total: 20,589 samples No. of samples more than 100Bq/Kg: 351 No. of samples less than 100Bq/Kg: 20,238
Edible Fungi(cultivated)
1,127
618
1,629
692 780 762
1,725
680 783
1,014
1,755
880
1,128 893
1,696
708
1,180
642
1,546
282
6
33
72 1
6
0
3
1
3
1
0
2
1
0
1
0
2
20.0%
1.0% 2.0% 1.0% 0.3% 0.1% 0.3% 0.0% 0.4% 0.1% 0.2% 0.1% 0.0% 0.2% 0.1% 0.0% 0.1% 0.0% 0.1%0%
50%
100%
0
200
400
600
800
1,000
1,200
1,400
1,600
1,800
2,000
20124-6
20127-9
201210-12
20131-3
20134-6
20137-9
201310-12
20141-3
20144-6
20147-9
201410-12
20151-3
20154-6
20157-9
201510-12
20161-3
20164-6
20167-9
201610-11
Number of Samples Excess Ratio
more than 100Bq/Kg
less than 100Bq/KgExcess Ratio
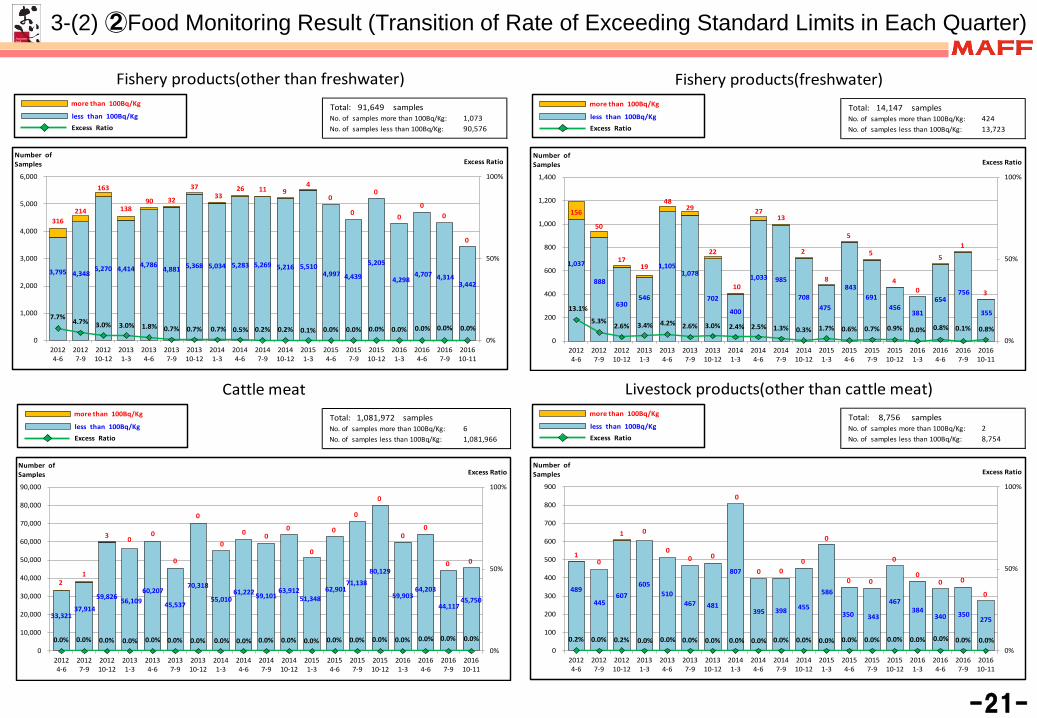
3-(2) ②Food Monitoring Result (Transition of Rate of Exceeding Standard Limits in Each Quarter)
-21-
Total: 91,649 samples No. of samples more than 100Bq/Kg: 1,073 No. of samples less than 100Bq/Kg: 90,576
Fishery products(other than freshwater)
3,795 4,348 5,270 4,414 4,786 4,881 5,368 5,034 5,283 5,269 5,216 5,510
4,997 4,439
5,205
4,298 4,707 4,314
3,442
316214
163
13890 32
3733
26 11 94
0
0
0
00
0
0
7.7%4.7% 3.0% 3.0% 1.8% 0.7% 0.7% 0.7% 0.5% 0.2% 0.2% 0.1% 0.0% 0.0% 0.0% 0.0% 0.0% 0.0% 0.0%
0%
50%
100%
0
1,000
2,000
3,000
4,000
5,000
6,000
20124-6
20127-9
201210-12
20131-3
20134-6
20137-9
201310-12
20141-3
20144-6
20147-9
201410-12
20151-3
20154-6
20157-9
201510-12
20161-3
20164-6
20167-9
201610-11
Number of Samples Excess Ratio
more than 100Bq/Kg
less than 100Bq/KgExcess Ratio
Total: 14,147 samples No. of samples more than 100Bq/Kg: 424 No. of samples less than 100Bq/Kg: 13,723
Fishery products(freshwater)
1,037
888
630 546
1,105 1,078
702
400
1,033 985
708 475
843 691
456 381
654 756
355
156
50
1719
4829
22
10
2713
2
8
5
5
40
5
1
3
13.1%
5.3%2.6% 3.4% 4.2% 2.6% 3.0% 2.4% 2.5% 1.3% 0.3% 1.7% 0.6% 0.7% 0.9% 0.0% 0.8% 0.1% 0.8%
0%
50%
100%
0
200
400
600
800
1,000
1,200
1,400
20124-6
20127-9
201210-12
20131-3
20134-6
20137-9
201310-12
20141-3
20144-6
20147-9
201410-12
20151-3
20154-6
20157-9
201510-12
20161-3
20164-6
20167-9
201610-11
Number of Samples Excess Ratio
more than 100Bq/Kg
less than 100Bq/KgExcess Ratio
Total: 1,081,972 samples No. of samples more than 100Bq/Kg: 6 No. of samples less than 100Bq/Kg: 1,081,966
Cattle meat
33,321 37,914
59,826 56,109 60,207
45,537
70,318
55,010 61,222 59,101
63,912 51,348
62,901 71,138
80,129
59,903 64,203
44,117 45,750
21
3 00
0
0
0
0 00
0
0
0
0
00
0 0
0.0% 0.0% 0.0% 0.0% 0.0% 0.0% 0.0% 0.0% 0.0% 0.0% 0.0% 0.0% 0.0% 0.0% 0.0% 0.0% 0.0% 0.0% 0.0%
0%
50%
100%
0
10,000
20,000
30,000
40,000
50,000
60,000
70,000
80,000
90,000
20124-6
20127-9
201210-12
20131-3
20134-6
20137-9
201310-12
20141-3
20144-6
20147-9
201410-12
20151-3
20154-6
20157-9
201510-12
20161-3
20164-6
20167-9
201610-11
Number of Samples Excess Ratio
more than 100Bq/Kg
less than 100Bq/KgExcess Ratio
Total: 8,756 samples No. of samples more than 100Bq/Kg: 2 No. of samples less than 100Bq/Kg: 8,754
Livestock products(other than cattle meat)
489
445 607
605 510
467 481
807
395 398 455
586
350 343
467 384
340 350 275
10
1 0
00 0
0
0 00
0
0 0
0
00 0
0
0.2% 0.0% 0.2% 0.0% 0.0% 0.0% 0.0% 0.0% 0.0% 0.0% 0.0% 0.0% 0.0% 0.0% 0.0% 0.0% 0.0% 0.0% 0.0%0%
50%
100%
0
100
200
300
400
500
600
700
800
900
20124-6
20127-9
201210-12
20131-3
20134-6
20137-9
201310-12
20141-3
20144-6
20147-9
201410-12
20151-3
20154-6
20157-9
201510-12
20161-3
20164-6
20167-9
201610-11
Number of Samples Excess Ratio
more than 100Bq/Kg
less than 100Bq/KgExcess Ratio
-22-
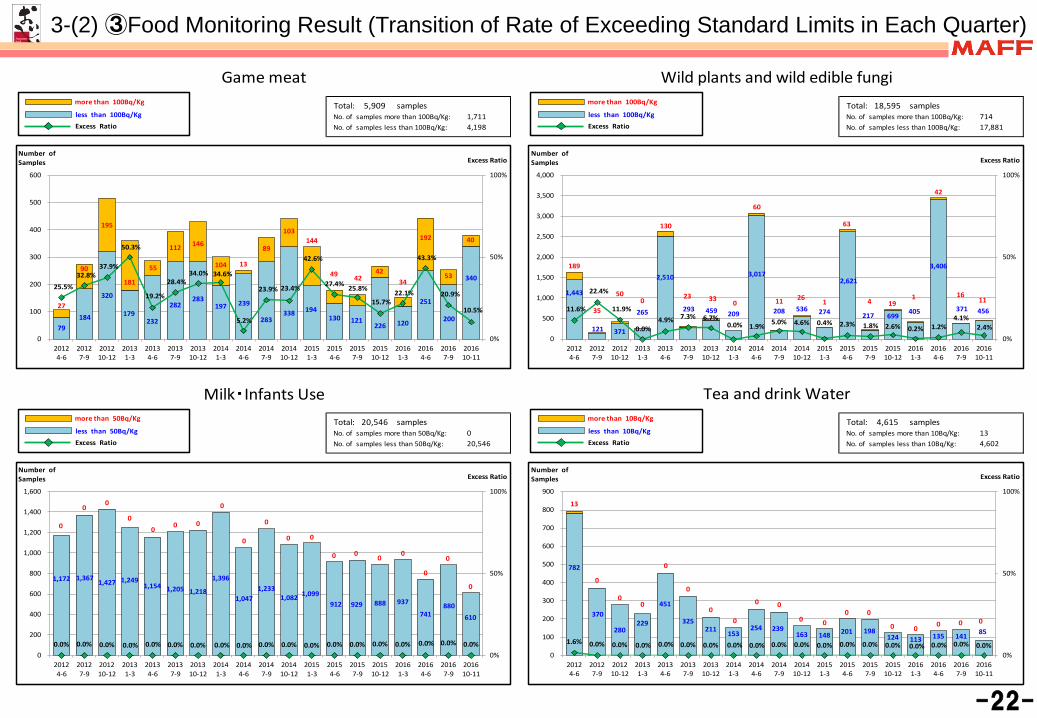
3-(2) ③Food Monitoring Result (Transition of Rate of Exceeding Standard Limits in Each Quarter)
Total: 5,909 samples No. of samples more than 100Bq/Kg: 1,711 No. of samples less than 100Bq/Kg: 4,198
Game meat
79 184
320
179 232
282 283
197 239
283 338 194
130 121 226 120
251
200
340
27
90
195
181
55
112 146
104 13
89
103144
49 4242
34
192
53
40
25.5%32.8%
37.9%
50.3%
19.2%
28.4%34.0% 34.6%
5.2%
23.9% 23.4%
42.6%
27.4% 25.8%
15.7%22.1%
43.3%
20.9%
10.5%
0%
50%
100%
0
100
200
300
400
500
600
20124-6
20127-9
201210-12
20131-3
20134-6
20137-9
201310-12
20141-3
20144-6
20147-9
201410-12
20151-3
20154-6
20157-9
201510-12
20161-3
20164-6
20167-9
201610-11
Number of Samples Excess Ratio
more than 100Bq/Kg
less than 100Bq/KgExcess Ratio
Total: 18,595 samples No. of samples more than 100Bq/Kg: 714 No. of samples less than 100Bq/Kg: 17,881
Wild plants and wild edible fungi
1,443
121 371
265
2,510
293 459 209
3,017
208 536 274
2,621
217 699 405
3,406
371 456
189
35
500
130
23 33 0
60
11 26 1
63
4 191
42
1611
11.6%
22.4%
11.9%
0.0%4.9% 7.3% 6.7%
0.0% 1.9% 5.0% 4.6% 0.4% 2.3% 1.8% 2.6% 0.2% 1.2%4.1%
2.4%0%
50%
100%
0
500
1,000
1,500
2,000
2,500
3,000
3,500
4,000
20124-6
20127-9
201210-12
20131-3
20134-6
20137-9
201310-12
20141-3
20144-6
20147-9
201410-12
20151-3
20154-6
20157-9
201510-12
20161-3
20164-6
20167-9
201610-11
Number of Samples Excess Ratio
more than 100Bq/Kg
less than 100Bq/KgExcess Ratio
Total: 20,546 samples No. of samples more than 50Bq/Kg: 0 No. of samples less than 50Bq/Kg: 20,546
Milk・Infants Use
1,172 1,367 1,427 1,249 1,154 1,205 1,218
1,396
1,047 1,233
1,082 1,099 912 929 888 937
741 880
610
0
00
00
0 0
0
0
0
0 0
0 0 00
0
0
0
0.0% 0.0% 0.0% 0.0% 0.0% 0.0% 0.0% 0.0% 0.0% 0.0% 0.0% 0.0% 0.0% 0.0% 0.0% 0.0% 0.0% 0.0% 0.0%0%
50%
100%
0
200
400
600
800
1,000
1,200
1,400
1,600
20124-6
20127-9
201210-12
20131-3
20134-6
20137-9
201310-12
20141-3
20144-6
20147-9
201410-12
20151-3
20154-6
20157-9
201510-12
20161-3
20164-6
20167-9
201610-11
Number of Samples Excess Ratio
more than 50Bq/Kg
less than 50Bq/KgExcess Ratio
Total: 4,615 samples No. of samples more than 10Bq/Kg: 13 No. of samples less than 10Bq/Kg: 4,602
Tea and drink Water
782
370
280 229
451
325 211 153
254 239 163 148 201 198
124 113 135 141 85
13
0
00
0
0
00
0 0
0 00 0
0 0 0 0 0
1.6% 0.0% 0.0% 0.0% 0.0% 0.0% 0.0% 0.0% 0.0% 0.0% 0.0% 0.0% 0.0% 0.0% 0.0% 0.0% 0.0% 0.0% 0.0%0%
50%
100%
0
100
200
300
400
500
600
700
800
900
20124-6
20127-9
201210-12
20131-3
20134-6
20137-9
201310-12
20141-3
20144-6
20147-9
201410-12
20151-3
20154-6
20157-9
201510-12
20161-3
20164-6
20167-9
201610-11
Number of Samples Excess Ratio
more than 10Bq/Kg
less than 10Bq/KgExcess Ratio
-23-
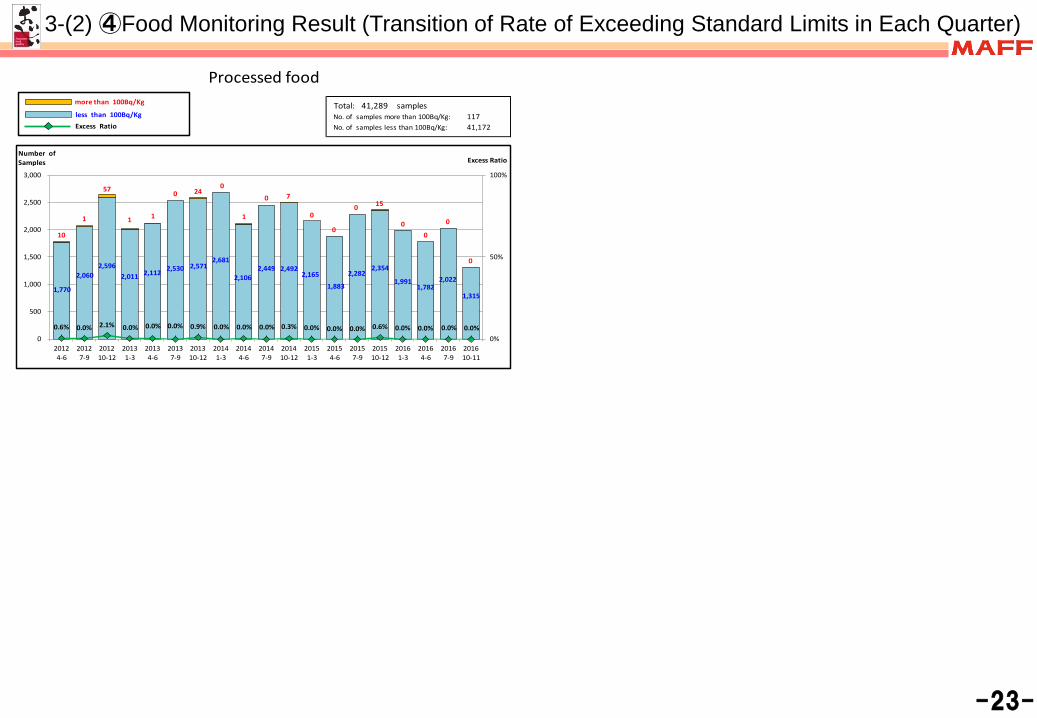
3-(2) ④Food Monitoring Result (Transition of Rate of Exceeding Standard Limits in Each Quarter)
Total: 41,289 samples No. of samples more than 100Bq/Kg: 117 No. of samples less than 100Bq/Kg: 41,172
Processed food
1,770
2,060 2,596
2,011 2,112 2,530 2,571 2,681
2,106 2,449 2,492
2,165
1,883
2,282 2,354
1,991 1,782
2,022
1,315
10
1
57
1 1
0 240
1
0 7
0
0
0 15
00
0
0
0.6% 0.0% 2.1% 0.0% 0.0% 0.0% 0.9% 0.0% 0.0% 0.0% 0.3% 0.0% 0.0% 0.0% 0.6% 0.0% 0.0% 0.0% 0.0%0%
50%
100%
0
500
1,000
1,500
2,000
2,500
3,000
20124-6
20127-9
201210-12
20131-3
20134-6
20137-9
201310-12
20141-3
20144-6
20147-9
201410-12
20151-3
20154-6
20157-9
201510-12
20161-3
20164-6
20167-9
201610-11
Number of Samples Excess Ratio
more than 100Bq/Kg
less than 100Bq/KgExcess Ratio
【Relaxation of the restriction since Dec. 2014】
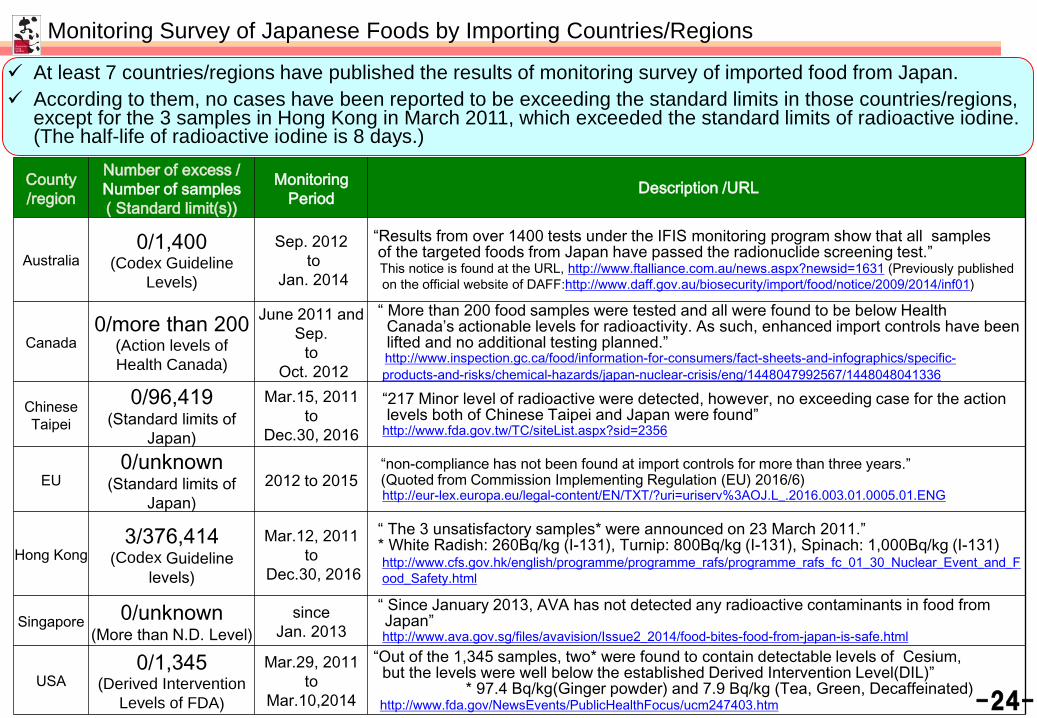
Monitoring Survey of Japanese Foods by Importing Countries/Regions
At least 7 countries/regions have published the results of monitoring survey of imported food from Japan. According to them, no cases have been reported to be exceeding the standard limits in those countries/regions,
except for the 3 samples in Hong Kong in March 2011, which exceeded the standard limits of radioactive iodine. (The half-life of radioactive iodine is 8 days.)
-24-
County/region
Number of excess / Number of samples ( Standard limit(s))
MonitoringPeriod Description /URL
Australia0/1,400
(Codex GuidelineLevels)
Sep. 2012to
Jan. 2014
“Results from over 1400 tests under the IFIS monitoring program show that all samplesof the targeted foods from Japan have passed the radionuclide screening test.”This notice is found at the URL, http://www.ftalliance.com.au/news.aspx?newsid=1631 (Previously published on the official website of DAFF:http://www.daff.gov.au/biosecurity/import/food/notice/2009/2014/inf01)
Canada0/more than 200
(Action levels of Health Canada)
June 2011 and Sep.
toOct. 2012
“ More than 200 food samples were tested and all were found to be below Health Canada’s actionable levels for radioactivity. As such, enhanced import controls have beenlifted and no additional testing planned.”http://www.inspection.gc.ca/food/information-for-consumers/fact-sheets-and-infographics/specific-products-and-risks/chemical-hazards/japan-nuclear-crisis/eng/1448047992567/1448048041336
Chinese Taipei
0/96,419(Standard limits of
Japan)
Mar.15, 2011 to
Dec.30, 2016
“217 Minor level of radioactive were detected, however, no exceeding case for the actionlevels both of Chinese Taipei and Japan were found”
http://www.fda.gov.tw/TC/siteList.aspx?sid=2356
EU0/unknown
(Standard limits of Japan)
2012 to 2015“non-compliance has not been found at import controls for more than three years.”(Quoted from Commission Implementing Regulation (EU) 2016/6)http://eur-lex.europa.eu/legal-content/EN/TXT/?uri=uriserv%3AOJ.L_.2016.003.01.0005.01.ENG
Hong Kong3/376,414
(Codex Guideline levels)
Mar.12, 2011 to
Dec.30, 2016
“ The 3 unsatisfactory samples* were announced on 23 March 2011.” * White Radish: 260Bq/kg (I-131), Turnip: 800Bq/kg (I-131), Spinach: 1,000Bq/kg (I-131) http://www.cfs.gov.hk/english/programme/programme_rafs/programme_rafs_fc_01_30_Nuclear_Event_and_Food_Safety.html
Singapore 0/unknown(More than N.D. Level)
since Jan. 2013
“ Since January 2013, AVA has not detected any radioactive contaminants in food from Japan” http://www.ava.gov.sg/files/avavision/Issue2_2014/food-bites-food-from-japan-is-safe.html
USA0/1,345
(Derived Intervention Levels of FDA)
Mar.29, 2011 to
Mar.10,2014
“Out of the 1,345 samples, two* were found to contain detectable levels of Cesium,but the levels were well below the established Derived Intervention Level(DIL)”
* 97.4 Bq/kg(Ginger powder) and 7.9 Bq/kg (Tea, Green, Decaffeinated) http://www.fda.gov/NewsEvents/PublicHealthFocus/ucm247403.htm
4. Reinforcement of Measures Against Environmental Contamination
-25-
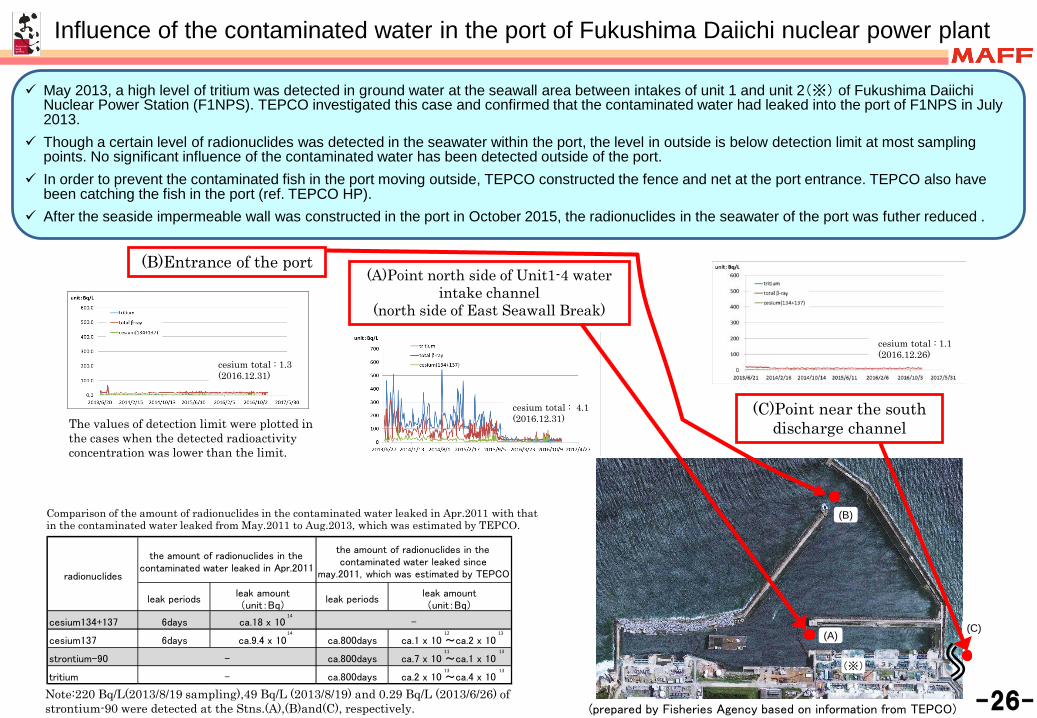
cesium total : 4.1(2016.12.31)
May 2013, a high level of tritium was detected in ground water at the seawall area between intakes of unit 1 and unit 2(※) of Fukushima Daiichi Nuclear Power Station (F1NPS). TEPCO investigated this case and confirmed that the contaminated water had leaked into the port of F1NPS in July 2013.
Though a certain level of radionuclides was detected in the seawater within the port, the level in outside is below detection limit at most sampling points. No significant influence of the contaminated water has been detected outside of the port.
In order to prevent the contaminated fish in the port moving outside, TEPCO constructed the fence and net at the port entrance. TEPCO also have been catching the fish in the port (ref. TEPCO HP).
After the seaside impermeable wall was constructed in the port in October 2015, the radionuclides in the seawater of the port was futher reduced .
Influence of the contaminated water in the port of Fukushima Daiichi nuclear power plant
Note:220 Bq/L(2013/8/19 sampling),49 Bq/L (2013/8/19) and 0.29 Bq/L (2013/6/26) of strontium-90 were detected at the Stns.(A),(B)and(C), respectively. (prepared by Fisheries Agency based on information from TEPCO)
(C)Point near the south discharge channel
(※)
Comparison of the amount of radionuclides in the contaminated water leaked in Apr.2011 with thatin the contaminated water leaked from May.2011 to Aug.2013, which was estimated by TEPCO.
leak periodsleak amount(unit:Bq)
leak periodsleak amount(unit:Bq)
cesium134+137 6days ca.18 x 10
cesium137 6days ca.9.4 x 10 ca.800days ca.1 x 10 ~ca.2 x 10
strontium-90 ca.800days ca.7 x 10 ~ca.1 x 10
tritium ca.800days ca.2 x 10 ~ca.4 x 10
-
-
-
the amount of radionuclides in thecontaminated water leaked in Apr.2011
the amount of radionuclides in thecontaminated water leaked since
may.2011, which was estimated by TEPCOradionuclides
14
12 13
11 13
13 13
14
The values of detection limit were plotted in the cases when the detected radioactivity concentration was lower than the limit.
(A)
(B)
(C)
(B)Entrance of the port(A)Point north side of Unit1-4 water
intake channel(north side of East Seawall Break)
cesium total : 1.3(2016.12.31)
cesium total : 1.1(2016.12.26)
-26-
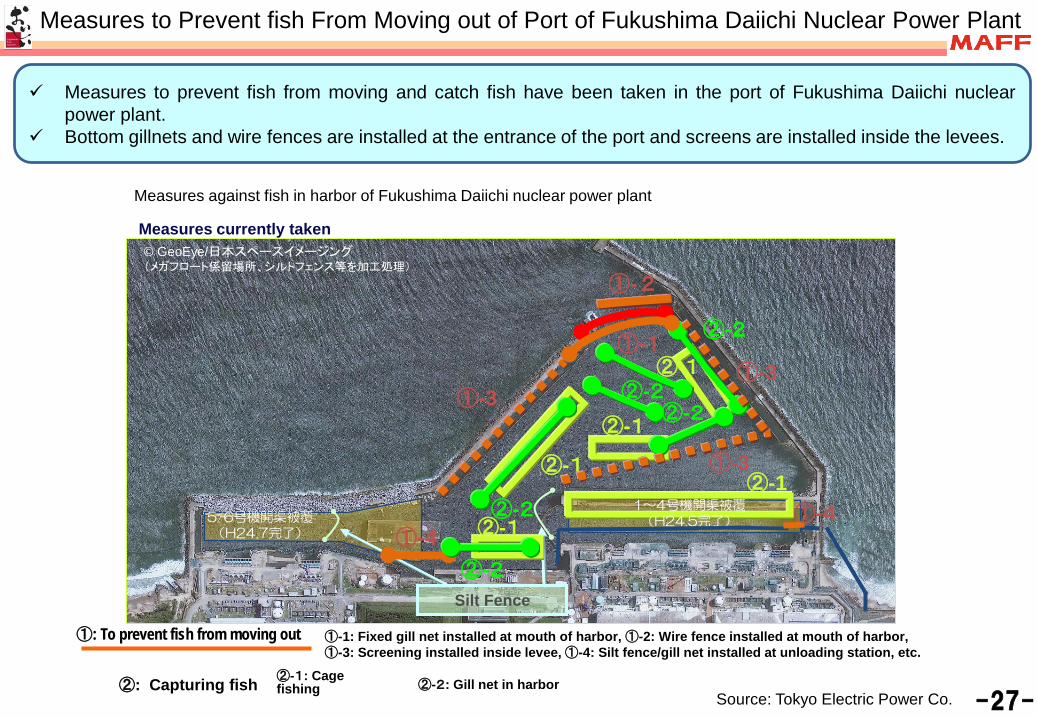
Measures to prevent fish from moving and catch fish have been taken in the port of Fukushima Daiichi nuclearpower plant.
Bottom gillnets and wire fences are installed at the entrance of the port and screens are installed inside the levees.
Measures to Prevent fish From Moving out of Port of Fukushima Daiichi Nuclear Power Plant
Source: Tokyo Electric Power Co.
①: To prevent fish from moving out
②: Capturing fish
①-1: Fixed gill net installed at mouth of harbor, ①-2: Wire fence installed at mouth of harbor, ①-3: Screening installed inside levee, ①-4: Silt fence/gill net installed at unloading station, etc.
②-1: Cage fishing ②-2: Gill net in harbor
Measures against fish in harbor of Fukushima Daiichi nuclear power plant
②-1 ①-3
②-2②-1
②-2
© GeoEye/日本スペースイメージング(メガフロート係留場所、シルトフェンス等を加工処理)
5/6号機開渠被覆(H24.7完了)
1~4号機開渠被覆(H24.5完了)
①-1
②-1
Silt Fence
①-4
②-1
②-1 ②-2
②-2
①-3①-3
②-2
①-2
①-4
Measures currently taken
-27-
-28-
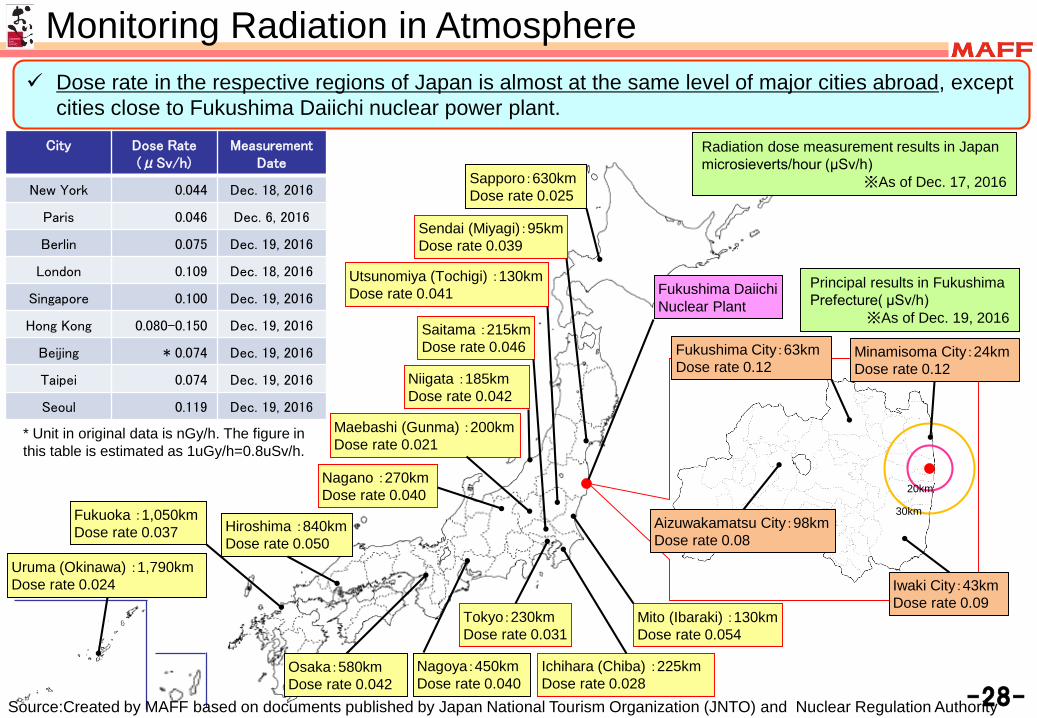
Monitoring Radiation in Atmosphere Dose rate in the respective regions of Japan is almost at the same level of major cities abroad, except
cities close to Fukushima Daiichi nuclear power plant.
20km
30km
City Dose Rate(μSv/h)
MeasurementDate
New York 0.044 Dec. 18, 2016
Paris 0.046 Dec. 6, 2016
Berlin 0.075 Dec. 19, 2016
London 0.109 Dec. 18, 2016
Singapore 0.100 Dec. 19, 2016
Hong Kong 0.080-0.150 Dec. 19, 2016
Beijing * 0.074 Dec. 19, 2016
Taipei 0.074 Dec. 19, 2016
Seoul 0.119 Dec. 19, 2016
* Unit in original data is nGy/h. The figure in this table is estimated as 1uGy/h=0.8uSv/h.
Radiation dose measurement results in Japan microsieverts/hour (μSv/h)
※As of Dec. 17, 2016
Fukushima City:63kmDose rate 0.12
Aizuwakamatsu City:98kmDose rate 0.08
Minamisoma City:24kmDose rate 0.12
Iwaki City:43kmDose rate 0.09
Sapporo:630kmDose rate 0.025
Sendai (Miyagi):95kmDose rate 0.039
Niigata :185kmDose rate 0.042
Maebashi (Gunma) :200kmDose rate 0.021
Mito (Ibaraki) :130kmDose rate 0.054
Tokyo:230kmDose rate 0.031
Uruma (Okinawa) :1,790kmDose rate 0.024
Nagoya:450kmDose rate 0.040
Osaka:580kmDose rate 0.042
Fukuoka :1,050kmDose rate 0.037 Hiroshima :840km
Dose rate 0.050
Nagano :270kmDose rate 0.040
Utsunomiya (Tochigi) :130kmDose rate 0.041
Saitama :215kmDose rate 0.046
Ichihara (Chiba) :225kmDose rate 0.028
Fukushima Daiichi Nuclear Plant
Principal results in Fukushima Prefecture( μSv/h)
※As of Dec. 19, 2016
Source:Created by MAFF based on documents published by Japan National Tourism Organization (JNTO) and Nuclear Regulation Authority
5. Lifting and Relaxation of the Import Restrictions
-29-
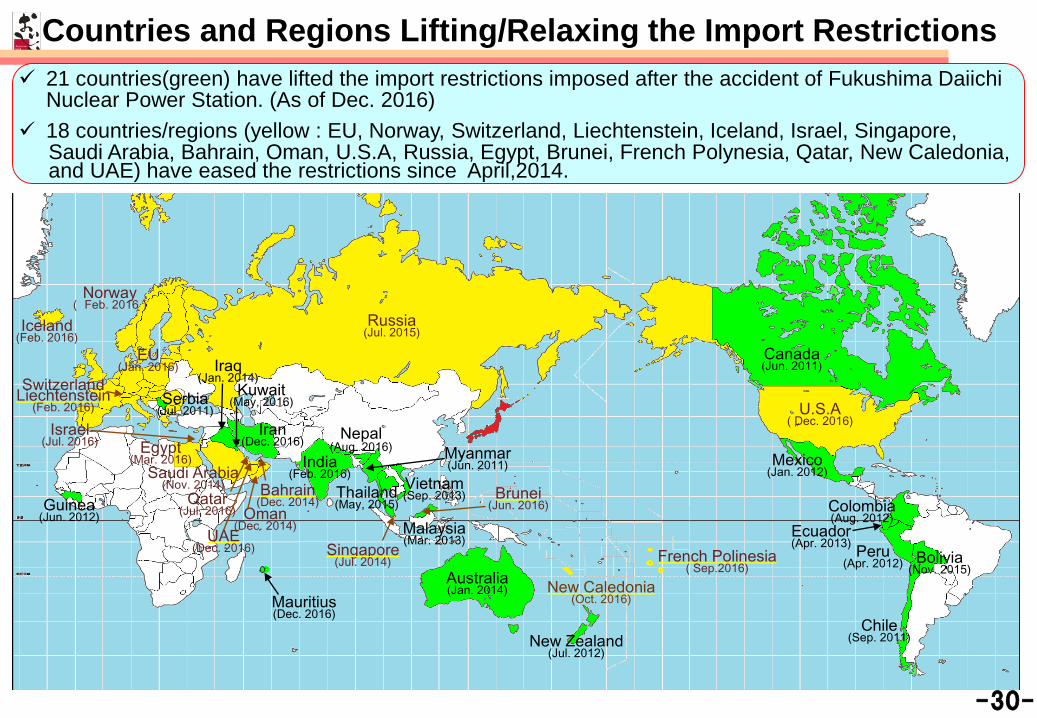
21 countries(green) have lifted the import restrictions imposed after the accident of Fukushima Daiichi Nuclear Power Station. (As of Dec. 2016)
18 countries/regions (yellow : EU, Norway, Switzerland, Liechtenstein, Iceland, Israel, Singapore,Saudi Arabia, Bahrain, Oman, U.S.A, Russia, Egypt, Brunei, French Polynesia, Qatar, New Caledonia,and UAE) have eased the restrictions since April,2014.
Countries and Regions Lifting/Relaxing the Import Restrictions
Colombia(Aug. 2012)
Guinea(Jun. 2012)
Malaysia(Mar. 2013) Ecuador
(Apr. 2013)
Vietnam(Sep. 2013)
Myanmar(Jun. 2011)
New Zealand(Jul. 2012)
Mexico(Jan. 2012)
Peru(Apr. 2012)
Canada(Jun. 2011)
Chile(Sep. 2011)
Serbia(Jul. 2011)
Australia(Jan. 2014)
EU(Jan. 2016)
Saudi Arabia(Nov. 2014) Thailand
(May, 2015)
Israel(Jul. 2016)
Oman(Dec. 2014)
U.S.A( Dec. 2016)
India(Feb. 2016)
Egypt(Mar. 2016)
Brunei(Jun. 2016)
Russia(Jul. 2015)
Iraq(Jan. 2014)
Bolivia(Nov. 2015)
Norway( Feb. 2016)
Iceland(Feb. 2016)
SwitzerlandLiechtenstein(Feb. 2016)
Singapore(Jul. 2014)
Bahrain(Dec. 2014)
Kuwait(May, 2016)
French Polinesia( Sep.2016)
Qatar(Jul. 2016)
Nepal(Aug. 2016)
New Caledonia(Oct. 2016)
UAE(Dec. 2016)
Mauritius(Dec. 2016)
Iran(Dec. 2016)
-30-
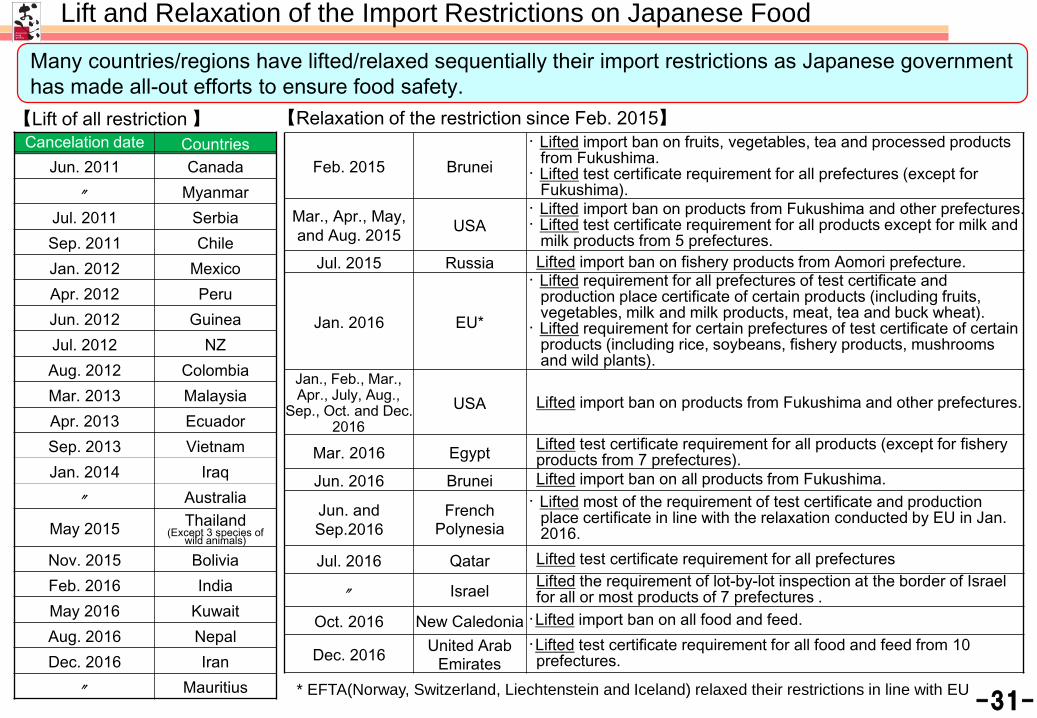
Many countries/regions have lifted/relaxed sequentially their import restrictions as Japanese government has made all-out efforts to ensure food safety.
Lift and Relaxation of the Import Restrictions on Japanese Food
-31-
【Lift of all restriction 】 【Relaxation of the restriction since Feb. 2015】Cancelation date Countries
Jun. 2011 Canada〃 Myanmar
Jul. 2011 SerbiaSep. 2011 ChileJan. 2012 MexicoApr. 2012 PeruJun. 2012 GuineaJul. 2012 NZAug. 2012 ColombiaMar. 2013 MalaysiaApr. 2013 EcuadorSep. 2013 VietnamJan. 2014 Iraq
〃 Australia
May 2015 Thailand(Except 3 species of
wild animals)
Nov. 2015 BoliviaFeb. 2016 IndiaMay 2016 KuwaitAug. 2016 NepalDec. 2016 Iran
〃 Mauritius
Feb. 2015 Brunei・ Lifted import ban on fruits, vegetables, tea and processed products
from Fukushima.・ Lifted test certificate requirement for all prefectures (except for
Fukushima). Mar., Apr., May, and Aug. 2015 USA
・ Lifted import ban on products from Fukushima and other prefectures.・ Lifted test certificate requirement for all products except for milk and
milk products from 5 prefectures. Jul. 2015 Russia Lifted import ban on fishery products from Aomori prefecture.
Jan. 2016 EU*
・ Lifted requirement for all prefectures of test certificate and production place certificate of certain products (including fruits, vegetables, milk and milk products, meat, tea and buck wheat).
・ Lifted requirement for certain prefectures of test certificate of certain products (including rice, soybeans, fishery products, mushrooms and wild plants).
Jan., Feb., Mar.,Apr., July, Aug.,
Sep., Oct. and Dec. 2016
USA Lifted import ban on products from Fukushima and other prefectures.
Mar. 2016 Egypt Lifted test certificate requirement for all products (except for fishery products from 7 prefectures).
Jun. 2016 Brunei Lifted import ban on all products from Fukushima.
Jun. and Sep.2016
French Polynesia
・ Lifted most of the requirement of test certificate and production place certificate in line with the relaxation conducted by EU in Jan. 2016.
Jul. 2016 Qatar Lifted test certificate requirement for all prefectures
〃 Israel Lifted the requirement of lot-by-lot inspection at the border of Israel for all or most products of 7 prefectures .
Oct. 2016 New Caledonia ・Lifted import ban on all food and feed.
Dec. 2016 United Arab Emirates
・Lifted test certificate requirement for all food and feed from 10 prefectures.
* EFTA(Norway, Switzerland, Liechtenstein and Iceland) relaxed their restrictions in line with EU
Thank you.Japan Appreciates Your Cooperation for Maintaining
Food Safety for Our Next Generation.