Embed Size (px)
Citation preview

US Department of Labor (DOL)
Employment and Training Administration (ETA)
Ensuring the Quality of Training Providers under the Workforce Investment Act (WIA)
Prepared by Lauren Eyster Doctoral Student Public Policy and Administration George Washington University
Washington DC
This paper was funded either wholly or in part with Federal funds from the US Department of Labor Employment and Training Administration (ETA) under Contract Number DOLJ061A20380 The contents of this publication do not necessarily reflect the views or policies of the Department nor does mention of trade names commercial products or organizations imply endorsement of same by the US Government This paper was one of seven prepared under the 2009 ETA Research Papers Program which competitively awarded doctoral and post-doctoral students funding to conduct original research and prepare scholarly papers on topics relating to the workforce investment system
Acknowledgments
Thank you to the US Department of Labor Employment and Training Administration (ETA) for its support for this research through the 2009 Research Paper Program offered to doctoral students The grant allowed for data collection and early analysis that will be the focus of this dissertation research Lance Grubb of HeiTech Services Inc provided helpful guidance throughout the grant program The insightful comments from staff in ETArsquos Office of Policy Development and Research Kenneth R Troske and Christopher Jepsen at the University of Kentucky and Doug Wissoker at the Urban Institute helped to guide and improve this research The assistance of Jonathan Pollak at Johns Hopkins University who shared his work on the Workforce Investment Act Standardized Record Data and all of the state Workforce Investment Act representatives who took the time to complete the survey were invaluable
Table of Contents
Introduction 1
A Conceptual Framework for Ensuring the Quality of Training Providers for Adults and Dislocated Workers under WIA 3 The Need for Training 3 MarketshyBased Policy Intervention 3 State Restrictions on Training Provider Markets 5 Training Provider Quality 8 Moderating Factors in Training Provider Quality 9 Policy Outcomes 10
Current Research on ITAs and ETP Policies and Their Effectiveness 11
Data and Research Methodology 13 Data 13 Research Methodology 14 Limitations 17
Findings and Conclusions 19 Descriptive Results of the State ETP Policy Survey 19 Multivariate Analysis of State ETP Policies 25 Policy Implications 31
References 33
Appendix A ndash State Eligible Training Provider Survey 36
Appendix B ndash Tables on Multivariate Results 38
Introduction The Workforce Investment Act of 1998 (WIA) authorized the use of a voucher-like
mechanism called Individual Training Accounts (ITAs) by which the WIA participants can
purchase training services The motivation behind ITAs is to promote maximum customer
choice and encourage a market-driven strategy for the workforce investment system To ensure
that customers have a selection of high-quality training providers whose training will lead to
employment states are required to provide ITA participants with a list of state-approved training
providers However states have a great deal of flexibility in the criteria they use to certify
training providers how they construct and distribute their lists and if they devolve the process to
local workforce investment areas
WIA created a framework for states to customize their eligible training provider (ETP)
systems from which ITA participants can select the provider that most meets their workforce
goals The legislation requires initial and subsequent eligibility procedures for training providers
to be established but allows states to design their own application and certification process allow
for local flexibility in the eligibility process and seek a waiver to extend eligibility periods
Standard performance data on the aggregate employment and wage outcomes of training
programs must be collected and shared by states but states can set the performance levels and
allow local workforce investment boards (WIBs) to increase those levels WIA also requires that
states publish a statewide ETP list but states can present the information to meet their needs such
as including providers from other states or providers that are not approved on their lists Thus
while WIA provides a framework for the ETP system states have a great deal of flexibility to
develop their own ETP policies ostensibly to help ensure that their statersquos ITA participants
receive high-quality training services that will lead to gainful employment
Little is known about how states have designed their ETP policies and if these policies
increase the quality of approved training providers as measured by the employment and training
outcomes of ITA participants To better understand states ETP policies and their possible
effects this study attempts to answer the following questions
What ETP policies have states implemented and how do policies vary across states
How much do the various state ETP policies have an effect on ITA participantsrsquo
employment and training outcomes
1
It is expected that while states set ETP policies that encourage the inclusion of high-quality
training providers (training that leads to employment) ETP eligibility criteria that are too strict
or onerous may deter some providers from applying which decrease the number of quality
providers In addition the more colleges ndash both two- and four-year postsecondary institutions ndash
included on the ETP lists may also encourage ITA participants to select a higher quality training
program that leads to gainful employment Finally the states that have more flexibility through
having a waiver and by giving local workforce investment areas some control to develop their
own ETP policies and practices may lead ITA participants to select higher quality training
programs because the eligibility process can be customized to state and local needs
To answer these questions and test these hypotheses a survey entitled the State Eligible
Training Provider Survey of the 50 states (and the District of Columbia) was fielded to inquire
about their ETP policies over the past five program years The short survey which was
administered January-May 2010 and completed by 24 states asked overall ETP policies (eg
use of waiver local flexibility) criteria used for provider eligibility percentage of colleges on
the state ETP list and state experiences administering ETP policies The state survey data are
then linked to Workforce Investment Act Standardized Record Data (WIASRD) files for the four
most recent program years available (2004-2007) and provide data on ITA participant
characteristics program participation pre-program employment experiences and post-program
employment and training outcomes for the analysis Both descriptive and multivariate regression
analyses are used to understand how state ETP policies affect individual-level employment and
training outcomes
This paper first offers a conceptual framework for how states under WIA can ensure the
quality of training providers through their ETP policies in order to improve outcomes for adults
and dislocated workers A summary of research on ITAs and ETP policies is then presented
Next a description of the primary and secondary data and the methodology used to analyze the
effects of state ETP policies on individual employment and training outcomes is provided The
final section summarizes the results of these analyses and offers several policy implications from
the research
2
3
A Conceptual Framework for Ensuring the Quality of Training Providers for Adults and Dislocated Workers under WIA
A conceptual framework is needed to provide a theoretical understanding of how state
ETP policies ensure training provider quality in order to improve individual employment and
training outcomes under WIA The framework depicted in Figure 1 focuses on WIA adult and
dislocated worker participants1 The following section provides the rationale for this framework
and how it offers a basis for the analytical task presented later in this paper
The Need for Training
At the starting point of the conceptual framework it is important to ask why adults and
dislocated workers need publicly-provided training As shown in the first column of the
conceptual framework there are two reasons for entering into WIA training First dislocated
workers may need retraining because they have skills that are considered obsolete and cannot
qualify for new employment For example an assembly person who lost his or her job at a
manufacturer may need a skills upgrade or training in a new occupation to find a job Second
adults who have insufficient skills or education may also need training in order to find a ldquogoodrdquo
job meaning employment that provides a self-sufficient wage and opportunities for promotion
These could be individuals who have only worked in low-paying jobs that require few
occupational skills to perform and provide no opportunities for career growth Under WIA
adults and dislocated workers who cannot find employment because of a lack of necessary skills
are assessed at a local One-Stop Career Center and may be considered eligible for training
Market‐Based Policy Intervention
The second column of the conceptual framework provides an understanding of how the
need for training is addressed by government using a market-based policy intervention ndash the
ITA ITAs operate similarly to a voucher defined by Judith Resnik as ldquoa subsidy that grants
limited purchasing power to an individual to choose among a restricted set of goods and
servicesrdquo WIA participants use ITAs to select and purchase training services from the market of
eligible training providers While the subsidy transaction remains between the entity issuing the
ITA (eg a One-Stop Career Center or workforce investment board) and the training provider
the power lies with the participant choose which training provider will best meet his or her
1 Although with a waiver local areas can provide training to older and out-of-school youth through ITAs the analysis focused on ITAs for adults and dislocated workers
Figure 1 Conceptual Framework for Ensuring the Quality of Training Providers for Adults and Dislocated Workers under WIA
Need for Training
Obsolete skills due to changes in workforce demands for industry (dislocated workers)
Insufficient skills or education needed to obtain a ldquogoodrdquo job (adults)
Market-based Policy Intervention
Selection of Policy Tool Use of a voucher-like mechanism called an Individual Training Account (ITA) under the Workforce Investment Act of 1998
Policy Goals Empowerment of individuals through choice a strong role for the private sector amp state and local flexibility
State Restrictions on Training Provider Market
State Policies to Ensure Provider Quality Initial amp subsequent eligibility determinations provider performance reporting design amp publication of ETP list use of waivers amp local flexibility in eligibility process
Training Provider Quality
Moderating Factors
State ITA Design Cap on ITA amount and limit on ITA training duration State Experiences and Challenges with the Provider Market Provider market that meets demand quality of information customer use of list and process burden ITA Participant Characteristics Demographics program participation WIA services amp pre-WIA wages State Economic Factors Unemployment rate
Policy Outcomes
ITA Participants Improvements in employment amp wages amp credential attainment
State Ability to meet WIA performance goals
Industry Better skilled workforce
4
individual needs and preferences However this choice is limited to the providers that have been
approved by the state and are on the ETP list
Vouchers are often used as a tool for government to provide goods and services and can
be politically popular (Steuerle and Twombly 2002) Policymakers recognize that vouchers can
create competition among businesses vying for vouchers from which produce goods and services
more efficiently meaning that supply will meet demand at fair market pricing (Steuerle and
Twombly 2002) Policymakers may also view them as a way to reduce the need for government
resources to administer the voucher and thus reduce government size and spending Voucher
recipients may favor having the choice among goods and services rather than having a very
limited or lack of choice through direct government provision grants and contracts (Salamon
2002) In addition business may prefer vouchers because they open the market to all providers
of a good or service and expand opportunities for the private sector to tap into government
spending This popular appeal of vouchers has led to many Federally-funded social programs to
use a voucher mechanism to deliver services including food stamps child care and housing
among others
The goals of WIA and the use of vouchers as a policy tool as shown in the conceptual
framework embody many of the principles in presented by Osborne and Gaebler (1992) in their
seminal book Reinventing Government As provided in the final rules of WIA (US Department
of Labor 2000) the key principles include empowering individuals through choice a strong role
for the private sector and state and local flexibility which directly align with Osborne and
Gaebler framework The use of training vouchers ndash because they are a market-driven permit
customer choice and are administered at a local level ndash will help to meet the goals of WIA
State Restrictions on Training Provider Markets In the conceptual framework the next step is to implement the market-based policy
intervention but with restrictions on the policy tool selected a voucher These restrictions are to
ensure that the government is receiving a certain standard of quality in the goods and services it
procuresmdashin this case training Vouchers as policy tools also use the power of the market to
ensure that there is an adequate supply of quality goods and services to meet customer demand
However the market of providers of ITA-funded training may not perform as intended and a
market failure may occur (Barnow 2000 Ellis 2001 Hipp and Warner 2008) In their study of
German and US training vouchers Hipp and Warner observe that market failures can occur on
5
both the supply and demand sides of vouchers On the supply side it can be difficult for
government to manage the quality of the providers and the viability of the market For example
in training vouchers developing performance standards for providers may be necessary to ensure
the quality of the training as measured by employment and earnings outcomes of participants
Solutions to supply side market failures can also include oversight and regulation of providers
both in their selection and performance Market formation issues because of a lack of scale in
the demand for training services can be addressed by making non-voucher services available to
customers such as those in rural areas
Market failures on the demand side can also be corrected by government action Voucher
users can have preferences that do not align with the goals of the program and government must
restrict the choices they can make according to Hipp and Warner This solution is evident in
programs such as food stamps where the US Department of Agriculture restricts the types of
food participants can buy because of nutritional concerns In training programs voucher use
may be restricted to training that is most likely to lead to employment Restrictions on the
vouchers may lead to their underuse which may hinder the formation of markets Not enough
demand by consumers for training especially in early implementation stages will stunt the
development of a viable market Governments sponsoring training vouchers have to carefully
structure voucher choice to encourage use by consumers and incentivize provision by private
firms Poor or uninformed choices can occur when the consumer holding the voucher does not
have enough information to make good choices for themselves In the case of training vouchers
a consumer may not be able to make a reasonable judgment as to whether their interests and
abilities will lead to successful completion of training and placement in a job Thus a system
that provides the data needed to make an informed decision and guidance from an intermediary
such as the ETP list under WIA can help to overcome a lack of adequate information
While ITAs are designed to allow for maximum choice in training options the risk of
ITA participants making poor choices that did not lead to positive outcomes such finding
employment and earning a living wage is evident WIA specifies that certain restrictions
imposed at the state or local level should be used to vet providers for their quality determined by
the training providersrsquo past performance and their ability to provide training in high-demand
high-wage occupations States and local WIBs must make information on training providers and
6
their programs available to WIA participants and are encouraged in the WIA regulations to
provide assessment and counseling to ITA participants so they can make an informed choice
The WIA legislation provides an overall structure to the ITA system that limits
customersrsquo choices to training providers that have been certified through a state-approved
process and ensures that WIA customers have access to information about the performance of
participants who had been served by these providers The Governor of each state must establish
minimum eligibility criteria and procedures for use by local WIBs to screen training providers to
be eligible to serve ITA participants The purpose of the eligibility process is not only to ensure
that ITA participants have adequate information from which to choose training services but also
to create a market-driven system of training providers that must compete against each other for
ITA participants There are two eligibility processes for training providers seeking state
approval to serve ITA participants 1) initial eligibility which can be waived for colleges and
registered apprenticeship programs and 2) subsequent eligibility which all providers must
undergo after the initial period ends
The eligibility process can be administered at the state or local level but the states have
final approval of training providers for the ETP list To be placed on the ETP list training
providers must submit performance data on the training programs they want to be approved for
use by ITA participants and the training program must be for an occupation that is considered
ldquohigh demand and high wagerdquo for the local labor market area These program performance
measures include (US Department of Labor 2000)
Completion rates for WIA and all training participants
Employment (unsubsidized) rates for WIA and all training participants
Average wages at the time of placement into employment of all participants
Employment retention rates for WIA participants completing training
Average earnings at six months for WIA participants completing training
Credential attainment (if applicable) for WIA participants completing training
If permitted by the state local WIBs can apply more stringent criteria to evaluate the provider
performance for the eligibility process States can also seek a Federal waiver to extend the initial
eligibility period for the training provider approval
If the providers are approved they are put on the ETP list that is linked to a Consumer
Reporting System (CRS) which provides the performance data on approved training programs to
7
ITA participants ETP lists have to be available through One-Stop Career Centers and are
typically available on the Internet (US Department of Labor 2000) States can also choose to
place training providers on the list that are not approved for ITAs In addition a state can
develop reciprocal agreements with other states to place their approved training providers on its
own list These policies can expand the training provider market from which ITA participants
can choose a training program
Thus the conceptual framework shows the policies that states enact to implement these
restrictions and quality controls on the training provider market These include making initial
eligibility determinations for ETPs through an application process receiving a Federal waiver to
extend the initial eligibility period permitting local flexibility in the eligibility process setting
provider performance levels for subsequent eligibility determinations and designing and
publishing a state ETP list may includes providers from border states or providers that are not
approved for ITA use The results from the survey provided in a later section describe how
states have designed these policies to implement their ETP systems
Training Provider Quality Up to this point the quality of training providers has been discussed somewhat
ambiguously However as shown in the conceptual framework the notion of ldquoqualityrdquo is key to
meeting the intended outcomes of WIA which are to help participants complete training earn a
credential and improve their employment and earnings WIA provides some signals for what its
creators saw as the key elements of training provider quality First WIA allows states to make
post-secondary educational institutions (eligible under the Higher Education Act2) and registered
apprenticeship programs automatically eligible at least initially as approved training providers
These providers offer participants widely recognized credentials upon graduation ndash a certificate
or college degree ndash or lead to licensure in a particular occupation such as a journeymanrsquos license
or a certified nursing assistant license This indicates that post-secondary educational institutions
and registered apprenticeship programs are considered higher quality than other providers who
need additional screening by states or local WIBs Second the training offered by providers
must be in high-demand high-wage occupations to be eligible The rationale is that training in
2 Title IV of the Higher Education Act provides federal financial aid funds including Pell grants to post-secondary educational institutions Institutions that receive these funds are initially eligible to be approved training providers under WIA
8
these occupations are more likely to lead to gainful employment by WIA training participants
Finally WIA stipulates that training providers during the eligibility process must demonstrate
that the training program(s) it offers is likely to lead to completion of or graduation from the
program credential attainment employment and wages This requirement shows that the
outcomes of participants are a crucial indicator of the quality of training providers
There are other potential indicators of training provider quality that WIA does not
directly address For example training providers that use evidence-based learning models may
be considered higher quality as they use instructional methods or program features that have
shown some success in achieving positive participant outcomes Thus the use of evidence-based
programs can be considered an indicator of high-quality training In addition hiring and
retaining qualified instructors that are trained in the latest industry advances or are highly
experienced in the classroom may also be a key indicator of training provider quality Finding
qualified instructors for training in a particular industry can be challenging because they may be
able to earn a higher wage working in the industry such as a registered nurse rather than as an
instructor at a post-secondary institution (Nightingale et al 2008) Thus some training providers
may not have enough qualified instructors for their training program due to competition for their
skills in the industry Another indicator of training quality may be providers that offer services
to participants that help them stay in and complete a training program (eg child care
counseling or peer support monetary incentives) and find employment after program
completion While many of the providers approved for ITA training may have any of attributes
mentioned WIA does not address them as possible measures of training provider quality This is
indicated by the focus of the WIA regulations on the use of only training outcomes to measure
quality rather than inputs
Moderating Factors in Training Provider Quality As described in the conceptual framework the state ETP policies are designed to ensure
the quality of training providers under WIA but moderating factors can influence the
effectiveness of the training providers First some states put a cap on the amount of the ITA
available to recipients and limit the duration of training received (Barnow and King 2005) In
addition some states allow local WIBs to develop their own ITA policies to limit ITA use (GAO
2005) These limits to ITAs may in turn limit the training options that ITA participants can
pursue especially longer-term or higher cost training programs
9
Another factor that may moderate the quality of training provider available to ITA
participants is the potential market failures that may occur in the implementation of ETP
policies Limits on provider eligibility and the burden of the eligibility process may keep
providers from applying (DrsquoAmico and Salzman 2004) There may also be a lack of qualified
providers in the workforce area such as those that have programs in high-wage high-demand
occupations In addition there may be a lack of quality data on the eligible training providers in
order for ITA participants to make informed training decisions or the ITA participants use other
means to select training providers other than the performance data provided by the ETP list (US
Department of Labor WIA Readiness Review 2002)
The characteristics of ITA participants may also moderate the effect of the quality of
training providers on participantsrsquo outcomes Studies of the effectiveness of training programs
take into account the individual demographics of participants other government programs they
participate in the training programrsquos services they use and their preprogram employment and
wages In particular participant characteristics are important in determining who may see more
success in their employment and training outcomes compared to others State economic factors
may also moderate the effectiveness of training provider quality It is important to consider how
the state economy such as unemployment rates may influence the employment outcomes of
individuals participating in a training program
Policy Outcomes There are three potential policy outcomes to the training offered by eligible providers as
shown in the conceptual framework ITA participants may be better prepared for the workforce
(and may have a credential in an occupation) and see improvements in their employment and
earnings These are the major outcomes that are tracked and monitored through the performance
reporting by states under WIA Specifically states must meet performance goals set by the US
Department of Labor which are entered employment employment retention and average post-
program earnings (US Department of Labor 2006) The Department also tracks credential
attainment for WIA participants Thus the second policy outcome shown in the conceptual
framework is the statersquos ability to meet these performance goals which having a pool of high-
quality training providers should improve Finally while a less directly measurable outcome
industry in a state may be strengthened through the efforts to train a better workforce
10
Current Research on ITAs and ETP Policies and Their Effectiveness The conceptual framework offers an analytical guide from which to understand how state
ETP policies affect ITA participantsrsquo employment and training outcomes by ensuring the quality
of training providers While little is known about the ETP policies and ensuring provider
quality some studies provide offer some insight into the effects of early training voucher
experiments and of the more recent ITAs More recent studies also offer some understanding of
how states and local areas have implemented their ETP policies
In the 1970s an experimental evaluation of a subsidy for vocational education for low-
income individuals was conducted as a part of the negative income tax experiments Researchers
found that individuals who received a 100-percent subsidy for training received one additional
year of training compared to those who did not receive the subsidy (Dickenson and West 1983)
However there was no statistically significant difference in their post-program earnings Thus
these subsidies increased participation in job training but did not result in higher earnings A
nonexperimental evaluation of the Career Management Account (CMA) demonstration a
precursor to ITAs showed mixed results there were small positive impacts on earnings for those
who received CMAs compared to those who did not (Public Policy Associates 1998) However
selection bias was a possible issue that could not be overcome in the nonexperimental design so
the results cannot be solely attributed to the CMA3
Three more recent ETA-sponsored evaluations have studied the implementation and
sometimes the outcomes of ITAs and ETPs in numerous states and local areas They are
National Evaluation of the Implementation of the Workforce Investment Act An
implementation study of WIA in the five years since its passage with 21 states and 40
local workforce investment areas participating in the study (Social Policy Research
Associates 2004)
An Evaluation of the Individual Training AccountEligible Training Provider
Demonstration The implementation component of an experimental evaluation to
understand the implementation of three approaches to ITAs in 13 states and local areas
(DrsquoAmico and Salzman 2004)
3 Selection bias can occur when the participation in programs is not determined randomly and that those who enter the program may be systematically different in immeasurable ways (eg ability motivation) from those who did not
11
The Workforce Investment Act in Eight States An evaluation of eight states with in-
depth case studies of the state and local administration of WIA (Barnow and King 2005)
In all three evaluations more direct evidence of the effects of ITAs and the implementation of
the ETP policies and processes in states and local areas is provided Researchers found that
many of the local staff were using a ldquoguidedrdquo or ldquoinformedrdquo choice model in which they worked
with the ITA customers to make training selections but that the choices were ultimately being
made by the customers after receiving information on their options Both evaluations concluded
that some of these states and training providers indicated that the application process to become
an eligible training provider was burdensome and expensive DrsquoAmico and Salzman (2004) also
noted that most of the lists were made up of community colleges and proprietary schools but that
many community colleges ldquobalkedrdquo at the eligibility requirements and considered it ldquonot worth
the troublerdquo These evaluations also highlighted the strong role of the local WIBs and One-Stop
Career Center staff in guiding ITA participants the selection of an eligible training provider and
the development of ITA policies such as caps on amount and duration States allowed for local
discretion in developing the ETP processes but still created a structure in which the local entities
operate
The US Government Accountability Office (GAO) (2005) surveyed a sample of local
WIBs on training under WIA The survey asked respondents to provide information on how
local boards spend training dollars and manage the use of ITAs and what outcome data on
training are available The study identified some of the challenges of local boards that imply
some level of market failure in local workforce systems The boards were challenged by a lack
of good performance data on training providers (and for rural areas a lack of training providers)
which did not permit them to evaluate the effectiveness of these providers However these
findings described local-level systems and did not indicate the state-level structures that may
mitigate the challenges local boards faced
While the current literature offers insight of how ETP policies are implemented no
research to date has been conducted to describe state-level ETP policies and how state-level
decisions on ETP policy can affect the outcomes of ITA participants The research presented in
this paper contributes to the current literature on ITAs and training vouchers by examining the
various state ETP policies and how they vary These include criteria for provider eligibility
processing of applications the composition of the ETP list and local flexibility to institute ETP
12
policy ndash and how different combinations of these elements may affect ITA participantsrsquo
employment and training outcomes
Data and Research Methodology The following section provides a description of the data and analytical methods used to
answer the research questions on state ETP lists A discussion of the studyrsquos limitations is also
included
Data To answer the questions outlined a research design involving the use of primary and
secondary data and multivariate analytic methods was necessary Primary data collection
entailed the fielding of a survey to capture state-level ETP policy data the key independent
variables of interest to understand how these factors influence state performance and participant
training outcomes See Appendix A for a copy of the State Eligible Training Provider Survey
Secondary data drawn from WIASRD provided individual-level WIA records of ITA
participants (adults and dislocated workers) State-level economic data were accessed through
the Bureau of Labor Statistics All data used were for the program years 2004-2007
State-Level Data State documents such as policy manuals WIA state plans and ETP
lists were reviewed for ETP data but the state information sought was inconsistent in format and
availability Thus to obtain standardized state-level ETP policy data a web-based survey of
state and the District of Columbia WIA administrators was conducted and fielded from January-
May 2010 and completed by 24 states The following questions were asked of state respondents
to ascertain basic information on their ETP policies and experiences over the past five program
years
Overall state policies such as receipt of a Federal waiver for the initial eligibility
period and local flexibility to design their own ETP eligibility process and set higher
performance levels for eligibility
Minimum performance standards for ETP for completion rates (for WIA and all
participants) employment (unsubsidized) rates (WIA and all participants) average
wages at the time of placement into employment of all participants employment
retention rates for WIA completers average earnings at six months for WIA
completers and credential attainment (if applicable) for WIA completers
13
Composition of the ETP list such as the percentage of colleges on the state ETP list
and inclusion of providers that are not approved and from other states on the list and
Perceived difficulty of the eligibility process and challenges with the provider market
Ranges rather than point estimates were used to capture the data because of the temporal factor
of looking at several years of data It was assumed that state ITA and ETP policies stabilized by
2004 and those changes would occur only around the margins so that a range estimate would be
acceptable for this analysis Using this temporal consideration for the state-level variables also
allows for analysis to be continued once WIASRD files are released for program years 2008 and
2009 A set of questions also asked states about their ITA policies including ceiling on ITA
amount training duration limit and degree of guidance provided to ITA participants at local
One-Stop Career Centers The data derived from these questions controlled for other state ITA
policies such as ceilings on training duration and costs to isolate the effects of state ETP policies
on state performance levels and individual training outcomes
Individual-Level Data The largest data source for this research was the WIASRD file
for the four most recent program years available ndash 2004-2007 This source provided
administrative data at the individual WIA participant level from which ITA participants from the
Adult and Dislocated Worker programs were extracted Demographic (eg race gender age
education preprogram earnings) and program participation variables (eg unemployment
insurance Temporary Assistance for Needy families) were provided for these individuals and are
used as controls for the multivariate analysis Other variables of interest were WIA program
experiences such as receipt of a Pell grant needs related payments and support services Data
on ITA participant outcomes of entered employment employment retention and average wages
the key common measures of performance for WIA as well as credential attainment (not a
general equivalency degree) were used for the analysis (US Department of Labor 2006)
Annual state unemployment rates (US Department of Labor Bureau of Labor Statistics 2010)
from 2004-2007 were also used
Research Methodology Descriptive and multivariate regression analyses were used to answer the research
questions posed 1) what ETP policies have states implemented and how do policies vary across
states and 2) how much do the various state ETP policies have an effect on ITA participantsrsquo
employment and training outcomes The main independent variables of interest were the set of
14
state ETP policies collected from the survey to describe state ETP policies and to better
understand how each of the state policies influenced ITA participant outcomes Descriptive
analysis of the state ETP policies and experiences ndash eligibility criteria and processes
composition of the list and local flexibility ndash was used to answer the first research question
Fixed and random effects models provided answers to the second question of interest
The multivariate models were used to better understand how state-level variation in ETP
list policies ndash after controlling for experiences implementing ETP policies ITA policies ITA
participant characteristics program participation and state economic conditions ndash may influence
or be associated with changes in individual-level training outcomes of ITA participants Fixed
effects models which do not identify the variance in the model at the state level were estimated
first Using ordinary least squares (OLS) regression the continuous dependent variables of
wages during the first quarter after exit and average wages in the second and third quarter after
exit were regressed on the independent variables to estimate the predicted change in wages due
to state ETP policies A logistic regression estimation for the fixed effects model provided the
probability of employment conditional on the state ETP policies and other independent variables
The fixed effects models are specified as follows4
OLS Model Y = β0 + β1Pi + β2Mi + β3Di + β4Ei
Logistic Model log[π(x)1-π(x)] = β0 + β1Pi + β2Mi + β3Di + β4Ei
Where Y = outcome variable of interest (wages) π(x) = the probability of the outcome variable of interest (employment and credential attainment) Pi = state ETP policies Mi = key moderating variables for state ETP experiences and ITA policy Di = variables for ITA participant characteristics program participation and WIA services received Ei = state economic conditions
4 For multivariate models it is possible to cluster the standard errors by a higher-level variable which provides more robust standard errors In this analysis the fixed effects models were estimated but the results are not reported in detail because there were too few states to permit to calculate a model test (F or chi-squared test) In general fewer estimates of the key ETP policy variables and moderating factors were statistically significant when clustering the standard errors by state However the random effects models were able to achieve more robust standard errors and provided a goodness-of-fit test so those estimates are reported in detail
15
Table 1 describes the variables included in each of these components
Table 1 Description of Variables in Model Components Model Component Variables Included Earnings Outcomes (Y) Wages in 1st quarter after exit average wages at 2nd and 3rd quarters after exit Employment and Credential Outcomes (π(x))
Employed in 1st quarter after exit employed in 2nd and 3rd quarters after exit attained credential
State ETP Policies (Pi) ETP waiver local ETP flexibility no minimum criteria reciprocal agreement non‐approved providers on the ETP list
Key Moderating Variables (Mi) Less than 50 percent colleges on ETP list provider difficulties performance data difficulties state ITA cap on training amount or on training duration
ITA participant characteristics program participation and WIA services received (Di)
Gender ethnicity race older worker disabled limited English speaker single parent education level veteran displaced homemaker public assistance recipient (ie Temporary Assistance for Needy Families and state general assistance) unemployment insurance claimant or exhaustee Rapid Response Trade Adjustment Assistance received supportive services or needs related payments Pell grant recipient employed in quarter prior to program entry
State Economic Conditions (Ei) State unemployment rate by program year
Each model was run separately for adults and dislocated workers This was because the
two groups are inherently different (eg all dislocated workers have recent work experience) and
the models for each group require the use of different control variables
The random effects models which identify state-level variance were estimated next
The overall models were the same but estimates of the within state and between state variance
were provided While the parameter estimates did not change much (or at all in some cases)
between the fixed and random effect models the random effects models provide more robust
standard errors and a measure of within-state variance and between-state variance These models
were specified as follows
Random Effects Generalized Least Squares Model Y = μ + αi +β0 + β1Pi + β2Mi + β3Di + β4Ei + εij
Random Effects Logistic Model log[π(x)1-π(x)] = μ + αi +β0 + β1Pi + β2Mi + β3Di + β4Ei + εij
Where Y = outcome variable of interest (wages) π(x) = the probability of the outcome variable of interest (employment and credential attainment) μ = overall mean of the outcome variable which is an unknown constant αi = a random effect due to the ith state Pi = state ETP policies Mi = key moderating variables for state ETP experiences and ITA policy Di = variables for ITA participant characteristics program participation and WIA services received
16
=
Ei state economic conditions εij = the within state variance among ITA participants
Because the random effect models identifies the state-level variance estimates for these
models are reported in the findings section below and the full results are provides in Tables B1-
B5 in the Appendix To compare the model estimates the tables with the fixed effects models
are provided in Tables B6-B10 in the Appendix
Limitations There are several limitations of this study First and foremost the effectiveness of WIA
training against no training or another type of training is not being tested or measured in this
research This study only examines how different state ETP policies affect employment and
training outcomes not whether using ITAs works better than contracting (as used under the Job
Training Partnership Act the precursor to WIA) nor whether the ETP framework ensures the
quality of training providers for ITA participants This analysis can only provide some
understanding of which state ETP policies which are intended to ensure the quality of training
providers may show better employment and training outcomes within the adult and dislocated
worker programs It is hoped though that this study can serve as a starting point for
understanding ETP policies as a means to ensure training provider quality under a voucher
system It would be ideal if the research could build upon by using experimental or
nonexperimental analyses that involve a comparison group for measuring the impact of such
policies
The State Eligible Training Provider Survey has two specific challenges First the
survey analysis is limited to 24 states instead of all states A longer survey period was used to
increase the response rate but it is suspected that survey ldquofatiguerdquo exists among WIA
administrators5 The 24 states that responded show a range in characteristics such as size and
DOL region but caution is used in generalizing the results to all states A second concern is the
measures of ETP and ITA policies collected in the survey Precision of the estimates is
comprised by asking state WIA administrators for ranges rather than point estimates over
5 Requests for state WIA administrators to participate in surveys and other research activities have increased greatly over the past year with the implementation of the WIA and other workforce provisions in the American Recovery and Reinvestment Act of 2009 (ARRA) Thus it is expected that some states have had difficulty meeting research requests because of their intensive efforts to respond to the ARRA and recession and have experienced what researchers call ldquosurvey fatiguerdquo
17
multiple years but the design of the data collection was necessary for ease of answering the
survey and using state ETP and ITA policy variables across program years
Another challenge that exists is the bias inherent in the WIASRD dataset WIA
performance standards encourage local staff to keep participants enrolled in WIA until they find
employment and only terminate them once they do so Thus as WIASRD population is
comprised of only WIA exiters the findings from this analysis are likely to be biased toward
positive participant outcomes especially immediately after exiting the program Missing data
can also be a problem with WIASRD with some local workforce investment areas (LWIAs)
systematically not reporting some information Another challenge in using the WIASRD is that
it only provides three quarters of post-program earnings and employment Human capital theory
shows that gains to education and training should increase over time but it is not possible to test
the hypothesis of whether ETP policies have any influence on long-term employment and
earnings outcomes with the available data
A final limitation of the study is omitted variable bias First as is typical of analysis that
study human capital improvements having measures of participantsrsquo ability and motivation are
critical because they contribute to an individualrsquos selection into a particular field of training and
their ability to successfully complete the training and find employment There are no variables
that capture these data for ITA participants and could bias the results In addition local-level
ETP policies and administration clearly have the potential to influence the experiences of ITA
participants (Barnow and King 2005 DrsquoAmico and Salzman 2004 SPR 2004) This analysis
can only capture whether states allow for local flexibility in ETP policies but not the precise
nature of those policies
With all of the limitations of the study the multivariate models of state ETP policies
cannot be interpreted as causal models where it can be said that one ETP policy caused an
increase or decrease in earnings or employment for example The models can only indicate how
the state ETP models may be associated with or have an influence on the employment and
training outcomes of interest
18
Findings and Conclusions This final section provides a summary of the results from the descriptive and multivariate
analyses and their implications for policy especially in light of possible WIA reauthorization
Full analytic results are provided in Tables B1-B11 in the Appendix
Descriptive Results of the State ETP Policy Survey As mentioned 24 states which range in characteristics such as size and geographic
region completed the state ETP policy survey These states catalogued their state ETP policies
and experiences implementing these policies as presented here6
First states were asked about policy options they have exercised in designing their ETP
system over the past five program years These options include having a Federal waiver
extending the time limit on the initial eligibility period for training providers and allowing local
WIBs to increase minimum performance criteria set by the state Half of the state respondents
(12) said that they had a Federal waiver for the initial eligibility period This is consistent with
the number of all states (25) that currently have this Federal waiver (US Department of Labor
2010) Local flexibility to set higher minimum performance levels than the state is also a policy
option but only 4 of the respondents said that they had opted to permit such flexibility
The survey then asked state respondents about the minimum performance levels they
require for providers to maintain eligibility over the past five program years It should be
mentioned that there is a correspondence although not perfect between states that report having
waivers and not using the performance criteria for subsequent eligibility described in the WIA
legislation This is to be expected as since their initial eligibility period for providers has been
extended and performance criteria for subsequent eligibility are not needed
The survey asks about the subsequent eligibility criteria used by state and the levels they
have set to maintain eligibility as described in the WIA regulations Table 1 summarizes these
results The first eligibility criterion is training program completion for all participants and WIA
participants While most state respondents (5) that use this criterion for all participants tend
toward the middle option of 50-75 percent completion more state respondents (4) indicate that
they set a higher minimum completion rate for WIA participants (75 percent or more)
6 To encourage participation in the survey the states were assured that their individual answers would be kept confidential Thus the results do not identify specific state answers and are provided in the aggregate
19
The employment rate is also a key criterion used for maintaining provider eligibility
While over half the states that responded did not use this performance criterion of those that did
more states (7) report the their minimum performance level for post-program employment is in
the middle range (50-75 percent) for all participants and evenly distributed between the mid- and
high-range (4 states each) for WIA participants As observed in the completion rate criterion the
these states more often use employment rate minimums that are set higher for WIA participants
than for all participants that attended an eligible training provider
Two other possible performance criteria for training providers ndash employment in a related
occupation and employment at six months ndash are also identified in the WIA regulations More
states than with other employment criteria indicate that they do no use employment in a related
occupation for all participants as a criterion for eligibility Of the 6 states that use this criterion
half (3) report setting the minimum rate of 50-75 percent Ten states report using employment
rate at six months for WIA participants that completed training as a criterion Of these 6 states
use a minimum level within 50-75 percent 3 states set a higher minimum at over 75 percent and
1 state has a minimum level of less than 50 percent
Table 2 Statersquos Use of Minimum Performance Levels to Maintain Eligibility (N=24)
Minimum Performance Criteria lt 50 50‐75 gt75 Do Not Use
Do Not Know
Completion Rate (all individuals) 2 states (8)
5 states (21)
2 states (8)
14 states (58)
1 state (4)
Completion Rate (WIA participants)
1 state (4)
3 states (13)
4 states (17)
15 states (63)
1 state (4)
Employment Rate (all individuals) 0 states (0)
7 states (29)
2 states (8)
14 states (58)
1 state (4)
Employment Rate (WIA participants)
1 state (4)
4 states (17)
4 states (17)
13 states (54)
2 states (8)
Rate of Employment in Related Occupation (all individuals)
1 state (4)
3 states (13)
2 states (8)
16 states (67)
2 states (8)
Employment Rate at 6 Months (WIA completers)
1 state (4)
6 states (25)
3 states (13)
13 states (54)
1 state (4)
lt$7 per hour
$7‐10 per hour
$11‐14 per hour
$15 or more
Do Not Use
Do Not Know
Hourly Wage at Placement (all individuals)
0 states (0)
7 states (29)
0 states (0)
0 states (0)
13 states (54)
4 states (17)
lt$5000 $5000‐$9999
$10000‐$14999
$15000 or more
Do Not Use
Do Not Know
Average Wages at 6 Months (WIA completers)
1 state (4)
3 states (13)
2 states (8)
1 state (4)
14 states (58)
3 states (13)
Source 2010 Survey of State Eligible Training Provider Policies Note Percentages across cell rows may not total 100 percent due to rounding
20
Minimum wage levels are also used as eligibility criteria Of the 7 states that report using
hourly wage at placement into employment for all participants as a criterion all of these states
indicate that they set their minimum hourly wage at $7-10 While this may be a realistic goal for
training providers to meet for wages in entry-level jobs an hourly wage of $10 and working
fulltime would barely put a single-headed household of three above 100 percent of the national
poverty level (US Department of Health and Human Services 2010) Thus this may not be a
difficult performance level to meet The minimum performance level for average wages at six
months for WIA participants who complete the training is not set as low Of the states that use a
longer-term wage minimum criterion three states set the average six-month wages at $10000
and over and 4 states set it at below $10000
As allowed by WIA several states set additional criteria for maintaining provider
eligibility Six states use rates of licensure certification or attainment of academic degrees of
WIA participants and 1 state uses the criterion for all participants to determine subsequent
eligibility In addition 4 states use the rate of attainment of industry-recognized occupational
skills as an eligibility criterion Two states report using retention rates in employment at six
months for all participants and two states use average wages at six months for all individuals
Fourteen states report using no additional criteria for setting minimum performance levels for
maintaining provider eligibility
These minimum performance levels for provider eligibility can be a contentious issue for
some states A workgroup of state representatives hosted by the US Department of Labor met
in 2001 to discuss and develop recommendations for the implementation of subsequent eligibility
policies under WIA (US Department of Labor WIA Readiness Review 2002) The states
indicated that there is confusion in using the seven criteria used to determine subsequent
eligibility as states can weight each criterion differently In addition the workgroup suggested
that an adequate system is not in place to capture performance data in ldquoa uniform meaningful
and cost-effective manner across all programs on the ETP listrdquo The workgrouprsquos main concern
was that implementing these eligibility criteria would reduce the number of providers on the ETP
list and restrict the choice of training for ITA participants
Three questions were asked about how states have designed their ETP lists ndash reciprocal
agreements with other states non-approved providers on the ETP list and the proportion of post-
secondary institutions on the ETP list These options are intended to help to increase the size of
21
the provider market for ITA participants Nearly half of the respondents (11) also said that they
had entered into a reciprocal agreement with another state that permits eligible training providers
from one state to accept ITAs provided by another state Over a third of state respondents (9)
report allowing training providers to be placed on their state ETP list that have not been
approved for ITA use States were also asked about the approximate proportion of two- and
four-year colleges and universities on the ETP list Nearly half of the respondents (11) indicate
that at least half of the providers on the list are two- and four-year institutions which could lead
to more ITA participants selecting training programs that would lead to a college degree
States were asked their perceptions of their experiences implementing ETP policies over
the past five years On a four-point scale the state respondents indicated how successfully they
believed they addressed issues around ETP policies7 Table 2 provides a summary of these
results
Table 3 State Respondentsrsquo Experiences Address ETP Issues (N=24)
Issues With Great or Some
Success With Great or Some
Difficulty Does Not Apply Getting new providers onto the ETP list
21 states (88)
1 state (4)
2 states (8)
Getting degree‐bearing institutions onto the ETP list
19 states (79)
3 states (13)
2 states (8)
Getting unqualified providers off the ETP list
12 states (50)
5 states (21)
7 states (29)
Lack of providers on the ETP list that offer training in high‐demand high‐wage occupations
11 states (46)
6 states (25)
7 states (29)
Lack of qualified providers 11 states (46)
3 states (13)
10 states (42)
Lack of quality data on provider performance
5 states (21)
16 states (67)
3 states (13)
Lack of customer use of ETP list 15 states (63)
1 state (4)
8 states (33)
Negative feedback from providers on the burden of the application process
15 states (63)
4 states (17)
5 states (21)
Negative feedback from providers on the burden of maintaining eligibility
9 states (38)
8 states (33)
7 states (29)
Source 2010 Survey of State Eligible Training Provider Policies Note Percentages across cell rows may not total 100 percent due to rounding
7 GAO (2005) developed a survey of local workforce investment areas that included questions on their experiences implementing ITA and ETP policies Several of the survey questions for this study were adapted from the GAO survey
22
The first five issues on which states provided their perceptions of the experiences dealt
with various aspects of the viability of the provider market for their state over the past five
program years Of the 24 state respondents most either had success in addressing provider
market issues or the issues did not apply to their state These responses may indicate that the
ETP policies and systems have been in place long enough to have achieved a steady operating
state and that most of the issues were addressed earlier in WIA implementation However
several states especially in getting unqualified providers off the list (5 states) and getting
providers that offer training in high-demand high-wage occupations (6 states) have experienced
some difficulty in addressing provider market issues
As mentioned an issue that was at the forefront of Federal-State discussions on ETP
policy implementation in 2001mdasha lack of quality data on provider performancemdashremained an
issue through the past five program years Two-thirds of the state respondents (16) indicate that
they have had some or great difficulty addressing the issue of quality data on provider
performance over the past five program years The current requirements under WIA for
performance data on training providers (and their programs) are still a considerable challenge for
the states that responded to the survey However customer use of the list has not been a
perceived challenge for state respondents Only 1 state reports that it has been a problem over
the past five program years
The final two issues address the experience of states with negative feedback on the
burden of the application and subsequent eligibility processes As mentioned early studies on
ETP policies indicated that training providers were concerned about the burden of becoming and
remaining an eligible training provider for ITA participants Some state respondents report that
they have experienced difficulties addressing this issue over the past five program years
particularly for the burden of the subsequent eligibility process A third of state respondents (8)
indicates that they have had some or great difficulty addressing the negative feedback from
providers on the subsequent eligibility process Only 17 percent of respondents (4) report having
difficulty addressing negative provider feedback on the application process
The survey also asks states about its ITA policies on capping the ITA amount and
limiting the duration of training at the state level Half of the state respondents report capping
the amount of ITAs at the state level Of those states that cap the amount 5 states set the cap at
less than $3000 4 states between $3000-$4999 and 3 states between $5000-$7499 Of the 7
23
states that limit the duration of ITA training 5 states limit the duration to less than 12 months
and 2 states limit the duration to 12-23 months While not the focus of this study these
responses are used to understand one of the potential moderating factors that are associated with
ITA participant outcomes and are included in the multivariate analysis
Survey respondents were offered the opportunity to further explain their statersquos ETP
policies and to comment on what they would change about the ETP framework under WIA
Several of the comments addressed the issue of performance data required by providers Some
states have centralized and automated the ETP list which has streamlined the data collection
process for eligibility and reporting purposes Other state respondents indicate that the challenge
still exists to collecting performance data consistently especially data on all individuals in a
training program One state respondent reported that two large universities have pulled out of
the ETP list because the requirement that they track the performance of all students was too
onerous Another respondent recommended that the requirement that performance data on all
individuals be eliminated and only data on WIA participants be captured
Other comments addressed issues regarding the types or training providers and their
programs One respondent noted that not all post-secondary institutions automatically placed on
the ETP list offer training in high-demand high-wage occupations and would want to have
greater discretion to remove those programs that do not offer such training Another respondent
thought that the emphasis for WIA-funded training should be on developing work-based learning
models such as on-the-job training apprenticeship and customized training rather than only
traditional classroom training A third respondent said that determining the quality of training
providers is becoming more difficult as for-profit providers aggressively pursue enrollment but
may not deliver a job after training
Finally several state respondents indicate that they would recommend eliminating the
ETP component of WIA altogether One respondent thought that the ETP has not achieved its
intended purpose Another respondent indicated that it is the counselors in One-Stop Career
Centers that do the work to ensure the quality of the training provided not the ETP processes
that have been established
Overall these comments highlight some of the issues that some states have experienced
in implementing ETP provisions and some point out several challenges in determining the
quality of a provider in order to allow ITA participants to make informed training choices
24
Multivariate Analysis of State ETP Policies The analysis presented in this section builds on the descriptive data on state ETP policies
and experiences discussed above The conceptual framework provides an understanding of how
various state ETP policies influence the quality of training providers used by ITA recipients in
order to improve their employment and training outcomes The models discussed in the
methodology section run each outcome variable of interest against the key variables of interest
and control variables separately for adults and dislocated workers
One challenge to the analysis that bears addressing upfront is the problem of
multicollinearity which occurs when variables are highly correlated with each other among the
key ETP policy variables This caused large standard errors which lead to imprecision in the
model estimates (ie wide confidence intervals) To address the issue some survey questions
were collapsed into dichotomous variables to capture overall state ETP policy in a particular
topic area For example one variable created captures whether states used minimum
performance criteria for eligibility determinations In addition a single variable was created to
capture whether the state experienced any difficulty addressing provider market issues In
addition the information provided variable on the burden of training providers in the ETP
application and subsequent eligibility process was captured in the variable on the difficulty of
obtaining quality performance data so the burden variable was omitted A simple correlation
table and principal component analysis of the state ETP policy and moderating variables were
used to test for multicollinearity All models were then tested using variance inflation factors to
understand where continued issues may be present8 The results of the analysis show that while
multicollinearity exists between the key variables of interest particularly between ETP waiver
and having no minimum criteria between ETP waiver and state ITA policy and between having
no minimum criteria and state ITA policy9 With the existence of multicollinearity in the model
and other limitations it is again important to note that interpretations are limited to associations
rather than causal inferences
8 See Berenson ML DM Levine and M Goldstein (1983) Intermediate Methods and Applications A Computer Package Approach and Neter J MH Kutner and CJ Nachtsheim (2003) Applied Linear Regression Models (4th
Edition) for more information on multicollinearity tests 9 The results of the correlation table are provided in Tables B11 in the Appendix
25
Addressing the issue of multicollinearity yet adhering to the conceptual framework
designed for this study has focused the analysis on five key predictor variables of interest They
are
1 Use of a Federal ETP waiver
2 Local ETP flexibility
3 Use of any minimum performance criteria for subsequent eligibility determinations
4 Use of a reciprocal agreement with another state to allow use of ITAs with the other
statersquos eligible training providers and
5 Inclusion of training providers on the ETP list that have not been approved
The random effects models were run separately for adults and dislocated workers Included in
the models are three moderating variables that capture the state ETP experiences less than 50
percent two- and four-year colleges and universities on the ETP list some or a great degree of
difficulty experienced with the provider market and some or a great degree of difficulty
experienced in obtaining quality data on provider performance A moderating variable that
captures state ITA policy was also included in the model Demographics program participation
WIA services preprogram wages and state economic conditions were used as control variables
Table B1 in the Appendix presents the results of the first set of results for understanding
the effect of ETP state policies on the wages of adults and dislocated workers in the quarter after
exit For dislocated workers being in a state with a Federal ETP waiver raises the earnings in
the first quarter after exit by $297 However being in a state with no minimum criteria for
subsequent eligibility decreases these first quarter earnings for dislocated workers by $506 For
these two policies the findings are similar for adult workersrsquo first quarter earnings but are of a
greater magnitude These findings indicate that having a Federal waiver is associated with
higher first-quarter earnings but having no standards by which to measure the quality of training
providers could be detrimental to earnings in the first quarter It also appears that adults may see
negative earnings from two state ETP policiesmdashlocal ETP flexibility and allowing non-approved
providers on the ETP listmdashwhich do not influence the post-program earnings of dislocated
workers Adults see a $623 decrease in first quarter earnings in states that permitted local ETP
flexibility and see a $93 decrease in states which allowed non-approved providers on the ETP
list These findings contradict of the hypothesis that local flexibility in using higher minimum
performance levels improves ITA participant outcomes In addition the inclusion of non-
26
approved providers on the list was hypothesized to strengthen the provider market but it is
possible that lower-quality providers are being selected by ITA participants from the ETP list
The moderating variables of interest also show statistically significant results for first
quarter earnings For both adults and dislocated workers being in a state in which less than half
of its ETPs are two- or four-year colleges or universities is associated with a $526 decrease in
first quarter earnings for dislocated workers and a $294 decrease for adult workers This finding
is expected as having fewer colleges available to ITA participants may lead to the selection of
lower-quality providers Being in a state that has a cap on its ITA amount or limited ITA
duration decreases the first quarter earnings of dislocated workers by $812 and by $324 for
adults As hypothesized caps on ITAs and limits to training duration may deter ITA recipients
from completing their training program because of the cost or length of the program Some
differences in the effects of the moderating variables for adults and dislocated workers exist
Being in a state with performance data difficulties shows a $156 decrease in first quarter
earnings for adults Challenges with data quality may lead to a lack of information for ITA
participants on the providers they are selecting The analysis also indicates that being in a state
with provider difficulties is associated with a $251 increase in first quarter earnings for
dislocated workers This result is surprising as it is an indicator of challenges to the provider
market
The effects of state ETP policies on average post-program wages are presented for the
second and third quarters after exit for adults and dislocated workers As shown in Table B2 in
the Appendix the positive association with being in a state with a waiver for adults ($2472) and
dislocated workers ($834) and the negative association with being in a state with no minimum
eligibility criteria for adults ($895) and dislocated workers ($635) are consistent with the
findings for first quarter earnings Adults in states with local ETP flexibility see a $1357
decrease in earnings and being in a state with non-approved ETP see a $694 decrease in average
quarterly post-program earnings
The moderating variables show a somewhat similar pattern of the effects on second and
third quarter earnings to the effects on first quarter earnings Being in a state with less than half
of its ETPs as two- and four-year colleges and universities indicates a decrease in second and
third quarter earnings for both adults ($186) and dislocated workers ($706) but the magnitude of
the association for adults is not as strong as it is for adult first quarter earnings Dislocated
27
worker ITA participants in states that experience provider difficulties see a $423 increase in
second and third quarter earnings The estimates for performance data difficulties show some
instability across earnings time periods as the second and third quarter earnings estimate
becomes positive and significant for dislocated workers and nonsignificant for adults compared
to the results for first quarter earnings This may indicate that this variable is a poor influential
factor in the conceptual model or that the limitations of the analysis may be causing instability in
the estimates The estimate of second and third quarter earnings for adult exiters who are in a
state with a cap or limited duration on ITAs also changes to nonsignificant from the first quarter
earnings estimates
The third outcome variable of interest is entered employment (or employed in the first
quarter after exiting WIA) and the results of the analysis are provided in Table B3 in the
Appendix For adults and dislocated workers there is no statistically significant change in
employment associated with being in a state with a waiver local ETP flexibility no minimum
eligibility criteria and reciprocal agreement However both adults and dislocated workers see
an increase in the odds of being employment (41 percent and 32 percent respectively) if they are
in a state where non-approved providers are allowed on the ETP list
The estimates of the moderating variables on employment in the first quarter after exit are
different for adults and dislocated workers As with wages in the first quarter after exit there is a
negative association for dislocated workers (28 percent) with being in a state with less than 50
percent of its ETPs as colleges on employment in the first quarter after exit Dislocated workers
also see the odds of employment increase by 39 percent when the state where they received WIA
services has experienced any difficulties with its provider market This is consistent with the
findings for wage at placement but is contradictory to the original hypothesis Being in a state
with performance data difficulties decreases the odds of employment for adults by 29 percent an
expected and consistent finding There were no statistically significant changes in employment
in the first quarter after exit for adults and dislocated workers associated with the state having an
ITA cap on duration limit
The magnitude of the association with state ETP policies on employment becomes
slightly stronger for employment in the second and third quarters after exit for both adults and
dislocated workers As shown in Table B4 in the Appendix being in a state with non-approved
training providers on the ETP list increases the odds of retaining employment by 83 percent for
28
dislocated workers and 22 percent for adults A state with local ETP flexibility also increases the
odds of retaining employment for dislocated workers by 84 percent Finally the odds of being
employed in these two quarters increases for adults by 30 percent when being served in a state
with an ETP waiver Neither adults nor dislocated workers see any change in the odds of
employment retention when in a state with a reciprocal agreement or with no minimum criteria
for subsequent eligibility
The estimates of the moderating variables change for the second and third quarter of
employment from the first quarter The only moderating factor showing some association with
increased employment retention is having an ITA cap or duration limit The odds of retaining
employment into the second and third quarters increase by 49 percent for dislocated workers and
by 31 percent for adults
Credential attainment is the final outcome of interest for this analysis and the results are
presented in Table B5 in the Appendix Consistent with the positive findings for earnings the
analysis shows that being in a state with a waiver increases the odds of earning a credential by 87
percent for adults but shows no change in odds for dislocated workers Adults in a state with a
reciprocal agreement see their odds of attaining a credential decrease by 30 percent No state
ETP policies show any change in the likelihood of credential attainment for dislocated workers
As is consistent with the direction of the findings for other earnings variables being in a
state that has less than half of its ETPs as colleges decreases the odds of credential attainment for
adults (62 percent) and dislocated workers (41 percent) In addition having a state ITA cap or
duration limitation increases the odds of credential attainment increases the odds for adults by 54
percent As discussed this may be because training participants may choose shorter-term training
because resources and time for ITA-funded training may not be sufficient for longer-term
training such as a community college or apprenticeship program
Overall the findings from the multivariate analyses provide mixed and limited evidence
of how state ETP policies may be associated with ITA participant outcomes as explained in the
conceptual framework The analysis shows a positive association of being in a state with a
Federal waiver with the earnings and credential variables having this waiver may allow states to
have more providers on the ETP list and do so in a way that they use they own screening criteria
to ensure the quality of training providers for ITA participants The influence of no minimum
criteria on employment and training outcomes is inconsistent but is negative as hypothesized
29
for earnings The two variables identifying state efforts to expand the provider market ndash the
reciprocal agreements and policy to allow non-approved providers on the state ETP list ndash also
show mixed findings for employment and training outcomes This could be because it is not
possible to account for the quality and use of providers across state borders and non-approved
providers
The moderating factors of interests also had mixed results For the most part being in a
state that has less than half of its ETPs as two- and four-year colleges and universities indicates
negative employment and training outcomes of ITA participants In addition having a cap on
the ITA amount or a limit on the duration of training has inconsistent findings ndash negative for
earnings outcomes and positive for employment and credential outcomes However the
evidence was more mixed or nonsignificant on the difficulties states experienced in dealing with
issues of providers It could be that states while they experienced difficulty in these areas were
able to overcome these challenges successfully and thus did not affect ITA participantsrsquo
outcomes
It is possible that the inconsistencies in the findings are due to the limitations presented
earlier The state ETP policy variables may too diffuse in their construction (because of
temporal issues and collapsing of similar variables) to capture the effects of the policies on ITA
participant outcomes The multicollinearity and omitted variable bias are major challenges to the
analysis Finally the attempt to capture some of the state-level variance in the models may not
have been sufficient
While this first attempt at analyzing the association of state ETP policies with ITA
participant outcomes is limited it provides a basis for future research to examine what state
policies and factors may affect the quality of eligible training providers and their relevancy to
ITA participantsrsquo outcomes A more qualitative examination of how states design and
implement their ETP systems under WIA and how training providers and ITA participants
respond to these systems would help refine the conceptual framework and provide a better
understanding of state ETP policies and promising practices Case studies of the different
approaches states use to implement their ETP systems may shed light on what standards states
are using to determine the quality of training providers for their ETP lists This research could
then inform the development of better possibly annually collected measures of the state ETP
policies (and potentially all state WIA policies) to conduct more rigorous analyses that provides
30
stronger evidence of the effects of these policies on ITA participantsrsquo outcomes A database of
state Temporary Assistance for Needy Families policies called the Welfare Rules Database has
been operated since 1996 and a similar database could be constructed for WIA
The importance of the local WIBs and One-Stop Career Centers should also be examined
in more depth While several studies have studied how states and local WIBs have implemented
ITAs and the ETP system that supports customer choice it is unclear the relationship between
the state and local WIBs in designing this system and how much local flexibility is permitted In
addition better understanding of how ITA participants are using the ETP list and performance
data may help states and local WIBs improve how One-Stop staff work with ITA participants to
use the ETP list and performance data and potentially offer supplemental information on
training programs such as reviews by WIA completers and informational interviews with
graduates who are working in the field to help them make training decisions
Policy Implications The research on state ETP policies conducted for this study contributes new information
for policymakers to better understand the role of training provider quality in publicly-funded job
training efforts The conceptual framework shows how statesrsquo efforts to design a training system
that incorporates customer choice but must ensure that participants find and keep employment
have to consider the quality of the providers in the system Under WIA the quality of the
training providers is measured by aggregate participant outcomes for employment credential
attainment and earnings The conceptual framework shows that the inputs of training such as
evidence-based instructional models highly qualified instructors and supportive services can
also matter in looking at the quality of training providers While the notion of evaluating
program inputs is counter to the results-oriented management movement in government overall
program performance should consider evaluating both inputs and outcomes to support the
management of successful program Having this level and type of performance data would help
the Department of Labor identify and provide promising practices for states to test and replicate
Greater knowledge of the statesrsquo ETP policies has also been gained through this research
Of the 24 states that responded to the survey many do not use the minimum criteria for
subsequent eligibility as provided in WIA Many states also have pursued a Federal waiver to
extend the initial eligibility period of ETPs In addition states have shared anecdotes of the
challenges for providers and states to collect performance data needed to maintain eligibility on
31
the list As this research shows that the collection and use of ETP performance criteria and data
may not be fully implemented as intended in the WIA legislation future research could establish
how states have designed their ETP systems and interacted with local WIBs in establishing sub-
state ETP systems to approved and maintain providers on the ETP list They may be able to
offer lessons for WIA reauthorization in how to amend the current regulations to better develop
less burdensome state ETP systems but maintain a focus on ensuring the quality of the training
providers
This research also sought to provide insights into which ETP policies states have
developed may have an effect on ITA participantsrsquo outcomes than states that do not Because of
the limitations of the study answering this question was challenging However there are some
indications of promising state ETP policies and efforts that should be explored The importance
of having higher education represented on the ETP lists is supported by the analyses conducted
The findings show that states that have a significant presence of two- and four-year colleges and
universities on their ETP lists is often associated with improvements the employment and
training outcomes of their ITA participants With the current policy discussion about the use of
community colleges as a major training provider it is important to consider how higher
education can connect to the workforce investment system and respond to its participantsrsquo needs
These needs may include student retention incentives and supportive services such as child care
and transportation to assist ITA participants succeed in their pursuit of better skills and
education The promising findings from MDRCrsquos Opening Doors study which tested retention
incentives and services (Scrivener and Weiss 2009) and the ongoing evaluation of the
Community-Based Job Training Grants a Department of Labor demonstration program could
provide some ideas to incorporate into future community college-workforce investment system
initiatives
Any efforts to improve the statesrsquo ETP systems and test new approaches would take
considerable federal government resources to implement It would also be challenging for
overburdened state and local staff especially as they respond to the economic crisis to focus on
such activities However with more WIA participants being placed into training more than ever
and the potential reauthorization of WIA in the near future the time may be ripe to examine
statesrsquo ETP systems and how states are ensuring the quality of the training providers within these
systems
32
References
Barnow Burt S 2000 ldquoVouchers for Federal Targeted Training Programsrdquo Edited by C Eugene Steuerle Van D Ooms and George Peterson in Vouchers and the Provision of Public Services Washington DC Brookings Institution Press 224-250
Barnow Burt S and Christopher T King 2005 The Workforce Investment Act in Eight States Prepared for the US Department of Labor Employment and Training Administration Albany NY The Rockefeller Institute of Government February
DrsquoAmico Ron and Jeffrey Salzman 2004 An Evaluation of the Individual Training AccountEligible Training Provider Demonstration Prepared for the US Department of Labor Employment and Training Administration Oakland CA Social Policy Research Associates December
Decker Paul and Irma Perez-Johnson 2004 ldquoITAs ETP Lists and Consumer Report Systemsrdquo Edited by Christopher OrsquoLeary Robert A Straits and Stephen A Wandner in Job Training Policy in the United States Kalamazoo MI WE Upjohn Institute of Employment Research
Dickenson Katherine and Richard W West 1983 ldquoImpacts of Counseling and Education Subsidy Programsrdquo Final Report of the Seattle-Denver Income Maintenance Experiment Vol 1 Menlo Park CA SRI International
Gore Al 1995 Common Sense Government Works Better and Costs Less Third Report of the National Performance Review Washington DC US Government Printing Office September 7
Hipp Lena and Mildred E Warner 2008 ldquoMarket Forces for the Unemployed Training Vouchers in Germany and the USArdquo Social Policy amp Administration 421 77-101
King Christopher T 1999 ldquoFederalism and Workforce Policy Reformrdquo Publius 292 53-71
Nightingale Demetra S Lauren Eyster John Trutko Carolyn OrsquoBrien and Kate Chambers 2008 Implementation Analysis of the High Growth Job Training Initiative Programs Washington DC The Urban Institute June
Osborne David and Ted Gaebler 1992 Reinventing Government How the Entrepreneurial Spirit Is Transforming the Public Sector Reading MA Addison-Wesley
Public Policy Associates 1998 Career Management Account Project Evaluation Final Report Lansing MI December
Resnik Judith 1982 ldquoManagerial Judgingrdquo Harvard Law Review 96 374
33
Salamon Lester 2002 Tools for Government Action New York Oxford University Press
Scrivener Susan and Michael J Weiss with Jedediah J Teres 2009 More Guidance Better Results Three-Year Effects of an Enhanced Student Services Program at Two Community Colleges New York MDRC August httpwwwmdrcorgpublications524overviewhtml
Social Policy Research Associates 2004 The Workforce Investment Act after Five Years Results from the National Evaluation of the Implementation of WIA Prepared for the US Department of Labor Employment and Training Administration Oakland CA June
_____ 2006 ldquoWorkforce Investment Act Standardized Records Database Program Year 2005rdquo Prepared for the US Department of Labor Employment and Training Administration Oakland CA
_____ 2007 ldquoWorkforce Investment Act Standardized Records Database Program Year 2006rdquo Prepared for the US Department of Labor Employment and Training Administration Oakland CA
_____ 2008 ldquoWorkforce Investment Act Standardized Records Database Program Year 2007rdquo Prepared for the US Department of Labor Employment and Training Administration Oakland CA
Steuerle C Eugene and Eric C Twombly 2002 ldquoVouchersrdquo Edited by Lester Salamon in Tools for Government Action New York Oxford University Press 445-465
US Department of the Commerce US Census Bureau 2010 Current Population Survey Primary Families by Poverty Status by State 2005-2008 Washington DC httpwwwcensusgovhheswwwcpstccps_table_creatorhtml
US Department of Commerce Bureau of Economic Analysis 2009 News Release GDP by State Table 1 Real GDP by State 2004-2008 Washington DC June 2
US Department of Health and Human Services Assistant Secretary of Planning and Evaluation 2010 ldquoThe 2009 HHS Poverty Guidelinesrdquo Washington DC httpaspehhsgovpoverty09povertyshtml
US Department of Labor Bureau of Labor Statistics 2010 Local Area Unemployment Statistics Annual Unemployment Rates by State Washington DC httpblsgovlau
US Department of Labor Employment and Training Administration 1998 Workforce Investment Act of 1998 Washington DC September
_____ ldquoWorkforce Investment Act Final Rulerdquo Federal Register 65156 (11 August 2000)
34
_____ 2006 ldquoCommon Measures Policy for the Employment and Training Administrationrsquos (ETA) Performance Accountability System and Related Performance Issuesrdquo Training and Employment Guidance Letter 17-05 Washington DC February 17 httpwdrdoletagovdirectivescorr_doccfmDOCN=2195
_____ 2010 Workforce Investment Act (WIA) Waiver Summary Report Program Year 2009 (July 1 2009-June 30 2010) Washington DC June 3 httpwwwdoletagovwaiverspdfWIA-summary-waiver-report-6-01-10pdf
US Department of Labor WIA Readiness Review 2002 Draft Technical Assistance Guide Addressing Subsequent Eligibility Implementation Issues Prepared by the Eligible Training Provider List Work Group Washington DC March 25
US Government Accountability Office 2005 Workforce Investment Act Substantial Funds Are Used for Training but Little Is Known Nationally about Training Outcomes Report to Congressional Requesters Washington DC June
Workforce Investment Act of 1998 Public Law 105-220 US Statutes at Large 112 (1998) 936-1247
35
Appendix A ndash State Eligible Training Provider Survey
36
37
38
39
40
41
42
43
44
45
46
Appendix B ndash Tables on Multivariate Results
Table B1 Dependent Variable Is Wage at Placement (Random Effects)
Wages in 1st Quarter after Exit Dislocated Workers Adults
Coefficient (Std Er) Coefficient (Std Er)
State ETP Policies
ETP Waiver 2965184
(932657) 9618756
(699830)
Local ETP Flexibility 1532332 (777260)
‐6233708 (625893)
No Minimum Criteria ‐5062482
(833760) ‐6299391
(670033)
Reciprocal Agreement ‐375340 (612808)
7092884 (4425134)
Non‐Approved Providers on ETP List 9106931 (625639)
‐9348729 (455373)
Moderating Factors
Less than 50 Colleges ‐5258137
(589208) ‐2941053
(447627)
Provider Difficulties 2507538
(744034) 7108679 (553828)
Performance Data Difficulties 393094
(670033) ‐1563243
(482135)
State ITA Cap or Duration Limit ‐8124335
(962491) ‐3239131
(743258)
Participant Demographics Program Participation WIA Services and State Economic Conditions
Male 1227886 (3501888)
4191516 (322434)
Hispanic ‐325968
(578690) ‐2853029
(453916)
Black ‐7276263
(420410) ‐9656244
(322692)
Age 45 and Older ‐4604658
(351199) ‐4542002
(400297)
Disabled ‐5756758
(960549) ‐8142557
(695075)
Limited English Speaker ‐6078044
(783176) ‐2728541
(784771)
Single Parent ‐603922 (463104)
‐118377 (326958)
Less than High School ‐2765303
(728470) ‐2590482
(676988)
High SchoolGED ‐2280776
(550550) ‐206717
(566032)
Some CollegeNo Degree ‐1460937
(601817) ‐8550988
(607986)
Veteran 102492
(609838) 1756869
(605430)
Displaced Homemaker ‐5256269
(1268887) na
Public Assistance Recipient ‐5103727 (2072375)
‐6764217 (368733)
UI Claimant 3874343
(422135) 2523147
(402462)
47
UI Exhaustee 1999681
(712133) 2615851
(699007)
Rapid Response 2242406
(760052) na
Trade Adjustment Assistance ‐6268225
(482242) na
Supportive Services ‐157247
(381581) 695116 (699007)
Needs Related Payments ‐1452554 (1147422)
1104907 (800742)
Pell Grant 1027376 (584758)
41632 (389580)
Employed in Quarter Prior to Entry 8544655 (3830149)
1074606 (281801)
State Unemployment Rate ‐2202359
(266321) ‐139845
(172806)
Constant 8402926 (2290521)
682297 (1752454)
N = 76769 groups=20 N = 87038 groups=21
Wald chi2 = 653829 Wald Chi2 = 745810
Prob gt chi2 = 00000 Prob gt chi2 = 00000
R‐squared = 00785 R‐squared = 00789
statistically significant at the 01 level Within state variance = 00678
Within state variance = 00718
statistically significant at the 05 level statistically significant at the 10 level
Between state variance = 07198
Between state variance = 05001
48
Table B2 Dependent Variable Is Average Wages (Random Effects)
Average Wages at 2nd and 3rd Quarters after Exit Dislocated Workers Adults
Coefficient (Std Er) Coefficient (Std Er)
State ETP Policies
ETP Waiver 8341603 (1951461)
2472078 (1652124)
Local ETP Flexibility 3283617
(1637634) ‐1356786
(1470612)
No Minimum Criteria ‐6349872
(1744487) ‐8954289
(1575376)
Reciprocal Agreement 119598
(1293904) 1242513
(1035055)
Non‐Approved Providers on ETP List ‐668821
(1342795) ‐6940967
(1098091)
Moderating Factors
Less than 50 Colleges ‐7056964
(1267546) ‐1861961 (1073687)
Provider Difficulties 4234538 (1578244)
‐38601 (1326738)
Performance Data Difficulties 3185417 (1413519)
‐1551761 (1139033)
State ITA Cap or Duration Limit ‐9883405
(2036050) 6340015
(1763354)
Participant Demographics Program Participation WIA Services and State Economic Conditions
Male 2595662
(740409) 8320147
(757095)
Hispanic ‐6073506
(1235732) ‐6817535
(1066948)
Black ‐1445316
(889030) ‐1921733
(756244)
Age 45 and Older ‐1144567
(740903) ‐1072619
(941694)
Disabled ‐1251139
(2019849) ‐1610379
(1627435)
Limited English Speaker ‐1366966
(1669149) ‐5972806
(1817183)
Single Parent ‐3500702 (981519)
‐2280564 (765432)
Less than High School ‐5894185
(1551219) ‐5520787
(1600845)
High SchoolGED ‐4656926
(1166158) ‐4364031
(1339699)
Some CollegeNo Degree ‐3013139
(1276603) ‐184207 (1441763)
Veteran 683890
(1280103) 5035552 (1412892)
Displaced Homemaker ‐1093566
(2698455) na
Public Assistance Recipient ‐1039214 (4515161)
‐1455665 (860368)
UI Claimant 7158291
(899724) 6287289
(93218)
UI Exhaustee 2328817
(1517431) 6826655 (1648945)
Rapid Response 6347572 (1612314)
na
49
Trade Adjustment Assistance ‐9666388
(1010130) na
Supportive Services ‐3405629
(806350) 1565555 (714604)
Needs Related Payments ‐4026591 (2395110)
3525914 (1833252)
Pell Grant 997124
(1248827) 1017728
(915865)
Employed in Quarter Prior to Entry 1666538
(809645) 2125872
(659615)
State Unemployment Rate ‐3635331
(577559) ‐1179064
(410121)
Constant 1578683 (4896641)
1188090 (411299)
N = 65763 groups=20 N = 72767 groups=21
Wald chi2 = 603762 Wald chi2 = 579946
Prob gt chi2 = 00000 Prob gt chi2 = 00000
R‐squared = 00841 R‐squared = 00738
statistically significant at the 01 level Within state variance = 00748
Within state variance = 00674
statistically significant at the 05 level statistically significant at the 10 level
Between state variance = 06941
Between state variance = 05041
50
Table B3 Dependent Variable Is Entered Employment (Random Effects)
Employed in 1st Quarter after Exit Dislocated Workers Adults
Odds Ratio (Std Er) Odds Ratio (Std Er)
State ETP Policies
ETP Waiver 11127
(02028) 12711
(01896)
Local ETP Flexibility 10178
(00198) 06887
(01896)
No Minimum Criteria 11422
(01833) 13317
(03005)
Reciprocal Agreement 08832
(01134) 07644
(01331)
Non‐Approved Providers on ETP List 13245 (01830)
14072 (02643)
Moderating Factors
Less than 50 Colleges 07200 (01020)
11011 (02188)
Provider Difficulties 13873 (02166)
13260 (02914)
Performance Data Difficulties 08426
(01117) 07134 (01330)
State ITA Cap andor Duration Limit 11909
(02075) 13302
(03243)
Participant Demographics Program Participation WIA Services and State Economic Conditions
Male 10668 (00248)
09116 (00209)
Hispanic 11895 (00469)
10348 (00339)
Black 09520 (00259)
07975 (00183)
Age 45 and Older 07037 (00159)
07627 (00208)
Disabled 07039 (00454)
06250 (00272)
Limited English Speaker 09309
(00463) 09891
(00540)
Single Parent 10540 (00324)
10709 (00255)
Less than High School 07580 (00361)
06261 (00311)
High SchoolGED 08993 (00341)
07437 (00325)
Some CollegeNo Degree 09600
(00394) 09243 (00433)
Veteran 09295 (00363)
1005 (00423)
Displaced Homemaker 07796 (00587)
na
Public Assistance Recipient 08961
(01132) 07855 (00199)
UI Claimant 12644 (00347)
11620 (00356)
UI Exhaustee 12127 (00535)
13140 (00660)
51
Rapid Response 10853
(00571) na
Trade Adjustment Assistance 06997 (00211)
na
Supportive Services 11410 (00302)
10912 (00248)
Needs Related Payments 08404 (00618)
1015 (00589)
Pell Grant 09681
(00361) 10602 (00309)
Employed in Quarter Prior to Entry 18245 (00430)
24205 (00478)
State Unemployment Rate 10759 (00280)
14180 (00242)
N = 76769 groups=20 N = 87038 groups=21
Wald chi2 = 140883 Wald Chi2 = 326866
Prob gt chi2 = 00000 Prob gt chi2 = 00000
statistically significant at the 01 level Within state variance = 00621
Within state variance = 00913
statistically significant at the 05 level statistically significant at the 10 level
Between state variance = 09379
Between state variance = 09087
52
Table B4 Dependent Variable Is Employment Retention (Random Effects) Employed in Both 2nd and 3rd Quarters after Exit
Dislocated Workers Adults Odds Ratio (Std Er) Odds Ratio (Std Er)
State ETP Policies
ETP Waiver 11466
(02836) 13023 (02089)
Local ETP Flexibility 18426 (04907)
011619 (01953)
No Minimum Criteria 09423
(02048) 10383
(01473)
Reciprocal Agreement 09021
(01585) 10767
(01142)
Non‐Approved Providers on ETP List 18307 (03522)
12212 (01430)
Moderating Factors
Less than 50 Colleges 08243
(01965) 11130
(01352)
Provider Difficulties 09190
(02186) 09996
(01352)
Performance Data Difficulties 12163
(02186) 10231
(01159)
State ITA Cap andor Duration Limit 14938 (03543)
13094 (02073)
Participant Demographics Program Participation WIA Services and State Economic Conditions
Male 08508 (00246)
07138 (00187)
Hispanic 10390
(00471) 10134
(00381)
Black 08483 (00291)
07937 (00212)
Age 45 and Older 08484 (00245)
08842 (00286)
Disabled 08172 (00594)
08089 (00449)
Limited English Speaker 08654 (00504)
09393 (00554)
Single Parent 10068
(00389) 10029
(00279)
Less than High School 07561 (00426)
05651 (00322)
High SchoolGED 10281
(00457) 07361 (00368)
Some CollegeNo Degree 10967 (00538)
09466 (00514)
Veteran 09132 (00440)
09468 (00448)
Displaced Homemaker 08501
(00847) na
Public Assistance Recipient 08093
(01334) 07987 (00245)
UI Claimant 11624 (004005)
12196 (00414)
UI Exhaustee 10866
(00596) 12052 (00692)
Rapid Response 13200 (00915)
na
53
Trade Adjustment Assistance 13065 (00603)
na
Supportive Services 09802
(00303) 10569 (00270)
Needs Related Payments 10046
(00984) 11404
(00474466)
Pell Grant 11470 (00596)
12456 (00449)
Employed in Quarter Prior to Entry 14809 (00441)
15885 (00365)
State Unemployment Rate 11385 (00378)
11135 (00307)
N = 56914 groups=20 N = 61897 groups=21
Wald chi2 = 53556 Wald chi2 = 123699
Prob gt chi2 = 00000 Prob gt chi2 = 00000
statistically significant at the 01 level Within state variance = 00825
Within state variance = 00556
statistically significant at the 05 level statistically significant at the 10 level
Between state variance = 09175
Between state variance = 09444
54
Table B5 Dependent Variable Is Credential Attainment (Random Effects)
Credential Attainment Dislocated Workers Adults
Odds Ratio (Std Er) Odds Ratio (Std Er)
State ETP Policies
ETP Waiver 15771
(05044) 18669 (04079)
Local ETP Flexibility 13703
(04959) 08007
(01916)
No Minimum Criteria 06957
(01826) 08532
(01513)
Reciprocal Agreement 10771
(02432) 06974 (00997)
Non‐Approved Providers on ETP List 07572
(01832) 12297
(01917)
Moderating Factors
Less than 50 Colleges 03767 (00905)
05876 (00912)
Provider Difficulties 09250
(02394) 12009
(02059)
Performance Data Difficulties 13918
(03327) 09814
(01548)
State ITA Cap andor Duration Limit 11347
(03232) 15386 (02963)
Participant Demographics Program Participation WIA Services and State Economic Conditions
Male 10096
(00214) 10724 (00245)
Hispanic 11215 (00538)
08646 (00363)
Black 07938 (00189)
07355 (00160)
Age 45 and Older 10025
(00215) 10831 (00315)
Disabled 07867 (00434)
08046 (00358)
Limited English Speaker 08565 (00470)
11738 (00730)
Single Parent 08952 (00248)
09181 (00209)
Less than High School 06632 (00294)
05247 (00270)
High SchoolGED 10163
(00361) 07351 (00334)
Some CollegeNo Degree 09864
(00378) 09242
(00447)
Veteran 11443 (00424)
10136 (00427)
Displaced Homemaker 11178
(00865) na
Public Assistance Recipient 1342
(03049) 08195 (00229)
UI Claimant 09476 (00265)
09348 (00281)
UI Exhaustee 09812
(00403) 09140 (00414)
Rapid Response 10775
(00601) na
55
Trade Adjustment Assistance 06848 (00200)
na
Supportive Services 14032 (00371)
11595 (00272)
Needs Related Payments 09902
(00713) 11373 (00750)
Pell Grant 07705 (00247)
08519 (00219)
Employed in Quarter Prior to Entry 11579 (00257)
10604 (00209)
State Unemployment Rate 08397 (00222)
14148 (00250)
N = 61849 groups=19 N = 66887 groups=20
Wald chi2 = 86464 Wald chi2 = 123348
Prob gt chi2 = 00000 Prob gt chi2 = 00000
statistically significant at the 01 level Within state variance = 01023
Within state variance = 00731
statistically significant at the 05 level statistically significant at the 10 level
Between state variance = 08977
Between state variance = 09269
56
Table B6 Dependent Variable Is Wage at Placement (OLS)
Wages in 1st Quarter after Exit Dislocated Workers Adults
Coefficient (Std Er) Coefficient (Std Er)
State ETP Policies
ETP Waiver 2965184
(932657) 9618756
(699830)
Local ETP Flexibility 1532332 (777260)
‐6233708 (625893)
No Minimum Criteria ‐5062482
(833760) ‐6299391
(670033)
Reciprocal Agreement ‐3753401 (612808)
709288 (442513)
Non‐Approved Providers on ETP List 9106931 (625639)
‐934873 (455373)
Moderating Factors
Less than 50 Colleges ‐5258137
(589208) ‐2941053
(447627)
Provider Difficulties 2507538
(744034) 710868
(5538275)
Performance Data Difficulties 3930938 (670033)
‐1563243 (482135)
State ITA Cap or Duration Limit ‐8124335
(962491) ‐3239131
(743258)
Participant Demographics Program Participation WIA Services and State Economic Conditions
Male 1227886
(350189) 4191516
(322434)
Hispanic ‐325968
(578690) ‐2853029
(453916)
Black ‐7276263
(420410) ‐9656244
(322692)
Age 45 and Older ‐4604658
(351199) ‐4542002
(400297)
Disabled ‐5756758
(960549) ‐8142557
(695075)
Limited English Speaker ‐6078044
(783176) ‐2728541
(784771)
Single Parent ‐603922 (463104)
‐118377 (326958)
Less than High School ‐2765303
(728467) ‐2590482
(676988)
High SchoolGED ‐2280776
(550550) ‐206717
(566032)
Some CollegeNo Degree ‐1460937
(601817) ‐8550988
(607986)
Veteran 102492
(609838) 1756869
(605430)
Displaced Homemaker ‐5256269
(1268887) na
Public Assistance Recipient ‐5103727
(2072375) ‐6764217
(368733)
UI Claimant 3874343
(422135) 2523147
(402462)
UI Exhaustee 1999681
(712133) 2615851
(699007)
Rapid Response 2242406 (7600512)
na
57
Trade Adjustment Assistance ‐6268225
(482242) na
Supportive Services ‐157247
(381581) 695116 (305937)
Needs Related Payments ‐1452554 (1147422)
1104907 (800742)
Pell Grant 1027376 (584758)
41632 (389580)
Employed in Quarter Prior to Entry 8544655
(383015) 1074606
(281801)
State Unemployment Rate ‐2202359
(266321) ‐139845
(172806)
Constant 8402926 (2290521)
682297 (1752454)
N = 76769 N = 87038
F( 31 76737) = 21091 F( 28 87009) = 26636
statistically significant at the 01 level statistically significant at the 05 level statistically significant at the 10 level
Prob gt F = 00000 Prob gt F = 00000
R‐squared = 00785 R‐squared = 00789
Adj R‐squared = 00781 Adj R‐squared = 00787
58
Table B7 Dependent Variable Is Average Wages (OLS)
Average Wages at 2nd and 3rd Quarters after Exit Dislocated Workers Adults
Coefficient (Std Er) Coefficient (Std Er)
State ETP Policies
ETP Waiver 8341603 (1951461)
2472078 (1652124)
Local ETP Flexibility 328362
(1637634) ‐1356786
(1470612)
No Minimum Criteria ‐6349872
(1744487) ‐8954289
(1575376)
Reciprocal Agreement 119598
(1293904) 1242513
(1035055)
Non‐Approved Providers on ETP List ‐668821
(1342795) ‐6940967
(1098091)
Moderating Factors
Less than 50 Colleges ‐7056964
(1267546) ‐1861961 (1073687)
Provider Difficulties 4234538 (1578244)
‐38601 (1326738)
Performance Data Difficulties 3185417 (1413519)
‐1551761 (1139033)
State ITA Cap or Duration Limit ‐9883405
(2036050) 634002
(1763354)
Participant Demographics Program Participation WIA Services and State Economic Conditions
Male 2595662
(740409) 8320147
(757095)
Hispanic ‐6073506
(1235732) ‐6817535
(1066948)
Black ‐1445316
(889030) ‐1921733
(756244)
Age 45 and Older ‐1144567
(740903) ‐1072619
(941694)
Disabled ‐1251139
(2019849) ‐1610379
(1627435)
Limited English Speaker ‐1366966
(1669149) ‐5972806
(1817183)
Single Parent ‐3500702 (981519)
‐2280564 (765432)
Less than High School ‐5894185
(1551219) ‐5520787
(1600845)
High SchoolGED ‐4656926
(1166158) ‐4364031
(1339699)
Some CollegeNo Degree ‐3013139
(1276603) ‐184207 (1441763)
Veteran 6838895
(1280103) 5035552 (1412892)
Displaced Homemaker ‐1093566
(2698455) na
Public Assistance Recipient ‐1039214 (4515161)
‐1455665 (860368)
UI Claimant 7158291
(899724) 6287289
(932180)
UI Exhaustee 2328817
(1517431) 6826655 (1648945)
Rapid Response 6347572 (1612314)
na
59
Trade Adjustment Assistance ‐9666388
(1010130) na
Supportive Services ‐3405629
(806350) 1565555 (714604)
Needs Related Payments ‐4026591 (2395110)
3525914 (1833252)
Pell Grant 9971238
(1248827) 1017728
(915865)
Employed in Quarter Prior to Entry 1666538
(809645) 2125872
(659615)
State Unemployment Rate ‐3635331
(577559) ‐1179064
(410121)
Constant 1578683 (4896641)
118809 (4112990)
N = 65763 N = 72767
F( 31 65731) = 19476 F( 28 72738) = 20712
statistically significant at the 01 level statistically significant at the 05 level statistically significant at the 10 level
Prob gt F = 00000 Prob gt F = 00000
R‐squared = 00841 R‐squared = 00738
Adj R‐squared = 00837 Adj R‐squared = 00735
60
Table B8 Dependent Variable Is Entered Employment (Logistic)
Employed in 1st Quarter after Exit Dislocated Workers Adults
Odds Ratio (Std Er) Odds Ratio (Std Er)
State ETP Policies
ETP Waiver 10659
(00681) 11598 (00579)
Local ETP Flexibility 10775
(00567) 09027 (00391)
No Minimum Criteria 09287
(00506) 09432
(00437)
Reciprocal Agreement 08050 (00326)
07647 (00231)
Non‐Approved Providers on ETP List 11882 (00487)
11750 (00366)
Moderating Factors
Less than 50 Colleges 06982 (00270)
08386 (00260)
Provider Difficulties 14354 (00726)
13226 (00503)
Performance Data Difficulties 09149 (00400)
08602 (00286)
State ITA Cap andor Duration Limit 11895 (00774)
11632 (00606)
Participant Demographics Program Participation WIA Services and State Economic Conditions
Male 10664 (00247)
09153 (00208)
Hispanic 11856 (00469)
10446 (00336)
Black 09518 (00257)
07937 (00180)
Age 45 and Older 07037 (00159)
07816 (00212)
Disabled 07847 (00456)
06401 (00273)
Limited English Speaker 09438
(00464) 10474
(00566)
Single Parent 10497
(00321) 10545 (00248)
Less than High School 07724 (00365)
06374 (00315)
High SchoolGED 08890 (00335)
07591] (00330)
Some CollegeNo Degree 09565
(00391) 09541
(00445)
Veteran 09251 (00361)
10147 (00425)
Displaced Homemaker 07445 (00553)
na
Public Assistance Recipient 08498
(01070) 07374 (00183)
UI Claimant 12660 (00343)
11763 (00357)
UI Exhaustee 12229 (00537)
13356 (00669)
61
Rapid Response 11022 (00573)
na
Trade Adjustment Assistance 06672 (00195)
na
Supportive Services 11389 (00296)
10804 (00238)
Needs Related Payments 08074 (00590)
09771 (00564)
Pell Grant 09888
(00367) 10677 (00303)
Employed in Quarter Prior to Entry 17985 (00419)
23846 (00467)
State Unemployment Rate 10938 (00197)
12479 (00145)
N = 76769 N = 87038
statistically significant at the 01 level statistically significant at the 05 level statistically significant at the 10 level
LR chi2(31) = 218776 LR chi2(28) = 392665
Prob gt chi2 = 00000 Prob gt chi2 = 00000
Pseudo R2 = 00354 Pseudo R2 = 00524
62
Table B9 Dependent Variable Is Employment Retention (Logistic) Employed in Both 2nd and 3rd Quarters after Exit
Dislocated Workers Adults Odds Ratio (Std Er) Odds Ratio (Std Er)
State ETP Policies
ETP Waiver 21579 (00958)
13613 (00465)
Local ETP Flexibility 14870 (00525)
09437 (00287)
No Minimum Criteria 15727 (00583)
22464 (00753423)
Reciprocal Agreement 09893
(00269) 12106 (00264)
Non‐Approved Providers on ETP List 16701 (00473)
11483 (00251)
Moderating Factors
Less than 50 Colleges 10469 (00270)
13723 (00294)
Provider Difficulties 07049 (00230)
08524 (00229)
Performance Data Difficulties 07500 (00220)
09469 (00221)
State ITA Cap andor Duration Limit 30973 (01392)
24617 (00907)
Participant Demographics Program Participation WIA Services and State Economic Conditions
Male 09572 (00151)
08419 (00132)
Hispanic 09395 (00241)
09523 (00210)
Black 09016 (00171)
08537 (00134)
Age 45 and Older 08104 (00128)
08394 (00162)
Disabled 09244 (00395)
09041 (00311)
Limited English Speaker 09819
(00341) 10912 (00418)
Single Parent 09787
(00204) 10811 (00174)
Less than High School 08370 (00271)
09011 (00294)
High SchoolGED 10584 (00261)
10646 (00289)
Some CollegeNo Degree 10381
(00280) 10850 (00317)
Veteran 09600
(00263) 10352
(00307)
Displaced Homemaker 09778
(00546) na
Public Assistance Recipient 08132 (00713)
07949 (00143)
UI Claimant 11084 (00207)
12103 (00242)
UI Exhaustee 10667 (00336)
11094 (00379)
Rapid Response 11110 (00380)
na
63
Trade Adjustment Assistance 09906
(00218) na
Supportive Services 10138
(00173) 11059 (00166)
Needs Related Payments 10585
(00554) 11721 (00474)
Pell Grant 09638
(00253) 11253 (00217)
Employed in Quarter Prior to Entry 13922 (00238)
14476 (00199)
State Unemployment Rate 18533 (00224)
17684 (00162)
N = 56914 N = 98947
statistically significant at the 01 level statistically significant at the 05 level statistically significant at the 10 level
LR chi2(31) = 459434 LR chi2(28) = 651586
Prob gt chi2 = 00000 Prob gt chi2 = 00000
Pseudo R2 = 00410 Pseudo R2 = 00478
64
Table B10 Dependent Variable Is Credential Attainment (Logistic)
Credential Attainment Dislocated Workers Adults
Odds Ratio (Std Er) Odds Ratio (Std Er)
State ETP Policies
ETP Waiver 1362047 (00791268)
1503802 (00738823)
Local ETP Flexibility 1192903 (00659165)
1086719 (00501626)
No Minimum Criteria 05889517 (00287845)
06303801 (00259187)
Reciprocal Agreement 08038859 (00308537)
07688012 (00231051)
Non‐Approved Providers on ETP List 0821864 (00305776)
09212954 (00285404)
Moderating Factors
Less than 50 Colleges 04160928 (00140744)
04844944 (00134903)
Provider Difficulties 1299758 (00581351)
1232921 (00414332)
Performance Data Difficulties 1266055 (00551611)
1041325 (00344193)
State ITA Cap andor Duration Limit 09075297 (00493752)
1084563 (00488886)
Participant Demographics Program Participation WIA Services and State Economic Conditions
Male 1005608
(00212931) 1085944 (00246675)
Hispanic 1093782
(00513149) 09649167
(00388968)
Black 07993544
(0018882) 07013264 (00149626)
Age 45 and Older 09955974
(00212589) 1100156 (00318527)
Disabled 07362801 (00401095)
08082321 (00354811)
Limited English Speaker 08514039 (00464474)
118101 (0072862)
Single Parent 08863159 (00245004)
0912994 (00203986)
Less than High School 06698799
(0029513) 05059487 (00258618)
High SchoolGED 1019497 (00357656)
07162731 (00323194)
Some CollegeNo Degree 09854497 (0037551)
09135837 (0043865)
Veteran 1138998 (0042114)
1013603 (00424255)
Displaced Homemaker 105
(00805919) na
Public Assistance Recipient 1383428
(03138145) 08666843 (00236469)
UI Claimant 09576332
(00261938) 09458527 (00279275)
UI Exhaustee 09994911 (004076)
09224048 (00416234)
Rapid Response 1056595
(00585217) na
65
Trade Adjustment Assistance 06781054 (00195372)
na
Supportive Services 1372909 (00356113)
1217608 (00276749)
Needs Related Payments 0995449
(0071319) 1137914 (00746525)
Pell Grant 07821315 (00249322)
08035012 (00200784)
Employed in Quarter Prior to Entry 1166207 (00257534)
1060353 (00207686)
State Unemployment Rate 09488461 (00152725)
1245677 (00135518)
N = 61849 N = 66887
statistically significant at the 01 level statistically significant at the 05 level statistically significant at the 10 level
LR chi2(31) = 526781 LR chi2(28) = 476857
Prob gt chi2 = 00000 Prob gt chi2 = 00000
Pseudo R2 = 00761 Pseudo R2 = 00649
66
Table B11 Simple Correlation Table of Key ETP Variables
ETP Waiver
Local ETP Flexibility
No Minimum Criteria
Reciprocal Agreement
Non‐Approved Providers on ETP List
Less than 50 Colleges
Provider Difficulties
Performance Data Difficulties
State ITA Cap andor Duration Limit
ETP Waiver 10000 Local ETP Flexibility
03122 10000
No Minimum Criteria
08616 01860 10000
Reciprocal Agreement
‐01913
‐00706 ‐01565 10000
Non‐Approved Providers on ETP List
02007 ‐01193 00604 ‐01565 10000
Less than 50 Colleges
‐00162
02238 ‐01560 ‐00828 05457 10000
Provider Difficulties
‐03945
03500 ‐04166 00005 ‐02594 00115 10000
Performance Data Difficulties
01471 ‐00257 01581 ‐06642 02673 02579 01571 10000
State ITA Cap andor Duration Limit
‐08093
‐01594 ‐07884 01216 ‐02303 ‐00038 05835 ‐01118 10000
67
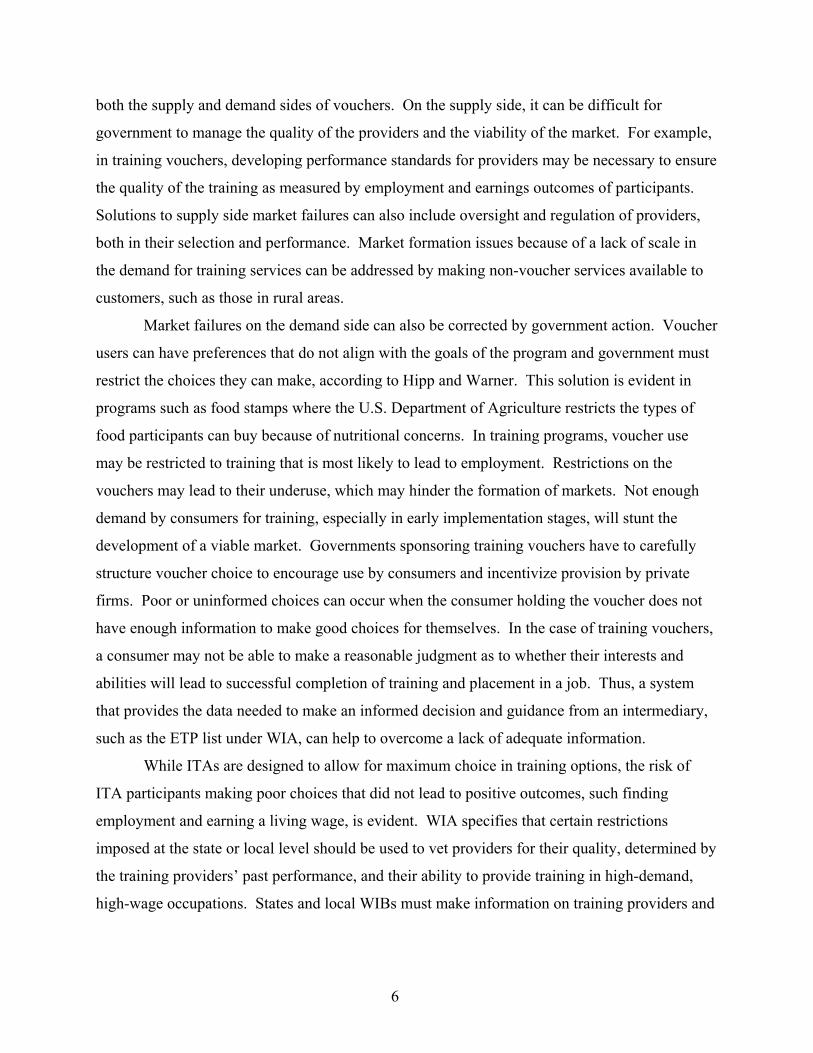
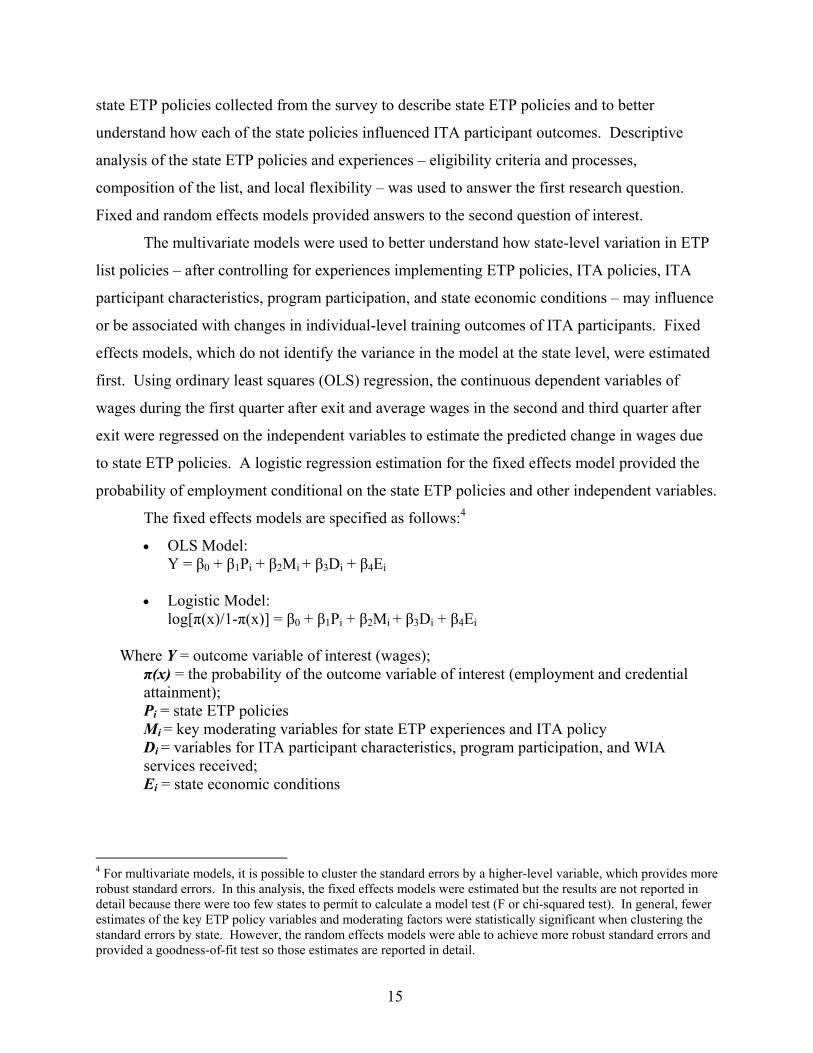
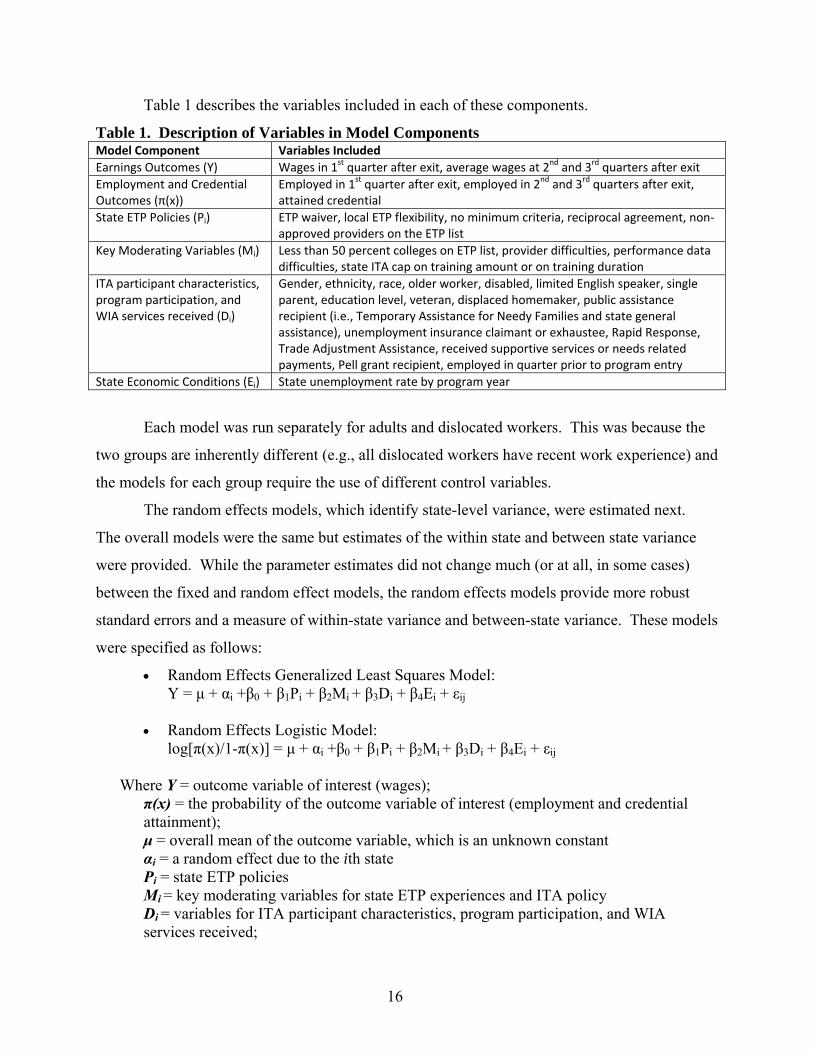
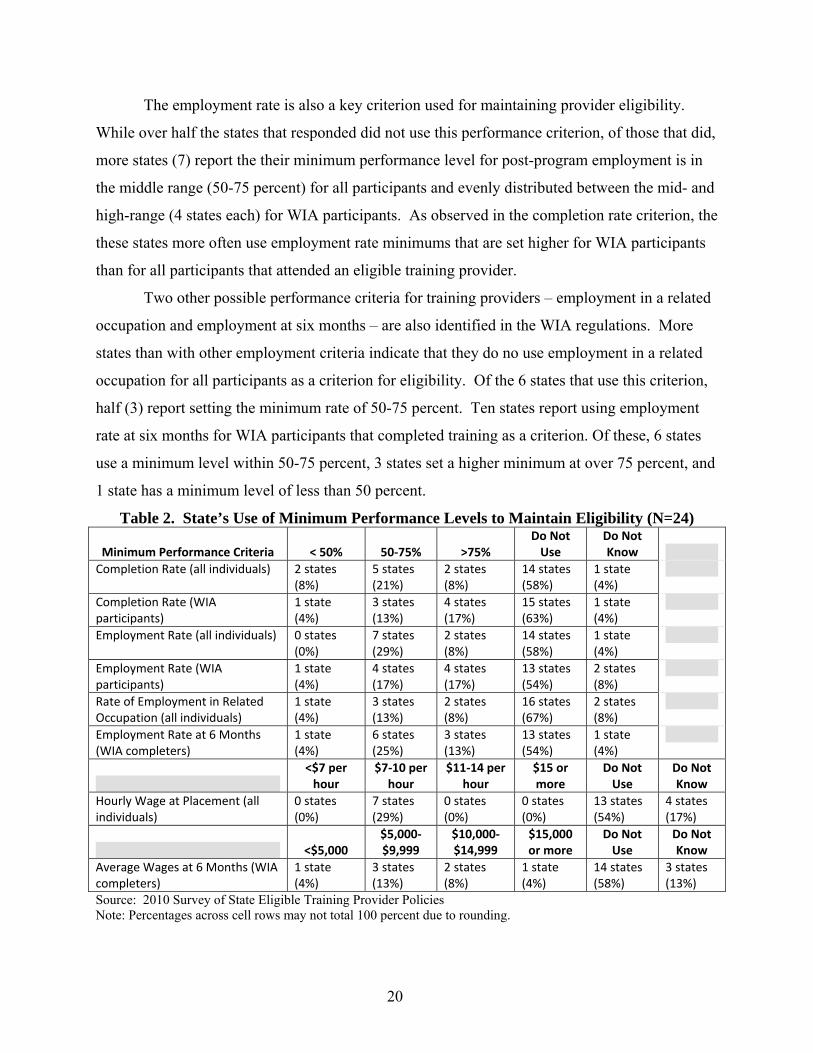
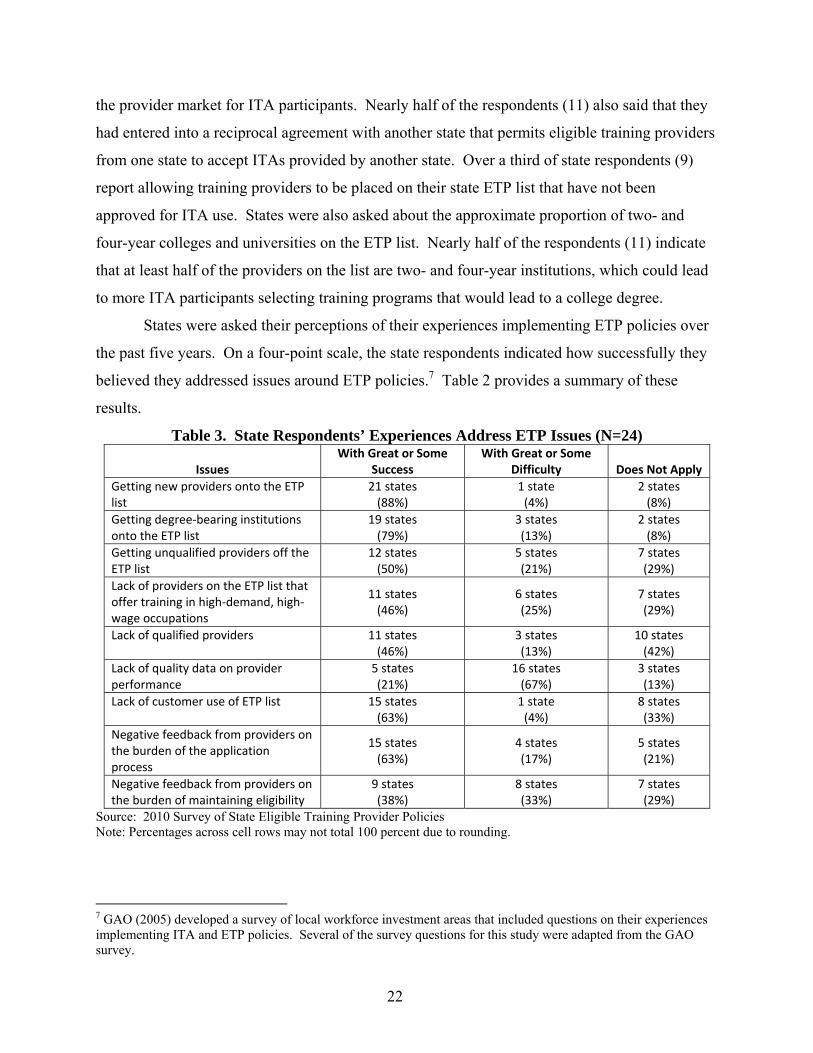
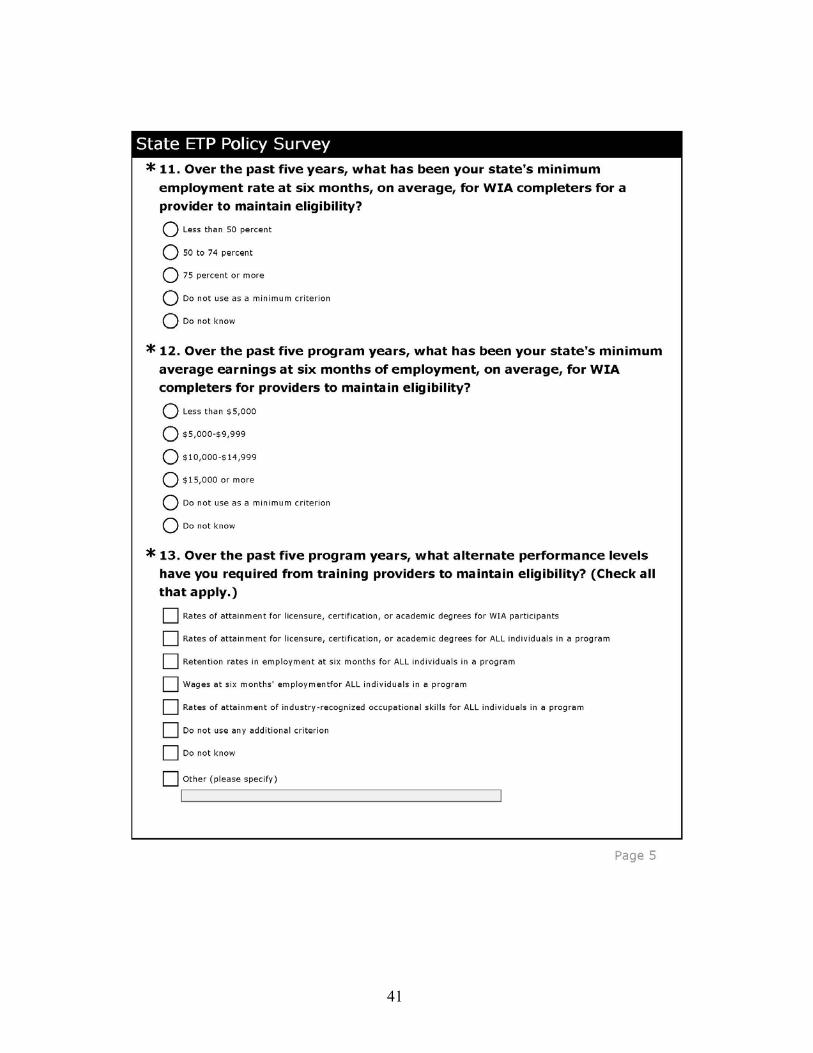
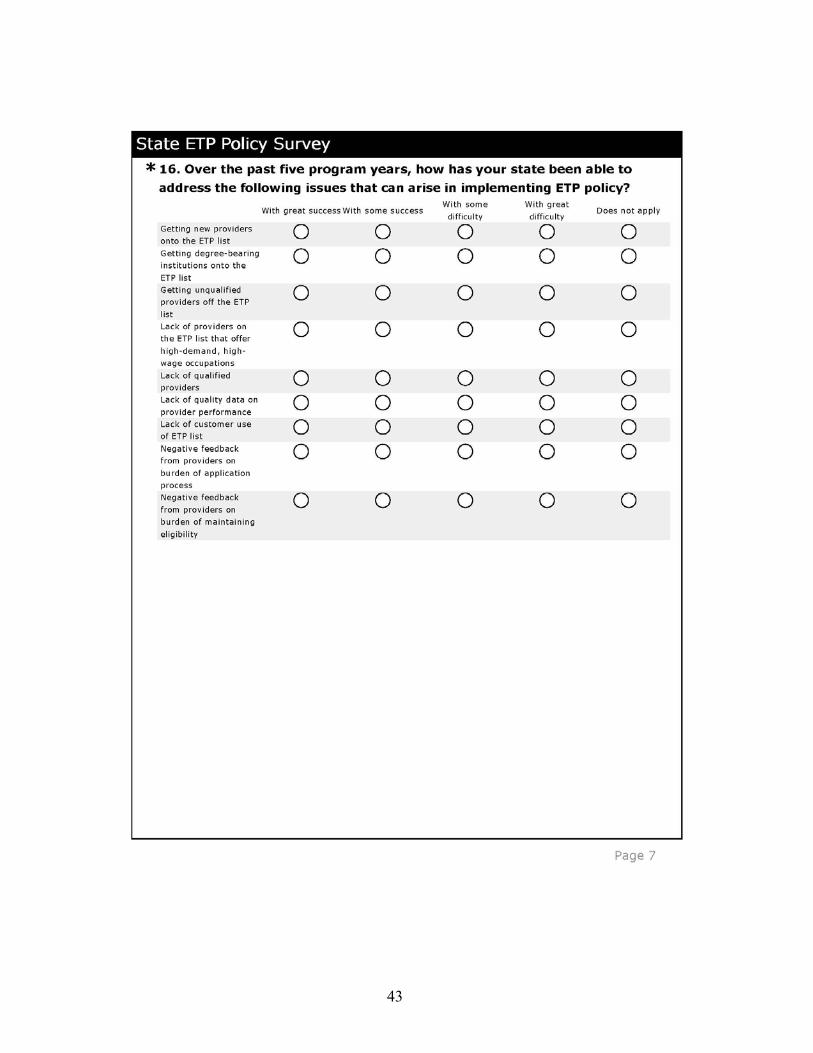
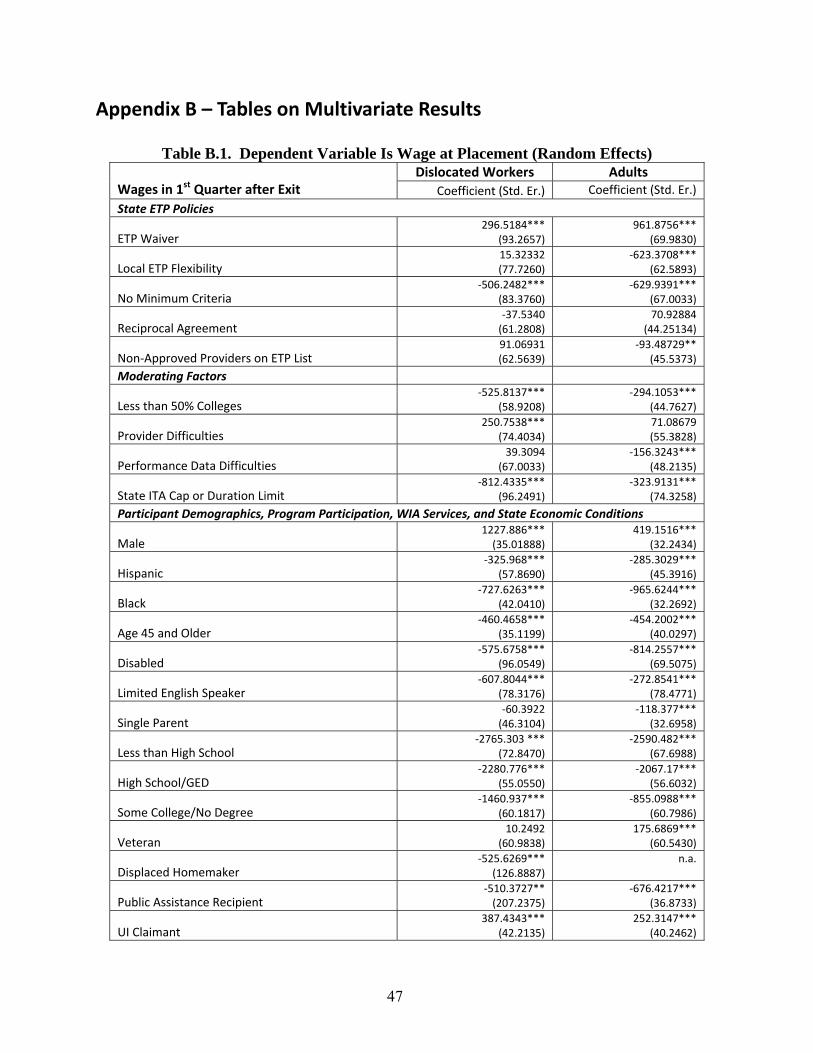
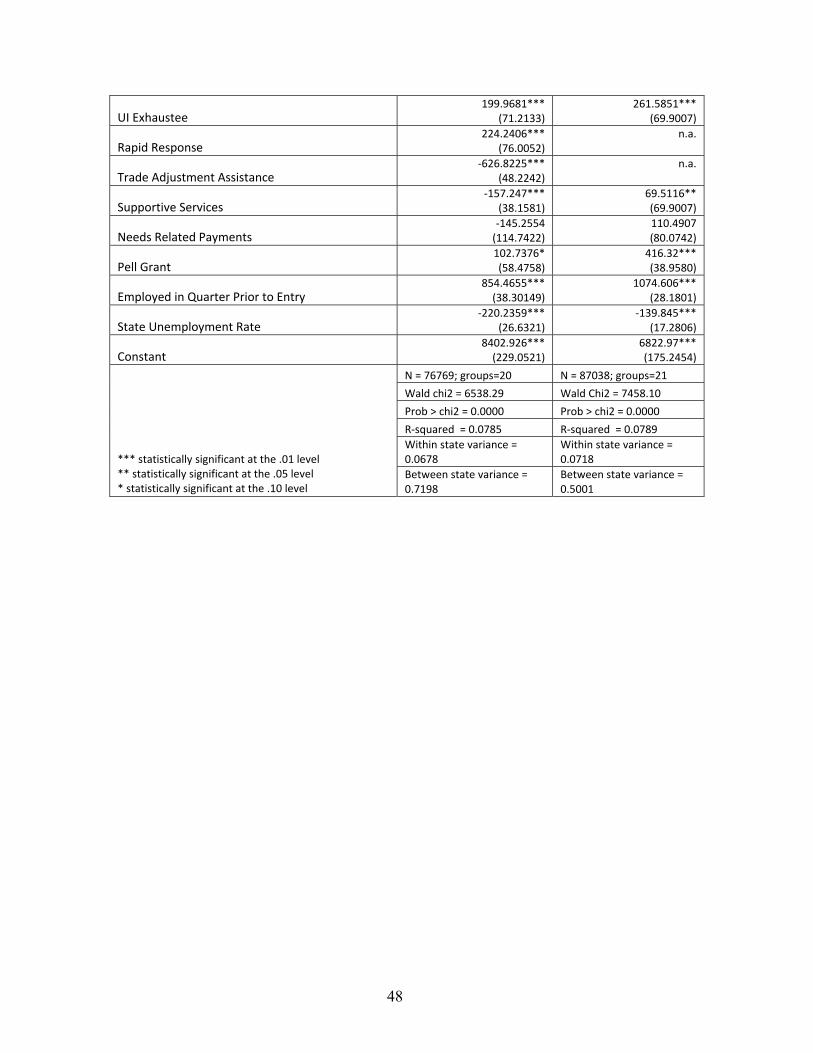
UI Exhaustee 1999681
(712133) 2615851
(699007)
Rapid Response 2242406
(760052) na
Trade Adjustment Assistance ‐6268225
(482242) na
Supportive Services ‐157247
(381581) 695116 (699007)
Needs Related Payments ‐1452554 (1147422)
1104907 (800742)
Pell Grant 1027376 (584758)
41632 (389580)
Employed in Quarter Prior to Entry 8544655 (3830149)
1074606 (281801)
State Unemployment Rate ‐2202359
(266321) ‐139845
(172806)
Constant 8402926 (2290521)
682297 (1752454)
N = 76769 groups=20 N = 87038 groups=21
Wald chi2 = 653829 Wald Chi2 = 745810
Prob gt chi2 = 00000 Prob gt chi2 = 00000
R‐squared = 00785 R‐squared = 00789
statistically significant at the 01 level Within state variance = 00678
Within state variance = 00718
statistically significant at the 05 level statistically significant at the 10 level
Between state variance = 07198
Between state variance = 05001
48
Table B2 Dependent Variable Is Average Wages (Random Effects)
Average Wages at 2nd and 3rd Quarters after Exit Dislocated Workers Adults
Coefficient (Std Er) Coefficient (Std Er)
State ETP Policies
ETP Waiver 8341603 (1951461)
2472078 (1652124)
Local ETP Flexibility 3283617
(1637634) ‐1356786
(1470612)
No Minimum Criteria ‐6349872
(1744487) ‐8954289
(1575376)
Reciprocal Agreement 119598
(1293904) 1242513
(1035055)
Non‐Approved Providers on ETP List ‐668821
(1342795) ‐6940967
(1098091)
Moderating Factors
Less than 50 Colleges ‐7056964
(1267546) ‐1861961 (1073687)
Provider Difficulties 4234538 (1578244)
‐38601 (1326738)
Performance Data Difficulties 3185417 (1413519)
‐1551761 (1139033)
State ITA Cap or Duration Limit ‐9883405
(2036050) 6340015
(1763354)
Participant Demographics Program Participation WIA Services and State Economic Conditions
Male 2595662
(740409) 8320147
(757095)
Hispanic ‐6073506
(1235732) ‐6817535
(1066948)
Black ‐1445316
(889030) ‐1921733
(756244)
Age 45 and Older ‐1144567
(740903) ‐1072619
(941694)
Disabled ‐1251139
(2019849) ‐1610379
(1627435)
Limited English Speaker ‐1366966
(1669149) ‐5972806
(1817183)
Single Parent ‐3500702 (981519)
‐2280564 (765432)
Less than High School ‐5894185
(1551219) ‐5520787
(1600845)
High SchoolGED ‐4656926
(1166158) ‐4364031
(1339699)
Some CollegeNo Degree ‐3013139
(1276603) ‐184207 (1441763)
Veteran 683890
(1280103) 5035552 (1412892)
Displaced Homemaker ‐1093566
(2698455) na
Public Assistance Recipient ‐1039214 (4515161)
‐1455665 (860368)
UI Claimant 7158291
(899724) 6287289
(93218)
UI Exhaustee 2328817
(1517431) 6826655 (1648945)
Rapid Response 6347572 (1612314)
na
49
Trade Adjustment Assistance ‐9666388
(1010130) na
Supportive Services ‐3405629
(806350) 1565555 (714604)
Needs Related Payments ‐4026591 (2395110)
3525914 (1833252)
Pell Grant 997124
(1248827) 1017728
(915865)
Employed in Quarter Prior to Entry 1666538
(809645) 2125872
(659615)
State Unemployment Rate ‐3635331
(577559) ‐1179064
(410121)
Constant 1578683 (4896641)
1188090 (411299)
N = 65763 groups=20 N = 72767 groups=21
Wald chi2 = 603762 Wald chi2 = 579946
Prob gt chi2 = 00000 Prob gt chi2 = 00000
R‐squared = 00841 R‐squared = 00738
statistically significant at the 01 level Within state variance = 00748
Within state variance = 00674
statistically significant at the 05 level statistically significant at the 10 level
Between state variance = 06941
Between state variance = 05041
50
Table B3 Dependent Variable Is Entered Employment (Random Effects)
Employed in 1st Quarter after Exit Dislocated Workers Adults
Odds Ratio (Std Er) Odds Ratio (Std Er)
State ETP Policies
ETP Waiver 11127
(02028) 12711
(01896)
Local ETP Flexibility 10178
(00198) 06887
(01896)
No Minimum Criteria 11422
(01833) 13317
(03005)
Reciprocal Agreement 08832
(01134) 07644
(01331)
Non‐Approved Providers on ETP List 13245 (01830)
14072 (02643)
Moderating Factors
Less than 50 Colleges 07200 (01020)
11011 (02188)
Provider Difficulties 13873 (02166)
13260 (02914)
Performance Data Difficulties 08426
(01117) 07134 (01330)
State ITA Cap andor Duration Limit 11909
(02075) 13302
(03243)
Participant Demographics Program Participation WIA Services and State Economic Conditions
Male 10668 (00248)
09116 (00209)
Hispanic 11895 (00469)
10348 (00339)
Black 09520 (00259)
07975 (00183)
Age 45 and Older 07037 (00159)
07627 (00208)
Disabled 07039 (00454)
06250 (00272)
Limited English Speaker 09309
(00463) 09891
(00540)
Single Parent 10540 (00324)
10709 (00255)
Less than High School 07580 (00361)
06261 (00311)
High SchoolGED 08993 (00341)
07437 (00325)
Some CollegeNo Degree 09600
(00394) 09243 (00433)
Veteran 09295 (00363)
1005 (00423)
Displaced Homemaker 07796 (00587)
na
Public Assistance Recipient 08961
(01132) 07855 (00199)
UI Claimant 12644 (00347)
11620 (00356)
UI Exhaustee 12127 (00535)
13140 (00660)
51
Rapid Response 10853
(00571) na
Trade Adjustment Assistance 06997 (00211)
na
Supportive Services 11410 (00302)
10912 (00248)
Needs Related Payments 08404 (00618)
1015 (00589)
Pell Grant 09681
(00361) 10602 (00309)
Employed in Quarter Prior to Entry 18245 (00430)
24205 (00478)
State Unemployment Rate 10759 (00280)
14180 (00242)
N = 76769 groups=20 N = 87038 groups=21
Wald chi2 = 140883 Wald Chi2 = 326866
Prob gt chi2 = 00000 Prob gt chi2 = 00000
statistically significant at the 01 level Within state variance = 00621
Within state variance = 00913
statistically significant at the 05 level statistically significant at the 10 level
Between state variance = 09379
Between state variance = 09087
52
Table B4 Dependent Variable Is Employment Retention (Random Effects) Employed in Both 2nd and 3rd Quarters after Exit
Dislocated Workers Adults Odds Ratio (Std Er) Odds Ratio (Std Er)
State ETP Policies
ETP Waiver 11466
(02836) 13023 (02089)
Local ETP Flexibility 18426 (04907)
011619 (01953)
No Minimum Criteria 09423
(02048) 10383
(01473)
Reciprocal Agreement 09021
(01585) 10767
(01142)
Non‐Approved Providers on ETP List 18307 (03522)
12212 (01430)
Moderating Factors
Less than 50 Colleges 08243
(01965) 11130
(01352)
Provider Difficulties 09190
(02186) 09996
(01352)
Performance Data Difficulties 12163
(02186) 10231
(01159)
State ITA Cap andor Duration Limit 14938 (03543)
13094 (02073)
Participant Demographics Program Participation WIA Services and State Economic Conditions
Male 08508 (00246)
07138 (00187)
Hispanic 10390
(00471) 10134
(00381)
Black 08483 (00291)
07937 (00212)
Age 45 and Older 08484 (00245)
08842 (00286)
Disabled 08172 (00594)
08089 (00449)
Limited English Speaker 08654 (00504)
09393 (00554)
Single Parent 10068
(00389) 10029
(00279)
Less than High School 07561 (00426)
05651 (00322)
High SchoolGED 10281
(00457) 07361 (00368)
Some CollegeNo Degree 10967 (00538)
09466 (00514)
Veteran 09132 (00440)
09468 (00448)
Displaced Homemaker 08501
(00847) na
Public Assistance Recipient 08093
(01334) 07987 (00245)
UI Claimant 11624 (004005)
12196 (00414)
UI Exhaustee 10866
(00596) 12052 (00692)
Rapid Response 13200 (00915)
na
53
Trade Adjustment Assistance 13065 (00603)
na
Supportive Services 09802
(00303) 10569 (00270)
Needs Related Payments 10046
(00984) 11404
(00474466)
Pell Grant 11470 (00596)
12456 (00449)
Employed in Quarter Prior to Entry 14809 (00441)
15885 (00365)
State Unemployment Rate 11385 (00378)
11135 (00307)
N = 56914 groups=20 N = 61897 groups=21
Wald chi2 = 53556 Wald chi2 = 123699
Prob gt chi2 = 00000 Prob gt chi2 = 00000
statistically significant at the 01 level Within state variance = 00825
Within state variance = 00556
statistically significant at the 05 level statistically significant at the 10 level
Between state variance = 09175
Between state variance = 09444
54
Table B5 Dependent Variable Is Credential Attainment (Random Effects)
Credential Attainment Dislocated Workers Adults
Odds Ratio (Std Er) Odds Ratio (Std Er)
State ETP Policies
ETP Waiver 15771
(05044) 18669 (04079)
Local ETP Flexibility 13703
(04959) 08007
(01916)
No Minimum Criteria 06957
(01826) 08532
(01513)
Reciprocal Agreement 10771
(02432) 06974 (00997)
Non‐Approved Providers on ETP List 07572
(01832) 12297
(01917)
Moderating Factors
Less than 50 Colleges 03767 (00905)
05876 (00912)
Provider Difficulties 09250
(02394) 12009
(02059)
Performance Data Difficulties 13918
(03327) 09814
(01548)
State ITA Cap andor Duration Limit 11347
(03232) 15386 (02963)
Participant Demographics Program Participation WIA Services and State Economic Conditions
Male 10096
(00214) 10724 (00245)
Hispanic 11215 (00538)
08646 (00363)
Black 07938 (00189)
07355 (00160)
Age 45 and Older 10025
(00215) 10831 (00315)
Disabled 07867 (00434)
08046 (00358)
Limited English Speaker 08565 (00470)
11738 (00730)
Single Parent 08952 (00248)
09181 (00209)
Less than High School 06632 (00294)
05247 (00270)
High SchoolGED 10163
(00361) 07351 (00334)
Some CollegeNo Degree 09864
(00378) 09242
(00447)
Veteran 11443 (00424)
10136 (00427)
Displaced Homemaker 11178
(00865) na
Public Assistance Recipient 1342
(03049) 08195 (00229)
UI Claimant 09476 (00265)
09348 (00281)
UI Exhaustee 09812
(00403) 09140 (00414)
Rapid Response 10775
(00601) na
55
Trade Adjustment Assistance 06848 (00200)
na
Supportive Services 14032 (00371)
11595 (00272)
Needs Related Payments 09902
(00713) 11373 (00750)
Pell Grant 07705 (00247)
08519 (00219)
Employed in Quarter Prior to Entry 11579 (00257)
10604 (00209)
State Unemployment Rate 08397 (00222)
14148 (00250)
N = 61849 groups=19 N = 66887 groups=20
Wald chi2 = 86464 Wald chi2 = 123348
Prob gt chi2 = 00000 Prob gt chi2 = 00000
statistically significant at the 01 level Within state variance = 01023
Within state variance = 00731
statistically significant at the 05 level statistically significant at the 10 level
Between state variance = 08977
Between state variance = 09269
56
Table B6 Dependent Variable Is Wage at Placement (OLS)
Wages in 1st Quarter after Exit Dislocated Workers Adults
Coefficient (Std Er) Coefficient (Std Er)
State ETP Policies
ETP Waiver 2965184
(932657) 9618756
(699830)
Local ETP Flexibility 1532332 (777260)
‐6233708 (625893)
No Minimum Criteria ‐5062482
(833760) ‐6299391
(670033)
Reciprocal Agreement ‐3753401 (612808)
709288 (442513)
Non‐Approved Providers on ETP List 9106931 (625639)
‐934873 (455373)
Moderating Factors
Less than 50 Colleges ‐5258137
(589208) ‐2941053
(447627)
Provider Difficulties 2507538
(744034) 710868
(5538275)
Performance Data Difficulties 3930938 (670033)
‐1563243 (482135)
State ITA Cap or Duration Limit ‐8124335
(962491) ‐3239131
(743258)
Participant Demographics Program Participation WIA Services and State Economic Conditions
Male 1227886
(350189) 4191516
(322434)
Hispanic ‐325968
(578690) ‐2853029
(453916)
Black ‐7276263
(420410) ‐9656244
(322692)
Age 45 and Older ‐4604658
(351199) ‐4542002
(400297)
Disabled ‐5756758
(960549) ‐8142557
(695075)
Limited English Speaker ‐6078044
(783176) ‐2728541
(784771)
Single Parent ‐603922 (463104)
‐118377 (326958)
Less than High School ‐2765303
(728467) ‐2590482
(676988)
High SchoolGED ‐2280776
(550550) ‐206717
(566032)
Some CollegeNo Degree ‐1460937
(601817) ‐8550988
(607986)
Veteran 102492
(609838) 1756869
(605430)
Displaced Homemaker ‐5256269
(1268887) na
Public Assistance Recipient ‐5103727
(2072375) ‐6764217
(368733)
UI Claimant 3874343
(422135) 2523147
(402462)
UI Exhaustee 1999681
(712133) 2615851
(699007)
Rapid Response 2242406 (7600512)
na
57
Trade Adjustment Assistance ‐6268225
(482242) na
Supportive Services ‐157247
(381581) 695116 (305937)
Needs Related Payments ‐1452554 (1147422)
1104907 (800742)
Pell Grant 1027376 (584758)
41632 (389580)
Employed in Quarter Prior to Entry 8544655
(383015) 1074606
(281801)
State Unemployment Rate ‐2202359
(266321) ‐139845
(172806)
Constant 8402926 (2290521)
682297 (1752454)
N = 76769 N = 87038
F( 31 76737) = 21091 F( 28 87009) = 26636
statistically significant at the 01 level statistically significant at the 05 level statistically significant at the 10 level
Prob gt F = 00000 Prob gt F = 00000
R‐squared = 00785 R‐squared = 00789
Adj R‐squared = 00781 Adj R‐squared = 00787
58
Table B7 Dependent Variable Is Average Wages (OLS)
Average Wages at 2nd and 3rd Quarters after Exit Dislocated Workers Adults
Coefficient (Std Er) Coefficient (Std Er)
State ETP Policies
ETP Waiver 8341603 (1951461)
2472078 (1652124)
Local ETP Flexibility 328362
(1637634) ‐1356786
(1470612)
No Minimum Criteria ‐6349872
(1744487) ‐8954289
(1575376)
Reciprocal Agreement 119598
(1293904) 1242513
(1035055)
Non‐Approved Providers on ETP List ‐668821
(1342795) ‐6940967
(1098091)
Moderating Factors
Less than 50 Colleges ‐7056964
(1267546) ‐1861961 (1073687)
Provider Difficulties 4234538 (1578244)
‐38601 (1326738)
Performance Data Difficulties 3185417 (1413519)
‐1551761 (1139033)
State ITA Cap or Duration Limit ‐9883405
(2036050) 634002
(1763354)
Participant Demographics Program Participation WIA Services and State Economic Conditions
Male 2595662
(740409) 8320147
(757095)
Hispanic ‐6073506
(1235732) ‐6817535
(1066948)
Black ‐1445316
(889030) ‐1921733
(756244)
Age 45 and Older ‐1144567
(740903) ‐1072619
(941694)
Disabled ‐1251139
(2019849) ‐1610379
(1627435)
Limited English Speaker ‐1366966
(1669149) ‐5972806
(1817183)
Single Parent ‐3500702 (981519)
‐2280564 (765432)
Less than High School ‐5894185
(1551219) ‐5520787
(1600845)
High SchoolGED ‐4656926
(1166158) ‐4364031
(1339699)
Some CollegeNo Degree ‐3013139
(1276603) ‐184207 (1441763)
Veteran 6838895
(1280103) 5035552 (1412892)
Displaced Homemaker ‐1093566
(2698455) na
Public Assistance Recipient ‐1039214 (4515161)
‐1455665 (860368)
UI Claimant 7158291
(899724) 6287289
(932180)
UI Exhaustee 2328817
(1517431) 6826655 (1648945)
Rapid Response 6347572 (1612314)
na
59
Trade Adjustment Assistance ‐9666388
(1010130) na
Supportive Services ‐3405629
(806350) 1565555 (714604)
Needs Related Payments ‐4026591 (2395110)
3525914 (1833252)
Pell Grant 9971238
(1248827) 1017728
(915865)
Employed in Quarter Prior to Entry 1666538
(809645) 2125872
(659615)
State Unemployment Rate ‐3635331
(577559) ‐1179064
(410121)
Constant 1578683 (4896641)
118809 (4112990)
N = 65763 N = 72767
F( 31 65731) = 19476 F( 28 72738) = 20712
statistically significant at the 01 level statistically significant at the 05 level statistically significant at the 10 level
Prob gt F = 00000 Prob gt F = 00000
R‐squared = 00841 R‐squared = 00738
Adj R‐squared = 00837 Adj R‐squared = 00735
60
Table B8 Dependent Variable Is Entered Employment (Logistic)
Employed in 1st Quarter after Exit Dislocated Workers Adults
Odds Ratio (Std Er) Odds Ratio (Std Er)
State ETP Policies
ETP Waiver 10659
(00681) 11598 (00579)
Local ETP Flexibility 10775
(00567) 09027 (00391)
No Minimum Criteria 09287
(00506) 09432
(00437)
Reciprocal Agreement 08050 (00326)
07647 (00231)
Non‐Approved Providers on ETP List 11882 (00487)
11750 (00366)
Moderating Factors
Less than 50 Colleges 06982 (00270)
08386 (00260)
Provider Difficulties 14354 (00726)
13226 (00503)
Performance Data Difficulties 09149 (00400)
08602 (00286)
State ITA Cap andor Duration Limit 11895 (00774)
11632 (00606)
Participant Demographics Program Participation WIA Services and State Economic Conditions
Male 10664 (00247)
09153 (00208)
Hispanic 11856 (00469)
10446 (00336)
Black 09518 (00257)
07937 (00180)
Age 45 and Older 07037 (00159)
07816 (00212)
Disabled 07847 (00456)
06401 (00273)
Limited English Speaker 09438
(00464) 10474
(00566)
Single Parent 10497
(00321) 10545 (00248)
Less than High School 07724 (00365)
06374 (00315)
High SchoolGED 08890 (00335)
07591] (00330)
Some CollegeNo Degree 09565
(00391) 09541
(00445)
Veteran 09251 (00361)
10147 (00425)
Displaced Homemaker 07445 (00553)
na
Public Assistance Recipient 08498
(01070) 07374 (00183)
UI Claimant 12660 (00343)
11763 (00357)
UI Exhaustee 12229 (00537)
13356 (00669)
61
Rapid Response 11022 (00573)
na
Trade Adjustment Assistance 06672 (00195)
na
Supportive Services 11389 (00296)
10804 (00238)
Needs Related Payments 08074 (00590)
09771 (00564)
Pell Grant 09888
(00367) 10677 (00303)
Employed in Quarter Prior to Entry 17985 (00419)
23846 (00467)
State Unemployment Rate 10938 (00197)
12479 (00145)
N = 76769 N = 87038
statistically significant at the 01 level statistically significant at the 05 level statistically significant at the 10 level
LR chi2(31) = 218776 LR chi2(28) = 392665
Prob gt chi2 = 00000 Prob gt chi2 = 00000
Pseudo R2 = 00354 Pseudo R2 = 00524
62
Table B9 Dependent Variable Is Employment Retention (Logistic) Employed in Both 2nd and 3rd Quarters after Exit
Dislocated Workers Adults Odds Ratio (Std Er) Odds Ratio (Std Er)
State ETP Policies
ETP Waiver 21579 (00958)
13613 (00465)
Local ETP Flexibility 14870 (00525)
09437 (00287)
No Minimum Criteria 15727 (00583)
22464 (00753423)
Reciprocal Agreement 09893
(00269) 12106 (00264)
Non‐Approved Providers on ETP List 16701 (00473)
11483 (00251)
Moderating Factors
Less than 50 Colleges 10469 (00270)
13723 (00294)
Provider Difficulties 07049 (00230)
08524 (00229)
Performance Data Difficulties 07500 (00220)
09469 (00221)
State ITA Cap andor Duration Limit 30973 (01392)
24617 (00907)
Participant Demographics Program Participation WIA Services and State Economic Conditions
Male 09572 (00151)
08419 (00132)
Hispanic 09395 (00241)
09523 (00210)
Black 09016 (00171)
08537 (00134)
Age 45 and Older 08104 (00128)
08394 (00162)
Disabled 09244 (00395)
09041 (00311)
Limited English Speaker 09819
(00341) 10912 (00418)
Single Parent 09787
(00204) 10811 (00174)
Less than High School 08370 (00271)
09011 (00294)
High SchoolGED 10584 (00261)
10646 (00289)
Some CollegeNo Degree 10381
(00280) 10850 (00317)
Veteran 09600
(00263) 10352
(00307)
Displaced Homemaker 09778
(00546) na
Public Assistance Recipient 08132 (00713)
07949 (00143)
UI Claimant 11084 (00207)
12103 (00242)
UI Exhaustee 10667 (00336)
11094 (00379)
Rapid Response 11110 (00380)
na
63
Trade Adjustment Assistance 09906
(00218) na
Supportive Services 10138
(00173) 11059 (00166)
Needs Related Payments 10585
(00554) 11721 (00474)
Pell Grant 09638
(00253) 11253 (00217)
Employed in Quarter Prior to Entry 13922 (00238)
14476 (00199)
State Unemployment Rate 18533 (00224)
17684 (00162)
N = 56914 N = 98947
statistically significant at the 01 level statistically significant at the 05 level statistically significant at the 10 level
LR chi2(31) = 459434 LR chi2(28) = 651586
Prob gt chi2 = 00000 Prob gt chi2 = 00000
Pseudo R2 = 00410 Pseudo R2 = 00478
64
Table B10 Dependent Variable Is Credential Attainment (Logistic)
Credential Attainment Dislocated Workers Adults
Odds Ratio (Std Er) Odds Ratio (Std Er)
State ETP Policies
ETP Waiver 1362047 (00791268)
1503802 (00738823)
Local ETP Flexibility 1192903 (00659165)
1086719 (00501626)
No Minimum Criteria 05889517 (00287845)
06303801 (00259187)
Reciprocal Agreement 08038859 (00308537)
07688012 (00231051)
Non‐Approved Providers on ETP List 0821864 (00305776)
09212954 (00285404)
Moderating Factors
Less than 50 Colleges 04160928 (00140744)
04844944 (00134903)
Provider Difficulties 1299758 (00581351)
1232921 (00414332)
Performance Data Difficulties 1266055 (00551611)
1041325 (00344193)
State ITA Cap andor Duration Limit 09075297 (00493752)
1084563 (00488886)
Participant Demographics Program Participation WIA Services and State Economic Conditions
Male 1005608
(00212931) 1085944 (00246675)
Hispanic 1093782
(00513149) 09649167
(00388968)
Black 07993544
(0018882) 07013264 (00149626)
Age 45 and Older 09955974
(00212589) 1100156 (00318527)
Disabled 07362801 (00401095)
08082321 (00354811)
Limited English Speaker 08514039 (00464474)
118101 (0072862)
Single Parent 08863159 (00245004)
0912994 (00203986)
Less than High School 06698799
(0029513) 05059487 (00258618)
High SchoolGED 1019497 (00357656)
07162731 (00323194)
Some CollegeNo Degree 09854497 (0037551)
09135837 (0043865)
Veteran 1138998 (0042114)
1013603 (00424255)
Displaced Homemaker 105
(00805919) na
Public Assistance Recipient 1383428
(03138145) 08666843 (00236469)
UI Claimant 09576332
(00261938) 09458527 (00279275)
UI Exhaustee 09994911 (004076)
09224048 (00416234)
Rapid Response 1056595
(00585217) na
65
Trade Adjustment Assistance 06781054 (00195372)
na
Supportive Services 1372909 (00356113)
1217608 (00276749)
Needs Related Payments 0995449
(0071319) 1137914 (00746525)
Pell Grant 07821315 (00249322)
08035012 (00200784)
Employed in Quarter Prior to Entry 1166207 (00257534)
1060353 (00207686)
State Unemployment Rate 09488461 (00152725)
1245677 (00135518)
N = 61849 N = 66887
statistically significant at the 01 level statistically significant at the 05 level statistically significant at the 10 level
LR chi2(31) = 526781 LR chi2(28) = 476857
Prob gt chi2 = 00000 Prob gt chi2 = 00000
Pseudo R2 = 00761 Pseudo R2 = 00649
66
Table B11 Simple Correlation Table of Key ETP Variables
ETP Waiver
Local ETP Flexibility
No Minimum Criteria
Reciprocal Agreement
Non‐Approved Providers on ETP List
Less than 50 Colleges
Provider Difficulties
Performance Data Difficulties
State ITA Cap andor Duration Limit
ETP Waiver 10000 Local ETP Flexibility
03122 10000
No Minimum Criteria
08616 01860 10000
Reciprocal Agreement
‐01913
‐00706 ‐01565 10000
Non‐Approved Providers on ETP List
02007 ‐01193 00604 ‐01565 10000
Less than 50 Colleges
‐00162
02238 ‐01560 ‐00828 05457 10000
Provider Difficulties
‐03945
03500 ‐04166 00005 ‐02594 00115 10000
Performance Data Difficulties
01471 ‐00257 01581 ‐06642 02673 02579 01571 10000
State ITA Cap andor Duration Limit
‐08093
‐01594 ‐07884 01216 ‐02303 ‐00038 05835 ‐01118 10000
67
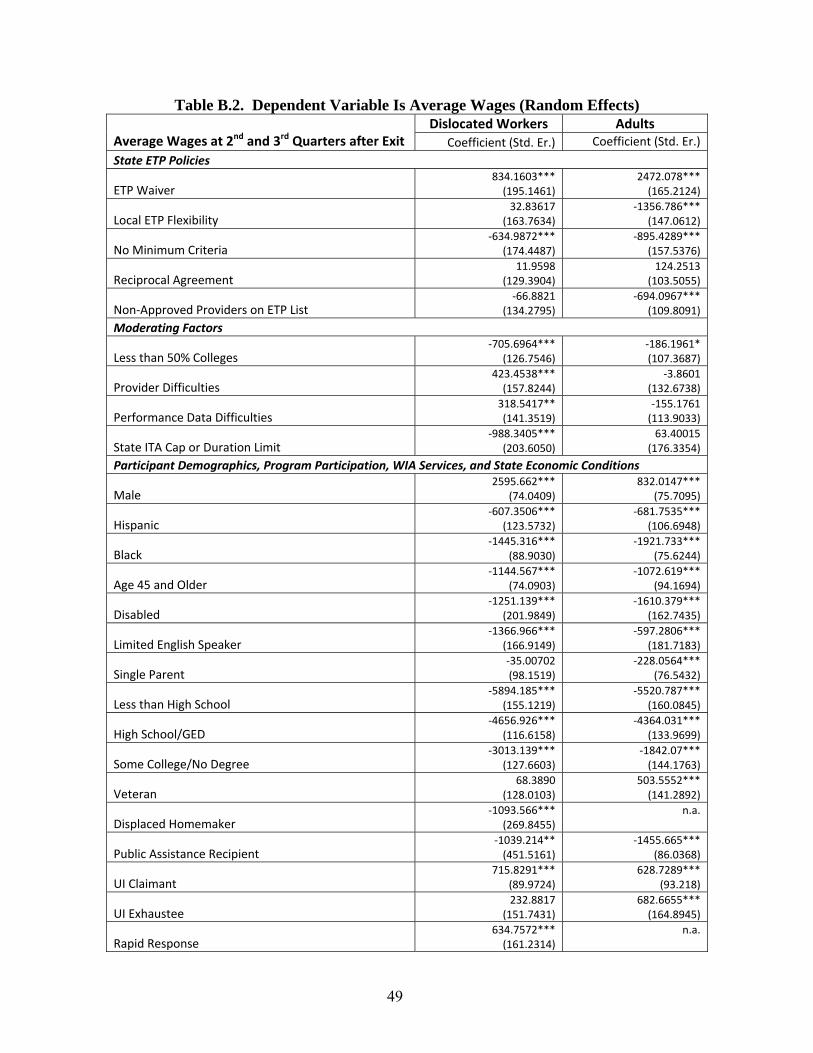
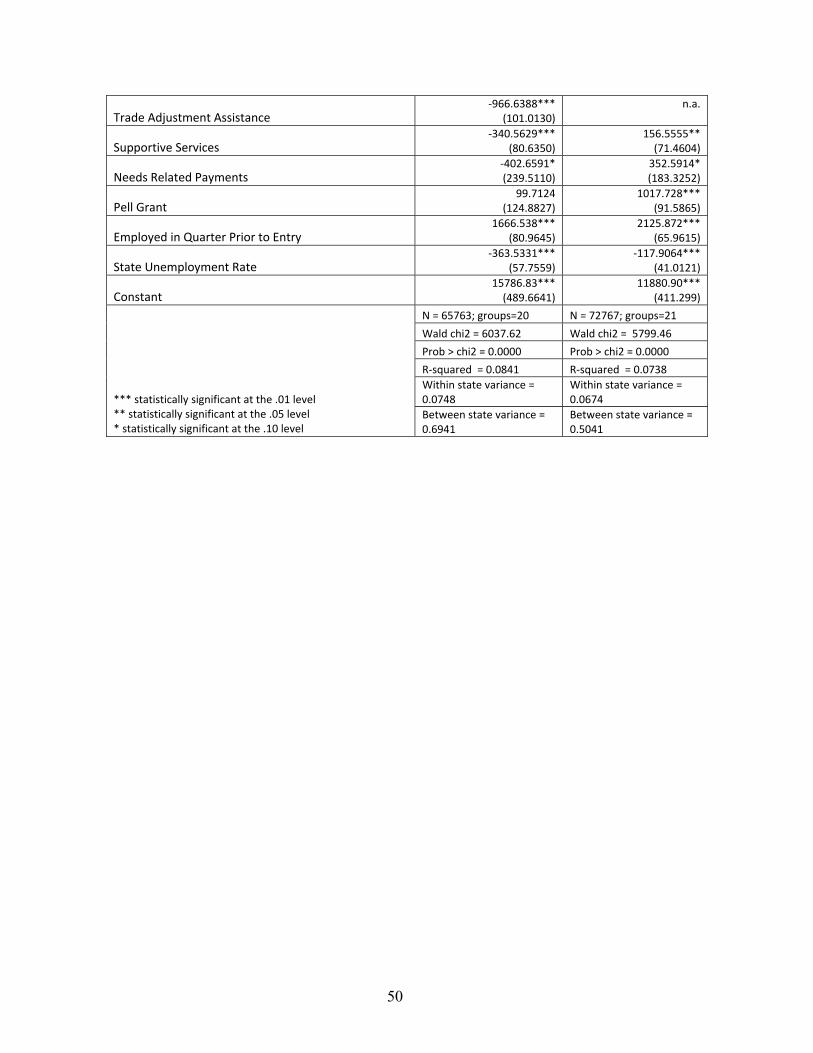
Trade Adjustment Assistance ‐9666388
(1010130) na
Supportive Services ‐3405629
(806350) 1565555 (714604)
Needs Related Payments ‐4026591 (2395110)
3525914 (1833252)
Pell Grant 997124
(1248827) 1017728
(915865)
Employed in Quarter Prior to Entry 1666538
(809645) 2125872
(659615)
State Unemployment Rate ‐3635331
(577559) ‐1179064
(410121)
Constant 1578683 (4896641)
1188090 (411299)
N = 65763 groups=20 N = 72767 groups=21
Wald chi2 = 603762 Wald chi2 = 579946
Prob gt chi2 = 00000 Prob gt chi2 = 00000
R‐squared = 00841 R‐squared = 00738
statistically significant at the 01 level Within state variance = 00748
Within state variance = 00674
statistically significant at the 05 level statistically significant at the 10 level
Between state variance = 06941
Between state variance = 05041
50
Table B3 Dependent Variable Is Entered Employment (Random Effects)
Employed in 1st Quarter after Exit Dislocated Workers Adults
Odds Ratio (Std Er) Odds Ratio (Std Er)
State ETP Policies
ETP Waiver 11127
(02028) 12711
(01896)
Local ETP Flexibility 10178
(00198) 06887
(01896)
No Minimum Criteria 11422
(01833) 13317
(03005)
Reciprocal Agreement 08832
(01134) 07644
(01331)
Non‐Approved Providers on ETP List 13245 (01830)
14072 (02643)
Moderating Factors
Less than 50 Colleges 07200 (01020)
11011 (02188)
Provider Difficulties 13873 (02166)
13260 (02914)
Performance Data Difficulties 08426
(01117) 07134 (01330)
State ITA Cap andor Duration Limit 11909
(02075) 13302
(03243)
Participant Demographics Program Participation WIA Services and State Economic Conditions
Male 10668 (00248)
09116 (00209)
Hispanic 11895 (00469)
10348 (00339)
Black 09520 (00259)
07975 (00183)
Age 45 and Older 07037 (00159)
07627 (00208)
Disabled 07039 (00454)
06250 (00272)
Limited English Speaker 09309
(00463) 09891
(00540)
Single Parent 10540 (00324)
10709 (00255)
Less than High School 07580 (00361)
06261 (00311)
High SchoolGED 08993 (00341)
07437 (00325)
Some CollegeNo Degree 09600
(00394) 09243 (00433)
Veteran 09295 (00363)
1005 (00423)
Displaced Homemaker 07796 (00587)
na
Public Assistance Recipient 08961
(01132) 07855 (00199)
UI Claimant 12644 (00347)
11620 (00356)
UI Exhaustee 12127 (00535)
13140 (00660)
51
Rapid Response 10853
(00571) na
Trade Adjustment Assistance 06997 (00211)
na
Supportive Services 11410 (00302)
10912 (00248)
Needs Related Payments 08404 (00618)
1015 (00589)
Pell Grant 09681
(00361) 10602 (00309)
Employed in Quarter Prior to Entry 18245 (00430)
24205 (00478)
State Unemployment Rate 10759 (00280)
14180 (00242)
N = 76769 groups=20 N = 87038 groups=21
Wald chi2 = 140883 Wald Chi2 = 326866
Prob gt chi2 = 00000 Prob gt chi2 = 00000
statistically significant at the 01 level Within state variance = 00621
Within state variance = 00913
statistically significant at the 05 level statistically significant at the 10 level
Between state variance = 09379
Between state variance = 09087
52
Table B4 Dependent Variable Is Employment Retention (Random Effects) Employed in Both 2nd and 3rd Quarters after Exit
Dislocated Workers Adults Odds Ratio (Std Er) Odds Ratio (Std Er)
State ETP Policies
ETP Waiver 11466
(02836) 13023 (02089)
Local ETP Flexibility 18426 (04907)
011619 (01953)
No Minimum Criteria 09423
(02048) 10383
(01473)
Reciprocal Agreement 09021
(01585) 10767
(01142)
Non‐Approved Providers on ETP List 18307 (03522)
12212 (01430)
Moderating Factors
Less than 50 Colleges 08243
(01965) 11130
(01352)
Provider Difficulties 09190
(02186) 09996
(01352)
Performance Data Difficulties 12163
(02186) 10231
(01159)
State ITA Cap andor Duration Limit 14938 (03543)
13094 (02073)
Participant Demographics Program Participation WIA Services and State Economic Conditions
Male 08508 (00246)
07138 (00187)
Hispanic 10390
(00471) 10134
(00381)
Black 08483 (00291)
07937 (00212)
Age 45 and Older 08484 (00245)
08842 (00286)
Disabled 08172 (00594)
08089 (00449)
Limited English Speaker 08654 (00504)
09393 (00554)
Single Parent 10068
(00389) 10029
(00279)
Less than High School 07561 (00426)
05651 (00322)
High SchoolGED 10281
(00457) 07361 (00368)
Some CollegeNo Degree 10967 (00538)
09466 (00514)
Veteran 09132 (00440)
09468 (00448)
Displaced Homemaker 08501
(00847) na
Public Assistance Recipient 08093
(01334) 07987 (00245)
UI Claimant 11624 (004005)
12196 (00414)
UI Exhaustee 10866
(00596) 12052 (00692)
Rapid Response 13200 (00915)
na
53
Trade Adjustment Assistance 13065 (00603)
na
Supportive Services 09802
(00303) 10569 (00270)
Needs Related Payments 10046
(00984) 11404
(00474466)
Pell Grant 11470 (00596)
12456 (00449)
Employed in Quarter Prior to Entry 14809 (00441)
15885 (00365)
State Unemployment Rate 11385 (00378)
11135 (00307)
N = 56914 groups=20 N = 61897 groups=21
Wald chi2 = 53556 Wald chi2 = 123699
Prob gt chi2 = 00000 Prob gt chi2 = 00000
statistically significant at the 01 level Within state variance = 00825
Within state variance = 00556
statistically significant at the 05 level statistically significant at the 10 level
Between state variance = 09175
Between state variance = 09444
54
Table B5 Dependent Variable Is Credential Attainment (Random Effects)
Credential Attainment Dislocated Workers Adults
Odds Ratio (Std Er) Odds Ratio (Std Er)
State ETP Policies
ETP Waiver 15771
(05044) 18669 (04079)
Local ETP Flexibility 13703
(04959) 08007
(01916)
No Minimum Criteria 06957
(01826) 08532
(01513)
Reciprocal Agreement 10771
(02432) 06974 (00997)
Non‐Approved Providers on ETP List 07572
(01832) 12297
(01917)
Moderating Factors
Less than 50 Colleges 03767 (00905)
05876 (00912)
Provider Difficulties 09250
(02394) 12009
(02059)
Performance Data Difficulties 13918
(03327) 09814
(01548)
State ITA Cap andor Duration Limit 11347
(03232) 15386 (02963)
Participant Demographics Program Participation WIA Services and State Economic Conditions
Male 10096
(00214) 10724 (00245)
Hispanic 11215 (00538)
08646 (00363)
Black 07938 (00189)
07355 (00160)
Age 45 and Older 10025
(00215) 10831 (00315)
Disabled 07867 (00434)
08046 (00358)
Limited English Speaker 08565 (00470)
11738 (00730)
Single Parent 08952 (00248)
09181 (00209)
Less than High School 06632 (00294)
05247 (00270)
High SchoolGED 10163
(00361) 07351 (00334)
Some CollegeNo Degree 09864
(00378) 09242
(00447)
Veteran 11443 (00424)
10136 (00427)
Displaced Homemaker 11178
(00865) na
Public Assistance Recipient 1342
(03049) 08195 (00229)
UI Claimant 09476 (00265)
09348 (00281)
UI Exhaustee 09812
(00403) 09140 (00414)
Rapid Response 10775
(00601) na
55
Trade Adjustment Assistance 06848 (00200)
na
Supportive Services 14032 (00371)
11595 (00272)
Needs Related Payments 09902
(00713) 11373 (00750)
Pell Grant 07705 (00247)
08519 (00219)
Employed in Quarter Prior to Entry 11579 (00257)
10604 (00209)
State Unemployment Rate 08397 (00222)
14148 (00250)
N = 61849 groups=19 N = 66887 groups=20
Wald chi2 = 86464 Wald chi2 = 123348
Prob gt chi2 = 00000 Prob gt chi2 = 00000
statistically significant at the 01 level Within state variance = 01023
Within state variance = 00731
statistically significant at the 05 level statistically significant at the 10 level
Between state variance = 08977
Between state variance = 09269
56
Table B6 Dependent Variable Is Wage at Placement (OLS)
Wages in 1st Quarter after Exit Dislocated Workers Adults
Coefficient (Std Er) Coefficient (Std Er)
State ETP Policies
ETP Waiver 2965184
(932657) 9618756
(699830)
Local ETP Flexibility 1532332 (777260)
‐6233708 (625893)
No Minimum Criteria ‐5062482
(833760) ‐6299391
(670033)
Reciprocal Agreement ‐3753401 (612808)
709288 (442513)
Non‐Approved Providers on ETP List 9106931 (625639)
‐934873 (455373)
Moderating Factors
Less than 50 Colleges ‐5258137
(589208) ‐2941053
(447627)
Provider Difficulties 2507538
(744034) 710868
(5538275)
Performance Data Difficulties 3930938 (670033)
‐1563243 (482135)
State ITA Cap or Duration Limit ‐8124335
(962491) ‐3239131
(743258)
Participant Demographics Program Participation WIA Services and State Economic Conditions
Male 1227886
(350189) 4191516
(322434)
Hispanic ‐325968
(578690) ‐2853029
(453916)
Black ‐7276263
(420410) ‐9656244
(322692)
Age 45 and Older ‐4604658
(351199) ‐4542002
(400297)
Disabled ‐5756758
(960549) ‐8142557
(695075)
Limited English Speaker ‐6078044
(783176) ‐2728541
(784771)
Single Parent ‐603922 (463104)
‐118377 (326958)
Less than High School ‐2765303
(728467) ‐2590482
(676988)
High SchoolGED ‐2280776
(550550) ‐206717
(566032)
Some CollegeNo Degree ‐1460937
(601817) ‐8550988
(607986)
Veteran 102492
(609838) 1756869
(605430)
Displaced Homemaker ‐5256269
(1268887) na
Public Assistance Recipient ‐5103727
(2072375) ‐6764217
(368733)
UI Claimant 3874343
(422135) 2523147
(402462)
UI Exhaustee 1999681
(712133) 2615851
(699007)
Rapid Response 2242406 (7600512)
na
57
Trade Adjustment Assistance ‐6268225
(482242) na
Supportive Services ‐157247
(381581) 695116 (305937)
Needs Related Payments ‐1452554 (1147422)
1104907 (800742)
Pell Grant 1027376 (584758)
41632 (389580)
Employed in Quarter Prior to Entry 8544655
(383015) 1074606
(281801)
State Unemployment Rate ‐2202359
(266321) ‐139845
(172806)
Constant 8402926 (2290521)
682297 (1752454)
N = 76769 N = 87038
F( 31 76737) = 21091 F( 28 87009) = 26636
statistically significant at the 01 level statistically significant at the 05 level statistically significant at the 10 level
Prob gt F = 00000 Prob gt F = 00000
R‐squared = 00785 R‐squared = 00789
Adj R‐squared = 00781 Adj R‐squared = 00787
58
Table B7 Dependent Variable Is Average Wages (OLS)
Average Wages at 2nd and 3rd Quarters after Exit Dislocated Workers Adults
Coefficient (Std Er) Coefficient (Std Er)
State ETP Policies
ETP Waiver 8341603 (1951461)
2472078 (1652124)
Local ETP Flexibility 328362
(1637634) ‐1356786
(1470612)
No Minimum Criteria ‐6349872
(1744487) ‐8954289
(1575376)
Reciprocal Agreement 119598
(1293904) 1242513
(1035055)
Non‐Approved Providers on ETP List ‐668821
(1342795) ‐6940967
(1098091)
Moderating Factors
Less than 50 Colleges ‐7056964
(1267546) ‐1861961 (1073687)
Provider Difficulties 4234538 (1578244)
‐38601 (1326738)
Performance Data Difficulties 3185417 (1413519)
‐1551761 (1139033)
State ITA Cap or Duration Limit ‐9883405
(2036050) 634002
(1763354)
Participant Demographics Program Participation WIA Services and State Economic Conditions
Male 2595662
(740409) 8320147
(757095)
Hispanic ‐6073506
(1235732) ‐6817535
(1066948)
Black ‐1445316
(889030) ‐1921733
(756244)
Age 45 and Older ‐1144567
(740903) ‐1072619
(941694)
Disabled ‐1251139
(2019849) ‐1610379
(1627435)
Limited English Speaker ‐1366966
(1669149) ‐5972806
(1817183)
Single Parent ‐3500702 (981519)
‐2280564 (765432)
Less than High School ‐5894185
(1551219) ‐5520787
(1600845)
High SchoolGED ‐4656926
(1166158) ‐4364031
(1339699)
Some CollegeNo Degree ‐3013139
(1276603) ‐184207 (1441763)
Veteran 6838895
(1280103) 5035552 (1412892)
Displaced Homemaker ‐1093566
(2698455) na
Public Assistance Recipient ‐1039214 (4515161)
‐1455665 (860368)
UI Claimant 7158291
(899724) 6287289
(932180)
UI Exhaustee 2328817
(1517431) 6826655 (1648945)
Rapid Response 6347572 (1612314)
na
59
Trade Adjustment Assistance ‐9666388
(1010130) na
Supportive Services ‐3405629
(806350) 1565555 (714604)
Needs Related Payments ‐4026591 (2395110)
3525914 (1833252)
Pell Grant 9971238
(1248827) 1017728
(915865)
Employed in Quarter Prior to Entry 1666538
(809645) 2125872
(659615)
State Unemployment Rate ‐3635331
(577559) ‐1179064
(410121)
Constant 1578683 (4896641)
118809 (4112990)
N = 65763 N = 72767
F( 31 65731) = 19476 F( 28 72738) = 20712
statistically significant at the 01 level statistically significant at the 05 level statistically significant at the 10 level
Prob gt F = 00000 Prob gt F = 00000
R‐squared = 00841 R‐squared = 00738
Adj R‐squared = 00837 Adj R‐squared = 00735
60
Table B8 Dependent Variable Is Entered Employment (Logistic)
Employed in 1st Quarter after Exit Dislocated Workers Adults
Odds Ratio (Std Er) Odds Ratio (Std Er)
State ETP Policies
ETP Waiver 10659
(00681) 11598 (00579)
Local ETP Flexibility 10775
(00567) 09027 (00391)
No Minimum Criteria 09287
(00506) 09432
(00437)
Reciprocal Agreement 08050 (00326)
07647 (00231)
Non‐Approved Providers on ETP List 11882 (00487)
11750 (00366)
Moderating Factors
Less than 50 Colleges 06982 (00270)
08386 (00260)
Provider Difficulties 14354 (00726)
13226 (00503)
Performance Data Difficulties 09149 (00400)
08602 (00286)
State ITA Cap andor Duration Limit 11895 (00774)
11632 (00606)
Participant Demographics Program Participation WIA Services and State Economic Conditions
Male 10664 (00247)
09153 (00208)
Hispanic 11856 (00469)
10446 (00336)
Black 09518 (00257)
07937 (00180)
Age 45 and Older 07037 (00159)
07816 (00212)
Disabled 07847 (00456)
06401 (00273)
Limited English Speaker 09438
(00464) 10474
(00566)
Single Parent 10497
(00321) 10545 (00248)
Less than High School 07724 (00365)
06374 (00315)
High SchoolGED 08890 (00335)
07591] (00330)
Some CollegeNo Degree 09565
(00391) 09541
(00445)
Veteran 09251 (00361)
10147 (00425)
Displaced Homemaker 07445 (00553)
na
Public Assistance Recipient 08498
(01070) 07374 (00183)
UI Claimant 12660 (00343)
11763 (00357)
UI Exhaustee 12229 (00537)
13356 (00669)
61
Rapid Response 11022 (00573)
na
Trade Adjustment Assistance 06672 (00195)
na
Supportive Services 11389 (00296)
10804 (00238)
Needs Related Payments 08074 (00590)
09771 (00564)
Pell Grant 09888
(00367) 10677 (00303)
Employed in Quarter Prior to Entry 17985 (00419)
23846 (00467)
State Unemployment Rate 10938 (00197)
12479 (00145)
N = 76769 N = 87038
statistically significant at the 01 level statistically significant at the 05 level statistically significant at the 10 level
LR chi2(31) = 218776 LR chi2(28) = 392665
Prob gt chi2 = 00000 Prob gt chi2 = 00000
Pseudo R2 = 00354 Pseudo R2 = 00524
62
Table B9 Dependent Variable Is Employment Retention (Logistic) Employed in Both 2nd and 3rd Quarters after Exit
Dislocated Workers Adults Odds Ratio (Std Er) Odds Ratio (Std Er)
State ETP Policies
ETP Waiver 21579 (00958)
13613 (00465)
Local ETP Flexibility 14870 (00525)
09437 (00287)
No Minimum Criteria 15727 (00583)
22464 (00753423)
Reciprocal Agreement 09893
(00269) 12106 (00264)
Non‐Approved Providers on ETP List 16701 (00473)
11483 (00251)
Moderating Factors
Less than 50 Colleges 10469 (00270)
13723 (00294)
Provider Difficulties 07049 (00230)
08524 (00229)
Performance Data Difficulties 07500 (00220)
09469 (00221)
State ITA Cap andor Duration Limit 30973 (01392)
24617 (00907)
Participant Demographics Program Participation WIA Services and State Economic Conditions
Male 09572 (00151)
08419 (00132)
Hispanic 09395 (00241)
09523 (00210)
Black 09016 (00171)
08537 (00134)
Age 45 and Older 08104 (00128)
08394 (00162)
Disabled 09244 (00395)
09041 (00311)
Limited English Speaker 09819
(00341) 10912 (00418)
Single Parent 09787
(00204) 10811 (00174)
Less than High School 08370 (00271)
09011 (00294)
High SchoolGED 10584 (00261)
10646 (00289)
Some CollegeNo Degree 10381
(00280) 10850 (00317)
Veteran 09600
(00263) 10352
(00307)
Displaced Homemaker 09778
(00546) na
Public Assistance Recipient 08132 (00713)
07949 (00143)
UI Claimant 11084 (00207)
12103 (00242)
UI Exhaustee 10667 (00336)
11094 (00379)
Rapid Response 11110 (00380)
na
63
Trade Adjustment Assistance 09906
(00218) na
Supportive Services 10138
(00173) 11059 (00166)
Needs Related Payments 10585
(00554) 11721 (00474)
Pell Grant 09638
(00253) 11253 (00217)
Employed in Quarter Prior to Entry 13922 (00238)
14476 (00199)
State Unemployment Rate 18533 (00224)
17684 (00162)
N = 56914 N = 98947
statistically significant at the 01 level statistically significant at the 05 level statistically significant at the 10 level
LR chi2(31) = 459434 LR chi2(28) = 651586
Prob gt chi2 = 00000 Prob gt chi2 = 00000
Pseudo R2 = 00410 Pseudo R2 = 00478
64
Table B10 Dependent Variable Is Credential Attainment (Logistic)
Credential Attainment Dislocated Workers Adults
Odds Ratio (Std Er) Odds Ratio (Std Er)
State ETP Policies
ETP Waiver 1362047 (00791268)
1503802 (00738823)
Local ETP Flexibility 1192903 (00659165)
1086719 (00501626)
No Minimum Criteria 05889517 (00287845)
06303801 (00259187)
Reciprocal Agreement 08038859 (00308537)
07688012 (00231051)
Non‐Approved Providers on ETP List 0821864 (00305776)
09212954 (00285404)
Moderating Factors
Less than 50 Colleges 04160928 (00140744)
04844944 (00134903)
Provider Difficulties 1299758 (00581351)
1232921 (00414332)
Performance Data Difficulties 1266055 (00551611)
1041325 (00344193)
State ITA Cap andor Duration Limit 09075297 (00493752)
1084563 (00488886)
Participant Demographics Program Participation WIA Services and State Economic Conditions
Male 1005608
(00212931) 1085944 (00246675)
Hispanic 1093782
(00513149) 09649167
(00388968)
Black 07993544
(0018882) 07013264 (00149626)
Age 45 and Older 09955974
(00212589) 1100156 (00318527)
Disabled 07362801 (00401095)
08082321 (00354811)
Limited English Speaker 08514039 (00464474)
118101 (0072862)
Single Parent 08863159 (00245004)
0912994 (00203986)
Less than High School 06698799
(0029513) 05059487 (00258618)
High SchoolGED 1019497 (00357656)
07162731 (00323194)
Some CollegeNo Degree 09854497 (0037551)
09135837 (0043865)
Veteran 1138998 (0042114)
1013603 (00424255)
Displaced Homemaker 105
(00805919) na
Public Assistance Recipient 1383428
(03138145) 08666843 (00236469)
UI Claimant 09576332
(00261938) 09458527 (00279275)
UI Exhaustee 09994911 (004076)
09224048 (00416234)
Rapid Response 1056595
(00585217) na
65
Trade Adjustment Assistance 06781054 (00195372)
na
Supportive Services 1372909 (00356113)
1217608 (00276749)
Needs Related Payments 0995449
(0071319) 1137914 (00746525)
Pell Grant 07821315 (00249322)
08035012 (00200784)
Employed in Quarter Prior to Entry 1166207 (00257534)
1060353 (00207686)
State Unemployment Rate 09488461 (00152725)
1245677 (00135518)
N = 61849 N = 66887
statistically significant at the 01 level statistically significant at the 05 level statistically significant at the 10 level
LR chi2(31) = 526781 LR chi2(28) = 476857
Prob gt chi2 = 00000 Prob gt chi2 = 00000
Pseudo R2 = 00761 Pseudo R2 = 00649
66
Table B11 Simple Correlation Table of Key ETP Variables
ETP Waiver
Local ETP Flexibility
No Minimum Criteria
Reciprocal Agreement
Non‐Approved Providers on ETP List
Less than 50 Colleges
Provider Difficulties
Performance Data Difficulties
State ITA Cap andor Duration Limit
ETP Waiver 10000 Local ETP Flexibility
03122 10000
No Minimum Criteria
08616 01860 10000
Reciprocal Agreement
‐01913
‐00706 ‐01565 10000
Non‐Approved Providers on ETP List
02007 ‐01193 00604 ‐01565 10000
Less than 50 Colleges
‐00162
02238 ‐01560 ‐00828 05457 10000
Provider Difficulties
‐03945
03500 ‐04166 00005 ‐02594 00115 10000
Performance Data Difficulties
01471 ‐00257 01581 ‐06642 02673 02579 01571 10000
State ITA Cap andor Duration Limit
‐08093
‐01594 ‐07884 01216 ‐02303 ‐00038 05835 ‐01118 10000
67
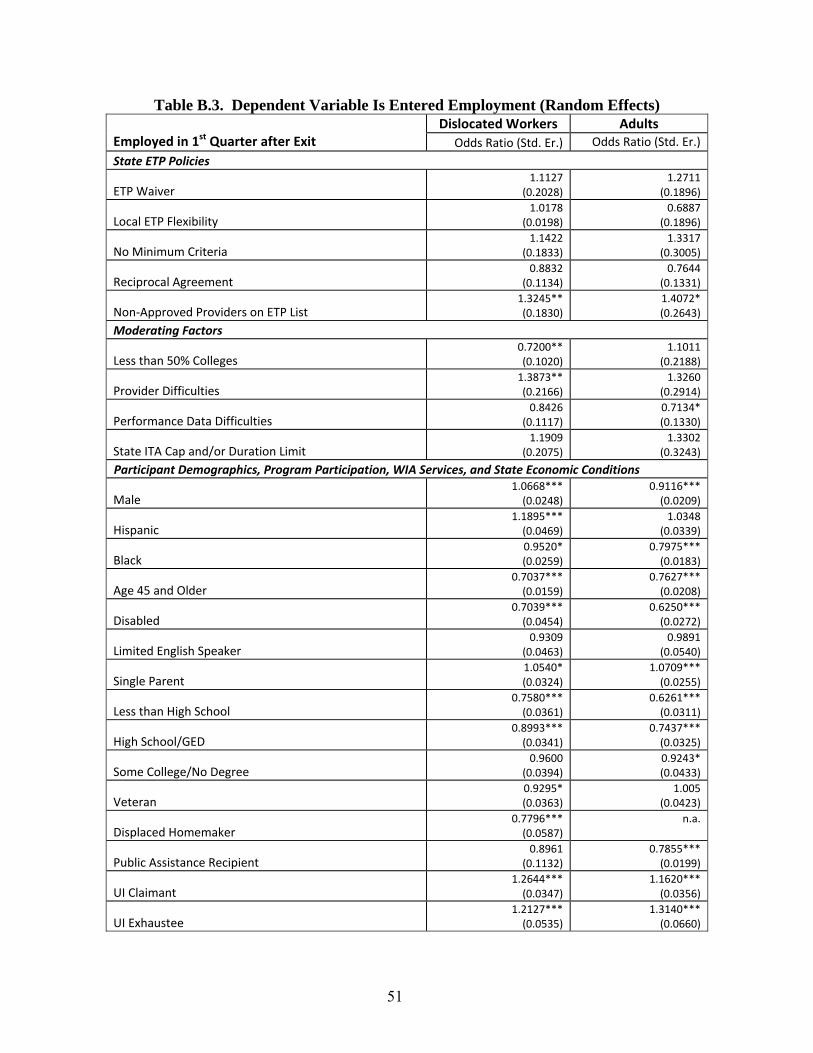
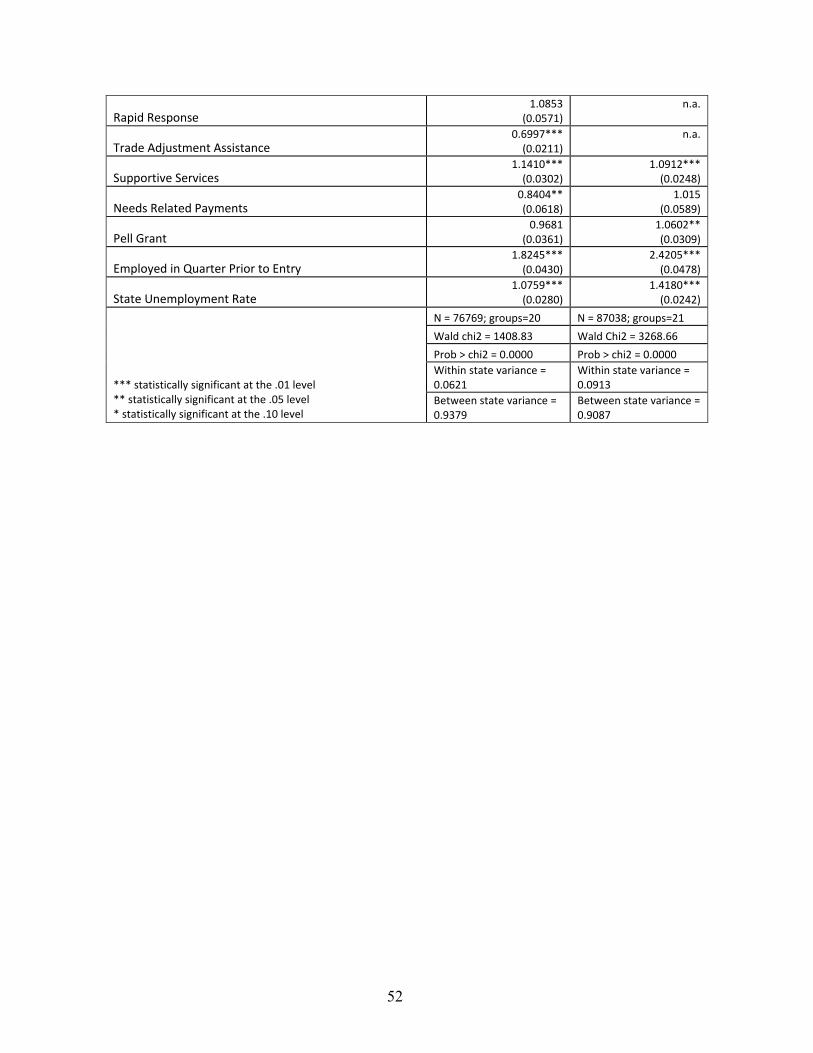
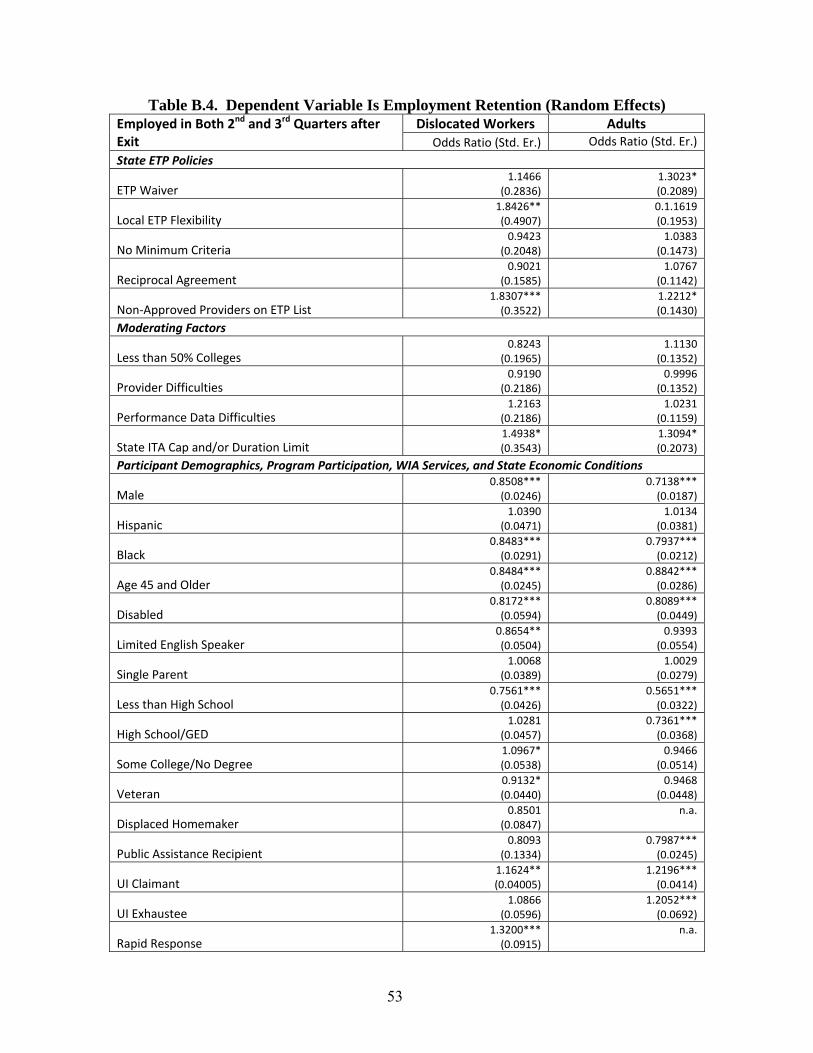
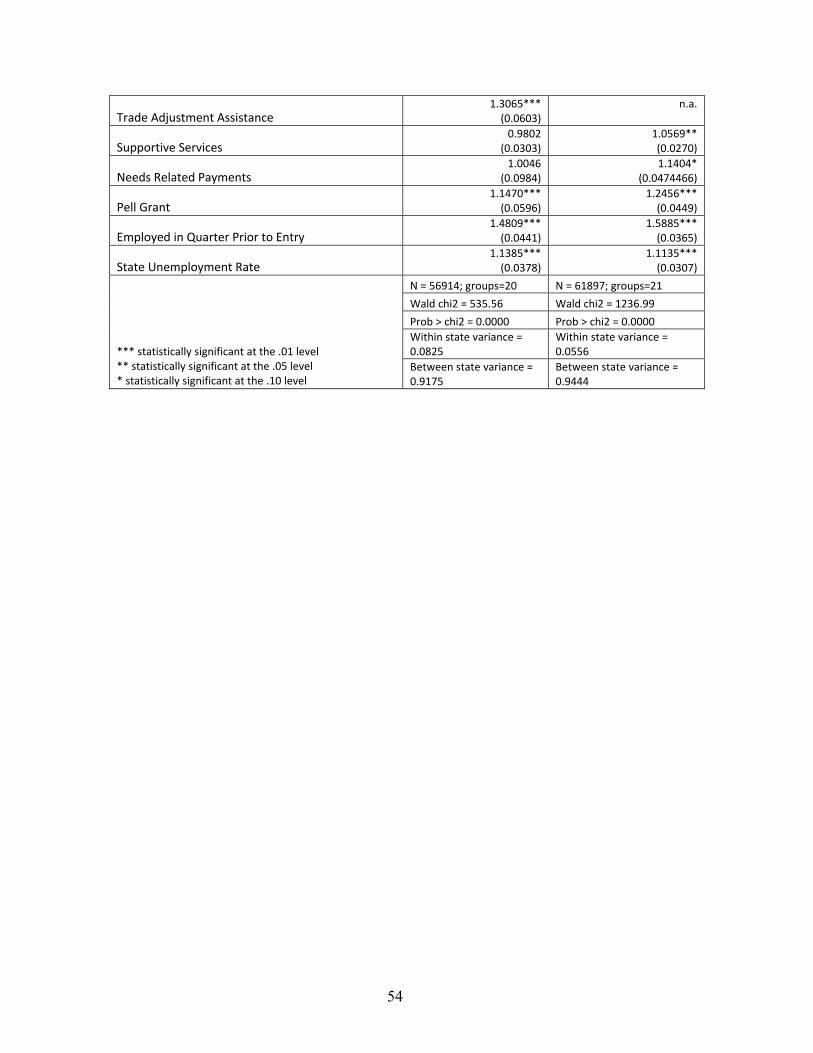
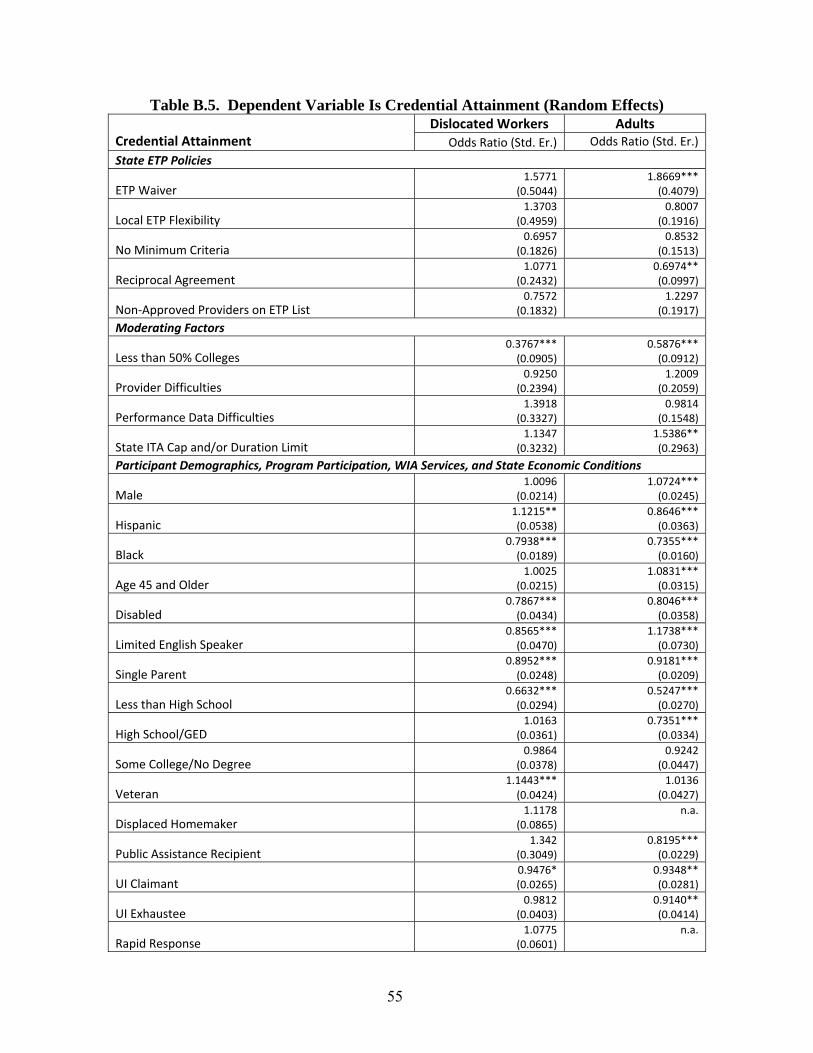
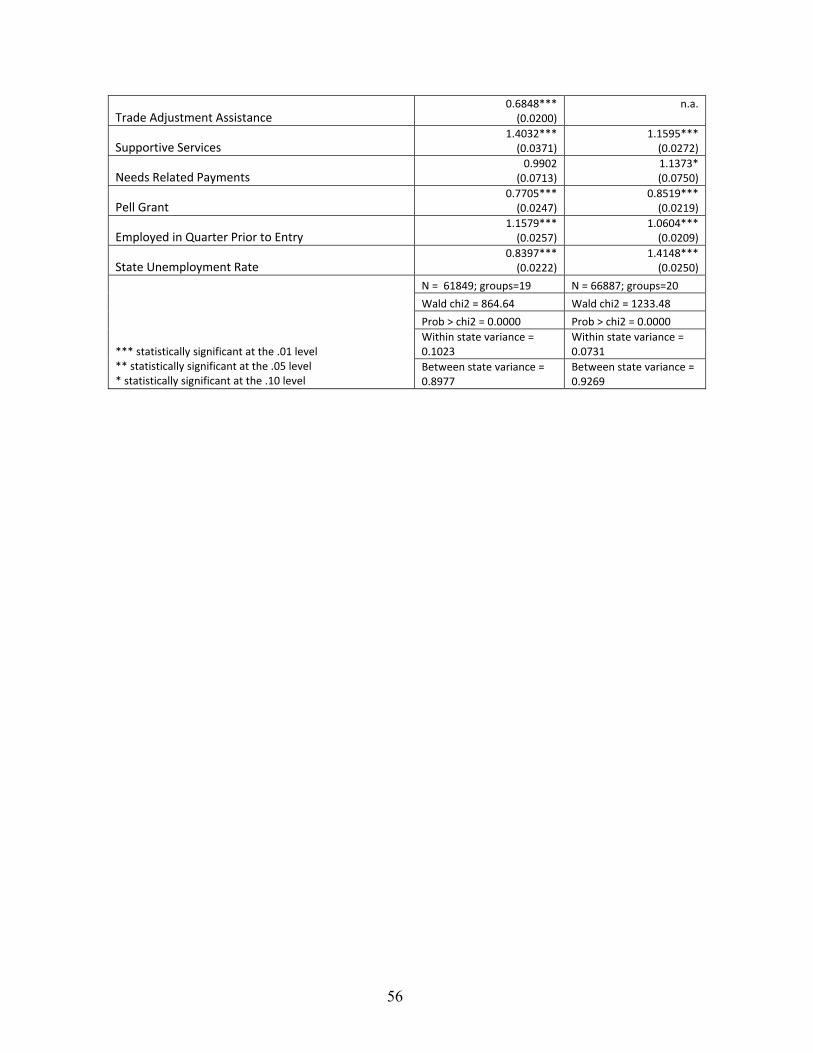
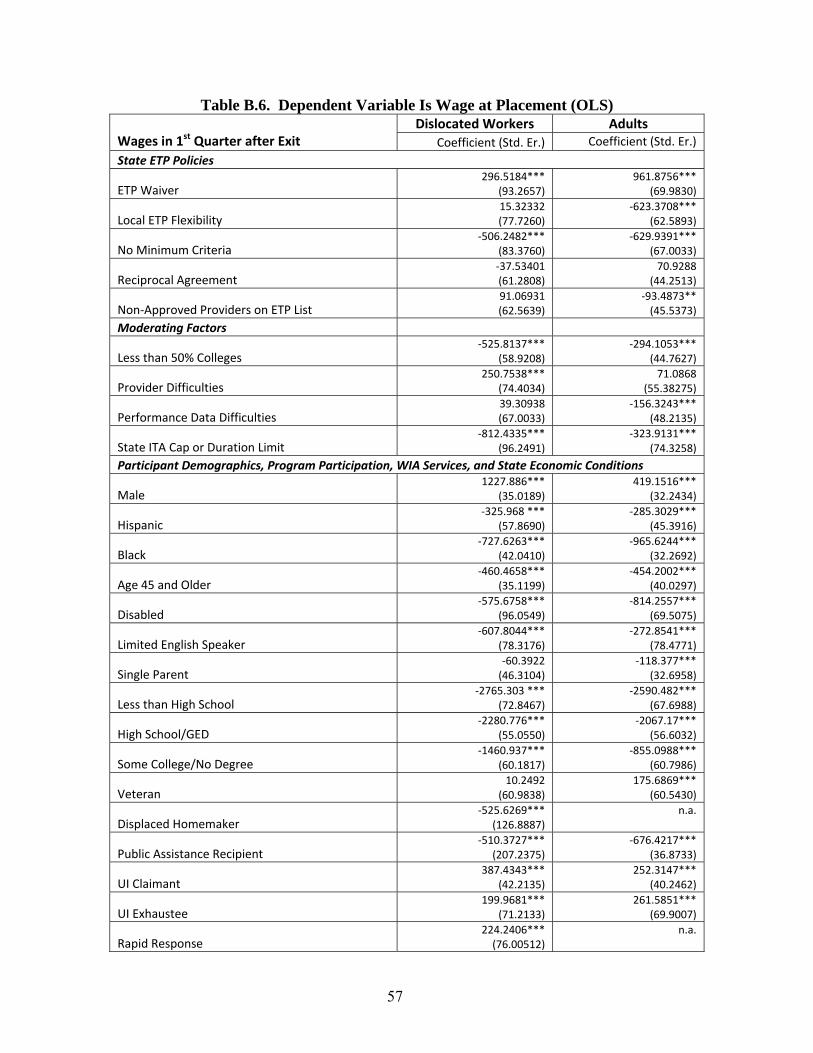
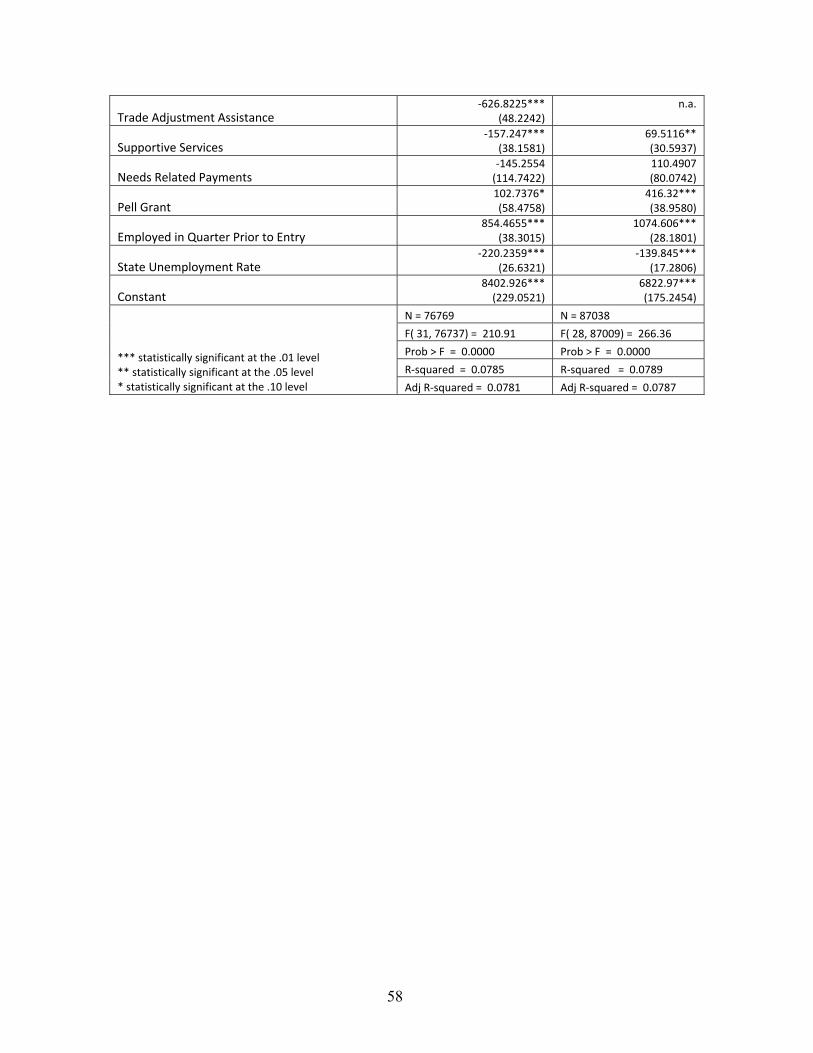
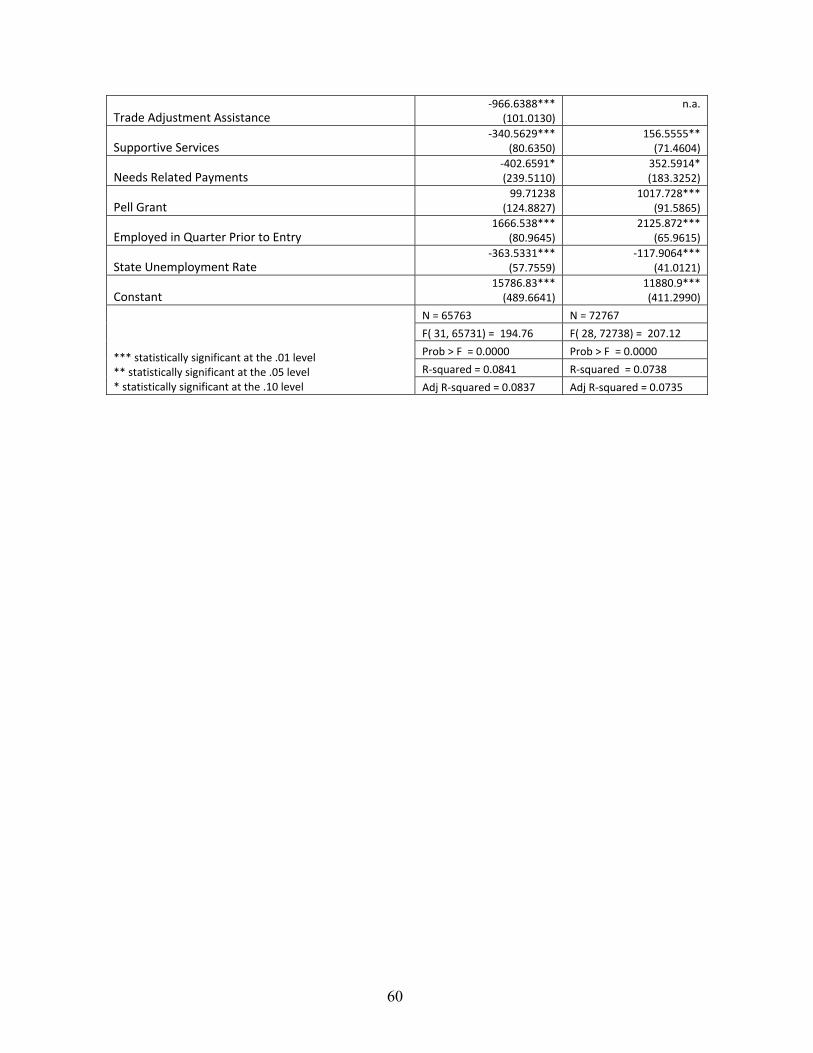
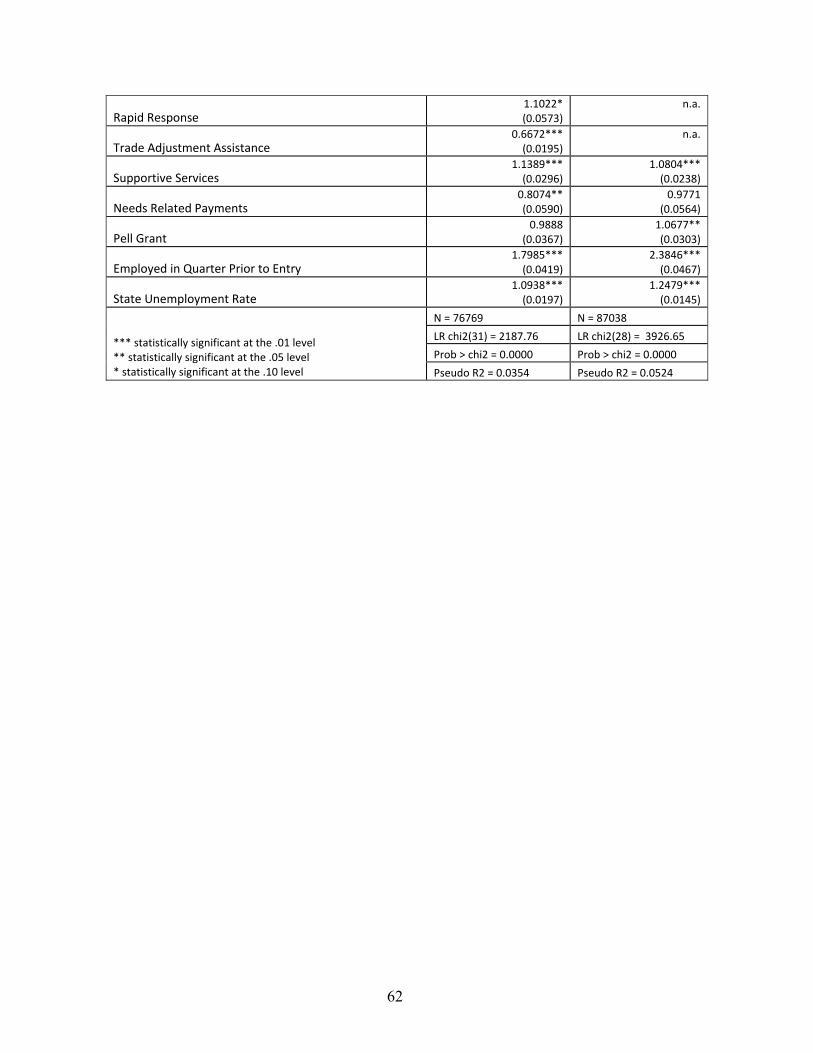
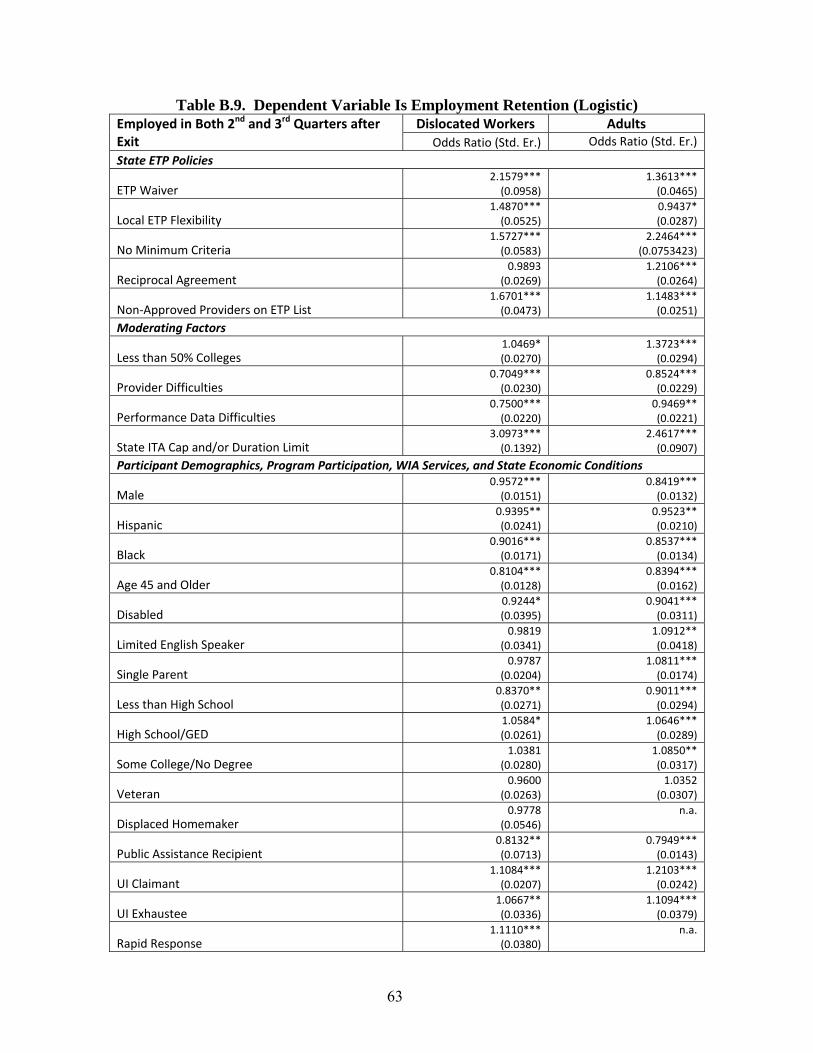
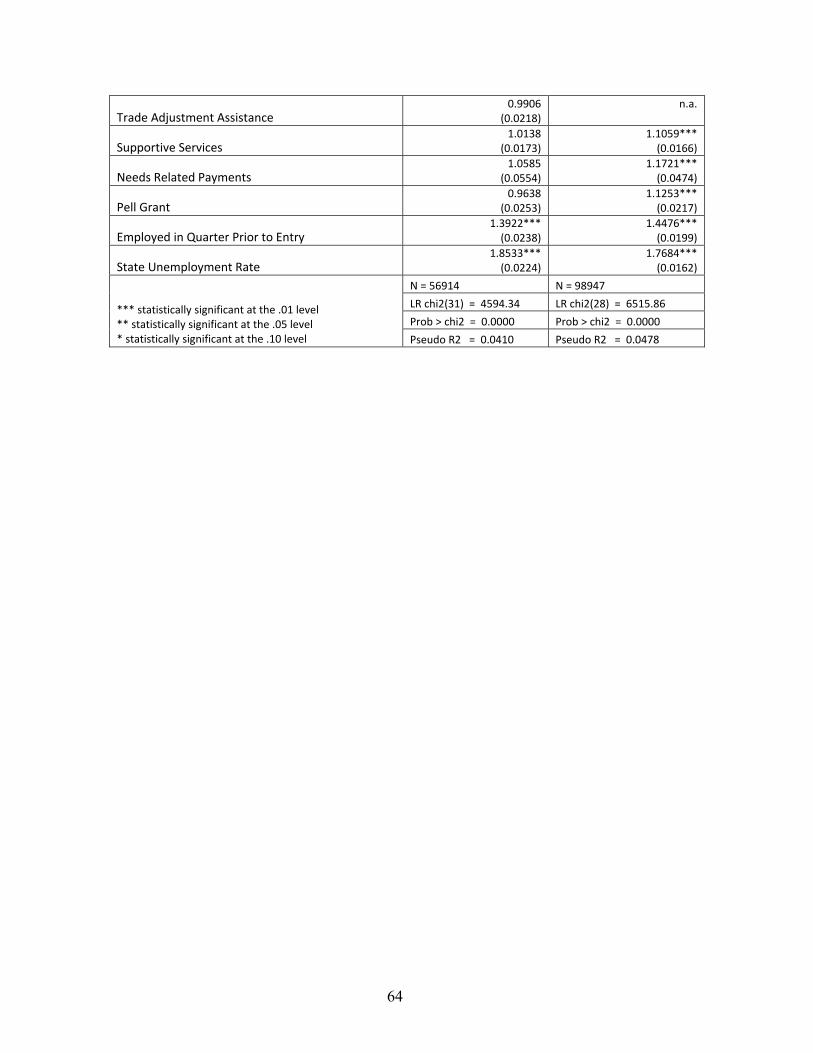
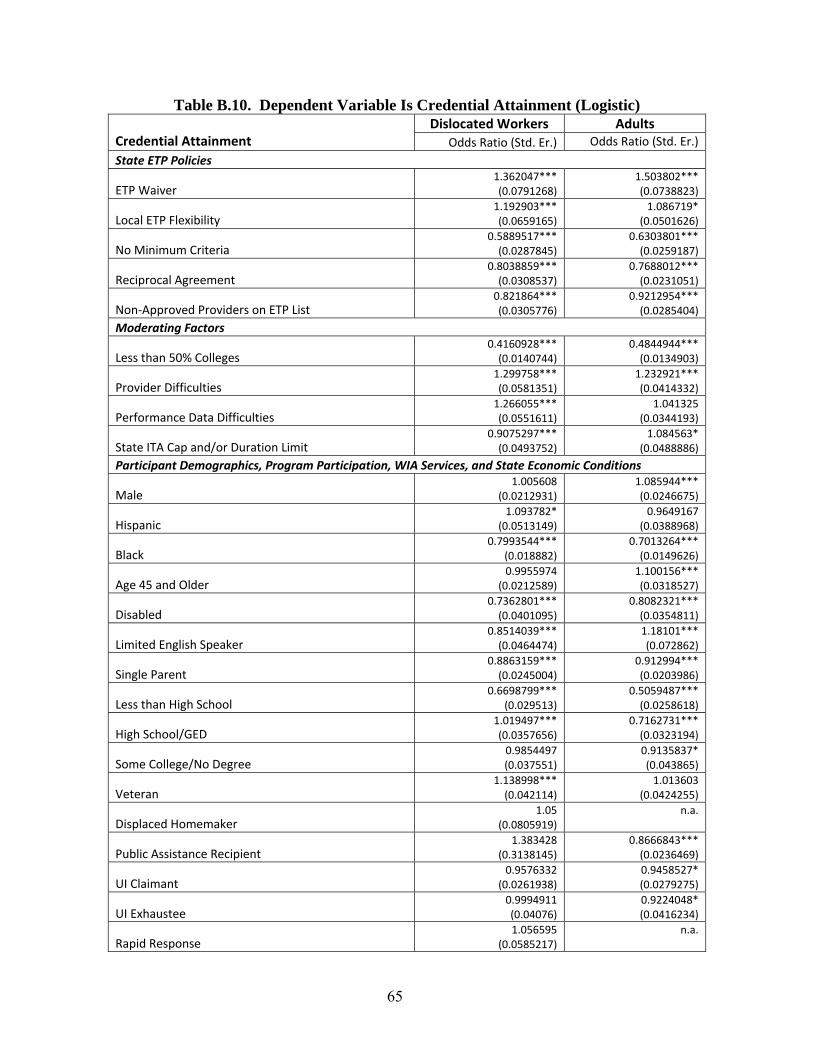
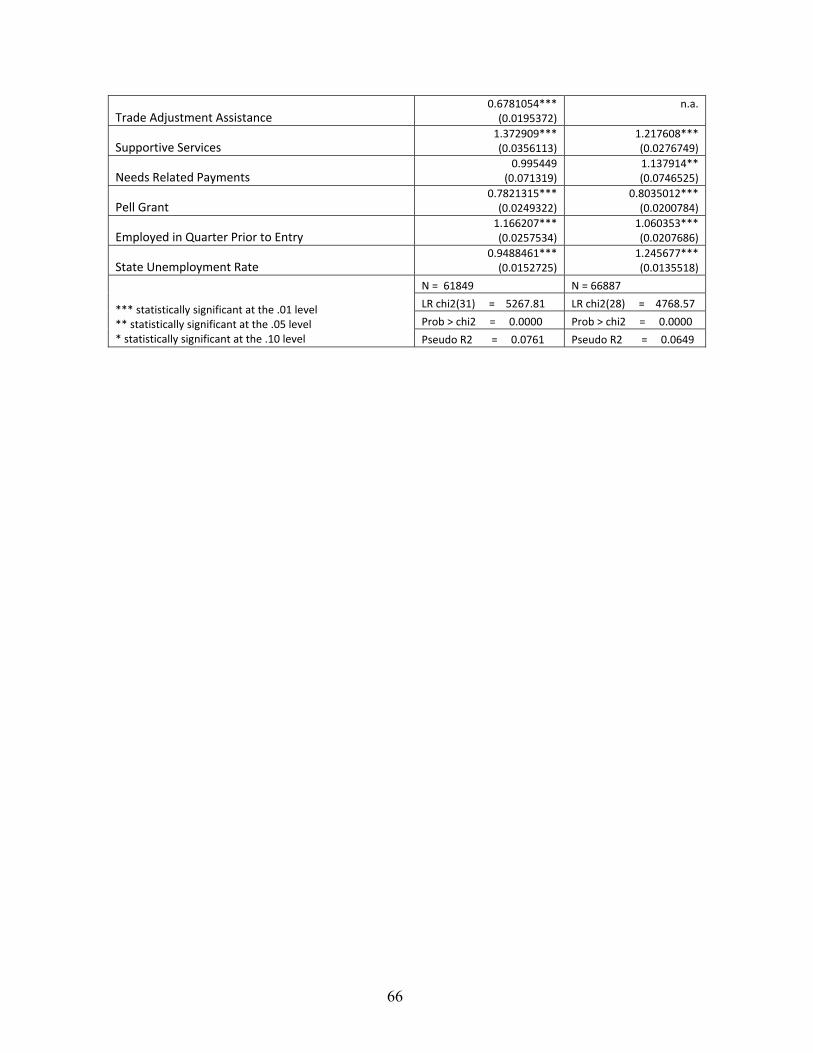
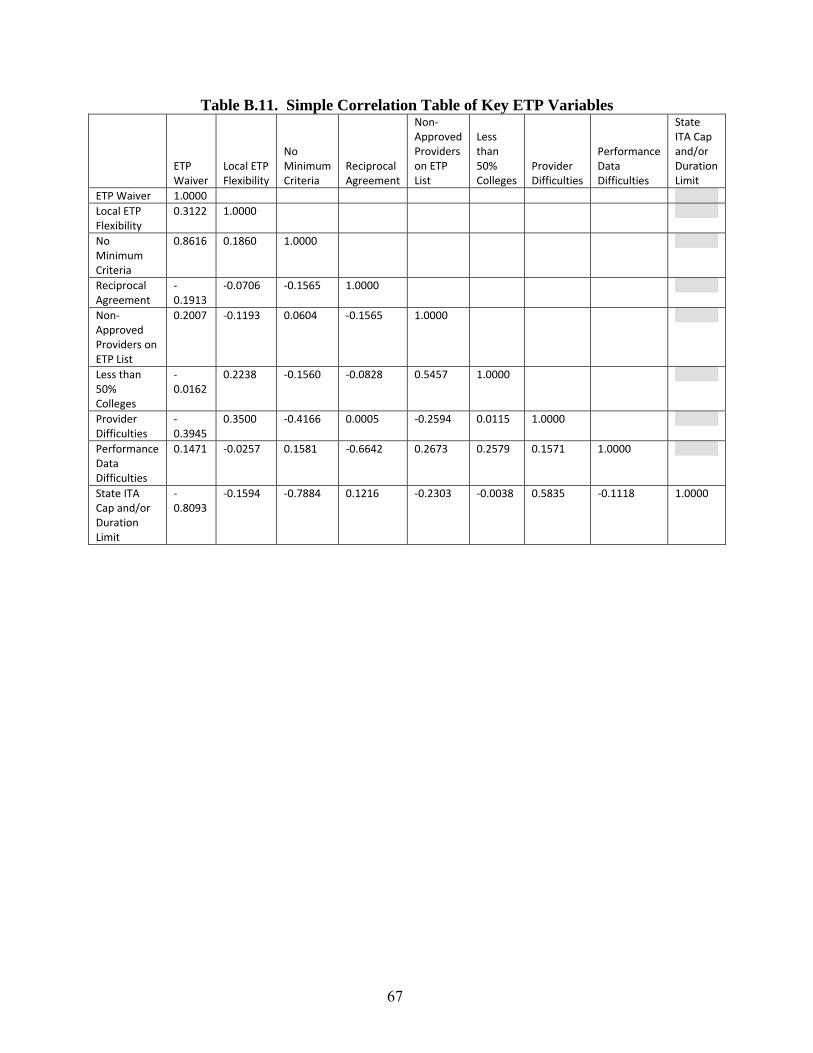