Embed Size (px)
Citation preview

ENTERPRISE ASSET MANAGEMENT
Meeting tomorrow’s challenges: How Enterprise Asset Management keeps transit rollingPublic transit is widely considered an essential service in medium and large urban areas in the
United States and Europe. Yet the sector is chronically underfunded, faces a substantial shortfall
in maintenance funding, and is largely an afterthought for strategic investment. In both markets,
the largest share of transit services is concentrated in a relatively limited number of larger cities,
reflecting a historical predisposition toward private vehicles as well as the larger critical mass of
population and transit demand required to sustain a more extensive system.
No enterprise has unlimited financial resources. But when funding is notably short, it becomes
even more important to make optimal use of every dollar, pound, or Euro, and of every asset in
an organisation's inventory. For transit agencies, this challenge points directly to the connection
between operational efficiency and a more strategic approach to enterprise asset
management.
1Perspectives: Enterprise Asset Management Solutions
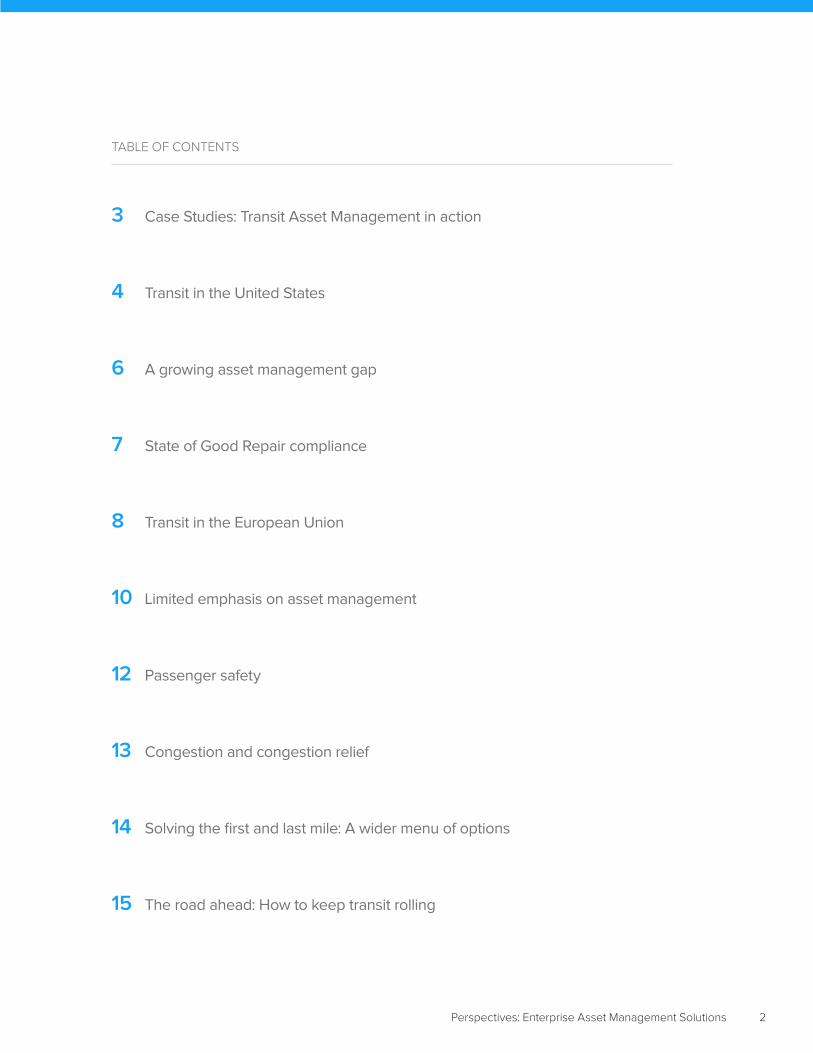
TABLE OF CONTENTS
3 Case Studies: Transit Asset Management in action
4 Transit in the United States
6 A growing asset management gap
7 State of Good Repair compliance
8 Transit in the European Union
10 Limited emphasis on asset management
12 Passenger safety
13 Congestion and congestion relief
14 Solving the first and last mile: A wider menu of options
15 The road ahead: How to keep transit rolling
2Perspectives: Enterprise Asset Management Solutions
Case Studies: Transit Asset Management in action When assets are complex and expensive, a strategic
approach to transit asset management is essential to control
costs; optimise reliability, safety, and operational efficiency;
manage the design and implementation of new capital
projects or equipment acquisitions; and get the most out of
every asset throughout its life cycle.
The following case studies are examples of the current state
of play in applying that rule to transit asset management.
■ With 19,000 employees across 242 locations and
350 separate maintenance contracts in place, Cincinnati-
based First Transit used a company-wide enterprise asset
management (EAM) solution with built-in mobile capability
to cut parts expenses 3-4% per year over
10 years, while empowering technicians to suggest process improvements and cost savings.
■ The San Francisco Municipal Transportation Agency
(SFMTA) introduced a 25-year EAM life cycle to standardise practices and processes, support compliance with State of Good Repair (SGR) standards, break
down departmental siloes, and encourage and
reward innovation.
■ ScotRail uses cloud-based EAM to optimise the reliability of
the 292 trains it operates across eight different suburban,
regional, and intercity fleets, representing
92% of Scotland’s rail network. The system boosts visibility across a diverse inventory of rolling stock, enabling the company to manage planned and corrective maintenance, boost productivity, and improve reliability.
■ Vancouver’s TransLink has been refining and enhancing its EAM system since 1994. The system has evolved through multiple customisations and generations of software to serve a system with 935 buses on 14 different chassis, 6,700 employees, and 385 million boardings in 2016.
■ The Shenzhen Municipal Metro Group in Guangdong province, China, uses EAM to integrate its maintenance and asset management systems and improve operational control of its organisational structure, processes,
key performance indicators, routine reporting, and information technology.
The bigger picture: A history of incremental gains Not so long ago, the state of the art in transit asset
management was as simple and challenging as sharing
practices, manuals, and definitions. In 2005, the U.S. Federal
Transit Administration (FTA)’s Transit Cooperative Research
Program (TCRP) saw the need to directly encourage transit
operators to document their bus maintenance practices and
share them with other agencies.
“People involved in maintenance of transit buses must
frequently address issues for which no internal written
maintenance practices are available,” wrote consultant
John Schiavone of the Transit Resource Center in Guilford,
CT. Then when they do, “the results of such efforts are not
typically shared with the rest of the transit industry,” leading
to significant duplication of effort.
In that period, recalled one veteran U.S. asset management
consultant, manufacturers were often the only source of
advice or solutions when transit authorities ran into problems
with the equipment they had acquired. Some manufacturers
or vendors would refer customers to other users that had
reported similar problems. Others, seeking to minimise
the risk of litigation, were sometimes less forthcoming.
Maintenance managers might glean essential guidance from
service bulletins, or from hallway conversations at industry
conferences. But in an era before national databases or
even the most rudimentary online discussion boards, transit
operators would sometimes improvise their own predictive
maintenance programs, pulling vehicles off the road to
proactively replace key components with known problems
rather than have them fail in service.
Peer learning and information-sharing is now a much more
established practice, and if front-line maintenance teams
can track a specific condition in which a piece of equipment
fails, manufacturers are often willing and eager to learn from
the user community. But spotting and acquiring the best
equipment and components is a continuing challenge.
3Perspectives: Enterprise Asset Management Solutions
On the whole, even as practices have evolved and improved
over the last decade, there is ample scope for agencies to
gather new knowledge, develop more effective systems,
optimise their asset management investments, and improve
operating performance. However:
■ Transit systems in the United States and the European
Union lack sufficient funds to meet their current
maintenance needs or keep up with projected or
accelerated growth in customer demand.
■ While there is some recognition of the potential for
a more integrated, enterprise-wide approach to transit
asset management, understanding and application
appear to be inconsistent.
■ At present, this gap is most urgent for larger transit
authorities operating older networks. But that means
the more established agencies are just a bellwether for
more recent arrivals. There is no area of infrastructure
investment where any manager can ever assume that
all needs have been permanently addressed. Even the
newest installation should be subject to a preventive
maintenance plan, to anticipate the reality that it will
inevitably deteriorate and eventually fail, without consistent
preventive or predictive maintenance.
■ Cities, transit operations, and surrounding transportation
networks are being transformed by changes in technology,
systems, environmental standards, and customer
expectations that would have been unimaginable in years
past. If agencies are already scrambling to keep up with
today’s demands, it stands to reason that they will need
every possible advantage—including state-of-the-art
enterprise asset management systems—to embrace a
more dynamic, demanding business environment that may
attach higher value to effective transit services.
Transit in the United StatesIn 2015, users in the United States took 10.6 billion trips on
various modes of transit, according to the American Public
Transit Association. FTA’s National Transit Database listed
897 urban transit providers, 778 of them cities, counties,
transit authorities, non-profits, or planning organisations. FTA
reported that those agencies’ operating budgets grew 41.8%,
from $31.3 to $44.4 billion, between 2007 and 2015, with the
federal government covering less than 10% of operating but
about 42% of capital costs.
U.S. transit volumeAmerica’s transit system today is largely an embodiment
of the 80-20 rule, with the greatest share of activity and
business potential flowing from a small proportion of
agencies. A list of the country’s 16 top transit agencies by
2011 trip volume, drawn from DOT’s ranking of 42 Urbanised
Areas (UZAs) with populations over a million as of 2010,
shows that the country’s transit leaders broke into three tiers:
■ The New York-Newark metropolitan area.
■ A half-dozen cities with volume above or just below
400 million trips per year.
■ Three communities with annual volume in the range
of 100 to 200 million trips, two of which ranked higher
for transit ridership than they did for population.
The 42 communities in the DOT ranking accounted for only
8.6% of UZAs in the United States, but 62.5% of the urban
population, 88.4% of the transit passenger miles travelled,
and more than four times the trips per capita. This cross-
section shows that demand for transit—and for the enterprise
asset management services that keep transit systems up
and running—is more likely to reflect local planning choices
than current population levels. The Washington, Boston, and
San Francisco metropolitan areas had transit ridership out
of proportion to their populations, while Miami, Dallas-Fort
Worth-Arlington, and Houston were at the opposite end of
the scale.
4Perspectives: Enterprise Asset Management Solutions
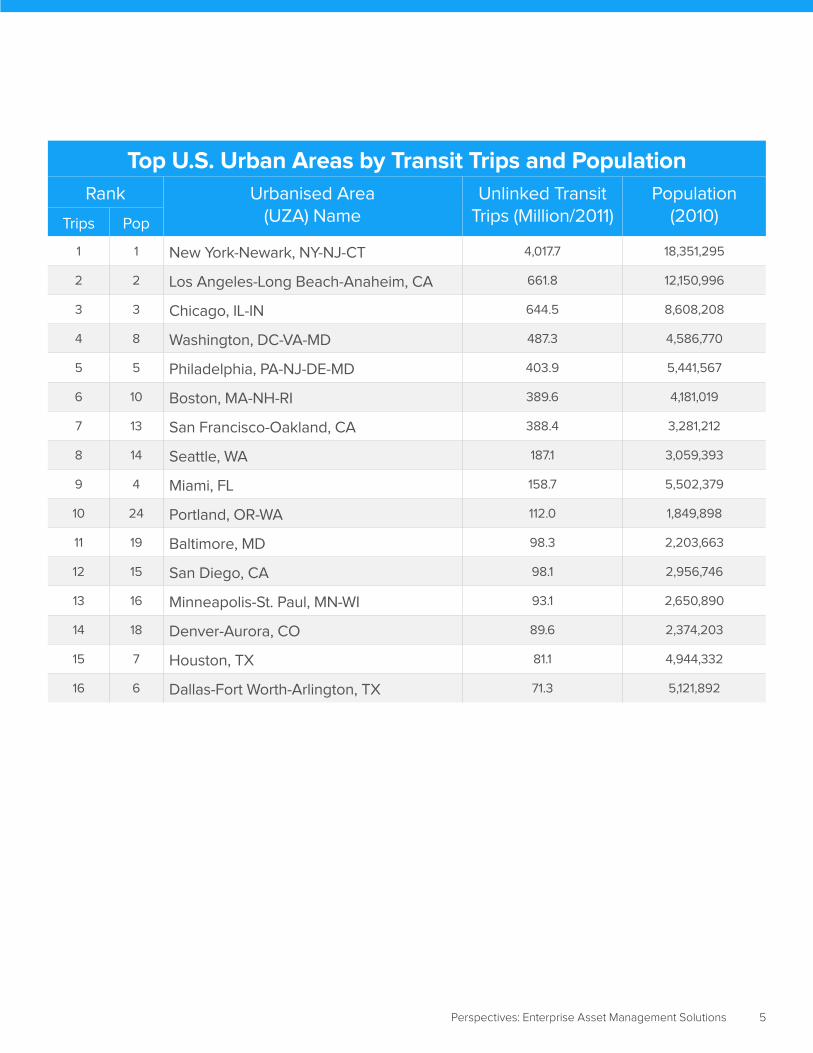
Top U.S. Urban Areas by Transit Trips and Population
Rank Urbanised Area (UZA) Name
Unlinked Transit Trips (Million/2011)
Population (2010)Trips Pop
1 1 New York-Newark, NY-NJ-CT 4,017.7 18,351,295
2 2 Los Angeles-Long Beach-Anaheim, CA 661.8 12,150,996
3 3 Chicago, IL-IN 644.5 8,608,208
4 8 Washington, DC-VA-MD 487.3 4,586,770
5 5 Philadelphia, PA-NJ-DE-MD 403.9 5,441,567
6 10 Boston, MA-NH-RI 389.6 4,181,019
7 13 San Francisco-Oakland, CA 388.4 3,281,212
8 14 Seattle, WA 187.1 3,059,393
9 4 Miami, FL 158.7 5,502,379
10 24 Portland, OR-WA 112.0 1,849,898
11 19 Baltimore, MD 98.3 2,203,663
12 15 San Diego, CA 98.1 2,956,746
13 16 Minneapolis-St. Paul, MN-WI 93.1 2,650,890
14 18 Denver-Aurora, CO 89.6 2,374,203
15 7 Houston, TX 81.1 4,944,332
16 6 Dallas-Fort Worth-Arlington, TX 71.3 5,121,892
5Perspectives: Enterprise Asset Management Solutions

A growing asset management gapWith U.S. transit demand outpacing growth in both
population and vehicle miles travelled since 1995, what
all of these agencies and communities are likely to have
in common is a large and growing funding gap for asset
management and maintenance. “Over the past 20 years,
U.S. public ridership has risen 39%, far outpacing the
21% rise in U.S. population,” wrote Richard White, acting
president and CEO of the American Public Transit
Association. But “many transit agencies haven’t been able
to expand capacity to keep up with this spreading demand.
What’s more, several of the nation’s older, most well-used
systems are under the greatest stress, beset by aging
equipment and service interruptions that can challenge
the best-run transit agencies.”
Writing in 2016, White cited 2010 data in FTA’s 2013
assessment that listed 40% of the country’s buses and
25% of its rail transit assets in marginal or poor condition,
adding up to an $86-billion backlog in equipment
replacement and deferred maintenance. After that, “the
nation would have to invest $43 billion annually to improve
system performance and condition to accommodate an
anticipated 2.4% annual growth in transit passenger-miles,”
or more if the growth in public demand exceeds current
projections. On the other hand, improved maintenance
performance between 2004 and 2012 was reflected in a
21% increase in the average number of miles between
failures across all modes.
In its 2016 Conditions & Performance Report, which
reported 2013 data, the FTA calculated that 31.4% of
guideway elements, 15.1% of transit agency systems,
4.8% of maintenance facilities, 4% of vehicles, and 2.1%
of stations were in a poor state of repair.
White points to municipalities as a powerful potential ally in
making the case for reversing the maintenance and asset
management gap. Transit “represents a powerful strategic
advantage as they strive to attract business investment
and talent, strengthen their economies, and deliver on the
promise of an outstanding quality of life,” he writes.
Transit Asset Management in the United StatesThe resources on the FTA’s Transit Asset Management
(TAM) website reflect a largely tactical approach to
maintenance and repair, suggesting either the FTA’s
expectation or the on-the-ground reality that most local
transit agencies are at a fairly rudimentary stage in their own
TAM planning.
“The large transit agencies are concerned about the
consequences of under-investment, but use asset
management systems that are elementary and limited,”
stated a 2011 report by the U.S. Transportation Research
Board’s Transit Cooperative Research Program (TCRP).
“Most agencies have systems that track all assets and are
frequently updated; however, these systems have limited
ability to estimate the consequences of not making asset
replacements when needed. The systems also lack the
ability to test the impacts and consequences of different
funding scenarios.
This approach contrasts with a presentation to the FTA’s First
State of Good Repair Roundtable in 2009, which pointed
toward the highway community’s much broader definition of
asset management:
Transportation Asset Management is a strategic and systematic process of operating, maintaining, improving, and expanding physical assets effectively throughout their life cycle. It focuses on business and engineering practices for resource allocation and utilisation, with the objective of better decision-making based upon quality information and well-defined objectives.
6Perspectives: Enterprise Asset Management Solutions
“For many, ‘asset management’ is synonymous with a single
component, such as maintenance management,” stated
presenter Rick Laver. But “true asset management provides
a broader, multidisciplinary, and agency-wide perspective
on the optimal long-term management of capital assets.”
He urged an approach that:
■ Is strategic and long-term, not tactical
■ Balances the competing needs of operations, maintenance, reinvestment, and system expansion
■ Operates across the organisation, integrating perspectives from planning, engineering, funding, and IT
■ “Seeks to make informed and prioritised decisions regarding the use of scarce resources based on reliable data.” (emphasis added)
Laver contrasted this vision of a more integrated, strategic
approach to asset management with traditional maintenance
functions that are typically carried out by different staff
teams, covering different periods of analysis, with insufficient
coordination, and performed in different ways by different
agencies. His presentation focused on the asset inventory
and current condition data required for capital inventory
planning, and the decision support tools that could help asset
managers “conduct ‘what-if’ analyses and better predict and
prepare for future outcomes.”
He encouraged transit agencies to learn from the more
sophisticated asset management approaches that were
taking shape in the highway community. “State DOTs,
AASHTO (the American Association of State Highway
and Transportation Officials), and the Federal Highway
Administration (FHWA) have been applying and refining
highway asset management concepts for more than a
decade,” his presentation stated, and “while highway
practices are still not fully ‘matured’, the highway community
is well out front of transit for TAM implementation.”
As recently as 2014, TCRP still saw the need to publish
a more basic, step-by-step guide to developing a transit
asset management plan, suggesting that agencies were
operating across a continuum from tactical to more strategic
TAM approaches.
State of Good Repair complianceState of Good Repair entered the U.S. transit lexicon in July
2012 with the adoption of the Moving Ahead for Progress
in the 21st Century Act (MAP-21). The FTA identifies “helping
transit agencies maintain bus and rail systems in a State of
Good Repair (SGR)” as one of its highest priorities. In its
fact sheet on SGR formula grants, the FTA describes the
program as its first stand-alone initiative written into law that
is dedicated to repairing and upgrading the nation’s rail
transit systems, along with high-intensity motor bus systems
that use high-occupancy vehicle lanes, including bus rapid
transit (BRT).
The fact sheet lists a variety of investments that qualify for
80% federal support under the SGR program, including
development and implementation of transit asset
management plans.
FTA’s final TAM rule took effect on October 1, 2016. It defines
transit asset management as the strategic and systematic
practice of procuring, operating, inspecting, maintaining,
rehabilitating, and replacing transit capital assets to manage
their performance, risks, and costs over their life cycles, for
the purpose of providing safe, cost-effective, and reliable
public transportation.
Some of the support for that planning activity comes from
the American Public Transit Association, which works
with member agencies on a consensus basis to develop
standards and recommended practices.
APTA’s recommended practice guide, Creating a Transit
Asset Management Program, positions TAM as a response
to the federal SGR initiative and places it at the intersection
of agency strategies for managing performance, assets,
and risk.
7Perspectives: Enterprise Asset Management Solutions
The Association’s Defining a Transit Asset Management
Framework to Achieve a State of Good Repair lists minimum
components of a TAM framework, including:
■ An accurate asset inventory, covering “all asset
procurements, implementations, and disposals”
■ A condition assessment, to provide an overall measure
of SGR
■ A system of asset performance measures, to assess each
asset’s adequacy for its intended purpose and compare
planned and actual operation
■ Life cycle cost tracking, as a basis for comparing asset
management strategy options
■ Financial planning, to identify funding needs and
communicate them to stakeholders
■ Continuous improvement, to assess and increase
the effectiveness of the program itself
■ Risk evaluation, based on the criticality of each asset
The industry consultant cited earlier in this paper warned
that federally-mandated SGR will fail if it seeks to define a
single best practice for all transit agencies, from the large,
integrated systems in Los Angeles and New York to rural
operators with one or two vans. Rather than specifying
quantitative targets—like a 14-year lifespan for a streetcar—
that are bound to be arbitrary, the consultant said SGR could
much more productively focus on the process of life cycle
planning, and the human resource management at the heart
of a working system.
The consultant also pointed to the irony of a federal
framework that resorts to financial penalties for transit
authorities that consistently miss their targets—a rule that
ends up targeting the agencies in greatest need of financial
resources to meet a higher asset management standard,
which then fall farther behind and lose more ridership and
revenue. An underlying challenge is that new equipment
or infrastructure is a much more newsworthy investment
that lends itself far better to a high-profile ribbon cutting than
a new maintenance building or TAM system. The problem
is that, the more often those ribbon cuttings take place,
the more urgent it will be to get a TAM system in place
and operational.
APTA’s guidance on TAM frameworks cites information
technology as “a vital tool that transit operators should
employ as part of an overarching asset management
strategy, with ‘management’ being the key word.” It cautions
that “acquisition and installation of an asset management
software system is not sufficient in and of itself to validate
that a transit operator is in fact doing a good job of asset
management. Software should be viewed as a tool, much like
any other tool used by staff executing physical maintenance,
upgrade, or replacement projects.”
Over the past several months, the precise place or priority
of SGR and TAM initiatives has been in flux. Messaging as of
April 2017 focused on infrastructure investment at the federal
level, and continuity for many state and local programs
that treat transit as an essential priority. What is certain is
that the need to maintain and upgrade fleets and physical
infrastructure will be a continuing reality that transcends
politics and partisanship.
Transit in the European UnionThe European Union’s International Association of Public
Transport (UITP, or Union Internationale des Transports
Publics) reports that 2014 “saw the highest number of local
public transport journeys in the 28 EU Member States since
the turn of the millennium,” with urban and suburban public
transport systems carrying about 185 million passengers on
the average working day and “providing the backbone of
urban mobility in many EU cities.” Out of 57.6 billion journeys
across the EU in 2014, the association reports 9.34 billion
on metro networks, 8.38 billion on trams and light rail,
and 7.84 billion on suburban railways.
The broad policies guiding transportation infrastructure
investment in the EU seem to give only secondary
attention to urban transit networks, apart from an interest in
“seamless door-to-door mobility” (p. 23) and processes to
support urban mobility planning (pp. 25-26). On the other
hand, EU Cohesion Policy could be a “substantial source
of investments in clean urban transport” through 2020,
according to a 2015 working paper for the EU Directorate-
General for Regional and Urban Policy that introduced a new
methodology for comparing transit access across cities. EU
data show no consistent correlation between the population
of a metropolitan area and the modal share taken up by
public transport.
8Perspectives: Enterprise Asset Management Solutions
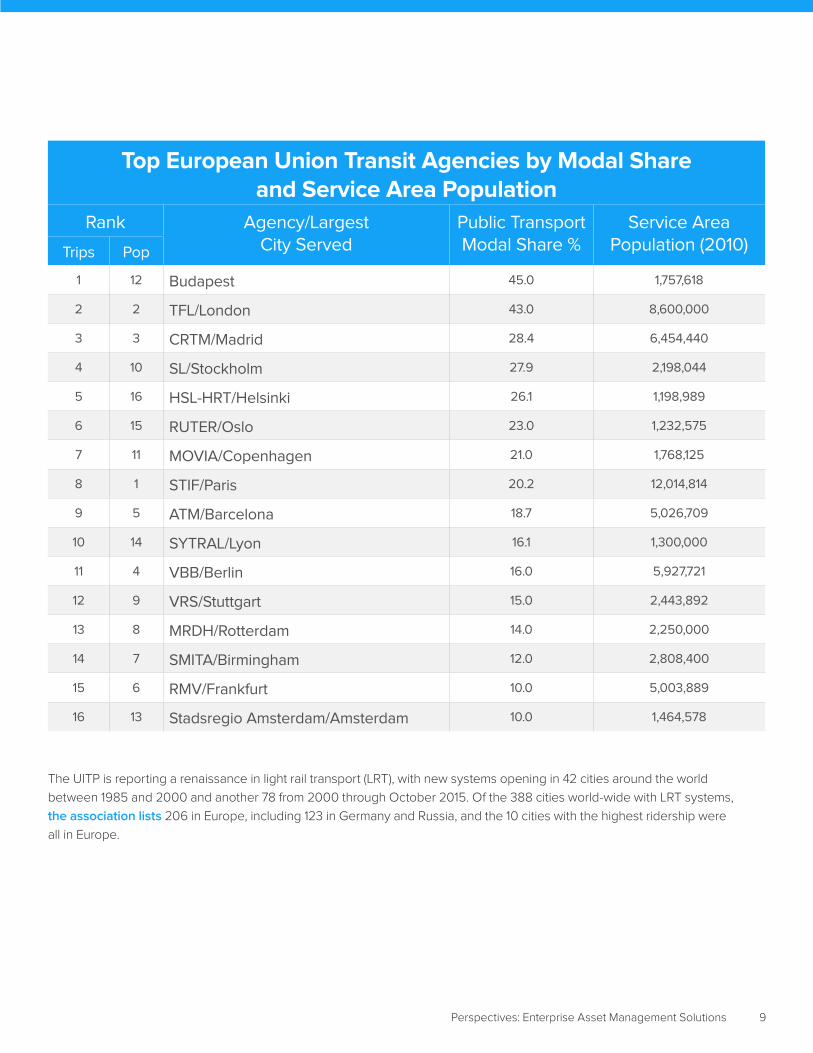
Top European Union Transit Agencies by Modal Share and Service Area Population
Rank Agency/Largest City Served
Public Transport Modal Share %
Service Area Population (2010)Trips Pop
1 12 Budapest 45.0 1,757,618
2 2 TFL/London 43.0 8,600,000
3 3 CRTM/Madrid 28.4 6,454,440
4 10 SL/Stockholm 27.9 2,198,044
5 16 HSL-HRT/Helsinki 26.1 1,198,989
6 15 RUTER/Oslo 23.0 1,232,575
7 11 MOVIA/Copenhagen 21.0 1,768,125
8 1 STIF/Paris 20.2 12,014,814
9 5 ATM/Barcelona 18.7 5,026,709
10 14 SYTRAL/Lyon 16.1 1,300,000
11 4 VBB/Berlin 16.0 5,927,721
12 9 VRS/Stuttgart 15.0 2,443,892
13 8 MRDH/Rotterdam 14.0 2,250,000
14 7 SMITA/Birmingham 12.0 2,808,400
15 6 RMV/Frankfurt 10.0 5,003,889
16 13 Stadsregio Amsterdam/Amsterdam 10.0 1,464,578
The UITP is reporting a renaissance in light rail transport (LRT), with new systems opening in 42 cities around the world
between 1985 and 2000 and another 78 from 2000 through October 2015. Of the 388 cities world-wide with LRT systems,
the association lists 206 in Europe, including 123 in Germany and Russia, and the 10 cities with the highest ridership were
all in Europe.
9Perspectives: Enterprise Asset Management Solutions

Limited emphasis on asset managementThe available literature reveals no coherent policy support
for Transit Asset Management, or any equivalent, in the
EU. The UITP’s overview of its Integrated Global Work
Programme lists six strategic priorities, but contains no
reference to maintenance or asset management, not even
as a funding issue. The agenda for the association’s 2017
maintenance and asset management training did include
segments on the fundamentals of asset management, life
cycle planning and costing, and predictive maintenance
of facilities and fleets.
The future is demanding… and disruptiveThe disruptive change and emerging opportunities facing
transit and transportation dictate a more strategic approach
to future planning, veteran analyst Todd Litman of the
Victoria Transport Policy Institute argues in a November 2016
sector review.
LRT system with the highest number of annual passengers (Millions)
“Good planning does not simply extrapolate trends, it
investigates underlying factors that cause change,” Litman
writes. “Transportation professionals help create the future,
so it is important that we consider the overall context of long-
term planning decisions.”
Litman foresees a series of changes ahead, some of them
unprecedented and many of them under-recognised by most
research, that could quickly and drastically shift individual
and community demand for transportation modes other than
private vehicles. He lists an array of factors that influence
travel demand, including demographics, incomes,
geographic location, travel speed (which has increased
24-fold since 1888), the availability of transportation options, and new technologies, many of which “conventional analysis tends to overlook or undervalue.”
Against this backdrop, Litman is sharply critical of “official
predictions” that do little more than extrapolate past trends
into the future. “These models assume that recent vehicle
travel declines are temporary, caused by recent fuel price
spikes and the global financial crisis, so in the near future
VMT [vehicle miles travelled] will grow at similar rates as in
the past,” he writes.
400 Budapest
Vienna
Bucharest
Prague
St. Petersburg
Warsaw
Moscow
Cologne
Zurich
Zagreb
350
300
250
200
150
100
50
0
10Perspectives: Enterprise Asset Management Solutions
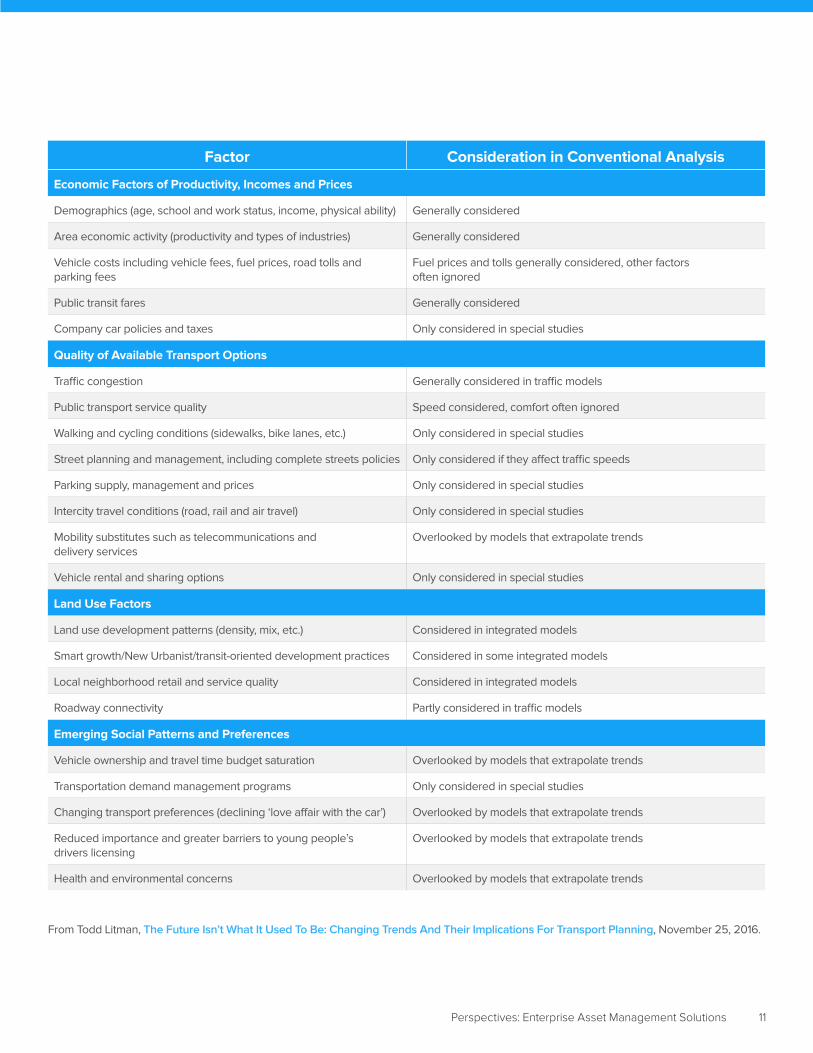
Factor Consideration in Conventional Analysis
Economic Factors of Productivity, Incomes and Prices
Demographics (age, school and work status, income, physical ability) Generally considered
Area economic activity (productivity and types of industries) Generally considered
Vehicle costs including vehicle fees, fuel prices, road tolls and parking fees
Fuel prices and tolls generally considered, other factors often ignored
Public transit fares Generally considered
Company car policies and taxes Only considered in special studies
Quality of Available Transport Options
Traffic congestion Generally considered in traffic models
Public transport service quality Speed considered, comfort often ignored
Walking and cycling conditions (sidewalks, bike lanes, etc.) Only considered in special studies
Street planning and management, including complete streets policies Only considered if they affect traffic speeds
Parking supply, management and prices Only considered in special studies
Intercity travel conditions (road, rail and air travel) Only considered in special studies
Mobility substitutes such as telecommunications and delivery services
Overlooked by models that extrapolate trends
Vehicle rental and sharing options Only considered in special studies
Land Use Factors
Land use development patterns (density, mix, etc.) Considered in integrated models
Smart growth/New Urbanist/transit-oriented development practices Considered in some integrated models
Local neighborhood retail and service quality Considered in integrated models
Roadway connectivity Partly considered in traffic models
Emerging Social Patterns and Preferences
Vehicle ownership and travel time budget saturation Overlooked by models that extrapolate trends
Transportation demand management programs Only considered in special studies
Changing transport preferences (declining ‘love affair with the car’) Overlooked by models that extrapolate trends
Reduced importance and greater barriers to young people’s drivers licensing
Overlooked by models that extrapolate trends
Health and environmental concerns Overlooked by models that extrapolate trends
From Todd Litman, The Future Isn’t What It Used To Be: Changing Trends And Their Implications For Transport Planning, November 25, 2016.
11Perspectives: Enterprise Asset Management Solutions
“Such projections are proving to be inaccurate, yet the
models are often not corrected to reflect underlying factors
that affect travel demands.”
Litman draws favorably from a 2012 study, How Not to Predict
Traffic, in which analyst Clark Williams-Derry argues that:
“Running a linear regression, with no other information for
context, is a nonsensical way to make a forecast of the future.
Instead, a real estimate of future traffic would look at macro-
economic forecasts, land use projections, future gas prices
and fleet mpg, population growth, population age structure,
recent trends by age and demographic groups, and a host
of other factors. Even with all of that baked in, of course, a
forecast will almost certainly be wrong; very few predictions,
even the most sophisticated and thoughtful, hit their mark.”
Long-term visions and projections published by transit
associations in the United States and the European Union
tend to anticipate the future at a similarly broad level, without
drilling down to operational issues facing local or regional
transit agencies.
The American Public Transportation Association’s 2050
vision argues that North American “population trends, urban
growth trends, energy trends, environmental trends, and
economic trends all point favorably to a ripe, robust future
for public transportation.” As elements of its 2050 narrative, it
points to population, urbanisation and placemaking, internal
migration, demographic shifts, climate change
and sustainability, and public demand for accessibility
and mobility options as key drivers of a multi-modal,
interconnected transportation system.
The International Association of Public Transport’s latest
assessment of public transport trends cites many of the same
emerging issues, along with a globalised economy
in which the BRICS nations (Brazil, Russia, India, China, and
South Africa) lead the growth in public transport, while Africa
and the ASEAN countries (Brunei, Cambodia, Indonesia,
Laos, Malaysia, Myanmar, Philippines, Singapore, Thailand,
and Vietnam) assume greater prominence.
“Besides challenges linked to quantitative growth, public
transport must make significant qualitative improvements in
order to become more attractive,” UITP states in its executive
summary of the trends report. “Customers expect the
same kind of lifestyle services and connectivity from public
transport vehicles and stations as they already have in their
own environment and living space.”
The notion of quality in public transport “should also be
created through operational excellence, which includes
enhanced frequency, punctuality, and reliability of the service
thanks to optimised network design and service
performance,” the association adds. The summary notes that
technology-driven services like smart ticketing and integrated
travel information “contribute to making public transport
customer/user-friendly, while facilitating accessibility for all
citizens.”
All of these future visions point to two questions that could
have major implications for transit demand, and for the scope
of the asset management challenge confronting transit
agencies (with or, more likely, without adequate funds to
respond): How quickly and how far will transit demand
increase in different urban centers? And which forms of
disruption will be most influential in shaping tomorrow’s
transit systems and answering broader questions about land
use and modal mix? The least that can be foreseen is that
transit agencies will have to make absolute best use of every
physical asset at their disposal, and every financial resource
available for operations and maintenance.
In brief, here are some of the specific trends and challenges
that will shape or reshape transit agencies’ operations in the
years ahead.
Passenger safetyPassenger safety is the most basic gold standard for any
transportation agency. In the United States, transit agencies
are required to report any safety or security events that
involve any one of nearly a dozen outcomes, including:
■ A death that results within 30 days of the incident
■ Injuries that call for immediate medical attention
or transport
■ Estimated property damage of at least US$25,000
■ Collisions that require a transit vehicle to be towed
from the scene
Between 2008 and 2015, U.S. transit agencies logged
46,432 major events, 83% of them on some mode other
than rail, according to the FTA’s National Transit Summary
& Trends 2015.
12Perspectives: Enterprise Asset Management Solutions
The U.S. transit sector reported 255 deaths in 2015, 170
of them involving the public, and another 67 involving
customers who were not on board vehicles at the time of the
incident. At the most basic level of operational effectiveness,
a sound maintenance strategy for equipment and
infrastructure is a cornerstone of the effort to prevent safety
risks for transit customers, staff, and the general public.
Congestion and congestion reliefPersistent congestion is the defining feature of too many
commuters’ daily relationship with the mobility infrastructure
they depend on. The Texas Transportation Institute
calculated that the average U.S. driver wasted an average
of 41 hours in traffic in 2012, for an astonishing all-time high
of 6.7 billion hours across the population. In its White Paper
on Transport, the European Union cites congestion as one
of a handful of factors, alongside looming climate change
and (at the time) rising oil prices, as factors warranting a
“radical overhaul” of the continent’s transport system. With a
“business as usual” response, it states, “congestion costs will
increase by about 50% by 2050.”
Transit has obvious potential as a form of congestion relief,
if only based on the sheer number of private vehicles taken
off the road when their occupants choose to travel by bus
or rail instead. In that sense, keeping transit systems in a
state of good repair is a lynchpin for any of the underlying
values attributed to congestion relief: from convenience
and time savings, to lower commuting costs, to air quality
improvements and greenhouse gas reductions due to
reduced idling and vehicle miles traveled (balanced against
the higher environmental impact of diesel vehicles).
With a wide variety of congestion relief solutions on the
immediate horizon, asset management will be just one of
the areas where transit authorities will be called to respond
with greater creativity and efficiency. In different parts of
the United States, transportation providers have looked at
synergies between bus rapid transit and price-managed
lanes, transportation apps, and even electrically-powered,
vertical take-off and landing (VTOL) vessels to relieve
highway congestion. The first two could represent significant
opportunities for transit agencies, while Uber’s VTOL initiative
may emerge as a long-term threat to their market share.
Urban design and transit-oriented developmentFor years, a combination of economic, social, and
environmental factors has been driving urban planning
philosophies and practices in the direction of more compact,
higher-density development. As cities and suburbs seek
to improve air quality, reduce greenhouse gas emissions,
boost local economies, ensure community safety, encourage
walking and biking, and build a deeper sense of community
around vibrant neighborhoods and town centers, they’re
finding synergies and interdependencies with transit.
Cities in the U.S. and Canada, Latin America, Europe, Asia,
and Oceania have introduced transit-oriented development
(TOD) policies and strategies to reduce citizens’ dependence
on private vehicles and encourage wider use of transit.
In its Great Communities Toolkit, the San Francisco
Foundation’s Great Communities Collaborative notes that:
“In a compact neighborhood, stores have enough local
customers to stay in business, transit systems have enough
riders to justify the public investment, and parks have people
strolling through keeping the neighborhood safe. Community
services including child care, medical offices, banks, and
post offices also have branch locations frequented by people
living within walking, biking, or transit distance.
Key to making the connection between TOD and housing
is the built-in ridership provided by a variety of compact
housing types, from apartments, to condominiums, to starter
homes. Locating compact development next to transit often
results in improved service, as transit agencies can justify the
improvements based on consistent ridership levels.”
A Harvard University study also identified transit as “the
single strongest factor in the odds of escaping poverty,” the
New York Times reported in 2015. “The longer an average
commute in a given county, the worse the chances of low-
income families there moving up the ladder.”
As more municipalities embrace TOD—as an end in itself,
or in support of broader community objectives—transit
agencies’ ability to maintain or expand services and maximise
cost-effectiveness will clearly depend on optimising the
management of every asset available to them.
13Perspectives: Enterprise Asset Management Solutions
Solving the first and last mile: A wider menu of optionsA persistent challenge for transit is to solve the “first mile/last
mile” problem, a reference to the ground a user has to cover
between their home or workplace and the nearest transit
stop. Transit-oriented development seeks to address the
issue by locating the densest built areas within a quarter- to
half-mile radius (400 to 800 meters) of central transit stops, a
distance that is considered suitable for pedestrians.
In the absence of broader TOD strategies, transit agencies
typically try to address first mile/last mile with park-and-ride
lots. But now, ride-hailing service Uber is highlighting its
ability to offer “transportation that covers every mile”.
The connection between transit and ride-hailing—and,
soon enough, autonomous vehicles—is new and potentially
disruptive. But the American Public Transit Association is all
for it.
Acting President and CEO Richard White states that:
We cannot restore and expand our public transportation
system without reaching outside of our conventional
agency silos to achieve greater collaboration. We must view
emerging concepts such as ridesharing as accelerators of
positive change, not as competitors. In fact, I contend that
autonomous vehicles (soon the car, and ultimately the bus
and train) will be game-changers for public transportation.
Meanwhile, as noted above, real-time passenger information
(RTPI) systems are driving increases in transit ridership
by taking the guesswork out of the walk (or bike ride, or
rideshare) to the transit stop.
“People with access to real-time transit information have
been shown to spend 15% less time waiting at bus stops than
people without this information,” reports the World Resources
Institute’s (WRI’s) CityFix blog. “A study of Chicago’s bus
routes found that access to real-time transit information
increased average daily ridership by 2%. And a study on
New York City’s bus system found that this information also
led to an increase in ridership, resulting in $5 million per year
in additional fare revenue.”
Here come the dronesMore and more companies and verticals are relying on
drones to monitor equipment and infrastructure, and a
limited number of transit agencies are tapping into the
trend. Trapeze Group, a transit management consultancy in
Mississauga, Ontario, lists drones used to enhance security
surveillance for a light rail network in Jerusalem, combat
graffiti along a large railway line in Germany, and improve the
efficiency of general maintenance along the Union Pacific rail
line in the United States. (The post also links to an article on
a service provider for the Massachusetts Bay Transportation
Authority that uses Google Glass-like augmented reality gear
to optimise maintenance activities.)
In 2016, Infor announced an initiative to apply tethered drone
technology to enterprise asset management projects, noting
that even small applications “can yield a significant impact
for the success of an asset. With a tethered drone’s ability to
perform functions like perch-and-stare, video capture, and
laser scanning, the drone can replace many of the dull, dirty,
and dangerous functions of inspection and compliance.”
14Perspectives: Enterprise Asset Management Solutions
Copyright ©2018 Infor. All rights reserved. The word and design marks set forth herein are trademarks and/or registered trademarks of Infor and/or related affiliates and subsidiaries. All
other trademarks listed herein are the property of their respective owners. www.infor.com.
641 Avenue of the Americas, New York, NY 10011
INFDTP1842138-en-US-0118-1
The road ahead: How to keep transit rolling Caught between growing customer demand, serious backlogs in maintenance funding, disruptive change in mobility patterns,
and potentially significant increases in public and political expectations for expanded service, transit agencies will face a
dynamic but challenging operating environment in the years ahead. The gap between capacity and demand is likely to be
particularly acute in more established communities with older transit systems.
Enterprise asset management could and should be one of the most valuable tools in the transit agency toolbox for meeting
future expectations. But the industry’s approach so far to Transit Asset Management (TAM) or State of Good Repair seems to be
mostly tactical, possibly reflecting a stratification between large and extra-large agencies and the rest of the sector.
As the need for preventive and predictive maintenance becomes ever more obvious, it will be increasingly important for
agencies to identify the information technology systems that can help them plan and execute wider TAM strategies, optimise the
resources available to them for maintenance and repair, make the case for more where necessary, and ensure that all the assets
in their inventories contribute to their core mission to keep transit rolling.
Learn more ›