Embed Size (px)
Citation preview
Enterprise M3 - Enterprise Zone Economic Vision
A Report by Regeneris Consulting
Page 283
13

Enterprise M3
Enterprise M3 - Enterprise Zone Economic Vision
16 March 2017
Regeneris Consulting Ltd www.regeneris.co.uk
Page 284
13

1
Contents Page
Summary - Emerging Enterprise Zone Vision 2
1. The Need for an Economic Vision 4
2. EM3 LEP – Driving the South East Economy 5
EM3’s Growth Priorities 6
3. EM3 Enterprise Zone – Collective Strength, Impact Through Differentiation 8
4. EM3 Enterprise Zone 2042 Vision – Evolution, Quality and Success 11
Balancing Collective Strength and Local Distinctiveness 11
Economic Vision – Exemplifying Success in 2042 11
EM3 Enterprise Zone Economic Vision 11
Scaling of Evolution 12 Principles of EM3 Enterprise Zone Activity 13
Functions of the three Enterprise Zone Sites 13
Basing View: An Innovation District for the M3 Corridor 14 Longcross Park: Internationally Connected Premium Offer 14 Whitehill and Bordon: A New Economic Place 15
5. The Evidence Base: 16
Enterprise Zone Market Areas 16
Current Enterprise Zone Characteristics 17
Basing View (Basingstoke and Deane) 17 Longcross Park (Runnymede) 22 Whitehill and Bordon (East Hampshire) 27
Considering Enterprise Zone Workspace Requirements and Future Needs 32
Appendix A - iGeolise Supporting Data 34
Page 285
13

2
Summary - Emerging Enterprise Zone Vision
ii. The Enterprise M3 Enterprise Zone Vision is a unique one, underpinned by investments in three complementary locations, Basing View, Longcross and Whitehill and Bordon. Through a set of common goals, and mutually beneficial investments it aims to provide a legacy which is of genuine significance to the UK’s economy.
Balancing Collective Strength and Local Distinctiveness
iii. In order to add maximum value, the economic vision needs to strike a balance between the collective strength of EM3, its brand and growing reputation,; as well as recognising the importance the respective local characteristics and distinctiveness of each of the sites which make up the enterprise zone.
Economic Vision Structure
Source: Regeneris
EM3 Enterprise Zone Emerging Economic Vision
iv. By 2042, through the Enterprise Zone, three new complementary business locations will have been created in Surrey and Hampshire.
v. The Enterprise Zone will provide opportunity to accommodate new international businesses, reinforcing the LEP’s role in one of UK’s most highly skilled and well connected locations. This will further enhance Enterprise M3’s ability to compete for global investment and footloose international businesses.
vi. It will provide the distinctiveness and flexibility to accommodate new sectors which will be fundamental to the UK’s economic evolution. This will mean accommodating new working
Page 286
13

3
practices and providing the spaces and technology which will differentiate EM3 from other locations, making it a beacon for the UK’s new position in the international economy.
vii. The Enterprise will also act as a conduit for the evolution of local activity; accommodating and facilitating local business growth and connecting this to national and international opportunities.
The Function of the Sites
viii. The headline function of the three sites in supporting this vision, is set out below and in more detail in section seven:
Basing View: An Innovation District for the M3 Corridor - A flourishing business ecosystem
– a mix of large and small businesses working together, providing an attractive complement
and ultimately an alternative to Reading and the M4 corridor.
Longcross Park: Internationally Connected Premium Offer – An internationally significant
business destination on the M3-M25 axis, closer to Heathrow than any other Enterprise
Zone.
Whitehill and Bordon: A New Economic Place – A key complement for the establishment
of a vibrant new settlement, incorporating wider regeneration and transformative place-
making, accommodating high growth SME’s from across the region.
Principles of EM3 Enterprise Zone Activity
ix. It is important that the LEP has some clear principles and terms of engagement to support their interaction and activities; particularly, where this relates to each site’s contribution to EM3’s overall economic vision.
x. The remit and make-up of the LEP allows it to play a critical role in ensuring quality; partnership and collaboration; accelerated impact; distinctiveness rather than duplication; functional links and agglomeration; and delivery of the infrastructure which will enable transformational change.
Page 287
13

4
1. The Need for an Economic Vision
1.1 Regeneris was commissioned by Enterprise M3 Local Enterprise Partnership (EM3 LEP), in conjunction with Cushman & Wakefield to develop an economic vision for its Enterprise Zone. This incorporates an appraisal of the future function of the three sites which make up the overall enterprise zone proposal.
1.2 The purpose of the vision is to help guide priority-setting around shared aspirations and provide the foundation for an implementation plan which is being developed by Cushman and Wakefield. In this context, it is crucial decisions undertaken are based on a robust and a collective understanding of local economic strengths and weaknesses, assets and a consensus on future growth priorities.
1.3 This is an important time to establish a LEP-wide consensus view and sense of ambition, setting the scene for a more detailed consideration of the operating principles of the three sites which make up the Enterprise Zone, that will be defined in the outline business case.
1.4 Equally, this is an exciting opportunity for the LEP to consider what can be achieved within a twenty-five-year period. Each site has specific competitive advantages and potential strengths in priority sectors identified in the LEP’s Strategic Economic Plan. The Enterprise Zone will also act as a key conduit for an ongoing discussion with Government, leveraging investment and strengthening links with national policy.
1.5 This report represents a cohesive vision for the future, emphasising an appetite for continued success and building on EM3’s considerable existing strengths. It also reflects a commitment to use Enterprise Zone status to maximise the potential for socio-economic benefit, commercial returns, and wider regeneration impact.
1.6 The document is structured as follows:
EM3 background and strategic context
An introduction to the Enterprise Zone, its constituent parts and the associated benefits
An assessment of each of the Enterprise Zone sites and their respective qualities
A consideration of future workspace requirements relevant to the LEP’s priority sectors
The emerging EM3 LEP Enterprise Zone vision and the potential contribution of each of the three sites to this, through their independent and complimentary functions
Page 288
13

5
2. EM3 LEP – Driving the South East Economy
2.1 EM3 LEP seeks to drive prosperity, economic growth and competitiveness within an area of Surrey and Hampshire covering some 445,000 hectares.
2.2 As part of the wider South East, the LEP makes a major contribution to the UK economy, pioneering sector specialisms and acting as a draw for global business and domestic innovation. EM3 possesses the third highest total GVA contribution, of £51.2bn, higher than any other South East LEP, and is only second in terms of GVA per head.
2.3 The LEP operates within a network of existing economic and regeneration activity, working in partnership to deliver its strategic goals. This cooperation extends to a variety of key stakeholders, including the private sector, local authorities, Government, a network of adjacent LEPs and other economic development delivery agents.
2.4 The LEP’s SEP, published in 2014 (with planned revisions in 2017), outlines EM3’s economic performance, strengths and priority growth sectors, which provide the basis for investment and intervention:
Demographics – a combined population of over 1.6 million people, including a large working age population.
Labour Market – a skilled workforce, sought after by high value employers, with strong levels of employment and economic activity.
Location – adjacent to the London urban area and other regional population centres, intersected by motorways and close to Heathrow Airport.
Knowledge and Innovation Assets – significant educational assets such as Royal Holloway University and the University of Surrey, as well as Surrey Research Park.
Quality of life –locations that frequently rate highly on quality of life indices, with good access to green space, natural assets and landscapes.
The home of businesses large and small –businesses of all sizes, with multinational and SMEs successfully trading in EM3.
A global profile – a reputation for excellence in a highly competitiveness marketplace.
2.5 Also of significance, is the LEP’s governance and relationship with primary delivery partners, such as the private sector and Government. This has translated into a legacy and track record of success. This is evident in the agreed Growth Deals, securing millions of pounds of priority investment for maximum local impact. Major achievements in 2015/16 include:
£148m of Local Growth Funding secured and invested
£13m of launched calls for EU funds
Launched the EM3 Growth Hub
4 established STEM Centres
Commissioned a Strategic Transport Study across 4 LEP areas
2.6 EM3’s reputation for delivery has enabled the establishment of a unique Enterprise Zone, built around three key sites. This provides a new centrepiece to the EM3 offer, reinforcing the LEP’s identity as a place to do business, whilst adding greater incentive and an additional element to the area’s economic competitiveness. With Enterprise Zone status secured, EM3 is well-placed to emphasise its advantages and sites that are complimentary and individually distinctive.
Page 289
13

6
EM3’s Growth Priorities
2.7 EM3’s SEP provides a framework for the LEP’s ambition and priority interventions, over the period 2014-2020. Using an evidence-based approach, it also provides a focus on the sectors that are most important to the area in terms of their existing significance, niche value and growth potential.
Figure 2.1 EM3 LEP Delivery Approach
Source: EM3
2.8 The identified priority sectors, as defined by the SEP, are:
IT & Digital Media
Pharmaceuticals
Aerospace & Defence
Professional & Business Services
2.9 These priorities are complimented by niche sectors that provide EM3 with additional competitive advantages, including Satellite Technologies, 5G, Cyber Security and Advanced Manufacturing. In addition, since 2014 further specialisms have also been identified in Advanced Automotive, Veterinary Medical and Creative Media (Gaming) technology.
2.10 Whilst the SEP draws together an aggregated view of strategic priorities, there are local specialisms, with evidence of clustering specialisms varying by location. This aligns to the Enterprise Zone sites and their potential to accommodate expansion in specific sectors.
2.11 At a local level, there are several complimentary plans that integrate with the SEP and set out local growth ambitions, sector specialisation and a package of priority investments:
Page 290
13

7
Table 2.1 Relevant Local Plans
Plan Overview
Basingstoke and Dean Economic Masterplan
20-year vision ensures a thriving future for those who live/work in the borough
Lays out major proposals for the future, that are needed to attract external investment (transport, business developments)
Used to attract funding and encourage companies to bring jobs to the borough
Borough and District Local Plans
These set the spatial planning strategy for economic development and growth, including considering the opportunity to apply special planning principles to sites
Borough and District Employment Land Reviews
These inform planning policy through an analysis of the supply and demand for employment land, considering projections in employment and housing growth
EM3 Commercial Property Study
Closely aligned to the Employment Land Review, this assesses supply and demand factors impacting the commercial property market, including workspace requirements, quality of stock and population projections
Runnymede Borough Council Functional Economic Area Analysis
Published in This report considers the geographic extent of the ‘functional economic area’ (FEA).
Sets out why Runnymede Borough Council (RBC) needs to identify the extent of this area, and considers what is meant by the phrase ‘functional economic area’ in the context of planning policy.
Runnymede Economic Strategy
Currently in development, with consultation undertaken during summer 2016.
The document will assess the Borough's business performance and prospects, and seek your input to develop the Borough's economic strategy.
Source: EM3, LEP area Borough and District Councils
2.12 Collectively, these plans offer the foundations for the economic vision and assert the conditions needed to make the Enterprise Zone successful.
Page 291
13

8
3. EM3 Enterprise Zone – Collective Strength, Impact Through Differentiation
3.1 EM3 has secured Enterprise Zone status, focussed on three locations. These are:
1) Basing View – Basingstoke (Basingstoke and Deane Borough Council)
2) Longcross Park – Longcross (Runnymede Borough Council)
3) Whitehill and Bordon – Whitehill and Bordon (East Hampshire District Council)
3.2 The map below illustrates the geographical locations of the sites which make up the EM3 Enterprise Zone, in the context of the wider LEP area and neighbouring LEPs and Local Authorities.
Figure 3.1 EM3 Enterprise Zone Map
Source: Regeneris
3.3 Having gained Enterprise Zone status, work is now underway to establish how these sites will evolve and how they can develop complementary activities and specialisms. The EM3 Enterprise Zone Implementation Plan sets out the scale of ambition for each site, clearly presenting the level of expectation and anticipated measures of success in the form of job creation, site regeneration, the development of new space and creation of start-up enterprise.
Page 292
13

9
Figure 3.2 EM3 Enterprise Zone Delivery Ambitions
Source: EM3
3.4 The Enterprise Zone is scheduled to provide the following outputs per the 2016 application1:
211,600 m2 of new employment floorspace
28,000 m2 of refurbished employment floorspace
10,200 jobs
3.5 Each site will make a significant contribution to the EM3 economy, whilst reinforcing the area’s reputation as a first-class destination to invest, do business and ultimately prosper.
3.6 Sites will also support and unlock additional housing and amenity which will help to enable a stronger local labour market and placemaking.
Enterprise Zone Principles and Benefits
3.7 Enterprise Zones remain a cornerstone of the Government’s economic growth strategies, increasing prosperity and targeting investment by:
Providing strong positive financial incentives for local authorities and communities to support and encourage local housing and business growth
Supporting LEPs to establish collaboration between the public and private sector and between different authorities so that economic decisions are more business-led
Substantial planning reform to ensure planning policy supports growth, and wider reductions in regulation, to make it easier to get things done and to drive local enterprise
Greater financial flexibility locally so that there is greater scope to support local economic growth through new instruments such as Tax Increment Financing
Providing direct support through funding streams, to give further help to areas where there are challenges or opportunities for local growth.
3.8 Within these underlying principles are a series of benefits, which define Enterprise Zones.
1 Commercial floorspace values are those quoted in the Enterprise Zone bid; these are subject to revision as the Business Case develops and any necessary revisions are made to net internal areas.
Page 293
13

10
Table 3.1 Enterprise Zone benefits
Incentives
A business rate discount worth up to £275,000 per business, over a five-year period.
All business rates growth within the Enterprise Zone retained by the local area for a period of up to 25 years, for reinvestment in priorities.
Government help to simplify planning approaches such as Local Development Orders.
Government support to ensure superfast broadband is rolled out across the Enterprise Zone through regulation and investment.
Alignment with funding bidding rounds.
DIT support for inward investment or trade opportunities in the zone.
Source: DCLG
3.9 The LEP now finds itself at a stage where it is required to agree the application of the above benefits, influenced by local characteristics, target sectors and collective principles. The visions therefore illustrate the ambition to transform each site into exemplar destinations for business, as landmarks for economic growth and prosperity in the LEP area in 2042.
Page 294
13

11
4. EM3 Enterprise Zone 2042 Vision – Evolution, Quality and Success
Balancing Collective Strength and Local Distinctiveness
4.1 In order to add maximum value, the economic vision needs to strike a balance between the collective strength of EM3, its brand and growing reputation; as well as recognising the importance the respective local characteristics and distinctiveness of each site. This suggests a tiered approach to articulating ambition to ensure the local and regional activities and opportunities are reflected.
Figure 4.1 Economic Vision and Functions Structure
Source: Regeneris
Economic Vision – Exemplifying Success in 2042
4.2 In keeping with the 25-year business rate reinvestment period which is afforded to the Enterprise Zones, respective economic visions are set out below. In each case, Enterprise Zone status offers unique opportunities to support transformation change by 2042.
4.3 It is important to recognise these visions need to function harmoniously and not seek to duplicate or create unwanted internal competition between the component sites.
EM3 Enterprise Zone Economic Vision
4.4 Through the Enterprise Zone, by 2042, three new complementary business locations will have been created in Enterprise M3. They will accommodate at least 10,000 jobs in a quarter of a million square metres of modern commercial space.
4.5 The unique three site zone will provide a breadth of offer that will appeal to a range of sectors and business sizes, unmatched by other Enterprise Zones nationally.
Page 295
13

12
4.6 The Enterprise Zone will capitalise upon the area’s key selling points, harnessing connectivity and a skilled labour market with the strength of the existing business base. Having capitalised upon sub-sector specialisms of international significance, the area will have levered value from 5G developments, cyber security and sustainable technologies to be recognised as one of the UK’s premier hubs of innovation.
4.7 The Enterprise Zone will accommodate new international businesses, reinforcing the LEP’s role in one of UK’s most highly skilled and well connected locations. This will enable Enterprise M3 to compete even more effectively in attracting global investment and footloose international businesses.
4.8 It will provide the distinctiveness and flexibility to accommodate new sectors which will be the fulcrum of the UK’s future economic evolution. This will mean accommodating new working practices and providing the spaces and access to technology which will differentiate EM3 from other locations, making it a beacon for the UK’s new position in the international economy.
4.9 The Enterprise will also be a conduit for the evolution of local activity; accommodating and facilitating local business growth and connecting this to national and international opportunities.
4.10 It will act as an exemplar as to how commercial and residential developments can be established sustainably and side-by-side. Through smart planning and a commercial approach, housing can be delivered to unlock an expanded and skilled labour force, in the context of sustainable regeneration and place-making.
Scaling of Evolution
4.11 The actions to support evolution of the Enterprise Zone are explored more fully in the accompanying Cushman and Wakefield Report. Linked to this is a broad outline of how the Enterprise Zone might evolve.
First Five Years: Enabling
Refining sector and specific sub-sector offer.
Initial work to change publicise development and ensure that sites are increasingly perceived as commercial locations.
Infrastructure investment will create the conditions to support business growth and differentiate each site within their markets.
Early intervention on skills and labour market will ensure that companies can invest with confidence that they can recruit skilled labour.
Initial development (and in some cases refurbishment) of commercial spaces to support growth.
Testing and piloting new activity.
Attraction, courting and securing anchor tenants.
Five to Ten Years: Embedding
Significant period of investment in commercial space.
Concerted marketing of locations and sites, focussing on international investment where relevant.
Page 296
13

13
Establish HE presence, R&D and knowledge transfer.
Ten Years +: Growing and Reinventing
Ongoing communication of successes, constantly reinforcing positive messages on sites and locations.
Additional investment in new infrastructure.
Reprofiling of commercial spaces where necessary to meet the needs of new sectors and specialisms.
Principles of EM3 Enterprise Zone Activity
4.12 In articulating a vision for the Enterprise Zone, it is important that EM3 has some clear principles and terms of engagement. These may be refined over time, but initial principles of the vision are:
Quality – The Enterprise Zone sites will be the main physical locations where EM3 and its partners can raise the profile and reputation of the area as a first-class destination for business, delivering employment, prosperity and sustainable growth.
Capitalising upon USPs – Overall, EM3 is a strong economic location with a number of notable selling points. It is important that the Enterprise Zone sites are seen to epitomise these strengths and are a testing ground for new differentiators; this is particularly true for current opportunities linked to 5G technologies.
Partnership and Collaboration – A clear overarching identity will help create a feeling of common purpose that will ultimately support the development of stronger business networks, agglomeration benefits and transfers of knowledge.
Acceleration of Impact – The Enterprise Zone can influence and in some cases, accelerate investment, delivering tangible improvements, maximising the incentives on offer and operating a sustainable business model.
Efficiency through Distinctiveness – The Enterprise Zone can support an understanding of the sectors and their specific needs. This enables a more coordinated offer, which does not duplicate, ensuring that specific sites do not complete with each other.
Functional Market Areas – EM3 can identify where opportunities for collaboration exist, driving an understanding of where enterprise zone sites share objectives with neighbouring areas.
Bigger Picture – The LEP and its partners have the ability to focus on the bigger picture, securing the housing, skills and infrastructure investment which will help to differentiate the three sites, enabling them to compete more effectively.
Functions of the three Enterprise Zone Sites
4.13 Set out below are the emerging functions for specific sites which constitute the Enterprise Zone:
Page 297
13
14
Basing View: An Innovation District for the M3 Corridor
Sectors: Digital and ICT; Business and Professional Servicers,Engineeing, Construction
USPs: Town centre location; connectivity; 5G investments
A flourishing business ecosystem – a mix of large and small businesses working together, providing an attractive complement and ultimately alternative to Reading and the M4 corridor.
Focus upon IT, Digital and business services, initially capitalising upon opportunities linked to 5G.
Organic growth of existing assets – tech and digital specialisms, expanding based upon growth of SET Squared and other innovation facilities.
Capitalising more effectively on a growing and highly skilled workforce.
Longer term opportunities are driven by a flexibility of offer which can attract any sector which thrives from good public transport and amenity. This could include more creative digital sectors as well as more technical activities.
Early stage reanimation of office activity, ultimately leads to redevelopment of office stock
Basing View is synonymous with quality public realm and environment.
Physical and broadband connectivity, as well as links to the town centre, support the location as a 24/7 business neighbourhood.
More footloose HEI activity and collaborations are encouraged to the area to create the feeling of a genuine ‘Innovation District’.
Achieving a suite of access improvements, by securing up-front investment in critical infrastructure projects including road, rail and pedestrian access.
Longcross Park: Internationally Connected Premium Offer
Sectors: Business and Professional Services; Digital and ICT
USPs: Connectivity to Heathrow; scale of opportunity; skilled local workforce
An international business destination on the M25-M3 axis, closer to Heathrow than any other Enterprise Zone.
Attracting global companies and setting the standard for business accommodation in the South East.
Optimum tenancy, with full build out of commercial premises, reflecting a balance of multinationals, large firms and local SMEs, making significant contributions to employment and economic growth.
An established reputation for inward investment and FDI, leveraging Government resources.
A bespoke, customised offer for major occupiers.
Educations tie ins that expand to international institutions eg links with Royal Holloway University of London cyber security base
Page 298
13

15
Infrastructure investments made to deliver key site improvements and unlock true potential.
Improved public and road transport, provides access to the most skilled labour market in Europe.
An established new settlement, with a good balance of commercial and residential services integrating harmoniously with the natural environment.
Supporting priority sectors such as professional and business services whilst maximising yields through a focused and commercially.
Whitehill and Bordon: A New Economic Place
Sectors: Sustainable/Smart Technologies; High-Tech Manufacturing; Business and Professional Services
USPs: Scale of development and place-making; commercial links to residential development; relatively affordable skilled workforce
A key component for the establishment of a vibrant new settlement, incorporating wider regeneration and transformative place-making.
Focussing on developing specialisms linked to large residential development – innovating and normalising sustainable and smart technologies.
A successful and well-known location for enterprise, particularly SMEs, excelling through an open for business approach and unique supporting infrastructure.
Potential two stages of growth, initially capitalising upon broad local sector growth through a highly flexible and evolving offer. Securing relocations from elsewhere in the Greater South East and London.
Reinforcing competitive advantages around the cost of labour, educated workforce whilst ensuring a holistic approach to commercial property stock improvement is undertaken to embed the area’s role as a quality place to do business.
Leveraging access to proportionately affordable new and existing housing stock, as a major incentive to inward investors and relocating businesses.
Capitalising upon the entrepreneurial potential of a new population beginning with the establishment of enterprise and skills centres which can act as a hub’s start-up and early growth.
Enhanced image of the area achieved through consistent marketing and branding, improvements to public transport and leveraging equidistant positioning between London and Solent.
Capitalise upon the commercial benefits of being an exemplar community, embracing ‘green’ and ‘sustainability’ principles which provide differentiation alongside the existing business base.
Page 299
13

16
5. The Evidence Base:
Enterprise Zone Market Areas
5.1 To better understand the respective characteristics of each Enterprise Zone, we have sought to analyse each site, to gain a fuller appreciation of relative strengths, weaknesses and assets. This sets the scene for the economic vision of each site.
5.2 We have established labour market areas based on one-hour driving/public transport travel time2. This creates a proxy for a functioning market area and enables data to be assessed accordingly. Appropriate geographical boundaries, such as other market area definitions and at the local authority and LEP area, have been used in sections not applicable for travel time analysis.
5.3 Maps representing the defined market areas, based on the one-hour travel time, are outlined below:
Figure 5.1 Basing View’s Market Area Figure 5.2 Whitehill and Bordon’s Market Area
Source: iGeolise Source: iGeolise
Figure 5.3 Longcross Park’s Market Area
Source: iGeolise
2 This is calculated at a specific time (in this case for an 8.30am arrival on a week day). This means that the labour market areas reflect an actual commute rather than the maximum reach within an hour.
Page 300
13

17
Current Enterprise Zone Characteristics
5.4 This section aims to breakdown the current characteristics of each site in more detail, highlighting the unique offer each site possesses and outlining the core strengths and weaknesses underpinning them. The evidence based breakdown analysis for each site begins with a look at the characteristics of the labour supply, before moving onto a drilldown of sector strengths, the existing commercial market, and asset audit.
5.5 This also includes the collation of insightful stakeholder comments obtained through consultation. These add a further layer of local intelligence, based on experiences and a knowledge of each zone, whilst helping to prioritise Enterprise Zone interventions and establish a consensus vision for the three sites.
Basing View (Basingstoke and Deane)
5.6 Basing View is owned by the Basingstoke and Deane District Council. It is located at the heart of Basingstoke with close proximity to the train station. Quick access to the M3, via junction 6, enables a 50-minute drive to London. The quickest train to London Waterloo is 42 minutes which, alongside a 45-minute trip to Heathrow, make it highly accessible for domestic and international business. The site is well established, home to a variety of businesses, with considerable existing assets.
5.7 The area is undergoing considerable regeneration, with Muse and the Council aiming to improve accessibility and the public realm, providing up to 73,600sqm of new business space and 28,000sqm of refurbished commercial space. The intention is to create a sustainable urban business park supporting 4,000 new jobs and 60 new businesses.
5.8 Basing View is adjacent to the largest digital cluster in the LEP area, with the Innovation Centre forms a key part of this. The centre will connect to the University of Surrey’s 5G Innovation Centre and thus provide further support and attraction for businesses. In addition to this SETsquared’s incubator, aims to create up to 20 further companies in technology-related sectors.
The Labour Market
5.9 The core findings presented here are based on the labour force catchment as defined by the Basing View market area above. The main advantages of the labour market are:
Strong labour supply – The working age population (WAP) as a proportion of the total
population is the highest (73.5%) of all EZ sites. The WAP is also young with 55% between
16-44. With 14,300 additional working age individuals projected to move to the area
between 2016-26, the labour supply will remain strong. More than half of the working
population work and live in the same local authority.
Figure 5.4 Basing View Site Plan
Source: Basingstoke and Deane Borough Council
Page 301
13
18
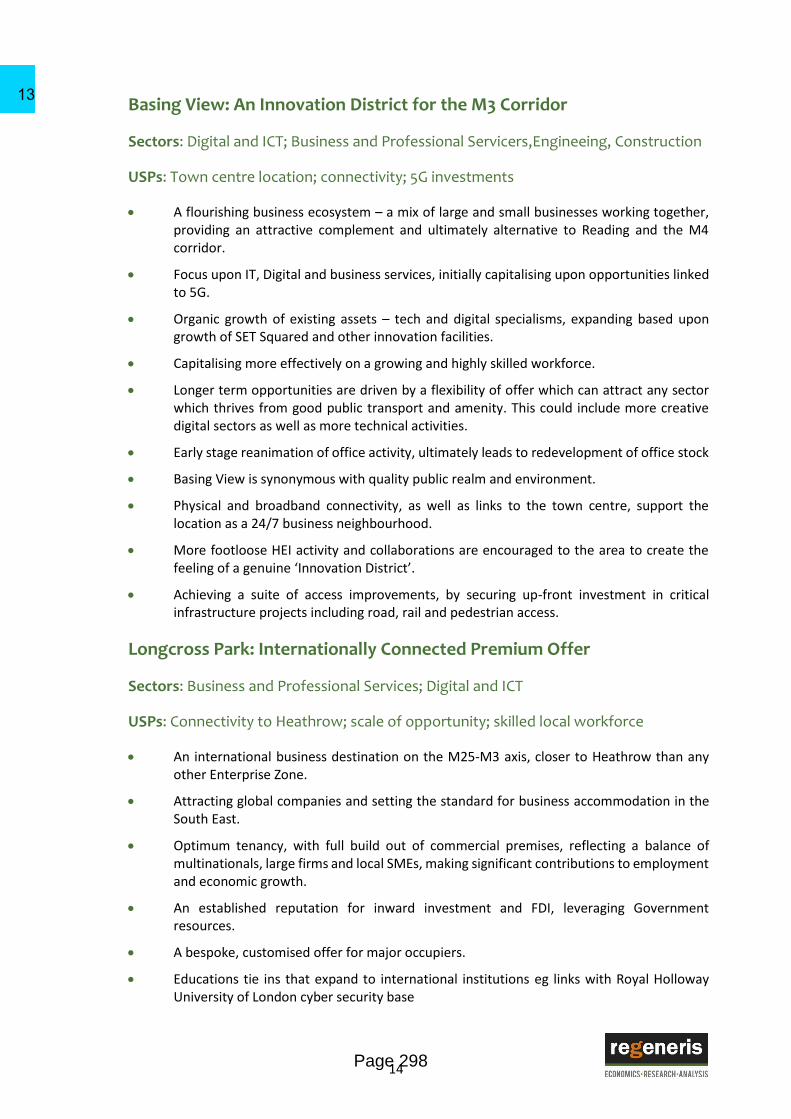
Experienced and skilled workforce – Over one-third of local workforce is in professional
and/or technical occupations, with over 12% holding senior positions. This provides
prospective businesses with a talented pool of readily available workers.
Highly educated labour force – Basing View’s individuals with level four or higher
qualifications as a proportion of the total population is approximately two and a half times
that the UK average.
Figure 5.5 Percentage of 16-44 as a proportion of the working age population
Figure 5.6 Proportion of WAP by Industry
Source: BRES Employment Data 2015 Source: UK Business Count 2016
Industrial Sectors and Business Base
5.10 This section looks at the baseline and performance of the LEP’s priority sectors. The Low Carbon sector is also analysed, to provide an indication of the size of the sector at each zone.
5.11 Figures 5.4 and 5.5 reveal the largest sector in Basing View is in Business and Professional Services, both in terms of the number of employees and businesses. 34% of the area’s businesses are in this sector, proportionally larger than regional and national averages, but lower than Longcross and Whitehill and Bordon.
5.12 The Digital and IT sector at Basing View stands out. Businesses in this sector make up the second largest proportion of businesses (17.1%), the highest of the EZ sites and is greater than that of the LEP, region and nationally.
Figure 5.7 Number of Employees by Sector 2015
Figure 5.8 Number of Businesses by Sector 2016
Source: BRES Employment Data 2015 Source: UK Business Count 2016
50%
51%
52%
53%
54%
55%
56%
Basing View South East England
12.3%
21.5%
14.6%
9.9%
41.7%
Managers, directors andsenior officials
Professional occupations
Associate professional andtechnical occupations
Process plant and machineoperatives
Other
0
2000
4000
6000
8000
10000
12000
14000
16000
18000
Pharmaceuticals Digital and IT Business andProfessional
Services
High TechManufacturing
Nu
mb
er o
f Em
plo
yees
0
500
1000
1500
2000
2500
3000
3500
Pharmaceuticals Digital and IT Business andProfessional
Services
High TechManufacturing
Nu
mb
er o
f Bus
ines
ses
Page 302
13
19
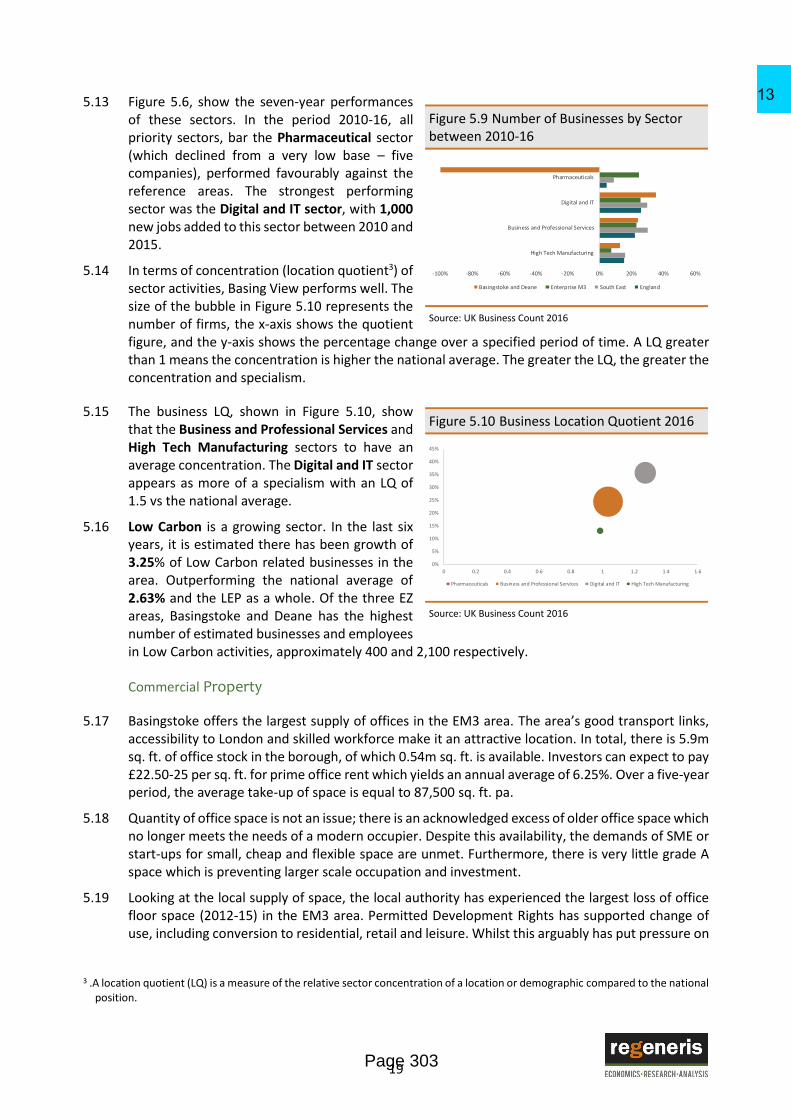
5.13 Figure 5.6, show the seven-year performances of these sectors. In the period 2010-16, all priority sectors, bar the Pharmaceutical sector (which declined from a very low base – five companies), performed favourably against the reference areas. The strongest performing sector was the Digital and IT sector, with 1,000 new jobs added to this sector between 2010 and 2015.
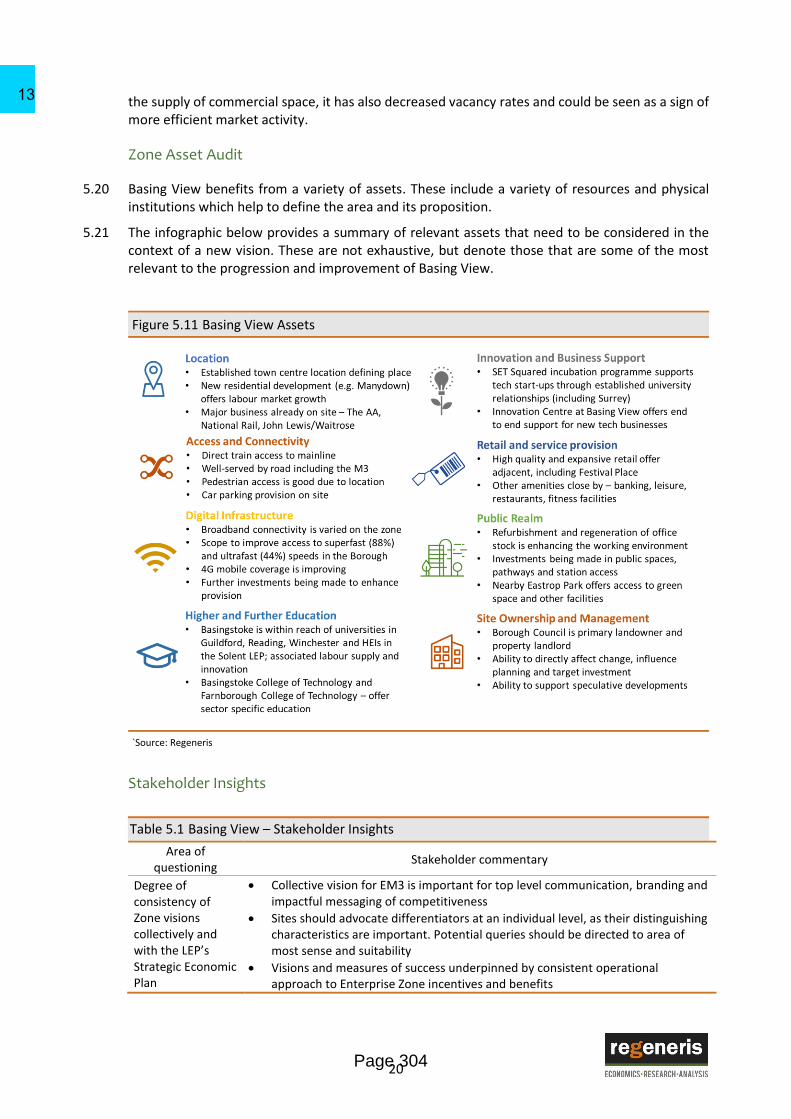
5.14 In terms of concentration (location quotient3) of sector activities, Basing View performs well. The size of the bubble in Figure 5.10 represents the number of firms, the x-axis shows the quotient figure, and the y-axis shows the percentage change over a specified period of time. A LQ greater than 1 means the concentration is higher the national average. The greater the LQ, the greater the concentration and specialism.
5.15 The business LQ, shown in Figure 5.10, show that the Business and Professional Services and High Tech Manufacturing sectors to have an average concentration. The Digital and IT sector appears as more of a specialism with an LQ of 1.5 vs the national average.
5.16 Low Carbon is a growing sector. In the last six years, it is estimated there has been growth of 3.25% of Low Carbon related businesses in the area. Outperforming the national average of 2.63% and the LEP as a whole. Of the three EZ areas, Basingstoke and Deane has the highest number of estimated businesses and employees in Low Carbon activities, approximately 400 and 2,100 respectively.
Commercial Property
5.17 Basingstoke offers the largest supply of offices in the EM3 area. The area’s good transport links, accessibility to London and skilled workforce make it an attractive location. In total, there is 5.9m sq. ft. of office stock in the borough, of which 0.54m sq. ft. is available. Investors can expect to pay £22.50-25 per sq. ft. for prime office rent which yields an annual average of 6.25%. Over a five-year period, the average take-up of space is equal to 87,500 sq. ft. pa.
5.18 Quantity of office space is not an issue; there is an acknowledged excess of older office space which no longer meets the needs of a modern occupier. Despite this availability, the demands of SME or start-ups for small, cheap and flexible space are unmet. Furthermore, there is very little grade A space which is preventing larger scale occupation and investment.
5.19 Looking at the local supply of space, the local authority has experienced the largest loss of office floor space (2012-15) in the EM3 area. Permitted Development Rights has supported change of use, including conversion to residential, retail and leisure. Whilst this arguably has put pressure on
3 .A location quotient (LQ) is a measure of the relative sector concentration of a location or demographic compared to the national position.
Figure 5.9 Number of Businesses by Sector between 2010-16
Source: UK Business Count 2016
Figure 5.10 Business Location Quotient 2016
Source: UK Business Count 2016
-100% -80% -60% -40% -20% 0% 20% 40% 60%
High Tech Manufacturing
Business and Professional Services
Digital and IT
Pharmaceuticals
Basingstoke and Deane Enterprise M3 South East England
0%
5%
10%
15%
20%
25%
30%
35%
40%
45%
0 0.2 0.4 0.6 0.8 1 1.2 1.4 1.6
Pharmaceuticals Business and Professional Services Digital and IT High Tech Manufacturing
Page 303
13
20
the supply of commercial space, it has also decreased vacancy rates and could be seen as a sign of more efficient market activity.
Zone Asset Audit
5.20 Basing View benefits from a variety of assets. These include a variety of resources and physical institutions which help to define the area and its proposition.
5.21 The infographic below provides a summary of relevant assets that need to be considered in the context of a new vision. These are not exhaustive, but denote those that are some of the most relevant to the progression and improvement of Basing View.
Figure 5.11 Basing View Assets
`Source: Regeneris
Stakeholder Insights
Table 5.1 Basing View – Stakeholder Insights
Area of questioning
Stakeholder commentary
Degree of consistency of Zone visions collectively and with the LEP’s Strategic Economic Plan
Collective vision for EM3 is important for top level communication, branding and impactful messaging of competitiveness
Sites should advocate differentiators at an individual level, as their distinguishing characteristics are important. Potential queries should be directed to area of most sense and suitability
Visions and measures of success underpinned by consistent operational approach to Enterprise Zone incentives and benefits
Page 304
13

21
EM3 SEP provides overarching messaging regarding LEP level vision which is helpful and should be utilised flexibly to reflect drivers of growth and jobs
Resources, skills and knowledge to be shared in the present and in the future to maximise benefits
Enterprise Zone distinctiveness
Town centre, established business district location with high profile existing tenants, and attractive natural environment nearby
Existing tech and digital sector specialisms, but also other industries well represented creating a level of diversity and community
Varied commercial property stock, with renovation underway, but others in need of replacement
Adjacent to amenities and facilities including train station, retail, leisure, green space
Council retains land and property ownership in parts, providing greater levels of influence
Sector priority identity and alignment
Digital and tech based industries are present, alongside other industries such as financial, professional services and engineering.
Basingstoke has a good alignment with the LEP priority sectors
Nature of any proactive market/sector targeting
Desire to remain flexible, emphasise commercial viability and maximise tenancy
Marketing/brand established, emphasising the qualities of the site in terms of affordability, access, lifestyle, modern style of working
Promoted as a central business district, with access to a significant existing supply chain
Level of commercial interest and reasons for considering the location
Commercial interest there but there are barriers to securing deals
Lack of grade A space and larger footprint office space available to secure tenants
Sense that Basing View is perceived positively but restricted by a lack of capacity to accommodate larger businesses
Key barriers to growth in relation to:
Infrastructure
IT and connectivity
Skills and workforce
Package of transport and access improvements needed to improve connection with surrounds
Office stock in some instances need replacement or refurbishment and is a visual detriment to prospective tenants
Long-term leaseholds acting as a barrier to investment in office space and premises
Site topography creates challenges to development and public realm; requires further improvements
Broadband connectivity is patchy in places and requires additional private and public investment to achieve ultrafast speeds
Lack of HE provisions or a campus in the town is a detractor to investors and creates labour supply issues such as access to STEM graduates
Greater access to vocational training needed
External threats ‘Brexit’ impact and resultant uncertainty affecting business investment
Proximity to Reading and the Thames Valley Corridor a significant competitive threat; EM3 lacks equivalent brand and recognition
Priority projects to unlock investment
Expansion of SET Squared tech-based start-up hub to reinforce sector credentials Remedial works to site topography and elevations to accelerate development Public realm and place investments Funding of a programme of access and transport projects/enabling works Acquisition of long-term leaseholds Branding and spinning threats in a way that is advantageous
Vision for success look like in 2042
Basing View is well integrated to the town centre and operates as a 24/7 destination
Page 305
13
22
Redevelopment of ‘end of life’ buildings delivers lower vacancy rate and a greater sense of a dynamic, purposeful business community
Zone is intrinsic to this success, through enabling accelerated investment and offering key hook to tenants/investors
A sustainable model that continues to grow, unlike previous Basingstoke regeneration attempts
Source: Regeneris. Stakeholders included; Pure World Energy, Enterprise M3, Basingstoke & Deane Borough Council, East Hampshire County Council, Runnymede Borough Council, Homes & Communities Agency, Crest Nicholson. Dept. for Business, Innovation and Skills
Longcross Park (Runnymede)
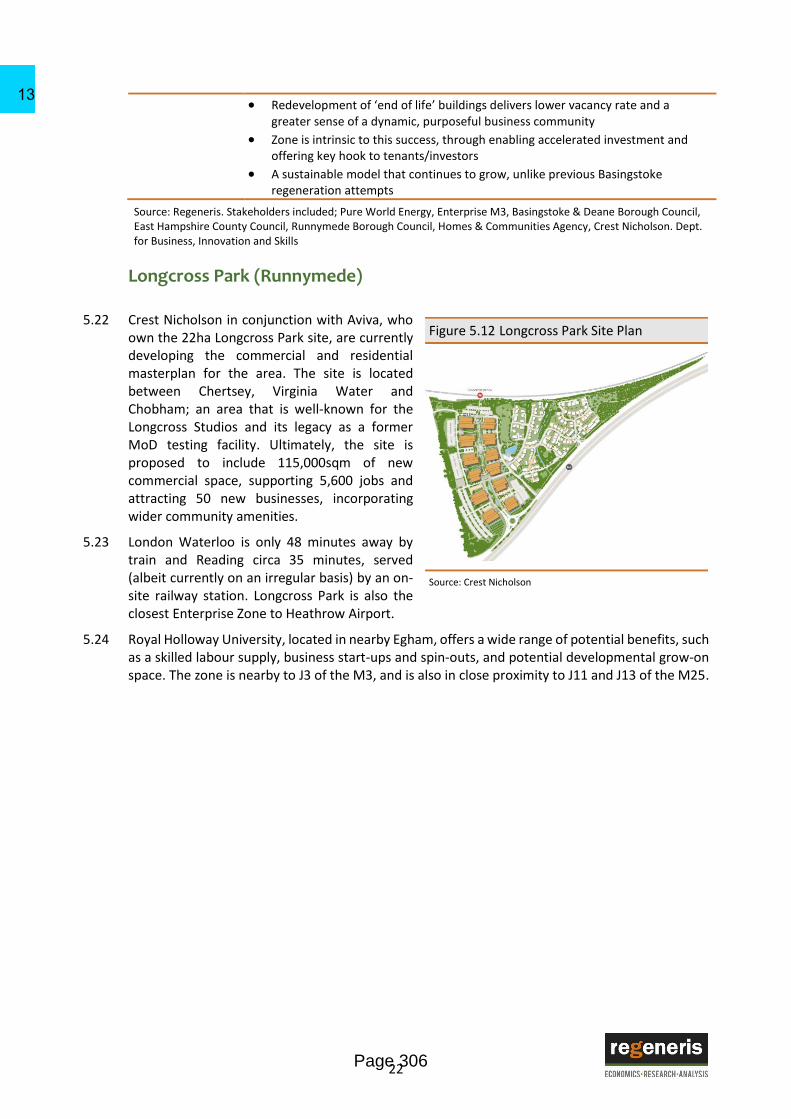
5.22 Crest Nicholson in conjunction with Aviva, who own the 22ha Longcross Park site, are currently developing the commercial and residential masterplan for the area. The site is located between Chertsey, Virginia Water and Chobham; an area that is well-known for the Longcross Studios and its legacy as a former MoD testing facility. Ultimately, the site is proposed to include 115,000sqm of new commercial space, supporting 5,600 jobs and attracting 50 new businesses, incorporating wider community amenities.
5.23 London Waterloo is only 48 minutes away by train and Reading circa 35 minutes, served (albeit currently on an irregular basis) by an on-site railway station. Longcross Park is also the closest Enterprise Zone to Heathrow Airport.
5.24 Royal Holloway University, located in nearby Egham, offers a wide range of potential benefits, such as a skilled labour supply, business start-ups and spin-outs, and potential developmental grow-on space. The zone is nearby to J3 of the M3, and is also in close proximity to J11 and J13 of the M25.
Figure 5.12 Longcross Park Site Plan
Source: Crest Nicholson
Page 306
13

23
The Labour Market
5.25 The main advantages of the labour force in the catchment area are:
Large workforce – There is strong
availability of labour, with just under 1
million working age individuals located
in the catchment area. Approximately
three quarters of the population are
economically active. An additional 4,000
working aged individuals are projected
to arrive in Runnymede by 2026,
increasing the labour supply.
Intelligent and capable workers – Not
only does Longcross possess the highest
proportion of workers with level 4 or
above qualifications across the EZ sites,
region and LEP, it also possesses the
highest proportion of employees in
associate professional and technical occupations. Longcross’ accessibility to educated
individuals at (34.1%) is far in excess of regional (13.5%) and national averages (13.3%).
Industrial Sectors and Business Base
5.26 Similar to Basing View but different in quantum, the Digital and IT and Business and Professional Services sectors are most prominent in the number of employees and businesses in the catchment areas. Of the three sites, Longcross is the only one to see positive growth in the number of businesses across priority sectors (bar Pharmaceuticals of which there are no businesses)4.
Figure 5.14 Number of Employees by Sector 2015
Figure 5.15 Number of Businesses by Sector 2016
Source: BRES Employment Data 2015 Source: UK Business Count 2016
5.27 Runnymede has outperformed the LEP, SE region, and the UK in terms of growth the Digital and IT and High Tech Manufacturing sectors. In comparison with the other EZ sites, Business and Professional Services expansion was the largest at 25% (not including High Tech Manufacturing
4 Note – data may not capture most recent market investments, such as Pharmaceutical relocations.
0
2000
4000
6000
8000
10000
12000
14000
Pharmaceuticals Digital and IT Business andProfessional
Services
High TechManufacturing
Nu
mb
er o
f Em
plo
yees
0
200
400
600
800
1000
1200
1400
1600
1800
Pharmaceuticals Digital and IT Business andProfessional
Services
High TechManufacturing
Nu
mb
er o
f Bus
ines
ses
Figure 5.13 Proportion of WAP by Industry
Source: BRES Employment Data 2015
13.5%
20.5%
15.4%9.5%
41.1%
Managers, directors andsenior officials
Professional occupations
Associate professionaland technical occupations
Process plant andmachine operatives
Other
Page 307
13

24
which started from a low base of 20 firms in 2010). Growth has been diverse and there exists a stable environment and potential for continued sector diversification.
Figure 5.16 Percentage Change in the Number of Businesses by Sector between 2010-16
Source: UK Business Count
5.28 Overall changes in the number of Low Carbon businesses, over the last few years, has broadly followed that of the general SE region and UK. Since 2010, the number of Low Carbon businesses has grown by 2.5%. Most of this growth has derived from businesses that focus on waste management, reuse and recycling, and green infrastructure. Whilst the biggest growth employment has come from R&D, and legal and associated accountancy services.
Commercial Property Data
5.29 The difficulty in analysing the commercial market for Longcross Park lies in the fact that the site is still currently under development. As such, the insights presented below derives from studying the more general Upper M3 market area.
5.30 Town and cities located nearby are mainly established office locations and are those that attract some of the highest rental values in the LEP. Prime office rents are estimated to be up to £34.50 per sq. ft., yielding 5.25%. Longcross Park’s close proximity to London and Heathrow, and access to a wide and skilful workforce will make it a very attractive location for businesses.
5.31 According to the 2016 Employment Land Review, there is currently 4.0m sq. ft. of B1, 0.9m sq. ft. B1c/B2, and 1.9m sq. ft. B8 floor space available in Upper M3. There still remains a large volume of vacant space in Runnymede, with a vacancy rate of 13%. However, if recent trends in the area and London apply this scenario is unlikely to continue, such is the market sentiment and increasing demand for high quality B1/B2 commercial space.
5.32 Development plans in Longcross Park make it the largest commercial development site in the LEP area. In terms of demand, there has been evidence of demand for HQ style office of 25,000 sq. ft. Nearby towns, Egham and Staines, have recently concluded business deals for over 1,000 sq. metre. In 2016 Q2, 50% of take up was for grade A development. However, local agents have reported a gap in supply for 2,000 – 5,000 sq. ft. high quality and modern spaces. Furthermore, there is interest for high quality industrial space, however there is limited market supply incentive due to local green belt regulations and low comparative office rental yield issues.
Page 308
13
25
Zone Asset Audit
5.33 Longcross Park benefits from its strategic location in Runnymede, on the edge of London and adjacent to the M3 and M25 motorways, as well as having direct access to London via trains on the Reading-Waterloo line. Despite its proximity to the urban areas, it is also blessed with a high quality natural environment and is a sought-after location to reside and do business. Considering its locational assets in more detail, the site offers great scope to become an exemplar business location, operating in one of the most economically competitive areas of the UK.
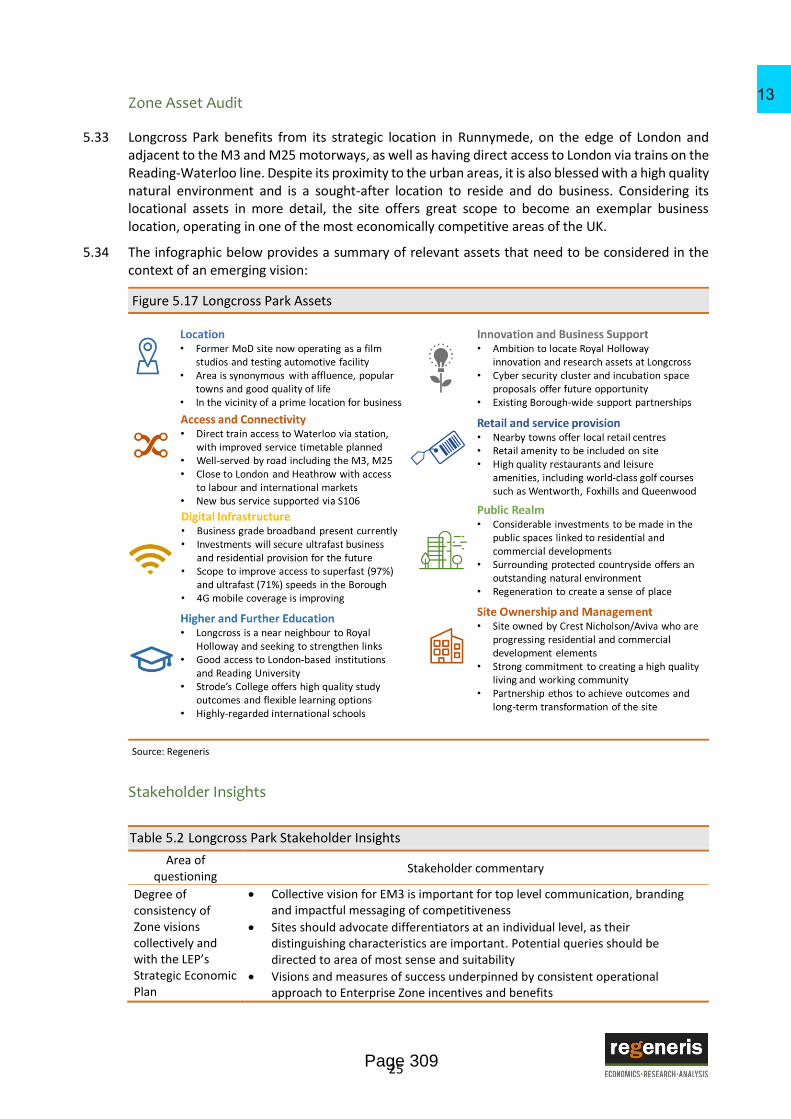
5.34 The infographic below provides a summary of relevant assets that need to be considered in the context of an emerging vision:
Figure 5.17 Longcross Park Assets
Source: Regeneris
Stakeholder Insights
Table 5.2 Longcross Park Stakeholder Insights
Area of questioning
Stakeholder commentary
Degree of consistency of Zone visions collectively and with the LEP’s Strategic Economic Plan
Collective vision for EM3 is important for top level communication, branding and impactful messaging of competitiveness
Sites should advocate differentiators at an individual level, as their distinguishing characteristics are important. Potential queries should be directed to area of most sense and suitability
Visions and measures of success underpinned by consistent operational approach to Enterprise Zone incentives and benefits
Page 309
13

26
EM3 SEP provides overarching messaging regarding LEP level vision which is helpful and should be utilised flexibly to reflect drivers of growth and jobs
Resources, skills and knowledge to be shared in the present and in the future to maximise benefits
Enterprise Zone distinctiveness
Location is a primary factor; on the doorstep of London, Heathrow, Surrey Green Belt
Connectivity is excellent; motorway, road and rail provides good access to the site
Proximity to major corporates, successful business parks, signifies success of the area
Quality of life is high as is the environment
Pre-let strategy enables greater flexibility over accommodation specification for tenants
Sector priority identity and alignment
The focus is on flexibility and offering what makes the site commercially viable; not looking to tie the site to specific sectors
Acknowledge sectors important to the LEP; capable of supporting these, such as digital, Pharmaceutical
Exploring opportunity to retain film and media occupiers in a new setting
Nature of any proactive market/sector targeting
Engagement has been underway with potential occupiers; these reflect a variety of sectors who see Longcross as an attractive site
Seeking occupiers of scale, given pre-let strategy and those looking for high quality and bespoke accommodation
Marketing references Enterprise Zone status but perceived as the focus
Level of commercial interest and reasons for considering the location
Distinctiveness and quality factors are a key selling points for the site
Enterprise Zone status not critical but perceived as a positive in the realms of commitment to investment, delivering infrastructure and links to Government
Pre-let strategy limits opportunity to build quickly without commitment from multiple tenants; lack of immediate available space can be an issue
Key barriers to growth in relation to:
Infrastructure
IT and connectivity
Skills and workforce
Power supply is a pinch point and needs immediate resolution to unlock development
Demolition and clearance of buildings challenging due to age, construction materials
Further improvements to the train station itself and introduction of more regular services
A direct junction from Longcross on to M3
Recruiting good quality labour has been a recurring challenge for some local companies/sectors; London is a help and hindrance in this sense
Cost of housing stock means retention of young people is challenging and it can be difficult to recruiting staff to supporting and service sectors
Digital connectivity is enhanced through residential fibre accessibility and evolving the high specification business offer
The brain drain of skilled, educated and high quality workers that live in the area but work in London, but not as pronounced as neighbouring authorities
External threats
‘Brexit’ outcome has created uncertainty but the real impact of this has yet to be felt here
Opportunity to mitigate this through evolution and of the Enterprise Zone so investments can be made to increase confidence
Priority projects to unlock investment
Emphasis needs to be on up-front infrastructure investments
Vision for success look like in 2042
Ambition is to create an exemplar development that creates a positive sense of place offering a blend of homes and business
Commercial components of the Enterprise Zone are fully let
Strengthened links with Royal Holloway and its cyber security cluster ambitions
Page 310
13

27
Support for local SMEs and start-ups where feasible
Source: Regeneris. Stakeholders included; Pure World Energy, Enterprise M3, Basingstoke & Deane Borough Council, East Hampshire County Council, Runnymede Borough Council, Homes & Communities Agency, Crest Nicholson. Dept. for Business, Innovation and Skills
Whitehill and Bordon (East Hampshire)
5.35 Whitehill and Bordon is to be transformed into Hampshire’s Green Town through a £1 billion regeneration project which will provide up to 3,350 new homes and 5,500 new jobs, as well as new schools, a new road, new facilities and more green space for residents and visitors to enjoy. Whitehill & Bordon originally grew because the Army settled in the town but these operations have now relocated, freeing up approximately 300ha of land, 70ha of which are available for development, in a prime location in the South East of England.
5.36 The town is one of the largest housing developments in the area, with thousands of new homes to be built over the next 20 years. To support this there will be significant commercial, retail and leisure development. The vision is to create a hub for technology businesses that complement the high environmental values and standards promoted throughout the regeneration.
5.37 The Whitehill and Bordon site is jointly owned by the Homes and Communities Agency (HCA) and the Defence Infrastructure Organisation (DIO). The wider area identified for development covers circa 400ha with 250ha of the land allocated for commercial, retail, leisure, education and health purposes, and the remaining for green space, public open space, etc. More specifically, the Enterprise Zone site aims to deliver 20,000 sqm of commercial space to accommodate 105 businesses and 495 new jobs.
5.38 The site is uniquely positioned further South in the EM3 area, in between Portsmouth and Guildford. The advantage of its location, being just off the A3, is that it provides a link to the Solent cities whilst still being sufficiently close to key High Tech Manufacturing businesses located in Farnborough.
5.39 There is already some development taking place at the site. The Whitehill and Bordon Future Skills Centre is under construction, which aims to provide top quality technical training for students aged 16, and the Business and Enterprise Centre which will create space for SMEs is due to break ground in 2017. Complementing the centre, is the expected arrival of a new secondary school in 2018 at the Prince Philips Barracks.
5.40 It is vital that accessibility to Whitehill and Bordon is addressed, there is a £17.5m investment into a relief road which is aimed at unlocking the town’s growth potential. Furthermore, there is an ambition to utilise the existing Louisburg Barracks at Whitehill and Bordon and replace it with a Business Park, that will provide 1,700sqm of commercial space and deliver 130 new jobs. All of which will develop the community and act as a further marketing asset to the town.
5.41 Supplementing the promotion of economic development, is the drive to encouraging healthier living. In February 2016, Whitehill and Bordon were designated the status of NHS England Healthy New Town. A title aimed at promoting health and independent living to reduce reliance on health
Figure 5.18 Whitehill and Bordon Site Visual
Source: Homes and Communities Agency
Page 311
13

28
and social care provision. Supporting this goal is the health and care campus development which is to be delivered by 2019, that will provide local residents access to primary care provision.
The Labour Market
5.42 Main Headlines:
Growing workforce – The proportion of working aged individuals is 1% less than the
regional average. Those aged 16-44 form 46.8% of the WAP, 5% less than the regional
average. That said, Whitehill and Bordon area has the highest projected increase in working
age population across the three sites.
Educated and qualified – The proportion of individuals with level 4 or higher qualifications
is comparable with that of the other sites and is approximately 20% greater than the
regional and national averages. The proportion of Whitehill and Bordon residents working
as managers, directors and senior officials was the highest across the EZ sites, greater than
South East and national average by 1.7% and 3.1% respectively.
Affordable labour – Whitehill and Bordon’s weekly gross salaries measured at the 75th
percentile (chosen to reflect the average cost of labour identified in their sector strengths)
is the only site to be lower than the Regional and national average. Figure 5.36, compares
the Median wage in Whitehill and Bordon with that of reference cases.
Figure 5.19 Proportion of WAP by Industry Figure 5.20 Median Salary Comparison
Source: BRES Employment Data 2015 Source: ONS, Annual Survey of Hours and Earnings, 2015
5.43 Though there are a relatively fewer number of available working aged individuals in the catchment area of Whitehill and Bordon, this is compensated for by the advantageous low cost and high quality workforce in the area. The projected increases in the number of working aged individuals (and the breadth of the workforce as a result of affordable housing provision) to situate in the local authority ensures labour supply will grow over time.
Industrial Sectors and Business Base
5.44 At first glance the makeup of the sector base is similar to Basing View and Longcross, with Business and Professional Services, and Digital and IT businesses making up roughly 50% of the businesses in the area. Since 2010, both sectors have experienced more than a 10% increase in businesses registering in the area.
14.0%
19.6%
14.2%12.0%
40.2%
Managers, directors andsenior officials
Professional occupations
Associate professionaland technical occupations
Process plant andmachine operatives
Other
Page 312
13

29
Figure 5.21 Number of Employees by Sector 2015
Figure 5.22 Number of Businesses by Sector 2016
Source: BRES Employment Data 2015 Source: UK Business Count 2016
5.45 A deeper analysis provides a deeper view of the sector strengths in Whitehill and Bordon. Despite contraction in the number of firms since 2010, Whitehill and Bordon still has an LQ for High Tech Manufacturing of 1.5.
Figure 5.23 Employee Location Quotient
Source: BRES Employment Data 2015
5.46 East Hampshire's Low Carbon economy performed well between 2010 to 2015, with a 3.6% increase in the number of employees in the sector compared to 0.07% and 1.45% in the SE region and nationally, respectively. It is estimated that there are 1,644 employees in the sector in the East Hampshire local authority. There has also been a 1.65% growth in businesses registering in the area. Based on these statistics, the Low Carbon Sector is an industry which could provide opportunity in the future for the Enterprise Zone and EM3.
Commercial Property Data
5.47 East Hampshire, specifically Bordon, is an area that currently caters to SMEs and possesses few established office locations. Bordon is mainly an industrial location that contains units up to 10,000 sq. ft., although research suggests there is latent demand for high quality office space. According
0
1000
2000
3000
4000
5000
6000
7000
8000
9000
Pharmaceuticals Digital and IT Business andProfessional
Services
High TechManufacturing
Nu
mb
er o
f Em
plo
yees
0
500
1000
1500
2000
2500
Pharmaceuticals Digital and IT Business andProfessional
Services
High TechManufacturing
Nu
mb
er o
f Bu
sin
esse
s
-80%
-70%
-60%
-50%
-40%
-30%
-20%
-10%
0%
10%
20%
30%
0 0.2 0.4 0.6 0.8 1 1.2 1.4 1.6 1.8
Per
cen
tage
Ch
an
ge
Quotient
Pharmaceuticals Business and Professional Services Digital and IT High Tech Manufacturing
Page 313
13

30
to local commercial agents, there is an oversupply of low quality office supplies, evidenced by the high vacancy rate of 9% for the local authority.
5.48 Agents report there to be demand for modern, high quality and flexible industrial (B8) space varying in size from 7,000 – 63,000 sq. ft. It should be noted that with little land for larger scale industrial space and a low accompanying vacancy rate it will be difficult for the local authority to meet the growth needs of existing businesses and to accommodate new investment targets from large industrial occupiers. Prime industrial rent is around £7-8 per sq. ft. whilst quality new units cost £8-10.
Zone Asset Audit
5.49 Whitehill and Bordon is situated in a predominantly rural setting, thereby helping to define its characteristics and solidifying its distinctiveness from other EM3 enterprise zone sites and business locations. Whilst the natural environment is the primary amenity, there is considerable opportunity to develop new and enhanced facilities, infrastructure and a sense of place, as large-scale regeneration continues.
5.50 The visual below provides a summary of relevant assets that need to be considered in the context of an emerging vision:
Figure 5.24 Whitehill and Bordon Assets
Source: Regeneris
Page 314
13

31
Stakeholder Insights
Table 5.3 Whitehill and Bordon Stakeholder Insights
Area of questioning
Stakeholder commentary
Degree of consistency of Zone visions collectively and with the LEP’s Strategic Economic Plan
Collective vision for EM3 is important for top level communication, branding and impactful messaging of competitiveness whilst maintaining local marketing
Sites should advocate differentiators at an individual level, as their distinguishing characteristics are important. Potential queries should be directed to area of most sense and suitability
Visions and measures of success underpinned by consistent operational approach to Enterprise Zone incentives and benefits
EM3 SEP provides overarching messaging regarding LEP level vision which is helpful and should be utilised flexibly to reflect drivers of growth and jobs
Resources, skills and knowledge to be shared in the present and in the future to maximise benefits
Enterprise Zone distinctiveness
Desire to advocate the unique characteristics of the zone; a wider regeneration package and establishment of a new community
Supported by guiding principles around place and design; ‘step up’ and ‘green’ designation
Quality of the natural environment important
Affordable new housing stock and major relocation incentive
Holistic focus on economic development, with investment in enterprise and future skills facilities to further establish the zone and incentive investment
Post MoD business base transition -first mover advantage in choice of workers and land
Sector priority identity and alignment
Digital and technology-based sectors are priorities, akin to LEP targets
Not looking to preclude existing sectors that are a legacy of MoD presence in the area
Keen to emphasise growth, jobs, productivity and avoid displacement where possible
Area should be flexible in its approach to attracting different sectors; over focus on priority sector can be damaging to success
Nature of any proactive market/sector targeting
Early stage in terms of proactive marketing
Consistent brand being developed to provide a cohesive communications proposition
Emphasis is on advocating benefits of a ‘soft landing’ strategy and flexibility in the provision of office space; focusing on B1 and B2 uses
Level of commercial interest and reasons for considering the location
Broad level of interest from the marketplace
Attractiveness of characterised by the quality of the location, environment and being part of a newly-created settlement
Package of support on offer to new businesses, centred on the Enterprise Zone
Key barriers to growth in relation to:
Infrastructure
IT and connectivity
Skills and workforce
Train access is an issue; distance to nearest stations somewhat problematic and signage and quality of welcome needs improvement
Digital infrastructure is being installed in residential elements, expected to follow through more flexible business
Existing low quality commercial and industrial space in the area lowers the perceived value as a business destination
Future skills centre will assist with local labour supply, as will the creation of new homes; potential for skills gaps with retained labour
Page 315
13

32
Need to encourage young person aspiration and an interest in local employment
External threats
‘Brexit’ has not had a noticeable impact
Sense that there is sufficient differentiation with competitors but momentum is key to get the site functioning
Competition from other local cities such as Farnborough
Recent Government plans for devolution of local authorities, particularly Solent devolution, may affect East Hampshire’s status in the EM3 LEP
Priority projects to unlock investment
Up-front investments, including speculative development
Heavy emphasis on branding and establishing a consistent message about place and offer, that is not dependent on the appeal of business rate relief but site specific
Vision for success look like in 2042
An established business location, acting as a hub for digital/tech enterprises
Enterprise Zone an actuator of leveraging further investment into Whitehill and Bordon
A key component of the regeneration of a new settlement and sense of place
Contributor to the local authority
Source: Regeneris. Stakeholders included; Pure World Energy, Enterprise M3, Basingstoke & Deane Borough Council, East Hampshire County Council, Runnymede Borough Council, Homes & Communities Agency, Crest Nicholson. Dept. for Business, Innovation and Skills
Considering Enterprise Zone Workspace Requirements and Future Needs
5.51 In developing a vision for the Enterprise Zone sites, it is important to consider the workspace needs of likely occupiers. There is a variety of research, which evaluates the workspace needs of different sectors and how these are likely to adapt over time, based on trends and projections.
5.52 The infographic below summaries some of the sector specific factors which will help ensure that EM3’s Enterprise Zone provide fit-for-purpose accommodation, capable of attracting and retaining occupiers who can support the LEP’s ambitions.
Page 316
13

33
Page 317
13

34
Appendix A - iGeolise Supporting Data
A.1 Analysis of impact of +/- 30 minute increments to 08:30 travel time
Travel Time
Catchment Areas at Different Times.docx
A.2 Infographic confirming iGeolise’s travel time mapping methodology
How the TravelTime
Platform Works - Infographic.pdf
Page 318
13

Regeneris Consulting Ltd Manchester Office
4th Floor Faulkner House Faulkner Street, Manchester M1 4DY
0161 234 9910 [email protected]
London Office
3rd Floor, 65 St. John’s Street. London EC1M 4AN
0207 336 6188 [email protected]
www.regeneris.co.uk
Page 319
13

This page is intentionally left blank