Embed Size (px)
Citation preview

Enterprise Zones Monitoring Report 2006/07
www.communities.gov.ukcommunity, opportunity, prosperity


Enterprise Zones Monitoring Report 2006/07
February 2009
Centre for Regional Economic and Social Research, Sheffield Hallam UniversityDepartment for Communities and Local Government

Department for Communities and Local GovernmentEland HouseBressenden PlaceLondon SW1E 5DUTelephone: 020 7944 4400Website: www.communities.gov.uk
© Queen’s Printer and Controller of Her Majesty’s Stationery Office, 2009
Copyright in the typographical arrangement rests with the Crown.
This publication, excluding logos, may be reproduced free of charge in any format or medium for research, private study or for internal circulation within an organisation. This is subject to it being reproduced accurately and not used in a misleading context. The material must be acknowledged as Crown copyright and the title of the publication specified.
Any other use of the contents of this publication would require a copyright licence. Please apply for a Click-Use Licence for core material at www.opsi.gov.uk/click-use/system/online/pLogin.asp, or by writing to the Office of Public Sector Information, Information Policy Team, Kew, Richmond, Surrey TW9 4DU
e-mail: [email protected]
If you require this publication in an alternative format please email [email protected]
Communities and Local Government PublicationsPO Box 236WetherbyWest YorkshireLS23 7NBTel: 0300 123 1124Fax: 0300 123 1125Email: [email protected] via the Communities and Local Government website: www.communities.gov.uk
February 2009
Product Code: 08ACST05614/E
ISBN: 978-1-4098-1002-5
The findings and recommendations in this report are those of the authors and do not necessarily represent the views of the Department for Communities and Local Government.

Enterprise Zones Monitoring Report 2006/07 | 3
Contents
Executive Summary 4
Section 1: Introduction 5
1.1 The Enterprise Zones 5
1.2 Monitoring the Enterprise Zones 7
Section 2: Enterprise Zone Profiles 10
2.1 Introduction 10
2.2 Dearne Valley 10
2.3 East Durham 11
2.4 East Midlands 12
2.5 Tyne Riverside 14
Section 3: Principal Outputs 2006/07 16
3.1 Sources and Methods 16
Section 4: Public Expenditure Costs 2006/07 20
4.1 Sources and Methods 20
4.2 Public Expenditure 20
Section 5: Supplementary Information 22
5.1 Sources and Methods 22
5.2 Additional Indicators 22
Section 6: Recent Development Trends 24
6.1 Introduction 24
6.2 Sources and Methods 24
Appendix 1: Monitoring Tables 26
Appendix 2: Enterprise Zone Development Trends 41

4 | Enterprise Zones Monitoring Report 2006/07
Executive SummaryEnterprise zones were introduced in 1980, as an ‘experiment’ in urban policy to stimulate economic activity by giving businesses as much freedom as possible in which to operate. This was to be achieved by reducing taxation and relaxing the regulations affecting businesses. In practice this meant the allocation of 100% tax allowances for firms and individuals investing in the construction of new buildings, or the conversion of existing buildings, for industrial and commercial purposes and by removing from the occupiers of those buildings the burden of general rates (Business Rates) for periods of up to ten years. The relaxation of regulations in the zones included simplified town planning procedures, expedited customs procedures and exemption from the payment of training board levies.
In total some 38 enterprise zones were designated between 1981 and 1996, each with a life of ten years. Regeneration performance in the zones has been monitored since the first zones were created, against outputs such as land reclaimed, infrastructure provided, buildings constructed and/or converted/refurbished and jobs created or safeguarded. The present monitoring report covers the period 1 April 2006 to 31 March 2007, during which time only one enterprise zone remained in operation – Tyne Riverside. Three others – Dearne Valley, East Durham and East Midlands – are also included, as they had expired towards the end of the previous financial year, and hence any construction works started during that period would still be eligible for capital tax allowances. These four zones contain a total of 469 hectares in 30 sites. At the end of the period the built floorspace in the four zones comprised 1,364,000 square metres (14,380,000 square feet) of industrial and commercial buildings, providing just over 29,000 jobs.
The figures in the tables in Appendix 1 are buildings-based, containing information on building footprints, floor areas and building types, as well as principal occupiers and their economic activity. Although this approach provides a great deal of information about the buildings on the zones, it does have a disadvantage in that by and large the occupiers of small units in linked business spaces and multi-let office buildings are not fully recorded. However, buildings of this type are listed by name, or operator, and total floor areas are recorded; employment estimates have also been made on the basis of the principal activity undertaken by occupiers.
In addition, for this final monitoring report a series of charts tracing recent development trends in the four enterprise zones has been included. These may be found in Appendix 2.

Enterprise Zones Monitoring Report 2006/07 | 5
Section 1: Introduction
1.1 The Enterprise Zones
The Enterprise Zones (EZ) initiative was announced by Government in 1980 as an ‘imaginative experiment’ where businesses would be given as much freedom as possible in which to operate (Catalano, 1983)1. Initially 24 local authorities applied for EZ designation and the first eleven areas were designated in 1981, followed two years later by a further eleven, plus extensions to the Speke (Liverpool) and Wakefield EZs. Since then the total number of EZs designated has risen to 38. Each zone was normally designated for a fixed life of ten years and the final designations (in Tyne Riverside) came to an end during the 2006/07 financial year.
The purpose of the EZs has been to stimulate private sector economic activity through lessening the incidence of taxation and by relaxing or speeding up some statutory controls or regulations. Investors in the EZs have had the ability to claim 100% tax allowances in respect of capital expenditure on industrial and commercial buildings. Occupiers of industrial and commercial buildings have enjoyed exemption from the payment of Uniform Business Rates (originally General Rates) for a maximum of ten years, from the date they occupied the buildings until the end of the relevant designation periods. Developers and investors have benefited from a simplified town-planning regime, whereby planning permission was not required for new developments provided that they complied with the published planning scheme for the zone. These differed slightly from one zone to another, for example in respect of the amount of retail development that would be permitted. Other benefits have included exemption from training board levies and expedited customs facilities.
This report summarises the position in respect of the remaining UK Enterprise Zones for the year ended 31 March 2007 – referred to as 2006/07. During this period only one EZ remained in full operation, but the designation of three others had just expired towards the end of the previous financial year, so that certain benefits still remained in force during this last monitoring period. EZ eligibility across the four areas was split between multiple sites, with a combined land area of 469 hectares. By the end of 2006/07 approximately 1,364,000 square metres of industrial and commercial floorspace had been developed on these sites (an increase of 4 per cent over the 1,311,600 square metres recorded at the end of the previous 2005/06 monitoring period). Almost all of the buildings in the Zones are new construction since the date of EZ designation.
The stock of industrial and commercial floorspace increased in each of the four EZs, with the amount of floor area that was occupied also increasing
1 Catalano, A. (1983) A Review of Enterprise Zones, London: Centre for Environmental Studies.

6 | Enterprise Zones Monitoring Report 2006/07
by around 5 per cent. This meant that the overall occupancy rate across all four Zones remained roughly the same as in the previous year at 81 per cent. However, this masked some variation between Zones, with East Durham having a relatively low occupancy rate of 73 per cent (but experiencing a noticeable year-on-year increase during the last two monitoring periods), compared to 92 per cent occupancy in the East Midlands. Tyne Riverside maintained its average occupancy rate over the year, while Dearne Valley experienced a decline from 79 per cent to 74 per cent. This was caused by a combination of plant closures and the lag between new building completion and take-up by new occupiers.
As part of the process of data verification, a range of sources has been used to determine the principal activity of occupying organisations. These include direct enquiries during monitoring visits, telephone calls, trade directories and the Internet. This information has enabled the activities carried out in the buildings to be assigned to different Standard Industrial Classification (SIC) codes. Such classifications are important, as any changes can have a significant impact on both the overall jobs estimates, the calculation of rates revenue foregone and to a lesser extent the cost of Exchequer capital allowances. This is because each of these has been calculated on the basis of standard multipliers associated with each SIC code.
Nevertheless, the combination of an increase in built floorspace and a stabilised occupancy rate has resulted in further growth in EZ employment over the year (by just under 500 or 2 per cent). Again, this masks variations between the four Zones, with a substantial increase of 23 per cent in East Durham (linked to the growth in occupancy noted above), a small increase in East Midlands (around 1 per cent), and minor decreases in Dearne Valley, and Tyne Riverside. Overall this maintains the reversed overall trend apparent in the last monitoring period, with the four EZs combined showing jobs growth.
The four EZs covered by this report are of different sizes, comprise several sites, were designated at different times, and up to the end of March 2007 had been developed at different scales:
Enterprise Zone Date Designated
Sites Area Dev’d (ha)
% of EZ Area
Built area (m2)
Est’d Jobs
Dearne Valley Nov 1995 6 107 72.3 341,692 6,602
East Durham Nov 1995 6 87 93.7 253,969 4,877
East Midlands Nov 1995 7 118 97.4 410,467 8,930
Tyne Riverside Feb-Oct 1996 11 91 78.8 357,864 8,810
Although there are clear differences between the four EZs, as a whole around 86 per cent of the available land area within them had been developed by the end of the monitoring period. Further details of this progress with respect to each EZ site are provided in Section 2 below.

Enterprise Zones Monitoring Report 2006/07 | 7
1.2 Monitoring the Enterprise Zones
Enterprise Zones have been subject to continuous formal monitoring since the designation of the first zones in 1981. The impact of the zones has also been evaluated in periodic reports, such as those by PA Cambridge Economic Consultants (1987 and 1995)2, and a number of different researchers and organisations have considered the impact of different aspects of the enterprise zone initiative. Sheffield Hallam University, initially supported by King Sturge, was appointed in July 2002 to continue the monitoring exercise for the remaining life of the last five enterprise zones, reporting on an annual basis through to mid-2007. The study team was also asked to consider the ‘transferable lessons’ that might be derived from enterprise zones, and these were the subject of a separate report published in January 20033.
Previous monitoring exercises have relied heavily on data reported by EZ Authorities, development agencies, developers, investors and property agents, as well as upon estimated information, where items could not be measured directly.
For the current series of monitoring reports, members of the study team have undertaken observation surveys on all EZ sites at regular intervals since the project was commissioned. These surveys have provided an excellent insight into changes taking place in the Zones, and consequently it is felt that this report presents as accurate a picture of the Enterprise Zones as they existed at the end of March 2007 as can reasonably be expected. Nevertheless, as one of the EZ benefits is reduced governmental reporting, some of the results are based on informed estimates and observations and should be treated with appropriate caution.
As with the previous monitoring exercises, the study team has liaised with EZ authorities and other organisations active in the four zones. For the most part this has been achieved through telephone and email contact. In order to provide a permanent record of changes and progress in the Enterprise Zones the team has constructed an electronic map-based record of EZ data, using Geographical Information System (GIS) techniques. The base maps contain Ordnance Survey data, which has been downloaded from the EDINA Digimap service, for which Sheffield Hallam University holds a licence. Although the Ordnance Survey electronic map data are continually updated, there is often a considerable time-lag in the latest versions becoming available via the Digimap service. Because of this, more recently the digital OS Landline base maps supplied under licence by Communities and Local Government were used. The up-dating of the digital map data also appears to vary between different parts of the country, so not all buildings were shown at the time when the annual monitoring returns were compiled. Therefore, some building ‘footprints’ have not been digitised and in such cases building curtilages and gross floor areas had to be estimated by the study team.
2 Department of the Environment (1987) An Evaluation of the Enterprise Zone Experiment, London: DoE. Department of the Environment (1995) Final Evaluation of Enterprise Zones, London: DoE.
3 Office of the Deputy Prime Minister (2003) Transferable Lessons from Enterprise Zones, London: ODPM. www.communities.gov.uk/archived/publications/citiesandregions/transferablelessons

8 | Enterprise Zones Monitoring Report 2006/07
Building footprints have been digitised for each building recorded in our survey4; these provide gross external areas, at ground floor level only, for the buildings in question. Where it has been possible to obtain accurate floor areas for buildings (including upper floors), for example from reports of property transactions or from estate agents details, this is stated in the ‘size of building’ columns. In some cases it has not been possible to verify the precise method of measurement used in preparation of the agent’s particulars. However, it is likely that slight differences in measurement approach for the few buildings concerned will have had a minute impact on the overall result. Metric measurements (square metres) are used throughout this report, but many estate agents still use imperial measurements; where these have been obtained they have been converted to the metric equivalents.
Where it has not been possible to verify the actual floor areas of buildings the digitised footprints have been used in order to estimate the total floor areas as follows:
• industrial buildings with an estimated 10 per cent office content on two floors – multiply the digitised area by 1.05
• industrial buildings with an estimated 20 per cent office content on two or more floors – multiply the digitised area by 1.10
• multi-storey office buildings – multiply the digitised area by the number of floors.
Digitised floor areas are measured over the external walls of buildings – gross external areas – whereas industrial buildings are normally let on the basis of gross internal areas and office buildings on net internal areas (after deducting entrance halls, stair and lift wells, toilets etc.). The use of gross external areas gives figures that are up to 5 per cent larger than gross internal areas, the difference being the thickness of the external walls. The use of these gross figures for the purpose of calculating construction costs, as prices per square metre, gives a more accurate estimate of costs than the use of internal areas, especially in the case of office buildings where circulation spaces etc. may differ significantly from one building to another.
The individual building data provide an added level of detail over that provided in previous monitoring reports. However, it should be borne in mind that the monitoring figures contained in this report are gross indicators, measuring actual activity within the EZs since designation. They include a comparison of change since the previous monitoring year to illustrate change over the last financial year. No account is taken in this report of what would have happened without EZ designation in each of the areas (deadweight), or of any offsetting changes that may have occurred outside the EZs (displacement). The real net economic impact of the EZs, and performance comparisons between EZs, cannot be achieved by monitoring studies such as
4 Where buildings were not shown on the original base map but were subsequently found to have been completed prior to 31 March 2006, the areas are digitised from later versions. If no digitised areas are stated this means that the buildings in question are not shown on the latest available versions of the electronic maps.

Enterprise Zones Monitoring Report 2006/07 | 9
the one reported here. Consideration of issues such as these have to be dealt with in evaluation studies, such as those referred to above.
In the sections that follow, the variables and the Enterprise Zones covered are the same as those reported upon in the 2005/06 monitoring report.

10 | Enterprise Zones Monitoring Report 2006/07
Section 2: Enterprise Zone Profiles
2.1 Introduction
This section of the report summarises the basic characteristics of each Enterprise Zone, providing a general description of the industrial background of the four EZ areas and the state of the sites at the time of designation. It also provides a brief overview of the state of development of each EZ as at 31 March 2007.
2.2 Dearne Valley
Zone description
The Dearne Valley Enterprise Zone contains five sites in South Yorkshire. This was an important coal mining area containing several major collieries, each with their associated communities. The main form of transport in the area was rail, for hauling coal from the mines and the road system was largely undeveloped. Situated to the east of the M1 motorway, to the south and east of Barnsley, it was necessary to undertake extensive infrastructure works, in the form of a new link road east from the M1 towards Doncaster and the A1, before much development work could be undertaken. Several of the sites were formerly parts of collieries and their associated spoil heaps, and extensive land reclamation has been required.
Date of designation: November 1995
Date of expiry: October 2005
Area of zone: 146 hectares
Zone authority: Dearne Valley Partnership / Yorkshire Forward
District Councils: Barnsley MBC, Doncaster MBC, Rotherham MBC
Number of sites in zone: six
Previous use of Land: coal mining
Number of jobs created/protected: 6,602
The sites within the zone are briefly described as follows:
Manvers (DV1) – this site lies to the north-east of Wath-upon-Dearne and has been developed with a mix of industrial and office uses. The location has proved to be very popular for call centre operations, and to a lesser extent for public sector ‘back office’ functions. While a great deal of the land is now developed, a substantial unbuilt tract in the northern part remains.
Enterprise Zones Monitoring Report 2006/07 | 11
Fields End (DV2) – located on the western edge of Goldthorpe, until recently development on this site comprised five buildings, two of which (both distribution warehouses) are vacant. During 2006/07 construction of six new office units were completed on the remaining vacant land at the northern end of the site. These all remained vacant at the time of the final monitoring visit.
Goldthorpe Industrial Estate (DV3) – part of a well established industrial estate, this site is fully developed with four industrial buildings, one of which was vacated during 2006/07. The other three retained their long-standing occupiers.
Denaby Lane Industrial Estate (DV4) – this is also an extension to an existing industrial estate, with three manufacturing buildings and some small industrial units. Recent construction work means that there is now little land available for further development. It also means that there are several small and medium-sized industrial units to let in this part of the Zone.
Cortonwood Park (DV5) – the site of the former Cortonwood Colliery, this is now occupied by seven relatively large units, specialising in manufacturing and distribution. Land in the south-east corner, adjacent to the new retail park, has recently been developed with two further retail warehouse units.
Waterside and Valley Business Parks (DV6) – this site is now fully developed with a mix of industrial and office buildings, given over to a variety of different activities.
2.3 East Durham
Zone description
The East Durham Enterprise Zone lies within the former East Durham coal mining area. The Enterprise Zone contains six different sites in different locations on the east side of Durham although only one at Dawdon is a former colliery. Three of the sites are located at Shotton, to the west of Peterlee, the new town developed from the 1960s onwards, and represent an extension of an existing industrial estate. These sites have good access to and from the A19. The fourth site forms part of an established industrial estate and is situated to the south of Sunderland and also has a good connection to the A19. The remaining two sites are more remote in terms of main road access being situated approximately one and a half miles east of the A19 at Seaham.
Date of designation: November 1995
Date of expiry: October 2005
Area of zone: 92.3 hectares
Zone authority: East Durham Development Agency/One North East

12 | Enterprise Zones Monitoring Report 2006/07
District Councils: Easington District Council
Number of sites in zone: six
Previous use of land: colliery, greenfield
Number of jobs created/protected: 4,877
The sites within the zone are briefly described as follows:
Bracken Hill Business Park (ED1) – this site is located to the west of Peterlee, and has good access to the A19 dual carriageway. It is now almost fully developed, with a focus on back office functions and call centres as the major occupiers.
Evolve Industrial Estate (ED2) – this is an extension of existing industrial development to the west of Peterlee. It has been developed mainly for industrial uses, with a particular emphasis on the manufacture of plastics products.
The Whitehouse Industrial Estate (ED3) – this site is located in between ED1 and ED2, and is another extension of the existing South West Industrial Estate. It contains a mixture of industrial and office buildings. However, five of the nine completed buildings remain vacant, including four medium-sized industrial units. A further office block was completed during 2006/07, leaving just a small part of the site still undeveloped.
The Seaham Grange Industrial Estate (ED4) – this site is located to the north-west of Seaham, and houses a mixture of industrial units and distribution warehouses. It is now fully developed. Just three of the thirty buildings were vacant at the end of March 2007.
The Fox Cover Industrial Estate (ED5) – this site is located to the south-west of Seaham. Development here started on this site rather late during EZ designation, with five of the six buildings being completed over the last two years. This followed the completion of a new access road. By March 2007, just two of the six completed buildings had found occupiers.
Dawdon Business Park (ED6) – located to the south of Seaham, this estate has several industrial and office units, along with a number of sites laid out in readiness for development. During the past year two new occupiers have moved in, leaving three units still vacant. Two of these are four-storey office blocks completed during 2005/06.
2.4 East Midlands
Zone description
The East Midlands EZ comprises seven sites, four of which are in accessible locations close to the M1 motorway. Holmewood (EM1, 2 and 3) is situated to the east of Chesterfield and a little over one mile from junction 29 of the M1 motorway. Sherwood Park (EM7) is located immediately adjacent to

Enterprise Zones Monitoring Report 2006/07 | 13
junction 27 of the M1, to the south of Kirkby in Ashfield. The Manton Wood site (EM4) is also well located in terms of transport communications, close to the A57 by-pass east of Worksop, and approximately three miles west of the A1 trunk road. The remaining two sites at Crown Farm, Forest Town, Mansfield (EM5 and 6) are more remote from the north-south road links but are in a well established industrial area. The zone authorities and the East Midland Development Agency have endeavoured to operate a jobs related policy (61 jobs per hectare) in respect of firms wishing to locate in the EZ.
Date of designation: September 1995 (EM 5 & 6); November 1995 (EM1, 2, 3, 4 &7)
Date of expiry: August 2005 (EM 5 & 6); October 2005 (EM1, 2, 3, 4 &7)
Area of zone: 119.8 hectares
Zone manager: North East Derbyshire DC
District Councils: Ashfield, Bassetlaw, Mansfield and North East Derbyshire
Number of sites in zone: seven
Previous uses of land: mostly greenfield sites but some former colliery land
Number of jobs created/protected: 8,930
The sites within the zone are briefly described as follows:
Holmewood (EM 1–3) – this covers three adjacent sites totalling 18.3 hectares, parts of which included former colliery installations. At the time of designation these sites formed part of an existing industrial estate. Development is now well advanced, with only a couple of small plots remaining vacant. Uses on the site are mainly related to manufacturing, with some distribution and other warehousing. The area has a very high occupancy rate (95 per cent).
Manton Wood (EM 4) – this is a single greenfield site with an area of 16.1 hectares. Services and infrastructure were installed by English Partnerships following designation, so that plots were only available for development from November 1997 onwards. Since then it has become fully developed as a location for manufacturing industries, with the emphasis being on foods, textiles and plastic mouldings. There are now just two unoccupied units on this site.
Crown Farm (EM 5 & 6) – this comprises two adjacent sites, part greenfield and part former colliery land, totalling 18.2 hectares. The former colliery land was mostly cleared by the date of designation, but extensive earth and drainage works were required to open up the greenfield sites for development. Some of the old colliery buildings were retained as small industrial units. These have been supplemented by further terraces of more modern units, with some business offices interspersed, on the southern part of the site, and a smaller number of larger manufacturing-based units on the northern part. The
14 | Enterprise Zones Monitoring Report 2006/07
completion of seven further medium-sized industrial units meant that this site was fully developed by the end of the 2006/07 monitoring period. These still remain on the market; however, only one of the twenty-two earlier buildings was vacant at the time of the last monitoring visit.
Sherwood Park (EM 7) – this is a single site of 67.2 hectares, comprising greenfield land surrounding the long established Kodak factory. Extensive infrastructure works opened up the site for development, so that it now hosts a mixture of uses, including manufacturing, distribution, utilities and offices. There was a flurry of development towards the end of the EZ designation, with eleven buildings completed during 2005/06, and three more under construction at the time of the last monitoring visit. While earlier buildings are almost fully occupied, most of this more recent development remained vacant, at the end of 2006/07.
2.5 Tyne Riverside
Zone description
The Tyne Riverside Enterprise Zone comprises eleven sites, eight to the north of the River Tyne and three to the south. Seven of the sites on the north side of the river fall into two distinct groups, four sites (TR1–4) located closely together north west of West Chirton – the Silverlink sites – and two sites (TR 6 and 7) immediately to the east of Longbenton. The eighth ‘north of the river’ site (TR8) forms part of the Royal Quays development to the south of Tynemouth. Apart from the two Longbenton sites, all are in close proximity to the A19 dual carriageway and its southwards link via the Tyne Tunnel. The three sites on the south side of the river (TR9, 10 and 11) are located to the east of Jarrow and are also conveniently located close to the A19.
Date of designation: February, August and October 1996
Date of expiry: January, July and September 2006
Area of zone 110.57 hectares
Zone authorities: One North East
District Councils: North Tyneside MBC, South Tyneside MBC
Number of sites in zone: eleven
Previous use of land: colliery, steel, greenfield
Number of jobs created/protected: 8,810
The sites within the zone are briefly described as follows:
The Silverlink Site (TR1) – this is a complex of nine buildings occupied by a single company, Atmel, having previously been developed by Siemens. A substantial part of the site to the east remained undeveloped, at the end of 2006/07.

Enterprise Zones Monitoring Report 2006/07 | 15
The Cobalt Business Park (TR2) – this site is emerging as a successful call centre location, with a mixture of public and private sector operators. Three out of five newly completed office buildings have been occupied over the last year, and two more substantial office blocks are under construction, leaving just two large vacant plots undeveloped.
Silverlink South (TR3) – this small site is fully developed, containing two office buildings, one of which is shared by two occupiers.
Middle Engine Lane (TR4) – this is another small site adjacent to the Stephenson Railway Museum. At present it contains two car showrooms and a two-unit extension to a terrace of industrial buildings. The north-eastern corner is still available for development.
The New York Industrial Park (TR5) – this site is now fully developed. With only two of the twenty industrial properties still seeking occupiers. Users comprise a range of manufacturing industries, with paper products, printing and transport components well represented, along with various distribution facilities.
Balliol Business Park West (TR6) – with a small office building under construction, this site is now fully developed. It acts primarily as an office park. All completed buildings are currently occupied.
Balliol Business Park East (TR7) – this site was previously occupied by VIA Systems, but following its withdrawal the building was demolished. In its place a series of newly constructed office and call centre units are gradually appearing as part of the ‘Quorum’ development. To date four of these have been occupied, with the remaining four still vacant, and there is one office block still under construction.
The Baltic Enterprise Park (TR8) – all land here is now developed, mainly for office and call centre uses. All but two of the seven units are currently occupied, two with multiple tenants or occupiers (including the Centre for Advanced Industries, an incubator unit with 29 sub-tenants).
Viking Industrial Estate (TR9) – this is a small site adjacent to the Eco Centre to the west of Jarrow, fully taken up by a 3,700 square metre office building and its associated car parking area. This building is occupied by the area’s Primary Care Trust.
The Network Centre (TR10) – this is mainly covered by three terraces of small industrial units, most of which are occupied, plus a more recently completed freight container depot which remains vacant. The extensive land take required for the latter means that no further plots are available for development.
The Viking Industrial Park (TR11) – fronting onto the south bank of the River Tyne, this site focuses on distribution facilities and business offices. Completion of two office buildings during 2004/05 means that the site is now fully developed. Three of the nine units remained unoccupied at the end of 2006/07.

16 | Enterprise Zones Monitoring Report 2006/07
Section 3: Principal Outputs 2006/07
3.1 Sources and Methods
Land and property
Information has been derived from a range of sources, including observation surveys, development agencies and local authorities covering the EZ sites, developers, investors and property agents. Typical rental values have been estimated by averaging and rounding the figures being quoted by property agents marketing currently vacant property in the four zones.
The information on land and property relates to the floorspace started, completed and under construction during 2006/07. In addition, there are tables providing snapshots of the state of the EZs at the end of the year, showing for example the stocks of vacant and occupied land and floorspace. In relation to these snapshots, or stock data, it is the amount of change over the year (for example, increases in developed land or occupied floorspace) that measures policy outputs.
In line with previous reports during the current phase of monitoring, buildings have been classified according to 11 different types. These are outlined in Box 3.1 below. This approach is an attempt to increase the detail and relevance of the analysis provided in the monitoring report.
Box 3.1 Building Types
1. Call centres type A – basic industrial office type units
2. Call centres type B – large clear span ‘hangar-like’ buildings, set in well-landscaped grounds
3. High-tech manufacturing: modern buildings, say for electronics type industries, possible lower headroom or two-storey manufacturing areas, with high, 20–25% office content
4. Conventional industrial buildings: 5.5 to 8 metres eaves heights and 5–10% office content, development densities around 40–45%
5. Modern industrial buildings: similar eaves heights to conventional offices but with higher office content, say 10–20%, and set in well-landscaped areas and development densities of 30–35%
6. Distribution warehouses: large clear span buildings with numerous loading doors, including tail-docking, office content 5–10% or even lower, includes cold stores
7. Conventional four/five storey offices: speculative type development, brick clad with good car-parking, minimal landscaping and high site coverage
8. Conventional two-storey offices: speculative or owner occupied, well landscaped and with good car parking, site coverage 30–35%
9. Retail warehouses: large open buildings with limited office content and extensive car parking, minimal landscaping, also includes car showrooms
10. Small, conventional industrial units – eg in terraces
11. Hotels and restaurants

Enterprise Zones Monitoring Report 2006/07 | 17
For this report covering 2006/07, the classification of building types has been used as the basis for calculating expenditure on new developments, and by extension, the cost of Exchequer tax incentives. Hence the information on such matters in the tables contained in Appendix 1 is based on building type, rather than the nature of the occupier or more accurately their SIC. This means that investment in all completed buildings can be captured immediately after completion, irrespective of whether they have been occupied or remain vacant. Floor areas are provided for each building in square metres, derived wherever possible from their digitised footprints, or, failing this, by means of approximate scaling from Ordnance Survey maps and observation surveys. Those in the latter category may be subject to revision in subsequent surveys and reports.
Economic activity and employment
To identify industrial and commercial businesses operating in the EZs, the study team has used physical surveys and information supplied by development agencies, local authorities, the owners and occupiers of land and property, and the Internet websites of occupying firms. Information on changes in business activity has been gathered from similar sources. Employment estimates have been derived by applying standard employment densities to the occupied floorspace in each of the Zones. These density figures were derived from the survey of EZ occupiers and other sources, carried out by Sheffield Hallam University in December 2002 and January 2003. This more transparent approach replaces the more ‘hit-and-miss’ estimation methods used in previous monitoring reports.
Private sector investment
The figures provided relate to construction investment in the EZs, including plant and machinery integral to buildings and external works within the curtilage of each property. They do not cover non-integral plant and machinery. Estimates have been calculated by multiplying the figures on floorspace completed during the year by the average construction costs for different building types and geographical areas5, and adding an allowance for external works6. These costs have been taken from the BCIS General Tender Index, with adjustments for regional variations applied using data from the DTI’s Construction Statistics Quarterly Price Indices (as the Annual Report for 2006/07 is not yet available). Accordingly, the figures are rough estimates and are not based on actual contract figures.
Public sector receipts
Information was provided by the recipient organisations – local authorities and development agencies – on public sector receipts associated with the EZ schemes. These comprise rent on publicly owned property, and capital receipts from the sale of land and property to the private sector.
5 BCIS Quarterly Review of Building Prices, RICS, December 2006.6 An allowance of 12.5% for external works.

18 | Enterprise Zones Monitoring Report 2006/07
Comparisons between 2006/07 and previous years
The present report focuses on the year 2006/07, ending on 31 March 2007; it also includes some data on 2005/06, for purposes of comparison. The study team previously completed a report on ‘transferable lessons’ from the Enterprise Zones scheme, which was published in January 2003 (see footnote 3). Information collected during the course of the work on that report – mainly from a questionnaire survey and from workshops – has also been used to inform this report, especially with regard to the estimation of data.
Classification of occupier activities
Some of the information presented in the following tables has been classified according to relevant 1992 Standard Industrial Classification (SIC) section and subsection codes. These have been retained to allow for consistency and comparability between monitoring periods, even though a more recent (2003) and updated classification has become available. For the majority of the occupiers the study team has relied upon the classification assigned at the time of previous monitoring rounds. For new occupiers and in cases of doubt, the code allocated to an occupier or activity has been based on observation, the study team’s knowledge of the organisation concerned or by checking against Internet websites. The basic descriptions for each of the SIC codes used in the report are as follows:
Standard Industrial Classification (1992) Section and Subsections:
D Manufacturing
DA Manufacture of food products, beverages and tobacco
DB Manufacture of textiles and textile products
DC Manufacture of leather and leather products
DO Manufacture of wood and wood products
DE Manufacture of pulp, paper and paper products, publishing and printing
DF Manufacture of coke, refined petroleum products and nuclear fuels
DG Manufacture of chemicals, chemical products and man-made fibres
DH Manufacture of rubber and plastic products
DI Manufacture of other non-metallic mineral products
DJ Manufacture of basic metals and fabricated metal products
DK Manufacture of machinery and equipment not elsewhere classified
DL Manufacture of electrical and optical equipment
DM Manufacture of transport equipment
DN Manufacture of equipment not elsewhere classified
E Electricity, gas and water

Enterprise Zones Monitoring Report 2006/07 | 19
F Construction
G Distribution (wholesale & retail)
H Hotels and restaurants
I Transport, storage, etc.
J Financial services
K Real estate & business activities
L Public administration
M Education
N Health and social work
O Other community, social and personal service activities

20 | Enterprise Zones Monitoring Report 2006/07
Section 4: Public Expenditure Costs 2006/07
4.1 Sources and Methods
The report covers three types of public expenditure:
i. The cost of EZ rate exemption, which equals the value of the non-domestic rates that would normally be payable by businesses operating in the EZs
ii. The cost of EZ capital allowances, equal to the corporation and income tax that would normally be payable, but from which taxpayers are exempted under the EZ regime
iii. Public expenditure on land and infrastructure in the EZs.
The first two elements represent revenue foregone rather than actual expenditure; and they are costs directly and unambiguously attributable to the EZ scheme, since rates exemption and tax allowances are legally part of the EZ regime. A new form of investment vehicle has grown up around Enterprise Zones, providing a means by which higher rate (40%) taxpayers can obtain tax relief on their investments. Such Enterprise Zone Investment Trusts (and similar vehicles) will therefore be eligible to tax relief at this rate, whereas corporate investors will receive tax relief at lower rates, up to 30%, according to the size of the company. The third item, spending on land and infrastructure, is not a statutory element of the scheme. The reason for including it – as it was in earlier monitoring – is that in practice public expenditure on laying out and servicing development sites has proved an integral element in the development of the EZs. By the time of this report, however, most of this expenditure had been incurred in earlier years.
The monitoring exercise does not cover both promotion and management of the EZs, or expenditure unrelated to the EZ scheme, such as business support or regional selective assistance provided under other legislation. The figures also exclude expenditure incurred before designation. In relation to currently designated sites, this is an important gap; to assess the true cost of these EZs, therefore, this report should be read in conjunction with the baseline data provided by EZ Authorities, which do report pre-designation expenditure.
4.2 Public Expenditure
Table 4.1 Rates Revenue foregone
As EZ designation had already expired for three of the Zones covered by this report, the estimated rates revenue foregone has been calculated for Tyne Riverside only. The estimates have been derived by applying typical

Enterprise Zones Monitoring Report 2006/07 | 21
rateable values to the existing floorspace stock and multiplying these by the Uniform Business Rate for England in force during 2006/07 (as shown on www.mybusinessrates.gov.uk). These rateable values have been adjusted for the last two monitoring periods to account for the Rating Revaluation undertaken during 2005. This was achieved by applying typical percentage increases to the values applied in previous monitoring rounds. Because these values are based on the SIC of occupier firms, any vacant floorspace is recorded as a ‘nil’ return. The general nature of the rateable values used in the calculations means that these estimates are very approximate and therefore merely indicative.
Table 4.2 Exchequer Cost of EZ Capital Allowances
No data are available from the Inland Revenue about the allowances claimed under the EZ regime. Therefore, Exchequer cost is estimated on the basis of construction completions during the year under review. The results produce only broad approximations. Under the EZ scheme investors, both companies and individuals can claim 100% tax relief against the costs incurred in constructing new industrial and commercial buildings, or in refurbishing and converting buildings for industrial and commercial uses. Relief can be claimed at the taxpayers’ maximum rate of tax – 40% for individuals and 30% for companies with taxable profits in excess of £1.5m and 19% for smaller companies. Where the investment exceeds the taxpayer’s taxable income/profits for the year of investment, relief can be claimed in subsequent years.
In previous monitoring reports the approach adopted has been to discount the cost of the 100% tax allowances over 25 years, in order to arrive at a net present value. The reality of the situation, however, is that investors are more likely to claim the full relief in the year in which the investment is made, especially if they are private investors investing in EZs through EZ investment trusts or other single purpose vehicles established primarily to take advantage of the capital allowances. The approach adopted in the present report therefore has been to treat the tax allowances as if they have all been taken in the tax year during which the investment has been made – ie in 2006/07. For this reason, all buildings completed in the three ‘expired’ Zones, but commenced prior to date of expiry, have been included in the analysis. As a means of reconciling the variable tax rates for different investors, a flat rate of 35% has been applied to all construction investments.
In non-EZ situations, investors in some industrial buildings (used for manufacturing purposes) can claim tax relief over the expected life of the buildings (25 years). A similar situation also exists in respect of some hotel buildings. Thus, the approach adopted in the present report may slightly overstate the actual cost to the Exchequer of the capital allowances, as it disregards the net present value of the capital allowances that would have been claimable over 25 years against investments in manufacturing and hotel buildings.
Table 4.3 Public Expenditure on Land and Infrastructure
The data were provided by public spending bodies.

22 | Enterprise Zones Monitoring Report 2006/07
Section 5: Supplementary Information
5.1 Sources and Methods
This section provides additional data required by the European Commission, comprising:
i. Two further output indicators
• New Recipients and New Projects Assisted (table 5.1)
• Jobs Created (table 5.2)
ii. Estimates or forecasts of public expenditure costs in 2007/08 (tables 5.3–5.5).
5.2 Additional Indicators
Table 5.1 New Recipients and New Projects Assisted
This table seeks to meet the requirement of the EC Commission for data on new recipients of assistance and new projects assisted. These concepts are difficult to apply to EZs, because the assistance available under the EZ scheme is not project-based. The table shows the number of industrial and commercial establishments, which started operation in the EZs, and the numbers of property developments completed, in 2006/07. It specifically does not provide any information as to support provided on an ongoing basis to organisations that had taken up occupation in the EZs in previous years.
Table 5.2 Jobs Created
The figures respond to the EC Commission’s requirement for an estimate of the jobs created under the scheme. The indicator used is employment change in the EZs over the year.
Table 5.3 Rates Revenue Foregone 2007/08 Estimated
The expiry of Enterprise Zone status for all four areas in either 2005/06 or 2006/07 mean that this provision no longer applies, and hence all Zones have a zero estimate. However, these figures have been included to maintain consistency with previous monitoring reports.

Enterprise Zones Monitoring Report 2006/07 | 23
Table 5.4 Exchequer Cost of EZ Capital Allowances 2007/08 Estimated
The figures were estimated by the monitoring team, using the same method as for 2006/07 (see section 3). As in previous reports, it has been assumed that the floorspace completed in 2007/08 will equal the total under construction on 31 March 2007. As explained earlier, this is a conservative assumption, and therefore the figures are low estimates.
Table 5.5 Public Expenditure on Land and Infrastructure 2007/08 Estimated
The figures are broad estimates provided by EZ Authorities and development agencies. However, the expiry of EZ status, combined with the almost complete take-up of the EZ sites, mean that little activity is forecast in the near future.

24 | Enterprise Zones Monitoring Report 2006/07
Section 6: Recent Development Trends
6.1 Introduction
A set of additional charts has also been included in this final monitoring report in the series, tracing the main development trends across the four EZs. This analysis broadly covers the second half of their designation (2001/02 to 2006/07).
These charts may be found in Appendix 2.
6.2 Sources and Methods
Figure 6.1 Percentage of Land Area Developed and Land Under Construction
Both indicators are based on information contained in successive versions of Table 3.1: Physical State of Land. ‘Land area developed’ has been defined as an aggregation of ‘Built Up (Developed)’; ‘Open Space or Derelict Buildings’; and ‘Roads, Railway, Water and Others’. This has then been expressed as a percentage of the total land area within each EZ. A similar calculation has been made for the separate category ‘Land Under Construction’.
Figure 6.2 Amount of Floorspace Completed
This is based on successive versions of Table 3.3: Floorspace Completed, and shows the amount measured in square metres.
Figures 6.3–6.5 Floorspace Stock in Different Types of Building and Vacancy Rates
These charts are based on successive versions of Table 3.6: Floorspace Stock – all buildings in the EZs regardless of construction date. The overall amount (in square metres) for offices on the one hand, and factories and warehouses on the other, have been expressed as a percentage of total floorspace within each EZ. Retail buildings have been excluded because of their minimal presence. The same sources have been used to calculate the changing rate of unoccupied or vacant buildings in each EZ (again expressed as a percentage of total floorspace).
Figures 6.6–6.9 Floorspace Devoted to Different Types of User
These charts are based on successive versions of Table 3.7: Occupied Floorspace, and combine various SIC codes into four broader groupings:

Enterprise Zones Monitoring Report 2006/07 | 25
• Manufacturing Industries (SICs DA to DN, plus F – Construction)
• Distribution and Leisure Uses (SICs E, G, H and I)
• Financial and Business Services (SICs J and K)
• Public and Other Services (SICs L, M, N and O).
The aggregate amounts under each are expressed as a percentage of total built floorspace.
Figure 6.10 Estimated Employment
This chart is based on successive versions of Table 3.10: Industrial and Commercial Employment – by activity. It shows the estimated number of full-time equivalent jobs that exist within each EZ.
Figure 6.11 Private Investment in Construction
This chart is based on successive versions of Table 3.12: Private Sector Investment in Construction. It shows the estimated amount spent by private sector developers in construction activity within each EZ. Figures are based on current prices, and in thousands of pounds.
Figure 6.12 Public Sector Receipts
This chart is based on successive versions of Table 3.14: Public Sector Receipts – By type of organisation. It shows the reported aggregate amounts, in thousands of pounds, received by local authorities and development agencies with respect to land and property sales, rental and leasehold income, and other items such as wayleaves.
Figure 6.13 Uniform Business Rates Relief
This chart is based on successive versions of Table 4.1: Rates Revenue Foregone. For each EZ it shows the total estimated amount of Uniform Business Rate income foregone. Again, figures are expressed as current prices and in thousands of pounds.
Figure 6.14 Capital Allowances
This chart is based on successive versions of Table 4.2: Exchequer Cost of EZ Capital Allowances. It shows the estimated cost to the Exchequer of tax reliefs claimable against newly completed construction in each of the EZs. Again, figures are expressed as current prices and in thousands of pounds.
Figure 6.15 Public Expenditure
This chart is based on successive versions of Table 4.3: Public Expenditure on Land and Infrastructure. It shows the reported aggregate amounts, in thousands of pounds, of expenditure on land acquisition, highways development, site reclamation and improvement, and other items such as design fees.
26 | Enterprise Zones Monitoring Report 2006/07
Appendix 1: Monitoring Tables
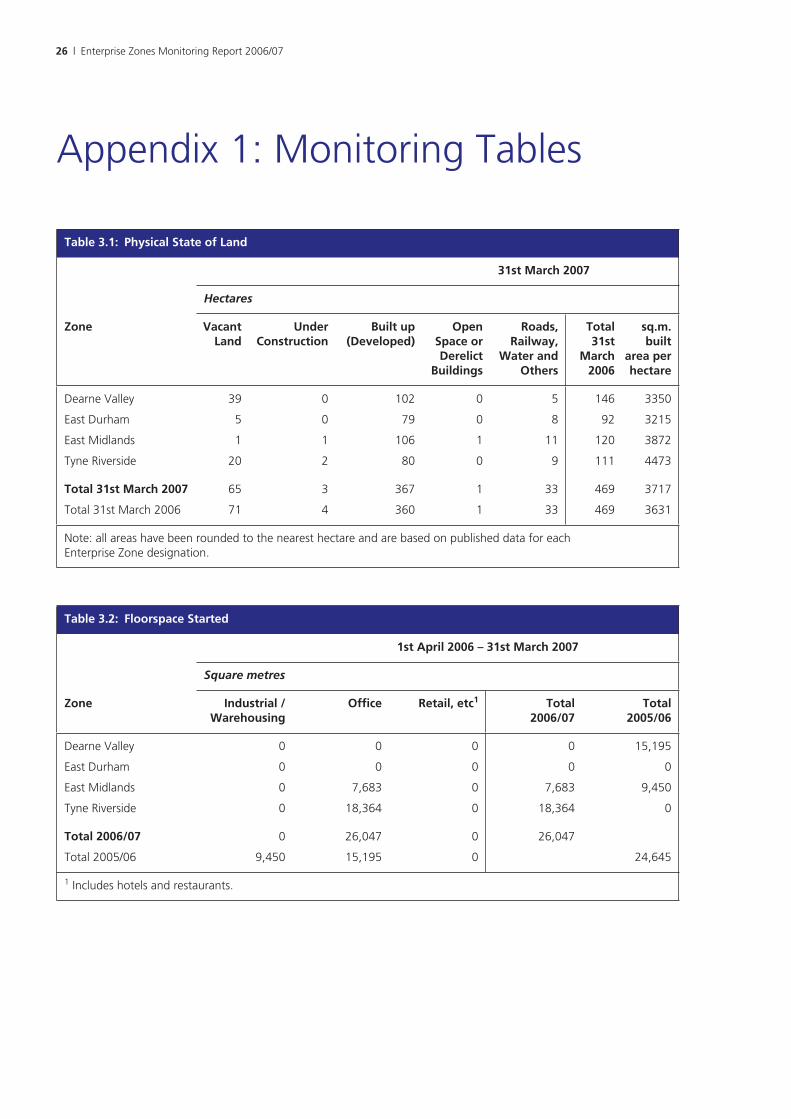
Table 3.1: Physical State of Land
31st March 2007
Hectares
Zone Vacant Land
Under Construction
Built up (Developed)
Open Space or Derelict
Buildings
Roads, Railway,
Water and Others
Total 31st
March 2006
sq.m. built
area per hectare
Dearne Valley 39 0 102 0 5 146 3350
East Durham 5 0 79 0 8 92 3215
East Midlands 1 1 106 1 11 120 3872
Tyne Riverside 20 2 80 0 9 111 4473
Total 31st March 2007 65 3 367 1 33 469 3717
Total 31st March 2006 71 4 360 1 33 469 3631
Note: all areas have been rounded to the nearest hectare and are based on published data for each Enterprise Zone designation.
Table 3.2: Floorspace Started
1st April 2006 – 31st March 2007
Square metres
Zone Industrial / Warehousing
Office Retail, etc1 Total 2006/07
Total 2005/06
Dearne Valley 0 0 0 0 15,195
East Durham 0 0 0 0 0
East Midlands 0 7,683 0 7,683 9,450
Tyne Riverside 0 18,364 0 18,364 0
Total 2006/07 0 26,047 0 26,047
Total 2005/06 9,450 15,195 0 24,645
1 Includes hotels and restaurants.

Enterprise Zones Monitoring Report 2006/07 | 27
Table 3.3: Floorspace Completed
1st April 2006 – 31st March 2007
Square metres
Zone Industrial / Warehousing
Office Retail, etc Total 2006/07
Total 2005/06
Dearne Valley 4,620 15,195 0 19,815 9,429
East Durham 20,291 2,040 0 22,331 16,299
East Midlands 8,250 0 0 8,250 10,791
Tyne Riverside 0 1,978 0 1,978 11,853
Total 2006/07 33,161 19,213 0 52,374
Total 2005/06 8,995 33,527 5,850 48,372
Table 3.4: Floorspace Completed by type of developer
1st April 2006 – 31st March 2007
Square metres
Zone Private sector firm building
for own occupation
Private sector developer / Investment Institution
Public Sector
Other Private Sector
Total 2006/07
Total 2005/06
Dearne Valley 0 19,815 0 0 19,815 9,429
East Durham 0 22,331 0 0 22,331 16,299
East Midlands 0 8,250 0 0 8,250 10,791
Tyne Riverside 0 1,978 0 0 1,978 11,853
Total 2006/07 0 52,374 0 0 52,374
Total 2005/06 7,739 40,633 0 0 48,372
Table 3.5: Floorspace Under Construction
31st March 2007
Square metres
Zone Industrial / Warehousing
Office Retail, etc Total 31/03/06
Total 31/03/05
Dearne Valley 0 0 0 0 19,595
East Durham 0 0 0 0 3,200
East Midlands 0 7,683 0 7,683 8,250
Tyne Riverside 0 16,386 0 16,386 0
Total 31st March 2007 0 24,069 0 24,069
Total 31st March 2006 13,810 17,235 0 31,045

28 | Enterprise Zones Monitoring Report 2006/07
Tab
le 3
.6:
Flo
ors
pac
e St
ock
– a
ll b
uild
ing
s in
th
e EZ
s re
gar
dle
ss o
f co
nst
ruct
ion
dat
e
31st
Mar
ch 2
007
Squa
re m
etre
s
Off
ice
Indu
stri
al /
W’h
ouse
Reta
ilTo
tal
31st
M
arch
20
07
Tota
l31
st
Mar
ch
2006
Zone
Vaca
ntO
ccup
ied
Tota
lVa
cant
Occ
upie
dTo
tal
Vaca
ntO
ccup
ied
Tota
lVa
cant
Occ
upie
dTo
tal
Vaca
ntO
ccup
ied
Tota
l
Dea
rne
Val
ley
43,1
1674
,952
118,
068
45,6
1016
8,59
121
4,20
10
9,42
29,
422
88,7
2625
2,96
534
1,69
266
,729
255,
721
321,
877
East
Dur
ham
35,1
6651
,864
87,0
3034
,078
132,
550
166,
628
031
231
269
,244
184,
725
253,
969
73,9
6415
7,67
423
1,63
8
East
Mid
land
s7,
087
46,6
7653
,763
27,1
2832
2,13
634
9,26
40
7,44
17,
441
34,2
1537
6,25
241
0,46
736
,284
365,
934
402,
217
Tyne
Riv
ersi
de51
,335
123,
302
174,
638
16,6
3416
3,26
617
9,90
00
3,32
63,
326
67,9
6928
9,89
535
7,86
476
,279
274,
697
355,
885
Tota
l 31/
03/0
713
6,70
429
6,79
543
3,49
812
3,45
078
6,54
290
9,99
30
20,5
0120
,501
260,
154
1,10
3,83
81,
363,
992
Tota
l 31/
03/0
613
3,02
827
1,90
540
4,93
311
8,55
376
0,39
387
8,94
61,
675
21,7
2723
,402
253,
255
1,05
4,02
61,
311,
617

Enterprise Zones Monitoring Report 2006/07 | 29
Tab
le 3
.7:
Occ
up
ied
Flo
ors
pac
e
31st
Mar
ch 2
007
Squ
are
met
res
Zon
eSt
and
ard
Ind
ust
rial
Cla
ssif
icat
ion
(SI
C)
Co
des
(se
e p
ages
18–
19 f
or
a d
escr
ipti
on
of
each
SIC
co
de)
DD
AD
BD
CD
DD
ED
FD
GD
HD
ID
JD
KD
LD
MD
ND
(t
ota
l)
Dea
rne
Val
ley
014
,580
12,5
500
864
25,8
580
3,94
96,
325
035
,676
6,82
71,
588
09,
270
117,
487
East
Dur
ham
07,
130
4,46
50
3,71
58,
995
02,
529
35,8
590
14,7
4138
02,
060
20,7
360
100,
611
East
Mid
land
s1,
025
23,3
4213
,198
04,
001
00
1,16
413
,633
25,6
2217
,775
12,5
352,
303
32,8
644,
696
152,
156
Tyne
Riv
ersi
de16
16,
585
2,09
90
09,
852
01,
503
1,65
90
016
272
,120
17,2
424,
775
116,
158
Tota
l 31s
t M
arch
200
71,
186
51,6
3632
,312
08,
580
44,7
050
9,14
657
,476
25,6
2268
,192
19,9
0478
,070
70,8
4218
,741
486,
411
Tota
l 31s
t M
arch
200
61,
433
51,6
3642
,317
08,
580
35,7
101,
164
20,1
7058
,823
39,6
5357
,949
13,0
8211
2,46
421
,938
16,6
9448
1,61
2
Zon
eSt
and
ard
Ind
ust
rial
Cla
ssif
icat
ion
(SI
C)
Co
des
Tota
l 31s
t M
arch
200
7To
tal 3
1st
Mar
ch 2
006
EF
GH
IJ
KL
MN
O
Dea
rne
Val
ley
5,82
01,
672
27,6
923,
716
32,4
420
39,9
9716
,376
7,44
132
30
252,
965
255,
721
East
Dur
ham
10,3
202,
759
15,3
620
16,4
190
21,0
8010
,242
05,
362
2,57
118
4,72
515
7,67
4
East
Mid
land
s7,
178
6,02
410
4,68
26,
391
74,5
210
23,1
370
2,16
40
037
6,25
236
5,93
4
Tyne
Riv
ersi
de0
4,62
924
,946
035
,077
2,83
569
,815
18,7
170
11,3
406,
377
289,
895
274,
697
Tota
l 31s
t M
arch
200
723
,318
15,0
8417
2,68
210
,107
158,
459
2,83
515
4,02
945
,335
9,60
517
,025
8,94
81,
103,
838
Tota
l 31s
t M
arch
200
620
,052
16,6
5517
9,82
110
,107
102,
951
2,83
516
5,99
345
,335
9,60
513
,767
5,29
51,
054,
026

30 | Enterprise Zones Monitoring Report 2006/07
Tab
le 3
.8:
Esti
mat
ed R
enta
l Val
ues
31st
Mar
ch 2
007
£/Sq
uar
e m
etre
31st
Mar
ch 2
007
31st
Mar
ch 2
006
Zon
eIn
du
stri
al –
500
sq
.m. a
nd
less
by
un
it s
ize
501
– 1,
000s
q.m
.1,
001s
q.m
. an
d
ove
rO
ffic
esIn
du
stri
al –
500
sq
.m. a
nd
less
by
un
it s
ize
501
– 1,
000s
q.m
.1,
001s
q.m
. an
d
ove
rO
ffic
es
Dea
rne
Val
ley
N/A
46.5
049
.00
134.
0040
.75
45.7
548
.50
134.
00
East
Dur
ham
45.0
0N
/A49
.00
126.
5048
.50
48.5
047
.00
126.
00
East
Mid
land
s49
.00
53.7
549
.00
132.
50N
/AN
/A44
.50
130.
00
Tyne
Riv
ersi
deN
/AN
/A52
.50
153.
00N
/AN
/A54
.75
153.
00
Not
e 1:
the
fig
ures
for
bot
h ye
ars
are
base
d on
the
‘gro
ss’ r
enta
l cha
rges
quo
ted
in a
gent
s’ b
roch
ures
or
in r
espo
nse
to e
nqui
ries.
Not
e 2:
In s
ome
cate
gorie
s fe
w, i
f an
y, t
rans
actio
ns t
ook
plac
e or
off
ers
brou
ght
to m
arke
t du
ring
the
year
200
6/07
, so
figur
es h
ave
ther
efor
e be
en e
stim
ated
on
the
basi
s of
m
arke
t tr
ends
, or
indi
cate
d as
‘N/A
’ (N
ot A
vaila
ble)
.

Enterprise Zones Monitoring Report 2006/07 | 31
Tab
le 3
.9:
Ind
ust
rial
an
d C
om
mer
cial
Est
ablis
hm
ents
– b
y ac
tivi
ty
31st
Mar
ch 2
007
Nu
mb
er o
f Es
tab
lish
men
ts
Zon
eSt
and
ard
Ind
ust
rial
Cla
ssif
icat
ion
(SI
C)
Co
des
(se
e p
ages
18–
19 f
or
a d
escr
ipti
on
of
each
SIC
co
de)
DD
AD
BD
CD
DD
ED
FD
GD
HD
ID
JD
KD
LD
MD
ND
(to
tal)
Dea
rne
Val
ley
01
40
12
03
30
95
10
231
East
Dur
ham
04
10
11
01
80
41
34
028
East
Mid
land
s1
44
01
00
12
27
21
63
34
Tyne
Riv
ersi
de1
12
00
30
21
00
13
41
19
Tota
l 31s
t M
arch
200
72
1011
03
60
714
220
98
146
112
Tota
l 31s
t M
arch
200
63
1014
03
51
619
218
87
117
114
Zon
eSt
and
ard
Ind
ust
rial
Cla
ssif
icat
ion
(SI
C)
Co
des
Tota
l 31s
t M
arch
200
7To
tal 3
1st
Mar
ch 2
006
EF
GH
IJ
KL
MN
O
Dea
rne
Val
ley
11
101
80
87
31
071
73
East
Dur
ham
34
90
50
62
03
262
54
East
Mid
land
s1
316
112
011
01
00
7977
Tyne
Riv
ersi
de0
617
05
120
30
56
8280
Tota
l 31s
t M
arch
200
75
1452
230
145
124
98
294
Tota
l 31s
t M
arch
200
64
1548
223
147
124
86
284
Not
e: t
his
tabl
e ex
clud
es f
irms
occu
pyin
g se
rvic
ed o
ffic
e sp
ace
and
the
tena
nts
of m
ulti-
let
offic
e bu
ildin
gs. I
t al
so e
xclu
des
a sm
all n
umbe
r of
ten
ants
of
nurs
ery
indu
stria
l uni
ts (m
ostly
und
er 1
50 m
2 in f
loor
are
a) w
here
it w
as n
ot p
ossi
ble
to d
eter
min
e th
e na
ture
of
the
use.

32 | Enterprise Zones Monitoring Report 2006/07
Tab
le 3
.10:
In
du
stri
al a
nd
Co
mm
erci
al E
mp
loym
ent
– b
y ac
tivi
ty
31st
Mar
ch 2
007
Esti
mat
ed N
um
ber
of
Job
s
Zon
eSt
and
ard
Ind
ust
rial
Cla
ssif
icat
ion
(SI
C)
Co
des
(se
e p
ages
18–
19 f
or
a d
escr
ipti
on
of
each
SIC
co
de)
DD
AD
BD
CD
DD
ED
GD
HD
ID
JD
KD
LD
MD
ND
(to
tal)
Dea
rne
Val
ley
063
722
80
937
369
990
450
158
220
248
2,29
3
East
Dur
ham
031
281
038
130
4456
20
186
929
915
02,
305
East
Mid
land
s16
1,02
026
60
400
2021
438
722
429
132
1,42
412
64,
061
Tyne
Riv
ersi
de3
288
380
014
260
260
04
1,00
576
112
82,
453
Tota
l 31s
t M
arch
200
719
2,25
761
30
8764
519
490
138
785
946
11,
088
3,10
050
211
,113
Tota
l 31s
t M
arch
200
623
2,25
778
60
8751
513
51,
078
387
862
433
1,14
82,
310
502
10,5
22
Zon
eSt
and
ard
Ind
ust
rial
Cla
ssif
icat
ion
(SI
C)
Co
des
Tota
l 31s
t M
arch
200
7To
tal 3
1st
Mar
ch 2
006
EF
GH
IJ
KL
MN
O
Dea
rne
Val
ley
163
4051
737
401
02,
667
335
145
50
6,60
26,
661
East
Dur
ham
288
6628
70
203
01,
405
209
077
374,
877
3,95
8
East
Mid
land
s20
114
41,
956
6492
00
1,54
20
420
08,
930
8,83
6
Tyne
Riv
ersi
de0
111
466
043
357
4,65
438
30
162
918,
810
9,28
7
Tota
l 31s
t M
arch
200
765
236
13,
226
101
1,95
657
10,2
6992
718
724
312
829
,219
Tota
l 31s
t M
arch
200
656
039
93,
360
101
1,27
157
11,0
8792
718
719
776
28,7
42

Enterprise Zones Monitoring Report 2006/07 | 33
Tab
le 3
.11:
Nu
mb
er o
f In
du
stri
al a
nd
Co
mm
erci
al E
stab
lish
men
ts –
by
Nu
mb
er o
f Em
plo
yees
31st
Mar
ch 2
007
Esta
blis
hm
ents
Zon
eN
um
ber
of
emp
loye
esTo
tal
31st
Mar
ch 2
007
Tota
l 31
st M
arch
200
6
0 to
10
11 t
o 2
425
to
49
50 t
o 9
910
0 to
199
mo
re t
han
200
Dea
rne
Val
ley
315
2318
66
7173
East
Dur
ham
1114
1210
69
6254
East
Mid
land
s4
913
2117
1579
77
Tyne
Riv
ersi
de18
1613
1213
1082
80
Tota
l 31s
t M
arch
200
736
5461
6142
4029
4
Tota
l 31s
t M
arch
200
635
4764
6038
4028
4
Not
e: t
he f
igur
es in
thi
s ta
ble
for
Mar
ch 2
007
excl
ude
som
e sm
all f
irms
in s
hare
d ac
com
mod
atio
n, s
uch
as s
ervi
ced
offic
es, h
ence
the
num
ber
of e
stab
lishm
ents
with
10
or f
ewer
em
ploy
ees
is u
nder
stat
ed.

34 | Enterprise Zones Monitoring Report 2006/07
Tab
le 3
.12:
Pri
vate
Sec
tor
Inve
stm
ent
in C
on
stru
ctio
n
1st
Ap
ril 2
006
– 31
st M
arch
200
7
£ th
ou
san
ds
at 2
006/
07 p
rice
s
Zon
eB
uild
ing
Typ
es (
see
Bo
x 3.
1 p
age
16 f
or
a d
escr
ipti
on
of
bu
ildin
g t
ypes
)To
tal 3
1st
Mar
ch 2
007
Tota
l 31s
t M
arch
200
6
12
34
56
78
910
11
Dea
rne
Val
ley
00
00
02,
442
018
,731
00
021
,173
20,7
99
East
Dur
ham
00
00
8,04
44,
592
02,
515
00
015
,150
20,6
97
East
Mid
land
s0
00
5,04
90
00
00
00
5,04
910
,280
Tyne
Riv
ersi
de0
00
00
02,
834
644
00
03,
478
16,6
81
Tota
l 31s
t M
arch
200
70
00
5,04
98,
044
7,03
42,
834
21,8
900
00
44,8
50
Tota
l 31s
t M
arch
200
60
00
03,
222
2,39
929
,477
32,8
0955
00
068
,456
Not
e 1:
The
con
stru
ctio
n co
sts
of n
ew f
loor
spac
e co
mpl
eted
in 2
006/
07 h
ave
been
est
imat
ed b
y re
fere
nce
to t
he B
CIS
Gen
eral
Ten
der
Inde
x an
d th
e C
onst
ruct
ion
Stat
istic
s Q
uart
erly
Pric
e In
dice
s 20
06/0
7 (D
TI/T
SO),
with
adj
ustm
ents
for
reg
iona
l var
iatio
ns. C
osts
hav
e be
en a
djus
ted
by 1
2.5%
to
allo
w f
or e
xter
nal w
orks
with
in t
he c
urtil
age
of t
he
prop
erty
.
Not
e 2:
Any
slig
ht d
iffer
ence
s in
tot
als
are
due
to r
ound
ing.

Enterprise Zones Monitoring Report 2006/07 | 35
Tab
le 3
.13:
Pu
blic
Sec
tor
Rec
ipie
nts
By
nat
ure
of
rece
ipt
1st
Ap
ril 2
006
– 31
st M
arch
200
7
£ th
ou
san
ds
at 2
006/
07 p
rice
s
Zon
eR
ent
Lan
d /
Pro
per
ty d
isp
osa
lsR
ent
and
Lan
dO
ther
Tota
l 200
6/07
Tota
l 200
5/06
Dea
rne
Val
ley
10
00
120
7
East
Dur
ham
00
00
057
4
East
Mid
land
s0
00
00
383
Tyne
Riv
ersi
de0
320
00
320
2,05
0
Tota
l 31s
t M
arch
200
71
320
00
321
Tota
l 31s
t M
arch
200
633
12,
700
181
23,
214
Tab
le 3
.14:
Pu
blic
Sec
tor
Rec
eip
ts
By
typ
e o
f o
rgan
isat
ion
1st
Ap
ril 2
006
– 31
st M
arch
200
7
£ th
ou
san
ds
at 2
006/
07 p
rice
s
Zon
eD
evel
op
men
t A
gen
cyLo
cal G
ove
rnm
ent
Tota
l 200
6/07
Tota
l 200
5/06
Dea
rne
Val
ley
01
120
7
East
Dur
ham
00
057
4
East
Mid
land
s0
00
383
Tyne
Riv
ersi
de32
00
320
2,05
0
Tota
l 31s
t M
arch
200
732
01
321
Tota
l 31s
t M
arch
200
62,
053
1,16
13,
214

36 | Enterprise Zones Monitoring Report 2006/07
Tab
le 4
.1:
Rat
es R
even
ue
Fore
go
ne
1st
Ap
ril 2
006
– 31
st M
arch
200
7
Un
ifo
rm B
usi
nes
s R
ate
– En
gla
nd
£0.4
3fo
r 20
06/0
7
£ th
ou
san
ds
at 2
006/
07 p
rice
s
Zon
eSt
and
ard
Ind
ust
rial
Cla
ssif
icat
ion
(SI
C)
Co
des
(se
e p
ages
18–
19 f
or
a d
escr
ipti
on
of
each
SIC
co
de)
DD
AD
BD
CD
DD
ED
GD
HD
ID
JD
KD
LD
MD
ND
(to
tal)
Dea
rne
Val
ley
00
00
00
00
00
00
00
0
East
Dur
ham
00
00
00
00
00
00
00
0
East
Mid
land
s0
00
00
00
00
00
00
00
Tyne
Riv
ersi
de4
159
510
024
338
410
04
3450
211
81,
193
Tota
l 31s
t M
arch
200
74
159
510
024
338
410
04
3450
211
81,
193
Tota
l 31s
t M
arch
200
626
859
675
013
164
432
792
962
390
120
42,
285
574
303
8,48
1
Zon
eSt
and
ard
Ind
ust
rial
Cla
ssif
icat
ion
(SI
C)
Co
des
Tota
l 31s
t M
arch
200
6To
tal 3
1st
Mar
ch 2
005
EF
GH
IJ
KL
MN
O
Dea
rne
Val
ley
00
00
00
00
00
00
6,16
8
East
Dur
ham
00
00
00
00
0 0
00
3,65
3
East
Mid
land
s0
00
00
0 0
0 0
0 0
06,
919
Tyne
Riv
ersi
de0
107
674
094
919
04,
688
1,29
50
818
315
10,2
2911
,840
Tota
l 31s
t M
arch
200
70
107
674
094
919
04,
688
1,29
50
818
315
10,2
29
Tota
l 31s
t M
arch
200
633
131
53,
386
325
1,95
219
09,
421
2,57
745
093
122
128
,580
Not
es:
1. A
ny s
light
diff
eren
ces
in t
otal
s ar
e du
e to
rou
ndin
g.2.
Fig
ures
hav
e be
en c
alcu
late
d on
the
bas
is o
f re
vise
d ra
teab
le v
alue
s pe
r sq
uare
met
re, t
o re
flect
the
200
5 Ra
ting
Reva
luat
ion.
The
se v
alue
s ha
ve b
een
deriv
ed b
y ap
plyi
ng
aver
age
perc
enta
ge in
crea
ses
for
diff
eren
t ty
pes
of u
se t
o th
e 20
01 v
alua
tion
figur
es u
sed
in p
revi
ous
mon
itorin
g re
port
s.
3. F
igur
es f
or D
earn
e V
alle
y, E
ast
Dur
ham
and
Eas
t M
idla
nds
and
one
of t
he T
yne
Rive
rsid
e si
tes
have
bee
n ad
just
ed t
o re
flect
the
fac
t th
at E
nter
pris
e Zo
ne s
tatu
s ex
pire
d du
ring
this
mon
itorin
g pe
riod.

Enterprise Zones Monitoring Report 2006/07 | 37
Tab
le 4
.2:
Exch
equ
er C
ost
of
EZ C
apit
al A
llow
ance
s
1st
Ap
ril 2
006
– 31
st M
arch
200
7
£ th
ou
san
ds
at 2
006/
07 p
rice
s
Zon
eB
uild
ing
Typ
es (
see
Bo
x 3.
1 p
age
16 f
or
a d
escr
ipti
on
of
bu
ildin
g t
ypes
)To
tal
31st
Mar
ch 2
007
Tota
l 31
st M
arch
200
6
12
34
56
78
910
11
Dea
rne
Val
ley
00
00
085
50
6,55
60
00
7,41
11,
787
East
Dur
ham
00
00
2,81
51,
607
088
00
00
5,30
37,
244
East
Mid
land
s0
00
1,76
70
00
00
00
1,76
73,
598
Tyne
Riv
ersi
de0
00
00
099
222
50
00
1,21
75,
838
Tota
l 31s
t M
arch
200
70
00
1,76
72,
815
2,46
299
27,
662
00
015
,698
Tota
l 31s
t M
arch
200
60
00
783
1,26
10
10,3
175,
043
1,06
30
018
,467
Not
e 1:
The
fig
ures
pro
vide
d in
thi
s ta
ble
are
the
undi
scou
nted
cos
ts o
f th
e 10
0% t
ax a
llow
ance
s, b
ased
on
the
assu
mpt
ion
that
inve
stor
s ta
ke t
he f
ull t
ax b
enef
it in
the
yea
r of
in
vest
men
t
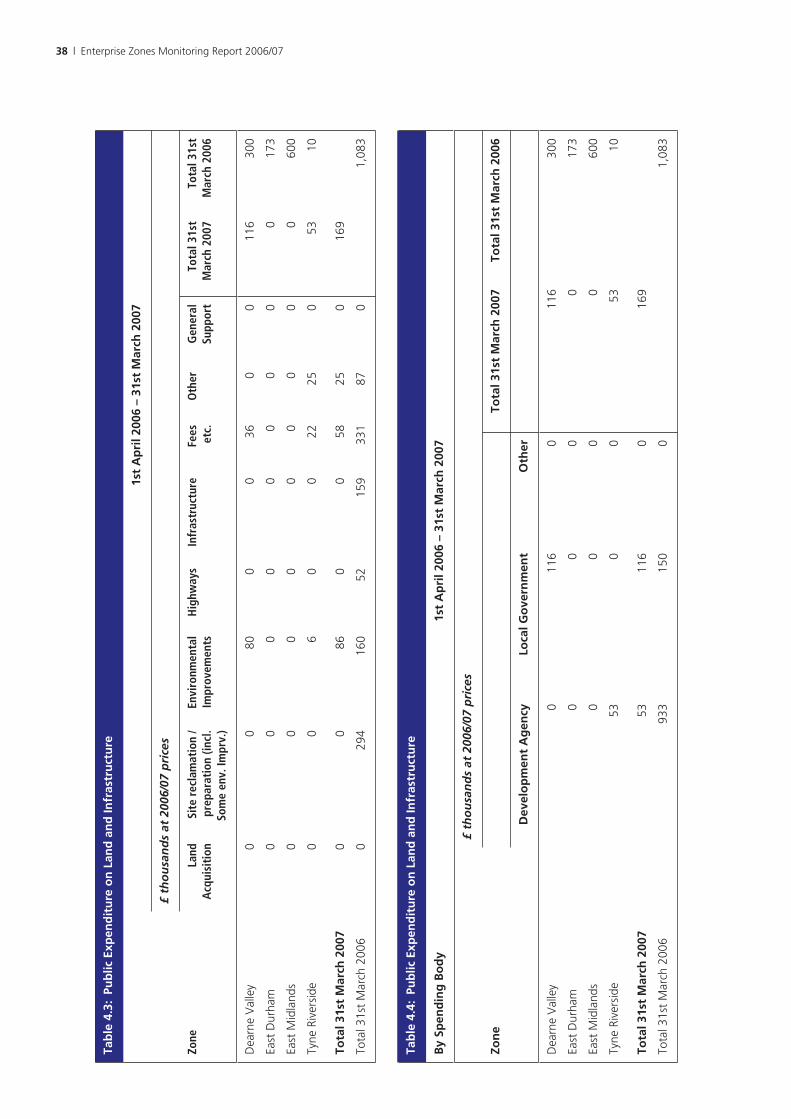
38 | Enterprise Zones Monitoring Report 2006/07
Tab
le 4
.3:
Pub
lic E
xpen
dit
ure
on
Lan
d a
nd
Infr
astr
uct
ure
1st
Ap
ril 2
006
– 31
st M
arch
200
7
£ th
ou
san
ds
at 2
006/
07 p
rice
s
Zone
Land
A
cqui
siti
onSi
te r
ecla
mat
ion
/ pr
epar
atio
n (in
cl.
Som
e en
v. Im
prv.
)
Envi
ronm
enta
l Im
prov
emen
tsH
ighw
ays
Infr
astr
uctu
reFe
es
etc.
Oth
erG
ener
al
Supp
ort
Tota
l 31s
t M
arch
200
7To
tal 3
1st
Mar
ch 2
006
Dea
rne
Val
ley
00
800
036
00
116
300
East
Dur
ham
00
00
00
00
017
3
East
Mid
land
s0
00
00
00
00
600
Tyne
Riv
ersi
de0
06
00
2225
053
10
Tota
l 31s
t M
arch
200
70
086
00
5825
016
9
Tota
l 31s
t M
arch
200
60
294
160
5215
933
187
01,
083
Tab
le 4
.4:
Pub
lic E
xpen
dit
ure
on
Lan
d a
nd
Infr
astr
uct
ure
By
Spen
din
g B
od
y1s
t A
pri
l 200
6 –
31st
Mar
ch 2
007
£ th
ou
san
ds
at 2
006/
07 p
rice
s
Zon
eTo
tal 3
1st
Mar
ch 2
007
Tota
l 31s
t M
arch
200
6
Dev
elo
pm
ent
Ag
ency
Loca
l Go
vern
men
tO
ther
Dea
rne
Val
ley
011
60
116
300
East
Dur
ham
00
00
173
East
Mid
land
s0
00
060
0
Tyne
Riv
ersi
de53
00
5310
Tota
l 31s
t M
arch
200
753
116
016
9
Tota
l 31s
t M
arch
200
693
315
00
1,08
3

Enterprise Zones Monitoring Report 2006/07 | 39
Table 5.1: New Recipients and new Projects Assisted
1st April 2006 – 31st March 2007
Zone Incoming firms – net change
2005/06 Construction completions
2005/06
Dearne Valley –2 –4 7 5
East Durham 8 2 4 4
East Midlands 2 –2 5 10
Tyne Riverside 2 6 1 2
Total 31st March 2007 10 17
Total 31st March 2006 2 21
Note: the data collected as part of this monitoring exercise excluded the occupiers of multi-let office buildings and firms in serviced offices – the buildings concerned have been identified and an average number of 25 suites per building has been applied in arriving at the change in number of firms. Where firms occupy more than one building within an EZ they have been counted as a single occupier.
Table 5.2: Jobs Created
1st April 2006 – 31st March 2007
Zone Employment change 2006/07 2005/06
Dearne Valley –60 73
East Durham 919 54
East Midlands 94 1,594
Tyne Riverside –476 320
Total 31st March 2007 477
Total 31st March 2006 2,041
Table 5.3: Rates Revenue Foregone
2007/08 Estimated
Zone £ thousands
Dearne Valley 0
East Durham 0
East Midlands 0
Tyne Riverside 0
Total 0
Note: With the expiry of all Enterpise Zones, this item of current expenditure foregone no longer applies.

40 | Enterprise Zones Monitoring Report 2006/07
Table 5.4: Exchequer Cost of EZ Capital Allowances
2007/08 Estimated
Zone £ thousands
Dearne Valley 0
East Durham 0
East Midlands 2,689
Tyne Riverside 5,735
Total 8,424
Note: Estimate, based on construction work in progress at year end. Works started prior to the end of EZ status still qualify for this support.
Table 5.5: Public Expenditure on Land and Infrastructure
2007/08 Estimated
Zone £ thousands
Dearne Valley 1,000
East Durham 0
East Midlands 0
Tyne Riverside 0
Total 1,000

Enterprise Zones Monitoring Report 2006/07 | 41
Appendix 2: Enterprise Zone Development Trends
Figure 6.1: Percentage of Land Area Developed, 2002/03 to 2006/07
90
100
80
70
60
50
40
2002/03 2003/04 2004/05 2005/06 2006/07
Dearne Valley
East Durham
East Midlands
Tyne Riverside
All EZs
% o
f La
nd A
rea
Dev
elop
ed
Figure 6.2: Amount of Floorspace Completed, 2001/02 to 2006/07
Tyne Riverside
East Midlands
East Durham
Dearne Valley
Sq. m
. Flo
orsp
ace
Com
plet
ed
2001/02 2002/03 2003/04 2004/05 2005/06 2006/070
20000
40000
60000
80000
100000
120000

42 | Enterprise Zones Monitoring Report 2006/07
Figure 6.3: Percentage of Floorspace Occupied by Offices, 2002/03 to 2006/07
40
50
30
20
10
0
2002/03 2003/04 2004/05 2005/06 2006/07
Dearne Valley
East Durham
East Midlands
Tyne Riverside
All EZs
% F
loor
spac
e in
Off
ices
Figure 6.4: Percentage of Floorspace Occupied by Factories and Warehouses, 2002/03 to 2006/07
90
100
80
70
60
50
40
2002/03 2003/04 2004/05 2005/06 2006/07
Dearne Valley
East Durham
East Midlands
Tyne Riverside
All EZs
% F
loor
spac
e in
Fac
torie
s &
War
ehou
ses

Enterprise Zones Monitoring Report 2006/07 | 43
Figure 6.5: Percentage of Floorspace Vacant, 2001/02 to 2006/07
Dearne Valley
East Durham
East Midlands
Tyne Riverside
All EZs
30
35
25
20
15
10
5
0
2002/032001/02 2003/04 2004/05 2005/06 2006/07
% F
loor
spac
e Va
cant
Figure 6.6: Percentage of Floorspace Occupied by Manufacturing Industries, 2002/03 to 2006/07
30
20
40
50
2002/03 2003/04 2004/05 2005/06 2006/07
Dearne Valley
East Durham
East Midlands
Tyne Riverside
All EZs
% F
loor
spac
e O
ccup
ied

44 | Enterprise Zones Monitoring Report 2006/07
Figure 6.7: Percentage of Floorspace Occupied by Transport and Distribution Uses, 2002/03 to 2006/07
% F
loor
spac
e O
ccup
ied
Dearne Valley
East Durham
East Midlands
Tyne Riverside
All EZs
40
30
20
10
0
50
2002/03 2003/04 2004/05 2005/06 2006/07
Figure 6.8: Percentage of Floorspace Occupied by Financial and Business Services, 2002/03 to 2006/07
% F
loor
spac
e O
ccup
ied
Dearne Valley
East Durham
East Midlands
Tyne Riverside
All EZs
25
30
20
15
10
5
0
2002/03 2003/04 2004/05 2005/06 2006/07

Enterprise Zones Monitoring Report 2006/07 | 45
Figure 6.9: Percentage of Floorspace Occupied by Public and Other Services, 2002/03 to 2006/07%
Flo
orsp
ace
Occ
upie
d
Dearne Valley
East Durham
East Midlands
Tyne Riverside
All EZs
10
12
8
6
4
2
0
2002/03 2003/04 2004/05 2005/06 2006/07
Figure 6.10: Estimated Number of Full-time Equivalent Jobs, 2001/02 to 2006/07
Tyne Riverside
East Midlands
East Durham
Dearne Valley
0
5000
10000
15000
20000
25000
30000
Estim
ated
Em
ploy
men
t
2001/02 2002/03 2003/04 2004/05 2005/06 2006/07

46 | Enterprise Zones Monitoring Report 2006/07
Figure 6.11: Private Sector Investment in Construction (£000s at current prices), 2001/02 to 2006/07
Inve
stm
ent
(£00
0s)
Tyne Riverside
East Midlands
East Durham
Dearne Valley
2001/02 2002/03 2003/04 2004/05 2005/06 2006/07
0
20000
40000
60000
80000
100000
120000
140000
Figure 6.12: Public Sector Receipts (£000s at current prices), 2001/02 to 2006/07
Inve
stm
ent
(£00
0s)
Tyne Riverside
East Midlands
East Durham
Dearne Valley
2001/02 2002/03 2003/04 2004/05 2005/06 2006/07
16000
14000
12000
10000
8000
6000
4000
2000
0
18000

Enterprise Zones Monitoring Report 2006/07 | 47
Figure 6.13: Rates Revenue Foregone by Local Authorities (£000s at current prices), 2001/02 to 2006/07
Tyne Riverside
East Midlands
East Durham
Dearne Valley
0
5000
10000
15000
20000
25000
30000
2001/02 2002/03 2003/04 2004/05 2005/06 2006/07
Reve
nue
Fore
gone
(£00
0s)
Figure 6.14: Cost of Capital Allowances to the Exchequer (£000s at current prices), 2001/02 to 2006/07
Cap
ital A
llow
ance
s (£
000s
)
5000
0
10000
15000
20000
25000
30000
35000Tyne Riverside
East Midlands
East Durham
Dearne Valley
2001/02 2002/03 2003/04 2004/05 2005/06 2006/07
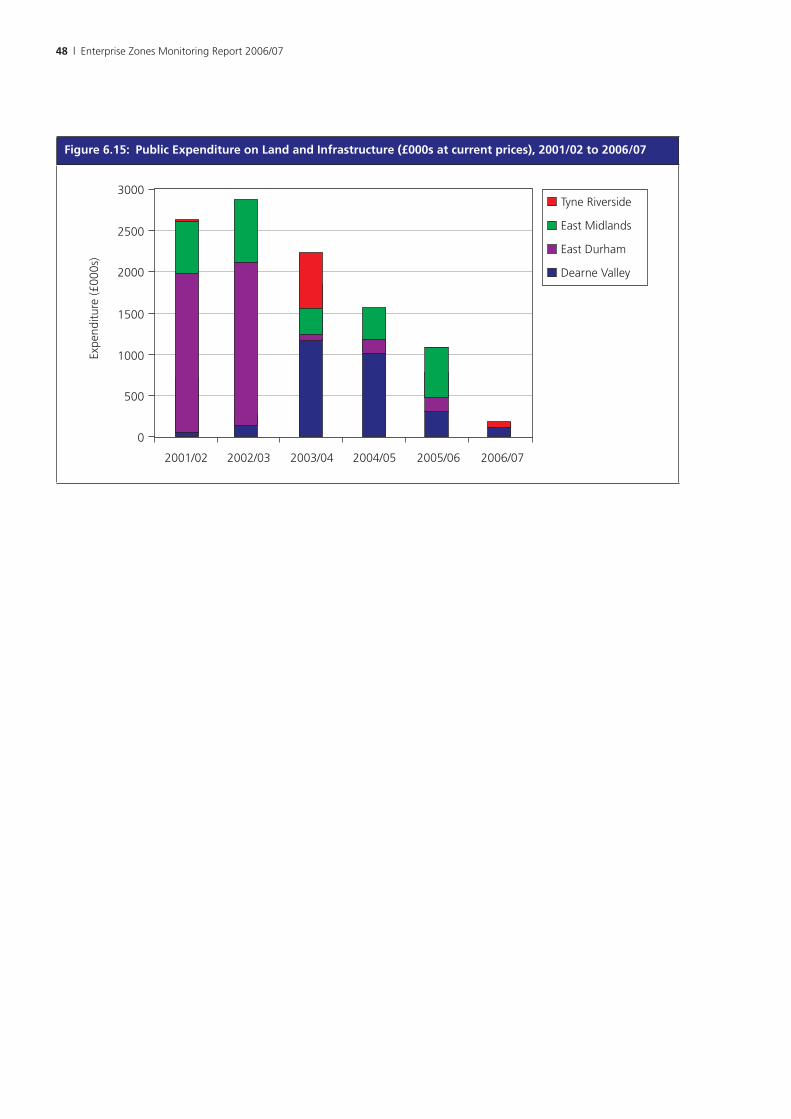
48 | Enterprise Zones Monitoring Report 2006/07
Figure 6.15: Public Expenditure on Land and Infrastructure (£000s at current prices), 2001/02 to 2006/07
Expe
nditu
re (£
000s
)
2500
3000Tyne Riverside
East Midlands
East Durham
Dearne Valley
2001/02 2002/03 2003/04 2004/05 2005/06 2006/07
2000
1500
1000
500
0


ISBN 978-1-4098-1002-5 9 7 8 1 4 0 9 8 1 0 0 2 5
ISBN 978-1-4098-1002-5


![Virtualization Monitoring in Solaris Zones - · PDF filealso possible to set caps for swap and locked memory. ... 2G )) [swap: 3G]) ... Virtualization Monitoring in Solaris Zones](https://img.pdfslide.net/doc/110x75/5aaf3d697f8b9a25088d48cb/virtualization-monitoring-in-solaris-zones-possible-to-set-caps-for-swap-and-locked.jpg)