Embed Size (px)
Citation preview
Citation: Surov O.V. Enthalpies of Fusion, Sublimation and Vaporization of Some Hydrazones. Phys Chem Ind J. 2017;12 (1):105.
© 2017 Trade Science Inc.
1
Enthalpies of Fusion, Sublimation and Vaporization of Some Hydrazones
Surov O.V.
G.A. Krestov Institute of Solution Chemistry of the RAS, Akademicheskaya St., 1, 153045, Ivanovo, Russia
*Corresponding author: Surov O.V, G.A. Krestov Institute of Solution Chemistry of the RAS, Akademicheskaya St., 1,
153045, Ivanovo, Russia, Tel: 8 (4932) 33-62-59; Fax: 8 (4932) 33-62-37; E-mail: [email protected]
Received: November 26, 2016; Accepted: January 05, 2017; Published: January 16, 2017
Introduction
Measurements of enthalpies of vaporization and sublimation are closely related to the evaluation of saturated vapor pressures
for indirect methods of measurement. Recently, publications have appeared describing the measurement of saturated vapor
pressure of organic compounds with the use of thermo-gravimetry [1-3]. The experiment is based on the concept that
vaporization and sublimation are zero order kinetic processes. Consequently, the rate of mass loss under the isothermal
conditions originating from the vaporization should be constant providing that the free surface of vaporization remains
constant. Among the procedures of thermal analysis, thermo-gravimetry has demonstrated its advantages as a fast and reliable
method for investigation of sublimation and vaporization processes of substances. Although the traditional methods of vapor
pressure evaluation are sufficiently accurate they require a long time. Thermo-gravimetry has the following advantages: first,
the applied equipment is of standard industrial production; second, the required quantity of sample is small, and, third, the
experimental time is short.
Sublimation enthalpies can be estimated using Eq. 1 and 3 [4].
ΔsubHm (Tfus) = ΔvapHm (Tfus) + ΔfusHm (Tfus) (1)
ΔvapHm (Tfus) = ΔvapHm (T ) + [10.58 + 0.26cpl estd (298.15 K)] ( T – Tfus) (2)
ΔsubHm (298.15 K) = ΔsubHm (Tfus) + [0.75 + 0.15cpc estd (298.15 K)] (Tfus – 298.15) (3)
Abstract
Enthalpies of melting, sublimation and vaporization were determined for some hydrazones. The validity of thermogravimetric
procedure for measuring enthalpy of vaporization of the compounds under investigation was demonstrated. Exploring packing
modes and intermolecular interactions in molecular crystals of the hydrazones using Hirshfeld surfaces was carried out.
Keywords: Hydrazone; Hirshfeld surface analysis; Sublimation enthalpy; Fusion enthalpy; Vaporization enthalpy
www.tsijournals.com | January 2017
2
Here Tfus is the melting point; T is a mean temperature of an experiment; cpl estd (298.15 K) and cpc estd (298.15 K) are the heat
capacities of the liquid and the solid phase, respectively, at the reference temperature 298.15 K estimated by a group additive
method [5].
Sublimation enthalpies adjusted to 298.15 K are calculated by means of substituting into Eq. (3) the values of ΔsubHm (Tfus)
obtained from Eq. (1). Thus, Eq. (1 and 3) make it possible to recalculate sublimation enthalpies from the melting
temperature to the reference temperature 298.15 K. Equ (3) can be similarly employed for adjusting experimental values of
sublimation enthalpies obtained at a mean temperature T to the reference temperature 298.15 K.
The main objective of the present work was to study thermodynamic aspects of sublimation and vaporization processes of a
series of closely related crystalline hydra zones, and to explore correlations between the thermochemical properties and the
intermolecular interactions in the molecular crystals.
Experimental Section
Materials
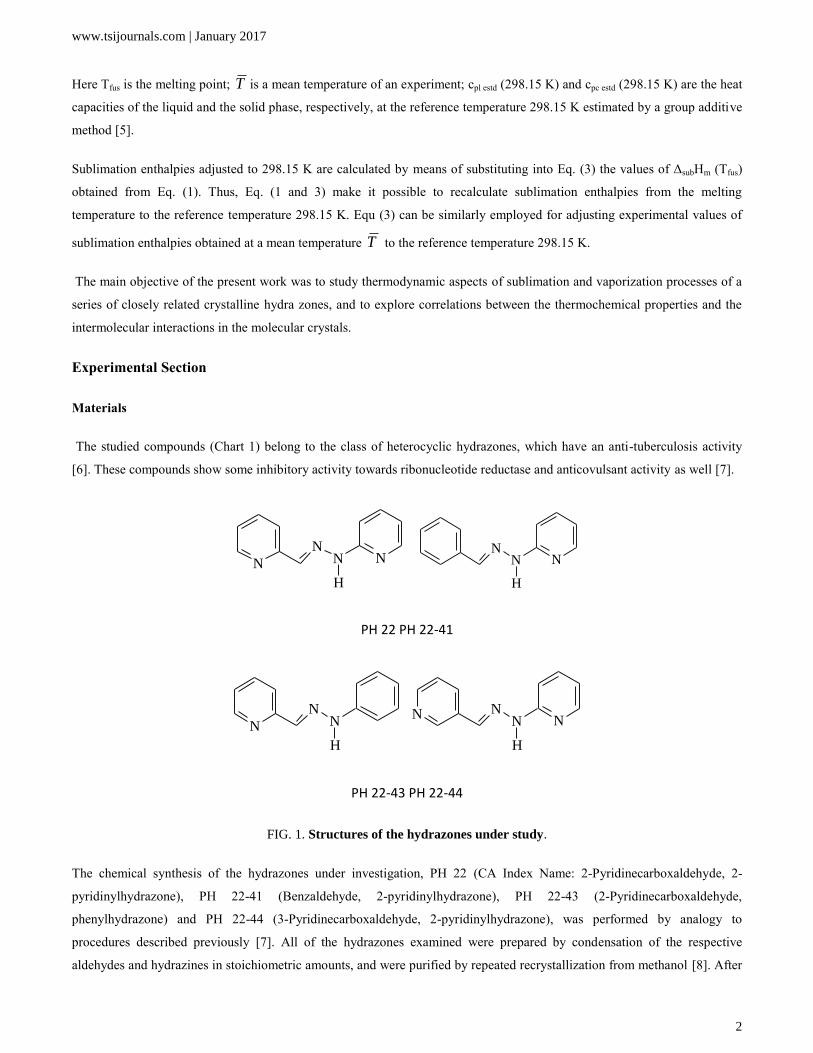
The studied compounds (Chart 1) belong to the class of heterocyclic hydrazones, which have an anti-tuberculosis activity
[6]. These compounds show some inhibitory activity towards ribonucleotide reductase and anticovulsant activity as well [7].
PH 22 PH 22-41
PH 22-43 PH 22-44
FIG. 1. Structures of the hydrazones under study.
The chemical synthesis of the hydrazones under investigation, PH 22 (CA Index Name: 2-Pyridinecarboxaldehyde, 2-
pyridinylhydrazone), PH 22-41 (Benzaldehyde, 2-pyridinylhydrazone), PH 22-43 (2-Pyridinecarboxaldehyde,
phenylhydrazone) and PH 22-44 (3-Pyridinecarboxaldehyde, 2-pyridinylhydrazone), was performed by analogy to
procedures described previously [7]. All of the hydrazones examined were prepared by condensation of the respective
aldehydes and hydrazines in stoichiometric amounts, and were purified by repeated recrystallization from methanol [8]. After
N
NN
H
NN
N
H
N
N
NN
H
N NN
H
N
www.tsijournals.com | January 2017
3
recrystallization the final products were dried at room temperature under vacuum until the mass was constant. The outlined
procedure was repeated several times. Additionally the hydrazones were purified by sublimation in a high vacuum using a
temperature gradient furnace. The purity of samples was checked by TLC, DSC and NMR (TABLE. S1 and SI) [9,10].
Experimental and computational methods
The temperature and the enthalpy of fusion were measured with a differential scanning heat flow calorimeter DSC 204 F1
Foenix (Netzsch, Germany). The calorimetry experiment was performed in an atmosphere of ultrapure grade dry argon
(argon content, 99.998%) at a flow rate of 15 ml min-1
and a heating rate of 10 K min-1
using standard aluminum crucibles.
The samples investigated were placed into pressed aluminum crucibles with holes in the lids. An empty aluminum crucible
served as a comparison sample. All DSC measurements were performed with respect to the signal base line obtained for the
two empty crucibles. Calibration of the calorimeter’s sensitivity was made by measuring the temperatures and enthalpies of
phase transitions for standard systems (Hg, C6H12, C6H5C6H5, KNO3, RbNO3, In, Bi, Sn, Zn, KClO4, CsCl). The accuracy of
temperature measurement was 0.1 K; the accuracy of enthalpy measurement for phase transitions was 0.4 Jg-1
. Weighing
accuracy was ± 0.001 mg (Sartorius M2P balance).
The thermogravimetric estimation of saturated vapor pressure during vaporization was carried out with a TG 209 F1 Iris
thermo-microbalance (Netzsch Geratebau GmbH, Germany) using platinum crucibles of cross-section area 4.064 × 10⁻⁵
m2 in
an atmosphere of dry argon. The starting sample weight in each experiment was about 20 mg. The accuracy of sample mass
measurement was 110-7
g.
Langmuir equation for the free vaporization in a vacuum relates the rate of mass loss to the saturated vapor pressure.
–dm/dt = Pα (M/2πRT)1/2
(4)
Here –dm/dt is the rate of mass loss per unit area; P is vapor pressure in Pa; M is the molecular weight of vapor; R is the gas
constant; T is the temperature of experiment in K, and α is the vaporization coefficient (taken usually as unity in a vacuum).
The sample is placed in a crucible with parallel walls and well determined surface area. Measurements can be performed
under isothermal and linear-rising temperature conditions using an inert atmosphere instrument purge under ambient
pressure.
In the case of a material volatilizing into a flowing gas stream at ambient pressure rather than in vacuum, α can no longer be
assumed to be unity. The transformation of Eq. (4) gives the following:
P = kν (5)
Here k = (2πR/α)1/2
, ν = (dm/dt) (T/M)1/2
. A plot of P vs ν is a straight line for a series of compounds with known vapor
pressures (regardless of chemical structure) provided that the sample does not associate in the solid, liquid or gas phase. For
instance, benzoic acid can be used as a reference. In other words, k does not depend on the sample but only on the device,
and therefore it is possible to find the calibration constant k and then determine the vapor pressures of unknown materials.
www.tsijournals.com | January 2017
4
Benzoic acid has been used as a calibration material in TG to aid in the thermal characterization of substances that either
sublime, evaporate, or both because of its so-called “ideal behavior” [11]. Such behavior refers to the well-characterized
points of melting and evaporation or sublimation behavior.
Further analysis of the temperature dependence of the vapor of the compound under study can be performed applying
Clapeyron–Clausius equation for the calculation of the enthalpy of sublimation or vaporization or Antoine’s equation for the
vapor pressure within a given temperature range.
The calibration of the thermo-microbalance for measuring the k constant in Eq. (5) with the use of benzoic acid was
performed at a carrier gas flow rate of 25, 50 and 100 ml min–1
and heating rates 2.5, 5 and 10 K min-1
. The heating range was
from room temperature to 523 K. The vapor pressure of benzoic acid as a function of temperature is expressed by Antoine’s
equation as follows:
log P (Pa) = A – B/ (C + T) + 2.12483 (6)
In Eq. (6) A, B, C are Antoine’s constants valid within a definite temperature range for the vaporization process. For benzoic
acids the values A, B, C for temperatures from 405 to 523 K are 7.80991; 2776.12; –43.978, respectively [2].
Applying Eq. (5) the linear dependence of P on ν was plotted whose slope was equal to k (FIG. S1 and SI). It was established
that the optimum mode of the thermogravimetric experiment was at the argon flow of 50 ml min–1
and the heating rate 5
Kmin-1
. In this case the coefficient k was (1.11 ± 0.013) × 105 J
1/2K
–1/2mol
–1/2. The vaporization enthalpy of benzoic acid was
calculated from the slope of the dependence of lnν on 1/T using the Clapeyron-Clausius equation:
lnν = constant – ΔvapHm (T ) /RT (7)
Here constant refers to the intercept; R is the gas constant; T is temperature of experiment in K; ΔvapHm (T ) is the enthalpy
of vaporization. The vaporization enthalpy of benzoic acid observed was 65.5 ± 0.2 kJmol–1
at the mean temperature 424 K
(FIG. S2 and SI) in good agreement with the published value (the average value 66.08 ± 2.0 kJmol-1
at the same temperature)
[11]. Using Eq. (5) the calibration constant k was further used to calculate the saturated vapor pressure of the hydrazones.
The sublimation experiment was carried out by means of the Knudsen effusion method. A detailed description of the set-up
and the experimental procedure has been given previously [12,13]. In brief, the experimental effusion installation was
designed using a vacuum unit providing the residual pressure in the pumped volume no higher than 1 ×10⁻⁴
Pa. The
experimental cell was made of stainless steel with internal volume of about 4 cm3. The ratio of sample surface area to
effusion orifice area was 100 to 300. The temperature of the effusion cell was maintained by means of thermocouples battery
and double-circuit thermoregulator with accuracy ± 0.1K. The vapor pressure was calculated from the sample mass loss using
Knudsen’s equation.
ACD/Labs software was used for estimation of vapor pressures of the studied compounds [14]. An analysis of molecular
crystal structures of the studied hydrazones was carried out by means of Crystal Explorer 2.1 software [15].
www.tsijournals.com | January 2017
5
Results and Discussion
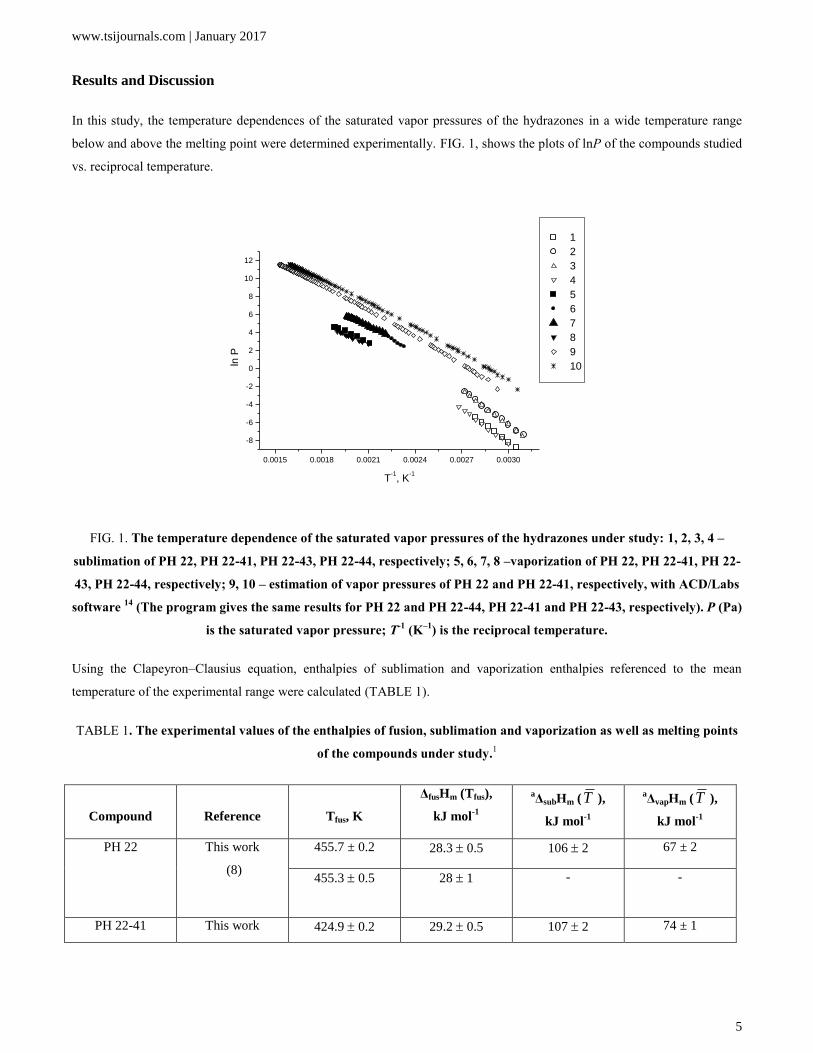
In this study, the temperature dependences of the saturated vapor pressures of the hydrazones in a wide temperature range
below and above the melting point were determined experimentally. FIG. 1, shows the plots of lnP of the compounds studied
vs. reciprocal temperature.
0.0015 0.0018 0.0021 0.0024 0.0027 0.0030
-8
-6
-4
-2
0
2
4
6
8
10
12
1
2
3
4
5
6
7
8
9
10ln P
T-1, K
-1
FIG. 1. The temperature dependence of the saturated vapor pressures of the hydrazones under study: 1, 2, 3, 4 –
sublimation of PH 22, PH 22-41, PH 22-43, PH 22-44, respectively; 5, 6, 7, 8 –vaporization of PH 22, PH 22-41, PH 22-
43, PH 22-44, respectively; 9, 10 – estimation of vapor pressures of PH 22 and PH 22-41, respectively, with ACD/Labs
software 14
(The program gives the same results for PH 22 and PH 22-44, PH 22-41 and PH 22-43, respectively). P (Pa)
is the saturated vapor pressure; T-1
(K–1
) is the reciprocal temperature.
Using the Clapeyron–Clausius equation, enthalpies of sublimation and vaporization enthalpies referenced to the mean
temperature of the experimental range were calculated (TABLE 1).
TABLE 1. The experimental values of the enthalpies of fusion, sublimation and vaporization as well as melting points
of the compounds under study.1
Compound
Reference
Tfus, K
ΔfusHm (Tfus),
kJ mol-1
aΔsubHm (T ),
kJ mol-1
aΔvapHm (T ),
kJ mol-1
PH 22
This work
(8)
455.7 ± 0.2 28.3 0.5 106 2 67 ± 2
455.3 0.5
28 1
-
-
PH 22-41 This work 424.9 0.2 29.2 0.5 107 2 74 ± 1
www.tsijournals.com | January 2017
6
(8)
424.6 0.5
29 1
-
-
PH 22-43
This work
(8)
448.4 0.2 34.1 0.5 107 2 67 ± 1
448.0 0.5
34 1
-
-
PH 22-44 This work
(8)
449.4 0.2 34.4 0.5 108 2 62 ± 2
449.0 0.5 34 1 - -
1Specified experimental pressure P1 is 0.1 MPa. Standard uncertainties u are u (P1) = 10 kPa, u (T) = 0.1 K, u (Tfus) = 0.2
K, u (ΔfusHm) = 0.5 kJ mol-1
, u (ΔsubHm), u (ΔvapHm). Standard uncertainties u (ΔsubHm), u (ΔvapHm) are reported inside the
data table.
aThe average temperatures to which the vaporization and sublimation enthalpies are attributed, are presented in TABLE S2
(SI).
The parameters of the linear equation, lnP (Pa) = a + b/T (K) for the experimental data as well as the mean enthalpies of
sublimation and vaporization estimated with ACD/Labs software are given in TABLE. S2 (SI), ACD/Labs software is
extensively used (for instance, in such data bases as REGISTRY) to describe compounds and for estimation their
physicochemical properties which are unknown or not well studied. Predictions are generated from structures, input in a
variety of forms. One can draw a structure in the ASD/Labs interface, paste a structure from ACD/ChemSketch, upload a
SMILES string, or look up a compound in the built-in dictionary.
It is apparent that the estimated values of sublimation and the vaporization enthalpies are underestimated and overestimated,
respectively, in comparison with the experimental values. However, the melting points and fusion enthalpies of the studied
compounds are in good agreement with the literature data [8] (TABLE. 1).
Enthalpies of sublimation and vaporization adjusted to the reference temperature 298.15 K as well as estimated values of heat
capacity of the compounds under study are presented in TABLE. 2.
TABLE. 2. Enthalpies of sublimation recalculated to the standard temperature 298.15 K as well as the estimated heat
capacities of the compounds under study1
Compound a cpl estd
(298.15 K),
J K-1mol-1
acpc estd
(298.15 K),
J K-1mol-1
b ΔsubHm
(298.15 K),
kJ mol-1
c ΔsubHm
(298.15 K),
kJ mol-1
PH 22 376.0 245.6 108 2 106 ± 2.1
PH 22-41 377.1 249.2 109 2 113 1.1
www.tsijournals.com | January 2017
7
PH 22-43 377.1 249.2 109 2 110 1.1
PH 22-44 376.0 245.6 110 2 108 ± 2.1
1Specified experimental pressure P1 is 0.1 MPa. Standard uncertainties u are u (P1) =
10 kPa, u (ΔsubHm). Standard uncertainties u (ΔsubHm) is reported inside the data
table.
aHeat capacities were calculated from additive contributions [5,16].
bValues ΔsubHm (298.15 K) were calculated from experimental data of ΔsubHm (T
) by Eq. (3).
cValues ΔsubHm (298.15 K) were calculated from experimental data of ΔvapHm (T
) and ΔfusHm (Tfus) by Eqs. (1)– (3); u (ΔsubHm (298.15 K))= (u (ΔvapHm
(Tfus))2+u (ΔfusHm (Tfus))2)1/2.
As seen from TABLE. 2, the values ΔsubHm (298.15 K) calculated from the experimental data of ΔsubHm (T ) by Eq. (3) and
those obtained from the experimental findings of ΔvapHm (T ) and ΔfusHm (Tfus) by Eq. (1 - 3) are consistent well enough.
Sublimation thermodynamic characteristics depend on the crystal structure of compounds. There is a lot of effort aimed at
determining the relationships between the crystal structure of molecular crystals and sublimation enthalpies. Moreover, the
thermochemical characteristics (such as fusion enthalpy and temperature) are often used in pharmaceutics as parameters
modeling crystal lattice (as they are easily obtained) [17-19]. In the past few years an analysis of molecular crystal structures
using tools based on Hirshfeld surfaces has rapidly gained in popularity [20]. It was shown that the analysis of intermolecular
interactions by means of Hirshfeld surfaces enable quantitative comparisons between contributions to crystal packing from
various types of intermolecular contacts [21]. Hirshfeld surfaces offer a way of visualizing intermolecular interactions by
color-coding short or long contacts, the color intensity indicating the relative strength of the interactions. Two-dimensional
fingerprint plots complement these surfaces, quantitatively summarizing the nature and type of intermolecular contacts
experienced by the molecules in the crystal. These plots, generated by triangulation of the Hirshfeld surface, depict the
fraction of points on the surface as a function of the closet distances from the point to nuclei inside and outside the the
surface [22].
The three surfaces used in this study are de, which is the distance from the surface to the nearest atom exterior to the surface,
di, which is the distance from the surface to the nearest atom interior to the surface, and dnorm, which is a normalized contact
distance taking into account the van der Waals (vdW) radius of the appropriate atom [23]. The dnorm surface is depicted in a
red-white-blue color scheme whereby red highlights shorter than vdW contacts, white for contacts around the vdW
separation, and blue is for longer than vdW contacts. Also as dnorm is symmetrical about de and di, both donor and accepter
close contacts are depicted on the surface.
www.tsijournals.com | January 2017
8
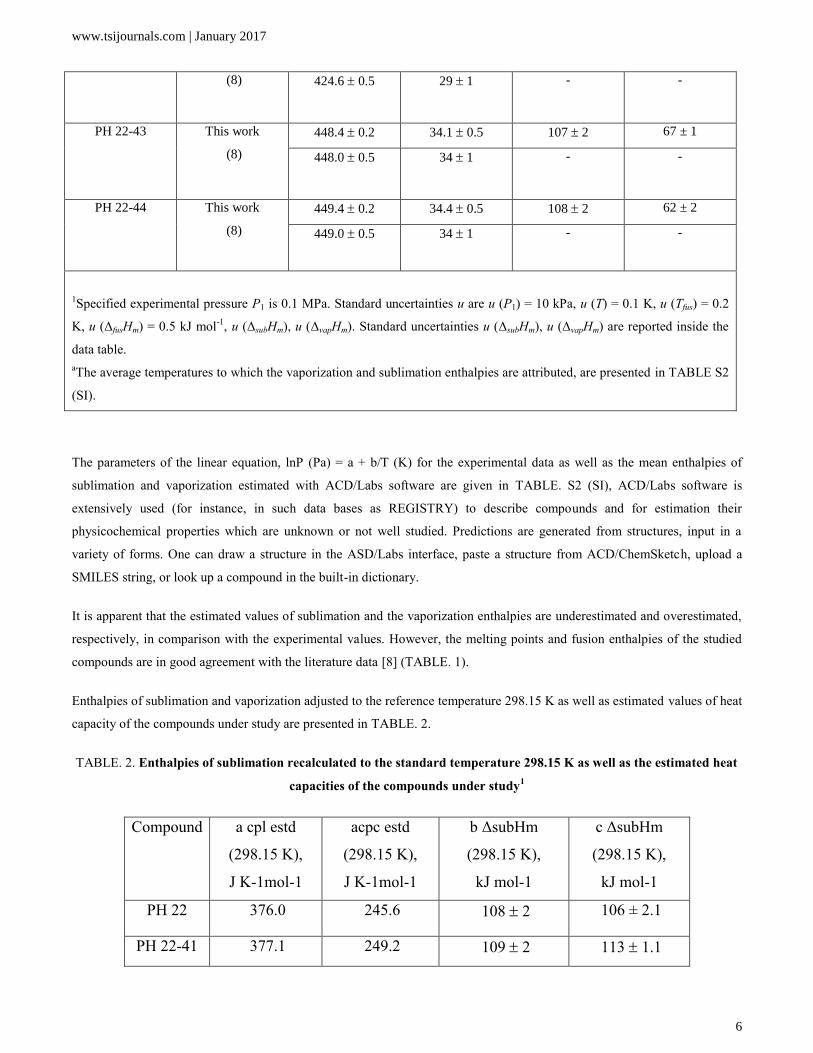
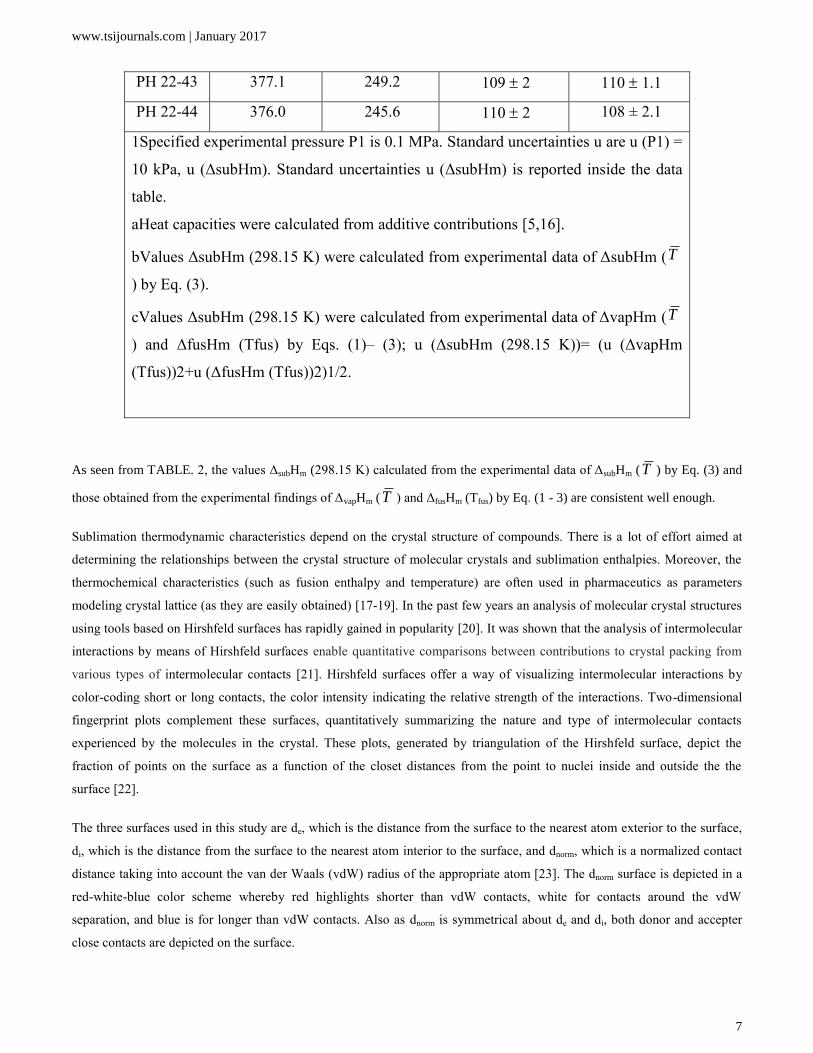
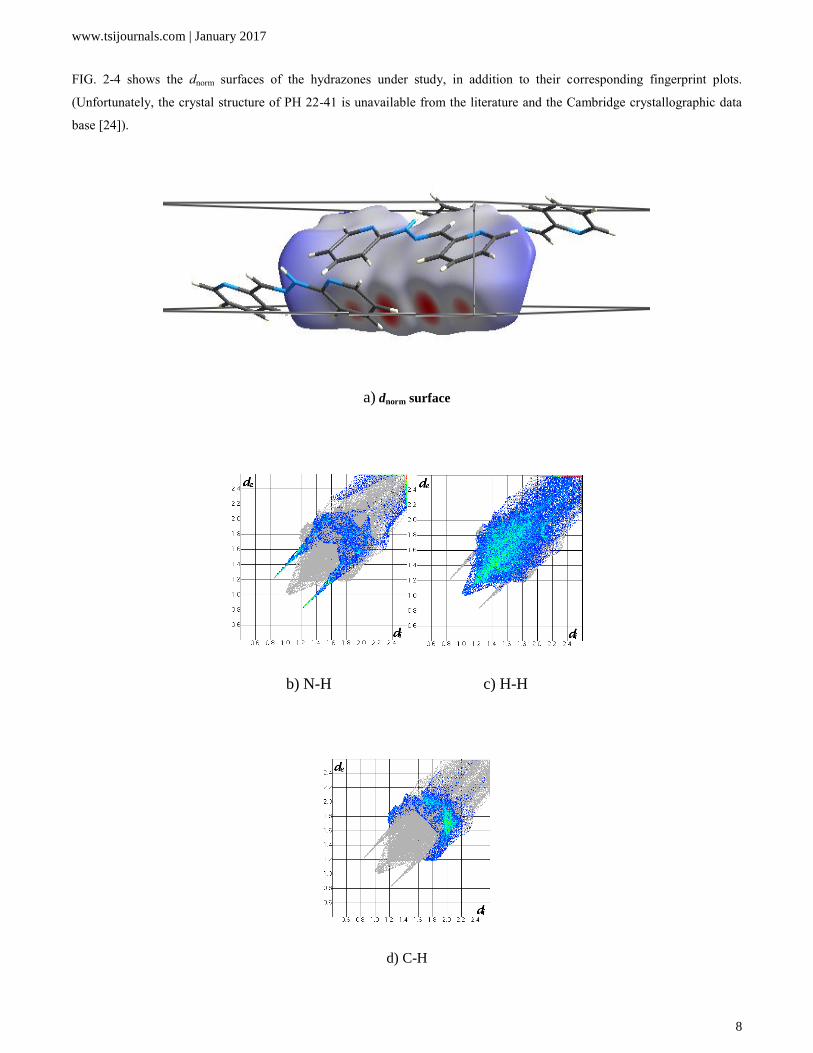
FIG. 2-4 shows the dnorm surfaces of the hydrazones under study, in addition to their corresponding fingerprint plots.
(Unfortunately, the crystal structure of PH 22-41 is unavailable from the literature and the Cambridge crystallographic data
base [24]).
a) dnorm surface
b) N-H c) H-H
d) C-H
www.tsijournals.com | January 2017
9
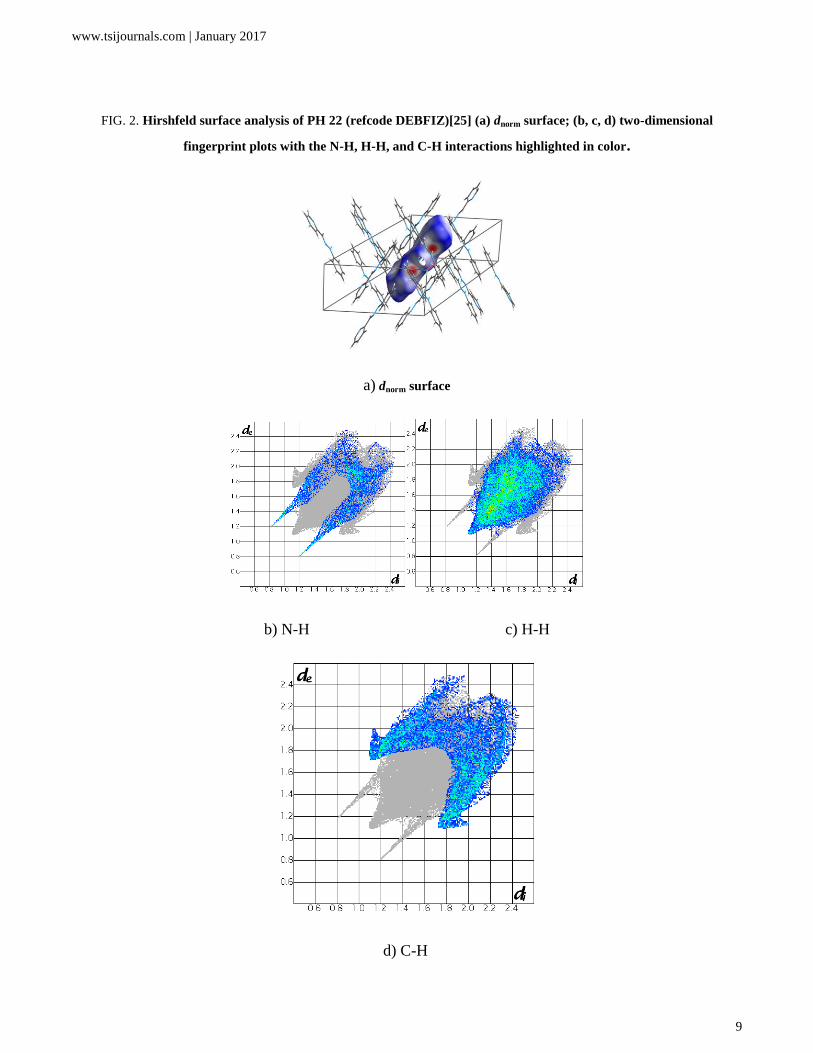
FIG. 2. Hirshfeld surface analysis of PH 22 (refcode DEBFIZ)[25] (a) dnorm surface; (b, c, d) two-dimensional
fingerprint plots with the N-H, H-H, and C-H interactions highlighted in color.
a) dnorm surface
b) N-H c) H-H
d) C-H
www.tsijournals.com | January 2017
10
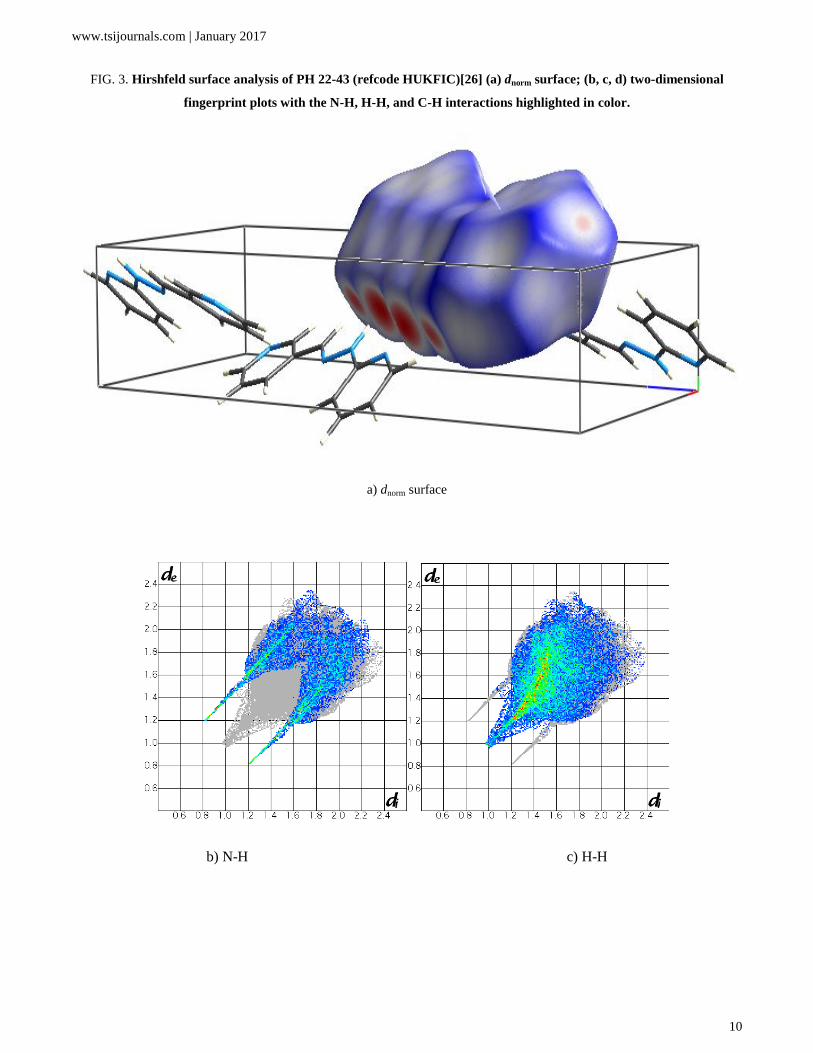
FIG. 3. Hirshfeld surface analysis of PH 22-43 (refcode HUKFIC)[26] (a) dnorm surface; (b, c, d) two-dimensional
fingerprint plots with the N-H, H-H, and C-H interactions highlighted in color.
a) dnorm surface
b) N-H c) H-H
www.tsijournals.com | January 2017
11
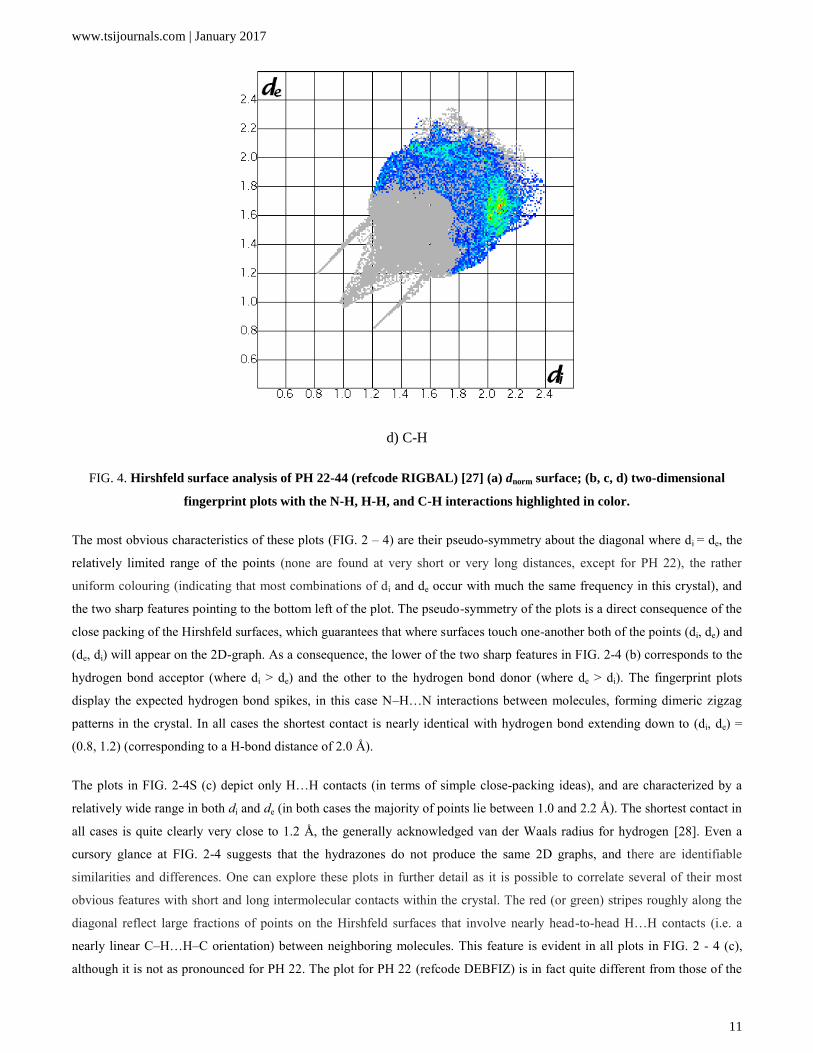
d) C-H
FIG. 4. Hirshfeld surface analysis of PH 22-44 (refcode RIGBAL) [27] (a) dnorm surface; (b, c, d) two-dimensional
fingerprint plots with the N-H, H-H, and C-H interactions highlighted in color.
The most obvious characteristics of these plots (FIG. 2 – 4) are their pseudo-symmetry about the diagonal where di = de, the
relatively limited range of the points (none are found at very short or very long distances, except for PH 22), the rather
uniform colouring (indicating that most combinations of di and de occur with much the same frequency in this crystal), and
the two sharp features pointing to the bottom left of the plot. The pseudo-symmetry of the plots is a direct consequence of the
close packing of the Hirshfeld surfaces, which guarantees that where surfaces touch one-another both of the points (di, de) and
(de, di) will appear on the 2D-graph. As a consequence, the lower of the two sharp features in FIG. 2-4 (b) corresponds to the
hydrogen bond acceptor (where di > de) and the other to the hydrogen bond donor (where de > di). The fingerprint plots
display the expected hydrogen bond spikes, in this case N–H…N interactions between molecules, forming dimeric zigzag
patterns in the crystal. In all cases the shortest contact is nearly identical with hydrogen bond extending down to (di, de) =
(0.8, 1.2) (corresponding to a H-bond distance of 2.0 Å).
The plots in FIG. 2-4S (c) depict only H…H contacts (in terms of simple close-packing ideas), and are characterized by a
relatively wide range in both di and de (in both cases the majority of points lie between 1.0 and 2.2 Å). The shortest contact in
all cases is quite clearly very close to 1.2 Å, the generally acknowledged van der Waals radius for hydrogen [28]. Even a
cursory glance at FIG. 2-4 suggests that the hydrazones do not produce the same 2D graphs, and there are identifiable
similarities and differences. One can explore these plots in further detail as it is possible to correlate several of their most
obvious features with short and long intermolecular contacts within the crystal. The red (or green) stripes roughly along the
diagonal reflect large fractions of points on the Hirshfeld surfaces that involve nearly head-to-head H…H contacts (i.e. a
nearly linear C–H…H–C orientation) between neighboring molecules. This feature is evident in all plots in FIG. 2 - 4 (c),
although it is not as pronounced for PH 22. The plot for PH 22 (refcode DEBFIZ) is in fact quite different from those of the
www.tsijournals.com | January 2017
12
other hydrazones, not just in the area mentioned, but also in regions where di or de are greater than 2.2 Å. DEBFIZ (FIG. 2.)
displays a long blue tail, with di > 2.2 Å, de > 2.2 Å for some points, a distance considerably greater than any observed for the
other hydrazones. This feature can be identified with the presence of water molecules in the lattice of DEBFIZ (C11 H10
N4·2.5 H2O). The dotted nature of the plot in these regions reflects a relatively small number of points, but these are at quite
large distances and arise from long contacts between DEBFIZ and water molecules in the crystal.
Fingerprint plots for C-H interactions in FIG. 2-4 (d) are remarkably different from that for N-H and H-H interactions, and
show a number of new features, the most striking being the presence of ‘wings’ at top left and bottom right of each plot. This
feature can be readily identified as a result of C–H…π interactions in the crystals, and it reflects the aromaticity of the
hydrazones under study. The wing at the top left (di < de) corresponds to points on the surface around the C–H donor,
whereas that at the bottom right (de< di) corresponds to the surface around the π acceptor, in this case the double carbon–
carbon bond. For PH 22-43 (refcode HUKFIC) these features are sharp and exceptionally well defined. The hydrazones under
study are examples of ‘sandwich herringbone‘structures, where dimeric pairs pack in herringbone fashion. Therefore,
fingerprint plots for C-H interactions display a significant additional feature, namely the blue-green areas centered at de = di ≈
2.0 Å, close to the van der Waals radius of carbon [28] and it arises from the appearance of a significant overlap between
parallel hydrazones molecules, the onset of π … π stacking for PH 22-43.
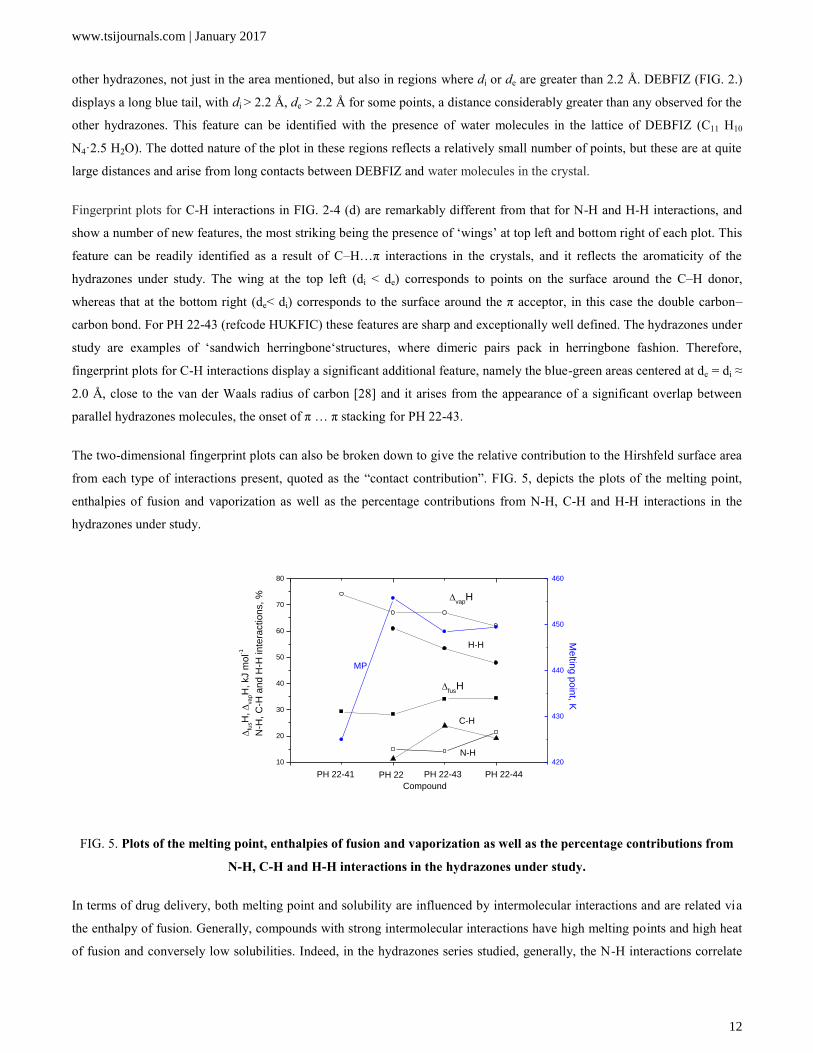
The two-dimensional fingerprint plots can also be broken down to give the relative contribution to the Hirshfeld surface area
from each type of interactions present, quoted as the “contact contribution”. FIG. 5, depicts the plots of the melting point,
enthalpies of fusion and vaporization as well as the percentage contributions from N-H, C-H and H-H interactions in the
hydrazones under study.
0 2 4
10
20
30
40
50
60
70
80
Compound
MP
vap
H
fus
H
H-H
C-H
N-H
PH 22-44PH 22-43PH 22PH 22-41
fu
sH
,
vapH
, kJ m
ol-1
N-H
, C
-H a
nd H
-H inte
raction
s, %
420
430
440
450
460
Me
lting
po
int, K
FIG. 5. Plots of the melting point, enthalpies of fusion and vaporization as well as the percentage contributions from
N-H, C-H and H-H interactions in the hydrazones under study.
In terms of drug delivery, both melting point and solubility are influenced by intermolecular interactions and are related via
the enthalpy of fusion. Generally, compounds with strong intermolecular interactions have high melting points and high heat
of fusion and conversely low solubilities. Indeed, in the hydrazones series studied, generally, the N-H interactions correlate
www.tsijournals.com | January 2017
13
with the heat of fusion and the highest N-H contribution being observed in the compound with the highest heat of fusion. On
the other hand, a decrease in melting point and enthalpy of vaporization corresponds to a general decrease in H-H
interactions.
Conclusion
It is well known that sublimation enthalpies are not additive because they are sum of vaporization and fusion enthalpies. But
here we can see that the closely related compounds are characterized by almost the same enthalpy of sublimation. However,
in the series of compounds, increase in the enthalpy of fusion is almost fully compensated by diminution of the enthalpy of
vaporization. The Hirshfeld surface analysis (unfortunately, only three structures are available) shows that increasing the
melting enthalpy is associated with a tendency to enhance the N-H ... N interactions whereas decrease in the enthalpy of
evaporation corresponds to weakening the H-H interactions. In turn, π ... π interactions seem to have little effect on the
thermochemical characteristics of the hydrazones. It is quite clear since in the crystal lattice the hydrazones are packed in
herringbone fashion when the molecular planes are perpendicular to each other. In other words, increasing the enthalpy of
fusion is determined by increased hydrogen bonding due to N-H ... N interactions, while enthalpy of evaporation depends
simply on the melt density (short-range intermolecular contacts that are saved in the melt).
The preliminary selection of new pharmaceuticals requires the development of new efficient methods of
physicochemical
analysis. The estimation of thermodynamic characteristics (e.g., of solubility) needs an
accurate determination of the enthalpy
of vaporization of compounds under investigation. In this study enthalpies
of fusion, sublimation, and vaporization were
measured for some hydrazones. The ability of the thermogravimetric method to measure saturated vapor pressure of the
hydrazones was demonstrated and the
enthalpies of vaporization of the hydrazones were determined. Combined
thermochemical analysis using several experimental procedures afforded consistent reliable
information on the thermal
characteristics of the compounds under study. The Hirshfeld surface analysis of the hydrazones reveals that
the fingerprint
plots rapidly convey the significant differences and similarities between this series of related structures, and it seems they
would be a useful complement to more conventional tools (such as crystal packing diagrams). Moreover, simultaneous
thermochemical and Hirshfeld surface analysis of a wide series of related compounds with available crystal structures would
reveal the relationships between the intermolecular interactions in the molecular crystals and the thermochemical properties
more precisely.
Associated Content
Supporting information: Analytical results regarding samples purity; Evaluation of constant of Langmuir equation based on
benzoic acid; Calculation of vaporization enthalpy of benzoic acid; Average values of sublimation and vaporization
enthalpies for experimental and estimated data; Experimental data for pressure derived by the Knudsen effusion method;
Experimental data for pressure derived by thermogravimetric method. This material is available free of charge via the
Internet at http://pubs.acs.org.
Conflicts of Interest
The author declares no competing financial interest.
www.tsijournals.com | January 2017
14
Acknowledgement
The author would like to thank Dr Perlovich GL and Dr Schaper KJ for the samples of the hydrazones for the investigations.
Abbreviations
PH 22: 2-Pyridinecarboxaldehyde, 2-pyridinylhydrazone.
PH 22-41: Benzaldehyde, 2-pyridinylhydrazone.
PH 22-43: 2-Pyridinecarboxaldehyde, phenylhydrazone.
PH 22-44: 3-Pyridinecarboxaldehyde, 2-pyridinylhydrazone.
TLC: Thin Layer Chromatography.
DSC: Differential Scanning Calorimetry.
NMR: Nuclear Magnetic Resonance.
References
1. Wright SF, Dollimore D, Dunn JG, et al. Determination of the vapor pressure curves of adipic acid and triethanolamine
using thermogravimetric analysis. Thermochim Acta. 2004;421:25-30.
2. Chatterjee K, Hazra A, Dollimore D, et al. Estimating vapor pressure curves by thermogravimetry: a rapid and convenient
method for characterization of pharmaceuticals. Eur J Pharm Biopharm. 2002;54:171-80.
3. Price DM. Vapor pressure determination by thermogravimetry. Thermochim Acta. 2001;367-8.
4. Chickos JS. A protocol for correcting experimental fusion enthalpies to 298.15 K application in indirect measurements of
sublimation enthalpy at 298.15 K. Thermochim. Acta 1998;313:19-26.
5. Chickos JS, Hesse DG, Liebman JF. A group additivity approach for the estimation of heat capacities of organic liquids
and solids at 298 K. Structural Chem. 1993;4:261-9.
6. Seydel JK, Schaper KJ, Rüsch-Gerdes S. Experimental drugs and combination therapy. Immunobiology 1994;191:569-77.
7. Popp FD, Potential anticonvulsant. XII. Anticonvulsant activity of some aldehyde derivatives. Eur J Med Chem.
1989;24:313–15.
8. Perlovich GL, Kazachenko VP, Strakhova NN, et al. Solubility and transfer processes of some hydrazones in biologically
relevant solvents. J Chem Eng Data. 2013;58:2659−67.
9. Wood A, Aris W, Brook DJR. Coordinated hydrazone ligands as nucleophiles: Reactions of Fe (papy)2. Inorg Chem.
2004;43:8355-60.
10. Taya T, Sakamoto T, Doi K, et al. Complexation behavior of heterocyclic hydrazones. I. Structure and acid-base
equilibria for heterocyclic hydrazones. Bull Chem Soc Jpn. 1993;66:3652-61.
11. Wright SF, Phang P, Dollimore D, et al. An overview of calibration materials used in thermal analysis – benzoic acid.
Thermochim Acta. 2002;392–93, 251-7.
www.tsijournals.com | January 2017
15
12. Surov OV, Mamardashvili NZH, Shaposhnikov GP, et al. Thermodynamic parameters of sublimation of calix[4]arene.
Russ J Gen Chem. 2006;76:974-9.
13. Surov OV, Mamardashvili NZH, Shaposhnikov GP, et al. Thermodynamics of sublimation of calix[4]arene complexes
with solvent molecules. J Incl Phenom Macrocycl Chem. 2007;58:329-35.
14. http://www.acdlabs.com.
15. Wolff SK, Grimwood DJ, McKinnon JJ, et al. Polymorphism in pharmaceutical solids. 2 Ed. CRC Press; 2015:72.
16. Chickos JS, Acree WE, Jr. Enthalpies of sublimation of organic and organometallic compounds. 1910–2001. J Phys
Chem Ref Data. 2002;31:537-698.
17. Gavezzotti AJ. Calculation of intermolecular interaction energies by direct numerical integration over electron densities:
An improved polarization model and the evaluation of dispersion and repulsion energies. Phys Chem B. 2003;107:2344−53.
18. Li ZJ, Ojala WH, Grant DJ. Molecular modeling study of chiral drug crystals: Lattice energy calculations. J Pharm Sci.
2001;90:1523−39.
19. Kuleshova LN, Hofmann DW, Boese MR. Lattice energy calculation – A quick tool for screening of cocrystals and
estimation of relative solubility. Case of flavonoids. Chem Phys Lett. 2013;564:26−32.
20. Spackman MA, Jayatilaka D. Hirshfeld surface analysis. Cryst Eng Comm. 2009;11 (1):19-32.
21. McKinnon JJ, Jayatilaka D, Spackman MA. Towards quantitative analysis of intermolecular interactions with Hirshfeld
surfaces. Chem Commun. 2007;3814–16.
22. Spackman MA, McKinnon JJ. Fingerprinting intermolecular interactions in molecular crystals. Cryst Eng Comm
2002;4:378–92.
23. McKinnon JJ, Spackman MA, Mitchell AS. Novel tools for visualizing and exploring intermolecular interactions in
molecular crystals. Acta Cryst. 2004;B60:627-68.
24. www.ccdc.cam.ac.uk
25. Casey AT, Hoskins BF, Traverso IP. The crystal and molecular structures of the ligand (E)-Pyridine-2-carbaldehyde
Pyridin-2'-ylhydrazone and the palladium (II) complex Chloro[ (E)-pyridine-2-carbaldehyde pyridin-2'-
ylhydrazonato]palladium (II) which involves the coordination of the ligand in its anionic form. Aust J Chem. 1984;37:739-
49.
26. Mondal B, Purani VG, Lahiri GK. Example of highly stereoregulated ruthenium amidine complex formation: Synthesis,
crystal structures, and spectral and redox properties of the complexes [RuII (trpy){NC5H4-CH=N-N (C6H5)C (CH3)=NH}]
(ClO4)2 (1) and [RuII (trpy) (NC5H4-CH=N-NH-C6H5)Cl]ClO4 (2) (trpy = 2,2‘:6‘,2‘ ‘-Terpyridine). Inorg Chem.
2002;41:5831-36.
27. Hansen LK, Perlovich GL, Schaper KJ, et al. Pyridine-3-carbaldehyde 2-pyridylhydrazone. Acta Cryst. 2007;63
(6):o3042.
28. Rowland RS, Taylor R. Intermolecular nonbonded contact distances in organic crystal structures: Comparison with
distances expected from Vander waals radii. J Phys Chem. 1996;100:7384-91.