Embed Size (px)
Citation preview
CDE March 2013
ENTREPRENEURSHIP OR SURVIVAL? CASTE AND
GENDER OF SMALL BUSINESS IN INDIA
Ashwini Deshpande Email:[email protected] Department of Economics Delhi School of Economics
Smriti Sharma Email:[email protected]
Department of Economics Delhi School of Economics
Working Paper No. 228
Centre for Development Economics Department of Economics, Delhi School of Economics
1
Entrepreneurship or Survival? Caste and Gender of Small Business in India
Ashwini Deshpande and Smriti Sharma Delhi School of Economics, University of Delhi.
Abstract
We use unit-level data from the registered manufacturing segment of the Third
and Fourth rounds of the Indian Micro, Small and Medium Enterprises (MSME) census data for 2001-2 and 2006-7 respectively, to understand the changes in involvement and dynamics not only of Dalits (officially, Scheduled Castes, or SCs), but also of other marginalized groups, specifically Adivasis (officially, Scheduled Tribes, or STs) and women, in this sector. We empirically estimate the growth rates for these enterprises and analyse the determinants, including caste and gender of the enterprise owner. We find clear and persistent caste and gender disparities in virtually all enterprise characteristics in the registered manufacturing MSME sector. The share of SC-ST ownership has declined over the period, SC-ST enterprises tend to be smaller, more rural than urban, have a greater share of owner-operated (single employee) units. The inter-state variation in share of ST-SC businesses reveals that with the exception of the tribal majority north-eastern states, SC and ST businesses are under-represented as compared to their share in state populations. The sectoral mix varies considerably by rural-urban location as well as by the caste and gender of the owner. The traditional stigmatizing association with leather-work continues to be one of the top five business activities for SCs and not for other caste groups. The gender-caste overlap indicates that the share of female-owned and female-managed enterprises is significantly greater among SC-ST-owned enterprises, than those owned by Others, and especially by Hindu upper-castes.The majority of the MSME workforce is employed in non-SC-ST owned firms. Also, there is evidence of homophily in OBC and upper-caste-owned firms, suggesting that the rise in Dalit entrepreneurship is key to increasing Dalit employment in the small business sector. While it is significant that there is now an emerging section of Dalit entrepreneurs, we find that most Dalit businesses occupy a very different place in the production chain, viz., that they are engaged in the bottom-of-the-ladder, low productivity, survival activities, as can be seen from our estimates of their lower rate of growth, after controlling for other characteristics. Thus, we find that entrepreneurship as a vehicle for social mobility for Dalits is yet to become a reality for India.
2
Entrepreneurship or Survival? Caste and Gender of Small Business in India
Ashwini Deshpande1
On Republic Day this year, two billionaires, Kalpana Saroj and Milind Kamble,
featured among the Padma Awardees, the nation’s highest civilian honours. The award
was less a celebration of material wealth and more of human triumph over adversity, as
these two awardees rose from a life of crushing poverty and marginalization, and against
all odds achieved unprecedented success. They are members of the Dalit Indian Chamber
of Commerce and Industry (DICCI), founded on April 14, 2005, on the birth anniversary
of Dr. B. R. Ambedkar, acknowledged by the DICCI as their “messiah and the intellectual
father”. Interestingly, while Ambedkar was responsible for making compensatory
discrimination for Dalits mandatory through constitutionally guaranteed quotas in
government jobs, the DICCI group rejects job reservation as a means to Dalit
emancipation, as they feel quotas have added yet another (negative) stereotype to the
Dalits, seen as they are as “the State’s Jamais” (sons-in-law of the State). Instead of
depending on the State to provide Dalits decent jobs, the DICCI has adopted as it’s
mission statement “be job givers, not job seekers”, exhorting members of the Dalit
community in India to become entrepreneurs
and Smriti Sharma
Delhi School of Economics, University of Delhi.
1. Introduction
2
The DICCI’s belief that historically marginalized groups can improve their lot
through entrepreneurship is not unique. Indeed, individuals from groups facing labour
.
1Deshpande ([email protected]) is the corresponding author. We are extremely grateful to B. N. Goldar for his help and suggestions in decoding the MSME data. We would like to
thank the Ministry of Micro, Small and Medium Enterprises for providing us with the data. We thank Bhaskar Dutta, Parikshit Ghosh and Thomas E. Weisskopf for comments on an earlier draft, and participants at the research students’ colloquium at the Department of Economics, Delhi School of Economics, and at the 7th IZA-World Bank conference on “Employment and Development” for questions and suggestions. Needless to add, we are solely responsible for all remaining errors and omissions.
2 http://www.dicci.org/about.html, accessed October 31, 2012
3
market discrimination have a greater incentive to enter self-employment, because they
expect lower wages or unfavourable employment in the labour market. Thus, self-
employment or entrepreneurship is seen as a route out of poverty and as a desirable
alternative to wage employment3
3For references to this literature, see Fairlie (2004).
. This belief implicitly assumes that discriminatory
tendencies that characterize labour markets are somehow absent from other markets, such
as land or credit, which are critical to the success of entrepreneurial activities. However,
research demonstrates that labour market discrimination can “spill over” into markets
relevant for self-employment creating seemingly discriminatory outcomes in these
markets (Coate and Tennyson, 1992).
Self-employment is also supposed to confer autonomy (what, how, when, and
where to produce) and economic independence (scale of operations, partnerships at
various levels etc.). However, this implicitly assumes that the self-employed are actually
entrepreneurs. In reality, a large part of self-employment in developing countries reflects
low-end, low-productivity, survival activity, in that individuals who fail to get a regular
job, end up with low-paying self-employment in the informal economy as a last resort,
rather than a conscious choice to move away from wage employment and into
entrepreneurship.
The DICCI focuses on entrepreneurship, as it believes that “Dalit Capitalism” will
help Dalits rise to the top of the social pyramid, and will pave the way for the end of the
caste system. The long history of engagement with the question of annihilation of caste is
testimony to how vexed this question is, with no easy answers. We believe that in order to
understand the spread of “Dalit Capitalism” it is not enough to focus on the top end of
Dalit businesses (the Dalit billionaires), but instead, to investigate the extent and spread
of Dalit participation in small businesses, which more accurately reflects the material
conditions of millions of Dalits who are not in wage employment. In 2004-5, according to
the National Sample Survey, in rural India, 34 percent of Scheduled Caste (SC) and 46
percent of Scheduled Tribe (ST) households were in self-employment (with
corresponding urban proportions being 29 and 26).
4
We use unit-level data from the registered manufacturing segment of the Third
and Fourth rounds of the Indian Micro, Small and Medium Enterprises (MSME) census
data for 2001-2 and 2006-7 respectively, to understand the changes in involvement and
dynamics not only of Dalits (officially, Scheduled Castes, or SCs), but also of other
marginalized groups, specifically Adivasis (officially, Scheduled Tribes, or STs) and
women, in this sector. The Third Census does not have information on the religion of the
owner, but the Fourth Census does. This allows us to examine the overlaps between caste
and religion and compare the non-SC-ST-OBC (Other Backward Classes) Hindus (the
closest approximation to upper castes) with Dalits and Adivasis. In a recent paper, Iyer et
al (2013) present a profile of Dalit businesses based on Economic Census data. Our paper
confirms several of their findings, but significantly expands the state of knowledge on
this subject by, one, examining how the caste mix of employees varies by the caste of the
owner, which enables us to assess the extent of homophily (or more appropriately status
homophily4
A stylized fact relevant to business ownership in group-divided societies, e.g.
USA, Malaysia or India, is that of wide inter-group disparities in the ownership of
businesses. These disparities reflect discrimination in several spheres, viz., pre- (labour)
market discrimination that manifests itself in lower education and skill level of
marginalized groups, called “less direct” discrimination (Moore, 1983), or discrimination
in credit or asset markets, which prevents access to resources needed to start a business.
), i.e. affinity of owners to hire employees from their own caste groups. This
helps us gauge if Dalit businesses can indeed be significant job-givers, and for whom.
Two, we examine gender differences in ownership and management as well as the
gender-caste overlap, to understand how gender mediates disparities both across and
within caste groups. Three, we calculate the growth of small businesses in manufacturing
and identify its determinants, including the effect of caste and gender of owner.
1.1 Literature on Entrepreneurship and Business Ownership
4McPherson et al (2001) discuss the literature on homophily which points out a distinction between status
homophily, in which the similarity is based on informal, formal or ascribed status, and value homophily, which is based on values, attitudes, and beliefs. The former includes the major socio-economic dimensions that stratify society – ascribed characteristics like race, ethnicity, sex, or age, and acquired characteristics like religion, education, occupation, or behavior patterns.
5
Also, while there are significant rags-to-riches stories in every society, these are more the
exception rather than the rule, and entrepreneurial success seems to be positively
correlated with a family background in business (Dunn and Holtz-Eakin 2000; La Porta
et al 1999), the socio-economic status of parents, of fathers in particular (Nafziger, 1975),
and better human and financial capital (Bates, 1997). Disparities in business ownership
are an important component of overall wealth disparities between social groups.
While the MSME sector in India has been extensively studied from the
perspective of efficiency and viability (Bhavani 1991; Goldar 1985; Goldar 1988;
Tendulkar and Bhavani 1997), a comprehensive investigation of this sector from the point
of view of the involvement of the marginalized groups is still at a nascent stage. Thorat
and Sadana (2009) combine evidence from the published Economic Census and National
Sample Survey data to present confirmation of continuing inter-caste disparity in
ownership of private enterprises. Iyer et al (2013) use three rounds of the Indian
Economic Census micro-data to document various aspects of inter-caste disparities in
enterprise ownership. They find that the differences are widespread, but have decreased
modestly between 1990-2005. Both these papers find that SCs and STs generally operate
smaller enterprises, mainly household businesses assisted by family labour, with a lower
capital base and traditional technology. Coad and Tamvada (2012) use the third MSME
census to explore determinants of firm growth and various types of barriers faced by
small enterprises, but unlike our paper that analyses various aspects related to the
participation of marginalized groups, their analysis considers more general factors and
focuses solely on growth.
Our main results can be summarized as follows: there are clear caste and gender
disparities in ownership of registered manufacturing MSMEs, where SCs and STs are
under-represented compared to their population shares, OBCs are roughly equal to their
population share and “Others” and Hindu upper castes (non-SC-ST-OBC Hindus) are
over-represented. Caste disparities have marginally increased over 2001-2 and 2006-7,
whereas gender disparities have marginally decreased. Proportions of SC, ST, OBC and
female-ownership are higher in rural compared to urban areas. Based on descriptive
6
evidence as well as rigorous growth regressions, we find that SC-ST enterprises are more
survivalist than entrepreneurial. We find that female-ownership is much higher among
SC-ST than among the upper-caste firms. In contrast to other literature on female small
business ownership, we find that female-owned and female-managed firms grow faster
than their male counterparts, after controlling for other factors. Matching the caste groups
of the owners with their employees, we find that proportions of SC-ST employees are
highest in SC-ST owned enterprises, and significantly lower in enterprises owned by
other caste groups, indicating that a rise in SC-ST ownership might be key to increasing
SC-ST employment in the registered manufacturing MSME sector.
2. Small Manufacturing in India: Caste and Gender of Enterprise Owners
The MSME sector in India contributes significantly to manufacturing output,
employment and exports. In terms of value, the sector accounts for about 45 percent of
the manufacturing output and around 40 percent of total exports. In 2010-11, it employed
73.2 million persons spread over 31.1 million enterprises (MSME, 2012:26-27). It has
consistently registered a higher rate of growth than the average for the industrial sector.
This sector produces over 6000 products ranging from the traditional to high-tech
products, with the largest contributors being food products and beverages producing 14
percent of the total MSME output, wearing apparel with 13.7 percent, and fabricated
metal products contributing close to 9 percent.
The Office of the Development Commissioner conducted the Third MSME
census in 2002-3 for the reference year 2001-2, and the Fourth Census in 2008-09 for the
reference year 2006-075,6
5The first census was conducted in 1973-74 and the second in 1990-91. 6 In 2006, the Micro, Small and Medium Enterprises Development (MSMED) Act was passed, prior to
which this sector was known as the Small Scale industries sector.
. In the Third census, the enterprises were divided into Small
Scale Industrial Undertakings (SSIs) and Small Scale Service and Business (Industry
Related) Enterprises (SSSBEs). In the Fourth Census, this classification was changed to
the following: enterprises with investment of up to INR 25 lakhs in plant and machinery
are classified as micro; enterprises with investment between INR 25lakhs and INR 5
7
crore are classified as small; and enterprises with investment between INR 5 crore and
INR 10 crore are classified as medium.
The permanently registered units were covered on a complete enumeration basis
(census), whereas a sample survey was conducted for the unregistered MSMEs7. In the
registered sector, approximately 23 and 22.4 lakh units were covered in the Third and
Fourth censuses respectively. Of these, 14 lakh in the Third Census and 15 lakh in the
Fourth census (about 63 percent) were found to be working, and the rest were closed. By
registration, we mean MSMEs that are registered with the District Industry Centers (DIC)
of the respective state governments. The registration scheme is voluntary and free of
cost8.This paper focuses on manufacturing enterprises in the registered sector for several
reasons: one, because the bulk of the registered enterprises (67 percent in the fourth
census) are in manufacturing 9
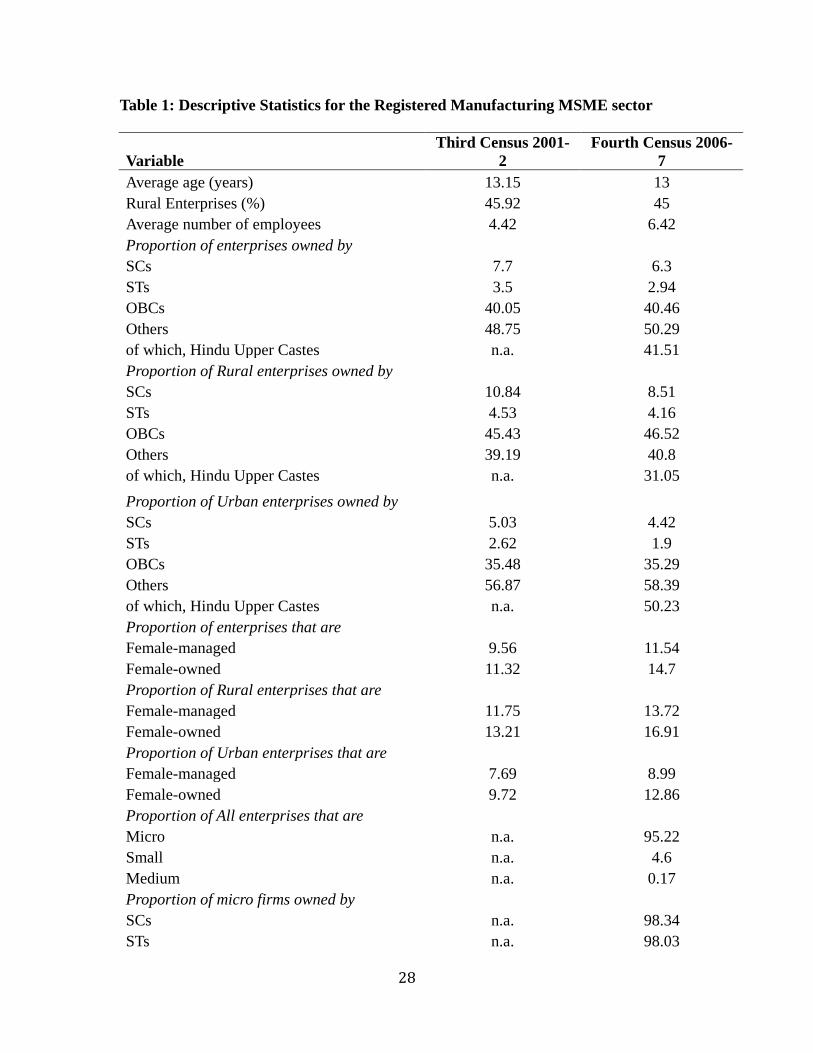
As Table 1 shows, the average age of a registered manufacturing enterprise in the
MSME sector is 13 years. 45 percent of units are rural. We see clear and sharp disparities
in ownership by caste, in that OBCs and Others together own over 90 percent of the units,
with the rest owned by SCs and STs. Comparing these figures to population shares, the
OBC share in enterprise ownership is roughly equal to their share in the population (41.2
percent), whereas SCs and STs (at 19.7 percent and 8.4 percent of the national
population) are significantly under-represented. The under-representation of these two
; two, manufacturing is critical for generating wage
employment; three, large parts of modern manufacturing are non-traditional activities,
therefore, an analysis of changes in the caste-occupation overlap in this sector provides a
good index of the changing economic role of caste in the private sector.
2.1 Caste and gender of enterprise owners
7Unregistered sector survey was done using a two-stage sampling design, with the first stage being the
village/urban block and the second stage being the establishment. The Economic Census was used as the base frame for sampling.
8Registration with the DIC gives the enterprise access to benefits such as easier access to institutional credit, preferential rates of interest, various exemptions and subsidies and marketing assistance etc. Sharma (2013) finds that being registered with the DIC yields significant gains for firms in terms of sales per employee and value added per employee.
9According to the Fourth Census, the unregistered MSME sector comprises of approximately 24.5 million enterprises, of which 52 percent are rural. 73.8 percent of units are service-based.
8
groups is mirrored in the over-representation of “Others”and Hindu upper castes (non-
SC-ST-OBC Hindus) which comprised 30.7 and 21.6 percent of the population
respectively in 2004-0510
Over the two censuses, we find an increase in caste disparity in ownership of
manufacturing enterprises: decline in proportions owned by SCs and STs (at 6 and 3
percent respectively in 2006-7)
.
11
10Authors’ calculations based on 61st Round NSS Employment-Unemployment Survey, 2004-5, unit-level
data. 11These are not very different from the proportions in the unregistered sector: SCs and STs own 7.89 and
3.18 percent respectively, while OBCs and Others own 40.31 and 43.48 percent respectively.
, and a corresponding increase in proportions owned by
OBCs and Others (at 40 and 50 percent respectively). This is contrast to the overall trend
reported in Iyer et al who find a modest increase in proportions of SC-ST enterprise
ownership over 1990-2005 for all non-agricultural enterprises (Iyer et al, 2013, p.53). We
find that one, proportions owned by SCs, STs and OBCs are substantially higher in rural
areas compared to urban. Two, the decline in SC-owned units is higher in rural than urban
areas, whereas ST-owned units show a greater decline in urban than in rural areas. Three,
the overall (small) rise in OBC-owned units is mainly due to a rise in rural areas, and the
rise in Others’ proportion is evenly spread across rural and urban areas.
Gender disparities in ownership are sharper, but show a reduction over the two
rounds. Female-ownership (enterprises where 51 percent of share capital belongs to a
woman) increased from 11.32 percent in 2001-2 to 14.7 percent in 2006-7, whereas
female-managed units increased from 9.56 to 11.54 percent. Note that all female-
managed enterprises are not female-owned: in 2006-7, 88 percent of female-managed
enterprises were female-owned, but only 69 percent of female-owned firms were female-
managed.As Table 1 shows, both female-management and female-ownership is higher in
rural than in urban areas. This might seem paradoxical at first glance, but it is useful to
recall that labour force participation rates (LFPRs) for women also exhibit the same
pattern in that rural LFPRs for women are higher than urban. This raises larger questions
about what factors contribute to female empowerment but that discussion would have to
await another paper.
9
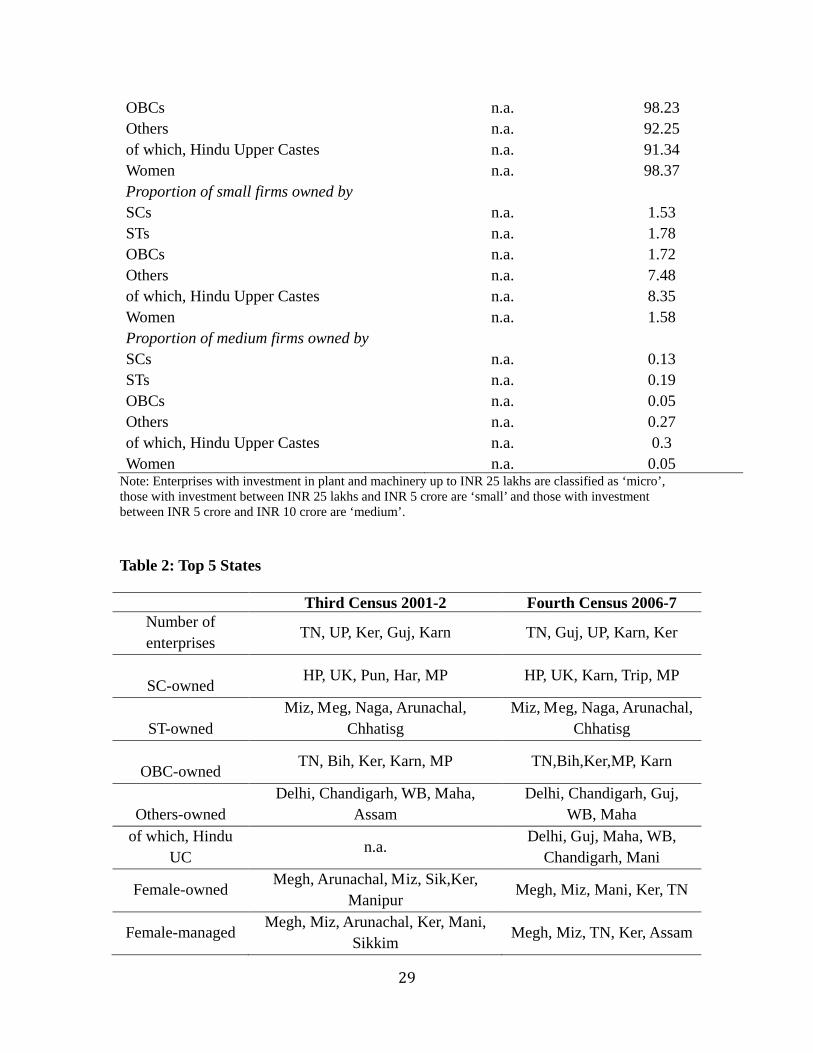
The overwhelming majority of enterprises in the registered MSME sector are
micro, rather than small or medium, but again with clear caste and gender disparities. For
instance, 8.35 percent of Hindu upper-caste owned firms are small, whereas the
proportions among the other caste groups are under 2 percent.
2.2 State-wise distribution
Tamil Nadu has the single largest percentage of registered manufacturing MSMEs
(around 16 percent in 2006-7). As Table 2 shows, the five states which together account
for over 56 percent of the total MSMEs have remained the same over the two censuses,
but the relative ranking of some of the states has changed. It is interesting that three of the
four southern states appear in the top five across both rounds.
SC-ST ownership is marked by considerable regional and inter-state variation,
and with the exception of ST ownership in some north-eastern states (such as Arunachal
Pradesh or Meghalaya), both these groups are substantially under-represented in
enterprise ownership relative to their shares in the respective state populations. The
highest proportion of SC-owned enterprises is in Himachal Pradesh, followed by
Uttarakhand, Karnataka, Tripura, Madhya Pradesh, and Punjab. ST ownership is high
predominantly in the tribal majority north-eastern states (Mizoram, Meghalaya,
Nagaland, Arunachal Pradesh). The only state in the Indian mainland with high ST
ownership is Chhattisgarh, which has the highest proportion of tribal population outside
of the north-east.
States with the highest proportions of OBC ownership are Tamil Nadu, Bihar,
Kerala, Karnataka and Madhya Pradesh. It is interesting that there is no overlap between
states which have high Others’ ownership and those which have high SC-ST ownership,
highlighting the somewhat obvious fact that caste disparities in enterprise ownership are
systematically related to broader inter-caste disparities at the state level, rather than a
result of random factors.
10
The north-eastern states, along with Kerala, lead in terms of both female
ownership as well as female management, reflecting the egalitarian tradition which owes
in part to the matrilineal history of these regions. The fact that a state such as Tamil Nadu
that does not share this history appears in the top five states for female-ownership (albeit
in the fifth position) in 2006-7 could be an indicator of change, but it is too early to say.
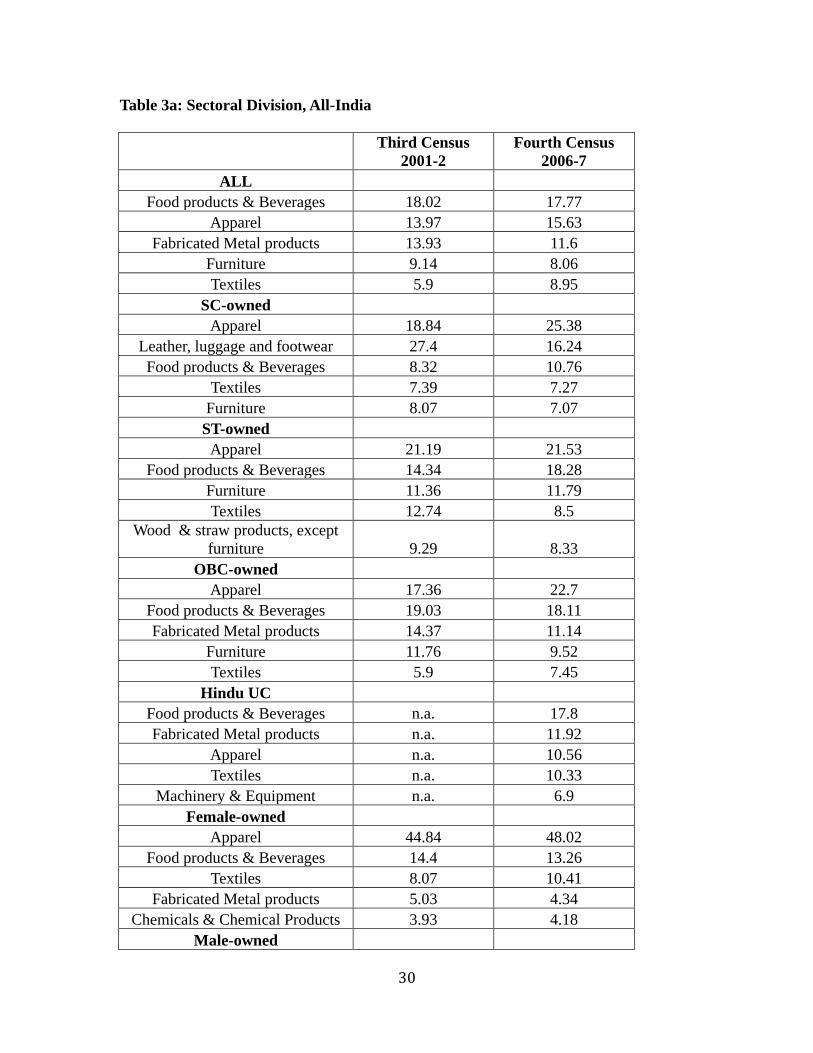
3. How is production differentiated by caste and gender?
3.1 Distribution of activities across castes
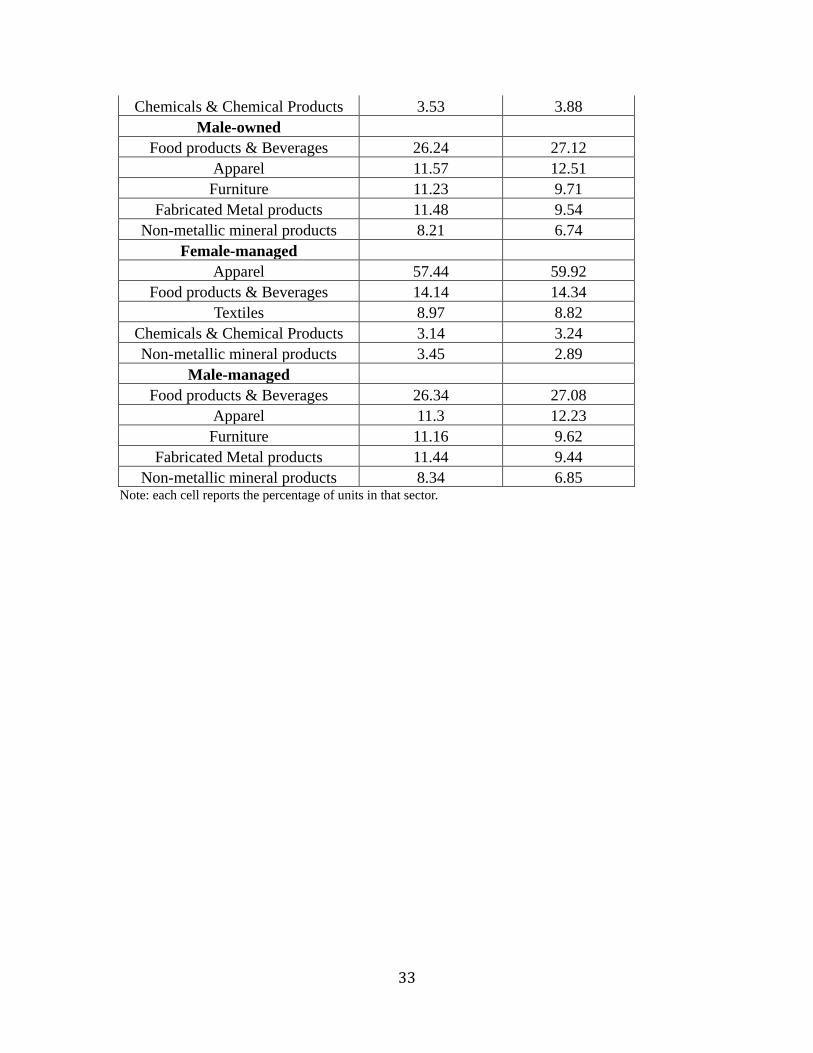
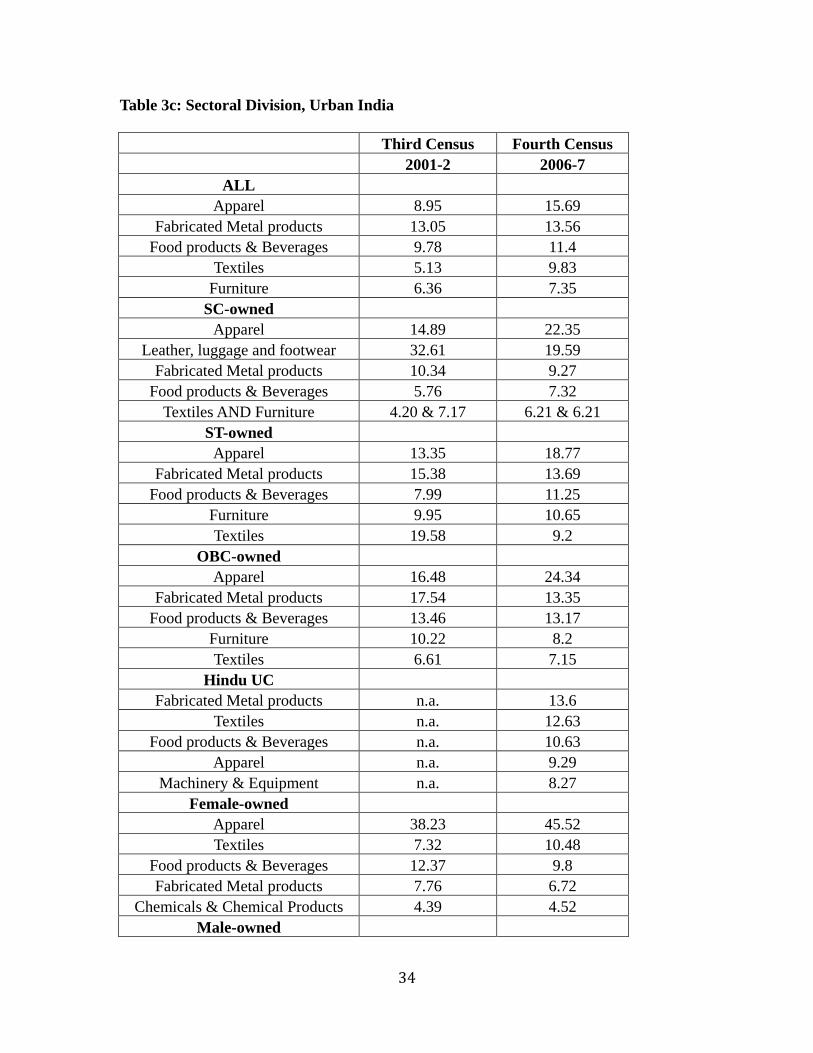
Tables 3a, b and c show the changing distribution of activities (based on NIC 2-
digit(2004) classification) over the two census rounds for all enterprises, differentiated by
rural-urban as well as by caste and gender of the owner/manager. The top five activities,
which collectively account for roughly 62 percent of all registered manufacturing
MSMEs, are food products and beverages, apparel, fabricated metal products, furniture
and textiles. Looking at the rural-urban division of activities, we see that food products
and beverages are far more important in rural areas, compared to urban. The share of this
sector has gone up over the period; the increase being much sharper for rural enterprises,
where they account for a quarter of all MSMEs in 2006-7.
This overall picture changes somewhat when we differentiate by caste of the
owner. We can see that activities dealing with leather – tanning and dressing of leather,
manufacture of luggage and footwear – stigmatizing jobs traditionally associated with
one of the Dalit castes, are the most important activity for SC manufacturing and these do
not appear in the top five activities of any other caste group. However, over the period,
the proportion of SC-owned enterprises engaged in leather has shown a decline. Also,
leather forms a larger share of urban SC-owned units, compared to rural.
The stigma of untouchability has traditionally kept Dalits out of food-related
industries (Navsarjan 2010; Shah et al 2006). We find that the proportion of SC-owned
11
firms in food products and beverages is significantly lower than the national average, and
that of all other caste groups. However, over the period, this proportion has increased,
both in rural and urban areas, and again, proportions are smaller in urban areas compared
to rural. To the extent that Dalit participation in leather and exclusion from food are
indicators of traditional caste practices, we find some evidence of loosening of these ties,
but find that these practices more strongly entrenched in urban compared to rural areas,
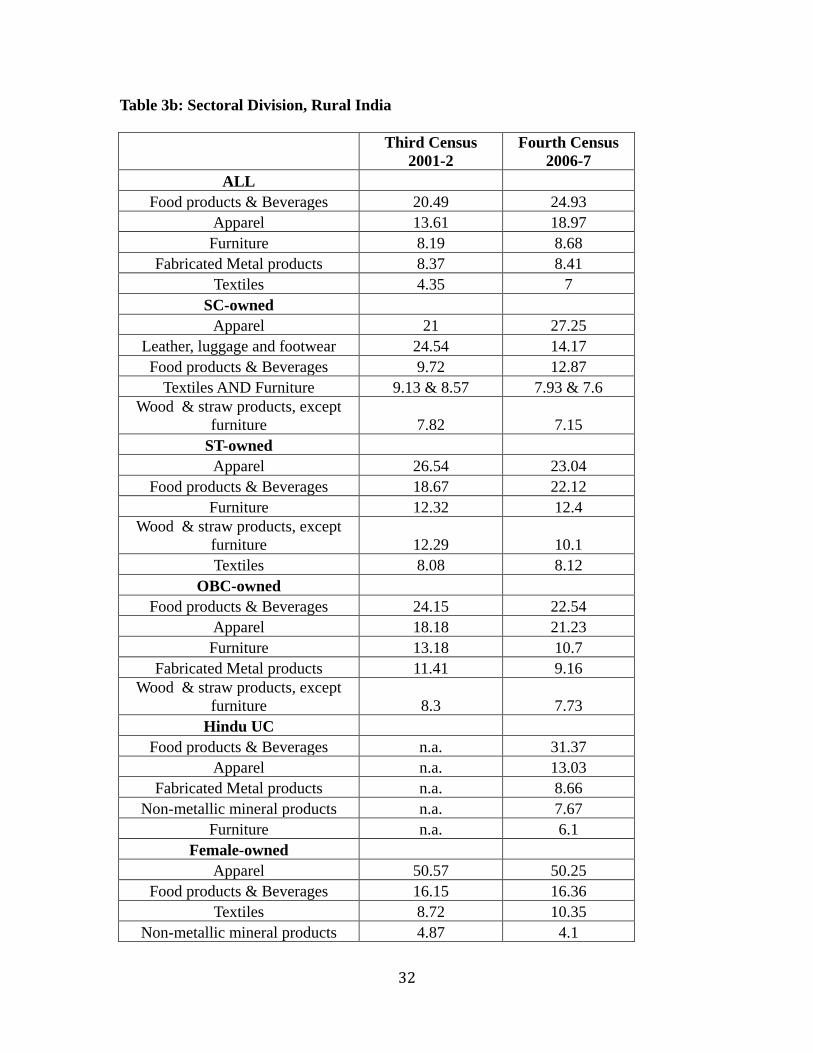
which is an enigma.
Another instance of traditional practices can be seen in the case of rural ST
enterprises, 10 percent of which are engaged in the making of wood and straw products.
It is noteworthy that for urban STs, this proportion is 5 percent in 2006-7, and this
activity is not in the list of the top five activities for urban STs. However, the share of
wood and straw products has marginally gone down over the two censuses.
The OBC picture is very similar to the all-India picture; given the high share of
OBC-owned enterprises, this is probably driving the all-India picture. Roughly 7-8
percent of Hindu upper caste units are engaged in the production of machinery and
equipment, a category of production that distinguishes them from the other caste groups.
Rural upper castes are also engaged in the production of non-metallic mineral products.
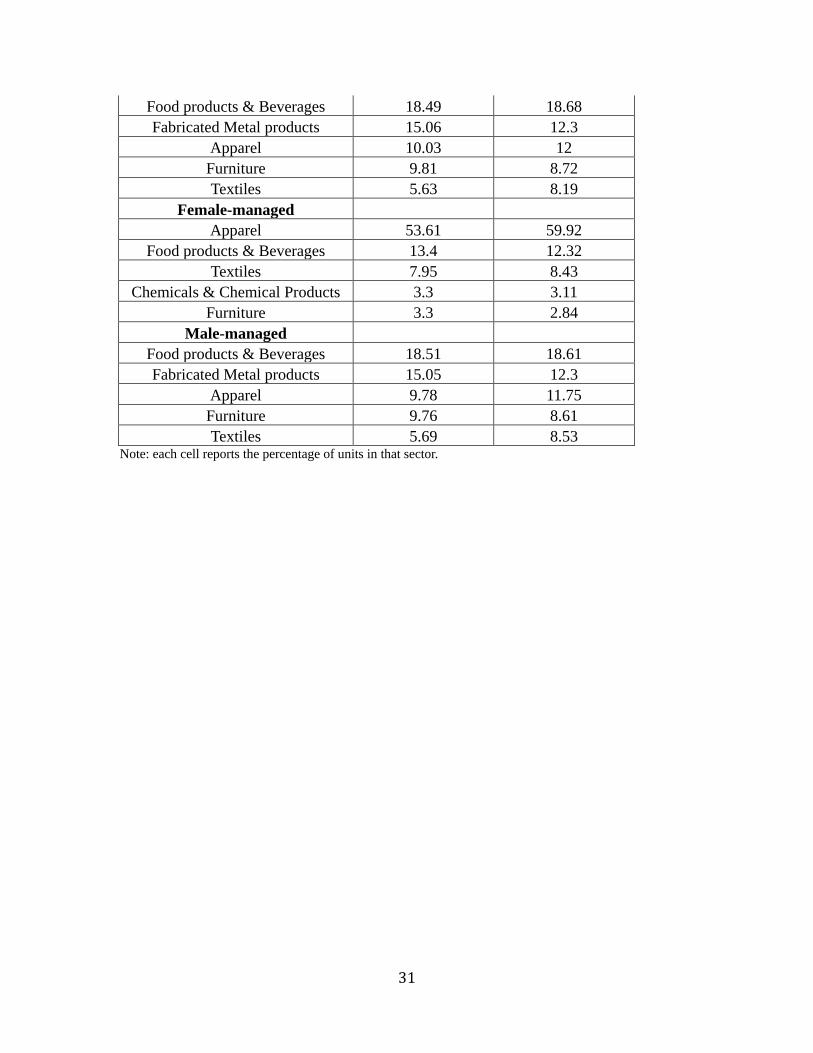
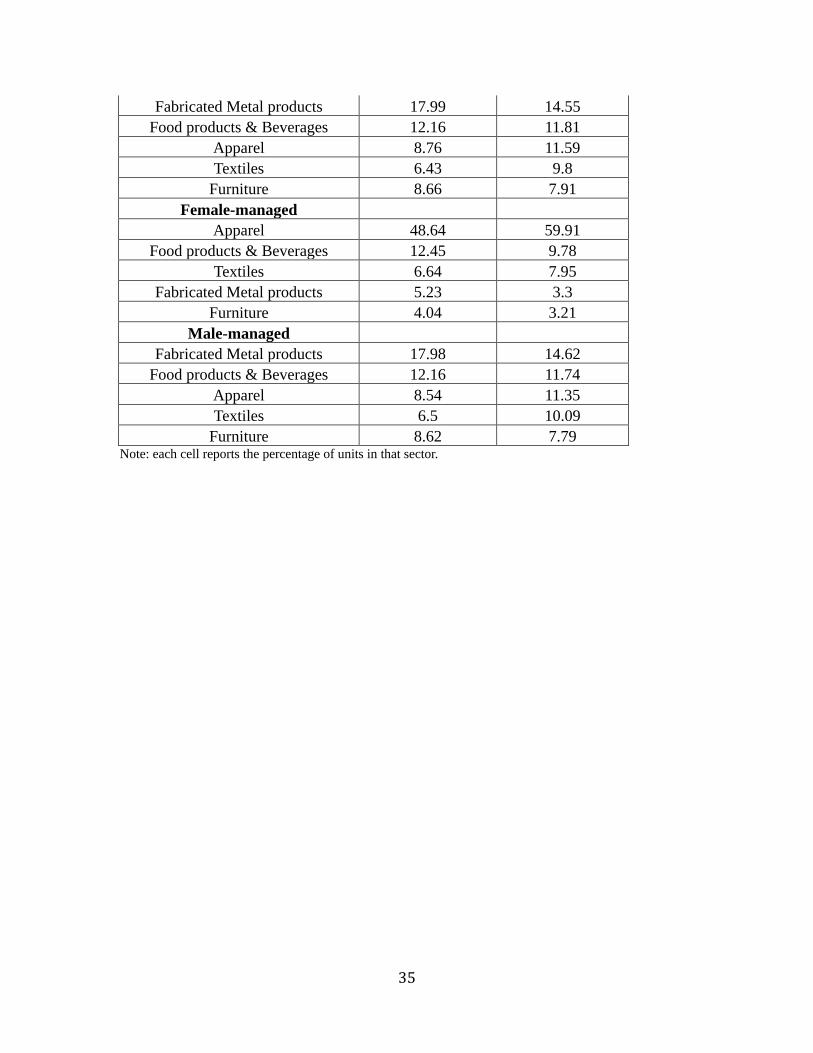
3.2 Distribution of activities by gender
The differences in activities by gender of owner-manager are starker than the
caste differences. In 2006-7, 59.92 percent of female-managed firms and 48 percent of
female-owned firms were engaged in manufacture of wearing apparel. These proportions
are an increase over shares in 2001-2, which were 53.61 and 44.84 respectively. Some
other dominant activities for female firms (managed and/or owned) are food products and
beverages (roughly 13 percent compared to roughly 19 percent for men) and textiles. On
the other hand, furniture and fabricated metal products are much more important for male
firms. These differences confirm findings from other literature. Das (2003) deals
specifically with non-farm household enterprises in India and finds that women continue
12
to operate trades traditionally considered the domain of women. Experimental evidence
also suggests that women are more likely to be risk-averse than men (Eckel and
Grossman 2008;Niederle and Vesterlund 2007), but we cannot say if this explains the
gender differences in propensities to be engaged with certain activities or if business
objectives tend to be different for men and women.
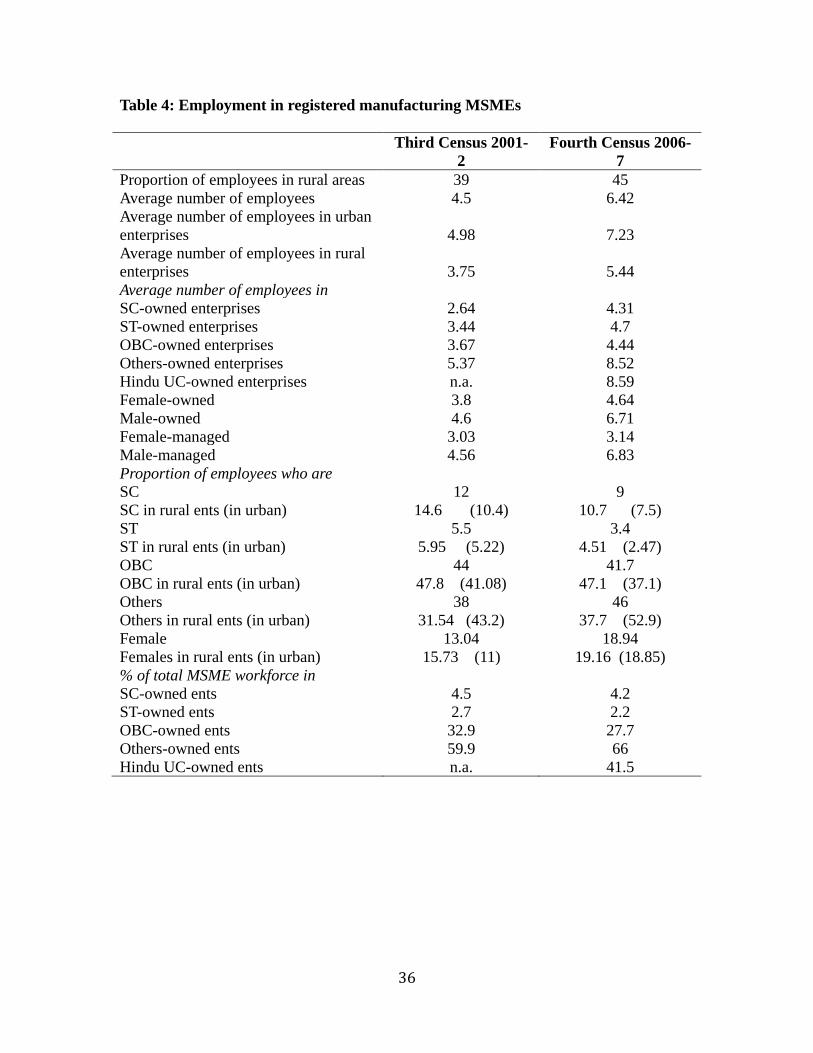
4. Employment
As Table 4 shows, 45 percent of employees in the registered manufacturing
MSME sector are in rural areas in 2006-7, an increase from 39 percent in 2001-2. Thus,
production patterns in this sector would play a vital part in shaping patterns of rural non-
farm employment, underscoring the critical importance of this sector in the Indian
economy. We see that the typical enterprise had 6.4 employees in 2006-7, with a higher
average in urban enterprises 12
The average number of employees is also an indication of the scale of the
enterprise. We can see that this number has gone up for all manufacturing enterprises
regardless of the caste and gender of the owner
. The MSME census does not specifically ask what
proportion of employees are family labour versus hired wage employees, but it would be
reasonable to infer that the probability of use of family labour would be higher, the lower
the number of average employees. Economic Census data allow the identification of
family labour, and Iyer et al (2013, p.56) find that in 2005, 51 percent of two-person and
26 percent of three-person firms consist of only family labour, with the proportions of
family labour being higher for SC/ST firms (77 percent) as compared to non-SC/ST firms
(68 percent). They also find greater differences among castes in the propensity to hire
family labour in urban than in rural areas.
13
12The average employment in the unregistered sector is 2.05. 95 percent of units are proprietary. 74 percent of enterprises use no power and only 11.5 percent use electricity. 13 This is in contrast to the trend for all enterprises where average firm size has been going down over
1990-2005 (Iyer et al, 2013, p.56).
, but shows differences by caste and
gender of owner/manager. SC, ST and OBC-owned enterprises tend to be smaller than
13
Others-owned, with the Hindu upper caste enterprises employing the highest average
number of employees (8.59) in 2006-7.
Research on female entrepreneurs in developing countries shows that female-led
enterprises are typically smaller, and experience slower growth than male enterprises
(McPherson 1996; Mead and Liedholm 1998). We find differences in size: female-owned
and female-managed enterprises tend to be significantly smaller in terms of average
number of employees (4.64 and 3.14 respectively) compared to male-owned and male-
managed enterprises (6.71 and 6.83 respectively): but our results on growth are different,
as we will see in Section 6.
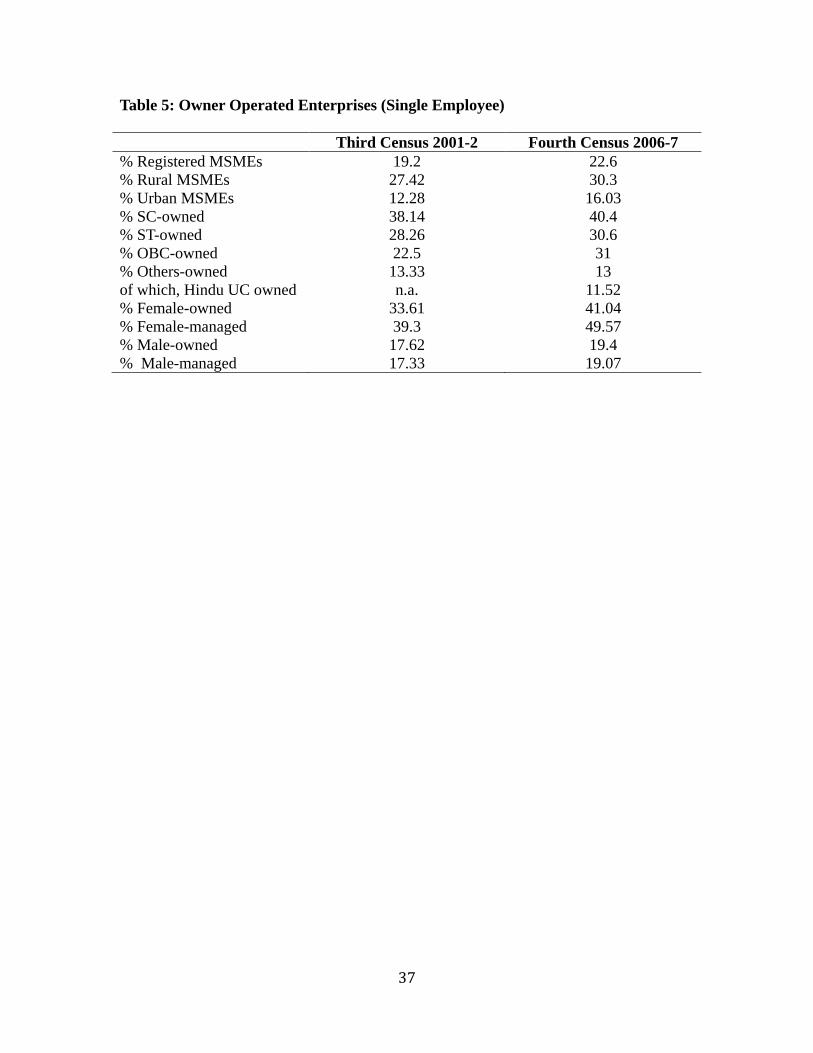
4.1 Owner-operated enterprises: survival activities?
Whether a self-employed individual is an entrepreneur, or simply involved in
survival activities is a matter of inference based on attributes of the business. Owner-
operated units, which by definition have one employee, can be reasonably seen as
representing survival activities, possibly distress-driven. From Table 5, we see that the
proportion of such units has increased over the period to stand at 22.6 percent in 2006-7.
Not surprisingly, the proportion of such units in rural areas is greater, but the increase in
urban proportions has been sharper compared to rural.
Proportion of owner-operated manufacturing enterprises is highest among SCs –
40 percent in 2006-7, an increase from 38 percent in 2001-2, indicating that a large part
of Dalit manufacturing is small-scale and survival-driven. Note that these proportions for
all non-agricultural enterprises are much higher, with 65 percent of SC enterprises and 56
percent of non-SC-ST enterprises being single-employee enterprises (Iyer et al, 2013, p.
56). Proportion of owner-operated units in ST and OBC-owned businesses are
significantly lower than that among SCs. However, the biggest contrast is between these
three groups and the “Others”, whose proportions of owner-operated enterprises have
remained practically unchanged over the period, whereas the other three groups have
registered significant increases. The proportion of owner-operated enterprises among the
14
Hindu upper-castes at 11.5 percent is the lowest among all caste groups, indicating that
these businesses are more entrepreneurial than survival-driven.
The proportions of female-owned and female-managed owner-operated
enterprises are much higher and have increased much more compared to their male
counterparts and therefore, this forms a significant component of gender disparities in
ownership and management of manufacturing enterprises.
4.2 Homophily
What about the caste break-up of the employees? Over the period, the proportion
of employees who are SC, ST and OBC have gone down, with a corresponding increase
in the proportion of Others14
It could be argued that these numbers simply reflect the use of family labour and
not homophily. While we cannot distinguish between the two with exact certainty, we can
provide pointers. In 2006-7, the median number of employees in the manufacturing
. The employee share of SC, ST and OBCs is greater in rural
enterprises than in urban, with the share of “Others” being exactly the opposite. The
gender break-up reveals that manufacturing MSME employees are overwhelmingly male,
with less than one-fifth of the employees being female; female proportions being higher
in rural than urban areas, with the rural-urban gap having narrowed over the period.
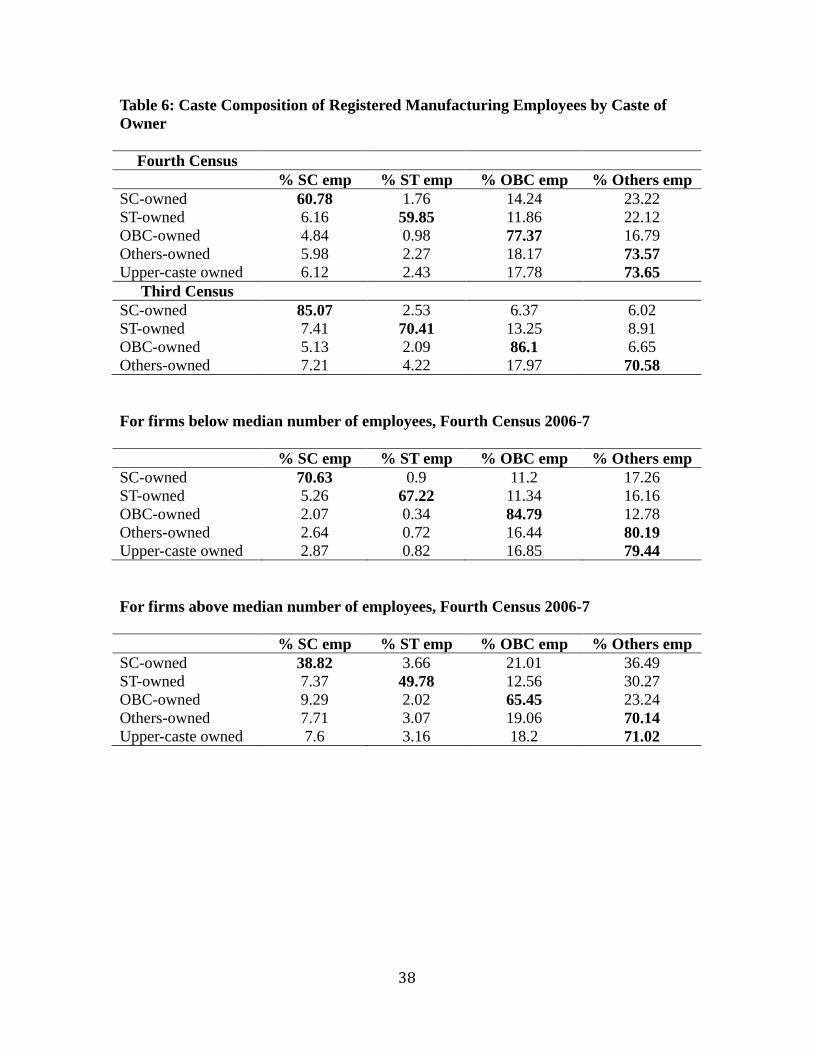
Looking at the distribution of employees by caste of owner, from Table 6, we see
that between 2001-2 and 2006-7, the share of SC-employees in SC-owned enterprises has
declined from 85 to 61 percent (for STs, the corresponding figures in ST-owned
enterprises are 70 to 60 percent). There is a similar decline for percentage of OBC
employees in OBC-owned firms, but an increase in “Other” employees in Others’-owned
firms. In 2006-7, in OBC and Others’-owned enterprises, between 74 and 77 percent of
employees belong to the owner’s caste group.
14MSME census does not ask for the religion of employees, so we cannot identify the Hindu upper castes
among the employees.
15
MSME sector was 3. We find that 50.52 percent of micro units, 0.57 percent of small
units and 0.6 percent of medium units had less than 3 employees. Conversely, of all units
with less than 3 employees, 99.94 percent were micro units, 0.05 small, and none were
medium. Adding this to the fact that smaller enterprises are more likely to use family
labour, we can look at employee shares separately for units above and below the median
number of employees. For firms with more than 3 employees (presumably with greater
use of hired labour), 65 percent of employees in OBC firms are OBCs and 70 percent of
employees in Others’ firms are Others (similar to upper caste firms), whereas only 39 and
49.7 percent of employees in SC and ST firms are SC and ST respectively. Thus, the
majority of employees in the larger SC-ST firms are not SC-ST. This outcome could
potentially be explained by the skill differential between SC-ST and Other employees,
but data do not allow us to separate employer preferences that are due to caste affinity
from those that are due to the potential skill of the employees. Also, it should be noted
that what we observe are outcomes as a result of the hiring process. Whether these
outcomes are due to homophily or simply reflect the relative availability of employees
from different caste groups is difficult for us to ascertain, since labour demand and supply
cannot be separated.
We started this paper with the DICCI mission statement: “be job givers and not
job seekers”. Empirically, how does the ability of Dalit enterprises to create jobs compare
with that of other caste groups? At the national level, of the total workforce in registered
manufacturing MSMEs, only 4 percent is employed in SC-owned firms, 2.2 percent in
ST-owned firms, 27.7 percent in OBC-owned firms, and 66 percent in firms owned by
Others (of which, 41.5 percent is employed in Hindu upper-caste owned firms). Notice
that over time, the share of OBC and Other employees in SC-ST owned enterprises has
risen significantly, whereas the share of SC-ST employees in OBC and Others-owned
enterprises has shrunk. Both due to the smaller size of SC-ST firms, and to the fact that
OBCs and “Others” practice homophily, evidence suggests that the beneficiaries of jobs
created in the registered manufacturing sector will be disproportionately OBCs and
Others. Thus, the potential of Dalit businesses to create jobs for Dalits seems to be
limited based on the evidence so far. However, as Table 6 indicates, in firms above the
16
median number of employees, the highest proportion of SC and ST employees is in firms
owned by SCs and STs respectively, and is significantly greater than the corresponding
proportions in firms owned by other caste groups. Thus, the likelihood of SC and ST
employees getting hired is far greater in SC/ST-owned firms, indicating that the rise in
Dalit/Adivasi entrepreneurship is critical to improving employment outcomes for
members of these groups.
5. The Gender-Caste Overlap
Literature on the overlap of caste and gender finds that SC and ST women are
doubly disadvantaged on account of their gender and their lower-caste status. However,
historically there has been a trade-off inherent in the gender-caste overlap in that, while
Dalits and Adivasi women have been subject to greater material deprivation and
oppression, they have experienced more egalitarian gender relations within the family, as
well as fewer taboos on public mobility. Upper-caste women, on the other hand, have
enjoyed relative material prosperity in comparison, but have been subject to greater
immurement and constraints on public visibility, with the taboos being sharper, the higher
the caste in the hierarchy (Deshpande 2007; Liddle and Joshi 1986). Using this data set,
we are able to examine how gender mediates disparities both within and across broad
caste groups. The preceding sections have outlined how gender disparities in ownership
and management manifest themselves in virtually all enterprise characteristics. The
overlap of caste and gender reveals how gender disparities are shaped by the caste of the
owner.
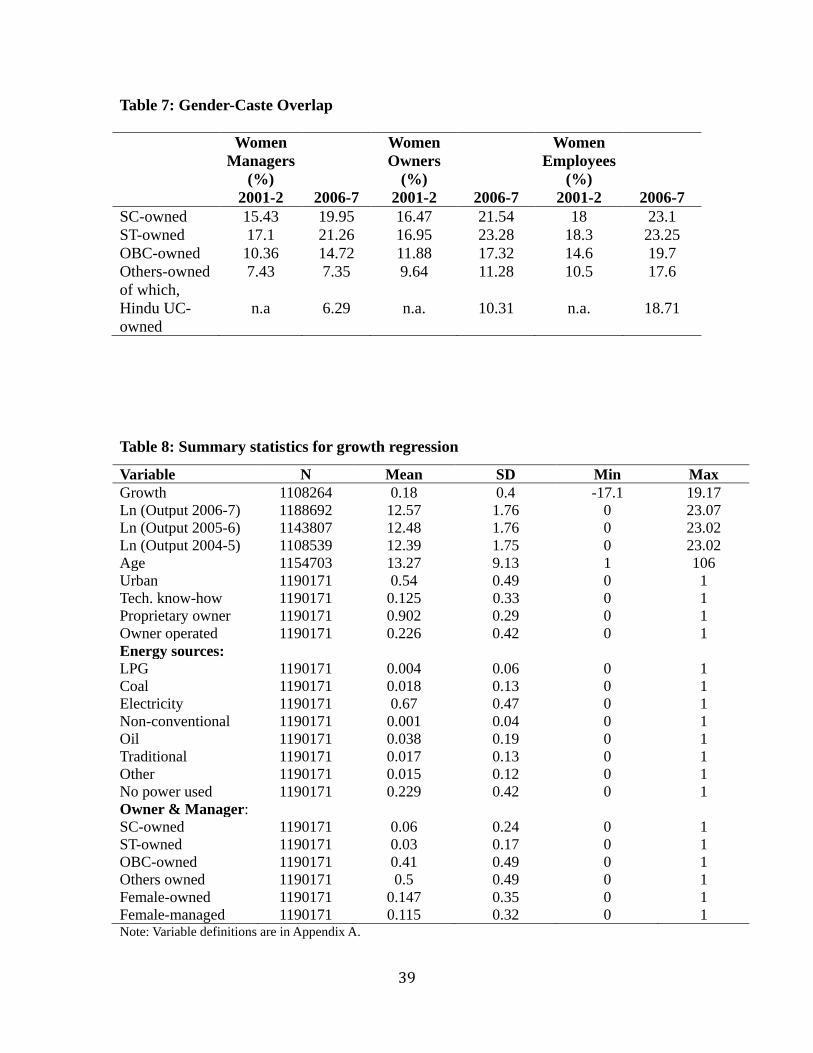
Table 7 reveals that overall, the proportion of women-owned and women-
managed enterprises has gone up over the period. However, reflecting the historical
egalitarian tradition, female ownership among lower castes is both higher and has
increased much more than among Others (by 5 to 6 percentage points among SCs, STs)
compared to less than 2 percentage points among Others. Thus, in 2006-7, more than
twice as many SC and ST firms were woman-owned compared to Hindu upper castes.
The same picture obtains for women managers, where the gap between upper caste and
17
SC-ST-owned units increases to over three times. Female management and ownership for
OBCs is in between SC-STs on the one hand, and upper castes on the other, but is closer
to SC-STs. STs have the highest rates of female management and ownership. We see
similar gaps in proportions of female employees, but here the gaps between social groups
are smaller, possibly due to the gendered nature of some operations, i.e., some activities
are traditionally done by women and regardless of the caste and gender of the owner,
women would be employed for such activities.
6. What Determines Growth of Manufacturing MSMEs?
In this section we present the estimation of determinants of growth of registered
manufacturing MSMEs based on the fourth census data. Growth in logarithmic form is
defined as:
Growth=ln(Xi,t)-ln(Xi,t-2) where i=1,2,…n (1)
Where X stands for gross output. The year t corresponds to 2006-07 and year t-2
corresponds to 2004-05. Since we have data on output for three consecutive years, we
calculate the growth rate over two years in order to smooth out any year-to-year
fluctuations in the data.
In data of this size, outliers are inevitable, either on account of data entry or
measurement errors. Using a standard cleaning procedure, firms that have output-capital
or output-labour ratios that are more than three standard deviations away from the mean
are excluded from the analysis. After cleaning the data, we ran a median regression
(LAD) on the remaining observations using the following equation:
Growth= α+β1 (size)+ β2 (age)+ β3 (urban)+ β4 (owner-operated)+ β5 (proprietary)+ β6
(knowhow)+β7 (energy source dummies)+β8 (owner caste dummies)+ β9 (female
owner)+ β10 (female manager)+ β11 (district dummies)+ β12 (industry 3-digit dummies)+ε
(2)
18
The exact definitions of the variables used in this regression are in Appendix A,
and the summary statistics are in Table 8. We account for industry specific and district-
specific factors by including industry 3-digit and district level dummy variables. District-
level dummy variables capture district-specific variables that might influence
performance of firms—such as infrastructure, product markets, quality of available
labour etc.—which we are not able to control for with the available data. Standard errors
are clustered at the district level. Calculations based on Table 8 indicate that the average
annual growth rate is 21.4 percent. Only 12.5 percent firms have access to any technical
know-how and 90 percent are proprietary. 23 percent enterprises use no power and 67
percent use electricity.
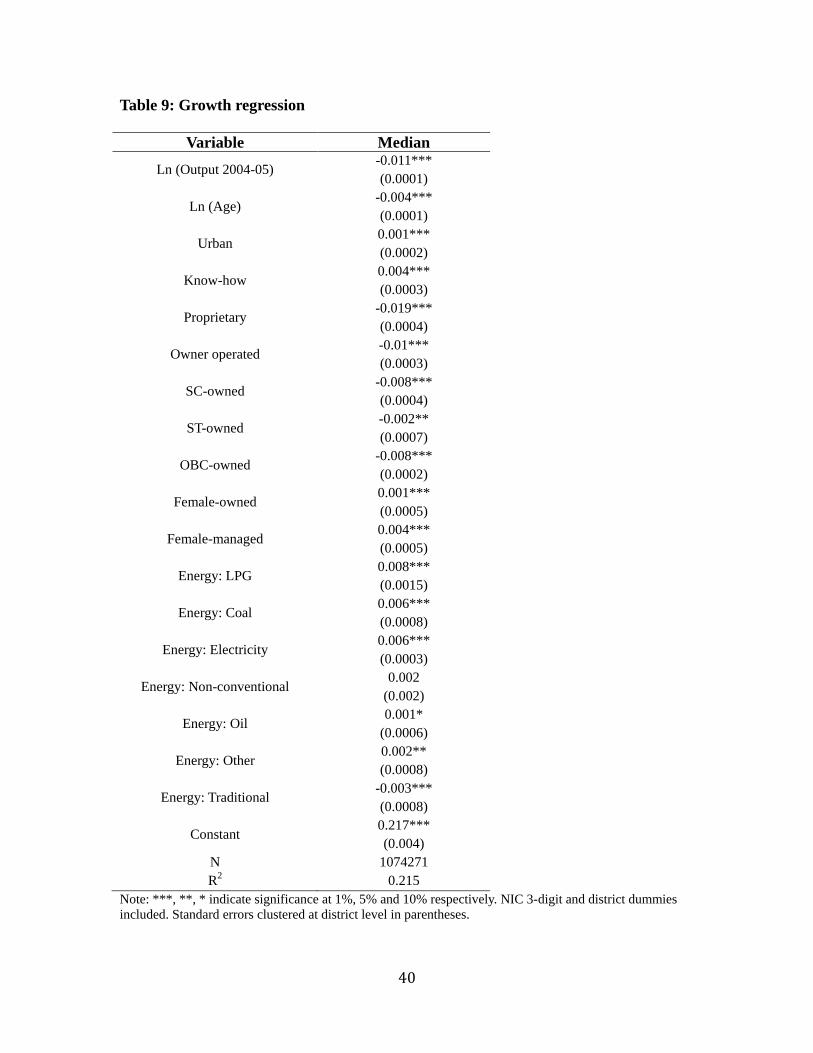
The results of the growth regression can be seen in Table 9, which shows that
output in period 2004-5 (which measures size) and age have a negative impact on growth,
i.e. smaller and younger firms grow faster. Firms with technical knowhow grow faster
than those without. Firms using any power source (mainly electricity, but also LPG, coal,
oil or even traditional sources, such as firewood or non-conventional energy) grow faster
than those firms not using any power. Owner-operated enterprises grow slower than those
with more than one employee. Firms in urban areas register higher growth rates than
those in rural areas. All these results are in the expected direction and standard in the
literature.
6.1 How is growth related to the caste of owner?
Our regressions reveal that the caste of the owner has a significant impact on
growth of the enterprise. Thus, in comparison to Others-owned firms, SC, ST and OBC-
owned firms register significantly lower growth, after controlling for size. Coad and
Tamvada (2012) summarize the literature that distinguishes between firms based on their
growth performance. The intuition is that high-productivity entrepreneurial firms will
grow fast, while firms that are in low-productivity survival activities will register lower
growth. Based on these indicators and other evidence on the informality and low-
productivity nature of SC-ST economic activity (NCEUS, 2008), we can say with greater
certainty that SC and ST-owned businesses are more likely to be survivalist than
19
entrepreneurial.
This data set does not have information on personal characteristics, assets and
networks of owners. Evidence from other data sets indicates that SC-STs individuals are
on average poorer, with lower education, fewer assets and poorer networks15
15Deshpande (2011) summarizes this evidence.
. However,
in this exercise, we are not able to isolate the effects of these characteristics, (which in
turn could reflect pre-market discrimination), and decompose the difference in growth
rates into “explained” and “discriminatory” components or directly test for discrimination
in credit or land markets.
There exists other evidence that Dalit firms face discriminatory barriers to
expanding their businesses and this could be a possible mechanism to explain our
findings. In a case study of Dalit businesses in north-west India, Jodhka (2010) finds that
most Dalit businesses are small in size, run mostly as self-proprietorships in the informal
sector (these would be classified as own-account enterprises in our data set). Some Dalits
in his study felt that they had been victims of prejudice. Locally dominant communities,
who have traditionally dominated the business scene, do not like Dalits getting into
business: “they hate us” or they “do not like us being in the business” were some of the
common responses from Jodhka’s Dalit businessman respondents. Some other reported
being regarded as outsiders or “odd actors”. Many felt handicapped because of not being
part of traditional business communities. A large proportion of his Dalit respondents felt
that caste affected their business negatively, both because of discrimination from
traditional business communities, but also from consumers. “Identification with my caste
name tends to discourage my clients. Even when they do not have caste prejudice, they
feel we may not be able to deliver because we are traditionally not the ones who have
been in business or possess enough resources to run a good business”(Jodhka 2010:47).
This is similar to evidence from other countries, e.g. Borjas and Bronars (1989) find
evidence that the large observed differences in self-employment rates across racial groups
(Asians, blacks, Hispanics, and whites) in the US is partly due to consumer
discrimination.
20
6.2 Effect of female ownership and management on growth
In contrast to the international literature which documents lower growth rates for
female enterprises because of conservative social attitudes towards women in
traditionally male-dominated arenas, and/or because female entrepreneurs are expected to
be less ambitious in terms of growth targets and more concerned with earning just enough
to provide for their families, our regressions reveal that female-owned and female-
managed enterprises have significantly higher growth than male-managed, after
controlling for other characteristics16
We find clear and persistent caste and gender disparities in virtually all enterprise
characteristics in the registered manufacturing MSME sector over 2001-2 and 2006-7.
The share of SC-ST ownership has declined over the period, SC-ST enterprises tend to be
smaller, more rural than urban, have a greater share of owner-operated (single employee)
units. The inter-state variation in share of ST-SC businesses reveals that with the
.
The strong positive effect of female ownership and management on growth is
noteworthy. This can be explained by self-selection since our study is based on only the
registered sector. Registration is voluntary and it is the more enterprising and motivated
owners/managers that are more likely to take the initiative to register their firms.
Therefore, it is possible, on average, that the women owners and managers in registered
firms represent a group with much higher innate abilities than male managers in
registered firms. Bardasi et al (2011) also cite self-selection as a possible reason for their
finding that in eastern Europe, central Asia and sub-Saharan Africa, gender gaps in firm
growth are much smaller. Also, while large proportions of Indian women have either no
or low education, in the segment of the population with higher education, women
outperform men, suggesting that those who are able to cross early hurdles have the
abilities necessary for success (Khanna, 2012).
7. Concluding Comments
16See Coad and Tamvada (2012:386) for a review of this literature.
21
exception of the tribal majority north-eastern states, SC and ST businesses are under-
represented as compared to their share in state populations. The sectoral mix varies
considerably by rural-urban location as well as by the caste and gender of the owner. The
traditional stigmatizing association with leather-work continues to be one of the top five
business activities for SCs and not for other caste groups; however, we see a decline in
this share for SC-owned enterprises.
For OBC-owned firms, the evidence is mixed. The proportion of OBC ownership
reflects their population share. Also, the top five states in terms of ownership are those
where OBCs are also the dominant group in politics, suggesting that small business
ownership has been one of the factors contributing to their political dominance. But there
are clear disparities between OBCs and Others.
The gender-caste overlap indicates that the share of female-owned and female-
managed enterprises is significantly greater among SC-ST-owned enterprises, than those
owned by Others, and especially by Hindu upper-castes, suggesting that the effects of the
historical taboos on upper-caste women, which were absent for lower-caste women, on
entry into public arenas of economic production continue to linger, even as the formal
taboos have loosened.
The majority of the MSME workforce is employed in non-SC-ST owned firms.
Also, there is evidence of homophily in OBC and upper-caste-owned firms. Thus, the
MSME sector, as it stands today, is not a major vehicle for job creation for the Dalits.
While it is significant that there is now an emerging section of Dalit entrepreneurs who
could be job-givers, we should note that most Dalit businesses occupy a very different
place in the production chain, viz., that they are engaged in the bottom-of-the-ladder, low
productivity, survival activities, as can be seen from their lower rate of growth, after
controlling for other characteristics.
In India, certain castes and communities have traditionally been business
communities, and entrepreneurs from these communities start with clear natural
advantages in that they possess insider knowledge, know-how and strong business
22
networks passed down through the generations (Damodaran, 2008). In this context, an
important channel of social mobility would be the extent to which marginalized groups,
whose traditional occupations have not been business-based, have been able to break into
established networks and establish themselves as entrepreneurs. While this data set does
not have detailed and specific jati information, the evidence suggests that
entrepreneurship as a significant vehicle for social mobility for Dalits is yet to become a
reality for India.
In a recent op-ed piece, Chandra Bhan Prasad and Milind Kamble17
The Indian state is often berated for creating casteism through reservations, the
implicit argument being that outcomes are not mediated by caste when the state doesn’t
intervene to change the caste-mix of institutions. Until April 2012, there was no
systematic policy of compensatory discrimination in the sphere of small business activity,
so the outcomes we report in this paper could not possibly be caused by state
intervention. On the contrary, this picture clearly indicates the need for concerted policy
to correct historical caste-based inequalities. The “supplier diversity” initiative of the
Madhya Pradesh government in 2002 was one such beginning, but the focus there was on
government procurement from SC-ST suppliers. The “Public Procurement Policy for
MSEs” of 2012 mandates that central government ministries, departments and public
sector undertakings should procure minimum of 20 percent of their annual value of goods
or services from MSEs and within this, 20 percent should be earmarked for SC-ST-owned
MSEs, i.e. total 4 percent of the 20 percent. Lest we think of this as too radical, note that
(2013) argue
that “capital is the surest means to fight caste. In Dalits’ hands, capital becomes an anti-
caste weapon…Dalit capitalism is the answer to that regime of discrimination”. We
believe that the best site to test the validity of this proposition is the private
manufacturing sector. Our analysis of changes in the private manufacturing sector in the
era of market-led and globalized development finds that caste continues to shape virtually
all aspects of production, and capital, so far, is not countering the deep-rooted inequities
produced by caste.
17One of the Padma Awardees.
23
the Malaysian affirmative action programme directly seeks to redress wealth disparities
between Malays and the Chinese by reserving 30 percent of all business ownership to
ethnic Malays. The policy of the Indian government is considerably weaker. While we
debate the efficiency and efficacy of this policy, we have to be mindful that altering the
no-intervention status quo in the private sector would not introduce disparities, but
correct them.
24
References:
Bardasi, Elena, Shwetlana Sabarwal and Katherine Terrell (2011):“How do female entrepreneurs perform? Evidence from three developing regions”,Small Business Economics, 37(4): 417-441
Bates, Timothy (1997) Race, Self Employment and Upward Mobility: an Illusive American Dream (Johns Hopkins University Press, Baltimore). Bhavani T.A. (1991):“Technical Efficiency in Indian Modern Small Scale Sector: An application of Frontier Production Function”,Indian Economic Review, 26(2):149-166 Bhavani, T. A and Suresh Tendulkar (1997):“Policy on Modern Small Scale Industries: A Case of Government Failure”, Indian Economic Review, 32(1): 39-64 Borjas, George and Stephen Bronars (1989): “Consumer Discrimination and Self-Employment”, Journal of Political Economy, 97: 581–605.
Coad, A and Tamvada, JP. (2012):“Firm growth and barriers to growth among small firms in India”,Small Business Economics, 39(2): 383-400.
Coate, Stephen and Sharon Tennyson (1992):“Labor Market Discrimination, Imperfect Information and Self-Employment”, Oxford Economic Papers, New Series, 44(2): 272-288
Damodaran, Harish (2008). India's New Capitalists: Caste, Business and Industry in a Modern Nation. (Palgrave Macmillan)
Das, Maitreyi Bordia (2003): “The Other Side of Self-Employment: Household Enterprises in India”, World Bank Social Protection Discussion Paper No. 318, Washington DC: World Bank.
Deshpande, Ashwini (2007): “Overlapping identities under liberalization: gender and caste in India”, Economic Development and Cultural Change, 55(4): 735-760
Deshpande, Ashwini (2011). The Grammar of Caste: Economic Discrimination in Contemporary India, (Oxford University Press, New Delhi)
25
Dunn, Thomas and Douglas Holtz-Eakin (2000):“Financial Capital, Human Capital, and the Transition to Self-Employment: Evidence from Intergenerational Links”, Journal of Labor Economics, 18(2): 282- 305.
Eckel, Catherine and Philip Grossman (2008): “Men, women and risk aversion: Experimental Evidence”,Handbook of Experimental Economics Results. 1:1061- 73
Fairlie, Robert W. (2004): “Does Business Ownership Provide a Source of Upward Mobility for Blacks and Hispanics?” in Douglas Holtz-Eakin and Harvey S. Rosen(ed) Public Policy and the Economics of Entrepreneurship (MIT Press)
Goldar B. N. (1985): “Unit Size and Economic Efficiency: A Study of Small Scale Washing Soap Industry in India”,Artha Vijnana,7 (1): 21-40 Goldar B. N., “Relative Efficiency of Small Scale Industries in India” in K. B. Suri (ed.) Small Scale Enterprises in Industrial Development: The Indian Experience (New Delhi : Sage Publications, 1988).
Iyer, Lakshmi, Tarun Khanna and Ashutosh Varshney (2013: “Caste and Entrepreneurship in India”,Economic and Political Weekly, XLVIII(6): 52-60
Jodhka, Surinder (2010):“Dalits in Business: Self-Employed Scheduled Castes in Northwest India”, Indian Institute of Dalit Studies Working Paper, 4(2)
Khanna, Shantanu (2012): “Gender wage discrimination in India: Glass Ceiling or Sticky Floor”, CDE Working Paper No. 214, Delhi School of Economics.
La Porta, Rafael, Florencio Lopez-de-Silanes and Andrei Shleifer (1999): “Corporate Ownership Around the World”,Journal of Finance, 54: 471-518.
Liddle, J. , & Joshi, R. (1986). Daughters of independence: Gender, caste and class in India. (United Kingdom. London: Zed Books Ltd, Rutgers University Press)
Mead, D. C. and Liedholm, C. (1998): “The dynamics of micro and small enterprises in developing countries”,World Development, 26: 61–74
McPherson, M. A. (1996): “Growth of micro and small enterprises in Southern Africa”,Journal of Development Economics, 48: 253–277
McPherson, Miller, Lynn Smith-Lovin and James M. Cook (2001): “Birds of a Feather: Homophily and Social Networks”,Annual Review of Sociology. 27: 415-444
Ministry of Micro, Small and Medium Enterprises (2012). Annual Report 2011-12. (Government of India).
26
Moore, Robert L. (1983): “Employer Discrimination: Evidence from Self-Employed Workers”, Review of Economics and Statistics, 65(3): 496-501
Nafziger, E. Wayne (1975): “Class, Caste and Community of South Asian Industrialists: An Examination of the Horatio-Alger Model”,Journal of Development Studies, 11: 131-148
Navsarjan Trust (2010). Understanding Untouchability: A Comprehensive Study of Practices and Conditions in 1589 Villages.
National Commission for Enterprises in the Unorganized Sector (2008). The Challenge of Employment in India: An Informal Economy Perspective. (Government of India).
Niederle, Muriel and Lise Vesterlund (2007); “Do Women Shy away from Competition? Do Men Compete too Much?”,Quarterly Journal of Economics, 122 (3): 1067-1101.
Prasad, Chandra Bhan and Milind Kamble (2013): “Manifesto to End Caste: Push Capitalism and Industrialization to Eradicate this Pernicious System”, Times of India, 23 January ( ://articles.timesofindia.indiatimes.com/2013-01-23/edit-page/36485155_1_dalit-youth-upper-castes-caste-system)
Shah, Ghanshyam, Harsh Mander, Sukhadeo Thorat, Satish Deshpande and Amita Baviskar (2006). Untouchability in Rural India (Sage Publications: New Delhi)
Sharma, Smriti (2013): “Benefits of a Registration Policy for Microenterprise Performance in India”, Small Business Economics, forthcoming.
Thorat, Sukhadeo and Nidhi Sadana (2009): “Caste and Ownership of Private Enterprises”, Economic and Political Weekly, XLIV (23): 13-16
27
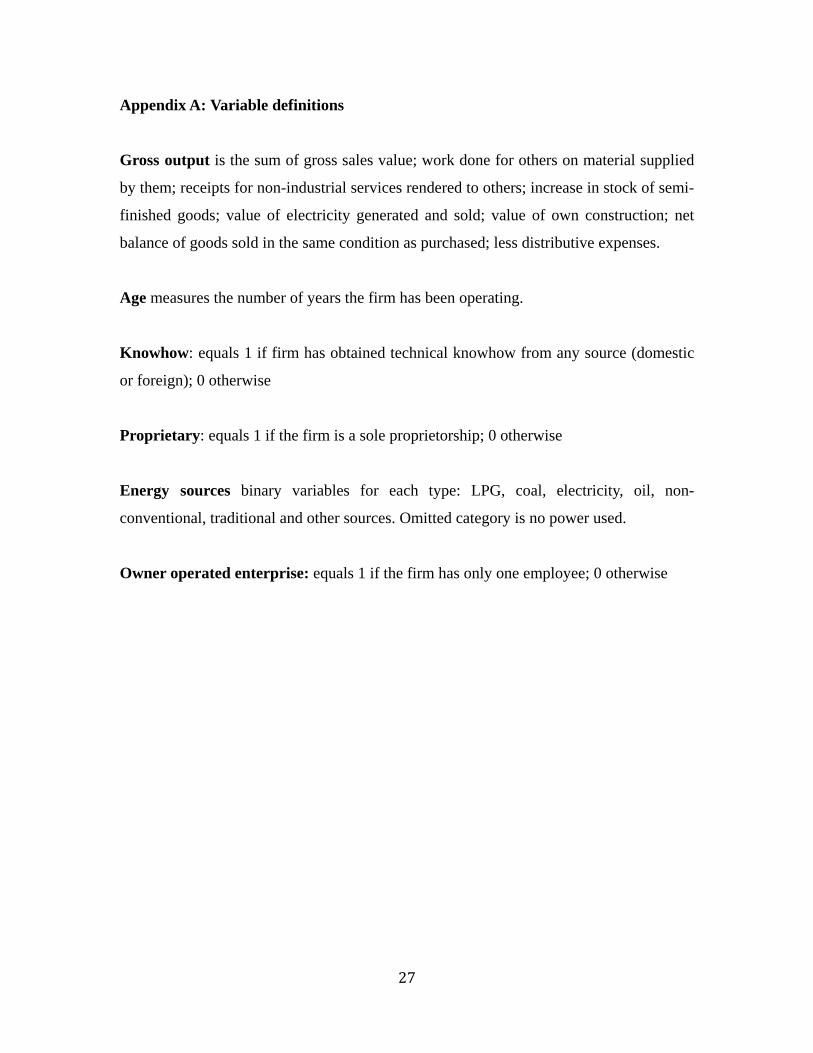
Appendix A: Variable definitions
Gross output is the sum of gross sales value; work done for others on material supplied
by them; receipts for non-industrial services rendered to others; increase in stock of semi-
finished goods; value of electricity generated and sold; value of own construction; net
balance of goods sold in the same condition as purchased; less distributive expenses.
Age measures the number of years the firm has been operating.
Knowhow: equals 1 if firm has obtained technical knowhow from any source (domestic
or foreign); 0 otherwise
Proprietary: equals 1 if the firm is a sole proprietorship; 0 otherwise
Energy sources binary variables for each type: LPG, coal, electricity, oil, non-
conventional, traditional and other sources. Omitted category is no power used.
Owner operated enterprise: equals 1 if the firm has only one employee; 0 otherwise
28
Table 1: Descriptive Statistics for the Registered Manufacturing MSME sector
Variable Third Census 2001-
2 Fourth Census 2006-
7 Average age (years) 13.15 13 Rural Enterprises (%) 45.92 45 Average number of employees 4.42 6.42 Proportion of enterprises owned by
SCs 7.7 6.3 STs 3.5 2.94 OBCs 40.05 40.46 Others 48.75 50.29 of which, Hindu Upper Castes n.a. 41.51 Proportion of Rural enterprises owned by
SCs 10.84 8.51 STs 4.53 4.16 OBCs 45.43 46.52 Others 39.19 40.8 of which, Hindu Upper Castes n.a. 31.05 Proportion of Urban enterprises owned by
SCs 5.03 4.42 STs 2.62 1.9 OBCs 35.48 35.29 Others 56.87 58.39 of which, Hindu Upper Castes n.a. 50.23 Proportion of enterprises that are
Female-managed 9.56 11.54 Female-owned 11.32 14.7 Proportion of Rural enterprises that are
Female-managed 11.75 13.72 Female-owned 13.21 16.91 Proportion of Urban enterprises that are
Female-managed 7.69 8.99 Female-owned 9.72 12.86 Proportion of All enterprises that are
Micro n.a. 95.22 Small n.a. 4.6 Medium n.a. 0.17 Proportion of micro firms owned by
SCs n.a. 98.34 STs n.a. 98.03
29
OBCs n.a. 98.23 Others n.a. 92.25 of which, Hindu Upper Castes n.a. 91.34 Women n.a. 98.37 Proportion of small firms owned by
SCs n.a. 1.53 STs n.a. 1.78 OBCs n.a. 1.72 Others n.a. 7.48 of which, Hindu Upper Castes n.a. 8.35 Women n.a. 1.58 Proportion of medium firms owned by
SCs n.a. 0.13 STs n.a. 0.19 OBCs n.a. 0.05 Others n.a. 0.27 of which, Hindu Upper Castes n.a. 0.3 Women n.a. 0.05
Note: Enterprises with investment in plant and machinery up to INR 25 lakhs are classified as ‘micro’, those with investment between INR 25 lakhs and INR 5 crore are ‘small’ and those with investment between INR 5 crore and INR 10 crore are ‘medium’. Table 2: Top 5 States
Third Census 2001-2 Fourth Census 2006-7 Number of enterprises
TN, UP, Ker, Guj, Karn TN, Guj, UP, Karn, Ker
SC-owned
HP, UK, Pun, Har, MP HP, UK, Karn, Trip, MP
ST-owned
Miz, Meg, Naga, Arunachal, Chhatisg
Miz, Meg, Naga, Arunachal, Chhatisg
OBC-owned
TN, Bih, Ker, Karn, MP TN,Bih,Ker,MP, Karn
Others-owned
Delhi, Chandigarh, WB, Maha, Assam
Delhi, Chandigarh, Guj, WB, Maha
of which, Hindu UC
n.a. Delhi, Guj, Maha, WB,
Chandigarh, Mani
Female-owned Megh, Arunachal, Miz, Sik,Ker,
Manipur Megh, Miz, Mani, Ker, TN
Female-managed Megh, Miz, Arunachal, Ker, Mani,
Sikkim Megh, Miz, TN, Ker, Assam
30
Table 3a: Sectoral Division, All-India
Third Census
2001-2 Fourth Census
2006-7 ALL
Food products & Beverages 18.02 17.77 Apparel 13.97 15.63
Fabricated Metal products 13.93 11.6 Furniture 9.14 8.06 Textiles 5.9 8.95
SC-owned Apparel 18.84 25.38
Leather, luggage and footwear 27.4 16.24 Food products & Beverages 8.32 10.76
Textiles 7.39 7.27 Furniture 8.07 7.07
ST-owned Apparel 21.19 21.53
Food products & Beverages 14.34 18.28 Furniture 11.36 11.79 Textiles 12.74 8.5
Wood & straw products, except furniture 9.29 8.33
OBC-owned Apparel 17.36 22.7
Food products & Beverages 19.03 18.11 Fabricated Metal products 14.37 11.14
Furniture 11.76 9.52 Textiles 5.9 7.45
Hindu UC Food products & Beverages n.a. 17.8 Fabricated Metal products n.a. 11.92
Apparel n.a. 10.56 Textiles n.a. 10.33
Machinery & Equipment n.a. 6.9 Female-owned
Apparel 44.84 48.02 Food products & Beverages 14.4 13.26
Textiles 8.07 10.41 Fabricated Metal products 5.03 4.34
Chemicals & Chemical Products 3.93 4.18 Male-owned
31
Food products & Beverages 18.49 18.68 Fabricated Metal products 15.06 12.3
Apparel 10.03 12 Furniture 9.81 8.72 Textiles 5.63 8.19
Female-managed Apparel 53.61 59.92
Food products & Beverages 13.4 12.32 Textiles 7.95 8.43
Chemicals & Chemical Products 3.3 3.11 Furniture 3.3 2.84
Male-managed Food products & Beverages 18.51 18.61 Fabricated Metal products 15.05 12.3
Apparel 9.78 11.75 Furniture 9.76 8.61 Textiles 5.69 8.53
Note: each cell reports the percentage of units in that sector.
32
Table 3b: Sectoral Division, Rural India
Third Census
2001-2 Fourth Census
2006-7 ALL
Food products & Beverages 20.49 24.93 Apparel 13.61 18.97 Furniture 8.19 8.68
Fabricated Metal products 8.37 8.41 Textiles 4.35 7
SC-owned Apparel 21 27.25
Leather, luggage and footwear 24.54 14.17 Food products & Beverages 9.72 12.87
Textiles AND Furniture 9.13 & 8.57 7.93 & 7.6 Wood & straw products, except
furniture 7.82 7.15 ST-owned
Apparel 26.54 23.04 Food products & Beverages 18.67 22.12
Furniture 12.32 12.4 Wood & straw products, except
furniture 12.29 10.1 Textiles 8.08 8.12
OBC-owned Food products & Beverages 24.15 22.54
Apparel 18.18 21.23 Furniture 13.18 10.7
Fabricated Metal products 11.41 9.16 Wood & straw products, except
furniture 8.3 7.73 Hindu UC
Food products & Beverages n.a. 31.37 Apparel n.a. 13.03
Fabricated Metal products n.a. 8.66 Non-metallic mineral products n.a. 7.67
Furniture n.a. 6.1 Female-owned
Apparel 50.57 50.25 Food products & Beverages 16.15 16.36
Textiles 8.72 10.35 Non-metallic mineral products 4.87 4.1
33
Chemicals & Chemical Products 3.53 3.88 Male-owned
Food products & Beverages 26.24 27.12 Apparel 11.57 12.51 Furniture 11.23 9.71
Fabricated Metal products 11.48 9.54 Non-metallic mineral products 8.21 6.74
Female-managed Apparel 57.44 59.92
Food products & Beverages 14.14 14.34 Textiles 8.97 8.82
Chemicals & Chemical Products 3.14 3.24 Non-metallic mineral products 3.45 2.89
Male-managed Food products & Beverages 26.34 27.08
Apparel 11.3 12.23 Furniture 11.16 9.62
Fabricated Metal products 11.44 9.44 Non-metallic mineral products 8.34 6.85
Note: each cell reports the percentage of units in that sector.
34
Table 3c: Sectoral Division, Urban India
Third Census Fourth Census 2001-2 2006-7
ALL Apparel 8.95 15.69
Fabricated Metal products 13.05 13.56 Food products & Beverages 9.78 11.4
Textiles 5.13 9.83 Furniture 6.36 7.35
SC-owned Apparel 14.89 22.35
Leather, luggage and footwear 32.61 19.59 Fabricated Metal products 10.34 9.27
Food products & Beverages 5.76 7.32 Textiles AND Furniture 4.20 & 7.17 6.21 & 6.21
ST-owned Apparel 13.35 18.77
Fabricated Metal products 15.38 13.69 Food products & Beverages 7.99 11.25
Furniture 9.95 10.65 Textiles 19.58 9.2
OBC-owned Apparel 16.48 24.34
Fabricated Metal products 17.54 13.35 Food products & Beverages 13.46 13.17
Furniture 10.22 8.2 Textiles 6.61 7.15
Hindu UC Fabricated Metal products n.a. 13.6
Textiles n.a. 12.63 Food products & Beverages n.a. 10.63
Apparel n.a. 9.29 Machinery & Equipment n.a. 8.27
Female-owned Apparel 38.23 45.52 Textiles 7.32 10.48
Food products & Beverages 12.37 9.8 Fabricated Metal products 7.76 6.72
Chemicals & Chemical Products 4.39 4.52 Male-owned
35
Fabricated Metal products 17.99 14.55 Food products & Beverages 12.16 11.81
Apparel 8.76 11.59 Textiles 6.43 9.8
Furniture 8.66 7.91 Female-managed
Apparel 48.64 59.91 Food products & Beverages 12.45 9.78
Textiles 6.64 7.95 Fabricated Metal products 5.23 3.3
Furniture 4.04 3.21 Male-managed
Fabricated Metal products 17.98 14.62 Food products & Beverages 12.16 11.74
Apparel 8.54 11.35 Textiles 6.5 10.09
Furniture 8.62 7.79 Note: each cell reports the percentage of units in that sector.
36
Table 4: Employment in registered manufacturing MSMEs Third Census 2001-
2 Fourth Census 2006-
7 Proportion of employees in rural areas 39 45 Average number of employees 4.5 6.42 Average number of employees in urban enterprises 4.98 7.23 Average number of employees in rural enterprises 3.75 5.44 Average number of employees in SC-owned enterprises 2.64 4.31 ST-owned enterprises 3.44 4.7 OBC-owned enterprises 3.67 4.44 Others-owned enterprises 5.37 8.52 Hindu UC-owned enterprises n.a. 8.59 Female-owned 3.8 4.64 Male-owned 4.6 6.71 Female-managed 3.03 3.14 Male-managed 4.56 6.83 Proportion of employees who are SC 12 9 SC in rural ents (in urban) 14.6 (10.4) 10.7 (7.5) ST 5.5 3.4 ST in rural ents (in urban) 5.95 (5.22) 4.51 (2.47) OBC 44 41.7 OBC in rural ents (in urban) 47.8 (41.08) 47.1 (37.1) Others 38 46 Others in rural ents (in urban) 31.54 (43.2) 37.7 (52.9) Female 13.04 18.94 Females in rural ents (in urban) 15.73 (11) 19.16 (18.85) % of total MSME workforce in SC-owned ents 4.5 4.2 ST-owned ents 2.7 2.2 OBC-owned ents 32.9 27.7 Others-owned ents 59.9 66 Hindu UC-owned ents n.a. 41.5
37
Table 5: Owner Operated Enterprises (Single Employee) Third Census 2001-2 Fourth Census 2006-7 % Registered MSMEs 19.2 22.6 % Rural MSMEs 27.42 30.3 % Urban MSMEs 12.28 16.03 % SC-owned 38.14 40.4 % ST-owned 28.26 30.6 % OBC-owned 22.5 31 % Others-owned 13.33 13 of which, Hindu UC owned n.a. 11.52 % Female-owned 33.61 41.04 % Female-managed 39.3 49.57 % Male-owned 17.62 19.4 % Male-managed 17.33 19.07
38
Table 6: Caste Composition of Registered Manufacturing Employees by Caste of Owner
Fourth Census % SC emp % ST emp % OBC emp % Others emp SC-owned 60.78 1.76 14.24 23.22 ST-owned 6.16 59.85 11.86 22.12 OBC-owned 4.84 0.98 77.37 16.79 Others-owned 5.98 2.27 18.17 73.57 Upper-caste owned 6.12 2.43 17.78 73.65
Third Census SC-owned 85.07 2.53 6.37 6.02 ST-owned 7.41 70.41 13.25 8.91 OBC-owned 5.13 2.09 86.1 6.65 Others-owned 7.21 4.22 17.97 70.58 For firms below median number of employees, Fourth Census 2006-7 % SC emp % ST emp % OBC emp % Others emp SC-owned 70.63 0.9 11.2 17.26 ST-owned 5.26 67.22 11.34 16.16 OBC-owned 2.07 0.34 84.79 12.78 Others-owned 2.64 0.72 16.44 80.19 Upper-caste owned 2.87 0.82 16.85 79.44 For firms above median number of employees, Fourth Census 2006-7 % SC emp % ST emp % OBC emp % Others emp SC-owned 38.82 3.66 21.01 36.49 ST-owned 7.37 49.78 12.56 30.27 OBC-owned 9.29 2.02 65.45 23.24 Others-owned 7.71 3.07 19.06 70.14 Upper-caste owned 7.6 3.16 18.2 71.02
39
Table 7: Gender-Caste Overlap Women
Managers (%)
Women Owners
(%)
Women Employees
(%)
2001-2 2006-7 2001-2 2006-7 2001-2 2006-7 SC-owned 15.43 19.95 16.47 21.54 18 23.1 ST-owned 17.1 21.26 16.95 23.28 18.3 23.25 OBC-owned 10.36 14.72 11.88 17.32 14.6 19.7 Others-owned 7.43 7.35 9.64 11.28 10.5 17.6 of which, Hindu UC-owned
n.a 6.29 n.a. 10.31 n.a. 18.71
Table 8: Summary statistics for growth regression
Variable N Mean SD Min Max Growth 1108264 0.18 0.4 -17.1 19.17 Ln (Output 2006-7) 1188692 12.57 1.76 0 23.07 Ln (Output 2005-6) 1143807 12.48 1.76 0 23.02 Ln (Output 2004-5) 1108539 12.39 1.75 0 23.02 Age 1154703 13.27 9.13 1 106 Urban 1190171 0.54 0.49 0 1 Tech. know-how 1190171 0.125 0.33 0 1 Proprietary owner 1190171 0.902 0.29 0 1 Owner operated 1190171 0.226 0.42 0 1 Energy sources: LPG 1190171 0.004 0.06 0 1 Coal 1190171 0.018 0.13 0 1 Electricity 1190171 0.67 0.47 0 1 Non-conventional 1190171 0.001 0.04 0 1 Oil 1190171 0.038 0.19 0 1 Traditional 1190171 0.017 0.13 0 1 Other 1190171 0.015 0.12 0 1 No power used 1190171 0.229 0.42 0 1 Owner & Manager: SC-owned 1190171 0.06 0.24 0 1 ST-owned 1190171 0.03 0.17 0 1 OBC-owned 1190171 0.41 0.49 0 1 Others owned 1190171 0.5 0.49 0 1 Female-owned 1190171 0.147 0.35 0 1 Female-managed 1190171 0.115 0.32 0 1 Note: Variable definitions are in Appendix A.
40
Table 9: Growth regression
Variable Median Ln (Output 2004-05)
-0.011*** (0.0001)
Ln (Age) -0.004*** (0.0001)
Urban 0.001*** (0.0002)
Know-how 0.004*** (0.0003)
Proprietary -0.019*** (0.0004)
Owner operated -0.01*** (0.0003)
SC-owned -0.008*** (0.0004)
ST-owned -0.002** (0.0007)
OBC-owned -0.008*** (0.0002)
Female-owned 0.001*** (0.0005)
Female-managed 0.004*** (0.0005)
Energy: LPG 0.008*** (0.0015)
Energy: Coal 0.006*** (0.0008)
Energy: Electricity 0.006*** (0.0003)
Energy: Non-conventional 0.002
(0.002)
Energy: Oil 0.001*
(0.0006)
Energy: Other 0.002** (0.0008)
Energy: Traditional -0.003*** (0.0008)
Constant 0.217*** (0.004)
N 1074271 R2 0.215
Note: ***, **, * indicate significance at 1%, 5% and 10% respectively. NIC 3-digit and district dummies included. Standard errors clustered at district level in parentheses.